Exporting SERVICES - World Bank Documents & Reports
406
Editors Arti Grover Goswami • Aaditya Mattoo • Sebastián Sáez A DEVELOPING COUNTRY PERSPECTIVE E xporting S ERVICES Public Disclosure Authorized Public Disclosure Authorized Public Disclosure Authorized ublic Disclosure Authorized Public Disclosure Authorized Public Disclosure Authorized Public Disclosure Authorized ublic Disclosure Authorized
-
Upload
khangminh22 -
Category
Documents
-
view
3 -
download
0
Transcript of Exporting SERVICES - World Bank Documents & Reports

EditorsArti Grover Goswami • Aaditya Mattoo • Sebastián Sáez
A DEVELOPING COUNTRY PERSPECTIVE
ExportingSERVICES
Pub
lic D
iscl
osur
e A
utho
rized
Pub
lic D
iscl
osur
e A
utho
rized
Pub
lic D
iscl
osur
e A
utho
rized
Pub
lic D
iscl
osur
e A
utho
rized
Pub
lic D
iscl
osur
e A
utho
rized
Pub
lic D
iscl
osur
e A
utho
rized
Pub
lic D
iscl
osur
e A
utho
rized
Pub
lic D
iscl
osur
e A
utho
rized
wb406484
Typewritten Text
wb406484
Typewritten Text
65837
wb406484
Typewritten Text


EXPORTING SERVICES


EXPORTING SERVICES
A DEVELOPING COUNTRY
PERSPECTIVE
Arti Grover Goswami, Aaditya Mattoo, and Sebastián Sáez,
Editors

© 2012 International Bank for Reconstruction and Development / International Development Association or The World Bank1818 H Street NWWashington DC 20433Telephone: 202-473-1000Internet: www.worldbank.org
1 2 3 4 15 14 13 12
This volume is a product of the staff of The World Bank with external contributions. Thefindings, interpretations, and conclusions expressed in this volume do not necessarilyreflect the views of The World Bank, its Board of Executive Directors, or the governmentsthey represent.
The World Bank does not guarantee the accuracy of the data included in this work. Theboundaries, colors, denominations, and other information shown on any map in this workdo not imply any judgment on the part of The World Bank concerning the legal status ofany territory or the endorsement or acceptance of such boundaries.
Rights and PermissionsThe material in this work is subject to copyright. Because The World Bank encourages dissemination of its knowledge, this work may be reproduced, in whole or in part, for noncommercial purposes as long as full attribution to the work is given.
For permission to reproduce any part of this work for commercial purposes, please senda request with complete information to the Copyright Clearance Center Inc., 222 Rosewood Drive, Danvers, MA 01923, USA; telephone: 978-750-8400; fax: 978-750-4470;Internet: www.copyright.com.
All other queries on rights and licenses, including subsidiary rights, should be addressedto the Office of the Publisher, The World Bank, 1818 H Street NW, Washington, DC 20433,USA; fax: 202-522-2422; e-mail: [email protected].
ISBN (paper): 978-0-8213-8816-7ISBN (electronic): 978-0-8213-8823-5DOI: 10.1596/978-0-8213-8816-7
Library of Congress Cataloging-in-Publication DataExporting services : a developing country perspective / Arti Grover Goswami, Aaditya Mattoo, Sebastián Sáez, editors.
p. cm.Includes bibliographical references and index.ISBN 978-0-8213-8816-7 — ISBN 978-0-8213-8823-5 (electronic)1. Service industries—Developing countries. 2. Foreign trade regulation. 3. Developing
countries—Commerce. 4. Free trade. I. Goswami, Arti Grover, 1978– II. Mattoo,Aaditya. III. Sáez, Sebastián.
HD9989.D44E97 2011382'.4500091724—dc23
2011039571
Cover image by Max Lyonga, Tiko, Cameroon, courtesy of the World Bank Art Program.Cover design by Tomoko Hirata/World Bank.

v
CONTENTS
About the Editors and Contributors xiii
Foreword xv
Acknowledgments xvii
Abbreviations xix
1 Exporting Services: A Developing-Country Perspective 1Arti Grover Goswami, Aaditya Mattoo, and Sebastián Sáez
2 Service Exports: Are the Drivers Different for Developing Countries? 25Arti Grover Goswami, Poonam Gupta, Aaditya Mattoo, and Sebastián Sáez
3 A Cross-Country Analysis of Service Exports: Lessons from India 81Arti Grover Goswami, Poonam Gupta, and Aaditya Mattoo
4 Reaching the World through Private Sector Initiative: Service Exports from the Philippines 121Soonhwa Yi
5 Exploring Niches for Exporting: The Case of Malaysia 161Mahani Zainal Abidin, Tham Siew Yean, and Loke Wai Heng
6 Unexploited Potential: The Case of Egypt 193Ahmed Farouk Ghoneim
7 Becoming a Global Exporter of Business Services? The Case of Kenya 237Nora Dihel, Ana Margarida Fernandes, Richard Gicho, John Kashangaki, and Nicholas Strychacz

8 Underlying Lessons: Service Exports from Brazil 269Mário Marconini
9 The Elusive Road to Service Export Diversification: The Case of Chile 309Francisco J. Prieto, Sebastián Sáez, and Arti Grover Goswami
Index 361
vi Contents

Boxes1.1 Defining Commercial Services 94.1 Exporting Services through the Movement of Labor:
The Pattern 1276.1 Case Studies of Successful Outsourcing Firms 2206.2 ITIDA Programs 2237.1 Description of Export Transactions 2557.2 Kenyan Services Exporters’ and Innovators’ Success
Stories: KenCall, Txteagle, Ushahidi, and Safaricom 2577.3 The Experience of South Africa in ITeS Exports 2629.1 Assessing the Performance of Chile’s Service Exports:
An Econometric Illustration 3209.2 Hidden Service Exports 3279.3 The Importance of Developing Credible Services
and Service Providers 339
Figures1.1 Partial Correlation between Service Exports and Human
Capital and Electronic Infrastructure, 2007 62.1 Service Exports: A Comparison across Income Groups, 2000–08 262.2 Human Capital and Service Exports, 2007 303.1 Agriculture, Industry, and Services as a Share of
India’s GDP, 1950–2010 853.2 Average Annual Growth Rates in India, by Sector, 1951–2009 863.3 Service Sector’s Share of India’s GDP and Log Per Capita
Income, by Sector, 1950–2006 873.4 Manufacturing Sector’s Share of GDP and Per Capita
Income, 1950–2006 883.5 Service Activities in Groups 1, 2, and 3 as a Share of
GDP, 1950–2008 903.6 Per Capita Service Output and Tertiary Education
across Indian States, 1980–2000 Averages 943.7 Importance of Service Exports in Aggregate
Exports, 1970–2009 953.8 RCA in Disaggregate Services, 1980–2010 963.9 Composition of India’s Software Service Exports,
2002/03 and 2007/08 973.10 India’s Outward FDI, by Sector, 1970–2007 1023.11 Ownership Structure of India’s Outward FDI, 1970–2007 1043.12 India’s OCS Exports, Actual versus Predicted, 1990–2010 1063.13 Export Growth from STP Units, 2000–09 1114.1 Growth in Exports of Goods and Services, 1999–2009 1244.2 Information and Business Services as a Proxy for BPO, 1999–2009 124
Contents vii

4.1.A Remittances in the Philippines Compared with Neighboring Countries, 1980–2010 127
4.1.B New Deployment by Occupation and Gender, 2007 1284.1.C New Deployment by Skill Category, 1995–2007 1294.3 Comparative Financial Attractiveness Scores, 2011 1394.4 Correlation between International Visitor Arrivals
and Tourism Export Receipts, 1990–2009 1454.5 Comparative Analyses of TTCI Rankings, 2009 1474.6 Marketing Effectiveness, 2008 1515.1 Value of Manufactured Exports and Transport
Service Exports, 1995–2008 1666.1 Structure of Egypt’s Exports of Commercial Services and
Other Commercial Services, 2000 and 2008 1976.2 Unemployment Rate of Educated Persons, 1994–2007 2166.3 Sources of Tourists in Egypt, 2007 2277.1 Services’ Share of GDP in Kenya, 2000–08 2397.2 Kenya’s Service Exports and Imports as a Share of
Total Exports and Imports, 2000–08 2397.3 Kenya’s Export Performance: Service Trade, 2004–08 2417.4 IT, BPO, and KPO Services 2437.5 Types of Activities That Can Be Outsourced across an
Organization’s Value Chain 2447.6 Evolution of Business Service Sectors 2457.7 Export Turnover of Service Sectors, 2007 2477.8 Service Exporters’ Target Markets 2498.1 Service Exports by Category, 1970–2009 2728.2 Composition of Service Exports, 2009 2758.3 Brazilian Service Export Markets, 2008 2768.4 Growth in Service Exports, 1989–2009 2768.5 Dynamism and Brazilian International Participation, 2003–07 2788.6 Doing Business Rankings, Brazil versus India, 2010 2808.7 Doing Business Rankings, Brazil versus China, 2010 2808.8 Importance of Each Fundamental Aspect, BRASSCOM 2818.9 Importance of Each Fundamental Aspect, ABES 2848.10 Distribution of Brazilian Direct Investment Abroad, 2009 2878.11 FDI in the Service Sector, 2004–09 2888.12 FDI in Brazil, 2005–09 2898.13 FDI Inflows as a Share of Total FDI, by Sector, 2009 2908.14 BNDES’s Expenditures in Credit Lines to the Service
Sector, 1998–2009 2928.15 BPT Service Exports, 1999–2009 2948.16 Cost of Dealing with Construction Permits, 2006–10 2978.17 Importance of Each Fundamental Aspect, Construction 298
viii Contents

8.18 Competitiveness of Transport Infrastructure, Brazil versus the United States, 2009–10 299
9.1 Chile’s Exports of Goods and Services, 2000–10 3109.2 Growth Rate of GDP and Services, 1990–2008 3149.3 Chile’s Service Exports, 1998–2008 3199.4 Service Export Composition, 1995–2008 3219.5 Chilean Offshoring Exports 3259.6 Firms’ Share in Service Exports 3269.7 Stock of Chilean Investment Abroad, June 2010 329
Tables1.A.1 Illustrative Barriers to Trade in Services 201.A.2 Inadequacies in Statistical Coverage on Trade in Services 222.1 Determinants of Service Exports: Gravity OLS
Estimation, 2000–08 442.2 Determinants of Service Exports: Gravity OLS Estimation,
Developing-Country Sample, 2000–08 492.A.1 Gravity Models for Explaining Service Trade 532.A.2 Results of Gravity Models 582.A.3 Definitions of Variables Used for Gravity Estimation 732.A.4 Partial Correlation of Variables on Electronic Infrastructure 753.1 Explaining Service Growth in India, 1980–2007 913.2 Service Share of SDP across Indian States, 1980–2005 933.3 Destination of Indian Software Service Exports, 2002/03
and 2007/08 983.4 Firm Characteristics and Software Service Exports
from India, 2002/03 and 2007/08 1003.5 Software Business by Indian-Owned Foreign
Affiliates, by Activity, 2007/08 1013.6 Allocation of India’s Outward FDI, by Sector, 1970–2007 1033.7 India’s Position in OCS Exports, 1990–2008 1054.1 Revealed Comparative Advantage Index, 1999–2009 1254.1.A Numbers of Overseas Workers 1284.1.B Destination of Deployment by Skill Category, 2007 1304.2 Revenues and Employment, by BPO Category, 2000–09 1344.3 BPO Export Destinations, 2005–08 1364.4 Foreign Equity Participation, 2005–08 1374.5 Number of Firms, by Ownership and by BPO Category, 2009 1374.6 High or Low Philippine Performance in Key Buy Factors 1384.7 Talent Pool, 2007 1394.8 Proportion of Graduates Suitable for the BPO Sector 1404.9 Incentives for IT-BPO Firms 1424.10 Tourism Incentives 146
Contents ix

5.1 Multiplier Effect of Increased Demand of RM 1 (US$0.26) in Every Subsector in Each of the Sectors Shown on Other Sectors and the Economy 163
5.2 Revealed Comparative Advantage of Malaysia, 1999–2008 1645.3 Investment Abroad of Telekom Malaysia Berhad, 2009 1695.4 Operations Abroad of Malaysian Banks, 2009 1705.5 Top Source Countries for International Students, 2003–07 1715.6 Top Destination Countries for Medical Tourism
Exports, 2003–07 1725.7 Top Source Countries for Tourists, 1999–2009 1735.8 Travel and Tourism Competitiveness Index, 2009 1745.9 Ease of Starting a Business: Malaysia and Regional and
Global Averages, 2010 1755.10 Ease of Doing Business: Ranking of Malaysia and
Selected Economies, 2006–10 1765.11 Regulators and Regulations for Selected Services 1845.12 Percentage of Adults with Tertiary Education 1865.13 The Global Competitiveness Index, Selected Indicators
for Skills, 2009–10 1876.1 Service Exports in Egypt, 2000, 2006, and 2007 1986.2 Revealed Comparative Advantage of Egypt’s Service Sectors 1996.3 Distribution of the Labor Force and the Unemployed in
Selected Middle Eastern and North African Economies, by Education 201
6.4 Egypt’s Ranking in the Doing Business Report 2046.5 Rank of Egypt and Its Main Competitors in Different
International Reports 2066.6 Egyptian Banks Operating in Foreign Countries, 2009 2096.7 Work Permits Granted to Egyptians in Arab Countries,
by Occupation and Year, 1985, 1990, and 2002 2146.8 Projections of IT Exports by 2010 2196.9 Fields Where Multinational Companies Are Engaged 2256.10 Main Tourism Indicators, 1985–2007 2276.11 Ranks in Travel and Tourism Competitiveness Index, 2009 2286.12 SWOT Analysis for Egypt’s Comparative Advantage in Services 2307.1 Service Subsectors as a Share of Total Service Exports, 1998–2008 2407.2 RCA in Kenyan Service Subsectors, 2008 2407.3 Typical Export Destinations, by Service Sector 2507.4 Exported Services, by Sector 2527.5 Policy Recommendations 2618.A.1 The Largest Nonfinancial Companies and Firms in
Latin America and the Caribbean and Their Investments outside Their Countries of Origin, 2007 305
9.1 Share of Services in GDP, 1990–2008 313
x Contents

9.2 Trade as a Share of GDP, 1990–2008 3179.3 Employment and Service Exports, 2008 3189.4 Composition of Other Commercial Service Exports in Chile 3239.5 Leading Chilean Companies Investing Abroad, 2004–05 3309.6 Attracting High-Tech Companies to Chile 3429.A.1 Chile’s Position in Commercial Service Exports 3519.A.2 Commercial Service Exports from the Chilean Perspective 355
Contents xi


xiii
About the editorsand Contributors
Editors
Arti Grover Goswami: Consultant, International Trade Department and Develop-ment Research Group Trade and Integration Unit, World Bank.
Aaditya Mattoo: Research Manager, Trade and International Integration, WorldBank.
Sebastián Sáez: Senior Trade Economist, International Trade Department, WorldBank.
Contributors
Mahani Zainal Abidin: Chief Executive, Institute of Strategic and InternationalStudies (ISIS), Malaysia.
Nora Dihel: Senior Trade Economist, Poverty Reduction and Economic Manage-ment Network, Africa Region, World Bank.
Ana Margarida Fernandes: Senior Economist, Development Research GroupTrade and Integration Unit, World Bank.
Ahmed Farouk Ghoneim: Professor of Economics, Faculty of Economics andPolitical Science, Cairo University; Research Fellow, Economic Research Forum(ERF) and Center for Economic and Social Research (CASE).

Richard Gicho: Principal Consultant, TriMagus Consulting, Nairobi, Kenya.
Poonam Gupta: RBI Chair Professor, National Institute of Public Finance and Pol-icy, Delhi, India.
John Kashangaki: Executive Director, Strategic Business Advisors, Ltd., Nairobi,Kenya.
Mário Marconini: President, ManattJones Marconini, Global Strategies, SãoPaulo, Brazil.
Francisco J. Prieto: Consultant and Professor of International Economics, Univer-sidad de Chile (Institute of International Studies) and Heidelberg Center for LatinAmerica.
Loke Wai Heng: Senior Lecturer, Department of Economics Faculty of Economicsand Administration University of Malaya.
Nicholas Strychacz: Project Analyst, Strategy and Analysis, Federal Reserve Bankof San Francisco.
Tham Siew Yean: Professor and Principal Research Fellow, Institute of Malaysianand International Studies (IKMAS), Universiti Kebangsaan Malaysia.
Soonhwa Yi: Economist, IDA Resource Mobilization (CFPIR), World Bank.
xiv About the Editors and Contributors

xv
The role of services reform in development is widely recognized. The past twodecades have seen exciting changes with developing countries emerging asexporters of services. Some countries have, of course, taken advantage of techno-logical developments that make it easier to trade services across borders. But otheravenues are also being exploited: tourists are coming, not just to sightsee but alsoto be treated and educated; service providers are moving abroad under innovativenew schemes; and, interestingly, some developing countries are defying traditionalnotions by investing abroad in services.
Policy makers, preoccupied with tangible trade, have taken some time to cometo terms with the rise of intangibles. But new and legitimate questions are beingraised: How can this dynamism be sustained and how can it be replicated in othercountries? Surprisingly, few studies address these questions. To provide credibleanswers, we need to delve deeper into the determinants of exporting success andconfront another consequence of intangibility: the difficulty measuring tradeflows and the policies that affect these flows have inhibited serious empiricalresearch on services trade.
This book takes a brave approach, combining exploratory econometric analysiswith detailed case studies of representative countries. It reviews the experienceand performance of Brazil, Chile, the Arab Republic of Egypt, India, Kenya,Malaysia, and the Philippines. Several questions lead the analysis: How did thesedeveloping countries succeed in exporting services? What policy mix was success-ful, and what strategies did not deliver the expected results? The analysis evaluatesthe role of three sets of factors: First, the fundamentals, which include a country’sfactor endowments (especially human capital), infrastructure (particularlytelecommunication networks), and institutional quality (especially the regulatoryenvironment for services); second, policies affecting trade, investment, and labor
Foreword

mobility in services; and third, proactive policies in services designed to promoteexports or investment.
The case studies illustrate the complex nature of reforms and policy making inthe service sector as well as the benefits of well-implemented reforms. Althoughsuccess seems to be explained by a set of conditions that are difficult to replicate,common features can also be identified. Countries in which the infrastructurefor service delivery and the institutions governing services—such as regulatoryframeworks—improved were, over time, able to become successful serviceexporters. Human capital and information technologies are crucial determinantsof export success in modern services, such as business and professional services.Openness to foreign investment is also relevant because in some cases this invest-ment provided the crucial first spark. Several countries have adopted policies tosupport exports, especially exports of information technology–related services.The book is refreshingly open to the role these proactive policies might haveplayed.
We hope this resource will be valuable for policy makers, experts, and academ-ics who are engaged in efforts to reform service and investment policies in theirown country and that the questions raised here generate new research and guidefurther economic policy analysis on service trade.
Otaviano Canuto Justin Yifu LinVice President Senior Vice PresidentPoverty Reduction and Economic Management Development EconomicsWorld Bank World Bank
xvi Foreword

xvii
This book is a joint effort by the World Bank’s International Trade Department(PRMTR) and the Development Research Group Trade and Integration Unit(DECTI), which are part of the Poverty Reduction and Economic ManagementVice Presidency and the Development Economics Vice Presidency, respectively. Ateam composed of Aaditya Mattoo (sector manager, DECTI), Sebastián Sáez(senior trade economist, PRMTR), and Arti Grover Goswami (consultant, DECTIand PRMTR) edited the book.
The editors would like to thank the authors of the individual chapters and themany individuals who contributed to the project. In particular, they would like toacknowledge contributions by Mahani Zainal Abidin, Nora Dihel, Ana MargaridaFernandes, Ahmed Farouk Ghoneim, Richard Gicho, Poonam Gupta, JohnKashangaki, Mário Marconini, Francisco J. Prieto, Loke Wai Heng, NicholasStrychacz, Tham Siew Yean, and Soonhwa Yi.
Many other people also contributed to this report. Michael Engman (WorldBank) and Sherry Stephenson (Organization of American States) peer reviewedthe concept note and provided important comments that helped direct the proj-ect. In addition, Michael Engman and Dale Honeck (World Trade Organization)peer reviewed an early draft of the book and provided valuable comments andsuggestions that were incorporated into the final draft. Bernard Hoekman (WorldBank), Daniel Lederman (World Bank), Carolina Lennon (United Nations Indus-trial Development Organization), Nanno Mulder (Economic Commission forLatin America and the Caribbean), and Maurice Schiff (World Bank) providedvaluable comments and suggestions on individual chapters. Also, Guillermo
Arenas, Jean-Francois Arvis, Olivier Cadot, Ejaz Ghani, Charles Kunaka, JoseGuilherme Reis, and Jose Daniel Reyes from the World Bank provided useful sug-gestions and comments in different stages of the project.
Acknowledgments

Pritam Banerjee and Mukul Gupta (Confederation of Indian Industry) pre-pared a background paper on specific policies promoting India’s services exportson which the relevant section of chapter 3 is based. Pumela Salela contributedinformation about South Africa’s experience in exporting information and com-munication technology–enabled services, which is included in chapter 7. CynthiaAbidin-Saurman, Shienny S. Lie, and Amelia Yuson provided excellent administra-tive assistance and helped to format the volume. Stacey Tai Sie Chow and StephanieK. Chen provided support during the book’s preparation and coordinated withPRMTR’s publication program.
This project was supported in part by the governments of Finland, Norway,Sweden, and the United Kingdom through the Multi-donor Trust Fund for Tradeand Development. Finally, the project and the book would not have been possi-ble without the continuous support and guidance of the PRMTR staff and itsmanagement team, in particular Mona Haddad (sector manager) and BernardHoekman (director).
The editors would also like to thank the World Bank’s Office of the Publisher forthe efficient management of the publication process, in particular, Theresa MarieCooke, Stephen McGroarty, Andrés Meneses, and Janice Tuten, who providedexcellent editorial, design, production, and printing services for this book andLinda Lee Stringer of Publications Professionals LLC, for editing an early draft.
xviii Acknowledgments

xix
ABES Associação Brasileira das Empresas de Software, or Brazilian Association of Software Companies
AFAS ASEAN Framework Agreement on Services APEC Asia-Pacific Economic Cooperation ApexBrasil Agência Brasileira de Promoção de Exportações e Investimen-
tos, or Brazilian Trade and Investment Promotion AgencyASEAN Association of Southeast Asian NationsBASA bilateral air service agreementBDIA Brazilian direct investment abroadBNDES Banco Nacional de Desenvolvimento Econômico e Social, or
Brazilian Development Bank BOI Board of Investments (Philippines)BPAP Business Processing Association of the PhilippinesBPO business process outsourcingBPT business, professional, and technicalBRASSCOM Associação Brasileira de Empresas de Tecnologia da Infor-
mação e Comunicação, or Brazilian Association of InformationTechnology and Communication
BRIC Brazil, the Russian Federation, India, and ChinaC&RSs construction and related servicesCAD computer-aided designCBE Central Bank of EgyptCMMI Capability Maturity Model Integration CNIC Consejo Nacional de Innovación para la Competitividad, or
National Council for Innovation for Competitiveness (Chile)CORFO Corporación de Fomento, or Chilean Development Agency
Abbreviations

DIRECON Dirección General de Relaciones Económicas Internacionales, or Directorate General of International Economic Relations (Chile)
DL Decree Law (Chile)DSCI Data Security Council of IndiaEAC East African CommunityEPC Export Promotion Council (Kenya)EPZ export processing zoneEU European UnionFDI foreign direct investmentFIC Foreign Investment Committee (Malaysia)FIML full information maximum likelihoodFiRe Financial Reporting (Award)FTE full-time employeeGATS General Agreement on Trade in ServicesGCC Gulf Cooperation CouncilGDP gross domestic productGMM generalized method of momentsGSC global support centerGSLI Global Services Location IndexGSM Global System for Mobile CommunicationHIPAA Health Insurance and Portability and Accountability Act
(United States)ICA Investment Climate AssessmentICT information and communication technologyIDA Industrial Development Agency (Ireland)IFRS International Financial Reporting StandardsIMF International Monetary FundINAPI Instituto Nacional de Propriedad Industrial, or
National Institute for Industrial Property (Chile)IPP Investment Priorities Plan (Philippines)ISO International Organization for StandardizationISQua International Society for Quality in HealthIT information technologyITeS IT-enabled serviceITH income tax holidayITIDA Information Technology Industry Development Authority
(Arab Republic of Egypt)ITIL IT Infrastructure Library JCI Joint Commission International
xx Abbreviations

KPO knowledge process outsourcingMCIT Ministry of Communications and Information Technology
(Arab Republic of Egypt)MTPDP Medium-Term Philippine Development Plan 2004–2010Mercosur Mercado Común del Sur, or Southern Cone Common MarketMQA Malaysian Qualifications AgencyMSC Multimedia Super Corridor (Malaysia)MSQH Malaysian Society for Quality in HealthNAC NASSCOM Assessment of Competence (India)NAIA Ninoy Aquino International Airport (Philippines)NASSCOM National Association of Software and Services Companies
(India)NEM New Economic Model (Malaysia)NIESA NASSCOM’s India-Europe Software AllianceNINJSA NASSCOM’s India-Japan Software AllianceNSR National Skills Registry (India)OBHE Observatory on Borderless Higher EducationOBS Orange Business ServicesOCR optical character recognitionOCSs other commercial servicesOECD Organisation for Economic Co-operation and DevelopmentOFW overseas Filipino workerOLS ordinary least squaresPDP Política de Desenvolvimento Produtivo, or
Policy for Productive Development (Brazil)PETRONAS Petroliam Nasional Berhad (Malaysia)PEZA Philippine Economic Zone AuthorityPFA Philippine Franchise AssociationPGMA President Gloria Macapagal-Arroyo (Philippines)PIATCO Philippine International Air Terminals Co.PISA Programme for International Student AssessmentPMR product market regulationPPML Poisson pseudo maximum likelihoodProChile Dirección de Promoción de Exportaciones, or
Export Promotion Agency (Chile)Procult Programa para o Desenvolvimento da Economia da Cultura,
or Program for the Development of the Economy of Culture(Brazil)
PTA preferential trade agreementQSIIS Quarterly Survey of International Investment and Services
Abbreviations xxi

RBI Reserve Bank of IndiaRCA revealed comparative advantageRTA regional trade agreementSAR Special Administrative Region (China)SARS severe acute respiratory syndromeSD standard deviationSDP state domestic productSECC Software Engineering Competence CenterSernatur Servicio Nacional de Turismo, or National Tourism Service
(Chile)SIPA Silicon Valley Indian Professionals AssociationSMEs small and medium-size enterprisesSTP software technology parkSTPI Software Technology Parks of IndiaSUR seemingly unrelated regressionSWOT strengths, weaknesses, opportunities, and threatsTESDA Technical Education and Skills Development Agency
(Philippines)TEZ tourism enterprise zoneTFP total factor productivityTiE The Indus EntrepreneursTIEZA Tourism Infrastructure and Enterprise Zone Authority
(Philippines)TOEFL Test of English as a Foreign LanguageTOKTEN Transfer of Knowledge through Expatriate NationalsTTCI Travel and Tourism Competitiveness IndexUNSTATS United Nations Statistical DivisionVoIP Voice over Internet ProtocolWiMax Worldwide Interoperability for Microwave Access
xxii Abbreviations

Exporting Services: A Developing-Country
Perspective
Arti Grover Goswami, Aaditya Mattoo, and Sebastián Sáez
Since the mid-1990s, service exports of 20 developing countries—including notjust Brazil, India, the Russian Federation, and China, but also Cambodia, Ghana,Morocco, and Nigeria—have grown by over 15 percent annually. From 1990 to2007, before the financial crisis, the average growth of service exports was about8.7 percent for high-income countries, 10.0 percent for low-income, and 13.0percent for lower-middle-income countries. The share of developing countries inexports of world services increased from 11 percent in 1990 to 21 percent in2008. Developing countries are exporting not just traditional services, such astransportation and travel (or tourism) services, but also modern services,notably high-value, skill-intensive services, such as computer and informationservices and other business services.
The success of some countries in exporting services seems to be unrelated totheir performance in trade in goods or to their industrial development. In fact,service sector exports of a number of developing countries are growing faster thantheir goods exports and are contributing to their export diversification. Someauthors have suggested a “service revolution” is occurring that offers an alternativechannel for accelerated economic growth and poverty alleviation (Ghani 2010).
At the start, clarifying certain aspects of trade in services is helpful(Copeland and Mattoo 2008; Francois and Hoekman 2010). Because manyservice transactions require face-to-face contact between the consumer and theprovider (despite the increased scope for electronic delivery), defining trade in
1
1

2 Exporting Services
services more broadly than trade in goods to encompass the following fourmodes of supply is now standard:
• Mode 1: Cross-border trade in services. Such trade is analogous to goods tradethat involves shipping services such as software from one country to another.
• Mode 2: Consumption abroad. Such trade occurs when consumers (for exam-ple, tourists or students) travel across borders.
• Mode 3: Commercial presence. The producer of a service establishes a commer-cial presence (for example, a subsidiary or branch of a bank) in the country ofthe consumer.
• Mode 4: Movement of natural persons. In this case, the producer (for example, amining engineer) travels across borders.
One important implication of this broad definition of trade in services is that itincorporates the international movement of factors—through foreign directinvestment (FDI) and temporary labor mobility.
The modes of supply can either substitute for or complement one another inspecific services. For example, in simple bookkeeping services, modes 1 and 4 maybe substitutes, but in the design of software suited to a foreign firm’s needs, thetwo modes may be complements. The relationship between modes has implica-tions for the analysis of the effect of regulations on the costs and quality of theservices. If modes are perfect substitutes, the liberalization of one of them isenough to fully reap the gains from liberalization. But when modes are imperfectsubstitutes or complements, effective access to service markets requires the free-dom to use a combination of modes.
Barriers to trade in services are more complex than are barriers to trade ingoods. The ability of foreign service providers to contest markets depends notonly on explicit restrictions to entry but also on policy and regulation of domesticservices (see table 1.A.1 in annex 1.A). These regulations exist, in principle,because service markets are characterized by market failures such as imperfect andasymmetric information, especially in such knowledge-intensive sectors as profes-sional and financial services, as well as lack of competition and natural barriers toentry, particularly in sectors with significant network externalities, such as com-munications and transport.
From a trade perspective, the first problem is that the presence of regulations toremedy information failures can become an impediment, either purely becausecountries differ in the choice and stringency of instruments (such as qualificationor licensing requirements) or because sometimes these regulations are deliber-ately designed to protect domestic providers. The second problem is that theabsence of regulations to remedy market power can enable incumbent providers

to frustrate entry by denying access to essential facilities (such as telecommunica-tion networks, ports, and airports).
Are the factors that explain trade in services different from those that explaintrade in goods? Broadly speaking, the two major explanations for trade betweencountries also apply to service trade and can be extended to include trade throughdifferent modes (Copeland and Mattoo 2008). First, the theory of comparativeadvantage sees trade as interindustry and the result of fundamental differencesbetween countries. In the case of services, as for goods, differences in technologyand relative endowments (including factors of production as well as institutionsand infrastructure) determine comparative advantage. Thus, Kenya exports cer-tain skill-intensive professional services to other African countries because it isrelatively well endowed with skilled labor, and the United States exports satellitelaunch services to other countries because it is relatively well endowed with capi-tal and the relevant technology. Differences in determinants are not static and mayevolve over time depending on the policy and other choices a country makes. Thesecond explanation for intraindustry trade between countries emphasizes thetwin features of (a) consumers’ love of variety and (b) producers’ gains from spe-cialization in specific varieties caused by increasing returns to scale or agglomera-tion. Many firms exist because they have specialized knowledge, distribution andsupply networks, and differing reputations for quality and reliability. Thus, bothEurope and the United States produce and sell banking services to each otherbecause their respective banks—ranging from UBS to the Bank of America—specialize in slightly different services that appeal to different European and U.S. consumers.
Recent theoretical developments highlight the role of technology in thegrowth of trade in services. Technological changes are clearly reducing the needfor proximity between the producer and the consumer. These changes are alsoallowing the fragmentation of production into tasks that may be performed indifferent locations (Feenstra 2010). Fragmentation, which affects the produc-tion of both goods and services, means that a vertically connected productionprocess that takes place in one location can now be undertaken in differentregions or countries (Jones 2000). Communication, logistics, and financialservices, among others, allow connection of tasks from different locations.Developing countries are taking advantage of these new opportunities toexport services. For example, the absence of internationally recognized profes-sionals may be an impediment to a country’s ability to export complete archi-tectural or accounting services to the final consumer in another country, butthe country can still produce and export parts of these services (basic designand accounts) to foreign professionals who can assemble these parts and servethe final consumer.
Exporting Services 3

4 Exporting Services
Determinants of Trade in Services
This book attempts to disentangle the determinants of developing-country partic-ipation in service exports and to identify strategies for export success. It examinesthe role of the following factors:
• The “fundamentals,” which are given in the short run but can be influenced bypolicy in the longer term. These fundamentals include a country’s factor endow-ments, especially of human capital, including skills and entrepreneurial ability;natural resources and cultural endowments, such as those that attract tourism;infrastructure,1 especially telecommunication networks that facilitate thedelivery of services; and institutional quality, especially the regulatory environ-ment for services.2
• Policies affecting trade, investment, and labor mobility in services. A broadrange of policies affect cross-border trade, such as transport and financialservices; consumption abroad in health and education services; foreigninvestment and the participation of multinational companies in banking,telecommunications, and business process outsourcing (BPO); and themovement of individual service providers in construction and informationtechnology (IT) services.
• Proactive policies in services. Such policies include those designed to promoteexports, investment, or both, for example, by creating special economic zonesor allowing privileged access to land, infrastructure, or imported inputs; byproviding fiscal incentives for exporters and investors in the form of subsidiesor tax exemptions; and by establishing other trade promotion activities, such astrade fairs and information dissemination.
The book builds on previous research, including that by the World Bank, on tradein services. Such research includes analyses of the effect of liberalizing services indeveloping countries and sectoral studies on financial, transportation, telecom-munication, and professional services, as well as on international negotiations.The conceptual framework for this book is based on the existing literature on theservice sector (Francois and Hoekman 2010; Hoekman and Mattoo 2008). Recog-nizing the heterogeneity in both the economic structure of developing countriesand their service exports, this book takes an eclectic approach to identifying suc-cessful strategies. Chapter 2 surveys the literature on determinants of serviceexports and presents an illustrative empirical model that synthesizes the availablemodels on trade in services. Because trade data on services are scarce and have anumber of weaknesses, rigorous econometric analysis has serious limits.
The subsequent chapters of the book examine the determinants of trade in servicesthrough case studies of the experiences of countries with varying degrees of success.

Exporting Services 5
The book analyzes service export performance for the following countries: Brazil,Chile, the Arab Republic of Egypt, India, Kenya, Malaysia, and the Philippines. Thecountries were selected on the basis of their performance in global trade (especiallytrade in services), their regional role, and the availability of data and because theyhave consciously pursued policies to promote service exports. The case studies ana-lyze and compare various policies and strategies that these countries have used. Sev-eral policy lessons emerge, which are grouped in accordance with the factors listedpreviously and discussed in the following three subsections.
The role of fundamentals
The empirical literature confirms that service sector performance criticallydepends on human capital, the quality of the telecommunication network, andthe quality of institutions.3 The gravity framework has been widely used toexplore the determinants of trade in services. Results of gravity models suggestthat human capital skills and electronic infrastructure are important determinantsof trade in services (Lennon 2006; Lennon, Mirza, and Nicoletti 2009; Shingal2010). The literature also suggests that the quality of institutions, as measured bythe degree of corruption,4 complexity of export procedures, and rigidity inemployment law (Lennon 2006), or the economic freedom index (Kimura andLee 2006) also positively influence trade in services. Additionally, bilateral trade in goods promotes trade in services. On the effect of geographic and cultural variables, most studies agree that distance dampens trade in services.
Identifying the reasons for the success or underperformance of developingcountries in exporting services remains challenging because of the lack of reliabledata. Mattoo (2005) and Maurer and others (2008) describe some of the inade-quacies in the data relating to trade in services. Annex table 1.A.2 summarizes themain inadequacies in current statistical coverage of trade in services.
The illustrative empirical exercise conducted in chapter 2 of this book corrob-orates the findings of several studies regarding the importance of the telecommu-nication network, human capital, and institutions. Figure 1.1 shows a positiveassociation between human capital and service exports (panel a) and electronicinfrastructure and service exports (panel b).
To succeed in higher-end service exports, a country must be well endowed withhuman capital. This finding is evident from both the illustrative empirical exerciseand the case studies. The estimation in chapter 2 finds that human capital, as measured by tertiary school enrollment in the source country, is significant inaffecting bilateral service exports. Moreover, the coefficient for this variable islarger for the developing-country sample, implying that the return to investmentin human capital in terms of exports is larger in countries that are not rich.

Figure 1.1. Partial Correlation between Service Exports and Human Capitaland Electronic Infrastructure, 2007
14a. Human capital and service exports
b. Electronic infrastructure and service exports
10
5
0
12
10
8
6
4
0 20 40tertiary school enrollment (% of gross)
60 80 100
0 20 40Internet penetration (per 100 persons)
60 80 100
serv
ice
exp
orts
(lo
gs)
serv
ice
exp
orts
(lo
gs)
Source: World Bank’s World Development Indicators database.
6 Exporting Services
The fact that endowment of human capital matters for service exports is evidentin many developing countries. The high quality of doctors and standard of treat-ment in Thailand explains its medical tourism exports. Even though the quality ofThai medical services compares well with that of developed countries, the prices aremostly lower than in other countries because of the low cost of doctors and infra-structure. For example, dental care in Thailand costs about 85 percent less than inthe United States even when the cost of travel is included (see Arunanondchai andFink 2007 for more details). Similarly, the quality and abundance of the engineeringworkforce in Tunisia explain its success in exporting engineering services. Tunisia’s

Exporting Services 7
performance is the result of a policy that made human resources a driving factor fordevelopment (Cattaneo, Schmid, and Engman 2010).
The success in service exports of India or the Philippines is attributed to thehigh quality and large pools of human capital. Particularly revealing are the casesof Malaysia, where inadequate skills are seen as the reason that commercial serviceexports have not developed, and Egypt, where the poor quality of education isfound to be an impediment to exporting those services. These cases mirror thoseof Chile, where inadequacies in the scale as well as the skill of labor deter serviceexports, and Brazil, where the insufficient quality of skills is the main concern forfuture development.
This book’s case studies do not provide guidance on the types of skills in whicha country should invest. In many countries, investment in human capital is pri- marily state driven, whereas service exports are usually private sector driven. Sev-eral countries are experiencing a mismatch between skills required by the marketand those being produced by the education system. For instance, Kenya is relatively well endowed with graduates who could work in various business serv-ice firms, including the BPO sector; however, new graduates need substantialpostgraduate training to catch up with international standards. In the Philippines,experience suggests that not all college graduates are ready for the labor market.Only 10 percent of contact center applicants are immediately hired. The TechnicalEducation and Skills Development Agency provides educational grants for BPO“near-hires.” Malaysian graduates lack the required skills needed in the market. Asa result, in 2008, about 25 percent of local graduates from public universitiesremained unemployed six months after graduation. Thus, a shortage of skilledhuman capital exists in the country, and improving the situation is critical forMalaysia to enhance the export of knowledge-based services. In India, the deriveddemand for skills has prompted a powerful response from the private sector interms of investment in education and training. Recognizing that the unavailabilityof skills disadvantages Egypt in comparison to its competitors (A.T. Kearney2009), the Ministry of Communications and Information Technology has devel-oped specific training programs for different segments of the industry to preparegraduates for work in the information and communication technology (ICT)industry. The Information Technology Industry Development Authority (ITIDA)is also running an education program called EduEgypt, which collaborates withuniversities to train students to enter the BPO industry.
The illustrative gravity model framework in chapter 2 also suggests that Internetpenetration in the trading partner matters more than that in the exporter. Theseresults imply that firms exporting services need access to high-quality electronicinfrastructure that does not necessarily have to cover the general population of theexporter country. Therefore, Internet penetration among the general population in

8 Exporting Services
the exporter country may not significantly affect service exports. An exporting firmin a developing country may own the equipment for better-quality telecommuni-cations, or the government may be able to create special economic regimes, such asIT parks or software technology parks (STPs), as in the case of Egypt, India, and thePhilippines, to overcome the handicap of technology penetration.
Neither does the state of electronic infrastructure by itself explain the successof developing countries in exporting services. For instance, India has been ableto successfully export software services even with a low Internet penetration of7 persons per 100, whereas Malaysia has been less successful in exporting suchservices despite a high Internet penetration of 63 persons per 100. In theMalaysian case, exports of ICT services are inhibited by low Internet penetrationin potential export destination countries.
Service exports conform in certain respects to the predictions of the theory ofcomparative advantage with some degree of factor specificity. Broadly, a country’sexports of services depend on its endowments at any time of infrastructure, fac-tors of production, and institutions relevant to services, in comparison to itsendowments of these factors relevant to manufacturing. Thus, countries such asIndia and the Philippines are doing well in cross-border exports of skill-intensiveservices but are lagging in labor-intensive manufacturing exports, not because oftheir absolute advantage in services—they remain relatively abundant in unskilledlabor—but because of their comparative disadvantage in manufacturing. In India,for example, the markets for skilled labor in services are relatively flexible, whereasthose for unskilled labor in the formal manufacturing sector are rendered rigid byregulation and unions. Moreover, the infrastructure for service delivery (telecom-munication networks) has improved dramatically, whereas that for goods delivery(roads and ports) is improving much more slowly. Also, the institutions governingtrade in services—both public institutions such as the Telecommunications Regu-latory Authority and private institutions such the National Association of Soft-ware and Services Companies (NASSCOM)5—are widely seen as competent andhonest, whereas the institutions governing trade in goods (such as the customsauthorities) are widely seen as less competent and more corrupt. Conversely, thecomparatively more limited success of countries such as Chile and Malaysia inexporting skill-intensive commercial services may have less to do with theirabsolute disadvantage in services than with their comparative advantage inexporting agricultural and manufacturing goods, respectively.
Transport and travel services are intensive in the use of physical infrastruc-ture and are also sensitive to institutions such as customs and border manage-ment. This characteristic makes such exports appear similar to goods exportsrather than to exports of other commercial services (box 1.1). In contrast,other commercial services, which are usually traded across borders, rely on

Box 1.1: Defining Commercial Services
Commercial services in this book are defined as transportation services, travel, andother commercial services, excluding government services (such as supplied oracquired by embassies, military bases, and international organizations, and so on).
Transportation services cover sea, air, and other modes of transportation, includingland, internal waterway, space, and pipeline transport. Such services are performedby residents of one economy for those of another and involve the carriage ofpassengers, the movement of goods (freight), rentals (charters) of carriers with crew,and related supporting and auxiliary services.
Travel includes goods and services acquired by personal travelers for health,education, or other purposes and by business travelers. Unlike other services, travel isnot a specific type of service but an assortment of goods and services consumed bytravelers. The most common goods and services covered are lodging, food andbeverages, entertainment, transportation (within the economy visited), and gifts andsouvenirs.
Other commercial services include the following:
• Communications services. These services include telecommunication, postal, andcourier services.a The term telecommunication services encompasses the transmissionof sound, images, or other information by telephone, telex, telegram, radio andtelevision cable and broadcasting, satellite, electronic mail, facsimile services, andthe like. Telecommunication services include business network, teleconferencing,and support services. They do not include the value of the information transported.Also included are cellular telephone services, Internet backbone services, and onlineaccess services (such as provision of access to the Internet).
• Construction. This type of service covers work performed on construction projectsand installation by employees of an enterprise in locations outside the territory ofthe enterprise (the one-year rule to determine residency is applied flexibly). Inaddition, goods used by construction companies for their projects are included,which implies that the actual service component tends to be overestimated.
• Insurance services. These services cover the provision of various types of insuranceto nonresidents by resident insurance enterprises, and vice versa. Such insurancemay include freight insurance, direct insurance (such as life insurance), andreinsurance.
• Financial services. These services are the financial intermediation and auxiliaryservices provided by banks, stock exchanges, factoring enterprises, credit cardenterprises, and other enterprises.
• Computer and information services. This category is subdivided into computerservices (hardware- and software-related services and data processing services);news agency services (provision of news, photographs, and feature articles to themedia); and other information provision services (database services and Websearch portals).
• Royalties and license fees. These fees include payments and receipts for the use ofintangible nonfinancial assets and proprietary rights, such as patents, copyrights,trademarks, industrial processes, and franchises.
• Other business services. This broad category comprises trade-related services;operational leasing (rentals); miscellaneous business, professional, and technicalservices such as legal, accounting, and management consulting; public relations,advertising, market research, and public opinion polling; research and development;architectural, engineering, and other technical services; and agricultural, mining, andonsite processing.
Exporting Services 9

• Personal, cultural, and recreational services. This category is subdivided into twocomponents: (a) audiovisual services and (b) other cultural and recreational services.The first component includes services and fees related to the production of motionpictures, radio and television programs, and musical recordings. Other personal,cultural, and recreational services include those associated with museums, libraries,and archives, as well as other cultural, sporting, and recreational activities. Alsoincluded are services related to education, such as correspondence courses andeducation via television or the Internet, as well as services performed by teachers.
• Health services comprise services provided by doctors, nurses, and paramedical andsimilar personnel, as well as laboratory and similar services, whether renderedremotely or on site.
Excluded from other personal expenditures is all expenditure by travelers on educationand health. Such services are included in travel.
Sources: Adapted from IMF 2009; UN and others 2002; WTO 2010. a. In IMF (2009), postal and courier services are included under transportation services, telecom-munication services are included under computer and information services, and the royalties andlicense fees were changed to charges for the use of intellectual property not included elsewhere.
10 Exporting Services
telecommunication infrastructure and are sensitive to institutions that influ-ence contract enforcement.
The case of Malaysia (chapter 5 in this book) is diametrically opposite to thatof India. Exports of travel services contributed more than 50 percent of aggregateservice exports from Malaysia in 2008. Between 2001 and 2008, exports of othercommercial services as a share of total service exports from Malaysia declinedfrom 34 percent to 27 percent even though Malaysia has very high Internet pene-tration rates and high tertiary school enrollment. Malaysia also has excellent-quality physical infrastructure and goods-related institutions that have boostedits exports of goods. Certain service exports have also benefited from the qualityof basic infrastructure, particularly mode 2 service exports, such as travel, healthtourism, and education services.
Chile (chapter 9 in this book) is another example of a country that seems tovalidate this hypothesis of the importance of the relative endowments, infrastruc-ture, and institutions that matter for the service sector. Although many otherdeveloping countries are taking advantage of globalization in service provisionand moving toward providing other commercial services, the composition ofChile’s exported services is moving toward transport services. Several supply-sidefactors, such as the limited pool of human resources specifically suited for othercommercial services and the scarcity of English-language skills, affect the effi-ciency of labor in service provision and hence partly explain the comparativelymoderate growth rate in exports of other commercial services from Chile. Chile’sexcellent infrastructure, endowment, and institutions seem to favor exporting

goods rather than exporting services; hence, the country excels in exporting trans-port services that complement the trade in goods.
The case of the Philippines (chapter 4 in this book) also underscores the impor-tance of the relative endowments, infrastructure, and institutions that matter forthe service sector. The contribution of BPO service exports to gross domestic prod-uct surged from 0.5 percent in 2001 to 3.7 percent in 2008. The Philippinesaccounted for 15 percent of the global BPO market in 2008, after India (37 percent)and Canada (27 percent). The industry thrived at an annual growth rate of40 to 50 percent from 2004 to 2007, before declining to 23 percent in 2008 and19 percent in 2009. Philippine business service exports were encouraged by lowlabor costs, low telecommunication and Internet costs, a large pool of compe-tent and English-speaking labor, and Filipinos’ affinity to the U.S. legal andeducational system and to U.S. culture.
Policy and regulations can be an impediment to trade in services. The researchliterature reviewed in chapter 2 tends to confirm that regulatory barriers to serv-ice trade in both the reporter and the partner countries negatively affect trade.This finding is also confirmed in the case studies. For instance, in the case ofMalaysia, progressive deregulation of the service sector, either through formaltrade liberalization agreements or unilateral liberalization measures, has con-tributed to the increasing importance of the service sector by enhancing thepotential of service exports. Also, in Brazil, the comparative advantage in serviceexports was significantly developed or deepened after the second half of the 1990s,which in turn indicates a strong correlation with the main economic policyreforms of that period—that is, liberalization and market opening. In the case ofthe Philippines, liberalization in the telecommunication industry in 1993increased competitiveness in the industry and, hence, improved the quality andefficiency of telecommunication infrastructure. Also the special regime that bene-fits the BPO industry creates a more business-conducive environment by offeringone-stop-shop services for business registration and extends an exemption oflocal government business permits, licenses, and fees.
Investment, labor mobility, and trade policies
Inward FDI may help initiate and even sustain service exports, as in the case ofIndia, the Philippines, and (to a lesser extent) Chile. In India, multinational firmswere among the first to recognize the scope for BPO (Athreye 2003). At the sametime, foreign firms established by expatriate Indians—who were familiar with for-eign markets and with new ideas for fragmenting the value chain—added to thecompetitive pressure. These developments generated a virtuous cycle drawing indomestic firms: for example, the tightening of labor markets, which was caused by
Exporting Services 11

12 Exporting Services
foreign competition, induced domestic firms to acquire unique organizationalcapabilities and multinational firms to devise improved value-adding strategies.In the case of the Philippines, of total equity investment in the BPO industry(US$2 billion), about 93 percent (US$1.8 billion) represented foreign equity par-ticipation. In 2008, the United States took up half the total foreign investment inthe industry, while Japan made up 20.0 percent, the European Union 18.6 percent,and India 7.3 percent. A similar dynamic was unleashed in Chile—with one dif-ference: whereas domestic firms dominate in exporting maritime and air trans-portation services, the bulk of ICT service exports is from multinational firms,even though they are relatively small in number. In contrast, countries such asMalaysia, which built their manufacturing export success on the back of foreigninvestment, remained much more tentative about openness to foreign investmentin services. Moreover, inward FDI is known to have promoted service exportsfrom Costa Rica after Intel’s initial investment.6
In 1993, liberalization in the Philippine telecommunication sector increasedcompetition in the industry and hence improved the quality and efficiency oftelecommunication infrastructure (World Bank 2010). Allowing competition inlocal long-distance services in 1995 and permitting international simple resale ledto a greater reduction in accounting rates and retail prices in the Philippines thanin other countries that liberalized their telecommunication sector (Fink, Mattoo,and Rathindran 2001). Lower communication costs shifted the comparativeadvantage of the Philippines toward the more communication-intensive BPOindustry. According to the A.T. Kearney (2011) Global Services Location Index,the Philippines ranks among top destinations in terms of financial attractivenessand infrastructure costs.
A factor that explains Malaysia’s success in exporting services is liberalization,especially in the higher education and Islamic finance sectors. In the case of highereducation, medical, and airline services, Malaysia first liberalized domesticallybecause the public sector could not meet growing demand. For instance, whenpublic universities could not enroll all students interested in getting a universitydegree, the government allowed the private sector, including foreign providers, tobridge this gap. This step then became a catalyst for the development of privatehigher education. The medical and airline services underwent the same process inwhich the private sector initially enhanced domestic capacity, which subsequentlypaved the way for export.7
Cross-border service exports may also be linked to outward FDI. In Brazil andChile, companies that in the beginning supported foreign investments of domesticfirms eventually became service exporters in their own right, confirming theimportance of “jointness” and complementarities in the provision of services(Francois and Hoekman 2010). Brazil’s experiences exemplify how mode 3 service

Exporting Services 13
exports (commercial presence abroad) can pave the way for mode 1 (cross-border)service exports. From 1990 to 2007, Brazil’s service exports grew at an average rateof 14 percent, compared with the world average of 9 percent. The recent phase ofinternationalization of services, led by new and small ICT firms, was encouragedby the demand created by a first wave of internationalization of Brazilian compa-nies. Newly internationalized firms needed software capable of setting up andintegrating systems, processing and storing data, devising programs, creating net-work services, and the like. Naturally, Brazilian companies looked to Brazilian ICTcompanies as a first choice for those services. Thus, from a policy perspective,outward FDI may be a channel for encouraging service exports.
Chile has also been a successful exporter of services through investment abroadin retail and other services, such as financial services, particularly in the LatinAmerican region. The only evidence of service exports that grew because of theirlink to Chilean outward investment in the Latin American region is found in com-panies that initially provided services to retail companies. Among the serviceproviders that supported domestic retail are a wide range of professional, logistics,human resource, marketing, and ITC-related service providers.
Tapping service demand from migrants may be one way to launch serviceexports. In the cases of Brazil and Egypt (chapters 8 and 6, respectively, in thisbook),8 service providers have established a commercial presence abroad to betterserve migrants. For example, exports of Brazilian and Egyptian soap operas wereinitially pitched at their respective diasporas before commanding wider interna-tional popularity. Financial service providers in the two countries also first cateredto the needs of expatriate populations and firms operating abroad, such as con-struction enterprises. But two related developments have helped. First, the open-ing up of financial service markets in Latin America and, to a lesser extent, in theMiddle East facilitated the establishment of financial institutions, and second,domestic regulations allowed overseas investment by financial institutions.
In the Philippines, remittances encouraged commercial banks to develop inno-vative banking products. With stagnant loan growth, remittances are an importantline of business in the Philippines and thus contribute to stronger competitionamong the banks by reaching out to Filipinos abroad. In the United States, 8 of the10 largest Philippine banks cater to U.S.-based overseas Filipino workers throughtheir own remittance centers or branches or through partnerships with otherinstitutions. A related lesson in this context is found in the case of Malaysia, whereservice exports in the health and education sector have been facilitated by easy visaand immigration policies.
Preferential (and multilateral) trade agreements in services have induced lim-ited incremental liberalization and therefore could have helped boost serviceexports only insofar as they created greater security of market access. For example,

14 Exporting Services
services have lagged goods in the Mercosur (Southern Cone Common Market, or Mercado Común del Sur) integration process, although they may play a significantrole in the future.9 The main destination markets for Brazil’s service exports arethe United States and Europe, where General Agreement on Trade in Servicesrules apply. In Chile, both investments abroad and service exports are intensivelylinked to the Latin American region—where service liberalization took placemainly on a unilateral basis—and only recently have rules on services been incor-porated in subregional and bilateral trade agreements. In the Middle East andNorth Africa, where service exports from Egypt have developed, rules on trade inservices are limited.
Proactive policies in services
Several countries have put in place targeted policies to support exports, especiallyfor IT-related services, but establishing a causal link between support and per-formance is difficult. Usually, these policies aim to create an enabling businessenvironment in which the private sector, national or foreign, has access to betterinfrastructure, benefits from incentives, and enjoys a more streamlined regulatoryenvironment (Engman 2010). This situation is exemplified by this book’s casestudies on Egypt, India, and the Philippines and, to a lesser extent, Brazil andChile.10 The advantage of this approach is that governments focus on promoting asector that enjoys an open environment where resistance to reform is less intenseand where the government can easily win support from a business communityeager to develop ICT-related service activities. From a political economy point ofview, the government can avoid tackling far-reaching and politically difficultreforms that could take several years. Also, this approach may have the advantage ofdeveloping a sector that could become an example for motivating more significantreforms. These examples prove the benefits of a more open and transparent invest-ment regime: investors respond positively to a transparent and more predictableregulatory environment. A major problem with this approach, however, is that itlimits the benefits of improved quality and quantity of services to a specific sectionof the business community, rather than aiding the entire economy. This approachmay also delay important reforms that could benefit a country’s population.
By allowing duty-free imports of computer hardware, Indian STPs aimedto promote software development. Firms in STPs were allowed tax exemptions, guaranteed access to high-speed satellite links, and provided reliable electricpower. Benefits included core computer facilities, ready-to-use office space, andcommunication facilities. Firms in STPs were allowed to import equipment dutyfree and without licenses. Full foreign ownership was permitted in exchange foran export obligation. Firms were allowed to freely repatriate capital investment,

Exporting Services 15
royalties, and dividends once they paid the taxes due. STPs played a major role indevelopment of India’s IT sector in the 1990s. The share in India’s softwareexports of units located in STPs rose dramatically, from 8 percent in 1992–93 to81 percent 10 years later. By 1995, about 400 companies were situated in STPs. By2008–09, 8,455 units were registered as operating units in STPs, of which 7,214were registered as exporting units, and India’s software service exports wereUS$47.1 billion.
The case of Egypt (chapter 6 in this book) evidences that targeted policies in anoncontroversial sector such as IT are playing a crucial role in service exports.Even though Egypt is not a top-ranked developing country in terms of quality oflabor force education, it has still been able to succeed in exports of IT services andIT-enabled services (ITeSs), especially in the Arab region. In Egypt’s ICT sector,the government established ITIDA in 2004 with a mission to develop the ICT sec-tor and boost its exports. ITIDA, a public-private partnership between the Min-istry of Communications and Information Technology and the private sector, isdedicated to developing IT in Egypt. The government also created STPs for pro-moting ICT service exports. The idea behind establishing the “smart village,”which was inaugurated in 2004, was to create a space where IT companies couldoperate within a community conducive to their business needs.
As a response to a more moderate performance in ICT service exports, Chilehas, since the mid-2000s, adopted a targeted set of policies administered by theCorporación de Fomento de la Producción de Chile (Production DevelopmentCorporation), Chile’s development agency, for attracting foreign investment topromote offshoring service exports.
In 2004, the Brazilian government selected software and related services as apriority sector for its industrial, technological, and trade policy. A special taxregime for the IT service export platform was implemented, as well as other taxincentives aimed at expanding Brazil’s exports of IT services. In addition, the Lawof Technological Innovation, approved in 2005, encourages interaction betweencompanies, research centers, and universities to stimulate development of newideas and innovative products.
Except in IT and tourism, export promotion policies in the service sector simi-lar to those in the goods sector are more recent. Countries such as Brazil and Chilepursued more traditional export promotion policies in sectors other than ICTthrough their respective export promotion agencies. In Brazil, the government hascombined policies that provide financial support through the Brazilian Develop-ment Bank (Banco Nacional de Desenvolvimento Econômico e Social, or BNDES)with promotion programs through the Brazilian Trade and Investment Promo-tion Agency (Agência Brasileira de Promoção de Exportações e Investimentos, orApexBrasil). BNDES financial support has targeted mainly construction and

16 Exporting Services
construction-related exports. More recently, BNDES has had a special focus onsupporting exports of services that have high intellectual content—software andcomputer services and engineering services in infrastructure projects. In the caseof ApexBrasil, the promotion programs have a stronger emphasis on the so-calledcreative industries, including music, audiovisual, entertainment, and fashion. TheICT and health service sectors are also included in current ApexBrasil programs.
Similarly, in Chile, although efforts to promote service activities were initiatedseveral years ago, the Export Promotion Agency (Dirección de Promoción deExportaciones, or ProChile) started a promotion fund for service exports only in2006. The fund covers a wide range of sectors and uses promotion strategies simi-lar to those in the goods sector. The range of instruments available in ProChile cov-ers two traditional areas: international trade fairs and strategic export sectoralplans. The latter include actions such as providing market intelligence, cofinancingbusiness trips, and organizing business agendas with the assistance of ProChile.
Some of the sectors where targeted policies were implemented have been ableto enhance their service exports, but how much credit goes to the targeted policiesis not clear. Little doubt exists that service exports of India and the Philippineswere driven primarily by the pool of skilled IT professionals and the availability ofmanagement and entrepreneurial skills. However, the establishment of STPs thathelped in creating a favorable business environment to overcome the inadequaciesin infrastructure and institutions may have further facilitated service exports.
A number of examples exist of targeted policies that did not work. In thePhilippines, targeted policies in the tourism industry failed to attract tourists.Because tourism is not confined to one region but depends on the overall healthof the economy, such targeted policies failed to make up for the poor quality oftransport, travel, and infrastructure facilities and the country’s generally poorsecurity environment. This experience suggests that although incentives can play arole in business decisions, the factors that influence private sector consumptionand investment decisions are much wider and deeper and cannot be ignored bygovernments. For instance, most Kenyan service exporters feel that direct incen-tives, such as tax incentives for exporters, are unnecessary. Rather, they consider itcrucial for the government to facilitate their access to foreign markets. In Chile,after several years of promotion efforts aimed at encouraging small and medium-size service exporters in several industries, the sectors chosen by ProChile are notreally associated with significant service exports. In this case, the insufficientresources allocated to the program (US$1 million in total) probably explain a sig-nificant part of this result.
At the same time, targeted policies pose risks and must be carefully designed(OECD 2011). One obvious risk is the waste of public resources by directing themto a sector or firm that would have developed even without government support

Exporting Services 17
or to sectors or firms that do not have any development prospects. Another risk iscapture by incumbent sectors. For example, some Indian service exporters havelobbied fiercely for the continuation of fiscal and other incentives even thoughwhether these incentives are still needed to support the sector is unclear. Finallyand crucially, targeted assistance (for example, in the form of dedicated commu-nication channels or streamlined approval procedures) can dilute political support for economywide reform (for example, in the nationwide telecommuni-cation and business environment or by the buying off of important pro-reformconstituencies). Therefore, governments must use care in designing such policies.In particular, they need to (a) identify clearly the market failure they want toaddress and establish that other instruments are not available to more directlyaddress the failure; (b) subject such policies to rigorous cost-benefit analysisbefore implementation and rigorous impact evaluation afterward; (c) includecredible sunset clauses to provide a clear horizon for, and a deterrent to capture by,investors; and (d) limit the use of such policies to areas where economywidereforms are clearly infeasible.
Cooperation by firms through an industry association can in some cases favor-ably influence policy at home and a country’s image abroad. Industry associationsin India and the Philippines have had such an influence, but in Brazil, Chile,Egypt, and Kenya, their effects have been fewer. The industry association forIndia’s software services, NASSCOM, has given Indian IT and ITeS companies aunified voice and has played an instrumental role in the industry’s policy-makingprocess. It worked in tandem with the Indian government to promote the sector’sinterests (Kapur 2002). At the same time, NASSCOM played an active and influ-ential role in building and strengthening the brand image of India as a premierglobal sourcing destination through various programs such as NIESA (NASS-COM’s India-Europe Software Alliance) and NINJSA (NASSCOM’s India-JapanSoftware Alliance). NASSCOM has also signed several trade contracts with coun-tries such as Ireland, Israel, Mexico, Morocco, and Singapore to expand the geo-graphic reach of Indian software companies beyond Japan, Western Europe, andNorth America. To ensure a steady supply of quality IT and ITeS professionals inIndia, NASSCOM started an assessment and certification framework called theNASSCOM Assessment of Competence.
Similarly, in the case of the Philippines, the Business Processing Association ofthe Philippines (BPAP), the umbrella BPO organization, plays a leading role insupporting and promoting the BPO industry. The association, together withstakeholders, has developed and acted on a blueprint designed to help bolster thecompetitiveness of the Philippines. The blueprint focuses on goals and specificaction items to obtain success. In 2009, as part of the action items, BPAP producedthe Next Wave Cities scorecard, which provides tools to help both investors and

18 Exporting Services
local governments assess readiness and develop working capacities. Going forward,BPAP is creating another blueprint, Roadmap 2016, to guide the ever-evolvingindustry (BPAP 2007). In terms of talent management, BPAP launched programson industry-specific training and career awareness. BPAP has advocated for theBPO sector, for example, to obtain passage of a house bill known as the Data Pro-tection Act and to create the Department of Information and CommunicationTechnology, which would provide stability and funds to market the BPO sector.
In the case of Kenya (chapter 7 in this book), the slow development of businessservice exports is attributed to poor brand quality, which a more active industryassociation might have developed. The Kenyan government, in contrast to itsIndian and South African counterparts, for example, does not sponsor interna-tional conventions or events to showcase the BPO services available in Kenya.
Conclusion
Several developing countries have succeeded in diversifying their exports throughservices. Given the rising importance of service exports from developing coun-tries, this book attempts to disentangle the determinants of this trend. Chapter 2of this book starts with a survey of the available literature on determinants oftrade in services and builds a nested model to illustrate the factors affecting serv-ice exports from developing countries. By analyzing the experiences of Brazil,Chile, Egypt, India, Kenya, Malaysia, and the Philippines, the book seeks toimprove the understanding of what lies behind the growth of service exportsfrom developing countries.
The book highlights several policy lessons. First, human capital is critical forcertain service exports, which is confirmed in the empirical model of chapter 2 aswell as the case studies. In the case studies, the book identifies human capital asthe main driver of service exports from India and the Philippines, whereas thelack of human capital explains the more moderate performance of serviceexports in Chile, Egypt, and Malaysia. Second, the state of the economywide elec-tronic infrastructure does not by itself explain the success of developing coun-tries in exporting services. These results are confirmed in the case studies of Indiaand Malaysia. Third, service exports in a developing country are driven by thequality of service-specific infrastructure, endowments, and institutions ratherthan those required for the manufacturing sector. Fourth, cross-border serviceexports may be encouraged by outward FDI, as has been true in the case of Brazil,where outward FDI led to ICT service exports. Fifth, inward FDI also seems topush service exports, as has been the case in India, the Philippines, and Chile, inoffshoring services. Sixth, migrants have played an important role in serviceexports, and thus targeting service exports to migrants can be a starting point.

Exporting Services 19
Seventh, preferential trade agreements in services have not yet played a key role inpromoting service exports. Eighth, sectors where targeted policies created a con-ducive business environment saw their service exports expand, but establishing acausal link is hard. This situation is exemplified by the case studies on Egypt,India, and the Philippines. Most often, only politically noncontroversial sectorshave been targeted for such policies. Finally, industry associations have been criti-cal in reaching the international market for services, more so in the case of Indiaand the Philippines than for Brazil, Chile, Egypt, and Kenya.
Caution and more research are needed to translate the lessons learned aboutservice exports in this book into policy prescriptions. Although human capitalmatters, any investment in human capital should not be supply driven but rathershould be guided by private sector requirements. Policies targeted to certain sec-tors, such as providing those sectors privileged access to infrastructure, may helppromote the exports of such sectors but may delay reforms in the economy as awhole. Reforming public institutions and the business environment is desirable ingeneral and usually safer than picking winners. It is too early, however, to pro-nounce definitive judgment on how long the experience of some developingcountries in exporting services can be sustained and how much it can be repli-cated in other countries.

Annex 1.A: Service Trade Barriers
Barriers to trade in services differ from barriers to trade in goods. Table 1.A.1 provides examples of the types of barriers exportersface for the four modes of supply.
• Local registration required formarketing or supply of services
• Appointment of local agentand local professional addressrequired
• Authorization, license, orpermit required to market andsupply services
• Use of monopoly or otherwisespecified network access orconnection provider required
• Access or connection toInternet or other forms ofelectronic network limited byspecific government regulation
• Cross-border transfer ofcapital, payments, and use ofcredit cards for suchtransactions subject toauthorization
• Local registration of offshoreprovider required for marketingof services, applied on atransparent, readily accessible,and nondiscriminatory basis
• Provision of services permittedonly through a designatedlocal partner, to maintainsupply advantage forpermitted local providers
• Use by consumer of monopolyor otherwise specified networkaccess or connection providerrequired
• Consumer access orconnection to Internet orother electronic networksavailable only throughmonopoly or exclusivelyauthorized provider
• Majority foreign ownership notpermitted; only minority sharein compulsory joint venturepermitted
• Acquisition of full or part shareof existing business notpermitted; restrictions onestablishment of newbusinesses
• Reservation of some sectors oractivities for state-ownedenterprises or for investmentonly by nationals or permanentresidents
Legal form of foreign company• Only joint venture as limited
liability company permitted• Only one legal form permitted
(for example, joint stock
• Bound only for definition ofpersonnel permitted, withgenerally applicable time limitsor conditions not specified,such that these may bearbitrarily or discriminatorilyapplied
• Permission subject to approvaland labor market tests forspecific categories ofpersonnel
• Approval for intracorporatetransferees and specialistssubject to general economicneeds test
• Requirement for localrecognition of experience orqualifications for professionalsand specialists, for which thecriteria are vague, arbitrarily or
Table 1.A.1. Illustrative Barriers to Trade in Services
Mode 1: Cross-border trade Mode 2: Consumption abroad Mode 3: Commercial presenceMode 4: Movement of naturalpersons
20
(Table continues on the following page.)

• Full commercial presencerequired; commercial presencerequired but granted only tospecified brand-name entities;or local partnership requiredto maintain supply advantagefor permitted local providers
• Cross-border transfer ofcapital, payments, and use ofcredit cards for suchtransactions not permitted
• Transfer of capital, payments,and use of credit cards for suchtransactions subject toauthorization
• Consumption of servicespermitted only through firmswith commercial presence inthe country or specified brand-name entities
• Transfer of capital, payments,and use of credit cards forsuch transactions notpermitted
company, private limitedliability corporation, jointventure)
Licensing or authorization • Economic needs test to
determine degree ofrestrictiveness
Nationality or residencyrequirements• Providers established in one
part of a country required tohave a minimum number ofresident providers or theiragents for provision in anotherpart of a country
• All directors required to beresidents of the host country
• Prior residency required toobtain operating license, andresidency not permittedwithout license
not transparently applied, ordiscriminatory
• Numerical limitation onforeign nationals in seniorpositions (for example,company managers,executives, seniorprofessionals, and specialists)or requirement of a specifiednumber of host-countrynationals relative to foreignnationals in each suchcategory
• Only intracorporate transfereespermitted, subject to a limit of2 foreign transferees peroperation; training of localstaff required
• Provision of services by self-employed persons notpermitted
Table 1.A.1. Illustrative Barriers to Trade in Services (continued)
Mode 1: Cross-border trade Mode 2: Consumption abroad Mode 3: Commercial presenceMode 4: Movement of naturalpersons
Source: Adapted from Thompson and Nielson 2001.
21

Table 1.A.2. Inadequacies in Statistical Coverage on Trade in Services
Mode of supply Relevant data source Inadequacies
Cross-border trade
International Monetary Fund(IMF) balance of paymentservice statistics (categoriesother than travel)
IMF balance of payment statistics donot distinguish between cross-bordersupply, commercial presence (firms),and presence of natural persons(individuals) for less than 1 year.
Consumptionabroad
IMF balance of paymentstatistics (mainly the travelcategory)
Travel also contains goods and is notsubdivided into the different categoriesof services consumed by travelers.Some transactions related to this modeof supply also appear in other IMFbalance of payment categories.
Commercialpresence
FDI and foreign affiliate trade statistics
FDI statistics do not provide data onoutput (or sales); FDI definition doesnot match the definition of commercialpresence.Until recently, foreign affiliate tradestatistics existed only for the UnitedStates. Now other countries of the Organisation for Economic Co-operation and Development havestarted collecting such statistics usingbasic concepts and definitionscontained in UN and others (2002).
Presence ofnatural persons(independent)
IMF balance of paymentstatistics (mostly categoriesother than transport andtravel)
IMF balance of payment statistics donot distinguish between cross-bordersupply, presence of natural persons(individuals), and commercial presencefor less than 1 year.Natural persons who are residents arenot covered.
Presence ofnatural persons(employees)
Employment data from foreign affiliate trade statistics
Statistics are not yet available.
Source: Mattoo 2005.
22 Exporting Services
Notes
1. In general, infrastructure in the text refers to electronic infrastructure, unless otherwise speci-fied.
2. The importance of infrastructure, broadly defined, in development is widely acknowledged. Forinstance, World Bank research concluded that in most African countries, particularly the lower-income countries, infrastructure emerges as a major constraint on doing business. Infrastructure con-tributed significantly to per capita economic growth from 1990 to 2005 in Africa, but that contributionis almost entirely attributable to advances in the penetration of telecommunication services. In con-trast, the deterioration in the quantity and quality of power infrastructure over the same periodretarded growth. Moreover, infrastructure requirements in Africa are lagging, compared with otherdeveloping regions, and services are expensive. Finally, regulatory and administrative bottlenecksprevent adequate delivery of services (Foster and Briceño-Garmendia 2010).

Exporting Services 23
3. For instance, Amin and Mattoo (2008) highlight the importance of human capital. Amin andMattoo (2006) emphasize the importance of the quality of institutions, whereas Freund and Weinhold(2002) make a case for the quality of telecommunication infrastructure.
4. Grünfeld and Moxnes (2003) also measure institutions through the corruption perceptionindex and find that corruption negatively affects service trade.
5. NASSCOM is the premier trade body and the chamber of commerce of the IT BPO industriesin India.
6. In this case, however, Intel invested in Costa Rica in the goods sector (computers) rather than inservices.
7. Similarly, in Tunisia, an open engineering service sector with better-quality and more engineer-ing graduates assisted in service exports. Along with the quality of human resources, engineering serv-ice exports has benefited from liberalization; the restrictiveness index for Tunisia is even lower than itis for several developed countries, such as Italy and Germany.
8. In the case of Egypt, education services have been exported by temporary migration as well;nevertheless, the extent of such service exports is declining over time (Engman 2009).
9. Mercosur is an economic and political agreement between Argentina, Brazil, Paraguay, andUruguay. Although a services agreement has been in force since 2005, and commitments have beennegotiated through periodic rounds of negotiations, the current commitments are more than 10 yearsold. New and improved commitments have yet to be implemented, but this situation could change inthe future if the liberalization process among Mercosur members is strengthened.
10. Although Costa Rica and South Africa are not studied in this report, this situation applies tothem as well.
References
Amin, Mohammad, and Aaditya Mattoo. 2006. “Do Institutions Matter More for Services?” PolicyResearch Working Paper 4032, World Bank, Washington, DC.
———. 2008. “Human Capital and the Changing Structure of the Indian Economy.” Policy ResearchWorking Paper 4576, World Bank, Washington, DC.
Arunanondchai, Jutamas, and Carsten Fink. 2007. “Trade in Health Services in the ASEAN Region.”Policy Research Working Paper 4147, World Bank, Washington, DC.
Athreye, Suma S. 2003. “Multinational Firms and the Evolution of the Indian Software Industry.” East-West Center Economics Working Paper 51, East-West Center, Honolulu. http://www.eastwestcenter.org/fileadmin/stored/pdfs/ECONwp051.pdf.
A.T. Kearney. 2009. “The Shifting Geography of Offshoring: The 2009 A.T. Kearney Global ServicesLocation Index.” A.T. Kearney, Chicago. http://www.atkearney.com/images/global/pdf/Global_Services_Location_Index_2009.pdf.
———. 2011. “Offshoring Opportunities amid Economic Turbulence: The A.T. Kearney Global Serv-ices Location Index, 2011.” A.T. Kearney, Chicago. http://www.atkearney.com/images/global/pdf/Offshoring_Opportunities_Amid_Economic_Turbulence-GSLI_2011.pdf.
BPAP (Business Processing Association of the Philippines). 2007. Offshoring and OutsourcingPhilippines: Roadmap 2010. Makati City, Philippines: BPAP.
Cattaneo, Olivier, Linda Schmid, and Michael Engman. 2010. “Engineering Services: How to Competein the Most Global of the Professions.” In International Trade in Services: New Trends and Opportu-nities for Developing Countries, ed. Olivier Cattaneo, Michael Engman, Sebastián Sáez, and RobertM. Stern, 293–319. Washington, DC: World Bank.
Copeland, Brian, and Aaditya Mattoo. 2008. “The Basic Economics of Services Trade.” In A Handbookof International Trade in Services, ed. Aaditya Mattoo, Robert M. Stern, and Gianni Zanini, 84–129.Washington, DC: World Bank; New York: Oxford University Press.
Engman, Michael. 2009. “Half a Century of Exporting Educational Services: Assessing Egypt’s Role inEducating the Arab World.” Working Paper 2009-10-04, Groupe d’Economie Mondiale at SciencesPo, Paris. http://gem.sciences-po.fr/content/publications/pdf/Engman_educational_services_Egypt102009.pdf.

24 Exporting Services
———. 2010. “Exporting Information Technology Services: In the Footsteps of India.” 2010. InInternational Trade in Services: New Trends and Opportunities for Developing Countries, ed.Olivier Cattaneo, Michael Engman, Sebastián Sáez, and Robert M. Stern, 219–62. Washington,DC: World Bank.
Feenstra, Robert C. 2010. Offshoring in the Global Economy: Microeconomic Structure and Macroeco-nomic Implications. Cambridge, MA: MIT Press.
Fink, Carsten, Aaditya Mattoo, and Randeep Rathindran. 2001. “Liberalizing Basic Telecommunica-tions: The Asian Experience.” Policy Research Working Paper 2718, World Bank, Washington, DC.
Foster, Vivien, and Cecilia Briceño-Garmendia, eds. 2010. Africa’s Infrastructure: A Time for Transfor-mation. Washington, DC: World Bank and Agence Française de Développement.
Francois, Joseph, and Bernard Hoekman. 2010. “Services Trade and Policy.” Journal of Economic Liter-ature 48 (3): 642–92.
Freund, Caroline, and Diana Weinhold. 2002. “The Internet and International Trade in Services.”American Economic Review 92 (2): 236–40.
Ghani, Ejaz, ed. 2010. The Service Revolution in South Asia. New York: Oxford University Press.Grünfeld, Leo A., and Andreas Moxnes. 2003. “The Intangible Globalization: Explaining the Patterns
of International Trade in Services.” Discussion Paper 657, Norwegian Institute of InternationalAffairs, Oslo.
Hoekman, Bernard, and Aaditya Mattoo. 2008. “Services Trade and Growth.” In Opening Markets forTrade in Services: Countries and Sectors in Bilateral and WTO Negotiations, ed. Juan A. Marchettiand Martin Roy, 21–58. Cambridge, U.K.: Cambridge University Press.
IMF (International Monetary Fund). 2009. Balance of Payments and International Investment PositionManual. 6th ed. Washington, DC: IMF. http://www.imf.org/external/pubs/ft/bop/2007/bopman6.htm
Jones, Ronald W. 2000. Globalization and the Theory of Input Trade. Cambridge, MA: MIT Press.Kapur, Devesh. 2002. “The Causes and Consequences of India’s IT Boom.” India Review 1 (2): 91–110.Kimura, Fukunari, and Hyun-Hoon Lee. 2006. “The Gravity Equation in International Trade in Serv-
ices.” Review of World Economics 142 (1): 92–121.Lennon, Carolina. 2006. “Trade in Services and Trade in Goods: Differences and Complementarities.”
Paper presented at the Eighth Annual Conference of the European Trade Study Group, Vienna,Austria, September 7–9.
Lennon, Carolina, Daniel Mirza, and Giuseppe Nicoletti. 2009. “Complementarity of Inputs acrossCountries in Services Trade.” Annals of Economics and Statistics 93–94: 183–206.
Mattoo, Aaditya. 2005. “Economics and Law of Trade in Services.” World Bank, Washington, DC. Maurer, Andreas, Yann Marcus, Joscelyn Magdeleine, and Barbara d’Andrea. 2008. “Measuring Trade
in Services.” In Handbook of International Trade in Services, ed. Aaditya Mattoo, Robert M. Stern,and Gianni Zanini, 169–220. Washington, DC: World Bank; New York: Oxford University Press.
OECD (Organisation for Economic Co-operation and Development). 2011. Maintaining Momentum:OECD Perspectives on Policy Challenges in Chile. Paris: OECD.
Shingal, Anirudh. 2010. “How Much Do Agreements Matter for Services Trade?” Paper prepared forthe World Trade Organization Public Forum, Geneva, September 17.
Thompson, Rachel, and Julia Nielson. 2001. “Consolidated List of Cross-Sectoral and Sector-SpecificBarriers.” In Trade in Services: Negotiating Issues and Approaches, 11–26. Paris: Organisation forEconomic Co-operation and Development.
UN (United Nations), European Commission, International Monetary Fund, Organisation for Eco-nomic Co-operation and Development, United Nations Conference on Trade and Development, andWorld Trade Organization. 2002. Manual on Statistics of Iternational Trade in Services. New York:UN; Washington, DC: IMF. http://unstats.un.org/unsd/publication/Seriesm/Seriesm_ 86e.pdf.
World Bank. 2010. Philippines Development Report 2009: Managing the Global Recession, Preparing forthe Recovery. Report 51557-PH. Manila: Poverty Reduction and Economic Management Unit, EastAsia and Pacific Region, World Bank.
WTO (World Trade Organization). 2010. International Trade Statistics 2010. Geneva: WTO.

25
2
Service Exports:Are the Drivers
Different forDeveloping Countries?
Arti Grover Goswami, Poonam Gupta, Aaditya Mattoo, and Sebastián Sáez
This chapter has benefited from discussions with Olivier Cadot, Ileana Cristina Constantinescu, JoãoSantos Silva, Anirudh Shingal, and Silvana Tenreyro.
The developing world has seen strong growth in service exports. The lower-mid-dle-income countries have seen service exports grow at an average of 24 percentsince 2001, compared with the world average growth rate of 15 percent during thesame period. Their share in world exports of services has increased from 5 percentin 1982 to 11 percent in 2008, although these figures are highly influenced bygrowth in China and India, whose shares have increased from below 1.0 percenteach to 3.7 and 2.6 percent, respectively. In fact, service exports are a growing pro-portion of both service value added and aggregate gross domestic product (GDP)in both lower-middle-income and low-income countries (figure 2.1). This chapteraddresses two questions that may help explain how far these trends can be sus-tained and replicated: What factors have contributed to the success of certaincountries in this area? And what policy lessons can other countries draw?
India’s success is well known: exports of software and business process servicescontributed about 33 percent of India’s exports in 2007–08. Less well known isthat a large number of other developing countries are also successfully exportingservices, both within their own regions and to high-income countries. Brazil,Costa Rica, and Uruguay export professional and information technology–related

services; Chile exports distribution and transportation services; and Mexicoexports communication and distribution services. African countries are also par-ticipating. Kenya, Morocco, South Africa, and Tunisia provide professional serv-ices to Europe, and the Arab Republic of Egypt has developed a world-class callcenter sector. Exports of health services (known as health tourism) are successfullyprovided by a diverse group of countries in Asia (India and Thailand), as well asby countries in Latin America and the Caribbean, the Middle East, and NorthAfrica. Capital-intensive and managerially complex services are also part of thestory. Providers of construction services from developing countries are among thetop 225 international contractors. Firms in developing countries engage in tradeacross a variety of sophisticated environmental service segments as well as infinancial and telecommunication services (Cattaneo and others 2010).
The United Nations Conference on Trade and Development notes a numberof interesting features of service exports from developing countries (UNCTAD2005). First, such exports are not concentrated in a few areas but already span awide variety of services. Second, developing countries have diversified theirservice export markets: the average developing country is reported to have 33export markets. Third, south-south service trade is important, with developingcountries accounting for two-thirds of the service export markets of other
26 Exporting Services
Figure 2.1. Service Exports: A Comparison across Income Groups, 2000–08
4
5
6
7
serv
ice
exp
orts
(as
a %
of G
DP)
2000
2002
2004
2006
2008
high income low income lower-middle income
middle income world
Source: World Bank’s World Development Indicators database.

Service Exports 27
developing countries. Fourth, the most widely used modes of supplying servicesfrom a developing country are mode 2 (consumption abroad, when foreignersvisit the producing market) and mode 4 (movement of natural persons, whenproviders visit other markets), although recent studies suggest that the impor-tance of mode 1 (cross-border) exports from developing countries is alsoincreasing (see, for example, Deardorff and Stern 2008; Karsenty 2000).
What Determines the Participation of a Developing Country in Service Trade?
This chapter synthesizes the available literature on the determinants of servicetrade and presents some evidence illustrating the relative importance of factorssuch as a country’s endowment of human capital or educated people, its elec-tronic infrastructure, its institutions, and other geographic and cultural factors.
To provide some empirical evidence, this chapter uses the gravity model toexamine the determinants of service exports from developing countries (Francoisand Hoekman 2010; Marshall and others 19871). The model has been used previ-ously to estimate the effect of preferential trade agreements, the determinants oftrade in services compared with those of trade in goods, the time trend in distanceeffect, and the effect of Internet penetration in partner countries on U.S. serviceimports.2
The results presented here broadly corroborate the findings of several previousstudies.3 For the entire cross-section of industrial and developing countries, avail-ability of electronic infrastructure and tertiary education enrollment significantlyaffect service exports. For example, ordinary least squared (OLS) estimates suggestthat one standard deviation (SD) increase in Internet penetration in the partnercountry increases bilateral service exports of the reporter by 15 percent. However,estimates over the smaller sample of nonrich countries reveal that electronicinfrastructure does not seem to have been critical in promoting service exportsfrom developing countries, whereas the effect of schooling has been significantand larger. The ability of large service-exporting firms in developing countries tocreate their own electronic infrastructure or to have access to dedicated infra-structure may reduce the relevance of economywide access indicators. For theentire sample, one SD increase in tertiary schooling enrollment in the reportercountry increases bilateral service exports by 22 percent, but for the developingcountry–only sample, the increase is 37 percent.
Among other factors considered in the gravity models, bilateral goods exportsare found to positively affect service exports: a 10 percent increase in bilateralgoods exports increases service exports for developing countries by 5.6 percent,which is slightly larger than estimates for the full sample. For both the restricted

and the full sample, the effect of distance, language, and colonial history is found tobe significant and of the expected sign; that is, distance negatively affects serviceexports whereas the latter two factors have a positive and statistically significanteffect. The negative effect of distance suggests that despite the growth of electroni-cally delivered services, proximity between suppliers and consumers still matters.
The chapter is organized as follows. The next section surveys the literature onthe possible drivers of service exports. It surveys the main empirical results on thedeterminants of bilateral service trade. Using the United Nations Statistical Divi-sion (UNSTATS) bilateral service trade database, the section that follows presentsan illustrative gravity model that nests together the main drivers of serviceexports. This section brings out the determinants of bilateral service trade. Thesubsequent section then asks whether determinants are different for developingcountries. The final section concludes with policy lessons.
The Determinants of Aggregate Service Exports: Literature Survey
What are the necessary conditions for being a successful service exporter? Why aresome countries so successful in exporting services while others are not? A largepart of the dynamism in service sectors in developing countries has been attrib-uted to factors such as the high income elasticity of demand for services, cost-reducing and variety-enhancing technological progress, and changes in themethod of organizing production favoring increased outsourcing.
Factors that are said to have played a significant role in promoting serviceexports are the access to a growing (though still restricted) external market forservices and the gradual (though partial) liberalization of domestic markets. Thecountries that have gained most from technological advances and changes in themethod of organizing production are those that were ready to embrace foreignfirms through liberalization. For instance, the impressive performance of theIndian software industry, which is so well documented, would not have been pos-sible if the country were not outward oriented.
Quantifying the effect of various factors on service trade is challenging for thebasic reason that data on service trade are insufficient and not free from meas-urement errors. To measure services, one has to consider different modes of sup-ply, their costs, and the relationship between the different modes. This sort ofcomplexity empowers governments to restrict service trade in many nontrans-parent ways. Moreover, a lack of consensus on basic definitions for various serv-ices further complicates measurement of service trade. Finally, unlike goodstrade, where tracking of goods flow is facilitated by tariff imposition at the bor-der, service trade that is transacted over the Internet is very difficult to track
28 Exporting Services

(Francois and Hoekman 2010). Thus, the limited data available on service tradeare inherently imprecise.
Subject to these data limitations, a large body of literature has estimated thedeterminants of service trade using either the standard gravity model or country-level studies. A typical gravity model attempts to explain trade flows between twocountries by referring to the size of their economies and the distance betweenthem.4 Until recently, a gravity model has been used to explain trade in goods onlybecause of lack of reliable data on bilateral trade in services. In 2002, the Organi-sation for Economic Co-operation and Development (OECD) put together tradedata on bilateral services. Since then, many studies have been done to understanddeterminants of bilateral service trade in a gravity framework.5
Studies on service subsectors indicate that an aggregate treatment of servicetrade determinants may be inappropriate. Different services have different roles toplay in the economy, have dissimilar market structures, are governed by differentsets of regulations, and rely on different modes of supply in competing in theinternational market. Thus, the determinants of service exports are likely to varyacross subsectors. For instance, transport service exports rely more on the state ofphysical infrastructure than on that of electronic infrastructure, which makes thedeterminants of transportation services closer to those of goods trade than servicetrade. However, given the lack of reliable data on service trade, perhaps one can-not reasonably expect service data to be of good quality across various subsectors.For this reason, studies attempting to disentangle the determinants of servicetrade across various subsectors are few. In this chapter, the determinants of aggre-gate service exports are reviewed in detail, and the few attempts to explore serviceexport determinants across various subsectors are briefly discussed.
Fundamentals
This section considers three main influences on service exports: education, insti-tutions, and infrastructure.6 Several variables potentially affect service exports, asthis chapter highlights; however, these variables are considered mainly becausethey form the backbone of any economy.
The role of educationA number of service sectors, ranging from business services to banking andtelecommunications, are significantly more skill intensive than most goods pro-duction (Gibbs 1986; Jensen 2008; Nusbaumer 1987). Endowments of humancapital can, therefore, be a critical determinant of output and export of services.The importance of skilled workers—engineers, in particular—to Indian softwareexports is widely recognized (Arora and Athreye 2002; Lakha 1994). Using data
Service Exports 29

from the World Bank’s World Development Indicators database, figure 2.2 pres-ents the clearly positive association between tertiary schooling enrollment andservice exports for 2007.
Recently, Arora and Bagde (2010) have evaluated the importance of humancapital in software service exports from India more rigorously, using primarydata.7 They empirically investigate how software exports by the 14 major states ofIndia are conditioned on local levels of human capital, as measured by state-levelengineering baccalaureate capacity, and argue that plenitude of engineers has cre-ated a comparative advantage for software service exports from India. Their esti-mate controls for potential endogeneity of human capital with software exportsby exploiting the variations in state policy allowing private engineering colleges todevelop an instrument for engineering college capacity. However, policy changescan also be introduced in response to the performance of software service exportsin these states. Thus, the issue of causality remains open.
Amin and Mattoo (2008) examine the relative effect of skilled labor availabilityon per capita GDP and value added in agriculture, manufacturing, and services in14 major states of India. Using panel data over the period 1980–2000 and control-ling for possible endogeneity of human capital with service exports, their use of
30 Exporting Services
Figure 2.2. Human Capital and Service Exports, 2007
4
6
8
10
12
14
serv
ice
exp
orts
(lo
gs)
0 20 40 60 80 100tertiary school enrollment (% of gross)
Source: World Bank’s World Development Indicators database

GMM (generalized method of moments) estimators suggests that greater avail-ability of skilled workers had a statistically significant and positive effect on percapita output of the aggregate service sector.
Chapter 9 of this book suggests that Chile’s difficulties in developing a strongcomparative advantage in services may be linked to its educational shortcomings andthe skill level of its labor force. Human capital also seems to be a major constrainthindering Egypt (chapter 6) from excelling as an industrial and service exporter. Inthe specific case of Brazil (chapter 8), studies have shown that a 1 percent increase inthe average time devoted to education by workers improves the propensity of firms toexport services by 0.68 percent, whereas the corresponding figure for the export ofgoods is only 0.02 percent (Moreira, Alves, and Kubota 2006).
In a bilateral setting, Mirza and Nicoletti (2004) use the O-ring theory8 todevelop a theoretical model for explaining trade in services, particularly empha-sizing that the quality of tasks in both the home country and the host country isimportant for successful service delivery.9 This model is quite unlike goods tradespecification, where only the exporting country’s characteristics are assumed toaffect exports.10 Using average number of years of education in the population asa measure of human capital, they find that skill levels in both the reporter and thepartner country are important determinants of service exports. This result impliesnot only that the population in the exporting country has to be well educated toexport services, but also that the population of the importing country must havethe skill to absorb or demand service exports.
Shingal (2010) also works on the effect of human capital in the exporter andthe importer countries on service trade. Using gross tertiary school enrollment asa proxy for human capital for 25 exporting and 53 importing countries from theOECD database over the period 1999–2003, his Hausman-Taylor estimation foraggregate service exports reveals that human capital in the exporter country iscritical for promoting service exports whereas that in the importer country doesnot matter.
Lennon (2006) uses a standard OLS methodology to quantify the complemen-tarity between bilateral trade in goods and services for OECD countries from 1999to 2002. Using alternative measures of human capital relating to years of school-ing, secondary school enrollment, and high school attainment, she finds that allthree variables in both the importer and the exporter countries significantly affectother commercial service exports.
The role of institutionsThat institutions play a critical role in economic development is now well estab-lished (Acemoglu, Johnson, and Robinson 2000). Certain institutions may, how-ever, play a more significant role in the development of service sectors for three
Service Exports 31

reasons: informational problems are more acute in many intermediation andknowledge-based services, natural monopoly or oligopoly is a feature of the“locational” services, and relationship-specific investments must be made byboth consumers and suppliers in customized services.
The first reason for the institutional link is to be found in the nature of services,which are for the most part intangible and invisible and hence cannot beinspected by consumers before they are bought and consumed. Imagine trying toidentify, before obtaining their services, all the relevant characteristics of serviceproviders such as doctors and banks. A consequence is a greater incidence of mar-ket failure caused by asymmetric information in service markets. Although themarket itself can provide solutions (for example, in the form of reputation build-ing), institutions concerned with regulation also matter. In particular, the exis-tence of credible regulators provides consumers with vital reassurance, throughcertification and licensing mechanisms, about the quality of the service.
Cattaneo and others (2010) identify as key factors in exporting services the qual-ity of service exports and the international standing of service providers. They arguethat the private sector, especially through institutions such as industry associations,can play a particularly important role in improving quality standards. Likewise, thegovernment and quasi-governmental entities responsible for service regulation canfacilitate improvements in the quality of service exports and endorse serviceexporters by introducing policy measures such as mutual recognition agreements ofprofessional qualifications and adoption of international standards.11
The second reason for the importance of institutions is the need to remedymarket failure attributable to the existence of natural monopoly or oligopoly inthe “locational services,” which require specialized distribution networks: roadsand rails for land transport, cables and satellites for communications, and pipesfor energy distribution. Independent regulators are needed to promote competi-tion in intermediate or final service markets. After some fits and starts, manycountries have instituted regulators for a range of services (from telecommunica-tions to air transport) to ensure that monopolistic suppliers do not exploit con-sumers or undermine market access by charging prohibitive rates for access to theessential facilities they control. Similar institutions may be needed in a variety ofother network services, including transport (terminals and infrastructure) andenergy services (distribution networks).
Third, unlike most goods, services tend to be customized, which means boththe supplier and the consumer need to make relation-specific investments. Con-sider the specific investments both parties must make for a back-office serviceprovider in India to become familiar with the needs of a large modern firm suchas General Electric. Once the investments are made, big switching costs inhibitmoving to another supplier (or consumer). In these circumstances, the fear of ex
32 Exporting Services

post default can reduce the incentive to make ex ante investments. Therefore,contract-enforcing institutions arguably assume greater importance for servicesthan they do for goods. Similarly, greater willingness exists to purchase an infor-mation-processing service outside the firm if the purchaser has confidence in therelevant laws and law enforcement of the host country. For example, a firm’s will-ingness to outsource the transcription of medical diagnosis or confidential finan-cial information is going to be much greater if it has confidence in the privacy anddata protection laws of the host country’s jurisdiction.
Finally, the quality of institutions matters in the design of proactive govern-ment policies to promote exports, although views differ on whether and wheregovernment intervention matters. Some argue that intervention has been criticalfor the development of information technology (IT) and IT-enabled service(ITeS) exports from several countries. For instance, the government in Canadaoffered special incentives to IT service–based companies that agreed to develop asignificant volume of contact center operations in the Atlantic provinces. Simi-larly, Ireland emerged as a world-class, high-quality service exporter and interna-tional financial services center partly as a result of proactive government policiesthat encouraged investment in these industries. In the Philippines, the Board ofInvestments has actively targeted the IT and ITeS sector so that it now captures avery large share in the global ITeS market. In the case of Costa Rica, a number ofspecial economic incentives and an aggressive policy of attracting foreign directinvestment (FDI) in information and communication technology (ICT)–relatedservices have transformed the country from an exporter of agricultural productsto an exporter of services. A recent study (Ghani 2010) suggests that governmentintervention to promote exports from South Asia has been most importantin dealing with higher education and telecommunication (Internet bandwidth)bottlenecks. Other privileges and targeted incentives, such as tax breaks, did notcritically matter for service exports.
Several studies have researched the effect of institutions on service exports in abilateral context. Lennon (2006) uses the index on corruption, complexity ofexport procedures, and rigidity in employment law of the partner and reportercountries as measures of institutions in the gravity model. These institutionalvariables are introduced one by one into the basic gravity model specificationcomprising GDP and GDP per capita in partner and reporter countries, languagesimilarity, contiguity, and distance. She finds that the quality of institutions inboth the reporter and the partner countries, measured by any of those variables,has a positive effect on other commercial service exports.
Using OECD data for 22 countries for the period 1999–2000, Grünfeld andMoxnes (2003) find that the corruption perception index (which is higher forcountries with lower corruption) positively affects service trade. Kimura and Lee
Service Exports 33

(2006) use the economic freedom index as a measure of institutions and find thateconomic freedom in both the partner country and the reporter country has apositive and significant effect on service exports.
The role of electronic infrastructure Telecommunication growth is the most powerful symbol of vitality of the servicesector, while at the same time being critical for further development of other serv-ices. Modern ICT has reduced the cost of delivering many cross-border servicesfrom infinite to virtually zero. Therefore, electronic infrastructure would under-standably increase service trade.
Freund and Weinhold (2002) assess whether the penetration of electronicinfrastructure has been critical in altering the geography of service provision.The positive effect of electronic infrastructure on service exports may not bestraightforward because the quality of certain services is critically influenced byphysical proximity, close monitoring and communication, or customization. Ifthese services are a large proportion of aggregate services, then Internet pene-tration may not greatly affect international trade. Measuring Internet penetra-tion by the number of top-level domains in each country (obtained from theInternet Software Consortium), Freund and Weinhold estimate the growth inbilateral service trade for the United States with its partner countries over theperiod 1995–99. Their results indicate that Internet penetration in the partnercountry significantly affects aggregate growth in service trade for the UnitedStates. After controlling for GDP and exchange rate movements, they find that a10 percent increase in Internet penetration in the partner country is associatedwith a 1.7 percent increase in export growth and a 1.1 percent increase inimport growth, which, in a dynamic long-run setting, translates to a 6 percentincrease in the level of U.S. imports and about a 4 percent increase in the level ofU.S. exports.
Freund and Weinhold (2002) also estimate a gravity model for U.S. bilateraltrade in services with partner countries. However, they do not find evidence thatInternet penetration abroad has increased U.S. exports or import of aggregateservices. On the contrary, when they run a gravity regression for U.S. imports ofbusiness professional and technical services, they observe that a 10 percentincrease in Internet penetration in the partner country is associated with a 1.2percent increase in the import of these services.
Shingal (2010) assesses the effect of the telecommunication density index,measured by fixed-line and mobile phone subscribers (per 1,000 people) as aproxy for infrastructure development in both the partner and the reporter coun-tries, on aggregate service exports. Hausman-Taylor estimation reveals that thequality of infrastructure in the partner country rather than the exporting country
34 Exporting Services

is very important for service exports. This result contrasts with that obtained byMirza and Nicoletti (2004), who find that telecommunication (and transport)infrastructure in both the partner and the reporter countries are critical for serv-ice exports. Their measure of the quality and quantity of telecommunicationinfrastructure is the OECD’s telecommunication index, which is a weighted aver-age of several components: mainlines per capita, mobiles per capita, percentage ofdigital lines, answer seizure ratio, and fault clearance rate. Mirza and Nicoletti(2004) explain the rationale for the use of infrastructure of both the partner andthe reporter countries as possible determinants of service exports through the O-ring theory mechanism, which suggests that, for instance, one needs to have com-puters, reliable telephone cables, and so on, in both countries to set up telecom-munication and export services through mode 1.
For disaggregate services, Lennon (2006) finds that Internet penetrationin both the partner and the reporter countries is significant in affecting othercommercial service exports. She used several other measures of the techno-logical environment in the partner and the reporter countries, including thenumber of personal computers per 1,000 persons, Internet users per 1,000persons, telephone mainlines per 1,000 persons, Internet hosts per 1,000 per-sons, and level of research and development expenditure as a share of GDP.All these alternative measures are tested one by one in a model with basicgravity variables and are found to significantly affect other commercial serv-ice exports.
In conclusion, whether using country-level data or trade data for bilateral serv-ices, researchers have found human capital to be critical for service exports. Severalstudies have researched the effect of institutions on service exports in a bilateralcontext. Specifically, level of corruption, complexity of export procedures, andrigidity in employment law of the partner and reporter country or a compositeindex of economic freedom is significant in affecting service exports. Finally, elec-tronic infrastructure is also key in exporting services.
Policy, regulations, and service exports
Policy and regulations can impede trade in services. For instance, to export bank-ing services through commercial presence in another country, the multinationalbank must usually adhere to several prudential and nonprudential regulations ofboth the home and the host countries. Similarly, for service exports throughmovement of natural persons (mode 4), regulations affect recognition of qualifi-cations from specific institutions or often require the professional to be proficientin the language spoken in the destination country. In addition, immigrationrequirements may also apply.
Service Exports 35

Lejour and de Paiva Verheijden (2004) contrast the determinants of bilateralservice trade within the Canadian provinces with those within the member statesof the European Union (EU) to bring out the importance of regulation in servicetrade, keeping in mind mode 1 and mode 3 service trade and measuring it throughvariable product market regulations (PMRs). The rationale for their comparison isthat economic institutions or regulations are inconsequential for trade within acountry, such as intraprovincial trade in Canada, whereas trade within the EUwould be inhibited by those factors. Thus, by comparing bilateral service tradeacross these two regions, one can measure the extent of trade inhibited by institu-tional differences and regulations. They find that regulatory barriers to servicetrade in both the reporter and the partner countries, as measured by the OECD’sPMR indicator, negatively affect trade within the EU. Mirza and Nicoletti (2004)confirm this conclusion for a sample of 20 OECD countries in 1999 and 2000.
Kox and Lejour (2005) estimate bilateral service trade determinants for 9 of the14 EU countries for the period 1999–2001, focusing specifically on the effect ofthe relative level of PMR as well as on the heterogeneity in PMR policy. Employinga variety of estimation techniques, such as OLS, a fixed-effects model, and an SURmodel, they find a negative and significant effect of the level of regulations as wellas the heterogeneity in PMR on service trade. Their full information maximumlikelihood (FIML) estimates reveal that heterogeneity in regulatory opacity nega-tively and significantly affects bilateral service exports, whereas heterogeneity inadministrative barriers to start up, heterogeneity in barriers to competition, het-erogeneity in state control, and heterogeneity in trade and investment barriers arenot critical for service exports.
Research suggests that policy that matters for aggregate services may notmatter for disaggregate services. For instance, for other commercial serviceexports, policy regulations such as heterogeneity in barriers to competition andheterogeneity in trade and investment barriers are found to have a negative andsignificant effect in Kox and Lejour (2005), whereas heterogeneity in adminis-trative barriers to start up and heterogeneity in state control do not matter.A policy variable that did matter for aggregate services in Kox and Lejour(2005)—heterogeneity in regulatory opacity—is not found to be critical forother commercial service exports.
Walsh (2006) has made a unique methodological contribution to the gravityliterature on service trade. After testing the efficiency of several gravity estimationtechniques, such as the fixed-effects model and the random-effects model, he usesHausman-Taylor estimation to estimate a gravity model for trade in services, giv-ing particular attention to the role of barriers to service trade. In contrast to thefocus of previous studies on aggregate services, Walsh extends his analysis to fourservice sectors: government, travel, transport, and other commercial services.
36 Exporting Services

Contrary to earlier studies, he finds that regulatory barriers in 27 OECD coun-tries, as measured by the Australian Productivity Commission’s trade restric-tiveness index, with their partner countries for the period 1999–2001 have notsignificantly hampered service imports. This finding is true not only for aggre-gate service imports but also for disaggregate services (that is, commercial,transport, travel, and government services).
Research findings on the effect of regulations relating to regional trade agree-ments (RTAs) on service trade do not always concur with each other. Grünfeldand Moxnes (2003), for instance, did not find that nontariff barriers or RTAs haveany significant influence on service exports. They justify this result because RTAsdo not cover trade in services. This finding, however, contrasts with the resultsobtained in Kimura and Lee (2006), who use an OLS estimation with time-fixedeffects to compare the determinants of goods trade with that of services in a grav-ity model setting for 10 OECD member countries and their partners (rangingfrom 27 to 47) for 1999 and 2000. They find that RTAs positively and significantlyaffect service exports. That RTAs have a positive effect on bilateral service tradeeven though they do not explicitly cover services can be explained because thepresence of RTAs indirectly facilitates service trade through goods trade. Kimuraand Lee (2006) also find that trade in goods and trade in services are complemen-tary in nature; that is, goods trade promotes service trade and vice versa. Thisfinding implies that even RTAs that cover goods trade should promote servicetrade indirectly.
Shingal (2010) augments this literature by separating the trade effects of pref-erential trade agreements (PTAs) into those emanating from services-only andgoods-only agreements. Moreover, he endogenizes the effect of preferentialism inestimating the trade effect within the gravity framework by using the Hausman-Taylor methodology. His estimates reveal that a services-only PTA increases bilat-eral service trade by 11.6 percent for all trading partners and by 12.7 percent fornon-EU trading partners. Goods PTAs are also found to promote service trade,with an incremental effect of 2.4 percent for all countries and 2.3 percent for non-EU trading partners.
Other determinants of service exports
Other determinants also play a role, including geography; common language,colonial history, and culture; FDI; and management or entrepreneurial skills.
The role of geographyDistance, adjacency and contiguity, and remoteness all affect service trade, thoughless so in recent years than in the past.
Service Exports 37

Distance
Historically, cross-border service trade had been limited because it requiredgeographic proximity between the buyer and the seller. For instance, a few yearsago, trade in medical services was not feasible because the patient and the doc-tor had to be in the same location, thus suggesting that distance should have anegative effect on service trade. Recent innovations in ICT, however, have ren-dered several nontradable services tradable. For instance, an x-ray for a patientcan be read and interpreted several miles away from the patient’s home location.Similarly, customer care for a U.S.-based credit card firm can be provided byagents located several thousands of miles away in cities of a developing countrysuch as India.
The most prominent variable in gravity estimation is the physical distancebetween a bilateral pair. As discussed before, the effect of distance on serviceexports is not very clear. On the one hand, physical distance may negatively affectservice exports not only because traditional services such as transport, travel, andconstruction services depend on physical distance but also because physical dis-tance represents cultural barriers that hinder cross-border service exports of othercommercial services such as business services or personal and recreation services.On the other hand, innovations in ICT have made free trade in services possiblefrom one end of the world to the other. An optimally large distance also reflectstime-zone differences that allow synchronization of work and, hence, should pos-itively affect service exports as long as the exporting and the importing countryhave high-quality electronic infrastructure.12 Given the two opposing effects, thefinal effect of distance would depend on the composition of aggregate services.13
Most research converges with respect to the qualitative findings on the effect ofdistance on service trade. Among the authors who found the effect of distance tonegatively affect service trade are Grünfeld and Moxnes (2003); Head, Mayer, andRies (2009); Kimura and Lee (2006); Kox and Lejour (2005); Lejour and de PaivaVerheijden (2004); Lennon (2006); Mirza and Nicoletti (2004); and Shingal(2010). However, when the effect of distance on service trade is compared to thaton goods trade, this consensus is lost. For instance, Lejour and de Paiva Verheijden(2004) compare the effect of distance on service exports with that on goodsexports by using a gravity model for intraregional trade in Canada and the EU.Unlike Kimura and Lee (2006), they find that the negative effect of distance islower for service trade vis-à-vis goods trade. Similarly, within a gravity frame-work, Tharakan, Van Beveren, and Van Ourti (2005) do not find that distance sig-nificantly affects software service exports from India. The gravity estimation inWalsh (2006) also suggests that distance is not critical for service trade.
Given the poor quality of data, not many authors have attempted to disentan-gle the determinants of service exports at the subsectoral level. For travel services,
38 Exporting Services

Walsh (2006) finds that after controlling for temperature in the exporting and theimporting countries, larger distance actually promotes travel service trade(imports). Similarly, for the case of transport service imports, he finds distance tohave a positive effect. This counterintuitive result is explained in terms of thevalue of service trade rather than the act of trade. Thus, a positive coefficientimplies that, as distance increases, it costs more to transport; hence, the value oftransport service trade increases.
For other commercial services, the Hausman-Taylor estimates of Walsh(2006) do not indicate that distance has a critical effect. OLS estimation of serv-ice trade data by Lennon (2006), however, suggests that other commercial serv-ice exports are negatively affected by physical distance. This finding is similar tothat of Head, Mayer, and Ries (2009) on exports of other commercial services,finance, IT services, and miscellaneous business services. They build a theoreti-cal foundation for a service gravity equation and estimate it using a recentlypopularized estimation technique for gravity models, Poisson pseudo maxi-mum likelihood (PPML),14 and the two-step negative binomial model. UsingEurostat data for 27 EU countries, along with Croatia, Norway, Turkey, and theUnited States, and their 33 partner countries for the period 1992–2006, Head,Mayer, and Ries (2009) specifically focus in their model on whether servicetrade has managed to overcome the impediments created by geographic dis-tance with time. They find that distance does dampen service trade; however,the effect of distance is declining over time (the coefficient for the time trendinteraction with distance variable is found to be negative). They also estimate amodel to check whether time-zone differences matter for service trade; however,because this variable is highly correlated with distance, it turns out to beinsignificant for all disaggregate services except miscellaneous service exportsand financial services.
Adjacency and contiguity
The estimates of Kimura and Lee (2006) for OECD countries suggest that coun-tries closer to each other have higher bilateral service trade. This finding is alsotestified to in the estimation of Lejour and de Paiva Verheijden (2004) for intra-EU trade. Contrary to their findings for the EU, Lejour and de Paiva Verheijdencontend that adjacency among Canadian provinces decreases their service trade,and their estimates seem to suggest that provinces closer to each other trade less inservices. The Hausman-Taylor estimates of Walsh (2006), in contrast, do not findadjacency to be a significant driver of or deterrent to any disaggregate serviceexports, except transport, where contiguity helps in promoting service exports.Lennon (2006), however, attests that the positive effect of adjacency is seen inother commercial service exports and total service exports.
Service Exports 39

Remoteness
Kimura and Lee (2006) also evaluate the effect of remoteness on service trade, avariable owed to Anderson and van Wincoop (2003). Kimura and Lee find thatremoteness of both the partner and the reporter positively affects service exports.In this way, service exports are quite unlike goods exports, for which remotenessof the reporter negatively influences exports whereas that of the partner has a pos-itive effect. Contrary to the findings of Kimura and Lee (2006), however,Tharakan, Van Beveren, and Van Ourti (2005) did not find any significant effect ofthe remoteness of India’s bilateral partner on software service exports.
Common language, colonial history, and cultureFamiliarity with the potential trading partner’s language and a common culturalor colonial history are likely to increase service exports because those factors easethe development of business ties. For instance, countries that share a colonial his-tory are linked by a common legal system that facilitates transactions betweenthem. Service exports usually involve intensive communication; therefore, a com-mon language promotes service exports via translation as well as through directcommunication effect (Mélitz 2008). Similarly, a shared cultural or colonial his-tory affects the ability to communicate and hence is likely to positively influenceservice exports.
Most gravity model research on service trade has evaluated the effect of lan-guage similarity on service trade. Justifiably, this variable should promote bilateralservice exports because communication is key to delivering services. Studies havefound a positive effect of language similarity on total service exports (Grünfeldand Moxnes 2003; Head, Mayer, and Ries 2009; Kimura and Lee 2006; Kox andLejour 2005; Lejour and de Paiva Verheijden 2004; Lennon 2006; Tharakan, VanBeveren, and Van Ourti 2005; Walsh 2006). Walsh (2006), however, suggests thatlanguage similarity is not critical for government or travel service exports,whereas Lennon (2006) and Head, Mayer, and Ries (2009) find language to be animportant driver of other commercial service exports. The estimates of Head,Mayer, and Ries (2009) also suggest that shared language is not critical for finan-cial service exports, whereas it is very important for promoting IT services or miscellaneous business service exports. Besides language similarity, Lennon(2006) and Head, Mayer, and Ries (2009) find shared colonial history to be impor-tant in encouraging disaggregate service exports.
Tharakan, Van Beveren, and Van Ourti (2005) use the threshold Tobit tech-nique to estimate a gravity model of India’s service exports using National Asso-ciation of Software and Services Companies (NASSCOM) data from 1998 to2001 and compare India’s bilateral service export determinants with those ofgoods exports. A peculiar determinant of trade in their model is the inclusion of
40 Exporting Services

population of Indian origin; that is, they estimate the effect of the Indian dias-pora on trade in goods and services. For both goods and services, the coefficientfor this variable is significant at a 1 percent level of significance. What is moreinteresting is that one cannot reject the hypothesis of this diaspora effect beingequal for both goods and services.
Foreign direct investment Several developing countries compete for FDI by offering tax incentives to largemultinational companies or by reducing barriers to foreign investment. This strat-egy is motivated by a widely held view that multinationals act as a catalyst forexport expansion and improve the competitiveness of the host country. FDI pro-motes exports of a host country by (a) augmenting domestic capital for exports,(b) transferring technology for new products for exports, (c) facilitating access tonew and large foreign markets, and (d) training local workers and upgrading theirtechnical and management skills. Ample empirical evidence in the literature (forinstance, Blomström and Kokko 1998; Borzenstein, De Gregorio, and Lee 1998;UNCTAD 1999) suggests that FDI promotes trade in the host country throughintroduction of new technology and management techniques, diffusion of marketinformation, and greater market access, as well as by stimulating competition inthe host country. East Asian economies witnessed tremendous growth before thecrisis of 1997–98. One can easily argue that these perceived benefits apply as muchto service exports as they do to manufacturing, thereby suggesting a positive influ-ence of inward FDI on service exports.
Using OECD data for 22 countries for the period 1999–2000, Grünfeld andMoxnes (2003) identify the determinants of service trade and foreign affiliate sales.Even though they use a standard OLS methodology for gauging service trade deter-minants, their contribution is special because of their emphasis on strong linksbetween FDI and trade in services. They determine the complementarity or substi-tutability between service exports and outward FDI in services by regressing FDIresiduals obtained from an FDI equation on service exports residuals obtainedfrom the service exports equation. The coefficient for service exports residuals isfound to be positive and significant at the 1 percent level, implying that outwardFDI and service exports are complementary. This finding is interesting because alarge proportion of trade is facilitated through foreign affiliate sales (mode 3).
The literature also suggests that FDI may be detrimental for exports if it lowersor replaces domestic savings and investment or transfers technologies that are lowlevel or inappropriate for the host country’s factor proportions.15 Furthermore, ifhost countries do not meet the threshold human capital requirement (see, forinstance, Blomström and Kokko 2003) or if most service exports are low in capitalintensity, FDI may not influence service sector exports in a significant way.
Service Exports 41

Management or entrepreneurial skillsMicrolevel studies in developing countries suggest that managerial skills play a keyrole in the adoption of modern technologies, which, in turn, are critical for pro-ducing a high-quality good for the export market.16 Because managerial skills canbe learned by observing other competent managers,17 experience working in anefficient multinational firm has been found to be important for the developmentof such skills.
Some studies (see, for instance, Saxenian 1999, 2000, 2004) suggest thattransnational entrepreneurial networks have played an essential role in the growthof exports from several developing countries. For instance, the development of theIndian software industry is attributed to entrepreneurs of Indian origin who hadworld-class training in management skills or who had the experience of workingabroad in well-established multinational firms (Gregory, Nollen, and Tenev 2009).Another example is highlighted by Lall (1999), who describes the dramaticincrease in the use of managers in the export-led, fast-growing East Asianeconomies. He also illustrates the critical role managers played in changing thetraditional human resource attitudes and policies toward new technology andproducts that were in demand in advanced economies. Thus, one would expect acountry rich in such managerial or entrepreneurial skills to be successful inexporting services. Unfortunately, no hard data are available on the quality ofmanagerial skills at the country level; therefore, only anecdotal or case-by-caseevidence exists on the significance of this variable.
Annex table 2.A.1 summarizes these papers, and table 2.A.2 points out theirspecific results.
The Determinants of Service Exports: An Illustration18
Two main sources provide data on bilateral service trade: OECD and UNSTATS.19
The UNSTATS bilateral service trade database reports data for 47 reporter coun-tries, of which 22 are developing countries.20 The data are reported for 2000–08.The data cover exclusively balance of payments statistics; therefore, they refer onlyto cross-border (mode 1) and consumption abroad (mode 2) statistics. No datacover service transactions through commercial presence (mode 3) for both devel-oped and developing countries. In addition, the data used do not cover serviceexports through temporary labor mobility (mode 4). Finally, because the bilateralservice trade between African countries is very small, they are excluded from thisestimation exercise.21
The dependent variable used is the log of service exports,22 and the base modelincludes basic gravity-type independent variables—that is, per capita incomes ofthe reporter and partner countries; their populations; bilateral distance betweentrading partners; and dummies for countries with a common border, with
42 Exporting Services

colonial relationships, and with a common language. Fixed effects of partner andreporter countries, as well as fixed effects for each year in the period 2000–08, areincluded.
The following base gravity equation is estimated:
log Ser expijt = FEi + FEj + TE + Per capita incomei + Per capita incomej
+ Populationi + Populationj + Cultural factorsij
+ Geographic factorsij + εijt. (2.1)
The variables of interest are added one by one to this base estimation. Becausethe variables pertaining to electronic infrastructure, human capital, and institu-tions are of primary interest, the following variables are included:
• A proxy for telecommunication infrastructure—that is, Internet penetrationfor both the reporter and the partner
• Tertiary education (tertiary school enrollment, as a percentage of gross enroll-ment)23
• An institutional variable—that is, shared legal origins between the reporterand the partner24
The effect of net FDI inflows and bilateral goods trade are also evaluated. Thefinal specification includes all these variables together.
The OLS regression results are presented in table 2.1. The regression output intable 2.1 suggests that per capita income and population in both the reporter andthe partner countries positively affect service exports of the reporter country,whereas distance negatively influences bilateral service exports.25 The negativeeffect of distance on service exports is rationalized by the fact that distance is nota proxy for transport costs alone (Anderson and van Wincoop 2003; Leamer2007). It might also reflect cultural, linguistic, and legal differences; existence ofRTAs; informational barriers; and differences in time zones.
This chapter’s conclusions on a common border positively affecting bilateralservice trade are the same as those reported in Kimura and Lee (2006) andLejour and de Paiva Verheijden (2004) but contrast with those found in Walsh(2006). The result confirms the positive effect of common language on servicetrade found in Head, Mayer, and Ries (2009); Kimura and Lee (2006); Kox andLejour (2005); Lennon (2006); Tharakan, Van Beveren, and Van Ourti (2005);and Walsh (2006).26 It also confirms the importance of near-shoring strategiesin service exports.
In column 2 of table 2.1, Internet penetration of both the reporter and thepartner countries are included because delivering services over electronic mediarequires both parties to have access to it. This specification is similar to Lennon’s(2006) specification. According to the findings, Internet penetration in the
Service Exports 43

Table 2.1. Determinants of Service Exports: Gravity OLS Estimation, 2000–08Dependent variable: bilateral service exports, in log level
Variables (1) (2) (3) (4) (5) (6) (7)
Per capita income,reporter
0.967***[3.552]
0.877***[3.116]
0.949***[3.083]
0.972***[3.543]
0.286[1.138]
0.965***[3.555]
0.228[0.774]
Per capita income, partner
0.753***[2.961]
0.791***[3.010]
0.677**[2.418]
0.658**[2.528]
0.393*[1.798]
0.760***[2.988]
0.535**[2.148]
Population, reporter –0.572[–0.612]
0.225[0.238]
1.163[0.964]
–0.493[–0.507]
0.261[0.314]
–0.627[–0.672]
2.495**[2.417]
Population, partner –3.108***[–4.717]
–2.291***[–3.212]
–3.514***[–4.567]
–3.505***[–5.172]
–2.255***[–3.817]
–3.070***[–4.674]
–1.583**[–2.159]
Common border 0.789***[11.968]
0.738***[11.076]
0.978***[13.829]
0.804***[12.128]
0.441***[9.196]
0.775***[11.751]
0.551***[10.519]
Common language 0.355***[7.915]
0.348***[7.799]
0.411***[7.990]
0.347***[7.670]
0.201***[4.987]
0.277***[6.002]
0.194***[4.115]
Common colonial history
0.631***[8.583]
0.642***[8.762]
0.634***[7.843]
0.618***[8.275]
0.328***[5.313]
0.536***[7.211]
0.294***[4.346]
Distance, in logs –1.115***[–55.074]
–1.108***[–54.365]
–1.111***[–46.242]
–1.111***[–54.271]
–0.454***[–18.139]
–1.091***[–53.309]
–0.432***[–15.102]
Internet penetration,reporter
0.002[0.631]
–0.001[–0.559]
44

Internet penetration,partner
0.010***[4.265]
0.007***[3.042]
School enrollment, tertiary(% of gross), reporter
0.011***[3.673]
0.012***[4.284]
FDI net inflows (% of GDP)
–0.001[–1.251]
Bilateral goods trade, in logs
0.537***[35.595]
0.526***[31.923]
Shared legal origins 0.201***[8.143]
0.116***[5.067]
Constant 38.680***[4.041]
28.669***[2.849]
35.106***[4.808]
32.591***[5.224]
7.776**[2.265]
38.534***[4.048]
–11.551[–1.246]
Fixed effects (time and country) Yes Yes Yes Yes Yes Yes Yes
Observations 11,914 11,609 10,642 11,793 11,893 11,914 10,405
R2 0.836 0.837 0.832 0.835 0.872 0.837 0.869
Source: Authors’ calculations.Note: Robust t-statistics in brackets.*** = significant at the 1 percent level; ** = significant at the 5 percent level; * = significant at the 10 percent level.
45

reporter country does not significantly affect service exports, whereas that in thepartner does. This result is robust to controlling for other determinants of serv-ice exports. In column 7 of table 2.1, Internet penetration in the partner countryis found to positively and significantly affect service exports, whereas that in thereporting country is insignificant in affecting service exports. An increase inInternet penetration in the partner country by one SD (24.7 persons per 100 per-sons) is found to increase bilateral service exports by about 17 percent.
This finding could be driven by the fact that UNSTATS includes in its databasemany reporter countries that are in a low stage of development and that do not yethave basic infrastructural facilities; nevertheless, these countries are able to exportservices for special reasons. For instance, a country such as India may have a verylow penetration of electronic infrastructure yet be able to export services becauseof its policy on higher education or because of recent policy initiatives on theestablishment of software technology parks that fill the country’s infrastructuralbottlenecks.
What is required for exporting services is that exporting firms have access tohigh-quality electronic infrastructure, which may not necessarily cover the gen-eral population of the reporter country. Therefore, Internet penetration amongthe general population in the reporter country may not significantly affect serviceexports. Exporting firms in developing countries may own the equipment forbetter-quality telecommunications where such equipment is not publicly avail-able, or the government may be able to create software technology parks (as in thecase of Egypt, India, or the Philippines) to overcome the handicap of technologypenetration among the general population.
In contrast, for a country to successfully export services, consumers in the part-ner country must have better access to good-quality electronic infrastructure. Thisresult is different from that of Lennon (2006), who found a positive effect for bothcountries’ Internet penetration. This difference perhaps reflects the large number ofdeveloping reporter countries in the sample that have low Internet penetration butexport services to rich countries with high Internet penetration. This chapter’sresult is, however, similar to the Hausman-Taylor estimation in Shingal (2010), whoattributes the success of service exports to the partner’s telecommunication densityrather than the reporter’s own telecommunication network penetration.
The base specification is augmented with variables pertaining to endowmentof human capital as measured by tertiary schooling enrollment (column 3 oftable 2.1), FDI (column 4), and bilateral goods exports (column 5), as well as aninstitutional variable (column 6)—that is, shared legal origins between thereporter and the partner countries.
One SD (18.7 percent) increase in tertiary school enrollment (as a percentageof gross enrollment) in the reporter country increases bilateral service exports
46 Exporting Services

by 21 percent.27 This finding is similar to the conclusions that Lennon (2006)draws with OLS regression of commercial service exports using the OECD datafrom 1999 to 2002. Mirza and Nicoletti (2004) also confirm this result by usinga three-stage least squares estimation of total bilateral service exports of OECDcountries for 1999 and 2000, whereas Shingal (2010) does so with Hausman-Taylor estimation of OECD bilateral service export data for 1999–2003. In thecomplete specification of column 7, the effect of tertiary education on serviceexports remains positive and significant. One SD increase in the percentage oftertiary school enrollment of the reporter country increases bilateral serviceexports by 22 percent.
Column 4 results suggest that net FDI inflows do not significantly affect serviceexports of the reporter country, whereas bilateral goods exports increase bilateralservice exports. Higher bilateral goods trade reflects better trading relationshipsbetween nations or intensive business networks that can potentially ease theexport of bundled services as well (column 5).28
In the complete specification of column 7, a 10 percent increase in bilateralgoods export increases service exports by 5 percent. The magnitude of the dis-tance coefficient falls from about –1.0 to –0.4 when bilateral goods exports areintroduced as an explanatory variable; that is, about 60 percent of the negativeeffect of distance on service exports is absorbed by goods exports. This findingimplies that the negative effect of distance on service exports materializes becauseof trade in services that is complementary to goods trade or embodied in thegoods themselves.
Next, institutional variables were added to the base gravity model (column 6 oftable 2.1) to evaluate whether institutions affect service trade: variables pertainingto business environment, rule of law, and regulatory quality in the reporter andpartner countries act as a proxy for institutional factors in evaluating their effecton service exports. None were found to be significant in affecting service exports.As discussed before, institutions, as measured by implementation of intellectualproperty rights, business environment, and the like, have found a significant placein service exports. However, as is well known, the time variation in institutions islow, and therefore capturing such effects in panel estimation is difficult. This dif-ficulty may be attributable to the absence of data on service exports through acommercial presence and the temporary movement of labor where these areimportant decision and market-access variables.
Finally, the model looks at the idea of Kox and Lejour (2005) that heterogene-ity in policy between the reporter and the partner countries can affect servicetrade and the idea of Rose (2000) that countries with the same colonizers havesimilar institutions and therefore trade more. Head, Mayer, and Ries (2009) alsoevaluate whether a shared legal origin leads to greater bilateral service trade.
Service Exports 47

This chapter’s model uses this same variable to test whether shared legal originsmatter for service exports and whether this determinant is valid even for devel-oping countries. The variable is highly significant in specification of column 6as well as in the complete specification (column 7) that controls for other deter-minants of service exports. Thus, this result confirms the findings of Head,Mayer, and Ries (2009).
Are Determinants Different for Developing Countries?
High-income countries are excluded from the sample, and the same models asthose in table 2.1 are again estimated using the OLS methodology.29 The result ofthis estimate is given in table 2.2. Three important differences are seen withrespect to the findings for developing countries: first, OLS estimates of therestricted sample suggest that the negative effect of distance is slightly lower fordeveloping countries, whereas the effect of a common border on service exports islarger. This result is more pronounced in the complete specification of column 7.The role of both (a) distance and common borders and (b) language could be anindication of the importance of regional markets for service exports for thesecountries as well as of the positive effect that a deep integration may have for serv-ice exports.
Second, column 2 estimates in table 2.2 suggest that the effect of Internet pen-etration in the partner country increases service exports of the developing coun-try; however, in the complete specification of column 7, this result does not holdtrue. Thus, the Internet penetration in neither the reporter nor the partner coun-try explains service exports from developing countries. This finding may beexplained by the composition of exports from developing countries, which isbiased toward transport and travel services that are less ICT intensive.
Third, human capital emerges as an important determinant of bilateralservice exports in the gravity framework, as indicated by the estimation resultsin columns 3 and 7 of table 2.2. In the complete specification, for one SDincrease in tertiary schooling enrollment, service exports increase by a muchhigher 37 percent for the limited sample (compared with 22 percent for the fullsample). Thus, the importance of education in promoting service exports ismuch higher in the case of developing countries. This finding may also beexplained by the relative size of other commercial services in comparison totransportation and travel services.
The results with respect to other variables are similar for developing anddeveloped countries. In a developing-country reporter, FDI does not signifi-cantly affect service exports. Similarly, bilateral goods exports are found to pos-itively affect service exports of developing countries as well, although their
48 Exporting Services

Table 2.2. Determinants of Service Exports: Gravity OLS Estimation, Developing-Country Sample, 2000–08Dependent variable: bilateral service exports, in log level
Variables (1) (2) (3) (4) (5) (6) (7)
Per capita income,reporter
1.042***[3.443]
0.949***[3.005]
1.082***[3.333]
1.054***[3.445]
0.268[0.947]
1.036***[3.433]
0.294[0.938]
Per capita income, partner 0.756**[2.360]
0.742**[2.232]
0.879**[2.541]
0.714**[2.177]
0.401[1.476]
0.753**[2.351]
0.673**[2.206]
Population, reporter 0.400[0.352]
0.955[0.846]
2.420*[1.824]
0.578[0.481]
1.469[1.434]
0.333[0.293]
3.403***[3.004]
Population, partner –2.959***[–3.518]
–2.020**[–2.206]
–3.187***[–3.372]
–3.269***[–3.763]
–2.073***[–2.762]
–2.925***[–3.481]
–1.418[–1.570]
Common border 1.027***[12.803]
0.965***[11.845]
1.280***[14.717]
1.039***[12.896]
0.600***[10.352]
1.026***[12.837]
0.764***[11.790]
Common language 0.386***[6.660]
0.380***[6.618]
0.466***[7.407]
0.380***[6.511]
0.231***[4.641]
0.316***[5.369]
0.253***[4.674]
Common colonial history 0.576***[7.271]
0.587***[7.498]
0.529***[6.225]
0.555***[6.923]
0.264***[3.912]
0.488***[6.036]
0.219***[3.033]
Distance, in logs –0.979***[–28.262]
–0.961***[–27.392]
–0.979***[–24.948]
–0.978***[–28.037]
–0.287***[–7.807]
–0.955***[–27.349]
–0.260***[–6.132]
Internet penetration,reporter
–0.003[–0.874]
–0.005[–1.577]
49
(Table continues on the following page.)

Internet penetration,partner
0.009***[3.204]
0.006**[2.309]
School enrollment, tertiary(% of gross), reporter
0.019***[5.172]
0.019***[5.725]
FDI net inflows (% of GDP)
–0.000[–0.837]
Bilateral goods trade, in logs
0.577***[31.108]
0.558***[27.729]
Shared legal origins 0.193***[6.133]
0.094***[3.236]
Constant 10.692[1.061]
8.577*[1.693]
10.840**[2.147]
29.258***[3.545]
16.442**[2.190]
10.887[1.084]
13.640[1.580]
Fixed effects (time andcountry) Yes Yes Yes Yes Yes Yes Yes
Observations 8,500 8,229 7,723 8,412 8,488 8,500 7,510
R2 0.825 0.826 0.822 0.823 0.866 0.825 0.863
Source: Authors’ calculations.
50
Table 2.2. Determinants of Service Exports: Gravity OLS Estimation, Developing-Country Sample, 2000–08 (continued)
Variables (1) (2) (3) (4) (5) (6) (7)

effect is marginally larger. Furthermore, as in the case of the full sample, rela-tive to human capital and electronic infrastructure, shared legal origins (theproxy for the state and similarity of institutions between trading partners) arecritical for service exports even in the case of developing countries, althoughtheir effect is slightly smaller.
As robustness checks, alternative measures for the quality of electronicinfrastructure were tried, and the results are replicated in these estimations.Moreover, for the nonrich sample, upper-income countries were excluded, yetall the results were qualitatively similar and the coefficient estimates differedonly marginally.
Policy Conclusions
This survey and empirical illustration suggest that electronic infrastructure,higher education, and institutional environment individually affect serviceexports. Among these variables, the effect of higher education on service exportsstands out. Sudan and others (2010) find that countries that have succeeded inexporting IT-based services have generally seen their governments make seriousefforts to catalyze the growth of the education sector. For instance, in a number ofcountries, such as Brazil, India, and South Africa, long-term investment in world-class technology institutes initially produced a critical mass of technology leadersable to compete globally. Subsequently, with growing derived demand for techni-cal education, the power of the market was unleashed when private technologyinstitutes were allowed to enter the tertiary education market, dramaticallyexpanding the number of engineering graduates available for the IT sector in onlya few years. Recently, countries such as Egypt have gone a step further by allowingthe private sector to partner with universities to advance the technological capa-bilities of the ICT industry.
Electronic infrastructure is also found to be an important determinant of serv-ice trade. Again, efficient government policy can help. In a number of developingcountries, governments have sought to overcome infrastructural and proceduralconstraints by providing data communication facilities, office space, and one-stop-shop statutory services, such as software parks in China, software technologyparks in India, and ecozones in the Philippines. In Egypt, the local IT sectorincreasingly operates in the so-called smart villages. Given the poor state of elec-tronic infrastructure, these technology parks have facilitated the growth of theindustry. In parallel, liberalization of telecommunications in countries such asEgypt and India allowed private sector investment in the sector and cleared thepath for establishment of alternative international gateways that were also criticalto development of the IT service and ITeS industries.
Service Exports 51

Institutions also matter. The gravity model enabled affirmation of the impor-tance of similarity in institutions, as reflected, for example, in shared legal origins.Even though other institutional variables, such as rule of law and ease of contractenforcement, turn out to be insignificant relative to higher education and infra-structure, that result could be because of limited variation over time in these variables, and they could nevertheless be important determinants of serviceexports. An example of how institutional efficiency promotes service exports isrevealed in Ireland, where the Industrial Development Agency (IDA), a government-sponsored agency, has been very successful in attracting IT service and ITeS invest-ments. An inward investment program launched by IDA gave export-orientedinvestors a one-stop shop that deals with all aspects of inward investment—planning,promoting, marketing, negotiating, and processing of investment proposals; provid-ing financial incentives and property solutions; and helping new investors get startedand working with them to maximize their contribution to the Irish economy.30 Thecase of India has been similar: the private sector industry association, NASSCOM,played a key role in building India’s brand image for offshoring services and in voic-ing industry concerns to the government.
Finally, the empirical finding results must be treated with some caution giventhe severe data limitations. Most empirical work deals with the determinants ofaggregate service exports rather than exports of specific services. The determi-nants of other commercial service exports are bound to be different from thoseof travel services. Nyahoho (2010), for instance, assesses the importance of factorintensity as a determinant of trade in services. He finds that human capitalendowments are critical for exports of computer and information services,whereas research and development intensity positively affects exports of con-struction services, public works, and computer and information services. Thestudy in this book attempted to estimate the determinants of disaggregated serv-ices: transport, travel, tourism, and other commercial service exports; other busi-ness services; and computer and information services. However, the resultsobtained were not intuitive, perhaps because of a lack of reliable data on disag-gregated service trade.
Annex 2.A: Definitions, Gravity Model Survey, Variables, and Data Sources
Tables 2.A.1 and 2.A.2 summarize the studies on the determinants of serviceexports and the results of the gravity models used in the literature, respectively.Table 2.A.3 defines the variables used in gravity OLS estimation in this study anddescribes the data sources. Table 2.A.4 shows the partial correlation of variableson electronic infrastructure.
52 Exporting Services

Table 2.A.1. Gravity Models for Explaining Service Trade
Authors Objective Special contribution Empirical methodologyCountry sample, period,and data sources
Grünfeld and Moxnes(2003)
To identify the determinants of servicetrade and foreign affiliatesales
• Emphasized the stronglinks between service FDI and tradea because a large proportion oftrade is facilitated through foreign affiliatesales (mode 3)
• Contributed newvariables: corruption inthe importing country,Trade RestrictivenessIndex
OLS and exporter countryfixed-effect model
• Sample: 22 OECDcountries for service tradeand “approximately thesame” OECD countries forFDI
• Period: 1999 and 2000for service trade and 1999for FDI
• Data sources: OECD forservice trade and OECDInternational DirectInvestment StatisticsYearbook
Lejour and de PaivaVerheijden (2004)
To (a) contrast bilateraltrade between the provinces of Canada andthat between EU memberstates to bring out theimportance of regulation in service trade and (b) compare service tradedeterminants with those of goods trade
• Assumed that for within-country trade (Canada),the role of institutions and regulations could beignored
• Disaggregated trade data for 10 service sectors within Canada,which could be exploited
OLS • Sample: 10 Canadianprovinces and 11 servicesubsectors; 9 EU countriesand 4 service subsectors
• Period: Canadianinterprovincial trade,1997–99; intra-EU trade,1999–2001
• Data sources: OECD andStatistics Canada
(Table continues on the following pages.)
53

Mirza and Nicoletti (2004) To explain bilateral trade in services by emphasizingthe importance of PMRs inboth countries, as well ashuman capital,infrastructure in transport,and telecommunicationnetworks in both countries
• Used the O-ring theory to explain trade inservices
• Emphasized that quality of tasks in both the home and the hostcountry is important forsuccessful service delivery, so modes of regulations of bothcountries affect thequality of final service,which is not the case with manufacturing trade where regulations in the importing countryaffect bilateral trade
OLS and SUR estimation of2 (exporter and importer)equations obtained from the mean deviation method to deal with themulticollinearity problem ina 3-dimensional panel(country, partner, and time);3-stage least squaresregression, which is basically a SUR method with some endogenousvariables, to which aninstrumental variableestimation technique isapplied
• Sample: 20 OECDcountries and 27 partnercountries
• Period: 1999–2000• Data source: OECD
Kox and Lejour (2005) To study service tradedeterminants with a focuson the effects of policyheterogeneity
• Studied the effect of relative level andheterogeneity in PMRs on service trade
• Focused on total servicesand commercial services
• OLS (with and without fixed effects)
• FIML with fixed-effect and SUR model
• Sample 9 of the 14 EUmember countriesbecause of limits on PMRdata
• Period: 1999–2001• Data source: OECD
Tharakan, Van Beveren, and Van Ourti (2005)
To compare software service export determinants with those of goods tradeb
• Studied the effect ofpopulation of Indianorigin on service andgoods trade
• Focused on a singledeveloping country
Threshold Tobit model • Sample: India• Period: 1998–2001• Data source: NASSCOM
Table 2.A.1. Gravity Models for Explaining Service Trade (continued)
Authors Objective Special contribution Empirical methodologyCountry sample, period,and data sources
54

Kimura and Lee (2006) To assess the effects ofvarious factors on bilateralservice trade relative togoods trade
• Studied the relationshipbetween goods exportsand service exportsc
OLS • Sample: 10 OECDcountries and theirpartner countries (rangingfrom 27 to 47)
• Period: 1999 and 2000• Data source: OECD
Lennon (2006) To contrast trade in goodswith trade in services, with aspecial focus on othercommercial services
• Quantified thecomplementarity betweenbilateral trade in goodsand servicesd
• Contributed newvariables: trust andcontract enforcement,networks, labor marketstechnology andtechnology ofcommunication,landlocked status
• Studied determinants for4 service categories(government, travel,transport, other commercial services) rather than simply totalservices
OLS • Sample: 28 OECDcountries and theirpartners
• Period: 1999–2002• Data source: OECD
Walsh (2006) To study the determinantsof trade in services using agravity model, withparticular attention to therole of barriers to servicetrade
• Extended the analysis to 4 service sectors(government, travel,transport, and othercommercial services), rather than using the total service focus ofprevious studies
Hausman-Taylor model • Sample: Imports between27 OECD countries andup to 50 of their partnercountries
• Period: 1999–2001• Data source: OECD
(Table continues on the following pages.)
55

• Quantified nontariff barriers through a gravitymodel
• As a methodologicalcontribution, tested theefficiency of the fixed-effects and random-effects modelsusing the Breusch Pagan Test
• Proposed using Hausman-Taylor model, as done in goods tradegravity literature, forestimating service tradedeterminants, a methodfound to be most efficient
Head, Mayer, and Ries(2009)
To focus on service tradedeterminants to see whether service trade hasmanaged to overcome theimpediments created bygeographic distance andinstitutional differences
• Explored the role ofinstitutions and timezones in service trade
• Calculated the wagepremium a firm would be willing to pay to avoidthe costs associated withremote provision ofservices
• Examined disaggregatedservices, differentiatingoffshored fromnonoffshored services
OLS; also estimated a PPML and 2-step negativebinomial model for timetrend of distance effect
• Sample: 65 countries—27EU countries, plus Croatia,Japan, Norway, Turkey,and the United States,and 33 partner countries(trade between 2 partnercountries excluded)
• Period: 1992–2006• Data source: Eurostat
Table 2.A.1. Gravity Models for Explaining Service Trade (continued)
Authors Objective Special contribution Empirical methodologyCountry sample, period,and data sources
56

• Researched the theoretical foundations for a service gravityequation
• Examined whether theeffect of distance inservices trade hasdampened over time
Shingal (2010) To assess the effect of PTAson service exports
• Endogenized the effect of PTAs
• Distilled the trade effect of PTAs into thatemanating from service-only and goods-onlyagreements
Hausman-Taylor model (also checked with OLS, PPML)
• Sample: 25 exporting and53 importing countries
• Period: 1999–2003• Data source: OECD
Source: Authors’ compilation. a. Grünfeld and Moxnes (2003) determine the complementarity or substitutability between service exports and outward FDI in services by regressing FDI residualsobtained from an FDI determinants equation on service exports residuals obtained from a service exports equation. The coefficient for service exports residuals ispositive and significant at the 1 percent level, implying complementarity between outward FDI and service exports. b. To test for determinants of service exports relative to goods exports, Tharakan, Van Beveren, and Van Ourti (2005) do a t-test for equality in coefficients.c. The estimation methodology was different. Goods exports residuals were regressed on service imports residuals and tested for significance. They were foundsignificant at the 1 percent level. d. To test for determinants of service exports relative to goods exports, Lennon (2006) followed an approach that is very different from usual gravity models of trade.Instead of having two dependent variables and two separate regressions for goods and service trade, total trade was regressed on a dummy variable for service trade,and independent variables interacted with the service trade dummy. To test whether goods exports encourage service exports, the model used instruments for goodstrade and import tariff on nonagricultural goods. Bilateral trade in goods explained bilateral trade in services with an elasticity of 1.0, whereas service trade encouragedgoods trade, but the elasticity is less than 0.5.
57

Table 2.A.2. Results of Gravity Models
Variables
Grünfeld and Moxnes (2003), OLS
estimationKimura and Lee (2006)
Shingal(2010),
Hausman-Taylor
estimation
Mirza andNicoletti(2004), 3-stage
least squares
estimation
Lejour and de Paiva
Verheijden (2004)
Kox and Lejour (2005), FIML estimation (deviation from
mean from average exporter)
Variables
Totalserviceexports
Serviceout ward
FDI stock
Serviceexports +
serviceoutwardFDI stock
Serviceexports
Serviceimports
Aggregateserviceexports
Total serviceexports
Inter -provincialCanadian
total serviceexports
Intra-EU total
serviceexports
Commer cialserviceexports
Commer cialserviceimports
Total serviceexports
Total serviceimports
GDP, reporter (+)*** (+)*** (+)*** (+)*** (+)*** (+)*** (+)*** (+)*** (+)*** (+)*** (+)*** (+)***
GDP, partner (+)*** (+)*** (+)*** (+)*** (+)*** (+)*** (+)*** (+)***
Population,reporter
(+)*** (+)***
Population,partner
(+)*** (+)***
GDP percapita,reporter
(+)*** (+)*** (+) (+)*** (+)***
GDP per capita,partner
(+) (–)*** (–)* (+)*** (+)***
Distance (–)*** (–)*** (–)*** (–)*** (–)*** (–)** (–)*** (–)*** (–)*** (–)*** (–)*** (–)*** (–)***
Distance �trendTime zonedifference
Remoteness,reporter
(+)* (+)***
Remoteness,partner
(+)*** (+)***
Adjacency (+)* (+) (–)*** (+)***
58

Regionaltradingagreement
(–) (–) (–)* (+)** (+)*** (+)* (services
only)
(+)***
Economicfreedom,reporter
(+)*** (+)***
Economicfreedom,partner
(+)*** (+)***
Language (+)*** (+)*** (–)***(languagedifference)
(–)***(languagedifference)
(–)***(language
measured aslinguisticdifferencebetween
languages)
(–)***(language
measured asling uisticdifferencebetween
languages)
(–)***(languagemeasured
as linguisticdifferencebetween
languages)
(–)***(languagemeasured
as ling uisticdif ferencebetween
languages)
Nontariffbarriers
(–) (–)*** (–)***
Temperature,reporter
Temperature,partner
Governmenteffectiveness,reporter
Governmenteffectiveness,partner
Diaspora
Contiguity
At least onecountrylandlocked
(Table continues on the following pages.)
59

Table 2.A.2. Results of Gravity Models (continued)
VariablesVariables
Grünfeld and Moxnes (2003), OLS
estimationKimura and Lee (2006)
Shingal(2010),
Hausman-Taylor
estimation
Mirza andNicoletti(2004), 3-stage
least squares
estimation
Lejour and de Paiva
Verheijden (2004)
Kox and Lejour (2005), FIML estimation (deviation from
mean from average exporter)
Variables
Totalserviceexports
Serviceout ward
FDI stock
Serviceexports +
serviceoutwardFDI stock
Serviceexports
Serviceimports
Aggregateserviceexports
Total serviceexports
Inter -provincialCanadian
total serviceexports
Intra-EU total
serviceexports
Commer cialserviceexports
Commer cialserviceimports
Total serviceexports
Total serviceimports
Trust inreporter frompartner
Corruptionperceptionsindex, reporter
Corruptionperceptionsindex, partner
(+)**(largerscore
implieslow cor -ru ption)
(+)***(largerscore
implies low cor -ru ption)
(+)***(largerscore
implieslow cor -rup tion)
Complexity of procedures,reporter
Complexity of procedures,partner
60

Colonialrelationship
Shared legalorigins
Migration
Average yearsof education,reporter
Average yearsof education,partner
Higheducationpopulation,reporter
Higheducationpopulation,partner
Secondaryeducationpopulation,reporter
Secondaryeducationpopulation,partner
Primaryeducationpopulation,reporter
(Table continues on the following pages.)
61

Table 2.A.2. Results of Gravity Models (continued)
Variables
Grünfeld and Moxnes (2003), OLS
estimationKimura and Lee (2006)
Shingal(2010),
Hausman-Taylor
estimation
Mirza andNicoletti(2004), 3-stage
least squares
estimation
Lejour and de Paiva
Verheijden (2004)
Kox and Lejour (2005), FIML estimation (deviation from
mean from average exporter)
Variables
Totalserviceexports
Serviceout ward
FDI stock
Serviceexports +
serviceoutwardFDI stock
Serviceexports
Serviceimports
Aggregateserviceexports
Total serviceexports
Inter -provincialCanadian
total serviceexports
Intra-EU total
serviceexports
Commer cialserviceexports
Commer cialserviceimports
Total serviceexports
Total serviceimports
Primaryeducationpopulation,partner
Employmentlaw rigidityindex, reporter
Employmentlaw rigidityindex, partner
Internet users,reporter
(+)
Internet users,partner
(+)***
Personalcomputers,reporter
Personalcomputers,partner
62

Telephonemainlines,reporter
Telephonemainlines,partner
Internet hosts,reporter
Internet hosts,partner
Research anddevelopmentexpenditure(% of GDP),reporter
Research anddevelopmentexpenditure(% of GDP),partner
Regulationlevel (PMR),reporter
(–)*** (–)*** (–)*** (–) (–)**(barriers to entre -prenuer-
ship)
Regulationlevel (PMR),partner
(–)*** (–)***
(Table continues on the following pages.)
63

Table 2.A.2. Results of Gravity Models (continued)
Variables
Grünfeld and Moxnes (2003), OLS
estimationKimura and Lee (2006)
Shingal(2010),
Hausman-Taylor
estimation
Mirza andNicoletti(2004), 3-stage
least squares
estimation
Lejour and de Paiva
Verheijden (2004)
Kox and Lejour (2005), FIML estimation (deviation from
mean from average exporter)
Variables
Totalserviceexports
Serviceout ward
FDI stock
Serviceexports +
serviceoutwardFDI stock
Serviceexports
Serviceimports
Aggregateserviceexports
Total serviceexports
Inter -provincialCanadian
total serviceexports
Intra-EU total
serviceexports
Commer cialserviceexports
Commer cialserviceimports
Total serviceexports
Total serviceimports
Regulationheterogeneityvariables
Heterogeneityin adminis -trative barriers tostart-up
(+) (+) (–) (–)
Heterogeneityin barriers tocompetition
(–)*** (–)*** (–) (–)
Heterogeneityin regulatoryopacity
(–) (–) (–)*** (–)***
Hetero geneityin state control
(+) (+) (+) (+)
Heterogeneityin trade andinvestmentbarriers
(–)*** (–)*** (+) (+)
Value added in servicesector,reporter
(+)***
64

Value added in servicesector, partner
(+)***
Wages,reporter
(–)***
Wages,partner
(–)***
Humancapital,reporter
(+)*** (+)***
Humancapital,partner
(+) (+)***
Transportinfrastructure,reporter
(+)***
Transportinfrastructure,partner
(+)***
Telecommuni -cationinfrastructure,reporter
(+)***
Telecommuni -cationinfra structure,partner
(+)***
Entry barriers,reporter
(–)
Entry barriers,partner
(–)
65
(Table continues on the following pages.)

Table 2.A.2. Results of Gravity Models (continued)
Variables
Walsh (2006), Hausman-Taylor estimation
Tharakan, Van Beveren, and Van Ourti
(2005)Lennon (2006), OLS estimation
Head, Mayer, and Reis (2009), OLS estimates with importer and exporter fixed effects
Total serviceimports
Travel service imports
Transport service imports
Government service imports
Commercial service imports
Software service exports
Total service exports
Commercial service exports
Total service trade
Othercommercial
service trade Finance
ITservicetrade
Miscellaneous business service
trade
GDP, reporter (+)*** (+)***
GDP, partner (+)*** (+)*** (+)***
Population, reporter (+) (+)* (–) (+) (+)
Population, partner (+) (–)*** (–)* (–) (+) (–)**
GDP per capita, reporter (+)*** (+)*** (+)* (+) (+)* (+)*** (+)***
GDP per capita, partner (+) (+) (+)* (+)** (+)* (+)*** (+)***
Distance (–) (+)* (+)** (–) (+) (+) (–)*** (–)*** (–)*** (–)*** (–)*** (–)*** (–)***
Distance � trend (+)*** (+)*** (+)** (+)*** (+)
Time zone difference (+) (+) (+)*** (+) (+)***
Remoteness, reporter
Remoteness, (–)partner
Adjacency (+) (+) (+)** (–) (+)
Regional trading agreement (+) (+) (+) (–) (+) (+)*** (+)
(EU ) (EU (EU
member- member- member-
ship) ship) ship)
66

Economic freedom, reporter (–) (+)
Economic freedom, partner (–) (+)
Language (+)*** (+)*** (+) (+) (+)** (+)*** (+)*** (+)*** (–)*** (–)** (–) (–)*** (–)***
(shared (shared (shared (shared (shared
langu- langu- langu- langu- langu-
age) age) age) age) age)
Nontariff barriers (–) (+) (+) (–) (+)
(transport (commercial
nontariff nontariff
barriers) barriers)
Temperature, reporter (–)
Temperature, partner (+)***
Government effectiveness, reporter (–)
Government effectiveness, partner (+)
Diaspora (+)***
(measured by
population of Indian origin in partner)
Contiguity (+)*** (+)***
At least one (+) (–) country landlocked
(Table continues on the following pages.)
67

Trust in reporter from partner (+)***
Corruption perceptions index, reporter (+)***
Corruption perceptions index, partner (+)***
Complexity of procedures, reporter (–)***
Complexity of procedures, partner (–)***
Colonial relationship (+)*** (+)*** (+)*** (+)*** (+)*** (+)***
Shared legal origins (+)*** (+)*** (+)*** (+)*** (+)***
Migration (+)***
(can be done
skillwise for
OECD countries)
Table 2.A.2. Results of Gravity Models (continued)
Variables
Walsh (2006), Hausman-Taylor estimation
Tharakan, Van Beveren, and Van Ourti
(2005)Lennon (2006), OLS estimation
Head, Mayer, and Reis (2009), OLS estimates with importer and exporter fixed effects
Total serviceimports
Travel service imports
Transport service imports
Government service imports
Commercial service imports
Software service exports
Total service exports
Commercial service exports
Total service trade
Othercommercial
service trade Finance
ITservicetrade
Miscellaneous business service
trade
68

Average years of education, reporter (+)***
Average years of education, partner (+)***
High education population, reporter (+)***
High education population, partner (+)***
Secondary education population, reporter (+)***
Secondary education population, partner (+)***
Primary education population, reporter (–)***
Primary education population, partner (–)***
Employment law rigidity index, reporter (–)***
Employment law rigidity index, partner (–)***
(Table continues on the following pages.)
69

Table 2.A.2. Results of Gravity Models (continued)
Variables
Walsh (2006), Hausman-Taylor estimation
Tharakan, Van Beveren, and Van Ourti
(2005)Lennon (2006), OLS estimation
Head, Mayer, and Reis (2009), OLS estimates with importer and exporter fixed effects
Total serviceimports
Travel service imports
Transport service imports
Government service imports
Commercial service imports
Software service exports
Total service exports
Commercial service exports
Total service trade
Othercommercial
service trade Finance
ITservicetrade
Miscellaneous business service
trade
Internet users, reporter (+)***
Internet users, partner (+)***
Personal computers, reporter (+)***
Personal computers, partner (+)***
Telephone mainlines, reporter (+)***
Telephone mainlines, partner (+)***
Internet hosts, reporter (+)***
Internet hosts, partner (+)***
Research and development expenditure (% of GDP), reporter (+)***
70

Research and development expenditure (% of GDP), partner (+)***
Regulation level (PMR), reporter
Regulation level (PMR), partner
Regulation heterogeneity variables
Heterogeneity in administrative barriers to start-up
Heterogeneity in barriers to competition
Heterogeneity in regulatory opacity
Heterogeneity in state control
Heterogeneity in trade and investment barriers
Value added in service sector, reporter
Value added in service sector, partner
Wages, reporter
Wages, partner
(Table continues on the following pages.)
71

Table 2.A.2. Results of Gravity Models (continued)
Variables
Walsh (2006), Hausman-Taylor estimation
Tharakan, Van Beveren, and Van Ourti
(2005)Lennon (2006), OLS estimation
Head, Mayer, and Reis (2009), OLS estimates with importer and exporter fixed effects
Total serviceimports
Travel service imports
Transport service imports
Government service imports
Commercial service imports
Software service exports
Total service exports
Commercial service exports
Total service trade
Othercommercial
service trade Finance
ITservicetrade
Miscellaneous business service
trade
Human capital, reporter
Human capital, partner
Transport infrastructure, reporter
Transport infrastructure, partner
Telecommunication infrastructure, reporter
Telecommunication infrastructure, partner
Entry barriers, reporter
Entry barriers, partner
Source: Authors’ calculations.*** = significant at the 1 percent level; ** = significant at the 5 percent level; * = significant at the 10 percent level.
72

Table 2.A.3. Definitions of Variables Used for Gravity Estimation
Variable Definition SourceService exports (balance ofpayments, current US$)
Services (previously nonfactor services) refer to the economic output of intangible commodities that may be produced, transferred, andconsumed simultaneously. International transactions in services are defined by the International Monetary Fund’s Balance of Payments Manual (IMF 1993), but definitions may vary among reporting economies.
World Bank’s World DevelopmentIndicators database
Population (total) Total population is based on the de facto definition of population, whichincludes all residents regardless of legal status or citizenship, except thatrefugees who are not permanently settled in the country of asylum aregenerally considered part of the population of their country of origin. The values shown are midyear estimates.
World Bank’s World DevelopmentIndicators database
Services, value added (current US$)
Services (previously nonfactor services) refer to the economic output ofintangible commodities that may be produced, transferred, and consumed simultaneously. International transactions in services are defined by IMF (1993), but definitions may vary among reportingeconomies.
World Bank’s World DevelopmentIndicators database
GDP (constant 2000 US$) GDP at purchasers’ prices is the sum of gross value added by all residentproducers in the economy plus any product taxes and minus any subsidies not included in the value of the products. It is calculated without making deductions for depreciation of fabricated assets or fordepletion and degradation of natural resources. Dollar figures for GDP are converted from domestic currencies using 2000 official exchangerates. For a few countries, where the official exchange rate does not reflect the rate effectively applied to actual foreign exchange transactions, an alternative conversion factor is used.
World Bank’s World DevelopmentIndicators database
(Table continues on the following page.)
73

Per capita income (constant 2000 US$)
GDP per capita is GDP divided by the midyear population. GDP is the sum of gross value added by all resident producers in the economy plusany product taxes and minus any subsidies not included in the value of the products. It is calculated without making deductions for depreciationof fabricated assets or for depletion and degradation of natural resources.
World Bank’s World DevelopmentIndicators database
FDI, net inflows (% of GDP) FDI is the net inflow of investment to acquire a lasting managementinterest (10% or more of voting stock) in an enterprise operating in aneconomy other than that of the investor. It is the sum of equity capital,reinvestment of earnings, other long-term capital, and short-term capitalas shown in the balance of payments. This series shows net inflows in thereporting economy and is divided by GDP.
World Bank’s World DevelopmentIndicators database
Internet users per 100 inhabitants
Internet users are people with access to the worldwide network. Thevariable Internet users per 100 inhabitants is obtained by dividing thenumber of Internet subscribers by the population and multiplying by 100.
International Telecommunication Union
School enrollment, tertiary(% of gross)
Gross enrollment ratio is the ratio of total enrollment, regardless of age, to the population of the age group that officially corresponds to the levelof education shown. Tertiary education, whether or not to an advancedresearch qualification, normally requires, as a minimum condition ofadmission, the successful completion of education at the secondary level.
World Bank’s World DevelopmentIndicators database
Bilateral service trade Bilateral service trade refers to trade in services between country pairs. UNSTATS
Bilateral goods trade Bilateral goods trade refers to trade in goods between country pairs. UNSTATS
Shared legal origins Five different legal origins exist: English, French, German, Scandinavian,and socialist. A dummy variable is created that takes the value 1 if bilateraltrading partners have the same legal origin and 0 otherwise.
Andrei Shleifer’s Data Sets webpage(http://www.economics.harvard.edu/faculty/shleifer/dataset)
Source: Authors’ compilation.
Table 2.A.3. Definitions of Variables Used for Gravity Estimation (continued)
Variable Definition Source
74

Service Exports 75
Notes
1. Marshall and others (1987) examined three regions in the United Kingdom and found that 80percent of services purchased by a local manufacturer are supplied by a firm located in the sameregion.
2. These studies were Freund and Weinhold (2002); Head, Mayer, and Ries (2009); Kimura andLee (2006); Lejour and de Paiva Verheijden (2004); Lennon (2006); Shingal (2010); and Tharakan, VanBeveren, and Van Ourti (2005).
3. The existing literature uses the database of the Organisation for Economic Co-operation andDevelopment to explore service trade determinants and does not really focus on developing coun-tries. This chapter uses the United Nations Statistical Division’s bilateral service trade database,which also covers the south-south trade dimension and therefore allows service exports from thedeveloping world to be better accounted for. The database reports bilateral service exports for2000–08 for 47 countries, of which 22 are nonrich countries that are not members of the Organisa-tion for Economic Co-operation and Development. Building on previous models, this chapter adoptsa unified approach to test for the relative importance of (a) human capital endowments, (b) elec-tronic infrastructure, and (c) institutions in determining services exports.
4. For theoretical foundations of the gravity model, see Anderson (1979), Bergstrand (1985, 1989),and Harrigan (2002).
5. These studies include Grünfeld and Moxnes (2003); Head, Mayer, and Ries (2009); Kimura andLee (2006); Kox and Lejour (2005); Lejour and de Paiva Verheijden (2004); Lennon (2006); Mirza andNicoletti (2004); and Walsh (2006). Another valuable contribution to the literature is made byTharakan, Van Beveren, and Van Ourti (2005), who built a gravity model of India’s bilateral softwareservice exports. They use a unique data set from NASSCOM (the apex industry body managing India’scomputer and business service exporting firms). Freund and Weinhold (2002) use U.S. bilateral tradedata to assess the importance of electronic infrastructure in service exports.
6. In general, infrastructure in the text refers to electronic infrastructure unless otherwise specified.7. Between 1985 and 2003, undergraduate engineering baccalaureate capacity increased from
about 45,000 (59 per million) to about 440,000 (405 per million), even as the total populationincreased from 765 million to 1,086 million. The number of engineering colleges in India increasedfrom 246 in 1987 to 353 in 1995 to more than 1,100 in 2003. Software exports were also growing
Table 2.A.4. Partial Correlation of Variables on Electronic Infrastructure
Variable
Broadbandsubscribers
per 100persons
Internetbandwidth,
bits perperson
Internetusers
per 100persons
Mobileusers
per 100persons
Telephoneusers
per 100persons
Broadbandsubscribers per 100 persons 1.0000
Internet bandwidth,bits per person 0.7176 1.0000
Internet users per 100 persons 0.8278 0.6100 1.0000
Mobile users per 100 persons 0.6917 0.4784 0.8465 1.0000
Telephone users per 100 persons 0.4786 0.3835 0.5263 0.4408 1.0000
Source: Authors’ compilation based on World Development Indicators database.

76 Exporting Services
rapidly during this period; therefore, software exports and engineering education capacity appearclosely associated.
8. The O-ring theory of economic development is a model of economic development that pro-poses that tasks of production must be executed proficiently together for any of them to be of highvalue.
9. Lennon, Mirza, and Nicoletti (2009) use this theory to test their analytical framework of the O-ring theory using a specific industry data set on air passenger international transportation and find theresults to be consistent with their theoretical framework—that is, policy and nonpolicy factors thataffect the use of inputs in both the exporting and the importing countries have a symmetric effect onthe bilateral flow of services between those countries.
10. Focusing on service trade of 20 high-income OECD countries with 27 of their partners for1999 and 2000, Mirza and Nicoletti (2004) contribute methodologically to gravity literature by esti-mating the gravity model through seemingly unrelated regression (SUR) and three-stage least squarestechniques, thereby dealing with the multicollinearity problem in a three-dimensional panel. SURconsists of several regression equations, each having its own dependent variable and potentially differ-ent sets of exogenous explanatory variables. Each equation is a valid linear regression on its own andcan be estimated separately; however, the error terms are assumed to be correlated across the equa-tions, and therefore a generalized least squares method is recommended. Three-stage least squares is atechnique that combines two-stage least squares with SUR.
11. Cattaneo and others’ (2010) case studies also indicate that trade agreements for liberalizing themarket, bilateral labor agreements for movement of natural persons, and partnerships with interna-tional suppliers can be critical in promoting service exports.
12. However, for services that require regular interaction and coordination for delivery, being inthe same time zone may be helpful. Thus, the effect of distance on service trade is not straightforward.
13. In the next section, the findings of service trade research with respect to distance are discussed. 14. See Santos Silva and Tenreyro (2006) for details about the PPML technique. 15. If foreign investment uses a capital-intensive production technique in a labor-rich country, it
leaves the country’s vast resources underused and may also inhibit the country’s ability to take advan-tage of foreign technology.
16. Easterly (2002) evaluated the case where Daewoo trained 130 workers of a Bangladesh-basedgarment firm, Desh, under a collaborative agreement in 1979. During the 1980s, of the 130Bangladeshi workers initially trained by Daewoo, 115 had left Desh to set up their own garment exportfirms. Similar cases for the success of Indonesian plywood or Colombian flower exports are discussedin Rhee and Bélot (1990).
17. See Enos, Kehrhahn, and Bell (2003) for a recent study and survey of the managerial studiesevidence.
18. This work is referred to as illustrative because it does not deal with endogeneity of variablesrelating to electronic infrastructure, education, or institutions. For instance, the causality from Inter-net penetration to service exports could run in the reverse direction as well where higher trade in serv-ices leads firms to adopt better telecommunication technology that facilitates trade in services. Similaris the case of human capital and skill usage for service exports.
19. Annex table 2.A.3 provides details on data sources used in this chapter. 20. UNSTATS does not have bilateral service trade data for Mexico, New Zealand, and Turkey;
however, these data are available in the OECD database.21. The UNSTATS data come very close to the OECD data (the correlation between them is nearly
0.9) for the countries reported by both sources. Because this book’s focus is on developing countries,this chapter uses the UNSTATS database.
22. Mirrored flows were used when data on exports from the reporter were missing but data onimports from the trade partner were given.
23. The state of electronic infrastructure in a country can be gauged by variables such as tele-phone lines per 100 persons, number of Internet users per 100 persons or the use of computers per100 persons, bandwidth of Internet connection, and number of mobile subscribers per 100 persons.

Service Exports 77
The correlation between these alternative measures of electronic infrastructure is given in annex table2.A.4. As can be seen from the table, most of these variables have a high correlation with each other.Therefore this estimate chooses to use the most commonly used variable—that is, Internet penetrationper 100 persons—as a measure of the quality of electronic infrastructure. For human capital, severalvariables measure the quality or the relative availability of human skills in a country. These variablesinclude tertiary school enrollment, average years of schooling, percentage of population with tertiaryeducation, and average years of tertiary schooling attained. All these variables except tertiary schoolenrollment can be obtained from Barro and Lee (2010).
24. Five different legal origins exist: English, French, German, Scandinavian, and socialist. 25. The negative effect of distance on service trade is confirmed in several studies using different
time periods and different estimation methodologies, as was discussed in the previous section. 26. The effect on disaggregate services, such as transport or government services, is, however,
insignificant. 27. The percentage of the population that has completed tertiary education was also tried as a
measure of human capital. The results were qualitatively similar, but the effect of this variable onservice exports was much higher (more than 40 percent). Various lags of tertiary schooling enroll-ment percentage were also tried as a measure of human capital on the assumption that tertiaryschooling enrollment can affect service exports only after the passage of some years (Amin and Mat-too 2008). However, they were not found to be significant in affecting service exports in the OLSmethodology.
28. This result is typical of gravity models such as those of Kimura and Lee (2006) and Lennon(2006). This chapter’s model has, however, a weak result because service exports can simultaneouslyaffect bilateral goods exports, as found in Nordås (2008).
29. High-income countries are excluded from the exporters but are retained as importers. Asbefore, the country fixed effects are used for both the partner and the reporter countries.
30. Similarly, development institutions in Chile and Malaysia have helped their countries advanceservice exports. The Corporación de Fomento de la Producción de Chile (Production DevelopmentCorporation), Chile’s economic development agency, partnered with management schools in theUnited States to undertake market research and establish contacts with key organizations such as theAmerican Electronics Association and the San Jose Business Incubator. Malaysia set up an Interna-tional Advisory Committee for its Multimedia Super Corridor to facilitate engagement with leadingglobal players.
References
Acemoglu, Daron, Simon Johnson, and James A. Robinson. 2000. “The Colonial Origins of Compara-tive Development: An Empirical Investigation.” NBER Working Paper 7771, National Bureau ofEconomic Research, Cambridge, MA.
Amin, Mohammad, and Aaditya Mattoo. 2008. “Human Capital and the Changing Structure of theIndian Economy.” Policy Research Working Paper 4576, World Bank, Washington, DC.
Anderson, James E. 1979. “A Theoretical Foundation for the Gravity Equation.” American EconomicReview 69 (1): 106–16.
Anderson, James E., and Eric van Wincoop. 2003. “Gravity with Gravitas: A Solution to the BorderPuzzle.” American Economic Review 93 (1): 170–92.
Arora, Ashish, and Suma Athreye. 2002. “The Software Industry and India’s Economic Development.”Information Economics and Policy 14 (2): 253–73.
Arora, Ashish, and Surendrakumar Bagde. 2010. “Human Capital and the Indian Software Industry.”NBER Working Paper 16167, National Bureau of Economic Research, Cambridge, MA.
Barro, Robert J., and Jong-Wha Lee. 2010. “A New Data Set of Educational Attainment in theWorld: 1950–2010.” NBER Working Paper 15902, National Bureau of Economic Research,Cambridge, MA.

78 Exporting Services
Bergstrand, Jeffrey. 1985. “The Gravity Equation in International Trade: Some Microeconomic Foun-dations and Empirical Evidence.” Review of Economics and Statistics 67 (3): 474–81.
———. 1989. “The Generalized Gravity Equation, Monopolistic Competition, and the Factor-Propor-tions Theory in International Trade.” Review of Economics and Statistics 71 (1): 143–53.
Blomström, Magnus, and Ari Kokko. 1998. “Multinational Corporations and Spillovers.” Journal ofEconomic Surveys 12 (3): 247–77.
———. 2003. “Human Capital and Inward FDI.” CEPR Discussion Paper 3762, Centre for EconomicPolicy Research, London.
Borzenstein, Eduardo, José De Gregorio, and Jong-Wha Lee. 1998. “How Does Foreign Direct Invest-ment Affect Economic Growth?” Journal of International Economics 45 (1): 115–35.
Cattaneo, Olivier, Michael Engman, Sebastián Sáez, and Robert M. Stern, eds. 2010. InternationalTrade in Services: New Trends and Opportunities for Developing Countries. Washington, DC:World Bank.
Deardorff, Alan V., and Robert M. Stern. 2008. “Empirical Analysis of Barriers to International ServicesTransactions and the Consequences of Liberalization.” In A Handbook of International Trade inServices, ed. Aaditya Mattoo, Robert M. Stern, and Gianni Zanini, 169–220. New York: Oxford Uni-versity Press.
Easterly, William. 2002. The Elusive Quest for Growth: Economists’ Adventures and Misadventures in theTropics. Cambridge, MA: MIT Press.
Enos, Michael, Marijke Thamm Kehrhahn, and Alexandra Bell. 2003. Informal Learning and theTransfer of Learning: How Managers Develop Proficiency. Human Resources Development Quar-terly 14 (4): 369–87.
Francois, Joseph, and Bernard Hoekman. 2010. “Services Trade and Policy.” Journal of Economic Liter-ature 48 (3): 642–92.
Freund, Caroline, and Diana Weinhold. 2002. “The Internet and International Trade in Services.”American Economic Review 92 (2): 236–40.
Ghani, Ejaz, ed. 2010. The Service Revolution in South Asia. New York: Oxford University Press.Gibbs, J. Murray. 1986. “Services, Development, and TNCs.” CTC Reporter 21 (Spring): 51–53.Gregory, Neil, Stanley Nollen, and Stoyan Tenev. 2009. New Industries from New Places: The Emergence
of the Hardware and Software Industries in China and India. Washington, DC: World Bank.Grünfeld, Leo A., and Andreas Moxnes. 2003. “The Intangible Globalization: Explaining the Patterns
of International Trade in Services.” Discussion Paper 657, Norwegian Institute of InternationalAffairs, Oslo.
Harrigan, James. 2002. “Specialization and the Volume of Trade: Do the Data Obey the Laws?” NBERWorking Paper 8675, National Bureau of Economic Research, Cambridge, MA.
Head, Keith, Thierry Mayer, and John Ries. 2009. “How Remote Is the Offshoring Threat?” EuropeanEconomic Review 53 (4): 429–44.
IMF (International Monetary Fund). 1993. Balance of Payments Manual. Washington, DC: IMF.Jensen, J. Bradford. 2008. “Trade in High-Tech Services.” Journal of Industry, Competition, and Trade
8 (3–4): 181–97.Karsenty, Guy. 2000. “Assessing Trade in Services by Mode of Supply.” In GATS 2000: New Directions in
Services Trade Liberalization, ed. Pierre Sauvé and Robert Stern, 33–56. Cambridge, MA: HarvardUniversity Center for Business; Washington, DC: Brookings Institution Press.
Kimura, Fukunari, and Hyun-Hoon Lee. 2006. “The Gravity Equation in International Trade in Serv-ices.” Review of World Economics 142 (1): 92–121.
Kox, Henk, and Arjan Lejour. 2005. “Regulatory Heterogeneity as Obstacle for International ServicesTrade.” CPB Discussion Paper 49, CPB Netherlands Bureau for Economic Policy Analysis, TheHague.
Lakha, Salim. 1994. “The New International Division of Labor and the Indian Computer SoftwareIndustry.” Modern Asian Studies 28 (2): 381–408.
Lall, Sanjaya. 1999. “Competing with Labour: Skills and Technology in Developing Countries.” Issuesin Development Working Paper 31, International Labour Organization, Geneva.

Service Exports 79
Leamer, Edward. 2007. “A Flat World, a Level Playing Field, a Small World after All, or None of theAbove?” Journal of Economic Literature 45 (1): 83–126.
Lejour, Arjan, and Jan-Willem de Paiva Verheijden. 2004. “Services Trade within Canada and the Euro-pean Union: What Do They Have in Common?” CPB Discussion Paper 42, CPB NetherlandsBureau for Economic Policy Analysis, The Hague.
Lennon, Carolina. 2006. “Trade in Services and Trade in Goods: Differences and Complementarities.”Paper presented at the Eighth Annual Conference of the European Trade Study Group, Vienna,Austria, September 7–9.
Lennon, Carolina, Daniel Mirza, and Giuseppe Nicoletti. 2009. “Complementarity of Inputs acrossCountries in Services Trade.” Annals of Economics and Statistics 93–94: 183–206.
Marshall, J. Neill, Peter Wood, Peter Daniels, and Alan McKinnon. 1987. “Producer Services andUneven Development.” Area 19 (1): 35–41.
Mélitz, Jacques. 2008. “Language and Foreign Trade.” European Economic Review 52 (4): 667–99.Mirza, Daniel, and Giuseppe Nicoletti. 2004. “What Is So Special about Trade in Services?” Research
Paper 2004/02, Leverhulme Centre for Research on Globalisation and Economic Policy, Universityof Nottingham, Nottingham, U.K.
Moreira, Sérvulo Vicente, Patrick Franco Alves, and Luis Cláudio Kubota. 2006. “Firmas de ServiçosExportadoras: Um Estudo sobre Setores Selecionados.” In Estrutura e Dinâmica do Setor de Serviçosno Brasil, ed. João Alberto de Negri e Luis Cláudio Kubota, 231–58. Brasília: Instituto de PesquisaEconômica Aplicada.
Nordås, Hildegunn K. 2008. “The Impact of Services Trade Liberalisation on Trade in Non-agriculturalProducts.” OECD Trade Policy Working Paper 81, Organisation for Economic Co-operation andDevelopment, Paris.
Nusbaumer, Jacques. 1987. Services in the Global Market. Amsterdam: Kluwer Academic Publishers.Nyahoho, Emmanuel. 2010. “Determinants of Comparative Advantage in the International Trade
of Services: An Empirical Study of the Hecksher-Ohlin Approach.” Global Economy Journal 10(1): 1–22.
Rhee, Yung, and Thérèse Bélot. 1990. “Export Catalysts in Low-Income Countries: A Review of ElevenSuccess Stories.” Discussion Paper 72, World Bank, Washington, DC.
Rose, Andrew K. 2000. “One Money, One Market: The Effect of Common Currencies on Trade.” Eco-nomic Policy 15 (30): 9–45.
Santos Silva, João, and Silvana Tenreyro. 2006. “The Log of Gravity.” Review of Economics and Statistics88 (4): 641–58.
Saxenian, AnnaLee. 1999. Silicon Valley’s New Immigrant Entrepreneurs. San Francisco, CA: Public Pol-icy Institute of California.
———. 2000. “Back to India.” Wall Street Journal: Technology Journal Asia, January 24.———. 2004. “The Bangalore Boom: From Brain Drain to Brain Circulation.” In IT Experience in
India: Bridging the Digital Divide, ed. Kenneth Keniston and Deepak Kumar, 169–81. NewDelhi: Sage.
Shingal, Anirudh. 2010. “How Much Do Agreements Matter for Services Trade?” Paper prepared forthe World Trade Organization Public Forum, Geneva, September 17.
Sudan, Randeep, Seth Ayers, Philippe Dongier, Arturo Muente-Kunigami, and Christine Zhen-WeiQiang. 2010. The Global Opportunity in IT-Based Services: Assessing and Enhancing Country Com-petitiveness. Washington, DC: World Bank.
Tharakan, P. K. M., Ilke Van Beveren, and Tom Van Ourti. 2005. “Determinants of India’s SoftwareExports and Goods Exports.” Review of Economics and Statistics 87 (4): 776–80.
UNCTAD (United Nations Conference on Trade and Development). 1999. World Investment Report1999: Foreign Direct Investment and the Challenge of Development. Geneva: United Nations.
———. 2005. “Are Developing Countries Exporting Services?” United Nations, Geneva. Walsh, Keith. 2006. “Trade in Services: Does Gravity Hold? A Gravity Model Approach to Estimating
Barriers to Services Trade.” IIIS Discussion Paper 183, Institute for International Integration Stud-ies, Trinity College, Dublin.


Following liberalization in 1991, the Indian economy grew rapidly, with the servicesector leading the way. The share of service value added in gross domestic product(GDP) increased from 44 percent in 1990 to 55 percent in 2009. Service exportsgrew even faster, and their share in service value added increased from 3.6 percentin 1990 to 17.0 percent in 2009 (their share in GDP increased from 1.4 percent to8.6 percent). India’s experience differs from the typical development of othercountries because services, rather than manufacturing, are playing the leading role.This chapter first examines the evolution of the service sector in India. It thenfocuses on India’s service exports and the reasons for the country’s dynamism.The chapter addresses, in particular, the anomaly of a country exporting skill-intensive services although its comparative advantage is in low-skilled products.
Technology has played a critical role in the growth of India’s service exports.Advances in information and communication technology not only have made itpossible to trade services that were historically regarded as nontradable, but alsohave made distance and delivery costs virtually irrelevant for some services.Therefore, a country such as India, which is thousands of miles away fromNorth America, is still able to deliver services to the United States as efficientlyas a U.S. border country. In fact, the distance between India and the UnitedStates may even encourage greater service trade because the time differenceallows for round-the-clock service provision.
81
3
A Cross-CountryAnalysis of
Service Exports: Lessons from India
Arti Grover Goswami, Poonam Gupta, and Aaditya Mattoo

Beyond technology, this chapter explores, in particular, the role of four fac-tors: human capital, electronic infrastructure, service-related institutions, andservice policy. Because many of the business services that India exports are skillintensive, services normally originate in countries that are relatively wellendowed with human capital. Furthermore, because electronic delivery hasmade these services tradable, the scope for such trade must be related to theavailability of the relevant electronic infrastructure. Institutions play a key rolein the development of service sectors. Because many services are invisible andintangible, regulatory institutions are needed to correct asymmetries of infor-mation between consumers and providers, thereby mitigating the risk of mar-ket failure. Because services are frequently customized and require providersand consumers to make relationship-specific investments, contract-enforcinginstitutions are also needed. Finally, policy-making institutions matter in termsof openness (for example, openness to foreign investment that brings technol-ogy, management, and exporting knowledge) and, perhaps, in terms of proac-tive export promotion (for example, through fiscal incentives and dedicatedfacilities).
India has clearly made progress along each of these dimensions, especiallycompared to other low-income countries. Its prolonged flirtation with import-substituting industrialization increased domestic capacity for high-quality techni-cal and tertiary education. The growth has been sustained: the share of tertiaryschool enrollment rose from 6 percent of total school enrollment in 1990 to12 percent in 2006, while tertiary school enrollment improved only marginally forother low-income countries (from 5 percent in 1990 to 7 percent in 2006). Simi-larly, as a rough measure of electronic infrastructure, Internet penetration per100 inhabitants increased from 0.0001 in 1996 to 7.20 in 2007, while it increasedfrom 0.01 to 3.70 for other low-income countries during the same period. ThoughIndia’s courts are clogged and there are signs of serious regulatory corruption (inthe allocating spectrum, for example), India still compares favorably with otherlow-income countries in terms of its institutions. Also, in terms of policy, Indiahas been atypically open to foreign investment in information technology (IT)and business services and was one of the few developing countries that signed theWorld Trade Organization’s Information Technology Agreement, which elimi-nated tariffs on IT products.
What is puzzling is that, notwithstanding favorable comparisons with the pastand with other low-income countries across each dimension, India still comparespoorly with a number of other countries that have similar advantages but fewerdisadvantages. Why is India such a dynamic exporter of services while these othercountries are not? For example, contract enforcement in India requires, on aver-age, 46 procedures and 1,420 days. This requirement is much higher than that of
82 Exporting Services

A Cross-Country Analysis of Service Exports 83
Eastern European countries such as Romania, where enforcing contracts requires32 procedures and 537 days, or in other Asian countries such as the Philippines(which showed early, but unfulfilled, promise in service trade), where 37 proce-dures and 842 days are required.
A possible solution to the puzzle may lie in the fact that along each of thesedimensions the service sector in India has been favored relative to the manufac-turing sector. Although the market for skilled labor is fairly flexible, the marketfor low-skilled manufacturing labor is rigid because of regulations and union-ization. Telecommunication networks have grown and improved rapidly, butthe infrastructure required for delivering goods (such as roads and ports) isbeing developed much more slowly in India than in East Asia, for instance.Although service-related regulatory institutions—from telecommunications tofinance—have a reputation of being competent and having integrity, the institu-tions affecting goods trade—from customs to export processing zones—have areputation for being plagued by inefficiency and corruption. Even in terms ofpolicy, liberalization of goods trade has been grudging and slow, but withrespect to the most trade-related services (IT and business) and the most service-related goods (computers), India has embraced openness more rapidly thanBrazil, for instance.
This chapter is organized in the following manner. The first section that fol-lows describes the evolution of the service sector in India as a backdrop for theemergence of service exports. Research suggests that India was not an outlier interms of the size of its service sector relative to other countries; however, Indiacaught up with developed countries in the 2000s. Most of this incremental serv-ice output originates from growth in modern services and not in traditionalservices such as transport and travel. Research shows that the increased tradabil-ity of certain modern services, such as other business services or computer andinformation services in the late 1990s, as well as India’s liberalization reforms,explains the rise in the modern service sector. It also confirms that more thanjust positive factors explain service sector growth; relative to services, the poorquality of infrastructure and restrictive labor market regulations inhibitedgrowth in manufacturing.
The chapter delves deeper into the characteristics of service exports fromIndia in the second section. This section identifies that India’s growth in service value added and exports is linked to exports of other commercial serv-ices (OCSs). Within OCSs, growth in exports of computer and informationservices, as well as in exports of other business services, distinguishes Indiafrom other countries. Most of such service exports from India are destined forthe developed-country markets of Europe, the United Kingdom, and theUnited States.

The third section presents an empirical model to estimate the influence ofvarious drivers of service exports from India using cross-country data. Theresults suggest that, although factors such as human capital, telecommunicationinfrastructure, and institutions are critical to explaining a country’s serviceexports, these factors alone cannot explain the amount of India’s OCS exports.
Because a large part of India’s service exports remains unexplained economet-rically, the fourth section evaluates the role of specific policy and other factorsthat drive India’s service exports. This section discusses the country’s importpolicy in intermediate goods and intellectual property protection, the role ofthe National Association of Software and Services Companies (NASSCOM), theincentive schemes, the establishment of software technology parks, and the inter-play between the Indian diaspora and exports. Because there are no systematicand objective data available on these factors, this information cannot quantifythe way the factors affect India’s service exports. The final section describespolicy lessons.
The Growth of Services in India from an International Perspective
Services have played an important role in the Indian growth story, contributingnearly two-thirds to the growth of GDP in recent years, and this contribution hasincreased over time.1 Within the service sector, tradable and modern services havegrown at the fastest pace, and, over time, the share of exports in service valueadded has increased. Thus, exports of services appear to have played an importantpart in India’s recent growth.
This section first documents the growth of services in India and places it in aninternational perspective. It then analyzes the factors that explain the growth ofservices in India using variation across Indian states. Finally, the section charac-terizes the services that have grown the fastest.
Sectoral shares and growth rates
Figure 3.1 displays agriculture, industry, and services as a share of India’s GDPduring the postindependence period (1950–2010).2 The share of the service sec-tor increased from 30 percent of GDP in 1950/51 to 57 percent in 2008/09, andthe pace accelerated as the period progressed. The rise of industry, in contrast,has been less eventful in recent years. The share of manufacturing rose rapidly inthe first 15 postindependence years, reflecting the country’s emphasis on heavyindustry, but the share rose more modestly from the mid-1960s to the early1990s. Following a small increase at the outset of the 1990s, which reflected a
84 Exporting Services

wave of liberalization, industry’s share then stagnated. The share of agriculturehas declined steadily over time. Figure 3.2 shows the average growth rates of agri-culture, services, and manufacturing and industry over the same period. Itshows even more clearly that the growth rate of services has accelerated whilethat of agriculture has declined.3
Eichengreen and Gupta (2009) estimate the relationship between the share ofservices in GDP and per capita income as a quartic polynomial in log per capitaincome using data for some 80 countries for the 1950–2006 period.4 They showthat the service sector grows in two waves (see figure 3.3). In the first wave its shareof output rises at modest incomes but at a decelerating pace as growth proceeds,leveling out at a per capita income of US$1,800 U.S. purchasing-power-parity dol-lars for 2000. In the second wave, the share of the service sector begins climbingagain at a per capita income of roughly US$4,000 before eventually leveling offagain. The evidence also shows that the second wave starts at lower incomes after1990 than in earlier years.5
Comparing India against these cross-country relationships shows that theIndian service sector was stunted all through the 1950–90 period, with the gapwidening after 1960. Although the share of services rose rapidly starting in the1980s, India continued to lag the international norm. After 1990, there is rapid
A Cross-Country Analysis of Service Exports 85
Figure 3.1. Agriculture, Industry, and Services as a Share of India’s GDP, 1950–2010
Source: Data from the Central Statistical Organization.
0
10
20
30
40
50
60
1950
1960
1970
1980
1990
2000
2010
shar
e of
GD
P (%
)
agriculture industry services

convergence to the predicted values. As of 2005, India’s service sector shareincreased to a level significantly above that predicted by the international cross-section for a country with India’s level of per capita income.
The service share in India has two significant features. First is the size of theservice share relative to GDP, and second is the growth rate of the sector. Interms of size, India remained at or below the level predicted by cross-countrydata until a few years ago; hence, it has not been an outlier for most of the1950–2006 period. However, the pace of the sector’s growth has been muchhigher than the pace estimated for the sample. Thus, the relevant question toask is, how did the Indian service share catch up to the cross-country datanorms so fast?
Figure 3.4 is the analogous relationship for industry.6 It shows that the shareof industry rises rapidly at low incomes, peaking around 40 percent of GDP andat an income level of US$8,000 (in U.S. purchasing-power-parity dollars for2000). The figure also shows that the share of the industrial sector tends to peakat a lower level of per capita income. The observations for India suggest thatuntil the mid-1990s the industrial sector was larger than the international norm.
86 Exporting Services
Figure 3.2. Average Annual Growth Rates in India, by Sector, 1951–2009
Source: Data from the Central Statistical Organization.
0
1
2
3
4
5
6
7
8
9
10
1951
–80
1981
–90
1991
–200
0
2001
–09
grow
th r
ate
(%)
agriculture industry services

Figure 3.3. Service Sector’s Share of India’s GDP and Log Per Capita Income, by Sector, 1950–2006
Sources: Eichengreen and Gupta 2009, 2010. Note: The estimated relationship is based on regressions of the share of services in GDP on a quartic polynomial in log per capita income and country fixed effects. The regressions allow for a different intercept in the three periods indicated and for different slope parameters for the 1990–2006 period.
c. 1990–2006
20
40
60
80
6 7 8 9 10
shar
e of
GD
P (%
)
log per capita income
20
40
60
80
6 7 8 9 10
a. 1950–69
shar
e of
GD
P (%
)
log per capita income
20
40
60
80
6 7 8 9 10
b. 1970–89
shar
e of
GD
P (%
)
log per capita income
linear prediction
India
two–standard deviation band
87

Figure 3.4. Manufacturing Sector’s Share of GDP and Per Capita Income, 1950–2006
Source: Eichengreen and Gupta 2010.Note: The estimated relationship is based on regressions of the share of manufacturing in GDP on a cubic polynomial in log per capita income and country fixedeffects. The regressions allow for a different intercept in the three periods indicated and for different slope parameters for the 1990–2006 period.
10
20
30
40
6 7 8 9 10
c. 1990–2006
shar
e of
GD
P (%
)
log per capita income
10
20
30
40
6 7 8 9 10
a. 1950–69
shar
e of
GD
P (%
)
log per capita income
10
20
30
40
6 7 8 9 10
b. 1970–89
shar
e of
GD
P (%
)
log per capita income
linear prediction
India
two–standard deviation band
88

Since then, the pace of industry growth has been the same as that of overallGDP, thus keeping the share of industry stagnant.
Where is service growth concentrated in India?
Some observers have worried that the growth of services in India is concentratedin the informal sector, in personal services, and in public administration—activities with little scope for productivity improvement and with limitedspillovers.
Eichengreen and Gupta (2009, 2010) look at the trends in various services in asample of Organisation for Economic Co-operation and Development countriesduring the 1970–2005 period, and they place the Indian experience in that con-text. They divide services into three groups. Group 1 includes traditional servicessuch as retail and wholesale trade, transport and storage, public administration,and defense. Its share in GDP tapers at the middle- and high-income levels. Group2 includes a hybrid of traditional and modern services consumed mainly byhouseholds, such as education, health, and social work; hotels and restaurants;and other community, social, and personal services. Its share increases linearlywith per capita income. Group 3 includes modern services consumed by house-holds and companies, such as financial intermediation, computer and businessservices, communications, and legal and technical services. Its share increases at afaster rate as the per capita income increases. Eichengreen and Gupta show that,for India, the shares of group 1 and group 2 services are as predicted in the cross-country data, but the share of value added in group 3 services increases at a muchfaster rate in India than in other countries.
The fastest-growing services in India are business, communication, andbanking, all of which belong to group 3. Business services include computer-related services, machinery rental, accounting, legal services, technical services,and research. The computer service sector constituted about 80 percent ofbusiness services in 2008/09, and it is the fastest-growing sector. Financial serv-ices include insurance and banking, which is the largest and fastest-growingsector. Other rapidly growing sectors include hotels, restaurants, education, andhealth (all of which are group 2 services), as well as trade and transport (group 1services). The transport sector includes road, railway, air, and water transport. Themost dynamic of these sectors is road transport, which has increased sixfold since1991. The rapid growth of trade and transport, which are placed in group 1 on thebasis of the experience of other countries, is presumably an effect of post-1991reforms. The stagnant service sectors in India have been public administrationand defense (the growth of which seems to have leveled off) and miscellaneousother personal services.
A Cross-Country Analysis of Service Exports 89

Figure 3.5 shows that the share of group 1 services stagnated following an earlyperiod of rapid growth. The share of group 2 services continued growing steadily,while that of group 3 has accelerated since 1990. Thus, overall, India has beenmoving toward high-tech services.
Some observers have dismissed the growth of modern services in India onthe grounds that these activities are small as a percentage of GDP and, there-fore, can contribute only modestly to the growth of GDP. However this critiqueis incorrect. The contribution of various services to GDP growth can be calcu-lated by multiplying the share of each service sector in GDP by the service sector’sgrowth rate. Such calculations indicate that the contribution of communica-tion, business services, financial services, education, health, and hotels andrestaurants has increased over time to more than 4 percent of service growth(roughly half of total growth) from 2000 to 2008.7 These activities alone canexplain most of the acceleration in service sector growth. The contribution oftrade, transport, and public administration and defense to service growth hasremained stable at 3.5 percent since the 1980s, indicating that these activitieshave not played a role in service growth acceleration.
90 Exporting Services
Figure 3.5. Service Activities in Groups 1, 2, and 3 as a Share of GDP, 1950–2008
Source: Data from the Central Statistical Organization. Note: Group 1 includes public administration and defense, as well as trade and transport; group 2includes education, health, and hotels; and group 3 includes communication, financial services, andbusiness services. Other personal and social services are excluded from group 2.
0
5
10
15
20
25
30
1950
1960
1970
1980
1990
2000
2008
shar
e of
GD
P (%
)
group 1 group 2 group 3

What factors can explain the growth of services in India?
Next, the proximate factors behind the growth in value added in services inIndia are analyzed. Using the annual service growth data of various services for1980–2007, one may estimate the following equation:
Growthit = a (SizeEU KLEMS, initial – Sizeind, –1t) + b PCYt
+ Tradability servicesi + l Skilled labori
+ r Liberalizationi + t Correlation with indi + eit. (3.1)
The dependent variable is the growth in value added of service i in year t. Thefirst explanatory variable is the difference between service i as a percentage ofGDP in other countries and service i as a percentage of GDP in India.8 This vari-able captures catch-up. For instance, if the initial share is unusually small, theservice activity is likely to grow unusually rapidly, all other things being equal.Other explanatory variables include per capita income, tradability of the service inquestion, skilled-labor intensity, whether the sector has been liberalized, andwhether growth of the activity in question is correlated with industrial growth (asa proxy for outsource capability).9
Results are in table 3.1. They suggest that the growth is higher for services thathave an unusually small share to begin with, measured against their share in the
A Cross-Country Analysis of Service Exports 91
Table 3.1. Explaining Service Growth in India, 1980–2007 Dependent variable: growth in value added of different services
(1) (2) (3) (4) (5) (6)
Size gap 0.31(1.48)
0.35**(1.98)
0.48**(2.46)
0.12(0.54)
0.10(0.27)
Log per capita income
6.56***(6.17)
6.62***(7.78)
6.80***(8.03)
6.30***(7.51)
6.27***(7.20)
6.12***(7.42)
Tradable (dummy variable)
5.59***(7.85)
5.62***(7.94)
4.40***(5.28)
4.28**(2.48)
3.95***(3.84)
Skilled labor intensity
–0.05**(2.05)
–0.01(0.45)
–0.01(0.32)
–0.01(0.34)
Liberalization (index)
3.14**(2.57)
3.25*(1.71)
3.69***(3.44)
Correlated withindustrial growth(dummy variable
–0.16(0.09)
–0.47(0.45)
Observations 252 252 252 252 252 252
R2 0.13 0.36 0.37 0.39 0.39 0.39
Source: Authors’ calculations. Note: Regression equation estimated is in equation 3.1. Robust t-statistics are in parentheses. * = significant at the 1 percent level; ** = significant at the 5 percent level; *** = significant at the 10 percent level.

advanced countries, which is consistent with the catch-up argument. For every1.0 percent of GDP that the service share is lagging, growth is 0.4 percenthigher. Tradable services and service sector activities that have been liberalizedhave grown faster, all other things being equal. Tradable services have grown by4 percent a year, and liberalized sectors have grown by 3 percent a year.10
The difference between service sector growth and industrial sector growthremains somewhat puzzling. If the service and industrial sectors operate underthe same broad regulatory framework in India, and with generally the same infra-structure, then why has the service sector been able to overcome these barrierswhile the industrial sector struggled?11
There can be two reasons for the difference. First, the service sector does notface the same regulations (including the labor laws) as the industrial sector. Sec-ond, services do not rely on infrastructure as much as industries do. Perhaps bothexplanations are correct. Gupta and Kumar (2010) use the state-level variation inthe shares of services and industry and in the regulatory framework and infra-structure to examine if these factors are associated with the shares of services andindustry in the domestic product of the states. They estimate the following regres-sion for the period 1980–2005:
(Services/SDP)jt = a (Services/SDP)j1980 + b(LogPerCapitaNSDP)jt – 5
+ g (LogPopulation)jt – 5 +d(LiteracyRate)jt – 5
+ l(PhysicalInfra)j + c (LaborMarketRegulation)j
+ j (ProductMarketRegulation)j + YearFE + ejt. (3.2)
Results are shown in table 3.2. The dependent variable in the equation is theshare of the service sector in the net state domestic product (SDP) of state j attime period t. Among the variables included as explanatory variables is the initialshare of services in SDP of the respective states in 1980 (Services/SDP)j1980. Thisvariable also serves to capture initial conditions and state-specific features. Othervariables include the lag of the log per capita income (as measured by net SDPper capita), lag of the total population of the state, and lag of the literacy rate.Measures of the state’s physical infrastructure, labor market regulation, andproduct market regulation are also included; all three of these variables are timeinvariant. The specification in equation 3.2 is estimated using ordinary leastsquares for the years 1980, 1985, 1990, 1995, 2000, and 2005, and all regressionsinclude year fixed effects.
The analysis starts with a very parsimonious specification and then adds morestate features to examine what influences the size of the service sector. Columns 1through 5 of table 3.2 show the states that had a higher initial share of services inSDP continue to have a higher share over the next 25 years. Similarly, biggerstates, as captured by the population, also have a larger share of services in SDP.
92 Exporting Services

As mentioned earlier, a large number of services cater directly to the final con-sumer; therefore, a larger population translates into more demand and, hence, abigger service sector in bigger states.
Another interesting pattern that emerges is the importance of literacy rates.States with a higher literacy rate tend also to have a bigger service sector. This pat-tern suggests that the service sector requires better-educated employees than othersectors, not only in terms of the need for highly qualified engineers, but also interms of the need for workers with minimum education and language skills tostaff call centers or customer services in a retail store or bank. This explanation isin line with previous research on the service sector by Amin and Mattoo (2008),who assess the importance of skilled labor availability to per capita GDP and valueadded in agriculture, manufacturing, and services in 14 major Indian states. Usingpanel data over the 1980–2000 period and controlling for other factors, their sys-tem (generalized method of moments) suggests that greater availability of skilledworkers had a statistically significant and positive effect on per capita output ofthe aggregate service sector. Figure 3.6 shows that states that have been the mostsuccessful in creating institutions of higher learning have the highest per capitaoutput of services.
A Cross-Country Analysis of Service Exports 93
Table 3.2. Service Share of SDP across Indian States, 1980–2005 Dependent variable: share of services in net SDP, 1980–2005
(1) (2) (3) (4) (5) (6) (7)
Share of service,1980
0.39***(4.97)
0.27***(4.09)
0.24***(3.61)
0.20**(2.42)
0.21**(2.42)
Lag log SDP percapita
2.59(1.61)
–0.92(0.63)
2.86(0.95)
4.31(1.56)
4.46(1.61)
7.19***(2.98)
7.38***(3.03)
Lag log population 3.77***(3.16)
4.99***(5.71)
5.32***(6.22)
5.64***(7.31)
5.65***(7.25)
6.75***(10.91)
6.78***(10.77)
Lag literacy rate 0.29***(8.45)
0.31***(8.92)
0.27***(6.45)
0.28***(6.29)
0.27***(6.17)
0.27***(5.97)
Physicalinfrastructure
–1.52*(1.83)
–1.46*(1.78)
–1.76*(1.95)
–1.74**(2.21)
–1.97**(2.25)
Labor marketregulation
2.86(1.22)
2.92(1.24)
4.57**(2.29)
4.66**(2.33)
Product marketregulation
–1.97(1.10)
–1.45(0.75)
Year fixed effects Yes Yes Yes Yes Yes Yes Yes
Observations 74 74 74 74 74 74 74
R2 0.73 0.85 0.86 0.87 0.87 0.85 0.85
Source: Authors’ calculations. Note: Data are estimated using the ordinary least squares method. Robust t-statistics are in parentheses. * = significant at the 1 percent level; ** = significant at the 5 percent level; *** = significant at the 10 percent level.

Regarding the role of state features such as infrastructure and regulatory barri-ers, the estimates show that states with better physical infrastructure have a lowershare of services in their SDP or a larger share of industry. One possible way toreconcile this finding is that in states with poor infrastructure, as determined bythe level of per capita income and literacy, manufacturing activity is small; thus,services as a share of GDP is higher. Finally, states with a more regulated labormarket have a higher share of services, which suggests that in such states busi-nesses choose to avoid the manufacturing sector and opt for the less regulatedservice sector. This evidence regarding labor market regulations is weak incolumns 1 through 5 of table 3.2 and stronger in columns 6 and 7 (when the ini-tial share of services is not included).
An equation similar to equation 3.2 is also estimated for the industry sector,and, using an alternative approach, two equations (one for the share of industryand one for the share of services) are estimated using a seemingly unrelatedregression estimation approach. The results show that the relative size of the serv-ice sector and the growth of services are not constrained by a heavy regulatoryburden or by the deficiency of infrastructure. However, the factor that may have abearing on the performance of the service sector is the availability of skills.
In summary, this section has established that Indian service growth has beenexceptional in comparison to the cross-country standards and, in particular, in thegrowth of modern services. Commensurate with the high growth of services is thegrowth of tradable services and exports as a share of total service value added,
94 Exporting Services
Figure 3.6. Per Capita Service Output and Tertiary Education across Indian States,1980–2000 Averages
Source: Amin and Mattoo 2008. Note: AP = Andhra Pradesh; BH = Bihar; GJ = Gujarat, HY = Haryana, KN = Karnataka, KR = Kerala, MH = Maharashtra, MP = Manipur, OR = Orissa, PJ = Punjab, RJ = Rajasthan, TN = Tamil Nadu, UP = Uttar Pradesh, WB = West Bengal.
OR
AP
BH
HY KNKR
TN
UP
WB
GJ
MPRJ
PJ
MH
0
1,000
2,000
3,000
4,000
5,000
6,000
0 0.001 0.002 0.003 0.004 0.005
tertiary educated population per capita
serv
ice
outp
ut p
er c
apita

with their contribution to service growth increasing over time. The next sectiondiscusses the various characteristics of service exports from India.
Characteristics of India’s Service Exports
Cross-border service exports from India
The phenomenal increase in service exports over the past decade has raised India’sservice exports to 34 percent of total exports in 2009, as shown in figure 3.7. Serv-ice exports as a percentage of GDP are also increasing rapidly—that is, from lessthan 2.0 percent in 1990, the preliberalization year, to more than 8.6 percent in2009. India’s service export performance is outstanding, not only with respect toaggregate exports from the country, but also relative to global service export per-formance. India’s share in the world’s service exports has grown from 0.5 percentto 2.5 percent since liberalization in the early 1990s.
Which disaggregated service exports from India have been responsible for thisphenomenal growth in aggregate service exports? Service trade is broadly concen-trated in the following three categories: transport, travel, and OCSs. In the case ofIndia, the share of OCS exports in commercial service exports increased dramati-cally from 45 percent in 1990 to 78 percent in 2008, with the corresponding shares
A Cross-Country Analysis of Service Exports 95
Figure 3.7. Importance of Service Exports in Aggregate Exports, 1970–2009
Source: World Bank’s World Development Indicators database.
15
20
25
30
35
serv
ice
exp
orts
(as
a %
of t
otal
exp
orts
)
1970
1980
1990
2000
2009

of transport and travel service exports each declining to 11 percent from 21 per-cent and 34 percent respectively.
OCSs comprise a gamut of services: communications; insurance; computerand information services; other business services; government services; construc-tion; financial services; royalties and license fees; and personal, cultural, and recre-ational services. Within OCSs, the segments that have seen the sharpest relativeincrease in exports are (a) computer and information services and (b) other busi-ness services. These two segments are closely related to IT and IT-enabled service(ITeS) exports or to business process outsourcing (BPO) exports. Computer andinformation service exports from India have grown exponentially since 2000, andother business service exports have also increased rapidly, even during the recentglobal financial crisis.12
The traditional revealed comparative advantage (RCA) is also calculatedusing the International Monetary Fund’s balance of payments data, and figure 3.8 depicts the time trend in RCA. An RCA greater than 1.00 suggeststhat a country has a comparative advantage in the relevant segment, but ofgreater interest are trends. India’s RCA in service sector exports increased fromaround 1.00 in the mid-1990s to 1.94 in 2006. OCS exports, with an RCA of3.33 in 2010, are driving India’s competitiveness in services. Within this broadcategory of services, computer and information services have maintained an
96 Exporting Services
Figure 3.8. RCA in Disaggregate Services, 1980–2010
Source: World Bank’s World Development Indicators database.
0
1
2
3
4
RCA
1980
1990
2000
2010
transportation services travel services
other commercial services service exports

average RCA of around 11.00 for several years, dwarfing the RCA in all othercategories of service exports.
Given that computer and information services, as well as other business serv-ices from India, have shown remarkable growth in exports, the chapter focuses onthe characteristics of these exports in more detail in the following section.
A closer look at IT and ITeS exports
Following the spectacular growth of software service exports in the early 1990s,the Reserve Bank of India (RBI) extensively surveyed Indian firms providingthese services every three years starting in 2002/03. This section highlights thestylized facts of software service and ITeS exports from India using RBI surveysand NASSCOM data.13
How large are India’s software service exports? Figure 3.9 shows the composition of India’s software service exports with snap-shots taken in 2002/03 and 2007/08 by the RBI (2005, 2009). The low contribu-tion of ITeS exports compared with computer service exports is partly becauseITeS exports began only toward the end of the 1990s, whereas computer serviceshave been exported since the early 1980s. Within computer services, most camefrom IT service exports (US$23.4 billion in 2007/08), whereas software productdevelopment was small, implying that computer service exports from India are
A Cross-Country Analysis of Service Exports 97
Figure 3.9. Composition of India’s Software Service Exports, 2002/03 and 2007/08
Sources: RBI 2005, 2009.
a. 2002/03 b. 2007/08
ITeS30%(US$2.7 billion)
ITeS23%(US$8.1 billion)
computer70%(US$ 6.4 billion) computer
77%(US$26.7 billion)

on the low to medium end. Within ITeS exports, BPO services contributedUS$7.0 billion, whereas engineering services accounted for only US$1.1 billionin export revenue.14
Where does India export? The destination marketsThe share of the destination markets remained fairly stable over the two RBIsurvey periods (table 3.3). Canada and the United States accounted for abouttwo-thirds of software service exports, and Europe for about one-fourth. Thepredominance of developed destination countries is explained by four factors.First, lower wages benefit developed destination countries more than they benefit Asian or Latin American economies. Second, developed countries arelarge consumers of services. Third, India shares a common language with theUnited Kingdom (a European country that alone accounted for 14 percent ofsoftware service exports) and the United States. Fourth, the time-zone differ-ence between India and those countries helps also in conducting round-the-clock business.
Because the United States is the main destination market, more than 75 percentof invoicing is done in U.S. dollars, and that figure has remained stable over time,which makes the profitability of the business sensitive to the dollar-rupeeexchange rate.15
What kind of firms export services and how?
Helpman, Melitz, and Yeaple (2004) suggest that differences in firm productivitywithin the sector can explain the structure of international trade and horizontalforeign direct investment (FDI). Their model goes beyond Melitz’s (2003) findingthat serving international markets demands a threshold level of productivity, and
98 Exporting Services
Table 3.3. Destination of Indian Software Service Exports, 2002/03 and 2007/08
Country Share in 2002/03 (%) Share in 2007/08 (%)
Canada and United States 63.7 64.0
Europe 23.7 26.6
East Asia 5.9 3.0
West Asia 1.9 0.5
Australia and New Zealand 1.5 1.6
South Asia 0.9 0.5
Latin America 0.2 ..
Other 2.2 3.8
Sources: RBI 2005, 2009.Note: .. = negligent.

their model suggests that, of the firms that export, only the most productive onesengage in FDI. This result is mainly driven by FDI’s involving larger fixed coststhan does exporting; hence, only the most productive firms can invest abroad toavoid transport costs. Recently, Bhattacharya, Patnaik, and Shah (2010) haveargued that this conclusion does not hold for services in which the marginal costfor transporting is virtually zero. They find that, in the provision of software serv-ices from India, distant buyers face uncertainty about the quality of the servicecontracted.16 Therefore, only the less productive firms need to invest abroad toreduce risk perception among consumers. Firm-level evidence from the RBI sur-vey suggests that large exporting firms had an export strategy different from thatof small firms.17
Software service exporting firms from India have four striking features. First, alarge proportion of service exporting firms are small (in 2002/03, 58 percent offirms had export revenues below Rs 10 million, whereas in 2007/08 this figure was30 percent) and contribute less than 1 percent of total software service export rev-enue (table 3.4). In contrast, large firms constitute a very small proportion of totalexporting firms (2.7 percent in 2002/03 and 8.5 percent in 2007/08) but con-tribute more than 80 percent of total revenue. This trend is in line with the recentliterature, such as Eaton, Kortum, and Kramarz (2004) and Melitz (2003), on firmproductivity (or size) and export volumes. Specifically, using NASSCOM firm-level data for the Indian software service industry, Manova and Shastry (2006)find that larger firms have higher export volumes.18
The second striking feature is that the destination markets for small firms weremainly the same as those for large firms: Canada and the United States. However,as Manova and Shastry (2006) find in the Indian IT industry, the number of trad-ing partners is higher for larger firms. This trend is likely true for the entire Indiansoftware service industry as well.
Third, a larger proportion of small firms choose to deliver services offshorerather than onshore; in contrast, large firms tend to adopt a model with a bal-anced mix of onshore and offshore service delivery. Over time, however, this bal-ance has shifted toward offshore delivery, perhaps as a result of “learning bydoing” or of establishing a reputation of reliable service providers (table 3.4). Thestatic result for small firms may be explained by Helpman, Melitz, and Yeaple(2004), who find that a high fixed cost for onsite delivery may deter small firmsfrom choosing an onshore model. Once a firm chooses an onshore deliverymodel, the dynamics can be explained by Bhattacharya, Patnaik, and Shah (2010),where uncertainty in the quality of service delivered locks small firms into anonshore delivery model.
A fourth characteristic of successful firms concerns their modes of delivery—that is, whether they deliver the services through cross-border supply (mode 1) or
A Cross-Country Analysis of Service Exports 99

Table 3.4. Firm Characteristics and Software Service Exports from India, 2002/03 and 2007/08
Export volume (Rs million)
Share of firms(%)
Share ofexport
revenue (%)
Destination of exports (%) Shoring model (%)
Canada andUnited States Europe Other Onshore Offshore
2002/03
< 10 58.00 0.90 66.27 15.98 17.75 26.29 73.71
10–100 31.47 5.19 69.30 13.37 17.33 16.74 83.26
100–1,000 7.79 11.17 65.74 21.73 12.53 14.19 85.81
> 1,000 2.74 82.74 63.09 24.66 12.25 52.79 47.21
2007/08
< 10 29.7 0.1 69.3 17.0 13.6 3.9 96.1
10–100 38.5 1.4 71.7 17.3 10.9 7.5 92.5
100–1,000 23.4 6.3 69.0 20.8 10.2 6.2 93.8
> 1,000 8.5 92.2 63.5 27.2 9.4 27.1 72.9
Sources: RBI 2005, 2009.
100

engage in horizontal FDI (mode 3). As suggested by Helpman, Melitz, and Yeaple(2004), a firm’s size may influence its choice of delivery mode.
When Indian software outsourcing firms engage in horizontal FDI, they preferto provide multiple services. The RBI survey for 2007/08 found that 56.3 percentof exporting firms provided a combination of software services (IT, BPO, softwaredevelopment, or engineering services) through a subsidiary (table 3.5). Moreover,85.6 percent of these exports were targeted at consumption in the host country,whereas only 10.6 percent were exported to other countries, excluding India. Sub-sidiaries of IT service firms are located in the destination markets themselves,whereas those of ITeS firms are located in a third country. The service is thenexported from that third country to the destination market (which is India for 100percent of exports in the case of engineering services). For instance, the Philippinesubsidiary of EXL Service exports all customer care services to the United States.The underlying differences in the nature of work in the IT and ITeS sectors mayexplain this pattern.
The RBI survey also finds that 51 percent of outward FDI in the software serv-ice sector is destined for English-speaking markets (that is, the United Kingdomand the United States), and that share accounts for 72 percent of total revenue. Inmost cases, the FDI was market seeking, except in the case of Canada, which actedas a relatively cheap near-shore location for the United States.
The growing importance of outward FDI from India
India is widely known for its cross-border service exports (mode 1); however,less well known is that India’s outward FDI increased at a striking rate duringthe past decade.19 Although India started from a much lower base (Pradhan2009), the country’s annual average growth of outward FDI from 2004 to 2007
A Cross-Country Analysis of Service Exports 101
Table 3.5. Software Business by Indian-Owned Foreign Affiliates, by Activity, 2007/08
Service
Share offoreignaffiliates
(%)
Software business exported by foreign affiliates (%)
To hostcountry To India
To othercountries
IT services 21.6 96.0 3.0 1.0
Software development 3.7 85.7 2.1 12.2
BPO services 17.6 22.9 2.3 74.8
Engineering services 0.8 0.0 100.0 0.0
Other (combination of services) 56.3 91.7 4.0 4.4
Total 100.0 85.6 3.7 10.6
Source: RBI 2009.

was unprecedented at 98 percent and far ahead of outward FDI growth in otheremerging markets, such as China (74 percent), Malaysia (70 percent), the Russian Federation (53 percent), and the Republic of Korea (51 percent). Thepercentage increase in recent decades has been higher in the service sector (430 percent) than in manufacturing and has mostly been fueled by overseasacquisitions.
Pradhan (2008a) divides the evolution of outward FDI from India into twoperiods: the first wave covers 1975–90, and the second wave covers 1991 to thepresent. The second wave has shown more dynamism with the rise in the numberof Indian multinational companies, the emergence of new sectors (diversifica-tion), and the increase in exports to new destinations. Figure 3.10 shows thesectoral composition of India’s outward FDI from 1970 to 2007.
The first wave of outward FDI flows was largely driven by manufacturingfirms, with internationalization primarily directed at developing countries withsimilar or lower levels of development relative to India. In the second wave, how-ever, manufacturing outward FDI and service outward FDI were comparable; theservice sector constituted 28 percent of total outward FDI, and the manufacturingsector 33 percent. This increase in service outward FDI was largely attributable tothe IT industry and the broadcasting and publishing sectors.
Table 3.6 shows outward FDI for selected disaggregate service sectors as apercentage of total outward FDI from India. As in the case of India’s mode 1exports, the software and ITeS sector stands out even for mode 3 exports, with
102 Exporting Services
Figure 3.10. India’s Outward FDI, by Sector, 1970–2007
Source: Authors’ calculations based on Pradhan 2008b.
0
10
20
30
40
50
60
70
80
90
1970
–79
1980
–89
1990
–99
2000
–07
shar
e of
out
war
d FD
I (%
)
primary manufacturing services others

that sector’s share increasing from 3.4 percent of total outward FDI in the 1980sto 13.8 percent in the 2000s.
Another important feature of cross-border Indian FDI during the 1975–90period was that participants were joint ventures (minority owned) in a largenumber of outward FDI cases (figure 3.11). Policy that restricted Indian equityparticipation contributed to the minority participation trend. The 1991 liber-alization reforms, however, relaxed such equity restrictions, resulting in out-ward FDI projects with majority ownership by Indian firms (that is, whollyowned subsidiaries).
Factors behind the Success of India’s Service Exports: A Cross-Country Analysis
As discussed earlier, India’s service sector grew dramatically in the 2000s, andservice exports partly explain this trend. This section’s discussion moves awayfrom service output and instead uses cross-country data to provide an interna-tional perspective on the success of India’s service exports.20 The following basemodel of service exports (log levels) controls for GDP, GDP per capita, size of theservice sector, and country and time fixed effects. Additionally, the authors showexplicitly the coefficient for India’s dummy variable. A positive and significantcoefficient on India’s dummy variable indicates that OCS exports from India arehigher than its economic fundamentals would suggest.
A Cross-Country Analysis of Service Exports 103
Table 3.6. Allocation of India’s Outward FDI, by Sector, 1970–2007
Sector 1970–79 1980–89 1990–99 2000–07
Construction and engineeringservices 3.23 7.05 3.09 1.54
Consultancy and businessadvisory services 0.12 0.33 0.22 0.23
Film, entertainment, andbroadcasting — — 14.17 2.35
Financial and insurance services 6.80 17.21 1.39 5.13Hospital and health services — — 0.17 0.76Hospitality and tourism 5.18 7.65 5.77 0.23Other services 2.07 0.33 0.11 0.63Software development,packages, and ITeS — 3.43 7.60 13.82
Telecommunication services — — 4.16 2.25Transportation services — 1.71 1.04 1.32
Source: Authors’ calculations based on Pradhan 2008b. Note: — = not available.

log(OCS exports)it = FEi + TE + log(Per capita income)it
+ log(ServicesValueAdded)it + log(GDP)it
+ Indiadummy + eit, (3.3)
where i refers to the country and t represents time.The estimation includes service exports from 1990 onward and excludes African
countries because of their small number of service exports. The results of the esti-mation for equation 3.3 are shown in column 1 of table 3.7. The signs of the fun-damental variables—GDP per capita, service value added, and GDP—are asexpected, and the coefficient for the India dummy variable is positive. Figure 3.12shows that India’s actual OCS exports first overshot their predicted value in 1998,which coincides with the growth spurt of India’s ITeS sector.
The next specification adds to the base model Internet penetration as a proxyfor the quality of electronic infrastructure for service delivery, which allows one toevaluate whether innovations in information and communication technology sig-nificant affect OCS exports.21 Column 2 of table 3.7 shows that Internet penetra-tion does significantly affect OCS exports. The positive and significant coefficientfor the India dummy variable implies that the state of India’s telecommunicationsdoes not explain the country’s success in exporting services.
Column 3 of table 3.7 adds an interaction term for Internet penetration toIndia’s dummy variable to evaluate whether the effect of Internet penetration islarger for India than for the rest of the countries in the sample. The positive andsignificant coefficient for this interaction term suggests that the effect of Internet
104 Exporting Services
Figure 3.11. Ownership Structure of India’s Outward FDI, 1970–2007
Source: Authors’ calculations based on Pradhan 2008b.
0102030405060708090
100
1970
–79
1980
–89
1990
–99
2000
–07
shar
e of
out
war
d FD
I (%
)
joint ventures wholly owned subsidiaries

Table 3.7. India’s Position in OCS Exports, 1990–2008 Dependent variable: log level value of OCS exports (constant 2000 US$)
Variable (1) (2) (3) (4) (5) (6) (7)
GDP per capita (constantUS$), in logs
3.572***[10.096]
2.462***[5.116]
2.430***[5.090]
2.462***[3.772]
2.434***[3.785]
4.584***[3.288]
4.584***[3.288]
Services value added, in logs
0.966***[31.060]
0.945***[32.115]
0.940***[32.812]
0.926***[35.307]
0.921***[35.298]
0.878***[4.250]
0.878***[4.250]
GDP (constant US$), in logs
–3.438***[–9.405]
–2.043***[–4.049]
–2.193***[–4.420]
–2.069***[–3.342]
–2.261***[–3.736]
–4.434***[–3.143]
–4.434***[–3.143]
Internet users per 100 0.006***[3.694]
0.007***[4.443]
0.008***[4.298]
0.009***[5.062]
–0.006[–1.644]
–0.006[–1.644]
Average years of schooling 0.192*[1.777]
0.152[1.344]
India dummy 1.169*[1.948]
2.112***[3.071]
3.284***[2.613]
19.319***[3.591]
Internet Penetration*Indiadummy
0.355***[4.834]
Schooling years*Indiadummy
1.325***[7.030]
Cost of contractenforcement
–0.012*[–1.815]
–0.012*[–1.815]
Contract enforcementcost*India dummy
0.049**[2.377]
Constant 66.313***[8.338]
35.827***[3.377]
40.645***[3.909]
34.498***[2.632]
37.463***[3.023]
69.948***[3.036]
87.322***[3.079]
Fixed effects (country and time) Yes Yes Yes Yes Yes Yes Yes
Observations 992 905 905 613 613 226 226
R2 0.955 0.959 0.961 0.967 0.968 0.997 0.997
Source: Authors’ calculations. Note: Robust t-statistics are in brackets. * = significant at the 1 percent level; ** = significant at the 5 percent level; *** = significant at the 10 percent level.
10
5

penetration on Indian OCS exports is significantly larger than the effect on OCSexports of other countries.
Recently, Arora and Bagde (2010) noted the importance of human capital insoftware service exports from India.22 Between 1985 and 2003, undergraduateengineering baccalaureate capacity increased from about 45,000 (59 per million)to about 440,000 (405 per million), though the total population increased onlyfrom 765 million to 1,086 million. The number of engineering colleges in Indiaincreased from 246 in 1987, to 353 in 1995, and to more than 1,100 in 2003. Soft-ware exports also grew rapidly during this period, and software exports and engi-neering education capacity appear closely linked. Arora and Bagde’s empiricalinvestigation in 14 states reveals that the relative availability of engineers has cre-ated a comparative advantage for India in software service exports.
As seen in column 4 of table 3.7, human capital, as proxied by average years ofschooling, helps to explain OCS exports in the sample countries. The coefficientfor the India dummy variable, however, is still positive and significant, whichimplies that schooling does not explain India’s success in OCS exports. In India,the average number of years of schooling was merely five years in 2005, and noother country in the sample with such low levels of schooling has been able toexport OCS comparable to India’s value. India is, therefore, an outlier in OCSexport performance, which is explained neither by the state of its telecommunica-tion sector nor by the average skill level in the population. However, one needs to
106 Exporting Services
Figure 3.12. India’s OCS Exports, Actual versus Predicted, 1990–2010
Source: Authors’ calculations based on OLS estimation of equation 3.3.
8
9
10
11
serv
ice
exp
orts
(lo
gs)
1990
1995
2000
2005
2010
predicted actual

understand that India has a population of more than 1 billion people, and aver-ages in such a large population may not reflect regional variations in endowments.In column 5, the interaction term’s positive and significant coefficient for averageyears of schooling and India’s dummy variable suggests that the effect of humancapital investment on India’s OCS exports would be positive and more significantthan its effect on another sample country.
Column 6 of table 3.7 assesses whether the quality of institutions matters forOCS exports—specifically, for India. Literature on growth increasingly empha-sizes efficient and properly functioning institutions as preconditions for invest-ment, entrepreneurship, innovation, and, hence, long-term growth. Researchershave argued that institutions confer two types of benefits. First, they enhancelong-term growth (Acemoglu, Johnson, and Robinson 2000; Collier and Gun-ning 1999). Second, they impart resilience to an economy, allowing it to adjustto exogenous shocks (Rodrik 1999). That institutions play a critical role in acountry’s economic development and in the trade of different goods(Berkowitz, Moenius, and Pistor 2006) is now well established. Certain institu-tions may, however, play a more significant role in the development of servicesectors for three reasons: (a) market failure caused by informational problems ismore acute in many intangible and invisible intermediation and knowledge-based services; (b) market failure caused by natural monopoly or oligopoly is aserious issue for locational services such as roads, rails, or energy distribution,because they require specialized distribution networks; and (c) suppliers andconsumers of customized services make relationship-specific investments thatmake them more sensitive to the contracting environment of the exportingcountry.
The cost of contract enforcement from the Doing Business database measuresthe quality of institutions.23 Because the variable for human capital collected byBarro and Lee (2010) ends in 2005, whereas the Doing Business variable starts in2004, the variables cannot be used together in one regression because of limits onthe number of observations. Column 6 of table 3.7 shows that the cost of contractenforcement negatively affects OCS exports; however, the quality of institutionsalso does not explain India’s success. In column 7, the positive and significantcoefficient for the interaction term of India’s dummy variable and the contractenforcement variable reveals that the high cost of contracting is more taxing inIndia than it is for other countries sampled.
Researchers increasingly believe that the root cause of a country’s backward-ness may lie in its history. For example, the quality of a country’s institutionsmay be related to its colonial history. Many institutions are slow to change,which prompts pessimism about the likelihood of a country’s residents escapingthe poverty trap. An interesting question concerns whether building effective
A Cross-Country Analysis of Service Exports 107

educational institutions through a combination of domestic policy action andexternal assistance is feasible in the medium term. If it is feasible, then accordingto the finding that the quality of higher education is a key determinant of theservice sector’s dynamism, investments in higher education could alleviate theconstraints of inadequate institutional development in the medium term.
Overall, results indicate that comparing the quality of India’s telecommunica-tion infrastructure, human skills, or institutions to those of other countries doesnot fully explain India’s success in exporting services. Thus, the contribution ofspecific factors, such as government policy and the role of the Indian diaspora,must be considered.
The Role of Specific Factors in India’s Export Success
The growth of the Indian IT and ITeS sectors, despite the apparent backwardnessof India’s IT penetration levels, points to the concerted policies and visionespoused by the government and industry in the 1980s and especially in the1990s to promote software exports and transfer of technology and telecommuni-cation links.24 However, what is puzzling about the explosive growth of India’s ITsector is how and why India emerged as a global leader in a cutting-edge industrywhen, despite strenuous policy efforts, it failed to achieve such leadership in anyother technology-intensive sector (except pharmaceuticals).
Although the conventional explanation of comparative advantage (low-cost,high-skilled human resources) may continue to hold true, concluding that thegovernment played no role in the development of the sector may be wrong. Thereview of literature shows that, unlike other sectors of the Indian economy,the state intervention was markedly different in India’s IT sector (see, for example,Kapur 2002; Saxenian 1999, 2000, 2004; Srinivasan 2005).25 The literature alsoshows that the historical roots of industry lie in state intervention, whereas itslater development owes some degree of success to the facilitative nature of statepolicies. Several policies, discussed next, have played a key role in promoting soft-ware service exports from India.
Import policy
Starting in the 1970s, tariffs on computer and software imports for trainingeducational institutions were reduced. Software exporters were allowed quickerclearance from customs. The new computer policy of 1984 made the proceduresfor importing hardware quicker and easier. The import duty on hardware wasreduced from 135 percent to 60 percent and on software from 100 percent to 60percent. Later, this policy also allowed 50 percent of software export earnings,
108 Exporting Services

well above the obligation in any given year, to be used to purchase foreignexchange permits to buy a range of goods (including more computers). In 1986,shifting from quantitative restrictions to tariff protection liberalized softwareimport policy, and all firms were allowed to import software after paying the60 percent import duty. However, the software export requirement was mademore stringent; the export obligation from importing foreign computers had tobe achieved in four years rather than five and needed to be backed by bonds andbank guarantees.
In 1988, a 10 crore rule was introduced, whereby large software firms (export-ing more than Rs 100.0 million, or US$7.1 million) were allowed to pay off theirexport obligations in whatever manner they chose.26 This provision was expandedto include small firms in 1993. Software import policy also changed. The 1988/89budget permitted accompanying software and start-up spares that were importedunder the software export policy to be subject to duty at the same rate as the mainhardware, rather than at the previous rate of 250 to 300 percent.
The five-year export-import policy of 1992 allowed free export and import ofall products except those on the negative list. The products on the negative list thatdirectly related to the software industry were computers (including personal com-puters) priced at or below Rs 150,000 (US$8,572.00) and keyboards and monitorspriced at or below Rs 7,500 (US$428.50). Other measures included a guarantee ofthe exchangeability of the rupee and a reduction of import duties. Import dutieson software imports were reduced to 110 percent in 1992 and to 85 percent in1993. These duties were split in 1994 to 20 percent for application software and65 percent for system software and were then reduced to 10 percent for both cate-gories in 1995. The Export Promotion Capital Goods Scheme, which allows a15 percent import duty for a 400 percent export obligation that is more than fiveyears, was extended to include service exports in 1993.
Export processing zones
As long ago as 1976, IT firms were permitted to operate from export processingzones (EPZs);27 however, the software technology park (STP), an EPZ focusedsolely on software services, was formed in 1986. Under the STP project, a buildingfurnished with communication and other utilities was to be shared by firmsexporting 100 percent of the software they developed. The objectives of STPs wereto establish and manage infrastructure resources such as data communicationfacilities, core computer facilities, built-up space, and other common amenities;to provide one-stop-shop statutory services such as project approvals, importcertification, software valuation, and certification of exports for softwareexporters; to promote development and export of software services through
A Cross-Country Analysis of Service Exports 109

technology assessments, market analyses, market segmentation, and marketingsupport; and to train professionals and encourage design and development in thesoftware technology and software engineering fields.
By allowing duty-free imports of computer hardware, STPs aimed to promotesoftware development. Firms in STPs were allowed tax exemptions; were guaran-teed access to high-speed satellite links; and were provided reliable electricalpower, core computer facilities, ready-to-use office space, and communicationfacilities. They were allowed to import equipment free of duty and withoutlicenses. Total foreign ownership was permitted in exchange for the obligation toexport. Firms were allowed to repatriate capital investments, royalties, and divi-dends for free once they paid the taxes due.
Backed by the government of Karnataka, Texas Instruments was the first firmto take advantage of STP policy. It established its own STP by installing communi-cation equipment on the roof of a building in Bangalore (RIDA 1996).28 Later, in1991, an organization called Software Technology Parks of India (STPI) was estab-lished under the Department of Electronics and began constructing STPs in threecities: Bangalore, Pune, and Bhubaneswar. STPI’s efforts spread further with time.In 1992, the government permitted the construction of private STPs anywhere inIndia. By 1995, about 400 companies were recognized as companies situated inSTPs. By 2008/09, 8,455 units were registered as operating units in STPs, of which7,214 were registered as exporting units. Although data quantifying the benefits ofSTPs are not available, the tax and the duty incentives offered to companies in anSTP considerably helped to expand India’s IT and ITeS exports. Figure 3.13 sug-gests the increase in exports resulted from STP policy.
Foreign investment policy
The new computer policy of 1984 allowed private companies, including theforeign-owned ones, to engage in the production of high-performance (32-bit)computers, which formerly only state-run companies could do. Similarly,under the 1984 policy, companies with up to 40 percent foreign equity holdings(covered by the Foreign Exchange Regulation Act29) and very large companies(covered by Monopolistic and Restrictive Trade Practices Act30) were allowedto produce software. In 1986, wholly foreign-owned software companies wereallowed to produce software as long as the product was 100 percent export ori-ented. In addition, several policy changes were introduced to speed up foreigncompany applications. With the 1991 reforms, foreign investment in the Indiansoftware and electronics sectors of up to 51 percent of the total capital wasallowed under the automatic route, as long as the value of investment exceededthe value of the capital goods imported.
110 Exporting Services

Investment in education and human capital
Besides establishing the famous Indian Institutes of Technology, the governmenthas taken several steps to accumulate a large pool of service professionals. Forinstance, the computer policy of 1984 established several research institutes, pri-vate training institutes, and organizations for software development. Recently, agovernment-led program called Human Resource Development in IT has soughtto make everyone computer literate, to increase Internet use in all aspects of life(including in banking), to improve the quality of IT education in all levels ofschooling, and to train skilled IT workers.
Policy on intellectual property
In 1984, software was placed under the Copyright Act, which made softwarepiracy punishable by fines or imprisonment. The 1995 agreement forming theWorld Trade Organization (which replaced the General Agreement on Tariffsand Trade) included provisions concerning intellectual property rights andconfirmed that raids, fines, and imprisonment could be used against softwarepirates. The Copyright Act spurred domestic sales of authorized products
A Cross-Country Analysis of Service Exports 111
Figure 3.13. Export Growth from STP Units, 2000–09
Source: STPI website (http://www.stpi.in/writereaddata/links/4851816909export.png). Note: Data converted to U.S. dollars from Indian rupees using the average annual exchange rateprevailing in the respective year.
50
45
40
35
30
25
exp
orts
(U
S$ b
illio
n)
grow
th r
ate
(%)
20
15
10
5
0 0
10
20
30
40
50
60
2000
/01
2001
/02
2002
/03
2003
/04
2004
/05
2005
/06
2006
/07
2007
/08
2008
/09
exports growth rate

and also stimulated development of Indian software products and packagedsoftware.
The role of industry associations
In 1988, the industry organization NASSCOM was established to contribute to thedevelopment of the Indian software industry. NASSCOM gave Indian IT and ITeScompanies a unified voice and played an instrumental role in the industry’s policy-making process at various levels. The organization worked with the Indian government to promote the sector’s interests (Kapur 2002). NASSCOM was veryinfluential in building and strengthening India’s global reputation as a premier out-sourcing destination. In 1999, NASSCOM initiated the India-Europe SoftwareAlliance program to increase strategic alliances, joint ventures, and partnershipsbetween companies in India and Europe. In 1999/2000, software exports to Euro-pean countries reached 23.5 percent of total software exports (in 1997/98, softwareexports were 20.0 percent). In 2000, NASSCOM developed a software cooperationproject with Japan, the India-Japan Software Alliance. NASSCOM has also signedseveral trade contracts with countries such as Ireland, Israel, Mexico, Morocco,and Singapore to expand the geographic reach of Indian software companiesbeyond Japan, North America, and Western Europe.
To ensure a steady supply of quality IT and ITeS professionals in India, NASS-COM started an assessment and certification framework called the NASSCOMAssessment of Competence (NAC). The aim of the NAC is to facilitate a contin-ual flow of talent through a standard assessment and certification process.NASSCOM also set up the National Skills Registry (NSR) as a database of ITindustry workers.31 NSR develops a fact sheet about each professional and com-piles background check reports. NSR’s efforts constitute a security best practicefor the industry and ensure that honest professionals receive identity securityand industry acceptance.
To uphold a high level of data privacy and security standards, NASSCOMdeveloped the Data Security Council of India (DSCI).32 DSCI’s mission is toensure that Indian companies are trustworthy global sourcing providers and tosend clients a worldwide message that India is a secure outsourcing destinationwhere privacy and protection of customer data are enshrined in the industry’sglobal best practices.33
The important role played by NASSCOM is visible in the steady increase inits membership. In 1988, NASSCOM had 38 members, which together con-tributed close to 65 percent of the revenue of the IT and ITeS industry. Sincethen, NASSCOM membership has grown significantly to reach more than 1,300members in 2008. These members currently account for more than 95 percentof the revenues of the IT and ITeS industry in India.
112 Exporting Services
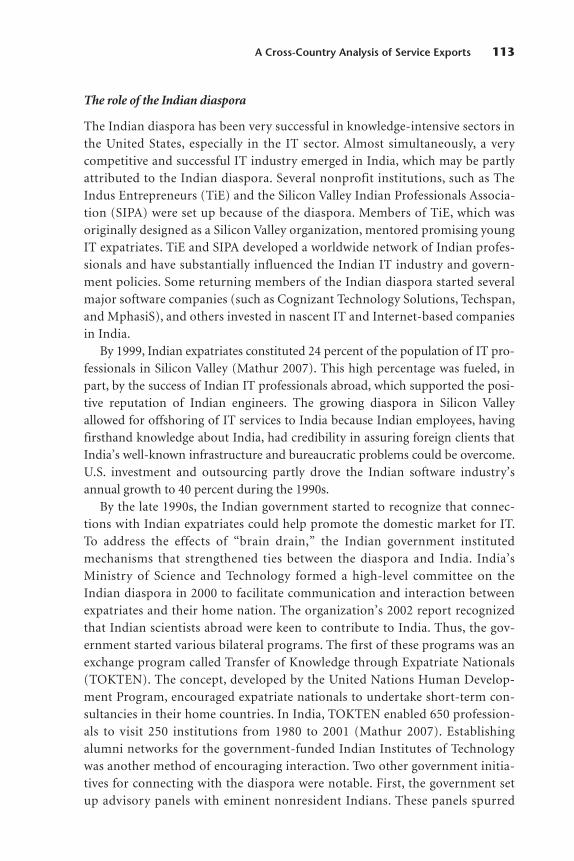
The role of the Indian diaspora
The Indian diaspora has been very successful in knowledge-intensive sectors inthe United States, especially in the IT sector. Almost simultaneously, a verycompetitive and successful IT industry emerged in India, which may be partlyattributed to the Indian diaspora. Several nonprofit institutions, such as TheIndus Entrepreneurs (TiE) and the Silicon Valley Indian Professionals Associa-tion (SIPA) were set up because of the diaspora. Members of TiE, which wasoriginally designed as a Silicon Valley organization, mentored promising youngIT expatriates. TiE and SIPA developed a worldwide network of Indian profes-sionals and have substantially influenced the Indian IT industry and govern-ment policies. Some returning members of the Indian diaspora started severalmajor software companies (such as Cognizant Technology Solutions, Techspan,and MphasiS), and others invested in nascent IT and Internet-based companiesin India.
By 1999, Indian expatriates constituted 24 percent of the population of IT pro-fessionals in Silicon Valley (Mathur 2007). This high percentage was fueled, inpart, by the success of Indian IT professionals abroad, which supported the posi-tive reputation of Indian engineers. The growing diaspora in Silicon Valleyallowed for offshoring of IT services to India because Indian employees, havingfirsthand knowledge about India, had credibility in assuring foreign clients thatIndia’s well-known infrastructure and bureaucratic problems could be overcome.U.S. investment and outsourcing partly drove the Indian software industry’sannual growth to 40 percent during the 1990s.
By the late 1990s, the Indian government started to recognize that connec-tions with Indian expatriates could help promote the domestic market for IT.To address the effects of “brain drain,” the Indian government institutedmechanisms that strengthened ties between the diaspora and India. India’sMinistry of Science and Technology formed a high-level committee on theIndian diaspora in 2000 to facilitate communication and interaction betweenexpatriates and their home nation. The organization’s 2002 report recognizedthat Indian scientists abroad were keen to contribute to India. Thus, the gov-ernment started various bilateral programs. The first of these programs was anexchange program called Transfer of Knowledge through Expatriate Nationals(TOKTEN). The concept, developed by the United Nations Human Develop-ment Program, encouraged expatriate nationals to undertake short-term con-sultancies in their home countries. In India, TOKTEN enabled 650 profession-als to visit 250 institutions from 1980 to 2001 (Mathur 2007). Establishingalumni networks for the government-funded Indian Institutes of Technologywas another method of encouraging interaction. Two other government initia-tives for connecting with the diaspora were notable. First, the government setup advisory panels with eminent nonresident Indians. These panels spurred
A Cross-Country Analysis of Service Exports 113

investment and led to several IT joint ventures. Second, the governmentencouraged the placement of many nonresident Indians in honorary fellow-ships at universities through an effort funded by professional scientific andtechnical societies.
By 2000, Indian engineers were at the helm of 972 Silicon Valley–based technology companies, which accounted for approximately US$5 billion insales and 25,811 jobs based out of Silicon Valley. Moreover, the pace of Indianentrepreneurship accelerated rapidly in the 1990s; Indians ran only 3 percentof the technology companies in the United States that were started between1980 and 1983, but they ran 10 percent of such companies started between1995 and 2000.
Conclusion
As part of its reform package during the economic crisis in 1991, India liberalizedits service sector and opened the economy to trade. India now ranks as the largestexporter of software services from the developing world. The establishment ofworld-class educational institutes, such as the Indian Institute of Engineering, fur-ther allowed India to take advantage of IT innovations. Using other commercialservice trade data from the World Bank’s World Development Indicators, thischapter tries to explain India’s success in exporting services and to compareIndia’s determinants with those of the rest of the world. Although fundamentalvariables such as human capital, electronic infrastructure, and institutions have alarger effect on India’s service exports, they cannot fully explain India’s success inexporting services. Thus, India’s service sector policy is examined to discover thereasons for its exporting success.
A descriptive analysis of software sector policy suggests that the import policy,which allowed for hardware and equipment imports at lower tariffs; the relaxationin foreign equity participation; and the establishment of STPs providing world-class infrastructure and tax incentives have also played a role in promoting serviceexports. NASSCOM, the industry association for software services, reinforcedthese policies, thereby deepening India’s ties with developed countries in Europeand Japan. Hence, NASSCOM played a key role in marketing the Indian brandand influenced the evolution of policy.
Annex 3.A: Variables, Definitions, and Data Sources
Table 2.A.1, in the annex to chapter 2, defines the variables used in this study anddescribes the data sources. Table 2.A.2, also in chapter 2, provides a partial corre-lation of the electronic infrastructure variables.
114 Exporting Services

Notes
1. This section draws on Eichengreen and Gupta (2009, 2010).2. The Central Statistical Organization, the main source of data for GDP and sectoral growth
rates, defines agriculture as including forestry and fishing and defines industry as encompassing manu-facturing, electricity, gas and water, mining and quarrying, and construction. Year 2007/08 refers to theperiod from April 2007 to March 2008 (fiscal 2008 in India); alternatively, the chapter refers to theperiod as 2007.
3. Contrary to the perception of poor industrial sector performance, the growth of industry hasaveraged 6 percent to 7 percent since 1990 and has improved since the turn of the century. Manufac-turing (industry net of mining and quarrying; electricity, gas, and water; and construction) grew by arobust 8 percent a year from 2000 to 2007.
4. Regressions include country fixed effects, and they allow for a different intercept in the 1970–89period and the 1990–2006 period and for a different slope in the 1990–2006 period. For more detail,see Eichengreen and Gupta (2009).
5. Data also show that this two-wave pattern—specifically, the greater importance of the secondwave in middle- and high-income countries—is most evident in democratic economies, in economiesthat are close to major financial centers, and in economies that are relatively open to trade (both gen-eral trade and trade in services).
6. The estimated size of industry as a share of GDP is from Eichengreen and Gupta (2010) and isbased on a cubic polynomial relationship between the industry share and the log per capita income. Asdiscussed earlier, regressions include country fixed effects, and they allow for a different intercept inthe 1970–89 period and the 1990–2006 period and for a different slope in the 1990–2006 period.India’s behavior in terms of agriculture as a share of GDP (not shown in figure 3.4) is unexceptional.The share matches the predicted downward-sloping relationship with respect to income.
7. In the 1990s, modern services contributed nearly as much to aggregate growth as did agricul-ture or manufacturing. Since 2000, communication services have contributed more to GDP growththan has agriculture.
8. The gap is calculated as the difference between the respective services as a share of GDP in theEU KLEMS sample. The 2008 EU KLEMS release spans 1970–2005 for the 15 founding (pre-2004)European Union (EU) member states and for Australia, Japan, the Republic of Korea, and the UnitedStates. Data from 1995 onward are available for states that joined the EU in 2004. Industries are classi-fied according to the European NACE revision 1 classification, but the level of detail varies acrosscountries, industries, and variables owing to differences in national statistical procedure. The analysisin this chapter does not include the new member states and also drops Luxembourg and Portugal, forwhich there are data availability problems. Thus, data are for Australia, Austria, Belgium, Denmark,Finland, France, Germany, Greece, Ireland, Italy, Japan, Korea, Netherlands, Spain, Sweden, the UnitedKingdom, and the United States.
9. The correlation variable is based on the correlation coefficients between service growth andgrowth in manufacturing, calculated over various time periods. The correlation coefficients are consis-tently significantly different from zero for three services: trade, hotels and restaurants, and transport.Tradability is indicated by a dummy variable, which takes a value of one if the service is considered tobe tradable and has a value of zero otherwise. This indicator is based on Jensen and Kletzer (2005).Details are in appendix C of Eichengreen and Gupta (2009).
10. The growth of tradable services and of services that have been liberalized has been much fastersince the 1990s compared to the 1980s.
11. Some people suspect that one reason for the service sector’s fast growth and the industrialsector’s slow growth is the increasing outsourcing from industry to services over time. Thus, thestagnant share of industry in India and the increasing share of services could, in a sense, merely be arelabeling phenomenon. Eichengreen and Gupta (2010) do not find evidence to support the viewthat the outsourcing from industry to services is increasing. They show that only a small fraction ofthe growth of demand derives from the outsourcing of activities from manufacturing to services;
A Cross-Country Analysis of Service Exports 115

rather, most production that does not go toward exports derives from the growth of final demand at home.
12. Borchert and Mattoo (2010) find that India’s exports to the United States, which are relativelyspecialized in service exports, declined less during the global financial crisis than the exports of devel-oping countries and regions for which services are less important, such as Africa (15 percent in aggre-gate exports), Brazil (12 percent), and China (9 percent). The contractions in those economies’ totalexports (goods and services) to the United States in the fourth quarter of 2008 were as follows: Africa(36.0 percent), Brazil (13.0 percent), China (9.0 percent), and India (2.5 percent).
13. Computer service exports (as defined in IMF 1993 and UN and others 2002) is a much nar-rower category than software service exports, which includes both computer services as well as ITeSand BPO services. Computer services include development, production, supply, and documentationof customized software, including operating systems made on order for specific users; systems main-tenance and other support services, such as training, provided as part of consulting; hardware andsoftware consulting; analysis, design, and programming of systems that are ready to use (includingwebpage development and design); technical consulting related to software; data processing servicessuch as data entry, tabulation, and processing on a timesharing basis; webpage hosting services; andso on. Most firms that export computer services provide the first two or three of these servicesbecause of the high demand for these services in developed countries. ITeSs include BPO services andengineering services. A wide range of activities are covered under BPO services, such as customerinteraction; finance, accounting, and auditing services; human resource administration; legal serv-ices; business and corporate research; medical transcription; content development management; andpublishing services. Engineering services include embedded solutions, product design engineering,and architectural services.
14. This analysis is based on the firms that responded to the RBI survey: 912 firms in 2002/03 and1,070 firms in 2007/08. On the basis of the survey, software exports from India during 2007/08 were estimated at US$34.841 billion. Adding this amount to the software business conducted by the Indiansubsidiaries abroad in 2007/08 (US$6.3 billion) makes a total of US$41.1 billion. Thus, the survey esti-mates are very close to national aggregates published by NASSCOM (US$40.3 billion) in 2007/08.
15. Rupee appreciation in 2007 shaved off almost 15 percent in revenue growth, and IT firms havehad to focus on getting only 2 to 3 percent price increases and higher labor productivity to protecttheir bottom lines (India Knowledge@Wharton 2008).
16. Services have a number of intangible characteristics. Thus, geographic distance introduces sig-nificant uncertainty about the true characteristics of the services that are being purchased.
17. The standard models of trade and firm heterogeneity explain why some firms are able toexport while other firms are not; however, because the RBI survey covers only exporting firms, thisissue is not relevant here. For details on these models, see Antoniades (2008); Bernard, Redding, andSchott (2007); and Melitz (2003).
18. Manova and Shastry (2006) find that larger (in terms of employment) IT firms in India offer awider variety of services to a wider range of countries (and clients) and sell more products abroad.
19. The authors are grateful to Dr. Jay Pradhan for sharing his work on India’s outward FDIwith us.
20. India may be more efficient at exporting services than exporting goods because the relativeimprovements in education, infrastructure, and institutions have favored growth in service trade morethan manufacturing growth. However, given the data at hand, this hypothesis cannot be tested.
21. The state of electronic infrastructure in a country can be gauged by variables such as telephonelines per 100 persons, number of Internet users per 100 persons, use of computers per 100 persons,bandwidth of Internet connection, and number of mobile subscribers per 100 persons. The correlationbetween these alternative measures of electronic infrastructure is very high. Here the most commonlyused variable—that is, Internet penetration per 100 persons—was selected as a measure of the qualityof electronic infrastructure.
22. The service sector is characterized by higher skill intensity than is the manufacturing sec-tor. There is a paucity of rigorous empirical literature on the role of human capital in promoting
116 Exporting Services

service exports. For instance, Rodrik and Subramanian (2004) note that India’s productivitygrowth in the past two decades has benefited from India’s stock of highly educated labor, but theyprovide no formal evidence. Similarly, Gordon and Gupta (2004) highlight a number of factorsbehind India’s “service revolution,” but human capital is not one of them. Shand and Bhide (2000)and Ahluwalia (2000), however, include measures of human capital to analyze variations in growthrates across Indian states in the post-1980 period, but both of these studies rely entirely on literacyrates.
23. This study tried using the rule of law, obtained from Kaufmann, Kraay, and Mastruzzi (2006),as a measure of institutions. However, this variable has a high correlation with GDP per capita (0.78),Internet penetration (0.69), and human capital (0.81), and it also lacks time variation.
24. This section is based on the background paper prepared for this chapter by Banerjee andGupta of the Confederation of Indian Industry.
25. The IT sector in India received the direct attention of policy makers only after 1984. However,state intervention in other sectors of the economy had a positive influence on India’s IT sector.
26. For example, a firm could pay off its debt at the expense of its onsite staff.27. EPZs are industrial zones with special incentives set up to attract foreign investors. In EPZs,
imported materials must undergo some degree of processing before being exported again.28. Texas Instruments set up an office in Bangalore with a direct satellite link to the United States
in 1985. The government announced plans for an STP project in 1986, and Texas Instruments was thefirst company to take advantage of these plans. It established its own STP in Bangalore, Karnataka, in1987.
29. In the late 1970s, the Indian government passed the Foreign Exchange Regulation Act. Laterrepealed in 1992, the controversial act forced all multinationals to reduce their equity share in theirIndian subsidiaries to less than 50 percent.
30. The 1969 Monopolistic and Restrictive Trade Practices Act ensured that the operation of theeconomic system did not result in the concentration of economic power in the hands of few, providedfor the control of monopolies, and prohibited monopolistic and restrictive trade practices.
31. NSR was set up and is managed by NSDL Database Management Limited (a wholly ownedsubsidiary of National Securities Depository Limited) on behalf of NASSCOM. NSR is a centralizeddatabase of employees of Indian BPO and IT service companies. It contains any personal, qualifying,and career information of IT professionals that has been verified by a third party. NSR is an employee-friendly measure to minimize misuse of an employee’s identity, and the database allows employers toview the verified resumes of IT professionals. For more information, see NSR’s website at https://nationalskillsregistry.com/aboutus.htm.
32. DSCI is a not-for-profit organization that was established with the objective of building acredible and committed body to uphold a high level of data privacy and security standards.
33. The NASSCOM website is http://www.nasscom.in/Nasscom/templates/NormalPage.aspx?id=5365.
References
Acemoglu, Daron, Simon Johnson, and James A. Robinson. 2000. “The Colonial Origins of Compara-tive Development: An Empirical Investigation.” NBER Working Paper 7771, National Bureau ofEconomic Research, Cambridge, MA.
Ahluwalia, Montek S. 2000. “Economic Performance of States in Post-reforms Period.” Economic andPolitical Weekly 35 (19): 1637–48.
Amin, Mohammad, and Aaditya Mattoo. 2008. “Human Capital and the Changing Structure of theIndian Economy.” Policy Research Working Paper 4576, World Bank, Washington, DC.
Antoniades, Alexis. 2008. “Heterogeneous Firms, Quality, and Trade.” Working Paper 4, Forum forResearch in Empirical International Trade, San Rafael, CA. http://www.freit.org/WorkingPapers/Papers/FirmLevelTrade/FREIT004.pdf.
A Cross-Country Analysis of Service Exports 117

Arora, Ashish, and Surendrakumar Bagde. 2010. “Human Capital and the Indian Software Industry.”NBER Working Paper 16167, National Bureau of Economic Research, Cambridge, MA.
Barro, Robert J., and Jong-Wha Lee. 2010. “A New Data Set of Educational Attainment in theWorld: 1950–2010.” NBER Working Paper 15902, National Bureau of Economic Research,Cambridge, MA.
Berkowitz, Daniel, Johannes Moenius, and Katharina Pistor. 2006. “Trade, Law, and Product Complex-ity.” Review of Economics and Statistics 88 (2): 363–73.
Bernard, Andrew B., Stephen J. Redding, and Peter K. Schott. 2007. “Comparative Advantage andHeterogeneous Firms.” Review of Economic Studies 74 (1): 31–66.
Bhattacharya, Rudrani, Ila Patnaik, and Ajay Shah. 2010. “Export versus FDI in Services.” IMF Work-ing Paper 10/290, International Monetary Fund, Washington, DC.
Borchert, Ingo, and Aaditya Mattoo. 2010. “The Crisis-Resilience of Services Trade.” Policy ResearchWorking Paper 4917, World Bank, Washington, DC.
Collier, Paul, and Jan Willem Gunning. 1999. “Explaining African Economic Performance.” Journal ofEconomic Literature (37) (1): 64–111.
Eaton, Jonathan, Samuel Kortum, and Francis Kramarz. 2004. “An Anatomy of International Trade:Evidence from French Firms.” Department of Economics, New York University, New York.http://www.econ.nyu.edu/user/eatonj/EKK.pdf.
Eichengreen, Barry, and Poonam Gupta. 2009. “Two Waves of Services Growth.” NBER Working Paper14968, National Bureau of Economic Research, Cambridge, MA.
———. 2010. “Services Sector Growth: India’s Road to Economic Growth.” ICRIER Working Paper249, Indian Council for Research on International Economic Relations, New Delhi.
Gordon, James, and Poonam Gupta. 2004. “Understanding India’s Services Revolution.” IMF WorkingPaper 04/171, International Monetary Fund, Washington, DC.
Gupta, Poonam, and Utsav Kumar. 2010. “Performance of Indian Manufacturing in the Post ReformPeriod.” MPRA Paper 24898, University Library of Munich, Munich, Germany.
Helpman, Elhanan, Marc J. Melitz, and Stephen R. Yeaple. 2004. “Export versus FDI with Heteroge-neous Firms.” American Economic Review 94 (1): 300–16.
IMF (International Monetary Fund). 1993. Balance of Payments Manual. Washington, DC: IMF.India Knowledge @ Wharton. 2008. “How Will Indian IT and BPO Firms Cope with a Global Slow-
down?” Wharton School, University of Pennsylvania. http://knowledge.wharton.upenn.edu/india/article.cfm?articleid=4254.
Jensen, J. Bradford, and Lori G. Kletzer. 2005. “Tradable Services: Understanding the Scope and Impactof Services Outsourcing.” Working Paper 05-09, Institute for International Economics, Washing-ton, DC.
Kapur, Devesh. 2002. “The Causes and Consequences of India’s IT Boom.” India Review 1 (2): 91–110.Kaufmann, Daniel, Aart Kraay, and Massimo Mastruzzi. 2006. “Governance Matters V: Governance
Indicators for 1996–2005.” Policy Research Working Paper 4012, World Bank, Washington, DC.Manova, Kalina, and Gauri Kartini Shastry. 2006. “Specialization and Neighborhood Effects in IT Out-
sourcing Firms in India.” Stanford University, Palo Alto, CA. http://www.stanford.edu/~manova/IT.pdf
Mathur, Somesh Kumar. 2007. “Indian IT Industry: A Performance Analysis and a Model for PossibleAdoption.” MPRA Paper 2368, University Library of Munich, Munich, Germany.
Melitz, Marc J. 2003. “The Impact of Trade on Intra-industry Reallocations and Aggregate IndustryProductivity.” Econometrica 71 (6): 1695–725.
Pradhan, Jaya Prakash. 2008a. “The Evolution of Indian Outward Foreign Direct Investment: Chang-ing Trends and Patterns.” International Journal of Technology and Globalisation 4 (1): 70–86.
———. 2008b. “Indian Direct Investment in Developing Countries: Emerging Trends and Develop-ment Impacts.” ISID Working Paper 2008/08, Institute for Studies in Industrial Development, New Delhi.
———. 2009. “Indian FDI Falls in Global Economic Crisis: Indian Multinationals Tread Cautiously.”Columbia FDI Perspective 11, Vale Columbia Center, Columbia University, New York.
118 Exporting Services

RBI (Reserve Bank of India). 2005. “Computer Services Exports from India: 2002–03.” RBI MonthlyBulletin 821–29.
———. 2009. “Survey on Computer Software and Information Technology Services Exports: 2007–08.”RBI Monthly Bulletin 1517–34.
RIDA (Research Institute of Development Assistance). 1996. “Information Technology Service Indus-tries in Developing Countries: Cases in India and Singapore.” OECF Research Paper 10, OverseasEconomic Cooperation Fund, Tokyo.
Rodrik, Dani. 1999. “Where Did All the Growth Go? External Shocks, Social Conflict, and GrowthCollapses.” Journal of Economic Growth 4 (4): 385–412.
Rodrik, Dani, and Arvind Subramanian. 2004. “From ‘Hindu Growth’ to Productivity Surge: TheMystery of the Indian Growth Transition.” NBER Working Paper 10376, National Bureau of Economic Research, Cambridge, MA.
Saxenian, AnnaLee. 1999. Silicon Valley’s New Immigrant Entrepreneurs. San Francisco, CA: Public Policy Institute of California.
———. 2000. “Back to India.” Wall Street Journal: Technology Journal Asia, January 24. http://interactive.wsj.com/archive/retrieve.cgi?id=SB948660121193873632.djm.
———. 2004. “The Bangalore Boom: From Brain Drain to Brain Circulation.” In IT Experience inIndia: Bridging the Digital Divide, ed. Kenneth Keniston and Deepak Kumar, 169–81. New Delhi:Sage.
Shand, Ric, and Shashanka Bhide. 2000. “Sources of Economic Growth: Regional Dimensions ofReforms.” Economic and Political Weekly 35 (42): 3747–57.
Srinivasan, Thirukodikava Nilakanta. 2005. “Information-Technology-Enabled Services andIndia’s Growth Prospects.” In Brookings Trade Forum 2005: Offshoring White-Collar Work, ed. Susan M. Collins and Lael Brainard, 203–31. Washington, DC: Brookings Institution Press.
UN (United Nations), European Commission, International Monetary Fund, Organisation for Eco-nomic Co-operation and Development, United Nations Conference on Trade and Development,and World Trade Organization. 2002. Manual on Statistics of International Trade in Services. NewYork: UN; Washington, DC: IMF. http://unstats.un.org/unsd/publication/Seriesm/Seriesm_86e.pdf.
A Cross-Country Analysis of Service Exports 119


Over the past decade, the Philippines has accounted for a small fraction (less than0.3 percent) of world commercial service exports. Albeit small in terms of volume,service exports from the Philippines rose by 3.6 percent on average per year duringthat period, faster than for Asia as a group (1.5 percent average annual growth; Asiaaccounts for one-fourth of world service exports).1 Philippine exports have beenconcentrated in transport, travel, and business process outsourcing (BPO) services.The BPO sector has performed remarkably well, as evidenced by its third-largestglobal BPO market share, whereas the transport sector has grown only mildly, andthe travel sector has been, despite its short-lived uplift in 2006–07, largely stagnant.
The Philippines has been successful at exporting services through the movementof workers (mode 4). Remittances from overseas Filipino workers (OFWs) have beenfar greater than total commercial service exports, accounting for 10 percent of grossdomestic product (GDP) in 2010. Even amid the global financing crisis, remittancesincreased by 5.6 percent in 2009 and by a further 8.2 percent in 2010. The govern-ment has been proactive in promoting the labor movement abroad. Since the enact-ment of the Labor Code in 1974, the government has set up public agencies (Orbeta,Abrigo, and Cabalfin 2009). Furthermore, the government has actively negotiatedbilateral labor agreements to facilitate the movement of workers and to protect theirrights in host countries.
121
Reaching the Worldthrough PrivateSector Initiative:
Service Exports fromthe Philippines
Soonhwa Yi
4

122 Exporting Services
This chapter attempts to shed some light on the factors behind the divergentperformance of various service exports within the Philippines. In particular, itfocuses on three questions:
• Which services performed well in exporting and which ones lagged?• What are the characteristics of the sectors with relatively good or poor
performance?• What strategies, fundamentals, and policies contributed to service exports or
failed to boost the sector to export?
In the Philippines, the private sector’s proactive involvement seems to be a keyto successful export performance. Also, in 2004 the Philippine government recog-nized service exports as one of the priorities for employment generation and for-eign exchange earnings (Executive Order No. 372 in 2004), resulting in the forma-tion of a public-private partnership task force. Successful service exports from thePhilippines can also be attributed to strong global demand as well as some supply-side characteristics such as factor endowments, price competitiveness, and tosome extent, favorable fiscal incentives. The Philippine BPO sector has been wellpositioned to benefit from all of these advantages.
The Philippines offers an attractive holiday destination with abundant naturalresources and strong price competitiveness. International tourist arrivalsrebounded in 2009 with the waning of effects of the global financial crisis. Thecountry has competitive prices and strength in English-speaking tourism, withfurther potential to expand in the field of medical and retirement tourism. Never-theless, tourism export receipts have been flat at about 3 percent of GDP over thepast two decades, reflecting supply-side constraints, particularly from the weaktransport infrastructure. It is well documented that investments have been insuffi-cient to upgrade transport infrastructure. Slow progress in deregulating air trans-port services lowers accessibility and impedes competition. The absence of online,one-stop travel portals generates some inconvenience associated with reservingairline tickets and hotel facilities.
In addition, the weak business environment may impede service exports, as itdoes other sectors. The World Bank’s Doing Business 2011 ranking reports thatstarting a business takes 38 days. Business leaders point to corruption as themost problematic factor for productivity in the Philippines (Schwab 2010). Poorinfrastructure and weak business environment can lower the productivity of anindustry (for example, tourism) so much that even fiscal incentives or zonesestablished under the Philippine Economic Zone Authority (PEZA) couldbecome less effective in promoting foreign investments and exports. To counterthe weak business environment, PEZA offers one-stop business registrationservices to PEZA-registered firms.

Service Exports from the Philippines 123
The rest of this chapter is organized as follows. The first section describes serv-ice exports in the context of the Philippine economy. The following sectionreports on factors behind the success of the BPO sector, including fundamentalsand government policies and strategies. Next, impediments to exports for thetourism sector, whose performance is yet to reach its full potential, are discussed,followed by a concluding section.
Service Exports in the Context of the Philippine Economy
The Philippines stands out in East Asia and the Pacific as a country with a largeservice sector and high private consumption. Overall, the service sector hasaccounted for more than half of the Philippine GDP and employed about half ofthe country’s labor force in 2009. Despite the importance of the service sector inthe economy, the direct contribution of cross-border service exports to GDP(value added) is rather small: it stands at 6.3 percent of GDP in 2009, or US$10billion. In the world service export market, the Philippines is a marginal player,accounting for less than 0.5 percent of world service exports in 2009.
Service exports from the Philippines: A snapshot
Cross-border service exports (a proxy for modes 1 and 2) from the Philippinesgrew significantly faster than goods exports from 2005 to 2009 (figure 4.1). Serv-ice exports as a percentage of total exports increased from 9 percent in 1999 to 21percent in 2009. Since 2006, unlike many developing countries, the Philippineshas been a net exporter of services.
As in other developing countries, the largest receipt from service exporting wastraditionally in tourism—expenditures from foreigners visiting the country(Karsenty 2000). The travel sector accounted for 74 percent of service exports in1999. During recent years, however, the BPO industry took a quantum leap for-ward and is now the biggest service export sector, recording 60 percent of serviceexports in 2009 (figure 4.2). Furthermore, the sector exhibited its resilience to theglobal financial crisis.
As shown in table 4.1, the revealed comparative advantage (RCA) index (Bal-assa 1965) indicates that other business services and computer and informationservices have gained comparative advantage in recent years and that communica-tion services has maintained comparative advantage over the past decade.2 ThePhilippines has maintained its comparative advantage in travel services over thepast decade, but the level has decreased over time and turned into a comparativedisadvantage in 2009 because of unfavorable external conditions. Comparativeadvantage in transport services was short lived—lasting only during the relatively

124 Exporting Services
Figure 4.1. Growth in Exports of Goods and Services, 1999–2009
grow
th c
omp
ared
to
1999
, 199
9 =
0 (%
)
–50
0
50
100
150
200
1999
2000
2001
2002
2003
2004
2005
2006
2007
2008
2009
goods services
Source: Author’s calculations based on data from Bangko Sentral ng Pilipinas.
Figure 4.2. Information and Business Services as a Proxy for BPO, 1999–2009
0
10
20
30
40
50
60
70
80
1999
2000
2001
2002
2003
2004
2005
2006
2007
2008
2009
shar
e of
ser
vice
exp
orts
(%
)
travel information and business services
Source: Author’s calculations based on data from Bangko Sentral ng Pilipinas.

Table 4.1. Revealed Comparative Advantage Index, 1999–2009
Service sector 1999 2000 2001 2002 2003 2004 2005 2006 2007 2008 2009
Transport 0.39 0.60 0.85 1.18 1.31 1.12 0.95 0.81 0.61 0.58 0.61Travel 2.39 2.09 1.91 1.76 1.61 1.79 1.85 2.09 2.01 1.05 0.95Communication 1.89 2.50 4.77 5.27 5.90 5.51 5.13 3.74 2.29 1.79 1.39Construction 0.69 1.50 1.06 0.46 0.74 0.94 0.73 0.51 0.54 0.37 0.30Insurance 0.18 0.21 0.22 0.13 0.13 0.12 0.20 0.16 0.11 0.08 0.13Financial 0.32 0.36 0.20 0.17 0.20 0.17 0.18 0.21 0.11 0.08 0.10Computer and information 0.68 0.75 0.21 0.30 0.21 0.20 0.47 0.33 0.65 2.22 2.78Royalties and license fees 0.03 0.04 0.01 0.01 0.02 0.06 0.03 0.02 0.01 0.00 0.00Other business services 0.29 0.38 0.37 0.37 0.40 0.38 0.50 0.61 1.06 1.81 1.94
Source: Author’s calculations based on International Monetary Fund balance of payments data.
12
5

126 Exporting Services
high GDP growth period. The country has had a comparative disadvantage ininsurance and financial services.
In contrast to mode 4 exports (described in box 4.1), mode 3 (outward foreigndirect investment) service exports from the Philippines are notable in franchising.Although cross-border exports of royalties and license fees are small (about US$5million in 2007), Philippine franchisors have penetrated foreign markets throughmode 3, particularly in the United States, the Middle East, and Asia, targetingFilipino diasporas. According to the Philippine Franchise Association (PFA), theynumber, as of April 2009, 325 outlets of 17 Philippine franchise brands abroad.Nearly 60 percent of the franchise business abroad is related to food. Retailbranches constitute 24 percent, and other service franchises account for 18 percent.The global franchising market accounts for 11 percent of total private sector outputs, or US$2.31 trillion in 2009, according to the PFA (http://www.franchisephilippinesonline.com/). To tap on this large global franchising market,somewhat similar to the way BPO stakeholders approached development of thatindustry, the PFA recently developed a master plan that includes strategies forexport, including piloting franchise exports.
Service trade environment: A broad picture
The Philippines has a fairly open regime for foreign market access, with a tariff rateas low as 3.8 percent. In contrast, service trade openness is below the regional aver-age. The country scores only 14.08 of 100.00 (best) in the overall General Agreementon Trade in Services (GATS) commitment index, ranking 83rd of 148 countries.Under the GATS, the Philippine government committed to bind all restrictions onmarket access and has applied national treatment in financial, transport, communi-cations, and tourism and travel-related services. The Philippines made commit-ments under basic telecommunication and financial services, but their effectivenessis pending its senate’s ratification of the GATS Fourth (basic telecommunications)and Fifth Protocols (financial services) (USTR 2010).
As for movement of natural persons (mode 4), the Philippines has systems inplace to help workers move abroad. The Philippines Overseas EmploymentAdministration regulates the recruitment industry and manages the deploy-ment process, the Overseas Workers Welfare Administration offers welfare serv-ices and predeparture seminars, and the National Reintegration Center forOverseas Filipino Workers provides returning migrant workers with services forreintegration into Philippine society. The government has been actively negoti-ating bilateral labor agreements. A recent agreement between Japan and thePhilippines for an economic partnership allows Philippine nurses, care workers,and seafarers to work in Japan, provided that they meet certain requirements.

Service Exports from the Philippines 127
Box 4.1: Exporting Services through the Movement of Labor: The Pattern
After the larger economies of India, China, and Mexico, the Philippines is the world’sfourth-largest remittance recipient in absolute terms: the Philippines central bank,Bangko Sentral ng Pilipinas, expanded amid the global financial crisis and reported arecord high level of remittances in 2010, US$19 billion. Remittances constitute about10 percent of GDP, compared with 1, 2, and 3 percent in China, India, and Mexico,respectively, and far greater than the rest of the Association of Southeast AsianNations (box figure 4.1.A). Remittances are the biggest source of foreign exchangeearnings for the Philippines. They contribute markedly to the current account surplusand are a major vehicle fueling the economy’s strong consumption.
Box Figure 4.1.A. Remittances in the Philippines Compared withNeighboring Countries, 1980–2010
Sources: World Bank for remittance data; International Monetary Fund for GDP data.
Geographically diverse destinations of OFWs contribute to the stability ofremittance inflows. Box table 4.1.A shows that workers from other Asian nationsmigrated to neighboring Asian countries. In contrast, the destinations of OFWs in2007 are, in order of prominence, the United States, the United Arab Emirates,Singapore, Canada, and Australia. This diversification might have contributed toinsulate the overall remittance flows from adverse shocks in one host country.
Greater demand in the personal care area boosted female deployment. Femalemigration is close to half of new deployment in 2007 and concentrated in theoccupations of domestic household helper, caregiver, nurse, and cleaner. Maleworkers are deployed as general laborers, electrical wiremen, plumbers (includingpipe fitters), and production workers. Waiters and other service workers are more orless equally distributed across the genders (box figure 4.1.B).
However, the number of higher-skilled migrants was again overtaken by that ofproduction migrants. Box figure 4.1.C shows that the new deployment of workers inthe production and professional (and technical) sectors is in opposite directions.Furthermore, the chart confirms the traditional view that a large share of OFWs areservice providers.
–2
0
2
4
6
8
10
12
14
shar
e of
GD
P (%
)
16
18
1980
1982
1984
1986
1988
1990
1992
1994
1996
1998
2000
2002
2004
2006
2008
2010
Indonesia Malaysia Thailand Philippines
(Box continues on the following pages.)

128 Exporting Services
Box 4.1: Exporting Services through the Movement of Labor: The Pattern(continued)
Box Figure 4.1.B. New Deployment by Occupation and Gender, 2007
Source: Data from the Philippines Overseas Employment Adminnistration.
Box Table 4.1.A. Numbers of Overseas Workers
Origin country
Number of migrant
workers Main destination Year
Cambodia 183,541 Thailand 2006China 530,000 Middle East, Asia and the Pacific,
Africa2004
Indonesia 2,700,000 Malaysia; Saudi Arabia; Taiwan,China; Singapore; Republic of Korea;United Arab Emirates
2007
Lao PDR 173,000 Thailand 2004Malaysia 250,000 Japan; Taiwan, China 1995Myanmar 1,840,000 Thailand 2006Philippines 8,726,520 United States, United Arab Emirates,
Singapore, Canada, Australia 2007
Singapore 150,000 — 2002Thailand 340,000 Saudi Arabia; Taiwan, China;
Myanmar; Singapore; Brunei Darussalam, Malaysia
2002
Vietnam 400,000 Republic of Korea; Japan; Malaysia; Taiwan, China
2005
Sources: Hugo and Young 2008; Philippine data are from the Philippines Overseas EmploymentAdministration. Note: — = not available.
0
20
40
60
80
shar
e of
wor
kers
(%
)
100
dom
estic
help
ers
care
giver
s
nurse
s
char
worke
rs an
d cle
aner
s
waiter
s
servi
ce w
orke
rs
prod
uctio
n wor
kers
gene
ral la
bore
rs
electr
ician
s
plum
bers
female male

Service Exports from the Philippines 129
Box Figure 4.1.C. New Deployment by Skill Category, 1995–2007
Source: Data from the Philippines Overseas Employment Administration.
The Middle East absorbed the largest number of OFWs in 2007 (box table 4.1.B).Among the destinations for service providers, Hong Kong SAR, China, has been themain destination of domestic helpers, absorbing 46 percent of total deployment in2007, followed by the Middle East. Taiwan, China, has hosted the largest number ofcaregivers. Saudi Arabia has absorbed the lion’s share of production-related workers,followed by Taiwan, China; the United Arab Emirates; and Qatar. For physiotherapistsand teachers, the United States is the main destination.
Remittances encourage commercial banks to develop innovative bankingproducts. With stagnant loan growth, remittances are an important line of businessin the Philippines and thus contribute to stronger competition among the banks byreaching out to Filipinos abroad. New banking services have sprung up besidetraditional ones. For instance, in 2007, MetroBank opened Internet money-transferservices in partnership with Xoom.com that allow OFWs to transfer money over theInternet. Banco de Oro, in alliance with the SM Group, allows beneficiaries to pick upremittances at SM malls or hypermarkets (SM’s supermarket) (Carroll 2008). GlobeTelecom, a leading mobile network operator in the Philippines, developed GCASH,which allows users to send and receive remittances in the equivalent peso amountthrough a global mobile phone, make purchases and bill payments (including tuitionfees), and give donations via short message service. Such a system helps lowertransaction costs and further facilitates direct and convenient delivery of cross-borderfinancial services.
0
10
20
30
shar
e of
tot
al n
ew d
eplo
ymen
t p
er y
ear
(%)
40
50
1995
1997
1999
2001
2003
2005
2007
production service professional
(Box continues on the following pages.)

130
Expo
rting
Services
Box Table 4.1.B. Destination of Deployment by Skill Category, 2007
Item
Share of total deployment (%)
Americas Middle East Asia Europe Others Total
Administrative, clerical, and managerial workers 0.16 4.29 0.25 0.04 0.10 4.84Agriculture-related workers (including fishermen and hunters) 0.06 0.18 0.01 0.01 0.06 0.31Production-related workers (including laborers) 1.08 27.58 9.47 0.40 1.30 39.83Professional, technical-related workers 0.85 9.60 2.86 0.20 0.37 13.89 Social workers, doctors, nurses, midwives, and medical assistants 0.10 2.83 0.17 0.06 0.02 3.20
Sales workers 0.04 2.39 0.11 0.01 0.05 2.60Service workers 2.57 17.61 11.61 3.12 0.15 35.06General services workers, domestic helpers, caregivers, and
housekeepers 2.01 8.40 11.31 2.99 0.04 24.75
Not stated 0.26 2.74 0.21 0.11 0.15 3.47Total 5.02 64.39 24.51 3.90 2.18 100.00
Source: Data from the Philippines Overseas Employment Administration.Note: Totals may not sum because of rounding.
Bo
x 4
.1:
Exporting Services through the M
ovement of Labor: The Pattern
(continued)

Service Exports from the Philippines 131
Similarly, the investment regime in the Philippines is relatively open. ThePhilippines adopts the negative list approach with regard to investment liberaliza-tion. Foreign equity participation is allowed up to 100 percent in all activitiesexcept those identified in Foreign Investment Negative List A and List B. Underthe Association of Southeast Asian Nations (ASEAN), the country plans to relaxforeign ownership limits from 40 percent to 70 percent in the sectors of air trans-port, telecommunications, tourism, and health care by 2010, but implementationis pending at the time of this writing. The negative lists are applied only to domes-tic market enterprises. Export enterprises that export more than 60 percent oftheir output face no restrictions on the extent of foreign ownership.
The Philippines provides several forms of investment incentives to encourageforeign investment. Firms engaging in the activities set out in the government’sInvestment Priorities Plan (IPP) are allowed to register with the Board of Invest-ments (BOI) for fiscal incentives: income tax holidays (ITHs) of up to eight years,tax deductions equivalent to 50 percent of wages of direct-hire workers, and dutyexemptions for imports of raw materials. For firms engaging in non-IPP activities,the incentives are limited to domestic-owned or foreign-owned (that is, 40 per-cent or more foreign ownership) firms that export at least 50 or 70 percent of pro-duction, respectively. Firms established in the PEZA and tourism enterprise zones(TEZs) enjoy additional incentives—such as a 5 percent gross income tax rate;exemption from all local government imposts, fees, licenses, or taxes; and exemp-tion from expanded withholding tax—but PEZA firms are required to export atleast 70 percent of their output.
Behind-the-border strengths include a large pool of labor ready to be tappedfor service export areas. Unlike other countries at the initial factor-driven stageof development, the Philippines has a relatively large pool of skilled, English-proficient workers (Schwab 2010). The World Bank’s 2006 Investment ClimateAssessment (ICA) and 2009 Enterprise Survey found that the Philippine busi-ness community perceives labor skills to be the least important obstacle to pro-ductivity, whereas businesses in Malaysia and Thailand see labor skills as themost important constraint.
The business environment calls for reforms. The World Bank’s Doing Business2011 data for the Philippines rank the country 148th among 183 economies interms of ease of doing business. The World Economic Forum’s 2010 ExecutiveOpinion Survey and the World Bank’s 2009 Enterprise Survey and 2006 ICAreport that firms perceive corruption as the most binding constraint to their busi-ness productivity, followed by inefficient government bureaucracy.
Weak infrastructure is a major constraint to the country’s competitiveness. TheWorld Economic Forum’s 2010–11 Global Competitiveness Index ranks thePhilippines 104th of 139 countries in the infrastructure pillar, far behind Indonesia

(82nd) and Vietnam (83rd) (Schwab 2010). Business leaders consider inadequatesupply of infrastructure as the third most problematic factor for productivity.
In infrastructure, high energy costs and occasional power shortages are of direconcern to Philippine businesses. The average value lost because of power outagesis approximately 5 percent of sales in the Philippines and 3 percent in Indonesia.The average cost of electricity in the Philippines is the highest among the ASEANeconomies: in 2007 the average cost in the Philippines was US$0.175 per kilowatt-hour. Even Singapore offers cheaper rates, US$0.1307 per kilowatt-hour.3 It isinteresting to note that tourism sector studies find that energy is less of an obsta-cle to tourism productivity.
Despite the fiscal incentives in place, the 2006 ICA and 2009 Enterprise Surveyfound that the business community in the Philippines continues to perceive thattax rates (at 49.4 percent) and administration (47 payments annually) hinder pro-ductivity. In recent years, overall tax rates went down slightly, but they are stillhigher than the East Asian and Pacific regional average (36.1 percent). The taxpayment frequency has a similar tendency (24.6 payments yearly for the region).
The BPO Sector and Factors behind Its Success
The Philippine BPO industry displayed impressive growth. According to the Busi-ness Processing Association of the Philippines (BPAP), full-time employmentgrowth climbed to 340 percent—from 100,000 workers in 2000 to 443,000 in2009—and BPO revenues soared by nearly 400 percent, from US$1.5 billion in2004 to US$7.2 billion in 2009. Nearly 100 percent of revenues are exportedaccording to BPAP.
Characteristics of BPO service exports from the Philippines
What are the characteristics of this sector? The Philippines has a long history ofBPO, although multinational companies have mainly led the industry. Forinstance, HSBC has outsourced in the country since the 19th century, and IBMsince the 1950s. The area of concentration in the early days was data entry, espe-cially accounting. Benefiting from improved global connectivity, contact centersrecently became the industry leader.4
Building on this initial status, Philippine BPO is now at the mature productionstage. The country accounted for 15 percent of the global BPO market in 2008,after India (37 percent) and Canada (27 percent). Output boasted a quantum leapfrom US$0.3 billion in 2001 to US$6 billion in 2008. BPAP forecasts the sector’sgrowth at 26 percent in 2010 and 27 percent in 2011, to US$11.6 billion. The
132 Exporting Services

industry had 515 information technology (IT)–BPO firms in 2009, comprising279 foreign firms and 236 local firms, according to BPAP.5
Naturally, BPO’s contribution to GDP surged, from 0.5 percent in 2001 to 3.7percent in 2008. This figure implies that, of the country’s 3.8 percent GDP growthin 2008, 0.9 percentage points were owed to BPO service outputs. This figure issignificant for a country with an average growth rate of 4.0 percent in the 2000s.
As shown in table 4.2, of BPO services, contact centers are the biggest industry.6
They had an average growth rate of 40 percent from 2004 to 2009, with revenuesof US$5 billion and 280,000 full-time employees (FTEs) in 2009. Back-office func-tion is the second-biggest BPO subsector and scored rapid growth, with an aver-age growth rate of 58 percent from 2004 to 2009.
The industry has shown its resilience to adverse exogenous shocks. Despite theglobal financial crisis, BPO continues to grow: 19 percent growth year-on-year in2009 in terms of both revenues and new FTEs (table 4.2). A substitution effect—outsourcing or offshoring to lower-cost locations—may explain this resilience(Gereffi and Fernández-Stark 2010). The Philippines has seen it in action. Forinstance, in September 2008, JPMorgan Chase opened its 14,050-seat call centerfacility in Taguig City, Metro Manila (Outsourcing Portal 2008). The company’snew office in Taguig City will house 6,100 additional seats (Remo 2010).
In the Philippines, both captive operations and third-party providers are well-established types of outsourcing operations. Multinational companies have a ten-dency to choose this captive model. A change in tax incentives in the home coun-try of a foreign affiliate can influence the outsourcing firm type.7 Like JPMorganChase, firms may also choose a hybrid model, depending on the situation.
The global competitiveness of the Philippines has challenged India’ssupremacy in the industry, but some indications of specialization exist. Going for-ward, the National Association of Software and Services Companies of India viewsChina and the Philippines as the strongest competition to India. Everest ResearchInstitute (2009, 2), in contrast, sees the Philippines as complementing India inproviding specific services. The Philippines has a competitive advantage in con-tact centers (customer care) and has been gaining strength in back-office func-tions such as finance and accounting (A.T. Kearney 2009), whereas India is strongin IT and China is distinctive in engineering (BPAP 2007).
Traditionally, the United States has been the main export destination for thePhilippine BPO sector, especially for contact center services, but demand fromJapan has been increasing (table 4.3). Services outsourced by Japan are concen-trated in the areas of software development, animation, and other IT-orientedBPOs. BPO service provision to Japan in the early days of the 1980s, as well as thegeographic proximity of the Philippines to Japan, time-zone alignment, and high
Service Exports from the Philippines 133

Table 4.2. Revenues and Employment, by BPO Category, 2000–09
Percentage oftotal in
BPO category 2000 2004 2005 2006 2007 2008 2009 2009
Revenues (US$ million)
BPO, voiceContact centers 24 1,024 1,792 2,360 3,600 4,100 5,000 69.2
BPO, nonvoiceBack officea 120 180 288 398 827 1,118 15.5Transcription 72 70 109 137 182 187 2.6Medical 42 25 48 69 89 94 1.3Legal 4 6 9 9 18 18 0.2Other data 26 39 52 59 75 75 1.0
KPOAnimation 52 74 97 105 120 120 1.7
ITO 170 204 272 423 601 568 7.9ESO 37 55 81 153 231 233 3.2Digital content or game development portion 3 7 13 1 3 5 0.1
Total 1,475 2,375 3,207 4,816 6,061 7,225Nominal year-on-year growth rate (%) 61.0 35.0 50.2 25.8 19.2
Year
134

FTEs (thousand)BPO, voiceContact center 2.4 64 112 160 198 227 280 3.9
BPO, nonvoiceBack officea 15 23 36 40 69 86 1.2Transcription 6 9 12 16 20 20 0.3Medical 4 6 7 10 13 13 0.2Legal 0 0 1 1 2 2 0Other data 2 3 4 5 6 6 0.1
KPOAnimation 3 5 7 7 8 8 0.1
ITO 10 12 16 29 35 35 0.5ESO 2 3 5 8 13 13 0.2
Digital content or game development portion 0 1 1 0 1 1 0Total 101 163 236 299 372 442Nominal year-on-year growth rate (%) 62 44 27 24 19
Source: Data from BPAP.Note: BPO = business process outsourcing; ESO = engineering services outsourcing; FTE = full-time employees; ITO = information technology outsourcing; KPO = knowledge process outsourcing. Totals may not sum because of rounding.a. Includes BPAP estimates.
13
5

labor costs and changing demographics in Japan, could explain this increase of“near-shoring” to some extent.
Estimates obtained from BPAP data indicate that for contact centers, softwaredevelopment, and animation, labor productivity (proxied by revenue per worker)is independent of firm size. However, small and medium-size enterprises (SMEs)in the areas of back-office functions and medical transcription tend to have signif-icantly lower labor productivity than large firms in their respective field. Whetherany optimal firm size exists for these nonvoice BPO services is an interesting areafor further research.
Foreign equity participation has been expansive (table 4.4), particularly in2008. Of total equity investment in the industry (US$2 billion), about 93 percent(US$1.8 billion) represented foreign equity participation. U.S. investment wasconcentrated in contact centers, whereas Japanese investment has been in softwaredevelopment. Even developing countries such as India and Indonesia acquiredcontact center firms in the Philippines (BSP 2010).
Industry stakeholder informants indicated that U.S. equity participations tendto be in wholly owned firms rather than joint ventures, perhaps because of theU.S. Foreign Corrupt Practices Act of 19778 as well as data protection concerns.Smarzynska and Wei (2000) found that corruption increases the value of a localjoint venture partner to a foreign investor. In contrast, a foreign investor withsophisticated technology that has concerns about leakage of technological know-how is less inclined to form a joint venture.
Although the majority of foreign BPO firms engage in contact centers, localBPO firms concentrate in transcription and animation (table 4.5). For instance,local medical transcription firms outnumber foreign ones by nearly three to one,whereas the reverse is the case for contact centers (local:foreign = 1:2). Many
136 Exporting Services
Table 4.3. BPO Export Destinations, 2005–08
Share of total (%)
Destination 2005 2006 2007 2008
United States 86.0 81.0 73.2 67.6Japan 3.2 3.2 9.6 16.2Europe 7.1 10.1 8.6 9.0Other Asia 2.4 4.0 7.0 5.5Australia and New Zealand 1.3 0.7 0.5 1.1Canada n.a. 1.0 0.2 0.2Others 0.0 0.0 0.0 0.2
Source: Data from BPAP.Note: n.a. = not applicable.

medical transcription firms are SMEs,9 and revenue per worker of SMEs is onlyone-tenth that of large medical transcription firms, corroborating the firm het-erogeneity literature.
Factors behind successful BPO service exports
As mentioned earlier, the BPO sector made a staggering achievement. What madethis growth possible in the Philippines when it had neither a designated nor an
Service Exports from the Philippines 137
Table 4.4. Foreign Equity Participation, 2005–08Ratio of foreign equity to total equity (%)
BPO category 2005 2006 2007 2008
Contact center 87.6 92.0 98.1 96.5Transcription 52.5 71.0 100.0 100.0Animation 38.4 95.8 97.2 100.0Software development 37.0 73.9 50.9 84.6Other BPOs 47.5 23.2 93.1 85.6Total 66.9 60.4 87.9 93.3
Source: BSP 2010, table 3.1.
Table 4.5. Number of Firms, by Ownership and by BPO Category, 2009
Total foreign BPO category owned U.S. owned Locally owned Total
BPO, voiceContact center 151 77 77 228
BPO, nonvoiceBack officea 8 8 6 14Transcription 29 24 79 108Medical 25 21 73 98Legal 4 3 6 10
KPOAnimation 9 6 32 41
ITOSoftware development 47 23 29 76
ESODigital content 6 5 4 10Engineering design 29 7 9 38
Total 279 150 236 515
Source: Data from BPAP.Note: BPO = business process outsourcing; ESO = engineering services outsourcing; ITO = informationtechnology outsourcing; KPO = knowledge process outsourcing.a. Finance and accounting firms and human resource firms are excluded.

independent regulatory body representing the industry? All the key factors forBPO operations are in the right place. The Philippines offers favorable factor con-ditions, industry conditions, and government supports for BPO operations (table4.6). Nonetheless, BPO businesses have cited tight labor market conditions andcorruption as key concerns to their business (BPAP 2010).
Low labor costsAccording to A.T. Kearney’s (2011) Global Services Location Index, compensationcosts in the Philippines are at par with those of India (figure 4.3). The averagemonthly wage paid to a Filipino BPO worker was 16,928 (or about US$385),according to Messenger and Ghosheh (2010). The Department of Trade and Indus-try reports that wages constitute 50 percent of total operating costs of a BPO firm,followed by buildings, facilities, and office infrastructure (20 percent); training andbusiness trips (15 percent); and utilities and communications (10 percent).
Young talent pool, English proficiency, and affinities to U.S. culture and systems A large pool of young talent fueled the industry’s fast growth. In terms of thenumber of graduates, 2008 saw 444,810 college graduates suitable to be tapped forthe industry. Table 4.7 details the talent pool available across services as of 2009.A large resource pool in the medical field (in particular, nurses) is notable, largelybecause the subject offers better prospects for job opportunities abroad than othersubjects.
138 Exporting Services
Table 4.6. High or Low Philippine Performance in Key Buy Factors
• Considerable pool of generalist and specialist talent• Strong English skills, both verbal and written
• Among the lowest in labor costs• Genuine global reputation in voice with multiple signature locators
• World-class telecommunications• Abundant and low-cost real estate in major urban areas• Accessibility
• Competitive incentives (for example, income tax holiday)Conducivebusinessenvironment
Qualityinfrastructure
Operationalperformance
Suitable andabundant talent
Key buy factors Performance Key points
• Specialized programs addressing near-term issues (for example, near-hire voucher program)• Supportive local and national governments
1
2
3
4
Source: BPAP 2007, 19.Note: Gray indicates high performance; black indicates low performance.

Furthermore, the share of the labor force considered suitable for the BPO sec-tor is as high as, or even higher than, that of other potential BPO destinations inAsia (BPAP 2007). Interviews with human resource managers, human resourceagencies, and heads of global resourcing centers reveal that 20 percent of engi-neers, 30 percent of finance and accounting graduates, and 30 percent of general-ists in the Philippines are suitable for work in multilateral settings, whereas theshare is 10 percent, 15 percent, and 3 percent, respectively, for Chinese graduates(table 4.8).
Filipinos’ warm personality and their affinities to the U.S. culture, education,and legal system are other factors that have contributed to the success of contactcenters, particularly customer care services. In addition, the Philippine legal andaccounting systems are similar to those of the United States because of the closeties of those countries; hence, the Philippines is well equipped to meet the needs
Service Exports from the Philippines 139
Figure 4.3. Comparative Financial Attractiveness Scores, 2011
0.54
6.86
5.73
6.87
0 2 4 6 8 10
United States
China
India
Philippines
compensation costs infrastructure costs tax and regulatory costs
Source: A.T. Kearney 2011, “financial attractiveness” subcategory.
Table 4.7. Talent Pool, 2007
Talent pool Number
Colleges and universities that produce graduates suitable for the BPO sector 2,036
Graduates ready for the BPO sector
General 3,411Business administration 95,646Medical 110,312Engineering 49,617IT 35,901
Source: Commission on Higher Education, Quezon City.Note: Data as of February 2009.

of U.S. firms for legal transcription outsourcing and financial and accounting out-sourcing (BPAP 2007).
Low telecommunication costsTelecommunications is a critical input for exporting BPO services. In contrastto the overall weak infrastructure in the Philippines, the telecommunicationinfrastructure is strong. According to the 2006 ICA, businesses in the Philippinesperceive that, of possible business constraints, telecommunications is the leastproblematic: only 10 percent of businesses perceive it as a constraint to theiroperations.
Liberalization of the telecommunication industry in 1993 has increasedcompetitiveness and hence improved the quality and efficiency of the telecom-munication infrastructure (World Bank 2009). Allowing competition in locallong-distance services in 1995 and permitting international simple resale led toa greater reduction in accounting rates and retail prices in the Philippines thanis found in other countries that liberalized their telecommunication sector(Fink, Mattoo, and Rathindran 2001). Furthermore, the National Telecommuni-cations Commission ruled that Voice over Internet Protocol (VoIP) is a value-added service and not a franchise, which resulted in an increase of VoIPproviders and a decline in VoIP costs from US$0.40 to US$0.02 per minute.Lower communication costs shifted the country’s comparative advantagetoward the more communication-intensive BPO industry.
Low real estate costs Real estate availability in the Philippines is high, and rates are attractive. In thewake of the Asian financial crisis, many buildings in Makati City, the main busi-ness district in Manila, became vacant. As the BPO sector began to rise during1999–2001, office facilities were readily available for BPO firms. Success in BPObusiness has boosted real estate development and changed the capital city’s
140 Exporting Services
Table 4.8. Proportion of Graduates Suitable for the BPO Sector
Suitable graduates in each subsector, out of 100
Country Engineer Finance and accounting Generalist
China 10 15 3India 25 15 10Malaysia 35 25 20Philippines 20 30 30
Sources: BPAP 2007, based on interviews with human resource managers, human resource agencies, andheads of global resourcing centers; McKinsey Global Institute.

landscape, especially in Taguig. According to BPAP (2007), Makati offers a lowerrate (US$23 per square meter) than Beijing (US$29 per square meter) andMumbai (US$100 per square meter).
Government supports BPAP (2007) notes that the rapid growth of the BPO sector is in part owed toinvestment incentives provided by the Philippine government. As described ear-lier, foreign ownership in a BPO firm may be up to 100 percent. Since 2000, infor-mation and communication technology has been one of the IPP sectors, andtherefore BPO firms registered with PEZA and located in designated IT parks andIT buildings have been eligible for PEZA incentives. See table 4.9 for a summary ofthese incentives.
Fiscal incentives of the Philippines seem to be competitive with those of India.BPAP (2007) reports that, according to analysis by McKinsey Global Institute, thenet marginal corporate income tax rate is 11 to 21 percent for the Philippines dur-ing the ITH period. In comparison, the rate is 13 to 16 percent for India because ofIndia’s minimum alternate tax. After the ITH period, the two countries areroughly at par: 9 to 14 percent for the Philippines and 10 to 13 percent for India.
Furthermore, PEZA has lowered the minimum space requirements to bedeclared as a PEZA IT park or building. In December 2000, the minimum landrequirement for an IT park outside Metro Manila was reduced from the initial25 hectares to 5 hectares. Most remarkably, PEZA allows a single building (or evensome floors of a building) in Metro Manila to be registered as a PEZA IT building,as long as the total floor area is at least 5,000 square meters (including commonareas and excluding parking space and roof gardens) (PEZA 2000).
Moreover, PEZA creates a more business-conducive environment. For compa-nies registering under PEZA, it offers one-stop-shop services for business registra-tion and extends an exemption from local government business permits, licenses,and fees. PEZA issues permits related to building and occupancy, import andexport, and environment clearance. Such services, according to PEZA, reducebusiness start-up time and costs. In an effort to strive for no graft and no corrup-tion, PEZA rotates staff members on a regular cycle.
Because data availability is limited, one cannot conclusively determine whetherfirms receiving PEZA incentives have generated more BPO exports than non-PEZA firms. PEZA reports that exports by PEZA IT-BPO firms amounted to US$4billion in 2009. This figure seems low given that planned BPO investment in PEZAareas from 2003 to 2009 was about 85 percent of total planned BPO investmentaccording to the BOI. A possible underestimation might have occurred owing to adiscrepancy in the classification of IT-BPO firms by PEZA and BPAP. Given thislimited data availability, PEZA effectiveness in terms of BPO exports is subject to
Service Exports from the Philippines 141

Table 4.9. Incentives for IT-BPO Firms
PEZA-registered IT-BPO firm BOI-registered IT-BPO firm
Qualification Export-oriented enterprises that locate in any PEZA economiczone
Firms whose activities are listed in the current IPP,regardless of ownershipa
Fiscal incentivesITHs up to 8 yearsb 6 years for pioneer enterprises,c plus up to 2 more
years if they comply with the following criteria (each criterion = 1-year extension):• Capital-to-labor ratio does not exceed US$10,000 to 1
for the year immediately preceding the ITH extension year being applied for.
• Average net foreign exchange earnings for the first 3 yearsare at least US$500,000.
3-year ITH applies to expansion projects (ITH limited toincremental sales revenue).
6 years for pioneer enterprises,c plus up to 2 moreyears if they comply with the following criteria (eachcriterion = 1-year extension):• Capital-to-labor ratio does not exceed US$10,000 to
1 for the year immediately preceding the ITHextension year being applied for.
• Average net foreign exchange earnings for the first 3 years are at least US$500,000.
3-year ITH applies to expansion and modernizationprojects (ITH limited to incremental sales revenue).New or expansion projects in less developed areasreceive a 6-year ITH regardless of pioneer status.
Tax payment option after the end of theITH
The following incentives apply:• Gross income tax of 5% (in lieu of regular corporate
income taxes and all other national and local taxes)• Exemption from payment of any and all local government
imposts, fees, licenses, or taxes• Under the ITH, no exemption from real estate tax, but
machinery installed and operated in the economic zone forprocessing not subject to real estate taxes for the first 3 years of operation
• Exemption from expanded withholding tax
Supplies receive a tax credit.
142

Value added tax exemptions and deductions after the ITH ends
The following value added tax incentives apply:• Locally purchased goods and services (for example, land-
based telecommunications, electricity and water bills, andbuilding lease) are exempt.
• Up to 150% deduction applies to training expenses iftaxpayer opted to pay 5% gross income tax.
The following value added tax incentives apply:• For the first 5 years, an additional deduction from
taxable income applies that is equivalent to 50% ofthe wages of additional skilled and unskilled workersin the direct labor force, if a prescribed capital-to-labor ratio is met (not available simultaneously withthe ITH).
• Deduction is double if the taxpayer is located in aless developed area.
Import dutyexemptions
The following import duty incentives apply:• Zero duty on imported equipment (for example,
computers) and parts • Exemption from wharfage duties on import shipments of
equipment
The following import duty incentives apply:• Zero duty on imported equipment, spare parts, and
accessories if BOI firms are in good standing• For all IPP firms, a 10-year exemption from wharfage
duties
Nonfiscal incentivesIncentives are as follows:• Nonresident foreign nationals may be employed in
supervisory, technical, or advisory positions.• Special nonimmigrant visa with multiple entry privileges
are available for nonresident foreign nationals in a PEZA-registered firm (including investors; officers; employees insupervisory, technical, or advisory positions; and spousesand unmarried children under 21 years of age).
• PEZA extends visa facilitation assistance to foreignnationals, their spouses, and dependents.
Foreign nationals may be employed in supervisory,technical, or advisory positions for 5 years from date ofregistration, extendable for limited periods at BOIdiscretion.
Sources: Data from PEZA and BOI. a. For firms in non-IPP activities, the following qualifications apply: at least 50 percent of the production is for export if ownership is 60 percent Filipino and 40 percentforeign, or at least 70 percent of production is for export if ownership is more than 40 percent foreign.b. ITH applies from the start of commercial operations.c. ITH is four years for nonpioneer projects.1
43

future research. Currently, the BOI has been working on building a statisticaldatabase on the performance of the BPO industry, and the completion of thework would shed some light on this subject.
Proactive private sectorThe BPO industry benefited from the adoption of an early strategic plan led byindustry players. Furthermore, BPAP, the umbrella BPO organization, hastaken the lead in marketing the brand—the Philippines as a BPO destination—by conducting high-profile campaigns, including road shows, and attendingoutsourcing-related conferences, such as the World Congress on Informationand Communication Technologies and the World BPO Forum.
BPAP plays a leading role in supporting and advocating the BPO industry. Theassociation, together with stakeholders, has developed a blueprint, namedRoadmap 2010, that focuses on goals and specific action items to obtain success(BPAP 2007). As part of the action items in this blueprint, in 2009 BPAP pro-duced the Next Wave Cities scorecard, which provides tools to help bothinvestors and local governments assess readiness and develop working capacities.Going forward, BPAP has recently produced another blueprint, Roadmap 2016,to guide the ever-evolving industry. BPAP has furthermore advocated the passageof a house bill known as the Data Protection Act.
The Tourism Sector and Factors behind Its Underperformance
The tourism sector has yet to reach its potential and play a leading role in eco-nomic growth and poverty reduction in the Philippines. On the production side,the travel and tourism sector peaked at 11.2 percent of GDP in 1993 but slowlydipped to 8.8 percent in 2007 before the global financial crisis and then furtherslipped to 7 percent in 2009. The tourism sector employed 3.3 million workers in2008,10 but over the past decade, employment has been flat at about 9.5 percent oftotal employment in the Philippines. Travel exports were recorded at 3.4 percentof GDP in 1999 and then remained between 2.0 and 3.0 percent until 2007, whenthey rebounded to 3.4 percent.
In terms of absolute numbers, however, Philippine tourist arrivals reboundedduring the global financial crisis in 2009, whereas the adverse impact of the reces-sion was deeper in both Thailand and Vietnam. This rebound in the number ofvisitors mismatches with a continued dip in tourist export receipts. In 2009, travelexports stumbled to 1.5 percent of GDP because of the worldwide financial crisis;tourism spending is deemed to be sensitive to global economic conditions. Thecorrelation between the number of tourist arrivals and visitor exports is about0.44 for the Philippines, which is much lower than that in Thailand (0.98) and
144 Exporting Services

Vietnam (0.91) (figure 4.4). This mismatch poses important policy questions onattracting types of tourists and minimizing leakages, if any.
Nearly half of international tourists in the Philippines originate from threecountries: the Republic of Korea (about 20 percent of total arrivals), the UnitedStates (18 percent), and Japan (11 percent). Korean tourists visit the Philippinesnot only for their holidays but also for English education. In contrast, visitorsfrom the United States come largely to visit their relatives and friends. Only some20 percent of U.S. visitors are on holiday.
The World Economic Forum’s 2009 Travel and Tourism CompetitivenessIndex (TTCI) ranks the Philippines 86th of 133 economies, five places behindIndonesia. The rank has deteriorated by five places since 2008. The country’sstrength in attracting tourists lies in its natural resources (ranked 23rd in terms ofthe number of World Heritage sites and 40th in terms of total known species inthe country); price competitiveness (ranked 16th), particularly in hotel prices;and policy, rules, and regulation (ranked 3rd in terms of visa requirements and28th in terms of bilateral air services agreements) (WEF 2009, 21).
The tourism sector has received ample government support. Tourism has beena priority activity in the IPP and in overseas government sales and investmentmissions. In 2009, in support of tourism exports, the Tourism Act reorganized thePhilippine Tourism Authority into the Tourism Infrastructure and Enterprise
Service Exports from the Philippines 145
Figure 4.4. Correlation between International Visitor Arrivals and Tourism Export Receipts, 1990–2009
Thailandy = 946.76x – 184.27
R2 = 0.98
Vietnamy = 705.57x – 217.10
R2 = 0.91
Philippinesy = 762.17x + 588.61
R2 = 0.44
–2,000
0
2,000
4,000
6,000
8,000
10,000
12,000
14,000
16,000
0 5 10 15 20
visi
tor
exp
orts
(U
S$ m
illio
n fo
r 20
00)
international visitor arrivals (million)
Source: Data from the World Travel and Tourism Council.

Zone Authority (TIEZA). TIEZA’s mandate is to develop, manage, and supervisetourism projects in the country. The act establishes TEZs in strategic areas, includ-ing Bohol, Boracay, Cebu, Davao, and Palawan,11 to attract foreign investors andtourists. TIEZA provides fiscal and nonfiscal incentives to tourism enterprises,including an ITH of up to 12 years, as summarized in table 4.10. Full foreignequity participation may be allowed in hotel development, subject to certain min-imum levels of foreign investment (Gutierrez 2008). Otherwise, the limitation of40 percent foreign ownership is generally applied. For development, foreign landownership is allowed up to 40 percent, but leasing is permitted up to 75 years.
Constraints for developing tourism exports
Despite the country’s potential for attracting tourists, government efforts to increasetourism exports, and increasing demand for English education tourism from Korea,the Philippines has been losing its competitiveness to its neighboring ASEAN mem-bers. For instance, Indonesia and Thailand are neighboring competitors, and theirproduct mix and target market segments are similar to those of the Philippines. Figure 4.5 shows that Indonesia and Thailand perform as poorly as the Philippinesin terms of (a) safety and security and (b) health and hygiene. Yet they have beenable to attract more tourists and earn more foreign exchange from tourism exports.So what are the factors that explain why the performance of the Philippines lags thatof these neighboring countries with similar natural endowments?
146 Exporting Services
Table 4.10. Tourism Incentives
Fiscal incentives Nonfiscal incentives
• ITH of 6 years with provision forextension for another 6 years
• Gross income tax for new enterprises of 5%
• 100% exemption from all taxes andcustoms duties on import of capitalinvestment and equipment
• Duty-free import of transportation andspare parts
• 100% exemption from all taxes andcustoms duties on importation of goodsconsumed in the course of servicesrendered by firms within a TEZ
• Tax deduction up to 50% of the cost ofenvironmental protection, culturalheritage preservation, or other socialresponsibility activities
• Employment of foreign nationals inexecutive, supervisory, technical, oradvisory positions permitted
• Special investor’s resident visa for a foreigninvestor who invests at least US$200,000
• Issuance of working visas by TIEZArenewable every 2 years to foreignerspossessing highly technical skills that noFilipino within the TEZ possesses
• Right to repatriate entire proceeds of theliquidation of an investment
• No property requisition of registeredenterprises
• Lease of land and buildings in a TEZ toforeign investors up to 75 years (50 yearsplus one-time renewal of up to 25 years)
• Transferability of the leasehold right
Source: Data from BOI.

Factor conditions: Weak transport infrastructure
Comparative analyses of the TTCI rankings of Indonesia, the Philippines, andThailand suggest that the Philippine bottlenecks lie largely in infrastructure andprioritization of travel and tourism (figure 4.5), where the government has agreater role to play than the private sector.
Ground transport infrastructureIn ground transport infrastructure, the Philippines scores particularly low in termsof road quality. The 2010–11 Global Competitiveness Index ranks the Philippines114th, one of the lowest rankings in East Asia and the Pacific. The majority of the201,940-kilometer road network (as of 2008) continues to be in poor condition,with one-fifth of it paved (CIA 2010).
This weak ground transport infrastructure, together with the weak quality ofthe ground transport network, has adverse implications for tourism. First, it limitsmobility of tourists who already have time constraints in place. Second, it restricts
Service Exports from the Philippines 147
Figure 4.5. Comparative Analyses of TTCI Rankings, 2009
0.0
0.2
0.4
0.6
0.8
1
policy rules andregulations
environmental sustainability
safety and security
health and hygiene
prioritization oftravel and tourism
air transportinfrastructure
ground transportinfrastructure
tourism infrastructure
ICT infrastructure
price competitiveness intravel and tourism industry
human resources
affinity fortravel and tourism
natural resources
cultural resources
Philippines Indonesia Thailand
Source: WEF 2009.Note: Ranking in respective category is converted into percentile.

choices of transportation means. For instance, the journey to the 2,000-year-oldBanaue Rice Terraces (recognized as a World Heritage site by the United NationsEducational, Scientific, and Cultural Organization and said to be the Eighth Wonderof the World) well illustrates these two points. Banaue is only 350 kilometers fromManila, but because of the weak ground transport network and narrow, windingroads, often congested around towns, tourists need 8 to 11 hours to reach Banaueby road and may only travel by car or bus. Neither air transport nor railway toBanaue is available. Upon arriving in Banaue, tourists need to rely on eitherjeepneys or tricycles on unpaved bumpy roads to reach most rice terraces. In con-trast, Chiang Mai in Thailand is 696 kilometers north of Bangkok and can bereached from Bangkok within an hour by air (at least six airlines operate some23 flights daily), 8 hours by car, 10 or 11 hours by bus, or 11 or 12 hours by train.Third, the World Bank (2009) reports that the weak road quality translates intohigher vehicle operating costs per kilometer. The Department of Public Worksand Highways found that average vehicle operating costs doubled between 1999and 2003, whereas the inflation rate was 20 percent.
The Medium-Term Philippine Development Plan 2004–2010 (MTPDP) identi-fies the improvement of air, sea, and land access to priority destinations (includ-ing Cordillera, the rice terrace region) from the country’s main air gateways as astrategic priority for tourism (NEDA 2009). Progress on road improvement, how-ever, seems to be slow. The Department of Public Works and Highways AnnualReport 2009 states that the 50.49-kilometer Mount Data–Bontoc–Banaue sectionis being improved and that the project, which began in September 2006, is 64.11percent complete (DPWH 2009, 11). The government promotes public-privatepartnership in modernizing land transport and developing, implementing, andoperating railways.
Air transport infrastructure Airports require major upgrades. The literature shows a positive correlationbetween the quality of airports and the number of international arrivals. Busi-nesses perceived that the Philippine passenger air transport infrastructure isunderdeveloped: the 2009 TTCI ranks the Philippines 89th in terms of the qualityof air transport infrastructure, far behind Thailand (28th) and Indonesia (75th).Ninoy Aquino International Airport (NAIA) in Manila, the country’s main inter-national gateway, was designed in 1974 and completed in 1981; it now ranks at thebottom of Asian international airports because of its limited and outdated facili-ties, weak passenger comfort, and overcapacity (its design capacity was alreadymet in 1991). NAIA-2 terminal has been in operation since 1999 but is usedexclusively for Philippine airlines’ domestic and international flights. Disputesover the build-operate-transfer contract for NAIA-3, with its anticipated modern
148 Exporting Services

facilities, have prevented the final completion and operation of the new airport.12
Currently, Cebu Pacific, Philippine Airlines, and Air Philippines operate fromNAIA-3. Full use of the new airport would require further investment to upgradethe facilities.13
Government supports
Liberalizing air transport services could improve accessibility to the Philippinesand boost competition in international air transport services. Piermartini andRousová (2008) find that air transport service liberalization has a positive and sta-tistically significant effect on passenger flows. Furthermore, they find that the sev-enth freedom,14 cabotage, free determination of capacity, free pricing, and multi-ple designations in bilateral air service agreements (BASAs) have a positive andstatistically significant relationship with passenger flows. The Philippines deregu-lated domestic air transport services, resulting in high scores on scheduled avail-able domestic seat kilometers15 (158 million seat kilometers per week in 2008).16
However, its international available seat kilometers are only one-third those ofThailand (355 foreign carrier flights per week to the Philippines, compared withmore than 1,000 to Thailand).
The government progressively liberalized BASAs in 1999 to boost tourism(WTO 2005), but competition in international air transport services is rather lim-ited. The Philippines scores 13.1 in the World Trade Organization’s index onopenness of BASAs (0 being most restrictive and 50 the most liberal), which isnearly at par with Singapore (13.0). However, BASAs remain restrictive in termsof controlling capacities and frequencies and in terms of requiring fare approvalby both partners (WTO 2005). Airlines may also be required to be designated bytheir country of origin through BASAs with the Philippines and may be limited tothird and fourth freedoms only.17 Philippine charter arrangements are restrictiveunless scheduled services are not significantly interrupted, and cabotage is pro-hibited (WTO 2005). High international traffic at NAIA (95 percent) indicatesthat the country has not yet fully adopted multiple-gateway policies to boosttourism. Even though the government encourages foreign airlines to offer servicesto regional airports—Cebu, Davao, and Clark-Subic (Trace, Frielink, and Hew2009)—such services are often subject to BASAs that inhibit entitlements.18
The Philippines has not yet implemented ASEAN open-skies policies at theregional level, which might inhibit intra-ASEAN tourist arrivals. Indonesia andMalaysia adopted the full fifth freedom to facilitate tourism in the BruneiDarussalam–Indonesia–Malaysia–Philippines East Asian Growth Area, whereasthe Philippines granted the fifth freedom to airlines designated by the partici-pating countries (Trace, Frielink, and Hew 2009).19 The Philippine airports
Service Exports from the Philippines 149

designated for fifth freedom rights are Davao City, General Santos City, PuertoPrincesa City, and Zamboanga City.
In addition, the Philippines suffers from regulatory uncertainty, which reducesinternational seat availability. For instance, Executive Order No. 500, issued in2006, increased the number of flights to more than 4,000 (accommodating470,000 passengers) in 2006 from less than 500 (50,000 passengers) in 2004(World Bank 2007) by allowing low-cost airlines to serve Diosdado MacapagalInternational Airport without limitations on traffic rights, capacity, and air free-dom rights. This order was, however, retracted six months later because of domes-tic pressures (Estavillo 2007). This regulatory uncertainty led many airlines, suchas Tiger Airways, to cut back on their flights to Diosdado Macapagal InternationalAirport.
Safety and security environmentSafety and security are inevitably interwoven with tourism. In the wake of a healththreat, crime, or terrorism, tourism is affected because such “security incidentscause changes in tourists’ perception of risk” (Pizam and Mansfeld 2006, 7). Forinstance, during the SARS (severe acute respiratory syndrome) outbreak in 2003,the Philippines experienced a dip in tourist arrivals and in tourism exportreceipts. Therefore, safety and security need to be an integral part of promotingtourism exports as good security is an integral part of overall service quality(Tarlow 2006).
The 2009 TTCI finds poor safety and security situations in the Philippines. Thethreat of terrorism in the Philippines imposes high costs on businesses (the TTCIranked the Philippines 125th of 133 economies). Police services are not reliable inenforcing law and order (the Philippines ranked 98th). The incidence of commoncrime and violence imposes costs on businesses (the Philippines ranked 93rd).The MTPDP reports that the government will act on improving security situa-tions in Mindanao to advance tourism (NEDA 2009).
Marketing and product developmentThe Philippines has adopted multipronged promotion strategies. As set out in theMTPDP, the country has prioritized aggressive promotion of short-haul beach-goer tourism to East Asian economies (NEDA 2009). For the European market, ithas concentrated on promoting scuba-diving products, but European touristaccess to the Philippines remains a bigger constraint. North America has been atraditional origin for tourists; therefore, the Department of Tourism allocatesfewer promotion expenditures to that market.
The tourism marketing effort has been ineffective. Business executives in thePhilippines still see the country’s tourism marketing as only moderately effective
150 Exporting Services

in attracting tourists (marketing scored 4.9 of 7.0 on the 2009 TTCI). The WorldTourism Council reports that the Philippine government spends 3.6 percent of itstotal budget for travel and tourism, which is higher than Thailand (2.7 percent),Malaysia (1.7 percent), and Vietnam (1.4 percent) (figure 4.6). The Tourism Act of2009 makes greater financial resources available to the Tourism Promotion Board,a marketing body of the Department of Tourism; therefore, more effective mar-keting and branding should become much more important and will potentiallyaugment tourism exports.20
Industry-specific conditions
Aside from the poor condition of transport infrastructure in the Philippines,hotel room capacity in tourist destinations is also constrained. The PhilippineTravel Agencies Association pointed out that prime tourist destinations such asBoracay, Cebu, Metro Manila, and Palawan need 30 percent more rooms to meetdemand—especially during the peak season (Arcibel 2008). The Survey ofTourism Establishments administered by the Department of Tourism reports that,as of 2008, accommodation facilities have been expanding in prime travel destina-tions, so the looming issue in room capacity should be resolved.
Service Exports from the Philippines 151
Figure 4.6. Marketing Effectiveness, 2008
Vietnam
Philippines
MalaysiaThailand
2.0
2.5
3.0
3.5
4.0
4.5
5.0
5.5
6.0
6.5
7.0
0 2 4 6 8 10tourism expenditure (% of total budget)
mar
ketin
g ef
fect
iven
ess
(1=
leas
t, 7
=m
ost)
Sources: WEF 2009; World Tourism Council.

The BPO industry in the Philippines shows that an industry can be developedfor the international market if “a champion with vision and the ability to organizepeople to implement plans and programs rises from within the sector” (Custodio2005, 4). The Philippine Chamber of Commerce and Industry for Tourismlaunched Biztour5 in 2003 to augment the government’s efforts for sustainabletourism. Its objective is to bring in 5 million foreign tourists, to generate US$5 bil-lion in tourism receipts, and to create 5 million jobs by investing US$5 billion bythe fifth year through reforms in the air and sea transport sectors, better road con-nectivity between airports and seaports, railway upgrades, and investment inaccommodation infrastructure. However, tourism stakeholders are still largelyunderepresented, and the relationship between the Philippine government andprivate tourism institutions and allied enterprises needs to be improved. The pri-vate sector needs to intensify its work toward creating innovative tourism prod-ucts. Recognizing these shortcomings, the Tourism Act of 2009 paved the way toform the Tourism Congress, comprising representatives of the tourism sector.
Challenges Ahead
The service sector is an important component of the Philippine economy, consti-tuting some 50 percent of GDP and total employment. Service exports from themovement of workers have outperformed those of many developing countries.Remittances have positively affected the Philippine economy, fueling domestic con-sumption that includes increased spending on private health and education andencouraging entrepreneurial activities (Yang 2006). Service exports, in contrast,have a limited role, accounting for only 6 percent of GDP in 2009. Nonetheless, thePhilippines is a net service exporter, and exports of services have been growingfaster than exports of goods. The Philippines earns net export credits in sectors thatare natural resource–based (tourism), that are labor intensive (construction), orthat involve more intensive use of human capital and telecommunications (com-munications, computer and information services, and other business services).
The BPO industry has become the principal success story. The sector demon-strated continued growth even during the global financial crisis, whereas tourismexports declined substantially. The success of BPO exports rests on the favorablefactor conditions: the sector benefited from low labor costs, low telecommunica-tion and Internet costs, a large pool of competent and English-speaking labor,Filipinos’ affinity to the U.S. legal and accounting systems and to U.S. culture, andtheir warm personalities suitable for employment in contact centers. In addition,as pioneers under the IPP, BPO firms registered with either PEZA or the BOIreceive favorable fiscal and nonfiscal incentives. Because PEZA offers one-stop-shop services, PEZA-registered BPO firms are less exposed to the weak business
152 Exporting Services

climate, especially in terms of starting a business. Furthermore, the industry’s suc-cess rests on greater global outsourcing demand and the proactive leadership ofthe private sector, together with a strong business association (BPAP).
Yet the BPO sector faces challenges going forward. First, the supply of skilledlabor could be challenged. BPAP forecasts that some 265,000 additional FTEs willbe needed by 2011. The current trend in the number of college graduates suggeststhat labor supply can easily meet demand. Labor supply would face challenges ontwo fronts: one is English competency, and the other is the global mobility ofskilled Filipino workers. Industry experience suggests that not all college gradu-ates are ready to hit the shop floor immediately. In fact, only 10 percent of contactcenter applicants are immediately hired.21 Managers say that the main problemlies with deterioration in English proficiency. Workers who are competent in Eng-lish proficiency, in contrast, are often hired by firms abroad; therefore, BPO firmsmust compete with firms abroad to retain competent workers, especially in theareas of software development and other IT-related services.
Second, the Philippines does not yet have comprehensive data protection lawsin place. The absence of such laws may prevent third-party BPO providers fromgrowing further in the Philippines. The issue of data secrecy is one of the chiefdrawbacks of third-party BPO providers, and contact centers have reportedinstances of theft of personal data. Recognizing the increasing need for privacyprotection laws, the Philippine government proposed House Bill No. 3828, theData Protection Act.22 The bill is in line with Asia-Pacific Economic Cooperation(APEC) Privacy Principles23 and “seeks to protect personal data in informationand communication systems in the government and the private sector, and createa National Data Protection Commission to implement the law” (CommitteeAffairs Department 2009, 16–17).24 However, the bill is yet to be passed into law.Mira (2009) points to the measure to create the National Data Protection Com-mission as a cause for the delays.
Third, quality control is key to maintaining the country’s reputation as thebest BPO destination. Quality control is particularly important in the legal andmedical transcription areas. To support the country’s reputation, the govern-ment has enacted a certification process for all individual companies’ services inthese areas. As for medical transcription BPO, Philippine firms may need to shiftgears to meet demand from the United States, the largest market for such serv-ices. An interview with an industry participant found that the provision toimplement electronic health recording systems, as set out in the American Recov-ery and Reinvestment Act of 2008, implies that the medical transcription BPOindustry will need to add health care management outsourcing, such as medicalcoding and billing, electronic medical records, and claims management.25 Inturn, the existing workforce would need to be retrained. Industry participants
Service Exports from the Philippines 153

noted that training a medical transcriptionist is painstaking and can easily takefive to seven months (Estavillo 2010).
Making additional investments in human capital, strengthening intellectualproperty rights, and improving quality control may further promote the growthof high-value-added activities within BPO industries that are not yet fullyexploited in the Philippines but have been successfully tapped by other countries,such as India.
The tourism sector has yet to reach its full potential and could develop moreopportunities and diversify as a health tourism and retirement destination. The2009 TTCI indicates that impediments to tourism competitiveness are largely asso-ciated with weak ground and air transport infrastructure—roads, railways, groundtransport network, and airports. Weak physical infrastructure lowers accessibilityto tourism destinations and discourages private sector investments in facilities toaccommodate tourists. Investments in transport infrastructure would boost notonly tourism exports but also transport and logistics exports.26 More broadly,infrastructure investment is a driver for growth. Agenor and Moreno-Dodson(2006) found that infrastructure investment indirectly improves labor productivityand affects adjustment or investment costs and the durability of capital.
The 2009 TTCI highlights two other constraints related to tourism exports:(a) safety and security concerns (as are found in Indonesia and Thailand) and (b)the government’s ineffective marketing to attract foreign tourists. One tourismindustry association’s view is that tourism export performance would improve ifair transport services were liberalized, leading to more available seats and lowerairfares. As noted in the tourism literature, the tourism sector is very complex;thus, descriptive research on tourism exports alone may face some limitations.Quantitative research on the Philippine tourism industry is ongoing.
Recognizing local stakeholders and developing their capacity to participate inbusiness environment reform is critical for successful and sustainable reforms.This capacity building can include strengthening the role and capacity of stateagencies, the private sector, workers’ organizations, and other civil society struc-tures, as well as supporting better dialogues and advocacy and building the capac-ity or ability of state agencies to manage reform programs. Although developingthe capacity of state agencies can be a legitimate and useful response to the situa-tions created by failed or weak states, working with other program partners suchas the private sector is equally important.
Notes
1. Asia’s growth was counterbalanced by the 3.5 percent decline in North American countries’exports, which still accounted for about one-fifth of world commercial service exports.
154 Exporting Services

2. The RCA index is by sector, as evidenced by trade flows (Balassa 1965):
where X is exports, p is the Philippines, w is the world, j is a service sector, and t is time. A compara-tive advantage is revealed if RCA is greater than one. If RCA is less than unity, the country is said to havea comparative disadvantage in the industry. As the formula shows, RCA is a dynamic concept, and there-fore it can change over time.
3. These data are according to the heads of ASEAN power and utilities authorities (Adriano 2008). 4. Early movers included Accenture, eTelecare Global Solutions, SYKES, and PeopleSupport.5. The figures exclude foreign back-office firms in the areas of (a) finance and accounting and (b)
human resources. 6. In this chapter, the BPO sector refers to both outsourcing and offshoring, consistent with the
Philippine statistics agency’s definition. (See Sako 2005, for clearer distinctions between outsourcingand offshoring.) Furthermore, to remain consistent with the scope of BPO data that are collected byBPAP, the sole BPO-related data compiler in the Philippines, this chapter includes BPO, IT outsourc-ing, and engineering services outsourcing in the BPO sector.
7. The Economic Times of India reported, “the recent statement by U.S. President Barack Obamaending the tax incentives on the overseas income of U.S. corporations has seen some of the [BPO]industry players predicting further exits of captives from India” (Abrar and Thimmaya 2009).
8. According to Smarzynska and Wei (2000, 14), “American investors are somewhat more reluc-tant to form joint ventures in more corrupt countries, possibly because of the U.S. Foreign CorruptPractices Act of 1977.”
9. A medical transcription company can be as small as nine employees. Monchito Ibrahim, com-missioner of the Commission on Information and Communications Technology, said that manyPhilippine start-ups are in the area of medical transcription and provide services for a large number ofU.S.-based hospitals (Arellano 2010).
10. The National Statistical Coordination Board reports employment by tourism subsector since2000, http://www.nscb.gov.ph/headlines/StatsSpeak/2009/041309_rav_tourism.asp#fig2.
11. Four TEZs were proclaimed in 2003: (a) Boracay Eco-Cultural Village Resort, (b) Fort Ilocan-dia Tourism Ecozone, (c) Island Cove Resort and Leisure Park, and (d) Pamalican Island Tourism Eco-zone. In 2006, two more TEZs were proclaimed: (a) Eco-Tourism Village and (b) Resort and TourismVillage, Retirement Village, and Vacation Villa (NEDA 2009).
12. The Arroyo government called the build-operate-transfer contract “onerous,” and theSupreme Court of the Philippines declared the contract “null and void.” In December 2004, the gov-ernment expropriated the airport; payments to the Philippine International Air Terminals Co.(PIATCO) were made afterward. PIATCO, the main project contractor, together with its partner Fra-port AG, submitted the dispute to arbitration (PIATCO in Singapore before the International Cham-ber of Commerce and Fraport AG in Washington, D.C., before the International Centre for Settlementof Investment Disputes). In October 2010, an International Centre for Settlement of Investment Dis-putes ad hoc committee declared the proceedings closed.
13. In May 2010, Cathay Pacific Airlines considered moving to NAIA-3, but the airport was notequipped to offer the airline its own lounge facilities.
14. The seventh freedom of the air is the right to fly between two foreign countries but not offerflights to one’s own country.
15. The term available seat kilometers captures the total flight passenger capacity of an airline inkilometers. It is obtained by multiplying the total number of seats available for scheduled passengersand the total number of kilometers those seats were flown.
16. Nonetheless, the level is lower than in Indonesia (628 million) and Thailand (206 million).However, one may need to consider the size of their territories when comparing these countries.
RCA X X X Xptj
ptj
pt
j
n
wtj
wt
j
n
=⎛
⎝⎜⎜
⎞
⎠⎟⎟
⎛
⎝⎜⎜
⎞
⎠⎟⎟∑ ∑/ / / ,
Service Exports from the Philippines 155

17. The freedoms of the air are a set of commercial aviation rights. The third freedom is the rightto fly from one’s own country to another. The fourth freedom is the right to fly from another countryto one’s own.
18. The government recently announced adopting the open sky policy in regional airports, exceptthose international gateways in Manila.
19. The fifth freedom of the air is the right to fly between two foreign countries during a flight thatoriginates or ends in one’s own country.
20. However, it should be noted that Crouch and Ritchie (1999) find that demand for interna-tional travel is generally not very responsive to the promotional or marketing expenditures of nationaltourist offices.
21. About 30 to 40 percent of applicants are classified as near-hires, and they must take an intensivetwo-week training course prior to being employed. Some 60 percent of near-hires are hired after theycomplete the training. The Technical Education and Skills Development Agency (TESDA) has ear-marked educational grants for BPO near-hires. For example, the PGMA (President Gloria Macapagal-Arroyo) Training for Work Scholarship Program offered scholarships in the amount of 350 million for2008 and 2009. TESDA accredited private training institutions and paid the institutions for each suc-cessful graduate who was hired by a BPO firm. After receiving close to two months of training, manynear-hires found jobs (Oliva 2007).
22. The United States passed the Health Insurance and Portability and Accountability Act(HIPAA) in 1996 to protect individuals’ medical records and other health care–related data. To ensurethat their clients’ data is protected, some U.S. firms require their future outsourcing partners in thePhilippines to be HIPAA compliant (Mira 2009).
23. As a member of APEC, the Philippines has followed the development path of the APEC Pri-vacy Principles, which seek to provide an alternative to the European Union data protection modelthat was finalized in November 2004. The principles are viewed as facilitating offshore outsourcing andare seen as more business friendly. The laws stemming from the principles will recognize the need forappropriate processing and transfer of personal information and will permit outsourcing if appropri-ate (not overly burdensome) protections are in place. Furthermore, the laws will recognize that globaldata flows are facilitated if the laws focus on ensuring that local firms are accountable for data process-ing activities (Eisenhauer 2005).
24. The Commission on Information and Communication Technology notes that, nonetheless,the Philippines has in place data privacy guidelines issued by various government bodies and that theseguidelines currently serve to protect data shared by consumers with private firms.
25. Myla Rose M. Reyes, president of the Medical Transcription Industry Association of thePhilippines and managing director of Total Transcription Solutions Inc., expressed similar concernsduring her interview with BusinessWorld (Estavillo 2010).
26. In an interview with the author, a logistics industry participant stated that high logistics costsare associated with poor road transport networks. For instance, a producer who is geographicallylocated closer to the Subic port must instead transport goods to the Manila port because of the absenceof a highway connecting the city to the port. Other logistics bottlenecks for exports are poor port facil-ities (poor Subic port facilities result in congestion in the Manila port), weak IT use, and arbitrarilyhigh shipping charges.
References
Abrar, Peerzada, and P. P. Thimmaya. 2009. “MNCs Stick with Plan for Captive BPO Units Here.” Eco-nomic Times (India), June 13.
Adriano, Joel D. 2008. “Power Politics in the Philippines.” Asia Times, June 10. http://www.atimes.com/atimes/Southeast_Asia/JF10Ae01.html.
Agenor, Pierre-Richard, and Blanca Moreno-Dodson. 2006. “Public Infrastructure and Growth:New Channels and Policy Implications.” Policy Research Working Paper 4064, World Bank,Washington, DC.
156 Exporting Services

Arcibel, Cheryl M. 2008. “Room Shortage Forces Manila to Turn away Tourists.” GMA News, October 21. http://www.gmanews.tv/story/128422/Room-shortage-forces-Manila-to-turn-away-tourists.
Arellano, Nestor. 2010. “Philippines Government Change Could Hurt BPO.” IT World Canada, February 10. http://www.itworldcanada.com/news/philippines-government-change-could-hurt-bpo/139964.
A.T. Kearney. 2009. “The Shifting Geography of Offshoring: The 2009 A.T. Kearney Global ServicesLocation Index.” A.T. Kearney, Chicago. http://www.atkearney.com/images/global/pdf/Global_Services_Location_Index_2009.pdf.
———. 2011. “Offshoring Opportunities amid Economic Turbulence: The A.T. Kearney Global Serv-ices Location Index, 2011.” A.T. Kearney, Chicago. http://www.atkearney.com/images/global/pdf/Offshoring_Opportunities_Amid_Economic_Turbulence-GSLI_2011.pdf.
Balassa, Bela. 1965. “Trade Liberalisation and Revealed Comparative Advantage.” Manchester School33 (2): 99–123.
BPAP (Business Processing Association of the Philippines). 2007. Offshoring and Outsourcing Philip-pines: Roadmap 2010. Makati City, Philippines: BPAP.
———. 2010. “Results of the BPAP-O2P Periodic Survey.” BPAP, Makati City, Philippines.BSP (Bangko Sentral ng Pilipinas). 2010. “Results of the Survey of IT and IT-Enabled Services, 2007
and 2008.” Department of Economic Statistics, BSP, Manila.Carroll, Nkechi. 2008. “Record High Remittances to the Philippines Lead to Increased Competition
among Philippine Banks.” Asia Focus (January): 1–3.CIA (U.S. Central Intelligence Agency). 2010. “Philippines.” In The World Factbook. Washington, DC:
CIA. https://www.cia.gov/library/publications/the-world-factbook/geos/rp.html. Committee Affairs Department, House of Representatives, 15th Congress of the Philippines. 2009.
“New Body to Deal with Privacy Issues Pushed.” Committee News 16 (36). http://www.congress.gov.ph/committees/commnews/commnews_det.php?newsid=1095.
Crouch, Geoffrey I., and J. R. Brent Ritchie. 1999. “Tourism, Competitiveness, and Societal Prosperity.”Journal of Business Research 44 (3): 137–52.
Custodio, Edsel T. 2005. “Coalition Building in the Philippines: Who Does What When.” Presented atthe Executive Forum on National Export Strategies: Export of Services—Hype of High Potential?Implications for Strategy-Makers, International Trade Centre, Montreux, Switzerland, October 5–8.
DPWH (Department of Public Works and Highways). 2009. Annual Report 2009: Drawing the Plans fora Strong Republic. Manila: DPWH.
Eisenhauer, Margaret P. 2005. “Privacy and Security Law Issues in Off-shore Outsourcing Transac-tions.” Hunton & Williams, Atlanta, GA.
Estavillo, Maricel E. 2007. “Airline Cuts Clark Flights in Policy Row.” BusinessWorld, March 22.http://www8.gmanews.tv/story/35395/airline-cuts-clark-flights-in-policy-row.
———. 2010. “Philippine Medical Transcription Rewrites Self amid Global Changes.” BusinessWorld,August 10. http://www.globalservicesmedia.com/Destinations/Asia/Philippine-Medical-Transcription-Rewrites-Self-Amid-Global-Changes/25/22/0/GS100810688658.
Everest Research Institute. 2009. “Destination Philippines: Key Trends in the Second Largest OffshoreBPO Location.” Global Location Insights (May): 1–3. http://www.smartmanager.com.au/res/content/au/smartmanager/en/docs/four_important_facets_of_filipino_bpo_industry.pdf.
Fink, Carsten, Aaditya Mattoo, and Randeep Rathindran. 2001. “Liberalizing Basic Telecommunica-tions: The Asian Experience.” Policy Research Working Paper 2718, World Bank, Washington, DC.
Gereffi, Gary, and Karina Fernández-Stark. 2010. “The Offshore Services Value Chain: DevelopingCountries and the Crisis.” Policy Research Working Paper 5262, World Bank, Washington, DC.
Gutierrez, Elsie. 2008. “Maximizing the Potential of Philippine Tourism.” Policy Advisory 2008–03,Congressional Planning and Budget Department, House of Representatives, Quezon City,Philippines.
Hugo, Graeme, and Soogil Young, eds. 2008. Labour Mobility in the Asia-Pacific Region: Dynamics,Issues, and a New APEC Agenda. Singapore: Institute of Southeast Asian Studies.
Service Exports from the Philippines 157

Karsenty, Guy. 2000. “Assessing Trade in Services by Mode of Supply.” In GATS 2000: New Directions inServices Trade Liberalization, ed. Pierre Sauvé and Robert Stern, 33–56. Washington, DC: BrookingsInstitution Press.
Messenger, Jon, and Naj Ghosheh. 2010. Offshoring and Working Conditions in Remote Work. Geneva:International Labor Organization.
Mira, P. Ricardo. 2009. “Philippine BPO-IT Industry: Performance and Prospects.” Policy Advisory2009-05, Congressional Planning and Budget Department, House of Representatives, Quezon City,Philippines.
NEDA (National Economic Development Authority). 2009. Medium-Term Philippine DevelopmentPlan 2004–2010. Manila: NEDA.
Oliva, Erwin. 2007. “Call Center Urges TESDA to Fine-Tune BPO Scholarship.” Inquirer.net, October 20.http://newsinfo.inquirer.net/breakingnews/infotech/view/20071020-95705/Call_center_urges_Tesda_to_fine-tune_BPO_scholarship.
Orbeta, Aniceto, Michael Abrigo, and Michael Cabalfin. 2009. “Institutions Serving Philippine Interna-tional Labor Migrants.” Discussion Paper 2009-31, Philippine Institute for Development Studies,Manila.
Outsourcing Portal. 2008. “AIG, JPMorgan Expanding BPO Operations Here Despite Crisis.” Outsourc-ing Portal, September 23. http://www.outsourcetalk.net/2008/09/23/aig-jpmorgan-expanding-bpo-operations-here-despite-crisis/.
PEZA (Philippine Economic Zone Authority). 2000. “Guidelines on the Registration of InformationTechnology (IT) Enterprises and the Establishment and Operation of IT Parks/Buildings.” Certifi-cate of Board Resolution, Resolution 00-411, PEZA, Pasay City, Philippines, December 29.http://www.peza.gov.ph/issuances/guidelines/Guidelines_IT.pdf.
Piermartini, Roberta, and Linda Rousová. 2008. “Liberalization of Air Transport Services and Passen-ger Traffic.” Staff Working Paper ERSD-2008-06, Economic Research and Statistics Division,World Trade Organization, Geneva.
Pizam, Abraham, and Yoel Mansfeld. 2006. “Toward a Theory of Tourism Security.” In Tourism, Secu-rity and Safety: From Theory to Practice, ed. Yoel Mansfeld and Abraham Pizam, 1–28. Oxford, U.K.:Elsevier.
Remo, Michelle. 2010. “JP Morgan Expands Operations in RP.” Philippine Daily Inquirer, July 28.http://globalnation.inquirer.net/cebudailynews/enterprise/view/20100728-283692/JP-Morgan-expands-operations-in-RP.
Sako, Mari. 2005. “Outsourcing and Offshoring: Key Trends and Issues.” Background paper preparedfor the Emerging Markets Forum, Said Business School, Oxford, U.K.
Schwab, Klaus, ed. 2010. The Global Competitiveness Report 2010–2011. Geneva: World EconomicForum.
Smarzynska, Beata K., and Shang-Jin Wei. 2000. “Corruption and the Composition of Foreign DirectInvestment: Firm-Level Evidence.” Policy Research Working Paper 2360, World Bank, Washington,DC.
Tarlow, Peter E. 2006. “A Social Theory of Terrorism and Tourism.” In Tourism, Security, and Safety:From Theory to Practice, ed. Yoel Mansfeld and Abraham Pizam, 33–48. Oxford, U.K.: Elsevier.
Trace, Keith, Barend Frielink, and Denis Hew. 2009. “Air Connectivity in Archipelagic SoutheastAsia: An Overview.” Southeast Asia Working Paper 2, Asian Development Bank, Metro Manila,Philippines.
USTR (Office of the U.S. Trade Representative). 2010. “The Philippines.” In 2010 National Trade Esti-mate Report on Foreign Trade Barriers, 299–306. Washington, DC: USTR. http://www.ustr.gov/sites/default/files/uploads/reports/2010/NTE/2010_NTE_Philippines_final.pdf.
WEF (World Economic Forum). 2009. The Travel and Tourism Competitiveness Report 2009: Managingin a Time of Turbulence. Geneva: WEF.
World Bank. 2007. Philippines: Invigorating Growth, Enhancing Its Impact. Report 39226-PH. Wash-ington, DC: Poverty Reduction and Economic Management Unit, East Asia and Pacific Region,World Bank.
158 Exporting Services

———. 2009. Philippines Transport for Growth: An Institutional Assessment of Transport Infrastructure.Report 47281-PH. Washington, DC: Poverty Reduction and Economic Management, East Asia andPacific Region, World Bank.
WTO (World Trade Organization). 2005. “Trade Policy Review: The Philippines.” WTO, Geneva.Yang, Dean. 2006. “International Migration, Remittances, and Household Investment: Evidence from
Philippine Migrants’ Exchange Rate Shocks.” NBER Working Paper 12325, National Bureau ofEconomic Research, Cambridge, MA.
Service Exports from the Philippines 159


The technological revolution has changed the way services can be providedfrom one end of the world to the other. Service provision no longer requires thecustomer and provider to interact in a shared environment through physicalpresence. The ability to provide services from a distance has facilitated the global-ization of services, making knowledge-based and technology-intensive intermedi-ate services the new sources of growth. Furthermore, progressive deregulation ofthe service sector through either formal trade liberalization agreements or unilat-eral liberalization measures has contributed to the increasing importance of theservice sector by enhancing the potential of service exports (Behuria and Khullar1994). Thus, service exports present a promising way to push economic growth.The United Nations Conference on Trade and Development found service exportsto be a significant factor in explaining the growth performances of developedcountries in the 1990s, though this nexus is somewhat weaker in developingcountries (Gabriele 2004, 20).
Malaysia’s gross domestic product (GDP) has enjoyed a high growth rate(about 5 percent) since 2000, which increased the demand for several consumerand producer services and hence the contribution of the service sector. TheMalaysian government believes that the service sector is potentially an engine ofeconomic growth and aims to increase its contribution to GDP from 56 percent in2009 to 67 percent—the contribution observed in developed countries—by 2020(NEAC 2010, 103). To achieve this target, the government has been proactive in
161
5
Exploring Niches for ExportinG:
The Case of Malaysia
Mahani Zainal Abidin, Tham Siew Yean, and Loke Wai Heng

162 Exporting Services
introducing policies and strategies to grow the service sector and its exports.Examples can be seen in the Second and Third Industrial Master Plans as wellas the New Economic Model (NEM) (MITI 1996, 2006; NEAC 2010). In theSecond Industrial Master Plan, the service sector was intended to enhance man-ufacturing development; in the Third Industrial Master Plan and the NEM,selected services such as health and education were targeted as new sources ofexport revenues.
This chapter characterizes the nature of service exports in Malaysia and ana-lyzes the factors that have contributed to the success (or otherwise) of specificservices relative to others. Factors that could influence the success or failure of theservice exports are grouped into three categories: (a) endowments such as avail-ability of human capital and telecommunication infrastructure; (b) governmentpolicies such as promotion initiatives and unilateral, bilateral, or regional liberal-ization; and (c) access to service export markets.
The chapter is organized as follows. An overall picture of the service sectorand service exports in the Malaysian economy is followed by a detailed analysisof the characteristics of service exports from Malaysia. The next section detailsthe fundamental factors that have contributed to the success of these exports.The subsequent section explores some specific factors that also may have con-strained service exports. Finally, the chapter concludes with policy lessons.
The Service Sector in Malaysia
Since its independence in 1957, Malaysia has traditionally been a net importer ofservices. After a long period of persistent deficit, a positive balance in service tradestarted to emerge in 2007 and 2008. Nevertheless, the sector is an important onefor the Malaysian economy in terms of its share in GDP, employment, and inter-and intrasectoral links. The service sector has been the largest sector in theMalaysian economy from 1978 to 2009. In 2009, this sector contributed 56 percentof GDP and 59 percent of total employment, including employment in govern-ment services (Tham and Loke 2010, 3).
The service sector has the second highest multiplier effect on the economy,after the manufacturing sector. An increase in demand in every service subsectorby RM 1.00 (US$0.26) is expected to increase the output in the whole economyby RM 40.04 (US$10.53) while it increases the output in the manufacturing sector by RM 3.73 (US$0.97) (table 5.1). Conversely, an increase in demand byRM 1.00 (US$0.26) in every manufacturing subsector will increase service out-put by RM 9.80 (US$2.58).
For input requirements, the service sector depends more heavily on its ownindustries (linkage index of 6.00) than on other sectors in the economy.1 The

The Case of Malaysia 163
manufacturing sector seems to depend more on the service sector (linkage indexof 1.67), relative to the service sector’s dependence on the manufacturing sector.
Among service subsectors, government services (public administration andother government services) in general have higher dependency on the manufac-turing sector than do nongovernmental services. Among the nongovernmentalservices, hotel and restaurant services depend relatively highly on the manufac-turing sector for inputs, particularly from the food processing subsector (linkageindex of 15.17). Other examples are transport and storage services, whichdepend relatively highly on the petroleum products subsector (linkage index of6.64); communication services, which have high dependency on the electricalmachinery subsector (6.18); education services, which depend on the food pro-cessing subsector (3.99); and health services, which depend on the industrialchemicals subsector (2.49).
In terms of the degree of importance of service subsectors as inputs to themanufacturing subsectors, the wholesale and retail trade service subsector is animportant input to all manufacturing subsectors particularly to the food process-ing subsector (linkage index of 22.60), because its forward linkage index valuesare all greater than 1.00. Other services that are relatively more important to themanufacturing sector are transport and storage services (particularly to foodprocessing, with an index of 6.23) and business services (particularly to foodprocessing, with an index of 6.59).
In short, the linkage analysis shows that the service and manufacturing sectorsare interdependent. Growth in the service sector (in terms of size or quality) islikely to promote the manufacturing sector and vice versa.
Table 5.1. Multiplier Effect of Increased Demand of RM 1 (US$0.26) in EverySubsector in Each of the Sectors Shown on Other Sectors and the Economy
Sector (RM)
Agriculture, Mining fishery, and and
Sector Services forestry quarrying Manufacturing Construction
Services 35.231 0.752 0.577 9.778 0.212Agriculture, fishery, and forestry 0.464 8.736 0.011 5.139 0.014Mining and quarrying 0.291 0.161 3.111 1.526 0.054Manufacturing 3.734 1.614 0.340 72.553 0.390Construction 0.321 0.031 0.146 0.496 1.008Total economy 40.040 11.294 4.185 89.492 1.678
Source: Authors’ computation based on Department of Statistics 2005, table 15.

Hence, the service sector is an important sector in the domestic economy interms of its contribution to GDP, employment, and inter- and intrasectoral linksin the country. However, its contribution to total exports is much smaller than thecontribution of manufacturing. Overall, Malaysia is not a big exporter of servicesin the global arena. Because of the dominance of multinational corporations inthe manufacturing sector, Malaysia’s export of manufactured goods is facilitatedthrough the import of transport services.
Significance of service exports
Malaysia’s exports comprise mainly manufactured goods. The share of serviceexports in total exports stagnated between 12 and 14 percent from 1998 to2008, while its share in GDP remained within 12 to 16 percent. The share ofservice exports in service value added stood at 36 percent in 2007 before fallingto 25 percent in 2008. This finding indicates that a larger share of service outputin the country is directed toward the domestic economy.
Table 5.2 shows the revealed comparative advantage for Malaysia for fourbroad categories of services. The results suggest that Malaysia has a strong andgrowing comparative advantage in travel services. Transport services indicated acomparative advantage for one year (2007). The comparative advantage thatMalaysia held in computer, communication, and other services in 1999 to 2000has deteriorated over time. These revealed comparative advantages should beinterpreted with caution because these indicators are calculated for a fairlyaggregated group of services; further disaggregation is not possible owing to theunavailability of data.
164 Exporting Services
Table 5.2. Revealed Comparative Advantage of Malaysia, 1999–2008
Real comparative advantage
Sector 1999 2000 2001 2002 2003 2004 2005 2006 2007 2008
Computer, communication, and other services 1.21 1.07 0.77 0.78 0.81 0.75 0.78 0.74 0.64 0.61Insurance and financial services 0.39 0.36 0.42 0.20 0.35 0.32 0.25 0.21 0.18 0.19Transport services 0.85 0.82 0.78 0.81 0.87 0.78 0.86 0.80 1.02 0.91Travel 0.95 1.15 1.55 1.62 1.51 1.68 1.63 1.80 1.82 1.95
Source: Authors’ calculation based on Balassa’s (1965) formula and balance of payments data from theWorld Bank’s World Development Indicators database.

Composition of cross-border service exports
This section identifies the major service exports of the country through its balanceof payments statistics, which are the primary source of data for the country’sexports of services. A shift occurred in the share of the three main categories ofexports over time. From 1995 to 2000, the largest share in exports accrued to otherservices, followed by travel and transport. The share of travel in exports increasedsteadily over time, and it became the largest component in service exports from2001 onward. Although the share of travel ranged between 21 and 35 percent inthe 1990s, it rose to over 40 percent for all years during the 2000s. In 2008, travelconstituted 50 percent of total service exports. The largest share of the travelexport is business travel. Personal travel exports are less than 1 percent, thoughthat figure is increasing. The share of health- and education-related services wasreported for the first time for the years 2004–07.
Although other services constituted the second-largest component in serviceexports from 2001 onward, their share has decreased over time, falling from 34percent in 2001 to 27 percent in 2008. This decrease does not imply that theabsolute value of other service exports has fallen but rather that the value ofexports in this category has not increased as fast as the value of service exports intransport and travel.
Nevertheless, within other services, the shares of some services are increasing,including computer and information services. The share of information and com-munication technology (ICT) service exports in aggregate service exports grewfrom 1.2 percent to 3.4 percent from 1993 to 2008. Total cumulative ICT serviceexports from the Multimedia Super Corridor (MSC), a government-designatedzone for the development of multimedia technology, amounted to RM 7.2 billion(US$2.0 billion) in 2009. Annual ICT service exports from the MSC as a percent-age of total computer and information service exports grew from 66 percent in2005 to 70 percent in 2006 but slowed to 43 percent in 2008.
Transport service exports are the third major group of service exports, witha share of about 20 percent of total service exports throughout the period1995–2006. However, the share of passenger transport in aggregate serviceexports increased significantly from 5.3 percent in 2001 to 10.8 percent in2008. The increase in passenger transport was facilitated by the emergence oflow-cost carriers in Malaysia and subsequently in other countries in the region.These carriers further enhanced tourism within the region as well as businesstravel. Tourism in Malaysia is also boosted by the presence of an increasingnumber of middle-income consumers in Asia, thanks to overall economicgrowth in the region.
The slow growth of transport service exports can be attributed to the fact thatMalaysia has not been able to capitalize on its manufacturing exports to deepen its
The Case of Malaysia 165

service exports. Figure 5.1 plots the value of manufactured exports and transportservice exports over time (1995–2008). Both have clearly increased over time;however, they do not seem to have high correlation with each other. Manufacturedexports increased at a faster rate than transport service exports, leading to awidening gap between manufactured exports and transport service exports overtime. This finding indicates that Malaysia still very much depends on the importof transport services to facilitate its exports of manufactured goods.
The heavy dependence on foreign transport services, particularly foreign ship-ping lines, was noted in a study by Sieh Lee, Abidin, and Loke (2000, 132), whichfound that only 15 percent of Malaysia’s total trade was carried by Malaysianships. This phenomenon has continued in recent years as an estimated 85 percentof total trade is carried by foreign ships (Baird Maritime 2010). Data from theMinistry of Transport show that, in 2005, Maersk Line handled approximately 78 percent of the total cargo in Port Klang and Tanjung Pelepas, two of the majorports in the country. Maersk’s share increased to 82 percent in 2009. The domi-nance of multinational corporations in manufacturing exports and their prefer-ence for using transport services from other multinational corporations in theirhome countries has contributed to this dependence.
In 2007, for the first time since independence, the services account shifted fromnegative to positive in Malaysia’s balance of payments (WTO 2009, 8). Increasingexports of travel services and passenger transportation contributed to this shift.This surplus was retained in 2008, although there was a slight decrease comparedto 2007.
166 Exporting Services
Figure 5.1. Value of Manufactured Exports and Transport Service Exports, 1995–2008
160,000
140,000
120,000
100,000
80,000
60,000
40,000
20,000
0
1995
1996
1997
1998
valu
e (U
S$ m
illio
n)
1999
2000
2001
2002
2003
2004
2005
2006
2007
2008
manufactured exports transport service exports
Sources: International Monetary Fund balance of payment statistics; Bank Negara Malaysia 2010.

Mode 2: Key service exports not fully reflected in balance of payments data
The balance of payments data do not describe the full extent of service exportsbecause they capture only cross-border financial transactions made through thebanking system. An important omission is the domestic expenditure involved inmode 2 service exports. Even for financial services, there are some restrictions inthe use of balance of payments data. First, it is not possible to identify the types offinancial services that are exported, because there are no domestic data on thistopic. Second, financial services in the balance of payments data do not completelycapture the export of some financial instruments and bonds.2 For example, nopublished data are available on the extent to which Islamic financial instrumentsand bonds in Malaysia have been subscribed in the global market. Malaysian andnon-Malaysian corporations and multinationals have issued Sukuk (Islamicbonds), which were subscribed by both domestic and international investors. In2002, Kumpulan Guthrie Berhad issued the US$150 million Global Sukuk (SukukIjarah), the first global corporate Islamic bond issue that was launched in Malaysia(Laldin 2008, 12). The Malaysian government also launched the MalaysianSukuk Ijarah, worth US$600 million, in 2002. To date, Malaysia captures about40 percent of the global Sukuk issuance, but there is no apparent indicator toshow the expansion of the related service activities.
Similarly, tourism is the largest service industry in Malaysia, employing about451,000 in 2005. The number of tourist arrivals increased from 10.2 million in2000 to 16.4 million in 2005 and is expected to reach 24.6 million in 2010 (underthe Ninth Malaysia Plan). This average annual rate of increase of 10 percent hassurpassed the target of 6.9 percent. A major difficulty is determining the amountof tourist receipts spent domestically on related services such as restaurants,transportation, and entertainment. The government estimated that touristreceipts in 2000 totaled RM 17.3 billion (US$4.6 billion), and this figure rose toRM 31 billion (US$8.2 billion) in 2005. The expected tourist receipts in 2010were RM 59.4 billion (US$19.2 billion).
Mode 3: Foreign direct investment outflows
Data on outflows of foreign direct investment (FDI) by sectors and by publicand private companies were not published in Malaysia at the time of writing ofthis chapter. According to the 2009 annual report of the Malaysian central bank,Bank Negara Malaysia, cumulative outflows grew from RM 32 billion (US$10.3billion) for the period 1995–99 to RM 182 billion (US$49.5 billion) for theperiod 2000–09 (Bank Negara Malaysia 2010, 37). The share accruing to servicesin the cumulative outflows from 1995 to 1999 grew from 49 percent to 70 percentfor the period from 2000 to 2009. Financial services, telecommunication, and
The Case of Malaysia 167

utilities are the main subsectors in services that are investing abroad. Govern-ment-linked companies play a big role in outward investment, although privatecompanies are also involved. The investment is focused in the region, especiallyin the Association of Southeast Asian Nations (ASEAN), the Asian newly indus-trialized economies, China, and West Asia.
Anecdotal evidence, as well as data from annual reports, indicates that gov-ernment-linked companies that have investment abroad are Telekom MalaysiaBerhad and banks, including private banks, as shown in tables 5.3 and 5.4.Tenaga Nasional Berhad, the national electricity company, reported in its 2009 annual report that it has investment holding companies in India, Mauritius, and Pakistan. It also operates a power plant and generates electricityin Pakistan.
AirAsia, the low-cost carrier, has joint ventures in Indonesia and Thailand(Indonesia AirAsia and Thai AirAsia). Private hospitals and higher educationinstitutions have also ventured overseas. For example, KPJ Healthcare has facili-ties in Bangladesh, Indonesia, and Saudi Arabia. Eight private higher educationinstitutions in the country have reported having branch campuses overseas,mainly in other developing countries such as Bangladesh, China, India, Indonesia,and various countries in Africa. The exception is Limkokwing University, whichhas reported the establishment of an affiliate in the United Kingdom.
Mode 4: Service exports from Malaysia
Many Malaysians work in Singapore, particularly in health and education serv-ices. An estimated 350,000 Malaysians are working in Singapore, with 150,000commuting from Johor Bahru and the rest residing in Singapore (New StraitsTimes 2009). The number of Malaysian migrants with tertiary educationreported in the countries of the Organisation for Economic Co-operation andDevelopment has increased from 72,649 in 1999 to 102,321 in 2000 (Fong2010). Fong (2010) also reported that there were 7,955 Malaysian science and technology researchers in the United States in 2003 compared with 10,419at home.
Destination of service exports
Malaysia has information on the destination markets for selected subsectors,which permits an analysis of bilateral service exports.
In the case of higher education, the top countries in terms of inflows ofinternational students are China, Bangladesh, and the Islamic Republic of Iran,
168 Exporting Services

The Case of Malaysia 169
Table 5.3. Investment Abroad of Telekom Malaysia Berhad, 2009
Country
Subsidiaries, associates, and affiliates
Shareholding(%)
Nature of business
Number ofsubscribers
Bangladesh TM International(Bangladesh) Limited
70.0 Cellular 8,700,000
Cambodia Telekom MalaysiaInternational(Cambodia) Company Limited
100.0 Cellular 591,515
India Idea Cellular Limited 15.0 Cellular 34,200,000SpiceCommunicationsLimited
49.0 Cellular 3,800,000
Indonesia PT Excelcomindo Pratama Tbk
83.8 Cellular 26,000,000
Iran, Islamic Rep.
Mobile TelecommunicationCompany of Esfahan
49.0 Cellular 13,696
Pakistan Multinet Pakistan (Private) Limited
89.0 Broadband, long-distance, and internationalservices
—
Singapore Mobileone Ltd 29.7 Cellular andbroadband
1,600,000
Sri Lanka Dialog Telekom PLC 85.0 Mobile, Internet,international data and backbone, fixed wireless,transmissioninfrastructure, and media-related services
5,500,000
Thailand Samart Corporation Public CompanyLimited
19.0 Mobile services,multimediaservices, ICTsolutions andservices, andtechnology-related businesses
—
Samart I-Mobile Public CompanyLimited
24.4 Mobile,multimedia, andinternationalbusiness services
—
Source: Telekom Malaysia Berhad 2009. Note: — = not available.

respectively, followed by countries in ASEAN (table 5.5). The most popularundergraduate programs for international students are the transnational pro-grams that are conducted locally in English. International students, includingstudents from China, aspire to obtain the foreign degrees that are awarded bythe parent institutions of these transnational programs. The lower cost of livingin Malaysia is an added attraction. Because Malaysia has multiethnic groups,including a substantial Chinese population, cultural diversity is another com-parative advantage. Over time, the share of students from Bangladesh and Chinahas been declining. The share of Chinese students coming to Malaysia for highereducation declined from 34 percent in 2003 to less than 14 percent in 2007while the share of Bangladeshi students declined from 7 percent to 5 percent inthe same period. By contrast, more students from the Islamic Republic of Iranwere attracted to Malaysia for higher education. Their share increased frombarely 1 percent to 8 percent.
An Observatory on Borderless Higher Education (OBHE) analysis of themarket share of the major and minor players for international students inhigher education from 2007 to 2009 reveals some interesting shifts (Lasanowski2009, appendix C; Verbik and Lasanowski 2007). According to OBHE, the mar-ket share of the major players (namely, Australia, the United Kingdom, and theUnited States) dropped slightly from 45 percent to 44 percent of the world’s
170 Exporting Services
Table 5.4. Operations Abroad of Malaysian Banks, 2009
BankNumber ofsubsidiaries Location of subsidiaries
Number ofbranchesa
AmBank Group 3 Brunei Darussalam, Indonesia, Singapore
3
CIMB 17 Bahrain; Brunei Darussalam; China; Hong Kong SAR, China; Indonesia;Myanmar; Singapore; Thailand; United Kingdom; United States
212
Hong Leong Bank 2 Hong Kong SAR, China; Singapore 2Maybank 14 Bahrain; Brunei Darussalam;
Cambodia; China; Hong Kong SAR, China; Indonesia; Papua New Guinea;Philippines; Singapore; United States;Uzbekistan; Vietnam
342
Public Bank 5 Cambodia; Hong Kong SAR, China; Lao PDR; Sri Lanka; Vietnam
51
RHB Bank 4 Brunei Darussalam, Singapore, Thailand, Vietnam
10
Sources: Annual reports of banks for 2009. a. Includes representative offices and offshore banking units.

overseas students. China, an emerging player in 2007, has joined the league ofthe “middle powers” in this market, although its market share remains at 7 per-cent. In contrast, France and Germany (the other two players in this group)experienced a drop in their shares from 10 percent each to 9 percent each. Theevolving destinations (Canada, Japan, and New Zealand) have also experienceda drop in their respective market shares from 5 percent, 5 percent, and 3 percentto 4 percent, 4 percent, and 2 percent during the same period. Malaysia and Singapore, classified as emerging contenders, maintained their respective mar-ket shares at 2 percent each. The Republic of Korea joined the group of emerg-ing contenders in 2009, with a market share of 1.5 percent.
The Case of Malaysia 171
Table 5.5. Top Source Countries for International Students, 2003–07
Country
Number of students (% of total)
2003 2004 2005 2006 2007 2003–07
Total 30,397 31,674 40,525 44,390 47,928 194,914Bangladesh 2,136
(7.03)1,635 (5.16)
5,712(14.10)
6,517(14.68)
2,506 (5.23)
18,506 (9.49)
China 10,349(34.05)
9,250(29.20)
9,317(22.99)
7,310 (16.47)
6,468 (13.50)
42,694(21.90)
Iran, Islamic Rep. 374(1.23)
703 (2.22)
1,181 (2.91)
1,784 (3.72)
3,678 (7.67)
7,720 (3.96)
ASEAN 8,350(27.47)
9,312(29.40)
10,150 (25.05)
11,099 (25.00)
12,317(25.70)
51,228 (25.80)
Brunei Darussalam 241(0.79)
234(0.74)
218 (0.54)
241 (0.54)
325 (0.68)
1,259 (0.65)
Cambodia 95(0.31)
85 (0.27)
130 (0.32)
213 (0.48)
218 (0.45)
741 (0.38)
Indonesia 5,634(18.53)
6,520(20.58)
6,866(16.94)
7,541 (16.99)
8,454(17.64)
35,015(17.96)
Lao PDR 29 (0.10)
14 (0.04)
19 (0.05)
27 (0.06)
27 (0.06)
116 (0.06)
Myanmar 458 (1.51)
495 (1.56)
566 (1.40)
503 (1.13)
500 (1.04)
2,522 (1.29)
Philippines 130 (0.43)
126 (0.40)
199 (0.49)
300 (0.68)
289 (0.60)
1,044 (0.54)
Singapore 462(1.52)
537 (1.70)
550 (1.36)
618 (1.39)
725 (1.51)
2,892 (1.48)
Thailand 881(2.90)
835 (2.64)
994 (2.45)
944 (2.13)
1,148 (2.40)
4,802 (1.98)
Vietnam 420 (1.38)
466(1.47)
608 (1.50)
712 (1.60)
631 (1.32)
2,837 (1.46)
Source: Data from the Ministry of Higher Education.

Most medical services from Malaysia are exported within the ASEAN region(80 percent in 2007), although Malaysia also attracts European and Japanesepatients (table 5.6). Policy measures have not identified specific niches for medicaltreatment in the country; however, the procedures in demand by medical touristsare procedures for coronary heart disease, plastic surgery, hip and knee implants,dental implants, and high-end diagnostic services (Chee 2007). The share ofpatients visiting Malaysia for treatment who are from ASEAN countries increasedfrom 75 percent in 2003 to 80 percent in 2007. Within the ASEAN region, Indonesiaaccounts for more than 95 percent of patients visiting Malaysia for treatment.Most of the increase in patients coming from ASEAN countries was due to anincrease in patients from Indonesia.
In the case of medical tourism, Malaysia’s share in the global market is less thanthat of Thailand, Singapore, and the Philippines. Malaysia’s share in the global med-ical tourism market, estimated at US$20 billion in 2006, is currently 0.27 percent(US$54 million). Thailand comes in at 3.75 percent (US$750 million), followed bySingapore at 2.13 percent (US$425 million) and the Philippines at 0.63 percent(US$125 million) (Choy 2010).
In the case of general tourism, the top source country is Singapore, followed byThailand, Indonesia, China, Brunei Darussalam, Japan, and Australia (table 5.7).
172 Exporting Services
Table 5.6. Top Destination Countries for Medical Tourism Exports, 2003–07
2003 2005 2005 2006 2007 2003–07
Total 102,883 174,189 232,161 296,687 341,288 1,147,208China 1,829
(1.77)1,974(1.13)
2,664(1.15)
3,765(1.27)
5,099(1.49)
15,331 (1.34)
Japan 7,213(7.01)
7,166(4.11)
9,006(3.88)
11,382(3.84)
11,210(3.28)
45,977 (3.13)
European countries
3,270(3.18)
3,776(2.17)
5,563(2.40)
7,383(2.49)
9,219(2.70)
29,211 (2.55)
ASEANa 77,406(75.24)
142,587(81.86)
189,247(81.52)
235,692 (79.44)
274,998(80.58)
919,930(80.19)
Brunei Darussalam
209(0.20)
449(0.26)
788(0.34)
711(0.24)
1,028(0.30)
3,185 (0.28)
Indonesia 74,579(72.49)
138,387(79.45)
183,503(79.04)
228,486 (77.01)
266,227(78.01)
891,182(77.68)
Philippines 579(0.56)
631(0.36)
1,090(0.47)
1,878(0.63)
1,902(0.56)
6,080 (0.53)
Singapore 1,248(1.21)
2,184(1.25)
2,656(1.14)
3,141(1.06)
3,812(1.12)
13,041 (1.14)
Thailand 791(0.77)
936(0.54)
1,210(0.52)
1,476(0.50)
2,029(0.59)
6,442 (0.56)
Source: Data from the Ministry of Health. a. Figures for ASEAN countries include only the countries shown.

Table 5.7. Top Source Countries for Tourists, 1999–2009
Country 1999 2000 2001 2002 2003 2004 2005 2006 2007 2008 2009 1999–2009
Total 7,931,149 10,221,582 12,775,073 13,292,010 10,576,915 15,703,406 16,431,055 17,546,863 20,972,822 22,052,488 23,646,191 171,149,554
China 257,832 501,590 597,857 674,056 422,624 632,807 432,570 532,914 789,783 949,864 1,019,756 6,811,653
Share (%) 3.25 4.91 4.68 5.07 4.00 4.03 2.63 3.04 3.77 4.31 4.31 3.98
Japan 286,940 455,981 397,639 354,563 213,527 301,429 340,027 354,213 367,567 433,462 395,746 3,901,094
Share (%) 3.62 4.46 3.11 2.67 2.02 1.92 2.07 2.02 1.75 1.97 1.67 2.28
Australia 134,311 236,775 222,340 193,794 144,507 204,053 265,346 277,125 320,363 427,076 533,382 2,959,072
Share (%) 1.69 2.32 1.74 1.46 1.37 1.30 1.61 1.58 1.53 1.94 2.26 1.73
ASEAN 5,944,804 7,190,421 12,868,029 9,877,168 8,032,705 12,479,185 13,226,107 13,839,325 15,565,385 16,567,282 18,289,362 133,879,773
Share (%) 74.96 70.35 100.73 74.31 75.95 79.47 80.49 78.87 74.22 75.13 77.35 78.22
Singapore 4,900,084 5,420,200 6,951,594 7,547,761 5,922,306 9,520,306 9,634,506 9,656,251 10,492,692 11,003,492 12,733,082 93,782,274
Share (%) 61.78 53.03 54.42 56.78 55.99 60.63 58.64 55.03 50.03 49.90 53.85 54.80
Thailand 498,578 940,215 1,018,797 1,166,937 1,152,296 1,518,452 1,900,839 1,891,921 1,625,698 1,493,789 1,449,262 14,656,784
Share (%) 6.29 9.20 7.97 8.78 10.89 9.67 11.57 10.78 7.75 6.77 6.13 8.56
Indonesia 307,373 545,051 777,449 769,128 621,651 789,925 962,957 1,217,024 1,804,535 2,428,605 2,405,360 12,629,058
Share (%) 3.88 5.33 6.09 5.79 5.88 5.03 5.86 6.94 8.60 11.01 10.17 7.38
Brunei Darussalam 187,704 195,059 309,529 256,952 215,634 453,664 486,344 784,446 1,172,154 1,085,115 1,061,357 6,207,958
Share (%) 2.37 1.91 2.42 1.93 2.04 2.89 2.96 4.47 5.59 4.92 4.49 3.63
Philippines 47,238 81,927 122,428 107,527 90,430 143,799 178,961 211,123 327,140 397,884 447,470 2,155,927
Share (%) 0.60 0.80 0.96 0.81 0.85 0.92 1.09 1.20 1.56 1.80 1.89 1.26
Vietnam 3,827 7,969 18,729 21,158 21,663 42,088 52,543 63,866 119,973 122,933 149,685 624,434
Share (%) 0.05 0.08 0.15 0.16 0.20 0.27 0.32 0.36 0.57 0.56 0.63 0.36
Cambodia — — — 7,705 8,725 10,951 9,957 14,694 23,193 35,464 43,146 153,835
Share (%) — — — 0.06 0.08 0.07 0.06 0.08 0.11 0.16 0.18 0.09
Source: Tourism Malaysia website, http://www.tourism.gov.my. Note: — = not available.a. Figures for ASEAN countries include only the countries shown.
17
3

Singapore’s share declined in the past decade, from 62 percent in 1999 to 54 per-cent, whereas Indonesians’ interest in visiting Malaysia increased, rising from 4 percent to 10 percent. Thailand’s share increased to 12 percent in 2005 but in2009 declined to its 1999 level of 6 percent.
On the basis of available data, the World Economic Forum travel and tourismcompetitiveness index ranked Malaysia ahead of Thailand, Indonesia, and thePhilippines but behind Singapore in terms of competitiveness in travel andtourism (table 5.8). Malaysia was ranked higher than Singapore for subindexes onhuman, cultural, and natural resources, probably because of the lack of resourceavailability in Singapore.
The emergence and subsequent expansion of Malaysia’s first low-cost carrier,AirAsia, has facilitated regional travel for inflows and outflows of tourists by mak-ing regional travel much more affordable than before. The emergence of low-costcarriers in other countries in Southeast Asia has also enhanced tourist flows in theregion. The rise of the middle class in the countries in the region is another factorcontributing to increased regional travel. Hence, intraindustry trade is expected tobe higher in this subsector than in other subsectors. Because Malaysia and theGulf Cooperation Council are the two main centers in the application of Islamicfinance contracts to financial products and cover a major portion of the total mar-ket of global Islamic finance, intraindustry trade is expected to prevail in theIslamic financial sector. Despite differences in Shariah opinions between the twoIslamic financial centers, some contracts are universally accepted—namely, themudaraba contract for project financing and deposits (Gintzburger 2010). Hence,it is expected that for universally accepted contracts there will be cross-borderflows between the two centers.
Factors behind the Success of Service Exports
Several factors explain the success behind Malaysia’s service exports. The funda-mentals are covered here.
174 Exporting Services
Table 5.8. Travel and Tourism Competitiveness Index, 2009
Business Human, cultural, Regional Overall Regulatory environment and and natural
Country index index framework infrastructure resources
Singapore 2 10 6 5 23Malaysia 7 32 42 38 14Thailand 8 39 70 40 19Indonesia 15 81 113 79 40Philippines 16 86 85 89 70
Source: Blanke and Chiesa 2009.

Economic performance
Political and economic stability are important for attracting providers and con-sumers of services. Malaysia’s overall economic performance has been very satis-factory over the 14 years from 1995 to 2008. Annual GDP has risen, with growthrates of well over 5 percent in most years during that period, with one exceptionduring the Asian financial crisis in 1998, when negative growth was recorded. As aresult of the continued positive economic growth, Malaysia’s GDP per capitaalmost doubled, from US$4,479 in 1995 to US$8,197 in 2008.
Although the economy grew at high rates, inflation was relatively well man-aged, with rates below 3.6 percent in most years. The exceptions were in 1998 and2008, when inflation rates exceeded 5 percent. One main factor for the higherinflation rates was the world price of oil, particularly in 2008.
Unemployment rates in the period from 1998 to 2008 also were relatively low,at about 3 percent every year. The country’s domestic supply of labor has not beenable to meet market demand. Labor shortage is particularly acute for low-skilledjobs such as plant assemblers and shop floor workers. Malaysia relies on foreignlabor, mainly from neighboring countries such as Cambodia, Indonesia, Myanmar,Nepal, and Vietnam.
Business climate
In general, Malaysia’s business climate is relatively conducive to both domesticand multinational corporations. It is still relatively easy to start a business inMalaysia, as compared to other countries in the region and throughout theworld (table 5.9). However, increasing competition from other countries andthe emergence of new markets in the world in recent years, coupled with someother domestic factors such as the perception of increasing corruption and dete-riorating safety in the country, have caused Malaysia’s ranking to deteriorate(table 5.10). According to the World Bank’s Doing Business indicators for 2006,
The Case of Malaysia 175
Table 5.9. Ease of Starting a Business: Malaysia and Regional and Global Averages, 2010
East Asian and Pacific Global Indicator Malaysia average average
Procedures (number) 9 8 8Time (days) 30 41 36Cost (% of income per capita) 25 26 41Paid-in minimum capital (% of income per capita) 0 21 60
Source: World Bank 2009.

Malaysia was preferred to countries such as Korea and almost equal to Thailandfor locating a business. However, in 2010, Korea improved in its ranking,whereas Malaysia dropped in its ranking.
Nevertheless, basic political and macroeconomic stability as well as ease ofdoing business in Malaysia are only three prerequisites for attracting consumersand providers of services to Malaysia. Other factors need to be in place, asexplained in the following sections.
Natural endowment and cultural factors
Malaysia has abundant natural resources to support tourism, especially eco-tourism in East Malaysia (Sabah and Sarawak). East Malaysia has extensive forestand tree cover that supports its megabiologically diverse endowments, includingexotic flora and fauna as well as different species of mammals, invertebrates, fish,and birds. A number of national and state parks have caves, including some of thelargest and longest in the world. The country also hosts a large variety of birdspecies as well as migratory birds, because it is located on the Australasian cross-migratory bird paths.
A number of tourism destinations have been established as gazetted terrestrialor marine protected areas. Daud (2002, 129) reports that 5 percent of the terres-trial area, covering 1,464,973 hectares, is protected. This protected area includes 1 national park, 18 state parks, 18 wildlife reserves, 3 wildlife sanctuaries, 3 birdreserves, and 2 protected landscapes. Marine protected areas include more than40 islands. The protected areas are managed by the Department of Wildlife andNational Parks, the Forestry Department, the Fisheries Department, and variousstate park authorities.
Malaysia is well known as a multiethnic society. Its population of 28 millionin 2009 comprises Malays (53 percent), indigenous or other Bumiputera groups
176 Exporting Services
Table 5.10. Ease of Doing Business: Ranking of Malaysia and Selected Economies, 2006–10
Economy 2006 2009 2010
Singapore 2 1 1Thailand 20 12 12Korea, Rep. 27 23 19Malaysia 21 21 23China 91 86 89Vietnam 99 91 93Indonesia 115 129 122
Source: World Bank 2005, 2009.

(12 percent of the population), Chinese (26 percent), Indians (8 percent), andother unlisted ethnic groups (1 percent). This multiethnic composition inevitablyimplies a multicultural society. In addition, Malaysia’s long-standing openness tointernational trade and FDI in the manufacturing sector has also led to a signifi-cant population of expatriates working in the country, thereby further enhancingthe diversity of cultures. The increasing presence of foreign workers since the early1990s, estimated at 1.9 million in 2009, has further added to the country’s diversity.This diversity is a source of advantage for Malaysia because Malaysian workers arecomfortable working with other ethnic groups and foreigners find it relatively easyto adapt to working with Malaysians. The Chinese and Indian diasporas in Malaysiamay be able to use kinship ties to penetrate the markets in China and India.
Special factors
A number of special factors have also encouraged the development of serviceexports.
Government support of service exportsThe Multimedia Super Corridor was established in 1996 to build a competitivecluster of local ICT companies and a sustainable ICT industry. Malaysia devel-oped the MSC by providing financial and nonfinancial incentives such as 100 per-cent foreign equity ownership and no restrictions on the employment of foreignknowledge workers. By 2005, a total of 1,421 companies had been established inthe MSC and were given MSC status. Of these, 349 companies were foreign ownedand 39 were 50-50 joint ventures. By 2009, the number of firms in the MSC hadgrown to 2,520, of which 25 percent were foreign, including joint ventures. Cumu-lative FDI in 2009 amounted to RM 5.8 billion (US$1.65 billion).
For travel service exports, the government approved the establishment ofthe first low-cost carrier in 2001. Although AirAsia is not the first low-cost car-rier in Southeast Asia, it is certainly the most successful—partly because it didnot intend to remain a domestic carrier even though it was established as one.By 2007, AirAsia had captured 48.6 percent of the domestic air traffic volume,leaving 51.4 percent of the domestic market to the national carrier, MalaysianAirlines (WTO 2009, 65).
In line with its regional ambitions, AirAsia quickly formed joint ventures inIndonesia and Thailand to capture those markets as well as to position itself forthe ASEAN open-skies policy (Tham 2008, 24). It is the biggest low-cost carrierin Southeast Asia, measured by fleet size, and has since ventured into long-haultravel by establishing AirAsia X. After AirAsia’s entry into the domestic market,the government deregulated the underserved, lucrative Malaysia-Singapore
The Case of Malaysia 177

monopoly in 2008. This route previously had been served by the national carriersof the two countries.
The establishment of the Low-Cost Carrier Terminal in 2006 boosted travelers’use of AirAsia. The rapid expansion of AirAsia has led to the expansion of the cur-rent facilities as well as to plans to build a similar terminal in the near future.
The enactment of the Islamic Banking Act in 1983 introduced Islamic bankinginto the country. Islamic banks offer the entire range of Islamic products.Although conventional banks offer conventional products, they are also allowedto offer Islamic products. A national Shariah Advisory Council was established bythe Securities Commission in 1996 to facilitate the development of the Islamiccapital market in the country (Securities Commission 2009). Members of thecouncil are highly qualified Malaysians with wide international exposure andinternational scholars in the region. The council serves as the sole authority forthe issuance of rulings and guidelines on the Islamic capital market. The provisionof specialized institutions gave Malaysia a first-mover advantage in setting stan-dards for Shariah-compliant equities for the stock market in Malaysia. Subse-quently, other stock markets around the world followed suit, thereby increasingcompetition in the Islamic capital market.
Strategic positioning of MalaysiaMalaysia has leveraged its relative strengths to focus on selected service subsectors.First, Malaysia has strategically positioned itself to benefit from its geographicproximity to Singapore and its historical links to Singapore. Key factors areMalaysia’s lower costs of services, Malaysians’ proficiency in the English language,and the central role of Islam in the country. Malaysians’ English-language skillshave also helped Malaysia to position itself against large countries in ASEAN suchas Indonesia and Thailand, where English proficiency is lower. The University ofNottingham has acknowledged that Malaysians’ proficiency in English was one ofthe main factors that led to it to choose Malaysia over Thailand for its branchcampus in the region.
The relatively lower cost of living in the country has distinguished Malaysiafrom Singapore. Although Singapore has numerous strengths relative to Malaysia,it is considerably more expensive to live there. Private hospitals that are based inSingapore have invested in Malaysian hospitals in order to tap the lower cost offacilities in the country. Patients who have found Singapore hospitals to be tooexpensive are diverted to the Malaysian counterparts, which can perform the sameprocedures at lower cost. Similarly, branch campuses in Malaysia are less expen-sive than branch campuses in Singapore.
Consequently, complementary services have developed between the two coun-tries in three areas of service exports: higher education, medical services, and
178 Exporting Services

tourism. Malaysia provides services in the lower-priced market according to itslower-cost advantage, while Singapore provides the same services for the higherend of the market. This complementarity has also attracted Singaporean invest-ment in Malaysian services in the case of medical tourism. U.S.-owned Singaporehospitals (such as Parkway Holdings) have invested in Malaysian hospitals to tapthe synergies of complementary services. In that way, foreign patients can bedirected to either Malaysian or Singaporean hospitals according to their budgetconstraints. The launch of the Iskandar Development Region in 2006 was expectedto capture more of the potential synergies between Singapore and the southernpart of Malaysia for the development of complementary services.
Finally, the Muslim population in Malaysia has led to the creation of an alter-native banking system that can serve the needs of Muslims and to the subsequentvision of making Malaysia a hub for Islamic finance. By positioning itself as amodern Islamic country, Malaysia has been able to draw tourists, students, andpatients to the country.
Unilateral liberalization and fostering of domestic competitionThe provision of certain public goods such as higher education and health by theMalaysian government has been limited by financial constraints. Consequently,the government has permitted private operators to provide for such services in thecountry. The number of private providers grew rapidly in response to the excessdemand in the country, leading to a substantial presence of private providers inboth the higher education and the health sectors. In 2009, there were 454 privatehigher education institutions and 222 private hospitals, including private mater-nity and nursing homes. Although local providers predominate in those two sec-tors, foreign providers also exist. For example, in the case of higher education, fivebranch campuses are operating in the country.
The large pool of domestic health and higher education providers has cre-ated a competitive domestic environment. It has also created increasing pres-sures to extend the services of these providers to international students andpatients, which in turn has led to increasing exports of these services, primarilyin the form of mode 2. Moreover, as discussed earlier, domestic providers arealso venturing overseas.
Progressive liberalization at the national, regional, bilateral, and multilateral levelsMalaysia is progressively liberalizing the service sector at the national, regional,bilateral, and multilateral levels. In particular, the lack of progress at the multilat-eral level has accelerated the liberalization process at the regional and bilateral levels. Under the ASEAN Framework Agreement on Services (AFAS), seven
The Case of Malaysia 179

packages of liberalization have been undertaken thus far. Malaysia is also party toadditional ASEAN agreements that cover services, such as the ASEAN-China,ASEAN-Japan, and ASEAN-Korea agreements. At the bilateral level, Malaysia hassigned agreements with Japan, New Zealand, and Pakistan.
Although no study has been conducted to assess the extent to which the recentcommitments have pushed domestic liberalization, the number of sectors thathave been committed has progressively increased over time. For example, in thecase of AFAS, Tham (2009) has shown that the number of sectors committed atthe three-, four-, and five-digit level increased substantially from AFAS 2 to AFAS7. There are also three sectors with 100 percent coverage: construction, education,and tourism and travel-related services. At the bilateral level, Malaysia increasedthe extent of foreign equity permitted in the higher education sector from lessthan 50 percent to 70 percent in the Malaysia–New Zealand agreement becausethis sector is important to New Zealand.
Domestically, Malaysia has undertaken unilateral liberalization, but only afterlocal providers secured a competitive capacity for providing the selected services.Some examples are higher education, medical, telecommunication, and airlineservices, all of which were originally provided by the public sector. When the pub-lic sector could not provide sufficient services to meet the growing demand, thegovernment introduced the first stage of liberalization by allowing the private sec-tor to offer similar services. For example, because public universities are unable tooffer enough places of study, the government allowed the private sector to fill thisshortfall. This change then became a catalyst for the development of privatehigher education. A similar process took place in the case of medical, telecommu-nication, and airline services. Subsequently these service sectors were liberalized,which led to foreign service providers participating in the local market anddomestic providers exporting their services and investing abroad with theirenhanced capacity.
Encouragement of inward FDI in Islamic finance and higher educationIn Malaysia, there are significantly more local establishments in most services thanforeign establishments, partly because of foreign equity restrictions in the servicesector. The New Economic Policy allocated equity ownership in Malaysia to 30 percent for Bumiputera, 40 percent for non-Bumiputera, and 30 percent forforeigners. The Foreign Investment Committee (FIC) was set up in 1974 for theapproval of nonmanufacturing activities that are not under the jurisdiction of anyministry as well as for the acquisition of corporate ownership (under the Guide-lines for the Acquisition of Assets, Mergers, and Takeovers) and property owner-ship (under the Guidelines for the Acquisition of Property by Local and ForeignInterests). After the Asian financial crisis in 1999, this restriction on foreign equity
180 Exporting Services

ownership was removed for the manufacturing sector. It was also relaxed forselected service subsectors such as telecommunications and ports. But the bank-ing and insurance sector is an exception to the pattern. Unlike other sectors, 100 percent foreign equity ownership is permitted for locally incorporated foreignbanks, foreign Islamic banks, international Islamic banks, international takafuloperators, and Islamic reinsurers.
The restrictions on equity ownership have limited FDI inflow, which conse-quently might have retarded the growth of the service sector, except in the case ofIslamic finance where there is large participation by multinational firms: 61 per-cent of commercial banks and 34 percent of Islamic finance banks are foreignowned. In addition, there are 4 international Islamic banks and 11 foreign-ownedIslamic banks.
Similarly, the higher education subsector was liberalized unilaterally in 1995,when foreign higher education providers were given licenses to operate. Five for-eign universities have since established their branch campuses in Malaysia.
Because of increasing concern over the inflows of FDI, the Department ofStatistics has published—for the first time—data on inflows by sectors andcountries of origin. Data from the Quarterly Survey of International Investmentand Services indicates that the stock of FDI3 in the country grew from RM 129.1billion (US$33.97 billion) in 2001 to RM 253.8 billion (US$73.83 billion) in2007. Equity capital is the largest component in the stock of FDI, followed byreinvested earnings; other capital is the smallest component. Although data onthe first two components revealed an upward trend, data on other capitalshowed a converse downward trend.
It is worth noting that the service sector had the largest increase in its share,from 1 percent in 2003 to 9 percent in 2007.4 However, manufacturing remainedthe largest recipient of FDI for the period, even though its share in total FDIdeclined from 58 percent in 2003 to 53 percent in 2007. The share of financialintermediation, including insurance (the second-largest recipient in 2003), alsofell—from 29 percent to 16 percent. In contrast, the share of mining (the third-largest recipient in 2003) increased, from 5 percent to 8 percent. Investment inupstream activity constituted an important component in this sector, as PetroliamNasional Berhad (PETRONAS) and its foreign partners continue their explo-ration, production, and development of the oil and gas resources in the country.The share of trade and commerce (the fourth-largest recipient in 2003) alsoincreased, from 5 percent to 8 percent.
According to Bank Negara Malaysia, net inflows fell from RM 29.1 billion in2005 to RM 26.7 billion in 2008, partly because FDI was rechanneled to theservice sector, where the scale of investment is smaller because it is less capitalintensive (Bank Negara Malaysia 2010, 36; WTO 2009, 11). Competition for FDI
The Case of Malaysia 181

from China, India, and Vietnam (as well as from Hong Kong SAR, China, andfrom Singapore) is also cited as a reason for moderation in net inflows intoMalaysia. Bank Negara Malaysia’s 2009 annual report estimated that net inflowinto the financial sector, including Islamic finance, amounted to RM 41.6 billion(US$11.8 billion) from 1999 to 2009, after the liberalization of that sector (BankNegara Malaysia 2010). This figure is in line with the government’s plan to buildMalaysia as a hub for Islamic finance.
The relaxation of foreign equity restrictions in financial services has beenmapped out in the Financial Services Master Plan of 2001. For example, foreignequity limits for investment banks, insurance companies, and Islamic insurerswere raised from 30 percent to 49 percent in 2005 and then to 70 percent in2009 (WTO 2009, 60). An increasing number of banking licenses with 100 per-cent foreign equity have been given for Islamic banks over time. Hence, therewas net inflow in the financial sector for the period 1999–2009. On April 22,2009, foreign equity restrictions on 27 service subsectors were removed. Thismove was followed a week later by the relaxation of foreign equity ownershipin financial services. In June 2009, the government announced that the FICguidelines would be deregulated and that limitations on foreign equity wouldbe decided by the regulator of the industry. These changes in equity restrictionsindicate that the government has been progressively opening up the servicesector to foreign investment.
Quality assuranceIn higher education, quality assurance is provided by the Malaysian QualificationsFramework for higher education in the country. The framework is a description ofthe national education system, including all qualifications and learning achieve-ments in higher education. It is governed by the Malaysian Qualifications Agency(MQA). In 2009, 7,074 programs were offered in the country, of which 2,298 hadachieved minimum standards while 2,167 (or 35 percent of the total number ofprograms) had received full accreditation. Quality assurance is provided for inter-national students, because only accredited programs are allowed to recruit interna-tional students. The MQA’s accreditation does not imply recognition.
There are ongoing efforts to increase recognition through the MQA’s collabora-tive links with several international networks in quality assurance, such as theInternational Network for Quality Assurance Agencies in Higher Education. At theASEAN level, mutual recognition agreements have been signed for seven areas:engineering services, nursing services, architectural services, survey qualifications,medical practitioner services, dental practitioner services, and accounting services.Malaysia is also a member of the Washington Accord, which provides recognitionfor engineering degrees for its member countries.
182 Exporting Services

In the health sector, the Malaysian Society for Quality in Health (MSQH) is theonly body that is recognized to carry out accreditation. The MSQH emphasizespatient safety and medical audits. It was formed through the initiative of the Min-istry of Health, the Association of Private Hospitals of Malaysia, and theMalaysian Medical Association. It is based on international standards with localmodifications, and it is affiliated with international health care accreditation bod-ies such as the International Society for Quality in Health (ISQua) and the JointCommission International (JCI). Both the MSQH and the JCI are recognizedmembers of the International Accreditation Federation Council. MSQH is also inthe process of forming ASQua, or the Asian equivalent of ISQua. As of 2009, 79hospitals were accredited by MSQH, of which 24 were private (Tham 2009). Onlyaccredited hospitals are allowed to take in international patients. JCI standards areinternationally accepted, so JCI accreditation has implications for the insurancecoverage of the patient. Malaysia has six JCI-accredited hospitals and health-related establishments (Choy 2010).
These quality assurance efforts are more effective for mode 2 rather than mode4 exports. International students and patients are drawn to Malaysia because thesequality assurance factors work in conjunction with other factors, such as costs,marketing, and the recruitment initiatives of the providers and the government.Malaysian domestic regulations do not hinder the movement of these studentsand patients.
In contrast, domestic providers seeking to export their services through mode4 may face other problems, because quality assurance and recognition are not theonly factors that determine the mobility of Malaysian providers to other coun-tries. For example, Malaysian architects who seek to export their services abroadmust satisfy regulations in the country to which they plan to export, which willinclude factors besides recognition. They must have the necessary network to finda local partner for an overseas project if domestic regulations so require.5
Regulatory frameworkThe service sector is regulated by various government ministries, departments,and agencies. Table 5.11 summarizes the relevant regulators and regulations forselected services: Islamic banking and finance services, private health care services,private tertiary education services, and tourism and travel-related services.
As shown in table 5.11, the regulatory framework for these services is rela-tively well laid out in the domestic legislation. Each of the acts listed spells outthe procedures for obtaining a license to operate and the guidelines for conductfor establishments covered by the act. The licensing system ensures that opera-tors conform to minimum standards before they are given the license to operate.The governance of the system is made readily available to the public through the
The Case of Malaysia 183

act, and it is transparent to the providers. For example, in the case of Islamicfinance, domestic regulations as specified in the legislation reflect the distinctfeatures of Islamic finance and aim to instill financial stability, market disci-pline, and public confidence (bin Ibrahim 2007). There are, therefore, guide-lines on corporate governance, a framework for the rate of return, guidelines onfinancial disclosure and Shariah governance, and Islamic money market and
184 Exporting Services
Table 5.11. Regulators and Regulations for Selected Services
ServicesRegulators andpromoters Regulations
Islamic banking and finance
Bank Negara MalaysiaSecurities CommissionIslamic Financial ServicesBoard (International)
Exchange Control Act 1953Islamic Banking Act 1983Securities Industry Act 1983Takaful Act 1984Banking and Financial Institutions Act 1989Securities Industry (Central Depositories)Act 1991Securities Commission Act 1993Islamic Financial Services Board Act 2002Capital Markets and Services Act 2007
Private health care services
Malaysian Health Travel CouncilAssociation of PrivateHospitals Malaysia Various professionalorganizations
Fees Act 1951 (amended in 2003)Medical Act 1971Dental Act 1971Standards of Malaysia Act 1996Malaysian Health Promotion Board Act 2006
Private tertiaryeducation services
Malaysia QualificationAgency Higher EducationDepartment, Ministry of Higher Education
Immigration Act 1959 and 1963Employment (Restriction) Act 1968(revised in 1988)Universities and University Colleges Act 1971National Accreditation Act 1996National Council on Higher EducationAct 1996Private Higher Educational Institutions Act 1996
Tourism and travel-related services
Tourism MalaysiaBahagian PerkhidmatanPerlancongan, Ministry of Tourism
Innkeepers Act 1952National Parks Act 1980Malaysia Tourism Promotion Board Act 1992Tourism Industry Act 1992Tourism Vehicles Licensing Act 1999
Source: Authors’ compilation based on data from the website of the Attorney General’s Chambers ofMalaysia (http://www.agc.gov.my) and information provided by the respective ministries.

capital adequacy standards. A dedicated high court adjudicates cases that arerelated to Islamic finance.
The respective regulators also ensure that the standards required are adheredto. For example, the Ministry of Higher Education works with the MQA on issuesrelated to course accreditation. The ministry also reviews the licenses that havebeen awarded. There is also benchmarking to international best practices toensure that the standards conform to best practices. Dialogues between the regu-lators and the providers (which are represented by their respective associations)are held at regular intervals. These dialogues serve as important lines of commu-nication between the providers and regulators, so that problems that emerge inthe respective sectors are resolved. Malaysia, therefore, has a well-developed sys-tem in place to govern the sectors listed in table 5.11.
Factors Constraining Service Exports
A number of factors constrain service factors, as described in this section.
Trade restrictions by other countries
The service sector is highly regulated in most countries. Even though there areongoing liberalization efforts at both the regional and the bilateral levels, the out-comes of these negotiations do not necessarily enable Malaysian exporters to pen-etrate and capture the markets of partner countries in these agreements becausethere are domestic regulations to contend with. Understanding the domestic reg-ulations of the targeted export country is essential if Malaysian exporters are topenetrate the markets of partner countries to these agreements. For example, amoratorium on the establishment of new institutions of higher learning in acountry will render the country’s offer of no limitations in mode 3 meaningless.
As identified by Mattoo (2003), the main barriers to trade in services in mode4 are immigration issues, especially visa-related barriers, discriminatory treat-ment of foreign service providers, and inadequate recognition of qualifications.Structural barriers, such as limited opportunities for gaining local experience, alsoexist. Communication skills, lack of a professional network, and limited knowl-edge of the local job market are other barriers.
Shortage of skills in Malaysia
The recently released NEM notes that, in 2007, only 25 percent of Malaysia’slabor force was in the highly skilled category. This percentage is alarmingly lowcompared with neighboring countries such as Korea (35 percent); Singapore
The Case of Malaysia 185

(49 percent); and Taiwan, China (33 percent). The share of highly skilled laboralso declined across various industries in the country between 2002 and 2007.The electrical and electronic sector, for example, experienced a notable declinein the share of highly skilled labor usage, from 54 percent in 2002 to 46 percentin 2007 (NEAC 2010, 50, figure 10).
The lack of highly skilled workers in the labor force is due to at least two fac-tors: (a) the weaknesses of the country’s education system and (b) a constant out-flow of talented workforce. The percentage of adults with tertiary education in thecountry is relatively low compared with countries such as Korea and Singapore(table 5.12). The Human Development Report 2009 (UNDP 2009) noted that only8.0 percent of Malaysian adults had tertiary education. This percentage is farlower than in Hong Kong SAR, China (15.2 percent); Korea (23.4 percent); andSingapore (19.6 percent). Even the Philippines has a slightly higher percentage(8.4 percent).
The recent Global Competitiveness Report 2009–2010 (Schwab 2009) confirmsthe relatively low level of skills in the labor force (table 5.13). Although Malaysiaperforms much better than other ASEAN economies such as Thailand in terms oflabor force skills, the skills level is still low for most of the indicators when com-pared with Singapore and Taiwan, China. In the case of India and Korea, the rela-tive performance is mixed, with some indicators in Malaysia scoring higher (suchas quality of education system, local availability of research and training services,and extent of staff training) and other indicators scoring lower.
In addition to the low percentage of highly skilled workers in the country, feed-back from many industry players indicates that Malaysian graduates lack the skillsneeded in the market. As a result, in 2008, about 25 percent of local graduatesfrom public universities remained unemployed six months after graduation(NEAC 2010). The 2007 Trends in International Mathematics and Science Study(TIMSS and PIRLS International Study Center 2007) shows that Malaysia’s scoresin both mathematics and science were below the international average scores,
186 Exporting Services
Table 5.12. Percentage of Adults with Tertiary Education
Economy Share (%)
Malaysia 8.0
Philippines 8.4
Hong Kong SAR, China 15.2
Singapore 19.6
Korea, Rep. 23.4
Source: UNDP 2009. Note: Percentage of the population age 25 years and older who have attained tertiaryeducation.

thereby implying that Malaysia is not producing good-quality students. Thus,there is a shortage of skilled human capital in the country, and improving thesituation is critical if Malaysia is to enhance its export of knowledge-basedservices. To a great extent, this constraint has affected Malaysia’s ability toexport ICT services, despite the early advantages offered by the MSC, becauseMalaysia’s size and the availability of the labor force—as well as the country’sfinancial incentives for business process outsourcing services—are less attractivethan those of India and the Philippines (A.T. Kearney 2009).
The large inflow of low-skilled migrant workers into the country since 1990has contributed to the reluctance of industries to move to high-value-added activ-ities using more skilled workers. The availability of low-skilled labor has encour-aged industries in the agriculture, manufacturing, and service sectors to continuetheir activities and maintain the same level of profitability. As a result, industriesare unwilling to train and upgrade the skills of local workers.
Increasing competition from other countries
The initial advantages of Malaysia in the case of low-cost carriers and Islamicfinance are being challenged by the rapid emergence of competitors, especiallyfrom countries within the region. Low-cost carriers have been established in other
The Case of Malaysia 187
Table 5.13. The Global Competitiveness Index, Selected Indicators for Skills, 2009–10
Indicator IndiaKorea,Rep. Malaysia Singapore
Taiwan,China Thailand
Quality ofeducation system 37 47 23 1 17 67
Quality of mathand scienceeducation 22 18 34 1 6 62
Quality ofmanagementschools 15 44 34 5 31 59
Local availability of research andtraining services 32 35 26 14 22 61
Extent of stafftraining 34 29 16 2 19 62
Availability ofscientists andengineers 4 25 33 14 7 54
Source: Schwab 2009. Note: Rankings are out of 133 economies.

countries, such as One-Two-Go and Nok Air, which were established in Thailandin 2003 and 2004, respectively (Zhang and others 2009). Singapore establishedTiger Airways in 2004. The Australian carrier Qantas established Jetstar in 2004also. Similarly, Singapore has established terminals for low-cost carriers.
In the case of Islamic finance, the general increase in interest in Islamicinstruments in the world has led Singapore to also focus on Islamic finance tostrengthen its position as a financial center. Korea is also venturing into Islamicfinance.
Similarly, economies such as Bahrain; China; Hong Kong SAR, China; India;Qatar; Singapore; Thailand; and the United Arab Emirates are also aiming to behubs for higher education as well as for medical tourism. Increasing competitionwill require Malaysia to innovate constantly in terms of products and costs to pro-vide a competitive edge for the country.
Broadband penetration, speed, and cost
In general, the pattern of service exports shows that Malaysia has been able toexploit its geographic and cultural proximity to other countries in the region.Most countries in this region are in the developing phase of their economy. Giventhe state of infrastructure in developing countries, Malaysian providers are lim-ited by the infrastructure facilities available in the partner countries. Even thoughMalaysia has a high-quality telecommunication network, for instance, and anInternet penetration of 62 persons per 100 population, mode 1 service exports areinhibited by the quality of the telecommunication networks in destination devel-oping countries. Moreover, although Malaysia has six higher education institu-tions that specialize in providing e-learning, these institutions have limitedopportunities to expand their services to the less developed countries in theregion (such as Cambodia, the Lao People’s Democratic Republic, Myanmar, andVietnam) because of those countries’ limited infrastructure support for this typeof learning. It would appear that mode 3 exports may be more useful than mode1 exports to other developing countries until they have developed the infrastruc-ture necessary to handle mode 1 exports from Malaysia.
Conclusion
Overall, exports of some selected services, such as higher education, medicaltourism, and Islamic finance, are beginning to emerge as potential revenue earnersfor the country. These industries are expected to join tourism as major exportingsectors that can balance the present dependency on manufacturing exports.Malaysia is relatively more successful in exporting services under mode 2 (that is,
188 Exporting Services

bringing international consumers in the form of students, patients, or touristsinto the country). The ability to bring investors into the country is improving overtime with the increasing relaxation of the equity restrictions on foreign owner-ship. Limited data on mode 4 exports also suggest that the number of Malaysianprofessionals working in other countries has increased over time.
Several factors assist these emerging exports, including a stable political andmacroeconomic regime and a relatively business-friendly environment. In partic-ular, Malaysia’s first-mover advantage in developing low-cost carriers, the MSC,and Islamic finance have provided an edge that has helped the country compete inthe region. The fact that Malaysia ventured into certain service sectors has helpedthe country be a pioneer exporting these services. The success of these exports wasfacilitated by strong government support that recognized the potential of theseservice exports. Malaysia’s natural endowment and a culturally diverse societyenhanced its appeal not just in the tourist sector but also in higher education andmedical tourism.
Another factor that explains Malaysia’s success in exporting services is liber-alization, especially in the higher education and Islamic finance sectors. For thehigher education, medical, and airline services, Malaysia first liberalized domes-tically because the public sector could not provide sufficient services to meet thegrowing demand. Because public universities are unable to offer enough placesof study, the government allowed the private sector to fill this shortfall. Thismove then became a catalyst for the development of private higher education.The medical and airline services underwent the same process, in which the pri-vate sector initially enhanced domestic capacity and later began to export. At thesame time, at the bilateral and regional levels, Malaysia has progressivelyincreased the number of committed sectors. For example, under the AFAS,Malaysia has made commitments in all the major service categories.
Finally, government policies have also significantly aided the provision ofservices in the international market. Policies that have worked for the countryinclude quality assurance and a sound regulatory framework. In the case ofhigher education and medical tourism, the endowment was not natural but wasbuilt by developing domestic capacity and by setting international standardsand a sound regulatory framework for domestic providers to adhere to. In thecase of tourism, the government invested in global campaigns such as MalaysiaTruly Asia, to promote the country as a major tourist destination in addition toproviding the necessary infrastructure, such as airports, roads, and railways, tofacilitate the movement of goods and people.
However, while the country has been relatively successful in bringing the worldto Malaysia, it has been less successful in bringing Malaysia to the world. The mainfactors that are constraining Malaysia in penetrating the world service market in
The Case of Malaysia 189

terms of mode 4 are trade barriers encountered in other countries. Because it isrelatively easier to enter other developing countries, Malaysia is also constrainedby the availability of suitable infrastructure in other developing countries for theprovision of mode 1 supply. For example, Vietnam, Indonesia, and Pakistan havee-readiness scores of 64, 65, and 66, respectively, of 70 countries ranked (EIU2009). At the same time, the country is challenged by increasing competitionfrom other countries in all the main export subsectors. Finally, human capitalconstraints are increasing over time. In the short term, importing foreign skilledworkers will help, because the development of human capital has a rather longgestation period. Attracting Malaysian expatriates back to the country isanother intermediate solution. These improvements will also help restore therelative attractiveness of Malaysia as a host country for knowledge-based andtechnology services.
Notes
1. According to the linkage index, a backward linkage that is greater (less) than 1.00 implies thatthe sector or industry has an above (below) average dependency on a particular domestic industry forits input requirements. A forward linkage that is greater (less) than 1.00 implies that a particulardomestic industry has an above (below) average dependency on the sector or industry in question forits input requirements.
2. Financial services covered in the balance of payments are defined as financial intermediary andauxiliary services, except insurance and pension fund services. They include deposit taking and lend-ing, letters of credit, credit card services, commissions and charges related to financial leasing, factor-ing, underwriting, and clearing of payments. Also included are financial advisory services; custody offinancial assets or bullion; financial asset management; monitoring services; liquidity provision serv-ices; risk assumption services other than insurance, merger, and acquisition services; credit-ratingservices; stock exchange services; and trust services (IMF 2009).
3. FDI is defined as equity capital, reinvested earnings, and other capital (defined as debt securi-ties, trade credits, loans, deposits, and so forth).
4. The findings of the Quarterly Survey of International Investment and Services (QSIIS) aredescribed by Masud and others (2008, 1). The QSIIS was first conducted in the first quarter of 1999, inconformity with the fifth edition of the Balance of Payments Manual (IMF 1993). The survey covered2,500 companies with significant international transactions in financial assets, liabilities, or servicesthat were incorporated or registered in Malaysia. Of these companies, 1,300 were classified as FDIcompanies.
5. See the website of the Malaysian Architects Exporters Club at http://www.pam.org.my/maec/benefits.htm.
References
A.T. Kearney. 2009. “The Shifting Geography of Offshoring: The 2009 A.T. Kearney Global ServicesLocation Index.” A.T. Kearney, Chicago. http://www.atkearney.com/images/global/pdf/Global_Services_Location_Index_2009.pdf.
Baird Maritime. 2010. “The Curious Case of the Malaysian Shipbuilding Industry.” Baird Mar-itime, May 6. http://www.bairdmaritime.com/index.php?option=com_content&view=article&id=6584:the-curious-case-of-the-malaysian-shipbuilding-industry.
190 Exporting Services

Balassa, Bela. 1965. “Trade Liberalisation and Revealed Comparative Advantage.” Manchester School33 (2): 99–123.
Bank Negara Malaysia. 2010. Annual Report 2009. Kuala Lumpur: Bank Negara Malaysia. Behuria, Sutanu, and Rahul Khullar. 1994. “Intermediate Services and Economic Development: The
Malaysian Example.” Asian Development Bank, Manila. bin Ibrahim, Muhammad. 2007. “Building an Effective Legal and Regulatory Framework for Islamic
Banking.” Paper presented at the Financial Regulators Forum in Islamic Finance, Kuala Lumpur,March 29.
Blanke, Jennifer, and Thea Chiesa, eds. 2009. The Travel and Tourism Competitiveness Report 2009:Managing in a Time of Turbulence. Geneva: World Economic Forum.
Chee, Heng Leng. 2007. “Medical Tourism in Malaysia: International Movement of Healthcare Con-sumers and the Commodification of Healthcare.” Asia Research Institute Working Paper 83,National University of Singapore, Singapore.
Choy, Lup Bong. 2010. “Healthcare Travel: Government’s Role.” Paper presented at the HealthcareTourism Congress, Kuala Lumpur, April 12–13.
Daud, Mohammad Mohd. 2002. “The Ecotourism Development in Malaysia.” In Linking Green Pro-ductivity to Ecotourism: Experiences in the Asia Pacific Region, ed. Tor Hundloe, 128–33. Tokyo:Asian Productivity Organization.
Department of Statistics. 2005. Malaysia Input-Output Tables 2005. Department of Statistics, KualaLumpur.
EIU (Economist Intelligence Unit). 2009. “E-Readiness Rankings 2009: The Usage Imperative.” EIU,London. http://graphics.eiu.com/pdf/E-readiness%20rankings.pdf.
Fong, Chan Onn. 2010. “Tracing the Brain Drain Trend: Many Ways to Attract Overseas Talent.” Sun-day Star, May 16.
Gabriele, Alberto. 2004. “Exports of Services and Economic Growth in Developing Countries.” UnitedNations Conference on Trade and Development, Geneva.
Gintzburger, Anne Sophie. 2010. “Regional Variations on the Permissibility of Islamic Financial Instru-ments.” Opalesque Group, Nicosia. http://www.opalesque.com/.../Kulliyyah_Korner_Regional_Variations_on_the_Permissibility726.html.
IMF (International Monetary Fund). 1993. Balance of Payments Manual. Washington, DC: IMF.———. 2009. Balance of Payments and International Investment Position Manual. 6th ed. Washington,
DC: IMF. http://www.imf.org/external/pubs/ft/bop/2007/bopman6.htm.Laldin, Mohamad Akram. 2008. “Islamic Financial System: The Malaysian Experience and the Way
Forward.” Humanomics 24 (3): 1–31.Lasanowski, Veronica. 2009. International Student Mobility: Status Report 2009. Redhill, U.K.: Observa-
tory on Borderless Higher Education. Masud, Mohd Ridauddin, Zuraini Mohd Yusoff, Hisham Abd Hamid, and Noraini Yahaya. 2008. “For-
eign Direct Investment in Malaysia: Findings of the Quarterly Survey of International Investmentand Services.” Statistics Malaysia 1. http://www.statistics.gov.my/portal/images/stories/files/journal/ArticleIVol12008.pdf?phpMyAdmin=HsSjziTw4modEUBuL5A5eWr139e.
Mattoo, Aaditya. 2003. “Introduction and Overview.” In Moving People to Deliver Services, ed. AadityaMattoo and Antonia Carzaniga, 1–19. World Bank: Washington, DC.
MITI (Ministry of International Trade and Industry). 1996. Second Industrial Master Plan, 1996–2005.Kuala Lumpur: MITI.
———. 2006. Third Industrial Master Plan, 2006–2020. Kuala Lumpur: MITI.NEAC (National Economic Advisory Council). 2010. New Economic Model for Malaysia, Part 1. Putra-
jaya, Malaysia: Malaysia National Printers. New Straits Times. 2009. “Malaysians in Singapore ‘Last to Be Let Go’” New Straits Times, February 18.
http://www.asiaone.com/Business/News/Office/Story/A1Story20090218-122755.html. Schwab, Klaus, ed. 2009. The Global Competitiveness Report 2009–2010. Geneva: World Economic
Forum. Securities Commission. 2009. “Mega Sukuk Defaults: Acid Test for Islamic Finance.” Malaysian ICM:
Quarterly Bulletin for the Malaysian Islamic Capital Market 4 (4): 3–7.
The Case of Malaysia 191

Sieh Lee, Mei Ling, Mahani Zainal Abidin, and Wai Heng Loke. 2000. Liberalisation and Deregulation ofMalaysia’s Services Sector. Kuala Lumpur: University of Malaya Press.
Telekom Malaysia Berhad. 2009. Annual Report 2009. Kuala Lumpur: Telekom Malaysia Berhad.Tham, Siew Yean. 2008. “ASEAN Open Skies and Its Implications on Airport Development Strategy in
Malaysia.” Working Paper 119, Asian Development Bank Institute, Manila.———. 2009. “Assessing the Remaining Barriers That Hamper the Expansion of Trade in Services in
ASEAN: Case of Malaysia.” Final report submitted to the ISIS/ASEAN Economic Forum, Jakarta.Tham, Siew Yean, and Wai Heng Loke. 2010. “Services Liberalization: The Need for Complementary
Policies.” Paper presented at the international conference Graduating from the Middle: MalaysianDevelopment Challenges, Kuala Lumpur, April 27–28.
TIMSS and PIRLS International Study Center. 2007. Trends in International Mathematics and ScienceStudy, 2007. Boston: Lynch School of Education, Boston College. http://timss.bc.edu/timss2007/.
UNDP (United Nations Development Programme). 2009. Human Development Report 2009: Overcom-ing Barriers—Human Mobility and Development. New York: UNDP.
Verbik, Line, and Veronica Lasanowski. 2007. “International Student Mobility: Patterns and Trends.”Observatory on Borderless Higher Education, London.
World Bank. 2005. Doing Business 2006: Creating Jobs. Washington, DC: World Bank.———. 2009. Doing Business 2010: Reforming through Difficult Times. Washington, DC: World Bank.WTO (World Trade Organization). 2009. “Trade Policy Review: Malaysia.” WTO, Geneva.Zhang, Anming, Shinya Hanaoka, Hajime Inamura, and Tomoki Ishikura. 2009. “Low-Cost Carriers in
Asia: Deregulation, Regional Liberalization, and Secondary Airports.” Research in TransportationEconomics 24 (1): 36–50.
192 Exporting Services

The service sector has been a major driver of growth in the Arab Republic ofEgypt. The contribution of the service sector to gross domestic product (GDP)increased from 54 percent in 1990 to 62 percent in 2006, while the service sector’sshare in employment and exports increased by modest amounts. Service exportsnow occupy a central place in the Egyptian economy. Recent research by Mishra,Lundstrom, and Anand (2011) finds that the sophistication of service exportsdrives growth, and given Egypt’s endeavor to export services, the country couldvery well be on its way to proving this proposition. This chapter provides a betterunderstanding of the factors behind the export performance and comparativeadvantage of some of the main Egyptian service sectors.
The chapter differentiates between (a) fundamental reasons for comparativeadvantage arising from geography and abundant natural resources and (b) specialreasons arising from adoption of trade promotion policies and regulations orfirm-specific strategies. In addition, the chapter highlights sector-specific compar-ative advantage and the interaction between different service sectors in shapingthe comparative advantage of a specific sector.
Service exports in Egypt are based on two sources of natural comparativeadvantage. The first is the geographic advantage of location, because the SuezCanal connects Egypt (and Africa) with Asia and Europe and primarily benefitsmaritime transportation service exports. The second is cultural, which togetherwith the geographic advantage, is beneficial for the tourism sector. A third poten-tial source of comparative advantage for Egypt remains somewhat unexploited: its
193
6
Unexploited Potential:The Case of Egypt
Ahmed Farouk Ghoneim
The author would like to thank Hanan Nazier and Yasmin Fahim for research assistance.

large labor force. Its huge potential labor pool, accompanied by relatively lowwage levels, provides Egypt an opportunity to become a hub for exporting labor-intensive services. However, as has been noted by domestic and foreign businessesoperating in Egypt as well as several international reports, the quality of workforceeducation and skills seems to be a major constraint in developing service exports.
In the Arab region, Egypt is a crucial provider of mode 4 service exports in thefield of teaching and nursing. Although the quality of education in Egypt is gener-ally not very high, its nurses and teachers are well trained, have low wages, andremain largely unemployed in Egypt. Familiarity with the Arab culture andknowledge of the Arabic language helps Egyptians emigrate to nearby countries. Afavorable government policy for emigrants also facilitates emigration.
Another emerging sector where service exports from Egypt have grown is theinformation and communication technology (ICT) sector. Since the 1990s, Egypthas been supplying 70 percent of the demand for software from the Gulf region,primarily represented by Saudi Arabia and the United Arab Emirates. The avail-ability of a multilingual workforce that can provide services in Arabic alongwith a broad range of European languages encourages ICT service exports.This linguistic aspect gives Egypt a competitive edge over India, which mainlyoffers English-language service exports. In addition, the cost of an ICT serviceemployee is lower in Egypt. Only a few countries, such as China, India, and thePhilippines, can compete with Egypt in terms of low labor costs. For example, onecan hire high-quality business process outsourcing (BPO) agents in Cairo forUS$225 to US$250 per month, whereas for other established and emergingcountries—such as India and the Philippines—the figure is about twice as high.The annual average salary of a programmer is approximately US$16,000, whichis less than in India and slightly more than in Vietnam.
In the ICT sector, targeted government policy, more than any other factor, hasplayed a vital role. In 2004, the government established the Information Technol-ogy Industry Development Authority (ITIDA) to develop the ICT sector andboost its exports. ITIDA, a partnership between the Ministry of Communicationsand Information Technology (MCIT) and the private sector, is dedicated to devel-oping information technology (IT) in Egypt. The MCIT has developed specifictraining programs for different segments of the industry to prepare graduates forwork in the IT industry. ITIDA also runs an education program. Called EduEgypt,the program liaises with universities to train students to enter the BPO industry.The government also created special technology parks for promoting ICT serviceexports. The idea behind establishing the Smart Village, which was inaugurated in2004, was to create a space where IT companies could operate within a commu-nity conducive to their business needs.
Egypt exports banking and financial services to some extent. The provision ofsuch services did not begin with the aim of exporting, but certain conditions
194 Exporting Services

related to domestic market constraints, firm size, and mandates from the govern-ment to operate regionally to attract investments from emigrants forced providersof banking and financial services to look abroad. In this regard, the regulatoryreform of the banking sector, which started with issuance of Law 88/2003, haspositively affected the exporting process by allowing banks to focus more on over-seas operations.
Tourism exports contribute about 3 or 4 percent of GDP, and with the indirecteffect of tourism, this figure increases to 11 percent. Even though Egypt has signif-icant historical importance, a diverse cultural heritage, and attractive naturalresources, it is not able to realize its full potential in exporting tourism services.A number of weaknesses are a drag on this sector, including weak infrastructure(especially ground infrastructure), modest human skills, and lack of environmen-tal sustainability. Although Egypt has low-cost labor, the relatively low quality ofits labor has been cited as a reason for the declining comparative advantage in thissector. The lack of employees trained according to international standards is cer-tainly a factor affecting the quality of services provided. Furthermore, a lack ofcoordination among the several authorities engaged in overseeing tourism activ-ities has resulted in delays in issuing licenses and allocating land permits and indifficulties in dealing with local governorates’ authorities.
The rest of this chapter is organized as follows. It first highlights the impor-tance of the service sector in Egypt. Next, the liberalization of the Egyptian econ-omy, which was crucial in contributing to service exports from Egypt, is discussed.Then, the sources of comparative advantage for service exports from Egypt areanalyzed, and subsequently the successful and less successful service sectors forEgypt are identified. Conclusions follow, including a synthesis of the main reasonsbehind the comparative advantage of exporting services.
Importance of Services in the Egyptian Economy
The importance of services in the Egyptian economy increased over time, as thepercentage of services to GDP increased from 54.6 percent in 1990/91 to 61.8percent in 2006/07 and declined to 53.0 percent in 2008/09, mainly as a result ofthe changing share of production services, which was hit by the global financialcrisis. The share of private sector services in GDP increased from 45.1 percent in1990/91 to 62.0 percent in 2006/07 and 51.0 percent in 2008/09, and its sharein production services increased from 62.1 percent in 1990/91 to 83.0 percentin 2008/09.1
The structural composition of services changed over time as the share ofproduction services, such as construction, transportation, telecommunication,communication, and financial and insurance services, as a percentage of GDP,increased relative to that of social services and public utilities, partially reflecting
The Case of Egypt 195

the increasing tradability of such services and the increased engagement of theprivate sector in the whole economy, in general, and in provision of productionservices, in particular. Within production services, finance and telecommunica-tions, transport, and housing experienced relatively higher growth rates startingin 2000. Hotels and restaurants (including tourism) experienced a substantialincrease, and their share in GDP increased from 1.7 percent in 1990/91 to 3.3 percent despite the global financial crisis in 2008–09.
Services’ share in employment increased from 54 percent of total employ-ment in 1990/91, exceeding 57.5 percent by 2007/08, with the largest share ofemployment concentrated in social services. However, the share of social serv-ices in employment has increased rather slowly, whereas that of productionservices jumped from about 20 percent in 1990/91 to 28.3 percent in 2007/08.The private sector’s share in employment for production services increasedfrom 15.4 percent to about 25 percent over the same period, reflecting thestructural changes in the Egyptian economy that affected the service sectors.2
Such structural changes included (a) the general transformation of the economyfrom a state-planned system to a free market economy (mainly as a result of theeconomic reform and structural adjustment program adopted in 1991) and (b)the vast privatization attempts undertaken in some service sectors (for example,the banking sector) and the enhanced role of the private sector in telecommuni-cations and ICT.
The increase in the relative importance of services in GDP was matched by anincrease in their contribution to the balance of payments. Exports of servicesplayed an important role in turning the current account deficit into a surplus. Forexample, in 2008, the deficit in the trade balance reached US$18.3 billion, whereasnet exports of services reached US$7.3 billion.3
Liberalization Steps and Export Potential
Egypt ranked 33rd among the leading exporters of commercial services in 2008,with the value of exports reaching US$25 billion and a share of 0.7 percent of theworld exports of commercial services (WTO 2009). Figure 6.1, which provides theclassification of Egypt’s commercial exports, shows that the composition of com-mercial service exports did not change much between 2000 and 2008.
Egypt has an excellent geographic location, and the presence of the Suez Canalsmoothly connects it across continents. In such a situation, expecting large trans-port service exports from Egypt is natural. However, the potential importance ofother services that could be exported if the quality of Egypt’s infrastructure andhuman resources improved should not be underestimated.
196 Exporting Services

The Case of Egypt 197
Figure 6.1. Structure of Egypt’s Exports of Commercial Services and OtherCommercial Services, 2000 and 2008
a. 2000
othercommercialservices 28%
transport27%
travel 45%
b. 2008other
commercialservices 23%
travel 43%
transport34%
c. other commercial services, 2008
communicationservices20.7%
construction16.6%
insuranceservices1.9%
financialservices4.8%
computers andinformation
services4.2%
other businessservices43.9%
personal, cultural,and recreational
services2.5%
governmentservices n.i.e.
5.4%
Source: UNCTAD 2009a.Note: Panel c details the subset of other commercial services in panel b.

Table 6.1 identifies the exports of services in some sectors together withEgypt’s ranking relative to other main developing countries that are exporters ofservices. Table 6.2 shows that Egypt enjoys a revealed comparative advantage(RCA) in transport (mainly because of the Suez Canal), tourism (proxied bytravel), and communications. Table 6.1 suggests that Egypt’s position in com-munication services, financial services, and other business services has deterio-rated among 20 leading developing countries, whereas its rank has moved byonly one point in the case of construction and in the case of royalties and licensefee services. Table 6.2 reflects that the RCA for Egypt is higher than 1 for trans-port, travel, communications, and construction services. Egypt’s RCA in com-munication services may be due to the high settlement payments Egypt isreceiving from other countries. In this case, Egypt’s “comparative advantage”may actually reflect a lack of domestic liberalization (that is, a lack of competi-tion for international telecommunication services). Data were not available toallow this issue to be investigated. Moreover, the construction sector seems tohave gained comparative advantage in the past few years. In contrast, the otherbusiness service sector seems to be losing its comparative advantage.4
In fact, the RCA reflects partially (as will be explained later) the main deter-minants behind acquiring comparative advantage. For example, transport andtravel reflect the role of fundamentals: geographic position represented by the
198 Exporting Services
Table 6.1. Service Exports in Egypt, 2000, 2006, and 2007
Service
Value (US$ million)
Rank among 20leading developing
countries
2000 2006 2007 2000 2005
Transport 2,645 5,489 6,949 8 8
Travel 4,345 7,591 9,303 10 10
Communications 306 496 757 8 13
Construction 93 430 984 5 6
Computer and information services 23 52 88 10 —
Financial services 52 149 86 9 13
Royalties and license fees 59 138 122 7 8
Other business servicesa 2,119 1,337 1,197 11 15
Personal, cultural, andrecreational services 15 116 92 12 12
Sources: UNCTAD 2003, 2008, 2009a; 2007 data are from http://unctadstat.unctad.org/TableViewer/tableView.aspx?ReportId=91.Note: — = not available. a. This category includes merchandising and other trade-related services; operational leasing services;and miscellaneous business, professional, and technical services.

19
9
Table 6.2. Revealed Comparative Advantage of Egypt’s Service Sectors
Item 1980 1985 1990 1995 2000 2003 2004 2005 2006 2007
Transport 1.47 2.03 1.56 1.54 1.23 1.40 1.34 1.45 1.55 1.58
Travel 0.88 0.44 0.53 0.95 1.47 1.46 1.52 1.74 1.82 1.87
Other services 0.63 0.67 1.04 0.73 0.60 0.57 0.57 0.41 0.36 0.35
Communications .. .. .. 1.23 1.43 1.29 1.30 1.08 1.26 1.66
Construction .. .. .. 0.00 0.60 1.20 1.68 1.74 1.26 2.28
Computer and information services .. .. .. 0.01 0.08 0.05 0.06 0.04 0.07 0.12
Insurance 0.26 1.06 0.37 0.07 0.16 0.12 0.10 0.20 0.10 0.19
Financial services .. .. .. 0.21 0.08 0.13 0.08 0.14 0.12 0.05
Royalties and license fees .. .. .. 0.11 0.11 0.20 0.11 0.18 0.17 0.12
Other business services 0.89 0.86 0.95 1.09 0.95 0.76 0.86 0.43 0.34 0.26
Personal, cultural, and recreational services .. .. .. 0.03 0.11 0.48 0.34 0.48 0.59 0.40
Government services not identified elsewhere 0.40 0.54 3.77 1.01 0.44 0.77 0.36 0.52 0.83 0.74
Source: Author’s calculations based on UNCTAD 2009a.Note: .. = negligible or unavailable. Shaded cells indicate that an RCA exists. The RCA index of country i for item j is often measured by the product’s share in thecountry’s exports in relation to its share in world trade:
RCAij = (xij/Xit) / (xwj/Xwt),where xij and xwj are the values of country i’s exports of item j and world exports of item j, respectively, and where Xit and Xwt refer to the country’s total exports andworld total exports, respectively. A value of less than 1 implies that the country has a revealed comparative disadvantage in the product. Similarly, if the index exceeds 1,the country is said to have a revealed comparative advantage in the item.

Suez Canal (transport) and the existence of monuments (travel). In other cases,policies have played an evident role, as in the case of communications. Othersectors, such as construction, have experienced an increase in RCA over time (with the exception of 2007), which could be a result of the increased roleplayed by Egyptian construction firms in the Gulf area. Nevertheless, thepotential is still not fully reaped as a result of the weak business environmentand lack of encouraging policies (further explanations are provided in subse-quent sections).
General Conditions Shaping Comparative Advantage in the Egyptian Economy
Hoekman and Mattoo (2008) found that the ability and capacity to produce andexport services are shaped by the interaction among the sources of comparativeadvantage, which include natural endowments, institutions, policies, and infra-structure. The following discussion highlights the main features of some impor-tant variables that could help shape the comparative advantage of Egypt in pro-ducing and exporting services in general.
Geographic location
Egypt’s geographic comparative advantage cannot be underestimated. Egypt’sstrategic location bridges the three continents of Asia, Africa, and Europe and actsas the gateway to some of the world’s largest markets because of the Suez Canal.Egypt is a hub for the world’s maritime and air traffic links at the nexus of Africa,Europe, and the Arab world.
The Suez Canal has certainly helped Egypt acquire comparative advantage intransport. One can argue that its unique position created a sort of global monop-olistic position for maritime transport between the Red Sea and the Mediter-ranean Sea. In 2008, the number of ships passing through the Suez Canal reached21,415, which was reduced to 17,228 in 2009 as a result of the crisis in world tradeas well as the impact of Somali pirates in the Gulf of Aden.
Labor and human capital
By February 2009, Egypt reached a population of 80 million. About 58 percent ofthe total population is under 25 years of age, and 41 percent is between 15 and 39.5
Such a huge potential labor force, accompanied by relatively low wage levels, pro-vides untapped resources for Egypt to become a major hub for labor-intensiveservices and industries.
200 Exporting Services

Even though the enrollment ratio of students in basic and secondary educationis relatively high at 89.4 percent in 2005/06 (UNDP and INP 2008), domestic andforeign businesses operating in Egypt, as well as several international reports, haveidentified human capital as a major constraint hindering Egypt from excelling inindustrial and service exports.
For example, the World Economic Forum’s Global Competitiveness Report2008–2009 found that higher education status in Egypt has worsened and its rank-ing dropped from 80 in 2007/08 to 91 in a group of 160 countries. This deteriorat-ing position of Egypt in higher education is among the factors that have con-tributed to the worsening of Egypt’s overall ranking in the report, dropping from77th in 2007–08 to 81st in 2008–09 (Porter and Schwab 2008).
Egypt’s ranking with respect to primary education has also deteriorated(Porter and Schwab 2008). This lack of qualified human capital implies that a mis-match exists between the outputs of the educational system and the demands ofthe economy, which resulted in high levels of unemployment, reaching 11.7 per-cent in 2007/08. The unemployment rate among university graduates reached26.8 percent in 2005, compared to an overall unemployment rate of 9.3 percent(UNDP and INP 2008).
The deteriorating educational system has been a concern of the governmentfor a long time, and it has sought the help of international donors (World Bank1999, 2005). Yet rather than being solved, the problem has been exacerbatedover time. As revealed by the World Bank (2008), Egypt has the highest rate ofunemployed labor with secondary education and above (table 6.3) amongneighboring countries in the Middle East and North Africa. This finding impliesthat the returns to education, in general, and to higher education, in particular,
The Case of Egypt 201
Table 6.3. Distribution of the Labor Force and the Unemployed in Selected Middle Eastern and North African Economies, by Education
Country
Proportion of labor force with secondary
education or above (%)
Proportion of unemployed with secondary education or
above (%)
Egypt, Arab Rep. 42.0 80.0
Bahrain 16.4 59.0
Morocco 16.4 29.6
Iran, Islamic Rep. 35.0 39.2
Jordan 45.1 43.6
Algeria 20.0 37.8
Oman 15.4 39.7
Tunisia 42.6 42.5
Source: World Bank 2008.

are relatively low (Galal 2002; Nugent and Saleh 2009), mainly because of its lowquality. The problem of deteriorating educational levels is rooted in Egypt’seducational system, which has focused on providing free public education fordecades. The focus on enhancing access, combined with increased populationgrowth rates, has negatively affected the quality of education.
Thus, Egypt could potentially enjoy a comparative advantage in labor-intensiveservices by using its abundant labor; however, given the low quality of education,it is unable to do so. The huge decline in Egyptian exports of other business serv-ices, as revealed in table 6.1, which shows that exports declined by more than40 percent between 2000 and 2007, and the huge decline in RCA for other busi-ness services between 1995 and the years that followed, as revealed by table 6.2,can be attributed to the deteriorating level of education.
Macroeconomic policies
Egypt has embarked on major economic structural reforms since 1991 afterbeginning the Economic Reform and Structural Adjustment Program, which wasdesigned and implemented jointly with the World Bank and the InternationalMonetary Fund.6 Throughout most of the 1990s, Egypt succeeded in implement-ing an economic reform program, which managed to slow down inflation andmake progress in restoring internal balances so the macroeconomic indicatorsimproved over the 1991–98 period. Since 1991, the government of Egypt hasadopted a number of reform measures, such as devaluing the Egyptian pound andunifying the existing exchange rate systems, reducing trade barriers, initiatingan ambitious privatization program (though it slowed down in the latter part ofthe 1990s), adopting a tightened fiscal policy, reducing subsidies on some strate-gic commodities (including gasoline), and upgrading and expanding physicalinfrastructure.
Consequently, economic performance improved during the 1990s (except in1997/98, when the real GDP growth rate dropped significantly, mainly becauseof the Luxor massacre and its severe impact on tourism and the capital flightthat followed the 1997 Asian financial crisis). These positive macroeconomictrends were reversed in 2000/01 as a result of the stagnation of the economicreform process, which was further aggravated by a slowdown in the interna-tional economy and the impact of the September 11 terrorism attacks. Thenegative developments were further exacerbated by the appreciation of theEgyptian pound, which was pegged to the U.S. dollar. As a result, real GDPgrowth continued to fall and reached its lowest level in a decade in 2003 (3.1 percent).
202 Exporting Services

Alarmed by the slowdown of the economy and the negative economic indica-tors, the government sought to revive the economic reform program. Among thereforms undertaken were flotation of the Egyptian pound in early 2003 andappointment of a new cabinet in 2004. A wide-ranging set of economic reformshas been undertaken since the appointment of a new cabinet, including trade andcustoms reform, tax reform, and a more market-oriented macroeconomic policy.For example, corporate and personal income tax rates were cut by half, many taxexemptions were eliminated, and tax administration was improved, whichresulted in a substantial increase in tax receipts (corporate and personal).
The privatization program was revived after a period of economic slowdown,which lasted from 1997 to 2003. Moreover, crucial institutional pillars of a marketeconomy, such as the competition law in 2005 and the consumer protection law in2006, were introduced. Tax reduction and exchange rate devaluation were partic-ularly beneficial for firms in the service sector because services (compared togoods) use fewer imported inputs, and hence devaluation lowered the price ofEgyptian services (for example, ICT-related services and tourism), which hashelped boost Egyptian exports of services and made the country more competi-tive worldwide.
The reforms undertaken by the government in 2004 corrected the macroeco-nomic imbalances. For example, the reform of the foreign exchange market estab-lished a market-based system and eliminated the black market by the second halfof 2004. Having a flexible exchange rate regime allowed better management by theCentral Bank of Egypt (CBE), leading to a better monetary policy that had a posi-tive influence on the development of the economy as a whole.
Foreign direct investment (FDI) inflows increased tremendously from US$0.2billion in 2003 to US$11.5 billion in 2007 and then decreased to US$9.5 billion in2008 (UNCTAD 2009b). The share of foreign participation in different sectors (aproxy for FDI) has ranged from 37 percent to 70 percent from 2005 to 2008.7
This inflow of foreign capital in the service sector has helped increase the num-ber of firms operating in the domestic market and has brought with it technol-ogy, managerial expertise, and competition.
The reforms helped improve economic performance, as seen in higher realGDP growth, which amounted to 5.1 percent in 2004/05 and reached 7.2 percentin 2007/08. Yet the Egyptian economy still suffered from negative macroeconomicphenomena, including relatively high inflation rates, which reached 18 percent in2008 (CBE 2010), when the increase in nominal wages lagged, and high unem-ployment rates, which revolved around 11.7 percent in 2007/08 (Ministry ofFinance 2008) before decreasing to 9.3 percent in the first quarter of 2009/10(Ministry of Economic Development 2009).
The Case of Egypt 203

Institutions and business climate
As asserted by Amin and Mattoo (2006), countries with better institutions(mainly regulatory and contract-enforcing institutions) have more dynamicand larger service sectors. The Doing Business report (published by the WorldBank since 2004) classified Egypt as the best performer in the world in 2008 interms of its ability to improve its ranking and overcome a number of obstaclesthat used to impede businesses.8 However, overall Egypt does not rank well onDoing Business indicators.
Table 6.4 shows the rankings for Egypt for 2008 and 2009. The number of pro-cedures for starting a business in Egypt decreased from 13 in 2004 to 6 in 2009,and the number of days declined from 37 in 2004 to 7 in 2009. A significantdecline in associated costs of starting a business has also been noted.
A significant improvement in its ranking is owed to the minimum capitalrequirements, which declined tremendously from 13 percent of per capitaincome to 2 percent of per capita income. Egypt’s ranking in enforcing contracts,which is an institution critical for service exports, improved slightly from 154 to148. Registering property in Egypt became a bit easier through reduction in costand time. Protecting investors and dealing with taxes also became significantlyeasier. Trading across borders improved in all its associated indicators, whetherdealing with time or costs. However, in relative terms, Egypt’s performancelagged that of other countries, which resulted in a lower rank.
Egypt’s position according to the Global Competitiveness Report has been dete-riorating over the years. Egypt ranked 70th in the 2009–10 report, but its rankingin the 2010–11 report has deteriorated to 81st (Schwab 2009, 2010). When onecompares Egypt to other countries, other countries are in a better position, and
204 Exporting Services
Table 6.4. Egypt’s Ranking in the Doing Business Report
Indicator 2008 2009
Ease of doing business 125 114
Starting a business 55 41
Dealing with construction permits 163 165
Registering a property 104 85
Getting a credit 102 84
Protecting investors 84 70
Paying taxes 151 144
Trading across borders 21 24
Source: World Bank’s Doing Business website, http://www.doingbusiness.org/custom-query.Note: Doing Business 2008 rankings have been recalculated to reflectchanges to the methodology and the addition of three new countries.

their performance has improved over time, implying a widening gap betweenEgypt and its competitors. For example, in 2005/06 Egypt was in a better positionthan Morocco and Turkey and almost comparable to Bahrain.
Service-specific reports
Despite the modest performance on an absolute and relative basis shown by Egyptin the Global Competitiveness Report and Doing Business rankings, other interna-tional reports that have focused mainly on services—especially ICT-relatedservices—have ranked Egypt in a better position. For example, the A.T. Kearney(2007) Global Services Location Index (GSLI) placed Egypt in position number13, surpassing all its competitors, including the United Arab Emirates (20),Tunisia (28), Morocco (38), and Turkey (49).9 In 2009, Egypt’s rank furtherimproved to sixth position (A.T. Kearney 2009). Moreover, other reports, such asGlobal Services–Tholons (2009), put Egypt (Cairo) in seventh position among themajor outsourcing cities in the world.
When comparing Egypt with its competitor countries in the field of export-ing services (see table 6.5), one observes that Egypt has a better rank in termsof human skills availability in A.T. Kearney’s GSLI indicators (reflecting theavailability of ICT skills), whereas it has a relatively lower rank in the GlobalCompetitiveness Report for higher education and training (because of the gen-eral inefficiency of the educational system). This finding implies that the edu-cation system is inefficient and is able to train professionals only to providelow-end ICT services globally. Hence, when the world demand for complexservices increases or service delivery becomes more competitive, Egypt may slipfrom its current competitive position in reports such as the GSLI if it does notimprove the quality of its education system.
In the financial attractiveness indicator of the 2007 GSLI, Egypt ranks relativelywell, while it has a mediocre ranking in terms of intellectual property rights andphysical infrastructure. In terms of technological readiness, the Global Competi-tiveness Report 2008–2009 suggests that Egypt has a relatively backward position(Porter and Schwab 2008). In other words, the comparative advantage enjoyed byEgypt in specific service sectors is difficult to relate to general fundamentals andcompare with the situation in competitor countries.
Characteristics of Service Exports from Egypt
Three main variables affected the choice of service sectors in Egypt. First, forobvious reasons, sectors where Egypt enjoys an RCA greater than 1 are dis-cussed. These sectors include travel, transport, construction, and communications.
The Case of Egypt 205

Table 6.5. Rank of Egypt and Its Main Competitors in Different International Reports
A.T. Kearney GSLI 2009a
Labor higher education and training rank
World Bank World DevelopmentIndicators 2009
Human capitalGSLI overall
rank
GSLI score forpeople skills and
availabilitycLabor force
(million)
Labor participation rate(% of total population
age 15+)
Egypt, Arab Rep. 6 1.20 88 25.5 47.3
Jordan 9 0.91 42 1.6 44.4
Morocco 30 0.93 99 11.2 51.4
Tunisia 17 — 32 3.7 48.3
Turkey 44 1.23 73 25.1 47.5
United Arab Emirates 29 0.84 29 2.7 77.7
Access to financeGSLI overall
rank
GSLI score forfinancial
attractivenessdFinancial market
sophistication rank
Egypt, Arab Rep. 6 3.07 84
Jordan 9 2.99 52
Morocco 30 2.62 96
Tunisia 17 2.86 87
Turkey 44 2.01 80
United Arab Emirates 29 2.10 33
Intellectual propertyrights protection
Intellectual propertyprotection rank
Egypt, Arab Rep. 58
Jordan 30
Morocco 86
Indicators
206
World Economic ForumGlobal Competitiveness
Report 2009–10b

Tunisia 43
Turkey 105
United Arab Emirates 15
Infrastructure (physical) Infrastructure rank
Egypt, Arab Rep. 55
Jordan 42
Morocco 70
Tunisia 37
Turkey 62
United Arab Emirates 6
Infrastructure (electronic)
EconomistIntelligence Unit IT
industrycompetitiveness
index 2009e
Global CompetitivenessIndex technological
readiness rank
Egypt, Arab. Rep. 53 82
Jordan — 61
Morocco — 76
Tunisia — 55
Turkey 46 54
United Arab Emirates — 17
Sources: A.T. Kearney 2009; EIU 2009; Schwab 2009; World Bank’s World Development Indicators database. Note: — = not available.a. Rank out of 50 economies is shown. b. Rank out of 133 economies is shown.c. People skills and availability are rated on a scale of 0–3.d. Financial attractiveness is rated on a scale of 0–4.e. Rank out of 66 economies is shown.
20
7

Second, Egypt is historically known to have been exporting services from a numberof sectors for which data were not available on a regional basis (for example, edu-cation and health services). Hence, historical reputation of exporting servicesplayed an important role in the choice of sectors. Third, some service sectors havebeen performing well in the past few years even though their contribution toexports might not be highly significant. The efforts undertaken by the governmentand the engagement of the private sector in such sectors show that their exportpotential is high (for example, ICT and related services). For other sectors, such asaudiovisual services, anecdotal evidence suggests that Egypt is a large exporter inthe region; however, lack of available data and information prevented investigationof the reasons behind the success or failure of their export.
Exports of financial services constitute banking, insurance, reinsurance, andother financial services. Exports of financial services from Egypt increased dra-matically in 2005 and 2006 but slowed in 2007. Because of lack of data, this chap-ter focuses its analysis only on exports of banking and other financial services.
Table 6.6 identifies the Egyptian banks operating abroad in different forms,ranging from branches to representative offices to a wholly owned subsidiary. Fromthe table one can see that two public banks, four private banks, and a specializedbank operate abroad. High concentration exists in destination countries wheremost of the mode 3 financial service exports are targeted for Arab countries, fol-lowed by a few European countries. The most notable competitors to Egypt on aregional basis are Jordan and Lebanon, which have a number of banks that haveextended their operations in the Arab region.
A number of Egyptian nonbanking financial firms founded in the mid-1980sand early 1990s have grown exponentially and have exported a number of theirservices via mode 3, mainly to Arab countries but also to some Western countries.The services exported include securities brokerage, asset management, investmentbanking, private equity, and research. Among the largest firms is EFG Hermes,whose market capitalization exceeded US$3.5 billion in mid-2008. EFG Hermesoperates in Egypt, Kuwait, Lebanon, Saudi Arabia, Oman, Qatar, the United ArabEmirates, and recently the Syrian Arab Republic and has 13 offices around theArab region. EFG Hermes is also listed on the Egyptian Stock Exchange andLondon Stock Exchange.
Smaller than EFG Hermes are other firms such as Pioneers Holding Co.(established in 1997), which is an investment bank focused on brokerage andasset management and had a turnover of approximately US$6 billion in 2009.10
The firm has offices and subsidiaries in Bahrain, Morocco, Saudi Arabia, Syria,and the United Arab Emirates. Another firm, Beltone Financial, has as wide aportfolio as EFG Hermes and Pioneers Holding, including brokerage, asset man-agement, investment banking, and private equity.11 It has offices in Libya, Qatar,
208 Exporting Services

Table 6.6. Egyptian Banks Operating in Foreign Countries, 2009
Bank BranchesRepresentative
offices
Initial approval of branch abroad
(not yet open) Other Total
National Bank of Egypt 2 3 2 1 8 (6 actual)United Kingdom (London) 1United States (New York) 1China (Shanghai) 1South Africa (Johannesburg) 1United Arab Emirates (Dubai) 1Saudi Arabia 1Sudan 1National Bank of Egypt (UK) Limited 1
(wholly owned byNational Bank of Egypt)
Banque Misr Liban SAL (in Lebanon) 1(89.32% owned byBanque Misr, Cairo)
1
Misr Bank–Europe GmbH (in Germany) 1(50.75% owned byBanque Misr, Cairo
1
Banque Misr SAE (in Egypt) 6 6France (Paris) 1
United Arab Emirates (Abu Dhabi, Dubai,Sharjah, Al Ain, Ras Al Khaimah) 5
20
9
(Table continues on the following page.)

Cairo Amman Bank (in Jordan) 1(10.77% owned byBanque Misr, Cairo)
1
Arab African International Bank 3 3United Arab Emirates (Abu Dhabi, Dubai) 2Lebanon (Beirut) 1Commercial International Bank 1 1United Arab Emirates (Dubai) 1Suez Canal Bank 1 1Libya (tribal) 1Egyptian Arab Land Bank (specialized bank) 18 18Jordan 12Palestine 6Total 29 5 2 4 40 (38 actual)
40
Sources: CBE 2010 and other unpublished sources.
Table 6.6. Egyptian Banks Operating in Foreign Countries, 2009 (continued)
Bank BranchesRepresentative
offices
Initial approval of branch abroad
(not yet open) Other Total
210

Saudi Arabia, the United Arab Emirates, and the United States and has recentlyexpanded its operations in Qatar. In 2009, Pioneers Holding and Beltone Finan-cial decided to merge. The merger is expected to enhance their exports of servicesin the Arab region, especially the Gulf area.
Other investment banking firms, such as HC Securities & Investment andPrime Group, have developed strategies similar to those adopted by EFG Hermes,Pioneers Holding, and Beltone Financial.12 Major regional competitors to Egyptin investment banking include the United Arab Emirates and, to a lesser extent,Bahrain.
Drivers and Constraints on Financial Services Exports
In the case of the banking sector, regulatory infrastructure has been strengthenedfollowing the adoption of Law 88/2003. Law 88/2003 set higher standards for thebanking sector, especially with respect to risk exposure, further emphasizing theCBE’s independence in managing monetary policy.
The regulatory reform of the banking sector has positively affected financialservice exports from Egypt by allowing banks to focus more on overseas opera-tions. Before the reform, export markets were relatively neglected because bankswere mainly concerned with solving domestic banking problems such as thoseemanating from the high percentage of nonperforming loans. The decision toexport services is not directly related to the performance of the banking sectordomestically, but strong domestic performance is a necessary condition forexpanding abroad. Domestic regulators will not usually allow a weak bank toexpand abroad, and a host country will probably not authorize weak foreignbanks to establish a commercial presence. Banking exports follow the regulationsof the host country and not Egypt; hence, branches abroad act as separate entitiesfollowing different rules. The CBE does not have any specific policy that encour-ages exports by banks. Its role is a regulatory one, and its relation to bankingexports is confined to the supervision of banks in Egypt, including their branchesabroad. However, by improving banks’ performance and building a strongerfinancial sector, domestic regulation reforms played a critical role in expandingthe exports of other financial services (investment banking).
Given the absence of a specialized undergraduate banking institute and theweak educational system, the banking sector depends on in-house training, spe-cialized banking courses abroad, and a few specialized training institutes(including the Egyptian Banking Institute, which is the training arm of theCBE) to prepare the various levels of management employees as well as newentrants to the banking sector. Under the reform program of 2005–08, banks—especially public sector banks—were able to recruit highly qualified banking
The Case of Egypt 211

cadres and leadership by providing them with attractive salaries using a specialfund (the banking reform fund) (CBE 2010). However, no direct relationshipexists between the strengthening of human capacity and the performance offinancial service exports. When the human capacity available to the financial serv-ices sector was enhanced, other challenges in operating at a global level becameevident, such as the lack of awareness of external environment and issues in riskmanagement. Moreover, Egypt lacks professionals with skill sets that could, ifreadily available, significantly increase its ability to export.
Many banks pursued efforts to apply modern technologies to upgrade thequality of their services and have taken decisive measures toward computerizationand increased competition (Hakim and Neamie 2001).
Thus, the banking sector in Egypt does not seem to face physical or humaninfrastructure constraints that impeded it from providing efficient service. Eventhough specific constraints, such as lack of specialized bankers in specific fields(for example, risk management); weak physical infrastructure in certain areas;and relative technological backwardness in the financial service industries exist inEgypt, such types of constraints have been gradually overcome and did not act asa bottleneck to development of this sector.
The size of the domestic market seems to play an important role in explainingexports of financial services. However, its role is different in the case of bankingservices compared to other financial services. In the case of banking services, therelatively large size of the domestic market (especially when compared to Egypt’sregional competitors in terms of size of population) narrowed the focus of com-mercial banks to the domestic market. The case has been different for investmentbanking, where provision of services (such as securities brokerage, asset manage-ment, investment banking, private equity, and research) was constrained by therelatively limited domestic market. After attaining a considerable size, the invest-ment banking firms realized the limitations of domestic absorption capacity andmoved regionally to other Arab countries to maintain their growth rate.
Export of banking services through mode 3 has occurred for different pur-poses, which included attracting remittances from the Egyptian diaspora (forexample, Banque Misr); taking advantage of rising business opportunities in thehost countries, such as a mandate in banks’ charters to open a branch abroad (forexample, the Arab African International Bank); and financing Egyptian invest-ments abroad.
The domestic performance of the banking sector is not highly correlated to theextent of service export. The large domestic market size lessened the need for sev-eral Egyptian banks to expand abroad. The few banks that did export throughmode 3 were motivated by specific purposes, such as a mandated mission to oper-ate regionally to attract remittances of Egyptian migrants. Thus, in the case of the
212 Exporting Services

banking industry, no correlation exists between size of bank and exporting; smallbanks as well as large banks export services. In contrast, exports of other financialservices are correlated with firm size. For instance, investment banks were encour-aged to move abroad and expand regionally after they had grown in size and weresignificantly constrained by the small domestic market. Evidence of this trend isthat, despite the establishment of such firms in the mid-1980s and early 1990s(except Beltone Financial, which was established in 2002), none of them decidedto go regional before 2005. Thus, the decision to export services came after thepassage of time and is mainly attributed to the acquired comparative advantage interms of the necessary human skills and knowledge of Arab markets and clients.
The increase in absolute terms of the value of exports reported in table 6.1reflects the increase in nonbanking exports, which were significant only after2005. However, the increase in financial services has remained highly limitedwhen compared to that of Egyptian exports of other services that have higherabsolute values (though financial services started from a low base). Therefore,Egypt does not appear to have acquired any comparative advantage in financialservices, as revealed in table 6.2.
Health and educational services
The number of Egyptian emigrants reached 2,399,251 in 2005, representing about3.2 percent of the Egyptian population.13 Most of these emigrants were destinedfor Arab countries (mainly, in order of importance, Saudi Arabia, the United ArabEmirates, Kuwait, and Oman) and some for European Union countries (Italy, theUnited Kingdom, Germany, Greece, and the Netherlands).
The regional comparative advantage enjoyed by labor in this regard hasresulted in the exportation of education services (teachers) and health services(physicians and nurses) to the Arab Gulf countries as well as Libya and the Repub-lic of Yemen. Exports have mainly taken place through mode 4 and, to a lesserextent, mode 2, so this chapter focuses on the former mode. Table 6.7 shows thedistribution of work permits granted to Egyptian labor. A major problem withmigration data is that no accurate information exists on the numbers of teachersand nurses working abroad (Fargues 2006). Thus, teachers and nurses areincluded in the category of scientists and technicians. This category represents thehighest share of work permits granted.
Engman (2009) pointed out that the number of Egyptian schoolteachersmigrating and working in Arab countries has declined over the years. Egyptianteachers working in Arab countries follow one of two systems: (a) a secondmentprogram by the Egyptian Ministry of Education or (b) private search and con-tacts. Engman (2009) found that the number of teachers in the secondment
The Case of Egypt 213

program dropped from 30,000 in the mid-1980s to 1,737 in 2006/07. He identi-fied several supply and demand reasons behind the decrease, including strictmigration policies adopted by Gulf countries and availability of side economicactivities that teachers residing in Egypt could pursue (for example, private les-sons). However, this chapter argues that the private route of obtaining a jobabroad has not been captured by the data provided by Engman (2009), which canexplain why the number of teacher-migrants has been maintained or at least hasnot dropped significantly.
Despite the general deteriorating status of educational institutions in Egypt,the country remained unique in terms of the availability of a large pool of labor inthe fields of teaching and nursing. The RCA enjoyed by Egypt in this regard ismainly attributed to the high unemployment rate for graduates in the fields ofeducation and nursing. According to the Labor Force Sample Survey conductedby the Central Agency for Public Mobilization and Statistics in 2006/07, holdersof bachelor’s degrees in teaching had the second-highest unemployment rate(5.4 percent of the total unemployed) after graduates of commerce and eco-nomics. The survey recorded the highest unemployment rate among femalesholding bachelor’s degree, with a rate of 6.9 percent. The unemployment rate forholders of bachelor’s degrees in the medical, dentistry, nursing, and pharmacyfields was about 0.6 percent (CAPMAS 2008b). Thus, a high unemployment rateamong teachers and nurses, coupled with the cultural and language similaritieswith countries in the Gulf area, Libya, and the Republic of Yemen, has helpedpromote this type of export.
The high level of unemployment, particularly among secondary and universitygraduates, signifies a mismatch between the output of the education sector and the
214 Exporting Services
Table 6.7. Work Permits Granted to Egyptians in Arab Countries, by Occupationand Year, 1985, 1990, and 2002
Occupation
Share (%)
1985 1990 2002
Scientists and technicians 20.4 40.2 41.0
Managers 0.3 0.3 2.4
Clerical workers 8.8 8.0 1.5
Sales and services 18.5 17.3 12.7
Agriculture, animal husbandry, and fishing 8.9 5.3 8.6
Production workers 43.0 28.9 33.8
Total 100.0 100.0 100.0
Source: Consortium for Applied Research on International Migration Demographic and EconomicModule, referring to data from the Ministry of Manpower and Emigration, http://www.carim.org/index.php?areaid=4

domestic demand. The unemployment rate among graduates with intermediate-level education or above reached 12.3 percent in 2007 (figure 6.2), whereas theunemployment rate among university graduates reached 16.4 percent in 2008(CAPMAS 2008b; see also http://www.msrintranet.capmas.gov.eg/ows-img2/pdf/4-6.pdf). The high rate of unemployment explains the high tendency of educatedpeople to migrate and helps explain the regional comparative advantage of Egyptin services such as nursing and teaching.
Egypt is, however, not alone in this field. The main competitor to Egypt as anArabic-speaking country is Morocco. However, the Arabic dialect of Moroccans isdifficult for the population of the Gulf countries, Libya, and the Republic ofYemen to understand. Hence, Egypt monopolized the regional export of healthand education services in the 1970s and 1980s, which coincided with the oilboom in the Gulf countries and their high demand for Egyptian labor. Avail-able data indicate that more than 70 percent of Egyptian migrants are concen-trated in Arab countries, compared with only 8.5 percent of Moroccanmigrants (Di Bartolomeo, Fakhoury, and Perrin 2009, 2010).
Two factors have caused Egypt’s health service export position (mainlythrough mode 4) to deteriorate, starting in the 1990s. The first factor relates to thedeteriorating quality of education (see Galal 2002; Radwan 2002). The second rea-son is the recent emigration of nurses from Southeast Asian countries to Arabcountries; these nurses have easily replaced Egyptian nurses (Girgis 2002). Teach-ers do not face this competition, because knowledge of the Arabic language isunique to Egypt and is not easily found in South Asia. The demand for Arabic-speaking teachers’ services is less elastic in the Gulf area, the Republic of Yemen,and Libya because of the scarcity of both domestic citizens and other nationalitieswho can supply such services.
Starting in the 1970s, Egypt adopted a regulatory framework that encouragesexports of health and education, among other services, through mode 4. Forexample, Law 73/1971 allowed public sector employees to return to their jobsone year after resignation (subsequently extended to two years), together withthe removal of other legal impediments. Law 111/1983 on emigration and spon-soring of Egyptians abroad identified the rights of all migrants, temporary andpermanent; allowed dual nationality; and identified the financial rights ofmigrants regarding waivers from taxes and fees for their deposits invested inEgyptian banks.
Moreover, the government of Egypt has created specific institutional represen-tation at the ministry level for migration issues (Presidential Decree 574/1981 setup the Ministry of State for Emigration Affairs) as well as a higher committeefor migration (headed by the Minister of Manpower and Emigration andincluding representatives from 13 ministries) in accordance with Presidential
The Case of Egypt 215

Figure 6.2. Unemployment Rate of Educated Persons, 1994–2007
0
5
10
15
20
25
1994
1995
1997
1998
1999
2000
2001
2002
2003
2004
2005
2006
2007
unem
plo
ymen
t ra
te o
f edu
cate
dp
erso
ns (
%)
Source: Egypt Information Portal/IDSC referring to data from CAPMAS 2008b, http://www.eip.gov.eg/nds/nds_view.aspx?id=4975.Note: Figures do not include emigrants.
216

Decree 2000/1997 to enhance cooperation between different ministries on migra-tion issues.
The Emigration Sector of the Ministry of Manpower and Emigration hasundertaken wide-ranging responsibilities with the following objectives:
• Developing policies to encourage Egyptian emigration (for example, allow-ing the children of emigrants to be examined following the Egyptian schoolsyllabus)
• Enhancing relationships with Egyptian emigrants abroad• Capitalizing on the knowledge, skills, and savings of Egyptians abroad to
enhance Egyptian social and economic development (for example, by allowingmigrants to return to their initial jobs when they come back to Egypt)
• Establishing an integrated database on issues related to migration (Ghoneim2010)
Hence, the regulatory framework itself acted as a major factor in shaping thecomparative advantage of Egypt in exporting such services.
The government has undertaken several policies to enhance short-term migra-tion to Arab countries. For example, it has concluded a number of bilateral agree-ments with Arab countries; between 1974 and 1993, Egypt signed labor migrationagreements with 11 countries. Many of these agreements have been renewed, andseveral existing agreements, including those with Jordan, Libya, Qatar, and Sudan,regulate the right of entry, movement, ownership, and work. Currently, Egypt hasconcluded 12 such agreements with Arab countries to regulate the flow of Egypt-ian migrants into those countries. The agreements deal with issues that ensurethat Egyptians are well treated in their host countries. The agreement with Libyaremained modest and emphasized the need for cooperation. The agreement withJordan is not reciprocal and focuses mainly on managing the flow of Egyptianemigrants to Jordan. The agreements include provisions on enhancing the train-ing of migrant labor, setting the conditions of entry, and preserving labor rights(Ghoneim 2010). In addition to these agreements, starting in the early 1970s, gov-ernment and private agencies were set up to organize labor migration, especiallytargeting Arab countries and focusing on specific occupations, such as teachers,physicians, and nurses.
ICT outsourcing and software services
Several international reports have identified the improved performance of Egyptin exporting ICT-related services. For example, Datamonitor estimated that thetotal market size for Egypt-based outsourced contact centers in 2005 was 655 agent
The Case of Egypt 217

positions (Datamonitor 2005, as cited in Kamel and Hussein 2008). This numberwas expected to rise rapidly over the next five years, at a compounded annualgrowth rate of just over 50 percent, to 3,775 contact center agent positions by2009. Agent positions in Egypt were at par with key near-shore markets, includingthe Czech Republic, Hungary, and Poland.
Egypt has a moderately large endowment of multilingual people, who arewell used in ICT service exports. Microsoft uses the nine-language local Xceedcontact center as its support center for global products and has a small innova-tion lab that specializes in prototype development and applied research. OrangeBusiness Services and France Telecom have 1,600 engineers managing their net-works nationwide. They operate 24 hours a day, seven days a week, and haveplans for expansion. Some Indian firms are outsourcing to Egypt as a near-shorelocation for Europe. Vodafone has 800 contact center agents in Cairo servingAustralian, New Zealand, and U.K. markets, as well as the domestic market. Xboxgame console technical support is done from Egypt. Network technology providerAlcatel-Lucent has a technical support staff of 300 in Cairo. Oracle has 500employees who provide technical support to customers across 140 countries inmultiple languages (Datamonitor 2009). Moreover, BPO is booming with a focuson software development.
The Global Services–Tholons (2009) study put Cairo seventh among theworld’s top emerging outsourcing cities, the only Middle-Eastern city to attainsuch a position.14 In 2007, Egypt was ranked 13th most attractive outsourcing des-tination by the A.T. Kearney GSLI, and in 2009 its rank had improved to sixthposition, preceded only by India, China, Malaysia, Thailand, and Indonesia.15 TheYankee Group has praised Egypt for its distinguished position in the world marketin IT outsourcing services (Marson and Blodgett 2008).16 These analyses putEgypt ahead of delivery locations in Eastern Europe such as the Czech Republic,Hungary, and Poland, as well as other African locations such as South Africa andTunisia (El Shinawi and Lanvin 2009). Outsourcing to Africa has put Egypt in topplace in Africa as an outsourcing location because of its competitive advantages,such as suitable infrastructure, availability of workforce, and suitability of busi-ness (Commonwealth Business Council and Cyber Media India 2009).17
From 2004 to 2008, the total volume of Egypt’s offshore industry (includingBPO, call centers, and technical support centers) grew from around US$100 mil-lion or US$150 million to US$700 million (El Shinawi and Lanvin 2009). ICTexports were expected to reach nearly US$1.1 billion by 2010, according to A.T.Kearney projections (table 6.8).
With a goal of becoming the IT hub for the Arab region, Egypt has become themajor software exporter to most countries in the Arab region, competing withJordan and the United Arab Emirates. Since the 1990s, Egypt has been supplying
218 Exporting Services

70 percent of the demand for software from the Gulf region, primarily representedby Saudi Arabia and the United Arab Emirates (Kamel, Rateb, and El-Tawil 2009).
Egypt has a larger pool of skilled labor, and its workforce’s language skills inArabic and English are better than its competitors in this specific field (see theGSLI findings in table 6.5). Multimedia-related products such as cultural, educa-tional, entertainment, and religious CDs are the leading products exported byEgypt to the Arab region. Exports have taken place to Arab countries throughmodes 1 and 3, whereas exports to the European Union have mainly been throughmode 1. The majority of Egyptian software companies have established branchesin Bahrain, Oman, Saudi Arabia, and the United Arab Emirates (box 6.1).
Moreover, this workforce is skilled in a broad range of European languages,giving Egypt a comparative advantage in exporting ICT services in the region.18
Such linguistic abilities give Egypt a competitive edge over India, which is mainlyexporting ICT services in the English language (Marson and Blodgett 2007).Moreover, sharing the same time zone with many European countries providesEgypt with a competitive edge over its competitors such as China and India, whileits low labor costs relative to Eastern European outsourcing centers make Egypt anideal exporter of such services to European and Arab countries (Marson andBlodgett 2007).
Only a few countries can compete with Egypt in terms of low labor costs—China, India, and the Philippines. For example, one can hire high-quality BPOagents in Cairo for around US$250 per month, whereas in other established andemerging countries—such as India and the Philippines—the figure is about twice
The Case of Egypt 219
Table 6.8. Projections of IT Exports by 2010
ICT industry element
Targetrevenue
(US$ million)
Compoundedannual growth
rate (%)Share oftotal (%)
Software and IT services 280 27 34
Arab-content management 200 46 12
Technical support centers 200 27 24
Contact center markets 115 50 6
Research and development engineeringdesign 100 38 8
BPO services 75 72 2
IT product exports (emerging markets) 45 25 6
IT localization 40 22 6
Knowledge process outsourcing services 30 43 2
Total 1,085 100
Sources: A.T. Kearney 2005 (as cited in Kamel, Rateb, and El-Tawil 2009).

220 Exporting Services
Box 6.1: Case Studies of Successful Outsourcing Firms
XceedAmong the successful examples in the field of ICT outsourced exporting services isa firm named Xceed. An Egyptian pioneer firm and a leading contact center,Xceed first started its first call center operation in 2003. It envisioned becomingthe foremost provider of outsourced customer contact solutions for commercialand government customers in Egypt and foreign markets, with aspirations toattract other opportunities globally. Xceed offers its services in nine differentlanguages and served local and foreign firms in various fields. Its customers includeTelecom Egypt, Microsoft Egypt, Oracle Global Product Support Center, ElectronicData Systems, NetOne, Nestlé Waters, Neuf Cegetel, the MCIT, the Ministry ofState for Administrative Development, Aviation Information Technology, and CITGlobal. According to its website (http://www.xceedcc.com), the firm has about 1,900employees. In addition to customized service solutions, Xceed provides customerrelationship management services, Internet-based customer care, and technical supportservices.
Other successful Egyptian firms in this field are C3, Raya Contact Center, andECCO Outsourcing. From its premises in Cairo, C3 provides call and contact centerservices (inbound and outbound) in a variety of languages to both domestic andforeign customers. Its global customers include the Wall Street Journal Europe, Tele2,and Banque de la Poste Belge. Raya Contact Center provides the same type ofservices as C3 in four languages, and ECCO Outsourcing provides such services inthree languages.
All these firms depend on the comparative advantage enjoyed by Egypt; however,they have also developed their own strategies, which are based on quality assuranceand employee training in relevant technical and managerial skills to ensure qualityprocesses are designed in accordance with customer requirements and withcustomer satisfaction in mind. The firms introduced full process documentationand detailed work instructions to ensure consistency of operations, which areregularly audited. Xceed also deployed several layers of calibration that ensuredmonitoring consistency. Moreover, quality scores were calibrated with customersatisfaction data. Xceed’s accreditations include the following: ISO 9001:2008 (onquality management systems); ISO 14001:2004 (on environmental managementsystems); OHSAS 18001:1999 (on occupational health and safety managementsystems); ISO/IEC 27001:2005 (on IT security techniques); and BS 25999 (on businesscontinuity management).
Orange Business Services The government of Egypt offered Orange Business Services (OBS) a number ofincentives to attract its major service center to Egypt. The incentive package includeda tax holiday and reduction of international circuit charges. The service centerestablished in Cairo is the largest one that OBS operates globally. Its physical securitymeets the highest standards required by OBS’s global clients, and it provides manydifferent services, including solution designs, service delivery management, incidentmanagement, change and resale management, configuration and data integrity, andonline support and design implementation. The Cairo center also develops newservices for OBS in incubators. It operates 24 hours a day, seven days a week, and hasa highly resilient network architecture. It provides service for a large array of

as high (El Shinawi and Lanvin 2009). Similarly, the annual average salary of aprogrammer in Egypt is approximately US$16,000, which is lower than in Indiaand slightly more than in Vietnam (Datamonitor 2009).
Egypt also enjoys a relatively well-developed and low-cost telecommunicationinfrastructure, largely owing to reforms in the telecommunication sector. Cur-rently, Egypt enjoys high-quality network facilities that are built around a world-class infrastructure, including 10 gigabit per second optical fiber and 2.5 gigabitper second rings, delivering services over a public switched telephone network.Mobile and packet-based networks cover the country (El Shinawi and Lanvin2009). In the longer term, Egypt needs to address issues relating to data safety thatcould potentially have an adverse effect on its reputation as an ICT serviceexporter (Marson and Blodgett 2007).
Among its other sources of comparative advantage is the liberal policy adoptedby the Egyptian government in the field of ICT service exports. ICT firms havebenefited greatly from the opening up of the data segment. Moreover, the liberal
The Case of Egypt 221
technical functions for OBS’s global multinational clients. The center currentlyemploys more than 1,500 highly qualified and trained workers in the 23 languagessupported by the company. The largest support teams are those that use Arabic,English, French, German, Italian, and Spanish. Orange Corporation chose Egypt forits qualified, low-cost talent pool and its ability to comply with technical andlanguage requirements. For example, more than 50 percent of staff members havetwo technical certifications, such as Cisco, IBM, or Microsoft, which they normallyobtain through the internal training program.
Oracle Global Support CenterOracle’s global support center (GSC) is located in Cairo within the Smart Village. Itemploys more than 400 world-class engineers to support more than 100,000customers in 140 countries worldwide. In 1999, Oracle Group’s headquarters in theUnited States began investigating whether Egypt would make a good outsourcingdestination and verified that the country’s labor productivity and the quality of itsinfrastructure were no less than they are in any other part of the world. The GSC wasopened in June 2005 with 20 engineers in its application product support division;currently, Egypt GSC is the fastest-growing center for Oracle around the globe. It startedby importing its entire consulting team from abroad. Today, the GSC is satisfying all itshuman resources needs from Egypt. Oracle chose the Egypt market because of its time-zone affinity with Europe; its cost-competitive environment; and the large, highlyskilled labor pool with multilingual skills in Arabic, English, French, German, Italian, andSpanish. Moreover, the excellent government support (including education programsfor working Egyptian professionals) and an advanced telecommunication infrastructureare important advantages.
Sources: Datamonitor 2009; El Shinawi and Lanvin 2009; Kamel and Hussein 2008; Marson andBlodgett 2007.

international resale of voice services has attracted several internationalinvestors—for example, GlobalOne, American Express, and MCI offer interna-tional calling card services (Rossotto, Sekkat, and Varoudakis 2003).
The government’s willingness to create a vibrant ICT sector is reflected in itsinitiation of the ICT master plan in 2000.19 In this plan the government has clearlystated its objectives:
• Creating a vibrant and export-oriented ICT industry• Supporting the development of a modern national telecommunication net-
work• Increasing employment opportunities in the ICT sector• Building an information society capable of absorbing and benefiting from
expanding sources of information• Developing and upgrading ICT applications to improve the standard of living
and support competitiveness in global ICT markets
As will be described later, the government has also addressed the supply-sideaspects by investing in human resources to develop a wide pool of qualified pro-fessionals and by establishing technology incubators.
In 2004, the government established ITIDA, whose mission is to develop theICT sector and boost its exports. ITIDA is a partnership between the MCIT andthe private sector dedicated to developing IT in Egypt. ITIDA also acts as the ICTindustry information center and provides market research data. Moreover, it isintended to offer technical counseling to disputing parties in the ICT industryfields (box 6.2). The supporting infrastructure, created mainly by the government,also includes research and development centers of excellence. The main goal ofsuch centers is to help establish start-up firms that make intensive use of ICT inareas such as data mining and computer modeling, wireless technologies, mobileand e-services, and electronic design.
Several other programs aim at enhancing exports, including export develop-ment programs of the Center for Business Support and the Egyptian ExportersAssociation under the Growth through Globalization Program.20
Clusters and technology parks, such as the Smart Village inaugurated in 2004,have created a space where IT companies can operate within a community con-ducive to their business needs. Most of the leading IT-related companies, as well asthe MCIT itself, have moved to the Smart Village, which currently employs about29,000 people. It is intended to accommodate up to 67 office plots, 500 companies,and approximately 80,000 employees, with a total of 1,336,000 square meters ofland, of which 90 percent is green space.
222 Exporting Services

The Case of Egypt 223
Box 6.2: ITIDA Programs
ITIDA undertakes several programs. These programs have the following aims:
• Developing the skills of potential and actual workers in the ICT sector• Building the caliber needed for work in BPO by providing the necessary training in
soft, technical, and language skills through special educational initiatives• Enhancing the linguistic capabilities of new entrants to BPO and the managerial
skills of existing workers• Building the capabilities of IT companies through ITIDA’s affiliate SECC (Software
Engineering Competence Center), which promotes and supports the developmentof Egypt’s software industry by raising industry standards and professionalism
• Supporting companies to sharpen their international competitiveness and exportpotential
• Protecting intellectual property rights in the IT field• Facilitating secure online business through enhancing the use of e-commerce and
e-signature• Building bridges with academia through special programs that aim at bringing
academic expertise to the IT field• Strengthening links with multinationals (for example, ITIDA launched a joint
nanotechnology research center with IBM aimed at enhancing the research andapplication of nanotechnology in different fields of interest to Egypt)
Moreover, ITIDA has developed special programs aimed at identifying andsupporting potential champions in IT. For example, ITIDA’s Technology IncubationProgram focuses on supporting the development of promising seed and start-up ITcompanies. The program is designed to identify potential innovations in the ICTsector by identifying candidates for incubation and supporting them, thus resultingin a greater number of successful start-ups and small businesses. ITIDA supportsprogram participants by providing furnished office space in the Smart Village.Participants receive full training and consultation that focuses on technical, projectmanagement, human resources, financial, marketing, business development, andnetworking. The incentive packages also include payment of salaries on the basis of apredefined salary scale. ITIDA supports attendance at start-up conferences andinternational exhibitions worldwide. Other programs focusing on enhancing exportsinclude the Go to GCC Program, which aims at helping Egyptian IT firms export toGulf Cooperation Council (GCC) countries by providing a platform for partnershipswith leading system integrators and channel partners in the region. ITIDA handles allissues related to licensing and provides a shield against red tape and cumbersomegovernment procedures for firms working in this field, thus overcoming some of thenegative business climate conditions previously highlighted.
In February 2010, ITIDA announced a new export promotion program, Export IT.This program aims at supporting Egyptian exports of IT services and products byproviding a 10 percent export subsidy on the value added (software products,consultations, training, IT-enabled services, software applications, system analysis,and so on) created by Egyptian IT firms in their export products. The goal is to reachUS$2 billion of exports of IT products and services by 2013. Through March 2010,154 firms had signed up for Export IT, and 140 firms met the necessary conditionsand were accepted for registration.
Source: ITIDA website, http://www.itida.gov.eg.

Companies inside as well as outside the Smart Village can benefit from ITIDAexport incentives. The main benefits of locating in the Smart Village are theadvanced infrastructure and the clustering (for example, amenities such as a fiber-optic network, multisource power supply, and district cooling and heating redun-dant network plant), but the location provides no additional financial gains or taxbreaks. A number of other successful ICT-exporting firms are located outside theSmart Village (in Nasr City public free zone), including Sakhr21 and ITWorx.22
Maadi Park, another business park designed for BPO and IT outsourcing delivery,is currently being built in downtown Cairo. It will have a capacity for 45,000employees in more than 40 buildings with 2 million square meters of space(Datamonitor 2009).
The total number of employees in the ICT sector reached 55,109 in December2008, and if Telecom Egypt employees, Egypt Post employees, and Smart Villageemployees are added, that number increases to 175,110 employees, compared with147,853 in December 2006, an increase of more than 18 percent (Helmy 2009;MCIT 2009). Over the same period, the number of ICT companies increased bynearly 42 percent to reach 2,938. Of these companies, 79 percent were IT compa-nies, 13 percent IT-enabled service companies, and 8 percent telecommunicationcompanies (MCIT 2009). Nearly 300 companies work in the software industry,employing more than 8,500 professionals. This number reflects about 13 percent ofthe total number of companies operating in the ICT sector. The sector was able toattract approximately US$3.13 billion in FDI during the period 1998–2004 andUS$3.97 billion during the period 2006–07 (Kamel, Rateb, and El-Tawil 2009).Table 6.9 shows the different fields in which multinationals are engaged.
The MCIT has developed specific training programs for the different segmentsof the industry. For example, the MCIT sponsors a training program for contactcenters to prepare 800 agents, supervisors, and trainers annually. The training isrelated to 10 fields, including banking, communications, IT, and medical services,and is provided through recognized educational institutions (MCIT 2005). More-over, a high percentage of IT and technical-related university graduates (about80,000 technical graduates each year) ensures a continuous flow of specialists inthis field. Both public and private universities and higher education institutionshave been increasing their capacities to provide such training, and a few new fac-ulties have been established within existing universities to further increase thelabor supply in this field.
Establishing the Nile University is an important achievement in creating aqualified workforce. The university is a not-for-profit research and developmentinstitution. Privately owned and autonomously managed, Nile University spe-cializes in engineering technology and business administration. It is the first in anew class of academic institutions in Egypt that embrace partnership between
224 Exporting Services

the private sector, represented by a nongovernmental organization;23 govern-ment, represented by the MCIT; and industry, in a major initiative of greatnational and regional interest.
Nile University opened in early 2007 and focuses mainly on applied ITresearch, looking to create solutions to industry challenges through strong linksbetween the university and industry. The university has three main centers spe-cializing in research and development, entrepreneurship and incubators, andinnovation and intellectual property. Those centers act as catalysts to advance thetechnological capabilities of the ICT industry (Marson and Blodgett 2007).
ITIDA runs an education program called EduEgypt, liaising with universitiesto train students for entering the BPO industry. Some 5,000 students are currentlyenrolled in this “university intervention for BPO” (ITIDA plans to increase enroll-ment to 20,000), and 700 students are enrolled in the IT equivalent of this pro-gram (Datamonitor 2009, 6). EduEgypt also supports undergraduate training insoft skills, language abilities, and technical competence to prepare students forlocal and global markets. This effort is a part of a workforce development initia-tive aimed at reducing the gap between student readiness and employer expecta-tions. The initiative produced 3,000 graduates in its first year and aims at supply-ing the market with 40,000 graduates per year by 2011.24
The software industry is attracting considerable investment from the privatesector, which is drawn by the industry’s growth and government incentives.
The Case of Egypt 225
Table 6.9. Fields Where Multinational Companies Are Engaged
Company Activities and projects
IBM Software development center employing 400+ skilled IT developers focusing on Arabization
Mentor Graphics Design center employing 170+ engineers
Intel Regional platform definition center and regional softwareenablement lab
Microsoft Developer support center for regional developers andsoftware innovation center
Cisco Core competency e-learning institute
Oracle Global support center employing 600+ engineers providingregional customer support
Orange and France Telecom Global support center employing 1,200+ engineers
Alcatel-Lucent International support center employing 300+ engineersproviding GSM (Global System for Mobile Communication)and wireless support services
Satyam BPO services with 200+ engineers
ZTE and Huawei WiMax (Worldwide Interoperability for Microwave Access)research and development centers
Source: Ministry of Communications and Information Technology website, http://www.mcit.gov.eg.

Nevertheless, it is still in a nascent stage of development covering four mainmarket segments: software tools, packaged applications, customizations ofexisting applications, and Arabization. Despite the government’s effort to relaxthe supply-side bottleneck in the sector, ICT service exports from Egypt are stillconstrained by skills availability compared with those of its main competitors(A.T. Kearney 2009). Neither is its telecommunication network up to the mark.For instance, Helmy (2009) argues that despite the rapid increase in ICT, someof the indicators related to telecommunication infrastructure are still moremodest in Egypt than in other countries in the region (for example, the numberof Internet hosts).
Tourism
Tourism is considered the main service export from Egypt; its contribution is thelargest to GDP, exports, and employment. Exports of tourism services account for23 percent of total exports of goods and services and 46 percent of total exports ofservices (CBE 2010). The foreign exchange proceeds from tourism rank firstamong other sources of foreign exchange and have been the largest foreignexchange contributor for the past five years. According to the Ministry of Eco-nomic Development, proceeds reached US$9 billion in 2009.25 Studies such asSakr, Massoud, and Sakr (2009) and Tohamy and Swinscoe (2000) find thattourism’s indirect effects on generating income and employment are so high thattaking them into account would increase tourism’s contribution to GDP from 3or 4 percent to 11 percent.
According to Sakr, Massoud, and Sakr (2009), the number of tourist arrivalsincreased more than sevenfold, from 1.5 million in 1985 to 11.1 million in 2007,with an average annual growth rate of 9.2 percent. Tourist nights also grew sub-stantially over the same period, from 9 million to 111.5 million, with an averageannual growth rate of 12.1 percent. Tourism earnings increased as well, from aboutUS$315 million in 1985 to nearly US$9.5 billion in 2007, and account for almost25 percent of total tourism receipts in the Middle East. Tourism revenues representaround 41.5 percent of Egypt’s service exports (Ragab 2008). Although tourismexports have increased over time, Sakr, Massoud, and Sakr (2009) argue that thepotential of tourism services has not yet been realized. Their findings showedconsiderable forgone opportunities in terms of unsatisfied potential demand ingeneral and for certain markets and tourism products in particular. Table 6.10identifies the main indicators of tourism development over time in Egypt.
Egypt attracts tourists mainly from European and Arab countries (figure 6.3).The World Economic Forum’s Travel and Tourism Competitiveness Report 2009
226 Exporting Services

The Case of Egypt 227
Table 6.10. Main Tourism Indicators, 1985–2007
Tourismindicators 1985 1993 2000 2007
Average annual growth rate
1985–93 1993–2000 2000–07
Number ofarrivals (million) 1.5 2.5 5.5 11.1 6.8 11.8 10.6
Number ofnights (million) 9.0 15.1 32.8 111.5 6.8 11.7 19.8
Average lengthof stay ofvisitors (nights) 6 6 6 10 — — 7.8
Tourismreceipts (US$billion) 0.3 1.9 4.3 9.5 26.7 12.5 12.0
Lodgingcapacity(thousandrooms) 27.3 58.8 111.3 190.2 10.0 9.8 7.7
Source: Sakr, Massoud, and Sakr 2009.Note: — = not available.
Middle East15%
Africa4%
North America3%
Latin America1%
Eastern Europe24%
Western andSouthern Europe
47%
East Asia andthe Pacific
3%
South Asia3%
Figure 6.3. Sources of Tourists in Egypt, 2007
Source: Data from the Central Agency for Public Mobilization and Statistics.

(WEF 2009) identified a number of factors that make Egypt an attractive countryfor tourists, including its rich cultural heritage, low prices, and national prioritiza-tion of the sector. However, the report also highlighted a number of factors thatreduce Egypt’s ability to fully exploit the potential of this sector: weak infrastruc-ture (especially ground infrastructure), modest human skills and humanresources, and lack of environmental sustainability. According to the report, Egyptstill lags several countries, including, as shown in table 6.11, Tunisia and Turkey.
Even though Egypt has low-cost labor, the relatively low quality of its labor hasbeen cited as a reason for the declining comparative advantage in this sector. Thelack of employees trained according to international standards certainly affectsthe quality of services provided. In 2006, only 14 percent of employees in this sec-tor had been trained according to international standards, which in turn affectedthe standards of service provided (Sakr, Massoud, and Sakr 2009). The govern-ment, in collaboration with international partners and the private sector, hasstarted implementing a number of development programs aimed specifically atimproving tourism skills. These programs attempt to overcome the weak humancapacity by targeting workers with different levels of education (higher secondaryand on-the-job training).26
Moreover, the government of Egypt has undertaken many efforts to enhancethe comparative advantage by facilitating investment in this sector. For example,laws and regulations have been implemented that provide tax holidays followinginvestment (Law 8/1997). Allowing full foreign ownership of tourism-relatedinfrastructure such as hotels has encouraged almost all chains of hotels recognizedworldwide to locate in Egypt. The room capacity reached 215,000 rooms in 2009(Ragab 2008), and additional capacity of 156,200 rooms is planned to be added by2014, particularly in the growing resort areas along the coasts of the Red Sea andEl Aqaba Gulf in South Sinai, and more recently along the north coast and west ofAlexandria (Sakr, Massoud, and Sakr 2009). In addition, the government is in the
228 Exporting Services
Table 6.11. Ranks in Travel and Tourism Competitiveness Index, 2009
Overall index
Travel and tourism
regulatory framework
Travel and tourism business environment and
infrastructure
Travel and tourism human,
cultural, and natural resources
Egypt, Arab. Rep. 64 52 65 73
Tunisia 44 31 49 56
Morocco 75 64 78 83
Turkey 56 63 60 44
Source: WEF 2009.

process of preparing a National Tourism Sustainable Development Plan andenhancing related infrastructure, including airports and aviation regulation. Thegovernment adopted an open-skies policy allowing charter flights to operate in allEgyptian airports. It has also diversified tourism activities (for example, yacht andshopping tourism); adopted aggressive marketing and branding techniques; andadopted high environmental standards. As a result of such policies, the number oftravel agencies operating in Egypt has increased from 550 in 1986 to 1,300 in 2007(Ragab 2008).
To overcome regulatory bottlenecks, the government of Egypt has issued rulesand regulations (for example, an amendment to Law 230/1996) that facilitateprocedures in some areas for organizing the possession of buildings and lands byforeigners. Ministerial Decree 548/2005 facilitates the possession of residentialunits by foreigners in some areas and removes any remaining restrictions on res-idential tourism (such as the purchase of Egyptian vacation homes by foreigners)(Ragab 2008).
The lack of public awareness in tourism sites accompanied by a lack of mecha-nisms to control the behavior of vendors created a negative reputation for Egypt-ian tourism. The Ministry of Tourism is trying to enhance public awareness andbuild a brand name for Egypt’s tourism sector through a number of promotionalradio and television programs.
Although the Ministry of Tourism is the main body responsible for tourism inEgypt, tourism is affected by other institutions and, therefore, a specific level ofcoordination is needed for activities ranging from transportation to lodging tomeals to entertainment to retail sales. Lack of coordination among the severalauthorities engaged in overseeing tourism activities has created difficulties forbusinesses that have to deal with local governorates’ authorities and has resultedin delays in issuance of licenses, allocation of land permits, and suspension oflicensees for different operators in the tourism industry (Ragab 2008). Further-more, policy constraints are difficult to address because up to 17 agencies andministries are involved in handling tourism-related issues (Sakr, Massoud, andSakr 2009).
Conclusions and Policy Implications
Table 6.12 lists the strengths, weaknesses, opportunities, and threats (SWOT) that,as outlined in this chapter, could shape comparative advantage of service exportsfrom Egypt.
As the chapter discussed, Egypt is in an advantageous position to provide adirect link between Africa, Asia, and Europe. Beyond its geographic location, thecountry is endowed with a large, educated population that not only advances the
The Case of Egypt 229

domestic market size but also could be a useful resource for exporting in the inter-national market. Egypt has been able to use its human resources, to a limitedextent, to export services.
The transportation and travel service sectors have benefited from Egypt’s geo-graphic location, while the ICT service sector has made use of the multilingualpeople skills Egyptians possess. However, Egypt’s potential is still not fully used. Ithas a pool of trained nurses and teachers who are moving abroad because theylack meaningful employment opportunities in the country. True, they are con-tributing to mode 4 service exports; nonetheless, such skills would be better usedto ensure higher quality and, hence, higher returns. Such underused resources,along with an underdeveloped electronic and telecommunication infrastructure,are the most important drags on service exports from Egypt.
Egypt’s traditional existing comparative advantage (the fundamental sources)has played an overwhelming role in identifying Egyptian exports of services; how-ever, for some sectors, targeted policy proved to be effective as well. Tourism andeducational service exports are based on traditional comparative advantagesources, such as the availability of cheap, educated labor with strong linguisticskills and the existence of natural tourism sites. However, ICT and software-related service exports are based on targeted policy, such as establishment of tech-nology parks, that is able to reinforce the fundamental source of comparativeadvantage (that is, the availability of cheap labor with linguistic skills). Other poli-cies, such as those that reformed the telecommunication sector, were also crucial.
230 Exporting Services
Table 6.12. SWOT Analysis for Egypt’s Comparative Advantage in Services
Strengths Weakness Opportunities Threats
• Geographicposition
• Large domesticmarket
• Well-educated,cheap laborforce inidentifiedsectors suchas ICT
• Clusters withnecessaryinfrastructure
• Weak infrastructure• Lack of space and planning• Lack of accessibility• Weak rule of law• Corruption• Low quality of human
resources• Expensive office space• Informal sector• Lack of access to finance• Lack of coordination among
official bodies• Sudden changes in policies
and regulations
• Large market• Underused
humanresources
• Loss of existingbusiness becauseof unfavorableconditions andcompetition fromother countries
• Increased pollution • Traffic congestion
Source: Interviews with business community representatives and main results of international reports.

In other cases, the traditional comparative advantage sources were not fully used(for example, tourism) because of the lack of complementary government policiesor a weak regulatory framework.
Egypt has been moderately successful in exporting language-specific softwareservices. Nevertheless, Egypt is not the only country in the region that is exportingthis type of services. Bahrain, Lebanon, and the United Arab Emirates are also inthe race. Therefore, Egypt not only needs to develop its human capital andtelecommunication infrastructure, but also should revaluate its policies relating toregulatory framework, corruption, real estate development, and access to financeto maintain its current hold on ICT service exports.
Finally, some policy recommendations can be derived from the Egyptian case:
• Egypt was able to establish its own competitive advantage in some sectors(such as ICT) through a determined policy that overcame several disadvan-tages, such as its complex regulatory system and inefficient education system.The policy focused on creating a tier of well-educated labor and used advan-tages such as time zones and linguistic ability.
• In contrast, although some sectors have a natural comparative advantage, suchas geography in the case of tourism or availability of labor supply in the case ofnursing and teaching (which are exported through mode 4), that advantagecan easily be lost if accompanying policies are not adjusted to serve the exportgoals. For example, in the case of tourism, training of workers and enhance-ment of public awareness will help ensure that tourists receive a positiveimpression of the country. Promoting tourism may even entail introducingspecific laws and regulations that prevent harassment of tourists. Moreover,policies in tourism-related sectors (such as transportation and traffic) shouldbe coordinated.
• The government’s role in promoting service exports of services is paramount.Any government should seriously consider an industrial policy for services.Such a policy can be created on a sectoral basis, can be established across theboard, or can use a mixture of both. Examples of across-the-board policiesinclude tax reductions if services are exported by mode 1 and introduction ofincentives for attracting FDI to specific sectors or geographic areas in the caseof mode 3.
Notes
1. Ministry of Economic Development, http://www.mop.gov.eg.2. Some studies suggest that production services have not played a highly positive role in enhanc-
ing employment, whereas social services (mainly governmental) have taken the lead in this regard (El-Ehwany and El-Megharbel 2008).
The Case of Egypt 231

3. Data are from the online version of the International Monetary Fund’s International FinancialStatistics database at http://www.imf.org.
4. The other business service sector encompasses a set of rather heterogeneous activities (frombookkeeping to architecture to research and development services), and Egypt may still have a com-parative advantage in certain subsectors but not in others. However, data limitations did not allowthorough investigation of this issue.
5. These figures are available on the website of the Central Agency for Public Mobilization andStatistics, http://www.capmas.gov.eg.
6. The Economic Reform and Structural Adjustment Program was not the first reform initiativeby the Egyptian government. In fact, Egypt signed three standby agreements with the InternationalMonetary Fund in 1976, 1978, and 1987. These standby agreements followed the same line of policyrecommendations, advocating to different degrees tight fiscal and monetary policies, a liberal exchangerate, and trade policies along neoclassical lines. However, the other three agreements were discontin-ued for social, political, or economic reasons (Korayem 1997).
7. These data were supplied by the Ministry of Investment and the General Authority forInvestment.
8. The seven main pillars of the Doing Business rankings are starting a business, dealing with con-struction permits, registering property, getting credit, protecting investors, paying taxes, and tradingacross borders. The World Bank uses a number of indicators to assess the performance of each pillar.See the Doing Business website, http://www.doingbusiness.org/custom-query.
9. The GSLI analyzes and ranks the top 50 locations worldwide that provide the most commonremote functions, including IT services and support, contact centers, and back-office support. Eachcountry’s score comprises a weighted combination of relative scores on 43 measurements, which aregrouped into three categories: financial attractiveness, availability of people and skills, and businessenvironment.
10. For more information about Pioneers http://www.pioneersholding.com.11. For more information about Beltone Financial http://www.beltonefinancial.com/egypt.12. The website for HC Securities & Investment is http://www.hc-si.com; the website for Prime
Group is http://www.primegroup.org.13. These data are from the World Bank’s South-South Migration and Remittances data sets, avail-
able online at http://econ.worldbank.org/WBSITE/EXTERNAL/EXTDEC/EXTDECPROSPECTS/0,,contentMDK:21154867~pagePK:64165401~piPK:64165026~theSitePK:476883,00.html. Accordingto the Central Agency for Public Mobilization and Statistics, the number of Egyptian emigrantsreached 3,901,396 in 2006, representing about 5 percent of the Egyptian population (CAPMAS 2008a).
14. The Global Services–Tholons (2009) study combines results from surveys and interviews withkey providers to identify which global cities are set to be the next hotspots for the outsourcing indus-try. It looks at a wide range of criteria, including scale and quality of workforce, education, cost, infra-structure, risk profile, and quality of life.
15. The GSLI is based on corporate inputs, current remote service activity, and government initia-tives to promote the sector. Such aspects were evaluated against 43 measurements across three maincategories, including financial attractiveness, people’s skills and availability, and business environment.
16. The Yankee Group uses similar methodology in its index to Global Services–Tholons and A.T.Kearney. All of these groups use industry surveys in addition to factual data. The differences are a resultof weights given to different variables in calculating the index, the surveys’ responses, and inclusion orexclusion of some variables.
17. This report looks at the same variables as the other international reports but is more focusedon the African continent. It uses secondary data on the national level as well as interviews.
18. The existence of several foreign language higher education providers and the positive spillovereffect of tourism have created a community that is friendly to foreign languages and familiar withEuropean culture and business ethics.
19. This plan is outlined on the MCIT’s website. See http://www.mcit.gov.eg.20. See http://www.expolink.org.eg for more information.
232 Exporting Services

21. Sakhr is the global leader in Arabic-language technology, with products for the Middle East ine-governance, education, wireless, and security. It has 200 employees worldwide, with offices in Cairoand Washington, D.C. Sakhr began in 1982 with a far-reaching vision of the need for Arabic-languagetechnologies. With 15 years of pioneering research and the world’s largest knowledge base in Arabicnatural-language processing, Sakhr has developed numerous Arabic-language “firsts.” Sakhr leads thefield in Arabic-language machine translation, OCR (optical character recognition), speech recogni-tion, speech synthesis, search, and localization. The firm has partners in all Arabic countries. SeeSakhr’s website, http://www.sakhr.com/default.aspx, for more information.
22. ITWorx is a global software professional services organization. Headquartered in Egypt, thecompany offers portals, business intelligence, enterprise application integration, and applicationdevelopment outsourcing services to Global 2000 companies. ITWorx serves governments, financialservices firms, educational institutions, telecommunication operators, and media companies inEurope, the Middle East, and North America. Across industry verticals and service practices, ITWorxhas developed specific competences in security, usability, productivity, and enterprise manageability.See ITWorx’s website, http://www.itworx.com/AboutUs/Pages/default.aspx, for more information.
23. That nongovernmental organization is the Egyptian Foundation for Technology Educa-tion, which is dedicated to improving technology-related education by establishing specializedinstitutes, schools, and vocational schools. It was created to provide a mechanism for the deliveryof Nile University services and activities. See Nile University’s website, http://www.nileu.edu.eg, formore information.
24. See ITIDA’s website, http://www.itida.gov.eg, for more information.25. This information is available on the Ministry of Economic Development’s website at
http://www.mop.gov.eg/MOP_META/nsdp.htm.26. Information about these programs was provided by the Ministry of Tourism.
References
Amin, Mohammad, and Aaditya Mattoo. 2006. “Do Institutions Matter More for Services?” PolicyResearch Working Paper 4032, World Bank, Washington, DC.
A.T. Kearney. 2005. Assessment of Egypt’s Potential as a Competitive Location for Offshore Services.Chicago: A.T. Kearney.
———. 2007. “Offshoring for Long-Term Advantage: The 2007 A.T. Kearney Global Services LocationIndex.” A.T. Kearney, Chicago.
———. 2009. “The Shifting Geography of Offshoring: The 2009 A.T. Kearney Global Services Loca-tion Index.” A.T. Kearney, Chicago. http://www.atkearney.com/images/global/pdf/Global_Services_Location_Index_2009.pdf.
CAPMAS (Central Agency for Public Mobilization and Statistics). 2008a. “Final Results of Populationand Housing Census 2006.” CAPMAS, Cairo.
———. 2008b. Labor Force Sample Survey 2006/2007. Cairo: CAPMAS.CBE (Central Bank of Egypt). 2010. Monthly Statistical Bulletin 156 (March). Research, Development,
and Publishing Sector, CBE, Cairo. Commonwealth Business Council and Cyber Media India. 2009. Outsourcing to Africa: A Relative
Ranking of 15 Country Locations. Cyber Media: Gurgaon, Haryana, India.Datamonitor. 2005. “Emerging Opportunities: Offshore Outsourcing in Egypt—A Growing Contact
Center Market Looks to Build Global Business.” Datamonitor, London. http://www.rayacorp.com/Uploads/Datamonitor_White_Paper_Feb_2005.pdf.
———. 2009. “Global Delivery Locations: Focus on Egypt (Analyst Insight).” Datamonitor, New York.http://www.egypton.com/Documents/Global%20Deliver%20Locations%20-Focus%20on%20Egypt.pdf.
Di Bartolomeo, Anna, Tamirace Fakhoury, and Delphine Perrin. 2009. “CARIM: Migration Profile—Morocco.” Consortium for Applied Research on International Migration, Robert Schuman Centre
The Case of Egypt 233

for Advanced Studies, European University Institute, San Domenico da Fiesole, Italy. http://www.carim.org/public/migrationprofiles/MP_Morocco_EN.pdf.
———. 2010. “CARIM: Migration Profile—Egypt.” Consortium for Applied Research on InternationalMigration, Robert Schuman Centre for Advanced Studies, European University Institute, SanDomenico da Fiesole, Italy. http://www.carim.org/public/migrationprofiles/MP_Egypt_EN.pdf.
EIU (Economist Intelligence Unit). 2009. Resilience amid Turmoil: Benchmarking IT Industry Competi-tiveness 2009. London and New York: EIU.
El-Ehwany, Naglaa, and Nihal El-Megharbel. 2008. “Employment Intensity of Growth in the EgyptianEconomy, with a Focus on the Manufacturing Industries.” ECES Working Paper 130, EgyptianCenter for Economic Studies, Cairo.
El Shinawi, Nagwa, and Bruno Lanvin. 2009. “How Outsourcing Can Help Mobilize Talents Globally:Egypt’s Success Story.” In Global Information Technology Report 2008–2009, ed. Soumitra Duttaand Irene Mia, 113–22. Geneva: World Economic Forum.
Engman, Michael. 2009. “Half a Century of Exporting Educational Services: Assessing Egypt’s Role inEducating the Arab World.” Working Paper 2009-10-04, Groupe d’Economie Mondiale at SciencesPo, Paris. http://gem.sciences-po.fr/content/publications/pdf/Engman_educational_services_Egypt102009.pdf.
Fargues, Philippe. 2006. “International Migration in the Arab Region: Trends and Policies.” Paper pre-sented at the United Nations Expert Group Meeting on International Migration and Developmentin the Arab Region, Beirut, May 15–16. http://www.un.org/esa/population/migration/turin/Symposium_Turin_files/P09_Fargues.pdf.
Galal, Ahmed. 2002. “The Paradox of Education and Unemployment in Egypt.” ECES Working Paper67, Egyptian Center for Economic Studies, Cairo.
Ghoneim, Ahmed F. 2010. “Labour Migration for Decent Work, Economic Growth and Developmentin Egypt.” International Migration Paper 106, International Labour Organization, Geneva.
Girgis, Maurice. 2002. “Would Nationals and Asians Replace Arab Workers in the GCC?” Paper pre-sented at the Fourth Mediterranean Development Forum, Amman, October 7–10.
Global Services–Tholons. 2009. “Top 50 Emerging Global Outsourcing Cities.” Global Services, October. http://www.globalservicesmedia.com/Dgmag/Top50/digimag.html.
Hakim, Sam, and Simone Neamie. 2001. “Performance and Credit Risk in Banking: A ComparativeStudy for Egypt and Lebanon.” ERF Working Paper 0137, Economic Research Forum, Cairo.
Helmy, Omneia. 2009. “ICT Services without Borders: An Opportunity for Egypt?” ECES WorkingPaper 150, Egyptian Center for Economic Studies, Cairo.
Hoekman, Bernard, and Aaditya Mattoo. 2008. “Services Trade and Growth.” In Opening Markets forTrade in Services: Countries and Sectors in Bilateral and WTO Negotiations, ed. Juan A. Marchettiand Martin Roy, 21–58. Cambridge, U.K.: Cambridge University Press.
Kamel, Sherif, and Maha Hussein. 2008. “Xceed: Pioneering the Contact Center Industry in Egypt.”Journal of Cases on Information Technology 10 (1): 67–91.
Kamel, Sherif, Dina Rateb, and Mohamed El-Tawil. 2009. “The Impact of ICT Investments on Eco-nomic Development in Egypt.” Electronic Journal on Information Systems in Developing Countries36 (1): 1–21. http://www.ejisdc.org/ojs2/index.php/ejisdc/article/viewFile/524/264.
Korayem, Karima. 1997. “Egypt’s Economic Reform and Structural Adjustment (ERSAP).” ECESWorking Paper 19, Egyptian Center for Economic Studies, Cairo.
Marson, Tony, and Mindy Blodgett. 2007. “Is the Future Bright for Outsourcing IT Services to Egypt?”Yankee Group, Boston. http://www.moveitgate.com/portal/Portals/0/4-yankee_Group_Report-May%20200720071227132214.pdf.
———. 2008. “Can Middle Eastern Countries Fulfill the ‘Eastern’ Promise?” Yankee Group, Boston.http://www.itida.gov.eg/Documents/Yankee%20Report%20Can%20Middle%20EasternCountries%20Fulfill%20the%20Eastern%20Promise.pdf.
MCIT (Ministry of Communications and Information Technology). 2005. Egypt’s Information Society.4th ed. Cairo: MCIT.
———. 2009. “Egypt ICT Indicators.” MCIT, Cairo. http://www.egyptictindicators.gov.eg/en/Pages/default33.aspx.
234 Exporting Services

Ministry of Economic Development. 2009. Online economic indicators. http://www.mop.gov.eg. Ministry of Finance. 2008. “Egypt Economic Outlook.” Macro Fiscal Policy Unit, Ministry of Finance,
Nasr City, Egypt. http://www.mof.gov.eg/MOFGallerySource/English/Egypt%20Economic%20Outlook-%20September%202008.pdf.
Mishra, Saurabh, Susanna Lundstrom, and Rahul Anand. 2011. “Service Export Sophistication andEconomic Growth.” World Bank, Washington, DC. http://siteresources.worldbank.org/INTRANETTRADE/Resources/Internal-Training/287823-1285275962946/Service_Export_Growth.pdf.
Nugent, Jeffrey, and Mohamed Saleh. 2009. “Intergenerational Transmission of, and Returns toHuman Capital and Changes Therein over Time: Empirical Evidence from Egypt.” ERF WorkingPaper 468, Economic Research Forum, Cairo. http://www.erf.org.eg/cms.php?id=NEW_publication_details_working_papers&publication_id=1093.
Porter, Michael E., and Klaus Schwab, eds. 2008. The Global Competitiveness Report 2008–2009.Geneva: World Economic Forum.
Radwan, Samir. 2002. “Employment and Unemployment in Egypt: Conventional Problems, Uncon-ventional Remedies.” ECES Working Paper 70, Egyptian Center for Economic Studies, Cairo.
Ragab, Adla. 2008. “Assessment of Trade in Tourism and Travel Related Services in Egypt in Relation tothe GATS.” Study undertaken for the Ministry of Trade and Industry, Cairo.
Rossotto, Carlo Maria, Khalid Sekkat, and Aristomene Varoudakis. 2003. “Opening Up Telecommuni-cations to Competition and MENA Integration in the World Economy.” Middle East and NorthAfrica Working Paper 33, World Bank, Washington, DC. http://siteresources.worldbank.org/INTMENA/Resources/wp33september2006.pdf.
Sakr, Mohamed, Nada Massoud, and Hala Sakr. 2009. “Tourism in Egypt: An Unfinished Business.”ECES Working Paper 147, Egyptian Center for Economic Studies, Cairo.
Schwab, Klaus, ed. 2009. The Global Competitiveness Report 2009–2010. Geneva: World EconomicForum.
———, ed. 2010. The Global Competitiveness Report 2010–2011. Geneva: World Economic Forum. Tohamy, Sahar, and Adrian Swinscoe. 2000. “The Economic Impact of Tourism in Egypt.” ECES Work-
ing Paper 40, Egyptian Center for Economic Studies, Cairo.UNCTAD (United Nations Conference on Trade and Development). 2003. Handbook of Trade Statis-
tics 2003. Geneva: UNCTAD.———. 2008. Handbook of Trade Statistics 2008. Geneva: UNCTAD.———. 2009a. Handbook of Trade Statistics 2009. Geneva: UNCTAD.———. 2009b. World Investment Report 2009: Transnational Corporations, Agricultural Production and
Development. Geneva: UNCTAD.UNDP (United Nations Development Programme) and INP (Institute of National Planning). 2008.
Egypt Human Development Report 2008: Egypt’s Social Contract: The Role of Civil Society. Cairo:UNDP and INP.
WEF (World Economic Forum). 2009. The Travel and Tourism Competitiveness Report 2009: Managingin a Time of Turbulence. Geneva: WEF.
World Bank. 1999. “Project Appraisal Document on a Credit in the Amount of SDR 35.8 Million to theArab Republic of Egypt for a Secondary Education Enhancement Project.” Report 18923-EGT,Human Development Group, Middle East and North Africa Region, World Bank.
———. 2005. “Project Appraisal Document on a Credit in the Amount of $20 Million to the ArabRepublic of Egypt for an Early Childhood Education Enhancement Program.” Report 31182-EG,Human Development Group, Middle East and North Africa Region, World Bank.
———. 2008. The Road Not Traveled: Education Reform in the Middle East and Africa. Washington,DC: World Bank.
WTO (World Trade Organization). 2009. “Egypt.” In Trade Profiles 2009, 54. Geneva: WTO.http://www.wto.org/english/res_e/booksp_e/anrep_e/trade_profiles09_e.pdf.
The Case of Egypt 235


Kenya’s potential for exporting business services is vast. Business services arethose that are provided by the private sector and that require a high level of skills,usually certified, and include accounting, architectural, engineering, businessprocess outsourcing (BPO), and legal services. Because of its strong domesticservices sector, Kenya is in a unique position to export such services throughoutEast Africa and to the rest of the world. Kenya’s recent information and commu-nication technology (ICT) revolution, epitomized by the success of Safaricom, hasexpanded mobile phone and Internet access to millions of people, and Kenya’sICT service firms such as KenCall have had substantial success in the domesticand international markets. However, as described in the World Bank’s (2010a)Kenya Economic Update, exports represent Kenya’s “weak engine.” Increasingexports of services, especially high-value-added business services, therefore repre-sents an important opportunity to drive economic growth in Kenya.
237
7
Becoming a GlobalExporter of
Business Services? The Case of Kenya
Nora Dihel, Ana Margarida Fernandes, Richard Gicho,John Kashangaki, and Nicholas Strychacz
The chapter is based on the findings of the assessment of Kenya’s export potential in business servicesundertaken by the Kenya Export Promotion Council and the World Bank in 2009. Support from theBank Netherlands Partnership Program and the Multi-donor Trust Fund for Trade and Developmentsupported by the governments of Finland, Norway, Sweden, and the United Kingdom is gratefullyacknowledged. The authors would like to thank Pumela Salela for her contribution on South Africa’sexperience in exporting information technology–enabled services.

Why focus on business services? Services are important because they are amain contributor to gross domestic product (GDP), to GDP growth, and toemployment in most developed and some developing countries (WTO 2008).Business services provide the inputs to many other economic activities and canhave significant positive spillover effects throughout the economy. Studies by theMcKinsey Global Institute and by the United Nations Conference on Trade andDevelopment suggest that a potential 18 million new jobs may be created indeveloping countries by service offshoring, and each new job in service sectorscould create a further three jobs in the rest of the economy (McKinsey GlobalInstitute 2005; UNCTAD 2003). An example of the power of business servicesfor economic growth is the impressive success of the BPO sector in India, whichpaved the way for the development of similar BPO sectors around the world.Middle-income countries such as the Arab Republic of Egypt and South Africaare following suit by expanding exports from their business service sectors.Despite this growth, however, in 2008 Sub-Saharan Africa as a whole stillaccounted for only 2 percent of global trade in services.
In Kenya, service sectors’ output accounts for approximately 56 percent ofGDP—or US$16.8 billion—in 2009, and service sectors grew by 4.2 percent in2009, led by the communication and transportation sectors as well as the traveland tourism sector, which rebounded with nearly 1 million foreign tourists. Overseveral years, the compound annual growth rate of services’ value added in Kenyahas been 8.6 percent, and services as a share of GDP has generally trended upwardover that time, as can be seen in figure 7.1. This trend compares with a 10-yearcompound annual growth rate of 11.7 percent for Rwanda and 7.3 percent forSouth Africa. The drop in Kenya’s service growth from 2007 to 2008 appears tobe caused by lower growth in service value added relative to a larger increase inGDP, perhaps because of the disruptions caused by political unrest in Kenyaduring this period (which hurt particularly BPO, nonbanking financial, andfreight-forwarding services).
Kenya’s trade in services has increased moderately over the past decade. Serviceexports increased to 12 percent of GDP in 2009 from 8 percent in 2000, withtransport and travel comprising 90 percent of total services exports (World Bank2010a). Similarly, since the beginning of the decade, Kenya’s exports and importsof services as a percentage of total exports and imports have steadily increased, ascan be seen in figure 7.2. The compound average growth rate for service exportsfrom 1998 to 2008 was 3.3 percent and for service imports was 2.8 percent. Incomparison, over the same period, Rwanda’s compound annual growth rate forservice exports was 23.8 percent (albeit starting from a substantially lower base)and for service imports was 10.6 percent, while South Africa’s compoundannual growth rate for service exports was 9.0 percent and for service imports
238 Exporting Services

was 11.6 percent. These comparators suggest that, despite the upward trend in itsservice trade, Kenya has further scope to develop its service sectors.
Kenya’s service exports consist mostly of travel and transportation services,whereas the country tends to be less competitive in higher-value-added sectorssuch as finance and ICT services. Kenya’s global share of service exports has
The Case of Kenya 239
Figure 7.1. Services’ Share of GDP in Kenya, 2000–08
5756555453525150sh
are
of G
DP
(%)
4948
2000
2001
2002
2003
2004
2005
2006
2007
2008
Source: World Bank national accounts data.
Figure 7.2. Kenya’s Service Exports and Imports as a Share of Total Exportsand Imports, 2000–08
2000
2001
2002
2003
2004
2005
2006
2007
2008
0
5
10
15
20
shar
e of
tot
al (
%)
25
30
35
40
45
services’ share of exports services’ share of imports
Sources: World Bank national accounts data; International Monetary Fund balance of payments statistics.

declined from 0.21 percent in 1970 to 0.09 percent in 2009. Table 7.1 presentsthe sectoral composition of service exports from 2005 to 2008 and the com-pound growth rate of each service subsector from 1998 to 2008. Table 7.2shows the revealed comparative advantage (RCA) of Kenya’s service exports infour subsectors.1
The numbers in table 7.2 confirm that Kenya is competitive in exporting trans-portation and travel services but is less competitive in exporting higher-value-added services such as BPO, ICT, and other business services. Also, the numbersemphasize that although Kenya is moving in the right direction, it has just begunto take advantage of the growing opportunities awarded by global trade in busi-ness services.
To examine further Kenya’s export performance and identify the service sec-tors with potential for expanding trade flows, this chapter uses a “quadrant” or“matrix” analysis. Figure 7.3 shows Kenya’s exports by service sector according toa methodology developed by the International Trade Centre to assess export per-formance. The horizontal axis indicates the evolution of Kenya’s share in worldtrade for each service sector, measured as the compound annual growth rate ofKenya’s share in the world market of that particular sector. The vertical axis indi-cates average world trade growth for each product category and is measured as the
240 Exporting Services
Table 7.1. Service Subsectors as a Share of Total Service Exports, 1998–2008
Service subsector
Share of total service exports (%)Growth rate,
1998–2008 (%)2005 2006 2007 2008
Transport 39.2 40.7 38.6 39.5 4.8
Travel 30.8 28.3 31.3 23.1 1.7
Communication 9.4 11.7 11.2 13.4 12.9
Finance and insurance 0.6 0.3 0.3 0.3 –0.9
Computers and IT 0.1 0.0 0.0 0.0 –1.1
Royalties and licenses 0.9 0.4 0.8 1.0 5.6
Source: Authors’ calculations based on International Monetary Fund balance of payment statistics.
Table 7.2. RCA in Kenyan Service Subsectors, 2008
Service subsector RCA
Transport 3.56
Travel 1.82
Finance and insurance 0.06
Communication, computers, and miscellaneous 1.13
Source: Authors’ calculations based on International Monetary Fund balance of payment statistics.

compound annual growth rate of world imports. The size of a balloon representsthe weight of the sector in Kenya’s export basket.
This type of analysis can indicate whether export sectors have registered adynamic, stagnant, or declining performance over the four-year period 2004–08.Figure 7.3 is best interpreted as allowing the identification of the service sectorsthat have, in the recent past, seized the opportunities offered by world marketsand those that failed to do so. This analysis could be a starting point for identify-ing sectoral or countrywide policies or policy reforms to help underperformingsectors and strengthen successful ones. Specifically, the sectors located toward theupper right corner are considered “champions,” where Kenya has gained marketshare and where world trade growth was the strongest, whereas the sectors locatedtoward the bottom left corner are “sluggish” sectors, where Kenya is losing marketshare and world demand is declining. The matrix analysis in figure 7.3 suggeststhat the communication sector has performed very well, whereas the finance andinsurance sector has underachieved given the global growth of that sector.
One area that Kenya can focus on is service offshoring as a way to develop strongservice firms for domestic consumption and international export. A decelerationin the growth of Kenyan service exports occurred in 2007–08 because of the post-election violence and the global financial crisis. BPO, nonbanking financial, and
The Case of Kenya 241
Figure 7.3. Kenya’s Export Performance: Service Trade, 2004–08gr
owth
in w
orld
tra
de b
y se
ctor
(%
)
finance and insurance
–15 –10 –5
royalties
computers andinformation technology
transportcommunication
government
travel
–5
0
5
10
15
20
5 10 15 20 250
growth in Kenya’s share in world trade (%)
Source: Authors’ calculations based on International Monetary Fund balance of payment statisticsfollowing the methodology described in ITC 2006.

freight-forwarding services, were particularly affected. Nevertheless, Kenya’spotential for offshoring is vast—particularly in the areas of information technol-ogy (IT), BPO, and knowledge process outsourcing (KPO). Figures 7.4 and 7.5illustrate the types of IT, BPO, and KPO services that can be offshored. Figure 7.4provides detailed lists of the types of services that can be outsourced, and figure 7.5details the types of activities that can be outsourced across an organization’s valuechain. As mentioned previously, recent studies suggest that a potential 18 millionnew jobs may be created in developing countries by offshoring, and each new jobcould create a further three jobs in the rest of the economy. However, severalimportant challenges need to be addressed for Kenyan exports of business servicesto grow.
Countries tend to develop their business service sectors incrementally, eachstep allowing the country to attain a higher value added as service sectors gainmore experience and exposure to international competition. Figure 7.6 outlinesthe progression of service sector development, from basic staff augmentationservices, such as back-office functions, which would require a Kenyan serviceprovider to take on most or all of the risk, to transformational sourcing, whichwould allow the Kenyan service provider to provide world-class innovation, com-pete internationally, and possibly even expand to other countries.
Although most developing countries’ service sectors fall toward the bottomof the progression, Kenya is somewhat of an outlier because of its handful ofinternationally successful, innovative, and competitive firms, such as KenCalland Safaricom. In Kenya, the large majority of service firms are clustered in thebottom two segments (staff augmentation and low-value offshoring), but sev-eral world-class firms are at the top end of the progression. Therefore, Kenya’seconomy could reap substantial gains from expanding the number of exportingfirms and the number of firms that progress to the higher-value offshoring andpartnership segments.
The remainder of this chapter first describes the characteristics of the pro-fessional service exporters in Kenya on the basis of an in-depth study of 52exporters, including their export strategies. Second, the key challenges faced bycurrent and potential exporters of professional services are identified. Third,the chapter proposes policy recommendations to address the challenges thatwill help establish Kenya as a desirable offshoring destination for internationalclients.
Kenyan Service Exporters’ Characteristics
Kenyan service exporters come in all sizes, but the majority employ fewer than 100workers. Most of these workers are permanent, except in the BPO sector, where
242 Exporting Services

Figure 7.4. IT, BPO, and KPO Services
IT outsourcing
IT help deskDesktopsupport
Data center operationsServer and storagemanagementNetwork operationsVoice servicesApplicationdevelopmentApplicationmaintenance
Colocation
Procure to payOrder to cashRecord toreport
Accounts payable/accounts receivableCollectionsFixed assetsTreasuryCash managementFinancialplanning
AnalyticsTax andcompliance
Expensemanagement
RecruitmentCompensationBenefitsadministrationPayroll
Human resourceinformation systems
Employee datamanagement
Workforcemanagement
TrainingOutplacementTravelmanagement
Customer serviceCustomer relationsCustomer acquisitionOperationssupport
CustomerrelationshipmanagementsupportOutboundtelemarketing
Specialty helpdesk
Source to paySourcing supportSupplier researchSupplier trainingContractmanagementMarketintelligenceProcurementanalytics
SpendanalysisPerformancereporting
Shared services
Projectmanagement
office
Vendormanagement
office
B2C e-Retail SiteBusiness tobusinessContentmanagementWeb designCommunityAnalyticsMarketingWeb hostingFulfillmentWarehousemanagement
BPO
Finance andaccounting
Humanresources
Customermanagement E-commerce
End-to-end shared services capabilities
IT
Businessintelligence
Marketresearch
InsuranceFinancialservices
Industryanalytics
Consumer goodsanalytics
Marketing Support
KPO
KnowledgeProcessing
Law firm backoffice
Corporatelegal
Documentreview
Intellectualproperty
Contractmanagement
Compliance
LegalProcessing
Procurement
Enterpriseresource planningsystems
Source: Avasant 2010. 24
3

Figure 7.5. Types of Activities That Can Be Outsourced across an Organization’s Value Chain
Finance and accounts
Product development
Human resource management
Technology services
Inbo
und
logi
stic
s
Man
ufac
turin
gan
d op
erat
ions
Out
boun
dlo
gist
ics
Mar
ketin
g an
dsa
les
Cus
tom
erse
rvic
e
• Order tracking• Order, claims and application processing• Payment processing
• Clinical research
• DSP chip design• Avionics research
• VLSI design
• Engineering design services• Legal research
• Backoffice
• Financial reporting
• Accounts payable/receivable
• Financial accounting• Revenue accounting
Operations and logistics
Research, design, anddevelopment
Finance and accountingHuman resources
• Payroll processing• Recruitment and selection support• Human resources information services
• Custom development• Systems integration• Hosting and maintenance• Customer help desk and support
IT services and support
• Telesales
• Customer service and complaints
• Order processing
• Help desk
Sales, marketing, andcustomer service
Source: Avasant 2010.
244

Figure 7.6. Evolution of Business Service Sectors
Staffaugmentation:Back-officefunctions (riskstays withserviceprovider)
Low-valueoffshoring: Costarbitrage, skills gapmanagement
High-valueoffshoring: Higherskilled functions(productdevelopment, researchand development, andso on)
Partnershipapproach: Businessventures with firms indeveloped countriesand success-basedsharing
Transformationalsourcing: Leveragingof global sourcing toachieve innovationand business change
Source: Adapted from Avasant 2010.
24
5

firms tend to keep a reserve of 20 percent of nonpermanent staff members toenable them to respond quickly should they face a sudden increase in exportorders. The majority of service exporters are 100 percent Kenyan owned.
Because the phenomenon of service exporting is new in Kenya, the majority offirms have fewer than 10 years of exporting experience. Only firms in freight forwarding and Kenyan affiliates of large multinational companies providingaccounting and legal services (such as Ernst & Young or Hamilton Harrison &Mathews) have longer experience in export markets.
The subsectors with greatest export turnover totals are insurance, account-ing, nonbanking financial services, and BPO services, as shown in figure 7.7.However, for most Kenyan service exporters, export turnover represents a smallproportion of total turnover. The exceptions are freight forwarding and BPO,where large shares of turnover come from exports, followed to a much lesserdegree by accounting and ICT and IT-enabled services (ITeSs). The generalinward orientation of service sectors that consider the domestic market as theirprimary target for growth is not a Kenyan phenomenon but rather a stylizedfact verified across countries; India is perhaps the only exception (Breinlichand Criscuolo 2010).
Modes of Delivery
Almost all surveyed Kenyan service exporters deliver some of their exportsthrough cross-border supply (mode 1), whereby the service crosses the border,for example, by means of faxing, couriering, or e-mailing of reports and otheroutputs.2
Service exports delivered through the movement of natural persons (mode 4)are also quite prevalent, occurring for 60 percent of the surveyed exporters inKenya. Movement of professionals is often seen, particularly in the East Africanregion, in the architectural and engineering sectors. Kenyan engineering firmshave projects in Rwanda, Southern Sudan, and Uganda, and engineers travel regu-larly to work at those sites. Accountants must also travel to the destination coun-try to conduct audits.
Commercial presence (mode 3) is used by 44 percent of the surveyed Kenyanservice exporters to deliver services abroad. Firms in the freight-forwarding sectorhave small satellite offices at main border points or in major markets such asUganda. Insurance companies must have affiliate presence to be able to sell theirservices in other countries. Firms in the BPO, ICT, and ITeS sectors often havesales subsidiary offices in foreign markets.
The least used mode of supply by Kenyan service exporters is consumptionabroad (mode 2). This mode is used by accounting, nonbanking financial service,
246 Exporting Services

Figure 7.7. Export Turnover of Service Sectors, 2007
0
2
4
6
8
10
12
14
16
18
20
legal
servi
ces
acco
untin
g se
rvice
s
arch
itectu
ral s
ervic
es
cons
ulting
engin
eerin
g se
rvice
s
med
ical s
ervic
esde
ntal
servi
ces
nurse
s
ICT c
onsu
lting
servi
ces a
nd IT
eSs
busin
ess p
roce
ss ou
tsour
cing
adve
rtisin
g se
rvice
s
mar
ket r
esea
rch se
rvice
s
busin
ess a
nd m
anag
emen
t con
sultin
g se
rvice
s
quan
tity s
urve
ying
servi
ces
educ
ation
servi
ces
bank
ing se
rvice
s
nonb
ankin
g fin
ancia
l ser
vices
shipp
ing an
d fre
ight s
ervic
e
othe
r ser
vice s
ubse
ctors
US$
mill
ion
insur
ance
servi
ces
Source: Government of Kenya and EPC 2008.
24
7

or legal service firms facilitating foreign client site visits for mergers and acquisitionswork or during initial public offerings. Also, legal firms often represent foreignclients; for example, a tourist may have an accident in a hotel and sue the hotel, or aforeign client may require family law services related to adoption or marriage.
Export Clients and Destinations
Kenyan firms export services to a variety of markets; as many as 40 different coun-tries were reported as export destinations by the 52 firms interviewed for thischapter. The regional markets of the East African Community (EAC)3 tend todominate the export flows of Kenyan professional service firms. More than half ofKenyan service exporters have clients in Tanzania or in Uganda, and about a thirdhave clients in Rwanda. Almost a quarter of firms have clients in Sudan and inEuropean countries (other than the United Kingdom), and a fifth of firms exportservices to South Africa. Because of language barriers, Kenyan legal firms tend torestrict themselves to English-speaking export destinations. Interestingly, dur-ing the recent global financial crisis, the need for Kenyan service exporters todiversify became apparent. Exporters needed to serve clients not only in devel-oped countries but also in African markets, because the African countries wereinsulated from the global financial crisis and actually saw growth in business.Figure 7.8 presents the distribution of the 52 interviewed service exportersacross export destinations.
Kenyan firms export services to a variety of clients. Multinational and privatecorporations are the main clients for more than half of Kenyan exporters, particu-larly those operating in the insurance, BPO, nonbanking financial, ICT, andfreight-forwarding service sectors. Multinational aid organizations, nongovern-mental organizations, and embassies are the key clients for a fifth of Kenyanexporters, particularly in the accounting and engineering sectors. Governments orquasi-governmental institutions are key clients for firms in the architectural, engi-neering, and ICT sectors because of the presence of large government-fundedinfrastructure works in the region.
In general, BPO, ICT, financial advisory, and logistics services are typicallyexported outside Africa. The other business services are typically exported toother East African countries. The strength of regional markets is crucial forexports of accounting, architectural, engineering, insurance, and legal services.However, the United Kingdom and the United States are the most importantmarkets for Kenyan exporters in the BPO sector. In the freight-forwarding, ICT,ITeS, and nonbanking financial sectors, Kenyan firms export to a combination ofregional markets and international markets outside Africa. Table 7.3 summarizesthe typical export destination by service subsector.
248 Exporting Services

24
9
Figure 7.8. Service Exporters’ Target Markets
Uni
ted
King
dom
othe
r Eu
rop
ean
coun
trie
s
Can
ada
and
Uni
ted
Stat
es
Uga
nda
Tanz
ania
Rwan
da
Buru
ndi
Suda
n
Sout
h A
fric
a
Som
olia
Zam
bia
Ethi
opia
othe
r A
fric
an c
ount
ries
Uni
ted
Ara
b Em
irate
s
Gul
f sta
tes
othe
r M
iddl
e Ea
ster
n C
ount
ries
Indi
a
Chi
na
Aus
tral
ia
othe
r A
sian
cou
ntrie
s
Sout
h A
mer
ica
Europe andNorth America
0
10
20
30
shar
e of
exp
orts
to
sele
cted
cou
ntrie
s (%
)
40
50
60
70
East AfricanCommunity
other African countries
Africa Middle East Asia SouthAmerica
Source: EPC and World Bank 2009.

Exported Services and Customization
Given the intangible and heterogeneous nature of service exports, it is of interestto consider some concrete examples of what Kenyan firms are exporting in theaccounting, architectural, BPO, ICT, ITeS, and legal sectors. In accounting, Kenyanfirms export accounting, tax, consulting, and auditing services. Auditing is sup-plied mostly to organizations with branches in the EAC or worldwide. Such workrequires travel to the country where the project is located. In architecture, Kenyanfirms provide consulting services such as master planning, urban planning, landuse planning, site planning, interior planning, and project management. In BPO,Kenyan firms export an array of services, including the following: (a) inbound-outbound customer voice, e-mail, or short message service support; (b) inboundand outbound sales via phones; (c) customer satisfaction surveys; (d) back-officesupport; (e) database management, such as updating changes to information por-tals or live updates of stock markets, providing safe data storage and backup facil-ities, transcribing from voice to text, or subtitling videos; and (f) entertainment orprofessional service chat support. In the ICT and ITeS sectors, Kenyan firmsexport design services such as animations of Web advertising, user interface sys-tems, and icon and banner advertisements. They also provide high-end corporatewebsites such as intranets (which allow collaboration and communication withinan organization) or extranets (which allow customers to log in and view state-ments securely), as well as technology solutions such as hardware and disasterrecovery. In legal services, Kenyan firms essentially export intellectual property,licensing requirements, and commercial and conveyancing services. Such servicescould pertain to due diligence in the purchase of property in Kenya or to mergersand acquisitions work.
250 Exporting Services
Table 7.3. Typical Export Destinations, by Service Sector
Service subsector Typical export destination
Accounting EAC
Architecture EAC
BPO United Kingdom and United States
Engineering EAC
Logistics Global
ICT EAC, Europe, and United States
Insurance EAC
Legal services EAC
Financial services Global
Source: EPC and World Bank 2009.

To suit client demands, the services exported by Kenyan firms are subject tosome degree of customization relative to the services sold domestically. How-ever, the degree of customization is minimal. For example, in the architecturaland engineering sectors, a change in measurements from the metric systemmay be necessary for U.S. clients. Another example of customization in thearchitectural sector is the provision of highly detailed drawings to foreignclients that are generally not required by Kenyan clients.4 In engineering serv-ices, customization occurs through the use of the appropriate computer-aideddesign (CAD) system (because some, mainly U.S., clients use MicroStationwhereas others use AutoCAD). In insurance services, Kenyan firms exportingto Sudan changed their focus from private vehicles, for which insurance is notmandatory in that country, to public service vehicles, for which insurance ismandatory and which therefore constitute a much larger market. In nonbank-ing financial services (stockbroking and investment banking services), some ofthe changes made to exported services are to customize foreign clients’ report-ing structures (for example, the need for daily reports). Finally, a generalchange to service delivery made for exports relative to domestic sales concernscommunication skills, because the bulk of communication for exports occursthrough e-mail. Employees of Kenyan exporters are trained on how to commu-nicate effectively by telephone and e-mail, thereby enabling them to efficientlydeliver export services. Table 7.4 provides details on the customization ofexported services by Kenyan firms across service subsectors.
The Process of Exporting: Starting to Export and Sustaining Exports
The majority of Kenyan exporters of services do not set specific or consciousobjectives to enter foreign markets. Instead, they follow their clients as thoseclients enter foreign markets, or they are referred to foreign clients, who contactthem directly. An example of the first type is when a major client of a service firmin the Kenyan market expands its services to Tanzania and the Kenyan servicefirm continues to provide services for that client in the new country. An exampleof the second type is when an existing U.K. client of a Kenyan service exporterrefers a potential U.K. client with some needs for work in East Africa to theKenyan exporter.
Most firms undertake a preliminary screening of the target export marketusing informal means, such as Internet research and business contacts’ knowl-edge of the target market. Larger and more established Kenyan firms select tar-get export markets systematically, basing their entry decisions and strategies onprofessional, in-depth market research. In some cases, large firms rely on in-house
The Case of Kenya 251

Table 7.4. Exported Services, by Sector
Subsector Domestic services Modifications to domestic services to make them exportable
Accounting Accounting servicesAudit and assurance servicesTax servicesConsulting services
Modifications are made with respect to tax regulations in the foreign country andthe client firm’s accounting program. For work on donor-funded projects, Kenyanfirms can conduct technical and social audits that include project impactassessments.
Architecture Urban planningLand use planningSite planningProject management
Only slight modifications are made. Foreign clients often want more detailed designsthan do local clients, more work is done through e-mail, and projects must adhereto regulations in the client’s country.
BPO Inbound and outbound salesCustomer satisfaction surveysBack-office supportDatabase managementTranscriptionTechnology support
All services can be exported. Delivery of exported services can be fully conductedonline (mode 1). However, employee training must be up to international standards,including developing strong customer service skills and teaching employees how tospeak with a neutral accent.
Engineering Engineering consultingEnvironmental impact assessmentsConstruction materials testing
Specifications are changed for the client country. Units in drawings are converted,depending on whether measurements in the client country are based on theimperial system (feet and inches) or metric system (meters and centimeters).Drawing text must be translated if in a different language than the client’s.
Freightforwarding
Customs brokerageDocumentation processingLogistics planning (transportation,warehousing, material handling, or actingas a shipping agency or cargo depot)
Small modifications are made when exporting, such as adapting to changingregulatory requirements. An additional service that is provided to foreign clients inwalking them through the numerous Kenyan documentation processes andprocedures.
252

ICT Digital design for Web advertisingAdvanced technical supportWebsite solutions and designWeb-based marketing
ICT services are typically exported by telecommunications (mode 1). Employeesmust be able to communicate effectively through e-mail and often must receivecomputer training.
Insurance Insurance products (general, life, crop,health, microinsurance)PensionsAsset management
Services are tailored to individual client countries and markets. For example, privatevehicle insurance is not mandatory in Sudan, whereas the public vehicle insurancemarket is quite large. These types of dynamics will alter the way firms marketinsurance products.
Legal services Corporate and commercial lawIntellectual propertyFamily lawCriminal lawLegal advisory services
All services can be exported as long as the lawyer is registered and admitted to theforeign bar association. Services pertaining to Kenyan law do not require registrationin the country of export. Modifications to services are small and generally have to dowith the way documents are presented, especially regarding court documents.
Nonbankingfinancialservices
Private equity and venture capital(investment, guidance, and strategy)Investment bankingStockbroking
Some clients have their own specific standards because of global regulations andoversight from headquarters, and services may be altered to adhere to these factors.For mergers and acquisitions advisory services, modifications are made on a case-by-case basis.
Source: EPC and World Bank 2009.
25
3

market research done across countries of operation that is then pooled andshared among subsidiaries. But for smaller firms, no organized or systematicassessment is made to determine the exportability of their services and the via-bility of target export markets.
To obtain new foreign clients, Kenyan firms pursue a wide array of marketingmethods. Referrals from foreign clients who contact Kenyan service firms directlyconstitute the most widely used method, particularly in the accounting, architec-tural, engineering, freight-forwarding, and legal sectors. In the accounting, freight-forwarding, and legal sectors, some firms have joined international networks thatrefer clients exclusively to network members operating within any given region.5
In the BPO, ICT, and ITeS sectors, firms often make use of commission-paidagents in foreign markets to source work. Marketing and advertising efforts alongwith personal client visits are another way that Kenyan service firms obtain for-eign business. However, these efforts are prohibited for firms in the accounting,legal, architectural, and engineering sectors.
Tendering in competitive bidding processes for government and donor work isanother important way that Kenyan firms in the accounting, architectural, andengineering sectors obtain foreign contracts. Very rarely do Kenyan service firmsreceive their foreign clients from the head office or the parent company. Hence,subsidiaries in Kenya operate rather autonomously and are required to developtheir own markets and client base.
In some cases, after exporting to a foreign country for some time, a Kenyanservice firm may identify new niche areas and underserved markets in that coun-try. Often the new service complements the one that the firm originally exportedto the foreign country. For example, a Kenyan architectural firm operating inRwanda originally offered architectural services but recently ventured into projectmanagement and property development after recognizing Rwanda’s limiteddomestic resources in those fields.
Given the heterogeneity in the types of services provided across professionalservice sectors, providing a uniform description of how the export transactionhappens is difficult. Box 7.1 provides examples of the step-by-step process thatfirms go through when exporting their services in the BPO and architecturalsectors.
Most Kenyan firms are able to negotiate some of the terms of their exportcontracts with foreign buyers, such as length of the assignment, but generallythey cannot negotiate price. In the BPO sector, however, firms have less supplierpower, and thus the terms of the contracts are largely imposed by foreign buyers.Contracts tend to include penalty clauses for delays in delivery, particularly in theengineering and architectural sectors.
254 Exporting Services

In certain professional service sectors, small and medium-size Kenyan firmsneed to partner with larger firms to engage in exports. For example, in theengineering sector, smaller firms often work as consultants to large firms;hence, although these smaller firms do not have the capital or capacity to dolarge projects on their own, they are able to participate in such projects.
The Case of Kenya 255
Box 7.1: Description of Export Transactions
BPO Services
Following are the steps that BPO service firms follow in exporting services:
1. Initial client engagement. 2. Evaluation by client—the foreign client assesses the Kenyan firm (for example,
listens to contact agent voices and assesses data skills in transcription, formediting, typing speeds, and accuracy).
3. Negotiation of contract and payment terms.4. Pilot contract stage—each job requires specific product knowledge, and the
pilot contract is a training period that typically lasts one to two weeks.5. Award of contract and work commencement.
Work is conducted entirely in Kenya and delivered by mode 1.
Architectural Services
Exporting architectural services usually requires the following steps:
Phase 1: Design
1. Initial client engagement—the Kenyan firm meets the client, explains its workingmethodology (often outlined in the company profile), and proposes an outline ofthe project.
2. Preparation of a proposal and concept sketch.3. Formal approval by the client.4. Design preparation.5. Delivery of design.
Phase 2: Construction
1. Filing of design with the relevant authorities—usually skim drawings are filed atthe local authority that are not as detailed as working or construction drawings.
2. Acquisition of work permits and registration in the foreign country.3. Supervision of work until completion.
Work for phase 1 can be conducted entirely in Kenya and is delivered by mode 1(documents are couriered to the client). Work for phase 2 is delivered by mode 4because it needs to be conducted in the foreign country.
Source: EPC and World Bank 2009.

Service Exports: Success Stories
Accounting is one sector that provides important export opportunities for Kenyanfirms. As a result of widespread adoption of International Financial ReportingStandards (IFRS) across developed and developing countries, the demand foraccountants proficient in IFRS has been growing. Kenya was among the firstcountries to adopt IFRS and thus has a supply of accountants who are proficientand experienced in IFRS (World Bank 2010b). Kenya has been able to capitalizeon this comparative advantage by exporting high-end accounting and auditingservices through mode 4: its accountants often travel to provide services in coun-tries that have recently adopted IFRS and that have a deficit in skilled and experi-enced IFRS professionals.
Kenya has also developed a reputation and specialist expertise in the marketniche of marine and underwater consulting engineering services. As such, Kenyahas been able to target export markets that need such specialized skill but lackdomestic professionals who can provide it. The development of this very special-ized and unconventional sector in Kenya is interesting because it shows the diver-sity of services that can emerge as potential exports.
Kenyan firms with premium pricing strategies have been able to offer special-ized or niche services (such as the provision of CAD drawings by architectural andengineering firms), and they have developed new ways of providing existing serv-ices (such as the provision of recurrent online job advertising sites by ICT andITeS firms to replace traditional newspaper job-seeking advertisements). Firmswith premium pricing strategies have also been able to offer customer service thatcaters to demanding foreign clients (for example, meeting a one-hour inquiryresponse policy in the ICT and ITeS sectors or providing detailed financialresearch reports in the nonbanking financial sector). Box 7.2 describes in detailKenyan firms with great success in providing IT-related services.
Overall, the recent success of Kenyan service exporters has occurred at both theregional and international levels. At the regional level, Kenyan firms are premium-quality service providers, especially in countries lacking skilled professionals.Kenyan firms are perceived as superior and offer better services than localcounterparts, but at lower rates than providers from developed countries orcountries outside the region. Moreover, Kenyan firms have a competitive advantagein understanding target markets in East Africa because of their knowledge of soft, orcultural, issues such as the slow pace of conducting business or the insistence onface-to-face meetings. Service firms from South Africa and developed countries thatdo not possess such skills have failed in their attempts to penetrate these markets.
At the international level, Kenyan firms are value service providers; that is, theyare able to provide quality services at lower cost than local service providers in theforeign market. Competitive pricing has been a key factor in the growth of Kenyan
256 Exporting Services

The Case of Kenya 257
Box 7.2: Kenyan Services Exporters’ and Innovators’ Success Stories: KenCall,Txteagle, Ushahidi, and Safaricom
KenCall
A Kenyan firm that has been very successful in exporting higher-value-added BPOservices to developed countries is KenCall. The firm specializes in providing outboundand inbound voice and data services for large Western companies. The firm beganwith outbound voice services, such as developing sales leads and doing postsale callswith customers, but now has added business in the more lucrative data and inboundvoice services. As the Harvard Business School case study by Isenberg (2009, 7) onKenCall explains, the inbound voice category includes a range of services that requirea level of skill with customers, such as “1-800 sales lines, customer service, help desk,hotlines, complaints, and emergency (911-type) services.” According to KenCall, theservices the firm offers include sales, billing, customer information, administrative anddata management, and level 1 tech support. For its tech support business, KenCall’semployees are certified by Cisco and Microsoft, among other ICT providers. Becauseof its success in this range of services, KenCall has been able to export its servicesglobally. As Kenya further increases the quality of its telecommunication infrastructure,in particular with fiber-optic cable connectivity, KenCall will likely be able to expand itsbusiness further, and other Kenyan firms may be able to enter the BPO service sector.
Txteagle
Txteagle is a U.S. firm that developed an innovative technology that enablesorganizations, through Txteagle’s platform, to compensate mobile phone users forproviding valuable information that would not otherwise be collected. The companyis able to tap into a network of 2.1 billion phone numbers in 80 countries around theworld. Mobile users tend to spend a large portion—about 10 percent—of theirincome on airtime. If Txteagle lowers this percentage by compensating mobilephone users with airtime, their disposable income will increase and could act as a defacto “pay raise” for millions or even billions of people.
Txteagle has close ties to Kenya, where the firm’s founder has helped train a newgeneration of Kenyan computer scientists. For example, one Kenyan entrepreneurcreated a system through which electricity bills can be prepaid through a mobile phone.Other Kenyan computer scientists are focused on using mobile phones to providevaluable local services that cannot easily be outsourced or can only be done at high cost,such as polls and surveys in rural areas, sentiment analysis, and market research forinternational firms and organizations. Although not all of these technologies will beimmediately exportable, innovative Kenyan entrepreneurs are well placed to be on thecutting edge of new game-changing mobile technologies.
Ushahidi
Another innovative Kenyan organization that has had international success is thenongovernmental organization Ushahidi. Ushahidi developed an open-source softwareplatform through which anyone with a mobile phone or digital connection can collect,place, and visualize information on an online map in near-real time. The online mapcan then be viewed by anyone with an Internet connection and a computer, allowingdetailed information about geography and events to be shared and transferred.Ushahidi’s software has been used around the world in a diverse array of applications.It was used first to track violence after the 2008 Kenyan elections and has since been
(Box continues on the following page.)

service exports, and it is due to the much lower costs of living in Kenya relative tomost developed countries. For example, the pay that would afford a middle toupper-middle quality of life for a programmer in the United Kingdom is threetimes as high as the pay that would afford the same quality of life for a program-mer of equal skill in Kenya.
Also, Kenyan service exporters have proven able to ensure business continuity anddelivery of continued high-quality service even under difficult conditions. For exam-ple, one BPO firm put in place a dormitory and catered food for contact center agentsto continue servicing clients during the period of postelection violence in Kenya in2007–08. The firm has now developed a disaster management and recovery systemthat is shared with foreign clients to reduce fears of political risk.
Large service firms that have been operating in Kenya for many years have builtconsiderable brand equity: for example, Ernst & Young in accounting services or
258 Exporting Services
used to observe wildlife patterns in Kenya, monitor elections in India, track violence inGaza and crime in Atlanta, avoid hazards during the 2010 blizzard in Washington,D.C., and coordinate the cleanup of the U.S. Gulf Coast oil spill, among others. Thesuccess of Ushahidi in disseminating its software platform globally shows that Kenyanfirms compare positively with larger firms around the world in terms of innovation andwill be able to compete more vigorously as Kenya’s potential for exporting higher-value-added services becomes better known internationally.
Safaricom
Safaricom is a groundbreaking mobile service provider that innovated and developedone of the largest mobile money systems in the world, called M-Pesa. The M-Pesasystem has helped greatly to expand access to finance in Kenya, especially among thepreviously unbanked. In 2010, M-Pesa accounted for a large proportion of the estimatedUS$7 billion (20 percent of GDP) transferred via mobile phones, and since its rollout in2007, Safaricom has grown at a staggering pace, signing more than 13.5 millioncustomers in that time. Originally M-Pesa allowed money to be transferred onlyelectronically using a mobile phone and an extensive network of agents around Kenya,but M-Pesa has now expanded further from a transfer system to a direct paymentsystem. In addition to transferring or remitting money to family members living in ruralareas of the country, subscribers can use their mobile phones to make purchases fromcommercial partners, including supermarket chains and Kenya Airlines. More recently,Safaricom has developed a new mobile platform called M-Kesha in partnership withEquity Bank, which allows subscribers to access their Equity Bank saving accountsthrough their mobile phones. The success and influence of Safaricom and M-Pesademonstrate that appropriate government regulations and strong business strategiesgeared toward growth can lead to success and international prestige for Kenyancompanies.
Sources: Giridharadas 2010, Isenberg 2009, www.safaricom.co.ke, www.txteagle.com, www.ushahidi.com.
Box 7.2: Kenyan Services Exporters’ and Innovators’ Success Stories: KenCall,Txteagle, Ushahidi, and Safaricom (continued)

Hamilton Harrison & Mathews in legal services. Younger service firms are con-stantly building their brand equity and reputation by striving to win awards such asthe Financial Reporting (FiRe) Award of Institute of Certified Public Accountantsof Kenya, Business Daily’s awards for the top 100 small and medium-size enter-prises, or technology service partner international awards (Microsoft Partnerawards). Brand equity is a competitive advantage in acquiring foreign work.
Challenges for Kenyan Service Exporters
An examination of the challenges facing Kenyan business service firms helps iden-tify the factors that firms see as the key constraints to exporting. The factor thatconstrains most service providers from exporting is a widespread lack of knowl-edge about exporting opportunities, markets, and processes and a lack of aware-ness about how to acquire such knowledge.
This dynamic is demonstrated by the surveys conducted for this chapter, whichshow that 48 percent of the surveyed Kenyan service exporters do not have a planfor exporting, and 54 percent of the surveyed exporters do not conduct any mar-ket research before exporting. This finding indicates that although Kenyan serv-ices firms may be innovative and successful domestically, many do not engage inany systematic attempt to export their services. Similarly, if nearly half of Kenyanexporters do not have an export business plan, then likely many other firms donot export but would be able to do so if given the opportunity. In the context ofincreasing Kenya’s exports of business services, this dynamic is an important con-straint that must be overcome rapidly.
Very often, Kenyan service providers—especially smaller ones—lack interna-tional networks and find obtaining market intelligence on foreign markets verydifficult. For example, they do not know the largest firms in each sector, the taximplications of exporting, or the key contacts that would allow them to accessopportunities. Kenyan service firms are also very unaware about what trade sup-port services are available from the government, such as the institutions that sup-port trade and services they offer. For example, surveyed exporters were unclearabout the activities and role of the Kenya Chamber of Commerce.
Another important constraint identified by the surveyed firms is difficulty inpenetrating foreign markets. Partially this difficulty is caused by the trade anddomestic regulatory restrictions faced by Kenyan firms in local and foreign mar-kets. But the global perception about Kenya—if not negative, at least not posi-tive, especially given the political turmoil during the 2008 election—also acts asa disincentive for potential clients to work with Kenyan service exporters.
Current and potential Kenyan service exporters face a series of regulatory bar-riers that affect their operations and export opportunities. Surveyed firms men-tion tax-related restrictions, excessive procedures and licensing requirements to
The Case of Kenya 259

operate in Kenya, outdated sector-specific regulatory measures, and sectoralrestrictions (such as advertising prohibitions in accounting, architectural, engi-neering, and legal services). Also, burdensome requirements on academic andprofessional qualifications and licensing requirements for individuals providingthe service can restrict entry into foreign markets.
Kenya has low international brand equity as a business service provider. TheKenyan government, in contrast to its Indian or South African counterparts, forexample, does not sponsor international conventions or events to showcase theBPO services available in Kenya. The foreign perception of Kenya’s government asunstable also plays a negative role and is likely to deter foreign companies fromoutsourcing work to Kenyan BPO providers. However, Kenya does have high visi-bility as a business service provider in the EAC.
Skill mismatches and skill shortages pose a significant challenge to many Kenyanexporters. Although Kenya is relatively well endowed with graduates who couldwork in various business service firms, including firms in the BPO sector, fresh grad-uates need to receive a substantial amount of training to catch up with marketrequirements. Such training costs make up a substantial part of BPO contact centercosts. Similarly, in the ICT and ITeS sectors, Kenyan graduates in programming areof good quality, but they lack skills in terms of the practicality of exporting theirservices, the exposure to a foreign environment, and the promotional expertise.
In the engineering sector, an acute shortage of professionals exists relative tolocal demand, particularly in mechanical engineering. In the insurance sector,training in technical skills is very low. Finding individuals with the necessary skillsis so difficult that insurance firms spend considerable time on in-house trainingand sponsoring staff members to attend courses.
In the legal sector, Kenya has many lawyers, but the grasp of the law for mostgraduates is very theoretical, and few lawyers are qualified to export legal services.In small law firms, in particular, the skills needed for exporting services (such asexperience in other jurisdictions and work experience with multinational organi-zations) are very rare.
Another frequently mentioned constraint by the surveyed firms is a lack of ICTinfrastructure. This constraint is being overcome, however, by the two underseafiber-optic cables that have recently given Kenya access to a high-speed Internetconnection.
Policy Recommendations
The government of Kenya is well aware of the need to diversify its export base byboosting professional service exports. Going forward, the government can,through its trade-supporting institutions and in collaboration with business and
260 Exporting Services

professional associations and the private sector, develop a service export strategyand play an important role in helping to reduce the barriers that Kenyan servicefirms face in their export development efforts.6
However, most Kenyan service exporters feel that direct incentives to exportssuch as tax incentives are unnecessary. Rather, what they consider to be crucial isfor the government to facilitate access to foreign markets. Such facilitation wouldlead to an increase in employment, upgrades in the technology used, and improve-ments in the quality of services delivered to meet high international standards.
Possible policy actions for the government of Kenya are summarized in table 7.5and described in more detail in the subsections that follow. Box 7.3 provides detailson how South Africa developed its BPO sector.
Address lack of knowledge about export opportunities
The government of Kenya, through the Export Promotion Council (EPC) and incollaboration with business and professional associations, can play a crucial rolein reducing the information asymmetries about service exports affecting bothKenyan service firms and their foreign clients. Following are several ways in whichthe informational barriers to exports can be addressed:
• The EPC could collect and disseminate to Kenyan service firms marketresearch information (for example, country profiles, sector rules and regula-tions, tax issues, and general working conditions in foreign markets) andhighlight available opportunities for service exports. The EPC could establishlinks with other international trade support institutions to create a greater
The Case of Kenya 261
Table 7.5. Policy Recommendations
Address lack of knowledgeabout export opportunities
Address regulatory andbranding issues
Address skill mismatchesand skill shortages
• Collect and disseminatemarket researchinformation.
• Develop trade directoriesof Kenyan serviceproviders to be used formarketing to foreignfirms.
• Encourage Kenyan firms’participation ininternational expositions.
• Enact regulatory reformto address domesticregulatory barriers andencourage regionalregulatory cooperation(free movement of EACnationals, mutualrecognition agreements,common EAC standards).
• Create and marketKenya’s internationalbrand.
• Provide better continuingprofessional education.
• Provide scholarships forfurther training toimprove skills andmarketability of the BPO sector.
• Provide rebates ordevelop incentives forfirms to conductspecialized training.
Source: Authors’ compilation.

262 Exporting Services
Box 7.3: The Experience of South Africa in ITeS Exports
In 2004, the government of South Africa identified the BPO and offshoring part of theITeS sector as one of the high-potential sectors targeted to boost economic growthand reduce unemployment and poverty in the country. In South Africa, servicesaccount for almost 70 percent of GDP. South Africa has a US$960 million annual BPOsector, which is forecast to grow to US$1.9 billion by 2015, according to recent figuresfrom Frost & Sullivan (2010) market research. Because human resources account forthe large majority of the cost base of any BPO service provider, the broad ITeS sectorhas the potential to lift the economic status of a large mass of people.
The Department of Trade and Industry has been the lead institution in developingthe BPO sector in South Africa and drafted the country’s BPO Sector DevelopmentStrategy. In 2005, the Department of Trade and Industry, the Business Trust, and theBPO sector body (Business Process Enabling South Africa) set up the BPO SectorSupport Programme with the assistance of professional service firms to enable actorsin the public and private sectors to work together in establishing South Africa as apreferred location for outsourced business processes. The objective is to create100,000 jobs (25,000 direct and 75,000 indirect) by 2010.
Government assistance and support for the accelerated development of the BPOsector was launched in 2007 and covered several work streams: for example, supportingthe effective marketing of South Africa as a competitive BPO location; developing anddeepening the pool of internationally competitive talent; creating an enablingenvironment of incentives and infrastructure to support the sector; and strengtheningthe sector body to make it capable of mobilizing and representing the key stakeholders,developing BPO in designated areas, and reducing telecommunication prices for BPO.
Some specific initiatives were undertaken under South Africa’s marketing strategyfor the BPO sector. First, market intelligence was gathered focusing on developmentsin the operating environment, and global research was undertaken for the purpose ofstrategy development. Second, broad-based marketing was used to organize outboundmarketing missions and produce of collateral material to support these missions, whiletargeted marketing focused on the creation of a database, the development of keyaccount plans and fact packs for priority targets, the creation of an economic model tobe used by investors to assess return on potential investments in South Africa, and theprovision of support to lead managers for the priority targets. Support was providedfor a number of marketing missions by South African firms to source countries.Additional support was provided to facilitate the entry of the first new major investorsto South Africa.
As a result of these efforts, South Africa has managed to attract, since 2007,some of the world’s top players in the BPO sector: Aegis, which is part of the EssarGroup, one of India’s largest conglomerates; Teleperfomance, which has the largestglobal footprint in the sector, with 249 contact centers, a presence in 47 countries,and services in more than 75 markets and 18 geographically diverse near-shore andoffshore locations; and Genpact, which is a leader in the globalization of servicesand technology and a pioneer in managing business processes for companiesaround the world.
The development of the BPO sector in South Africa did and does face severalchallenges. First, the cost of telecommunications and lack of broadband penetration inrural areas remains an inhibitor to rapid growth in the sector. Although BPO, giventhat it is a new sector, generally faces few formal regulations, it is affected byregulations in related sectors. For example, cross-border BPO services that use VoIP(Voice over Internet Protocol) or private networks may be confronted with restrictionson the use of telecommunication services or requirements that the transmission maybe terminated only on monopoly networks. Such restrictions can raise the cost of

The Case of Kenya 263
performing cross-border BPO and reduce its feasibility. In South Africa, VoIP is legal;however, the local loop remains to be unbundled. South Africa’s broadband costs andconnectivity are becoming less of a concern as more undersea cables landed in thecountry for the 2010 Fédération Internationale de Football Association World Cup,which increased the bandwidth availability.
Second, a steady stream of recent graduates who are ready to work is required asan increasing number of global investors view South Africa as an attractive destination.South Africa needs to draw lessons from countries such as Malaysia and the Philippines,where links have been established between the BPO industry and educationalinstitutions.
Third, to establish a commercial presence to supply BPO services, companies needto adhere to export market regulations and costs associated with establishment,investment, and incorporation in the foreign market, as well as local labor laws andrestrictions on government procurement. Recent perceptions in some countriesabout jobs lost to foreign outsourcing have led to the emergence of laws prohibitingthe outsourcing of public contracts or government procurement of services toforeign firms located abroad. Such laws may also prevent domestic companies fromsubcontracting portions of their government contracts to firms abroad.
Fourth, because South Africa does not offer tax breaks, the country findscompeting with countries that offer such incentives a challenge. However, measuresare in place to circumvent the unavailability of tax breaks by offering substantialincentives related, for example, to training and skills development, which can benegotiated at provincial and local government levels.
Fifth, the perception of difficulties in doing business in Africa remains a criticalchallenge for African countries that aspire to be significant players in the BPO globalmarket. South Africa, in particular, has suffered from the negative perception not onlyof crime but also of rising inflation and the volatility of the local currency.
Sixth, a key challenge experienced is how to ensure that BPO ITeS operators areevenly spread geographically across the country to stimulate economic developmenteven in rural areas.
Some of the lessons learned from the development of the BPO sector in SouthAfrica are that the keys to promoting ITeSs are the crafting of the right policies andstrategies to create an enabling environment to achieve long-term sustainability.Government support is essential from the onset, because the government is able toprovide strategic direction by issuing appropriate policy directives and setting asidethe necessary funding to drive the sector forward. Furthermore, collaboration withprivate sector players is important because they have firsthand experience of thesector and are better able to articulate their needs about the form of supportrequired from the government.
A coherent and nationally coordinated message is imperative; confusion is created ifprovinces within a country each approach potential investors in foreign markets,advancing their own value propositions or advantages over other provinces. Potentialinvestors prefer to have one point of entry, be it an organization or an allocatedaccount manager whom they work with in a country. Equally important is to identifythe key target markets and to have dedicated personnel to present them with a clearand concise value proposition. Because the ITeS sector is fast moving, what was “in”yesterday may not necessarily be the trend tomorrow; this dynamism of the sector hasto be monitored carefully by conducting benchmarking exercises and mapping outcompetition and other country movements. Of utmost importance is that the countrystrategy be anchored on intensive research and be substantiated with accurate factsand figures, because potential investors rely on this information to make decisionswithin a short space of time. Although not strongly articulated, soft issues play a role in
(Box continues on the following page.)

pool of information on business opportunities available in other countries aswell as profile companies that can deliver those services.
• The EPC, in collaboration with business and professional associations, coulddevelop trade directories of Kenyan service firms, including detailed providerprofiles, supply capacities, and key contacts. Such directories should be readilyavailable on the EPC’s website and should be used by foreign missions inKenyan embassies abroad to market Kenyan services internationally. The EPCand business and professional associations could also establish physical or vir-tual business exchanges to increase the marketing of services.
• Business and professional associations should be more active in hostinginternational seminars to educate the industry and increase networkingopportunities for local experts. For this purpose, some capacity building forthe associations is necessary—possibly through a government-supportedprogram—so that they can prepare marketing materials, organize conven-tions and forums, or participate in international forums and conventions tocreate awareness of the skills available in Kenya.
• The EPC could provide financial assistance to Kenyan service firms—especiallysmall firms—in their incursion into international markets, through participa-tion in international fairs and expositions (perhaps through a cooperativeeffort), for example. The EPC should also be able to assist individual Kenyanservice exporters or potential exporters with marketing and branding effortswhen they participate in international expositions (for example, ensure thatKenyan delegations have top-of-the-line display stands).
• The government of Kenya could allow tax exemptions for market developmentcosts such as business trips for marketing purposes or for businesspeople com-ing into Kenya to explore the local potential.
264 Exporting Services
the key decision-making process of investors. Considerations such as cultural affinity,product affinity, business culture, and general professionalism of parties involvedshould never be underestimated. Finally, progress needs to be constantly monitoredand evaluated against set goals to ensure that objectives are met continuously.
South Africa is one of Gartner’s top 30 offshoring destinations, according to arecent report by the research company. The country has the potential to compete withsome of the strongest exporters of BPO. The local population generally has goodlanguage skills, which is essential in this sector because its functionality is based ontelephonic verbal instructions. Business Process Enabling South Africa has highlightedas core focus areas for growth for 2010 and beyond financial services, desktoppublishing, software development, and legal process outsourcing. Reaching thesegoals would ensure that the country moves up to the higher end of the value chain interms of ITeS exports.
Sources: Frost and Sullivan 2010, Gartner 2011.
Box 7.3: The Experience of South Africa in ITeS Exports (continued)

Address regulatory and branding issues
Several domestic regulatory reforms could facilitate Kenyan service exports.7 Lib-eralizing advertising in various professional service sectors would enable currentand future exporters in Kenya to use an important channel for targeting foreignclients. Given the likelihood of strong informational asymmetries, allowing adver-tising that is relevant, truthful, and not misleading, as is currently done inaccounting in Malawi, South Africa, and Zambia, would be the best combinationto protect domestic and foreign clients.
Although Kenyan service firms aim high and would like to become globallyrenowned service providers, achieving such status will take some time. Kenyanservice providers may benefit from the establishment of a strong regional presenceas a stepping-stone for a global presence. The private sector in the region, individ-ual consumers in the EAC, and Kenyan service firms in particular could benefitfrom deeper regional integration in professional service trade, which wouldinclude the following:
• Opening regional boundaries to allow free movement of EAC nationals withoutwork permit requirements. This step would help greatly to increase businessopportunities within the region and to boost service exports.
• Establishing mutual recognition agreements of professional qualifications and oflicensing requirements within the EAC. Agreements in the areas of accounting,architectural, engineering, and legal services would likely benefit Kenyan serv-ice firms (as well as firms in neighboring countries) in their exports of servicesto the region. Talks about such agreements have been ongoing, and provisionshave been agreed to in principle. For example, a draft mutual recognitionagreement in accounting was signed in 2010 and is expected to be finalized in2011.
• Creating standards at the EAC level. The development of EAC standards for theaccounting, architectural, engineering, and even legal sectors would potentiallybenefit consumers in the EAC.
Domestic business and professional associations could play a stronger rolein lobbying the government of Kenya to push the EAC on the issues that affect their members with respect to cross-border practices, mutual recogni-tion of qualifications, and elimination of work permit requirements for EACmembers.
The government of Kenya should lead the positioning and marketing of thecountry brand and key services globally, showcasing professional services next totourism, sports, horticulture, and other Kenyan products. Trade support institu-tions should conduct concerted marketing efforts with professional associationsand government agencies such as the Kenya ICT Board, the Kenya Tourist Board,
The Case of Kenya 265

and the Communications Commission of Kenya, to promote Kenyan services andbuild Kenya’s reputation as an exporter of professional services.
Address skill mismatches and skill shortages
Several actions by professional associations as well as the government at the train-ing level would help develop Kenyan workers’ skills for service exports. The provi-sion of more and better continuing professional education to individuals workingin professional service sectors is important.
The availability of scholarships or partial funding to enable BPO agents toaccess formal training courses not readily available in Kenyan universities and col-leges would improve the skills—and thus marketability—of Kenya’s BPO sector.The same reasoning applies to professionals employed in the ICT and ITeS sectorswhose needs for training in specialized technology areas cannot be met by locallearning institutions.
The provision of rebates or the development of incentives for firms to conducttraining—especially specialized training such as the Association of CertifiedFraud Examiners–certified fraud examiners course in the accounting sector—would help increase the quality and degree of specialization of the services offeredby Kenyan firms.
Notes
1. The index of RCA, initially introduced by Balassa (1965), can be used to assess the structure ofa country’s exports. The RCA for the service sector is services’ share in the country’s total exports(including goods) divided by the country’s share of world trade in goods and services. A value of theindex greater than one implies that a country is relatively specialized in services and thus has an RCAin such exports compared with the world average.
2. The four modes of supply of services in the terminology of the General Agreement on Trade inServices are mode 1, cross-border supply: services supplied from the territory of one country into theterritory of another country; mode 2, consumption abroad: services supplied in the territory of onecountry to the consumers of another country; mode 3, commercial presence: services suppliedthrough any type of business or professional establishment of one country in the territory of another(that is, foreign direct investment); and mode 4, temporary presence of natural persons: services sup-plied by nationals of one country in the territory of another. Mode 4 includes both independent serv-ice suppliers and employees of the service supplier of another country.
3. The EAC is the regional intergovernmental organization of Burundi, Kenya, Rwanda, Tanzania,and Uganda. Its headquarters is in Arusha, Tanzania.
4. Kenyan clients do not see the value of such drawings or the benefit of having an architect over-see a project. Often, they receive the drawings and then engage a contractor to build without consult-ing the architect.
5. For example, if a U.K. member of the accounting network Nexia has a client with work in Mozam-bique, it would refer that piece of work to the nearest network member, which would be a Kenyanaccounting firm. Before a Kenyan firm may join the network, its processes, procedures, and skills must beassessed. If they are appropriate for the network standard, the firm is allowed to join. This procedure
266 Exporting Services

ensures that when one network member refers work to another member, the quality of work will remainthat of the network international standard. International networks sponsor networking events and train-ing seminars worldwide that offer Kenyan member firms the opportunity to provide training, to presenttechnical sessions that demonstrate their skills, and to share experiences with network members. Suchevents increase a firm’s likelihood of gaining referral work from network members.
6. A complementary view on policy changes that can make Kenya a more attractive destination foroffshoring of IT and ITeS work is provided by the examination of a location readiness index describedin Sudan and others (2010).
7. For more details on the regulatory framework affecting professional services in Kenya, seeDihel, Fernandes, and Mattoo (2010) and World Bank (2010b).
References
Avasant. 2010. “Globalization of Services: Developments in the Outsourcing Sector—Implications forBoth Developed and Developing Countries.” Presentation by Kevin Parikh, CEO Avasant, at theWorld Bank, Washington, DC, December 8.
Balassa, Bela. 1965. “Trade Liberalisation and Revealed Comparative Advantage.” Manchester School33 (2): 99–123.
Breinlich, Holger, and Chiara Criscuolo. 2010. “International Trade in Services: A Portrait of Importersand Exporters.” CEPR Discussion Paper 7837, Centre for Economic Policy Research, London.
Dihel, Nora, Ana M. Fernandes, and Aaditya Mattoo. 2010. “Towards a Regional Integration of Profes-sional Services in Southern Africa.” Africa Trade Policy Note 10, World Bank, Washington, DC.
EPC (Export Promotion Council) and World Bank. 2009. “Services Exports Study: Assessment ofKenya’s Export Potential and Supply Capacities in Selected Professional Service Sectors.” EPC,Nairobi.
Frost and Sullivan. 2010. “South African BPO Market.” Frost and Sullivan, London.Gartner. 2010. “Gartner’s 30 Leading Locations for Offshore Services.” http://www.gartner.com/it/
page.jsp?id=1500514.Giridharadas, Anand. 2010. “Africa’s Gift to Silicon Valley: How to Track a Crisis.” New York Times,
March 13. http://www.nytimes.com/2010/03/14/weekinreview/14giridharadas.html?scp=1&sq=ushahidi&st=cse.
Government of Kenya and EPC (Export Promotion Council). 2008. “Strategy for Export Promotion ofProfessional Services in Kenya.” EPC, Nairobi.
Isenberg, Daniel. 2009. “KenCall: Can Nik Nesbitt’s Venture Succeed in Kenya?” Harvard BusinessSchool Case Study 9–809–114, Harvard Business School Publishing, Boston.
ITC (International Trade Centre). 2006. “Product Champions of Developing Countries: ExplanatoryNotes.” International Trade Centre, Geneva.
McKinsey Global Institute. 2005. The Emerging Global Labor Market: Part III—How Supply andDemand for Offshore Talent Meet. Sydney: McKinsey.
Sudan, Randeep, Seth Ayers, Philippe Dongier, Arturo Muente-Kunigami, and Christine Zhen-WeiQiang. 2010. The Global Opportunity in IT-Based Services: Assessing and Enhancing CountryCompetitiveness. Washington, DC: World Bank.
UNCTAD (United Nations Conference on Trade and Development). 2003. E-Commerce and Develop-ment Report. New York and Geneva: United Nations.
World Bank. 2010a. Kenya Economic Update: Kenya at the Tipping Point? 3rd ed. Nairobi: PovertyReduction and Economic Management Unit Africa Region.
———. 2010b. Reform and Regional Integration of Professional Services in East Africa: Time for Action.Washington, DC: Poverty Reduction and Economic Management Unit 2, Africa Region, WorldBank.
WTO (World Trade Organization). 2008. Measuring Trade in Services: A Training Module for the WorldBank. Geneva: WTO.
The Case of Kenya 267


The increase in commercial service exports from Brazil has been impressive. Inthe 1990s, commercial service exports grew 153 percent and 192 percent in the2000s. Among emerging economies, Brazil’s phenomenal growth in serviceexports is second only to China’s growth in manufacturing exports and India’sgrowth in software service exports.
Brazil’s service sector has experienced three distinct phases of exportgrowth. The first phase was characterized by the export of construction andrelated services (C&RSs). As a result of their experiences in domestic infra-structure projects from the 1950s to the 1970s, several Brazilian constructioncompanies could successfully bid on international projects. These firmsbecame the hallmarks of service exports from Brazil. Given recent develop-ments, however, the success of construction and engineering companies hasnow become only a part of Brazil’s success in exporting services. The interna-tionalization of Brazilian companies is well under way and has extendedbeyond construction and engineering to include a more holistic developmentof service trade and investment.
The second phase of internationalizing Brazil’s service exports occurred at theend of the 1980s, reaching a broad range of sectors, such as audiovisual, transport,
269
8
Underlying Lessons:Service Exports
from Brazil
Mário Marconini
The author would like to thank the executives and representatives of a number of service firms andsectors who provided valuable information and produced a well-defined overall picture of serviceexports, which this chapter is based on.

and financial services. The three companies that led this wave of internationaliza-tion were TV Globo, Banco Itaú, and Embraer. In the case of financial services,service provision was initially a result of demand from subsidiaries of domesticpublic and private banks working abroad. Brazilian banks had establishedbranches abroad in the 1990s, seeking deposits and placements from Brazilianimmigrants around the world. Only later did banks begin to focus on regionaliz-ing their operations, particularly in the Mercosur area (that is, the Southern Com-mon Market or Mercado Común del Sur), by opening offices and agencies.
The third phase of service sector internationalization started in the 1990s,when new and small information and communication technology (ICT) com-panies engaged in service exports. The advent of ICT companies owes much tothe demand created by the first wave of internationalization, because newlyinternationalized companies needed help developing, installing, maintaining,and integrating software telecommunication systems; processing and storingdata; devising programs; creating network services; and so on. Naturally, BrazilianICT companies were Brazilian firms’ first choice for those services. Most of theseexporters are medium-size companies that are majority-owned by Braziliannationals. The Brazilian Association of Information Technology and Communi-cation (Associação Brasileira de Empresas de Tecnologia da Informação e Comu-nicação, or BRASSCOM) estimated that ICT service exports would reach US$5billion in 2010, whereas the Brazilian Association of Software Companies (Associ-ação Brasileira das Empresas de Software, or ABES) estimated overall softwareservice revenues at US$5 billion in 2009, with 10 percent of revenues devoted toexports (that is, US$500 million as opposed to US$209 million in the balance ofpayments). ABES estimates that software service exports account for about 8,000jobs in the Brazilian economy.
In this context, the development of Brazil’s service exports is different fromthat of other successful countries, such as India and the Philippines. In the case ofBrazil, outward foreign direct investment (FDI) paved the way for cross-borderexports in the software service sector. This pattern differs from the case of India,where mode 4 service exports in the software service sector were followed bymode 1 exports and then by mode 3 exports, but all in the same sector. Thus, inthe case of Brazil, it seems that outward FDI may be a successful strategy forexpanding the export of a wide range of services.1
With the increasing internationalization of Brazilian companies, financialinstitutions are also likely to spread globally, and not just regionally, furtherencouraging ICT and other service exports. Unlike other segments of the Brazilianeconomy, such as transport, Brazil’s financial service and capital market sectorshave technologically advanced infrastructure by international standards and areadequately organized to participate in the international market.
270 Exporting Services

Service statistics suggest that most of the service sectors have been championsin exporting to the world; that is, they have large market shares, and their exportlevels are above world averages. For instance, insurance services and computer andinformation services gained a much larger market share in the period 2003–07and maintained an above average growth rate. The only sector that did not per-form well was communications, which lost market share and was below the aver-age world growth rate.
The factors that influence the success or failure of service exports may varywidely across sectors. Services are very heterogeneous and respond differently tovarious policies, regulations, and market conditions. Nevertheless, some generaland specific elements are important. In Brazil, as in the rest of the world, there arefundamental sources of comparative advantage, such as general market and labormarket characteristics, infrastructure, and institutions.
It is apparent that, in becoming competitive, each sector may have its ownpeaking point. The difference in timing exists because factors that provide com-parative advantage may not be relevant across all sectors within the same time-frame. However, the analysis still leads to an overriding conclusion in the case ofBrazilian service exports: comparative advantage was significantly developedor advanced after the second half of the 1990s. This conclusion indicates astrong correlation between the main economic policies of that period (that is,liberalization, market opening, and privatization) and the success of serviceexports (figure 8.1).
In some sectors, macroeconomic conditions explain export performance. Forexample, C&RS exports have grown significantly since 1993, but in the reversedirection of the country’s macroeconomic conditions at the time. Macroeconomicinstability and strict stabilization policies during the 1990s pushed constructionservices abroad in search of stability and growth opportunities in other markets.
In other sectors, a combination of factors (such as macroeconomic stability,technology-driven changes, and economic growth) explains sector performance.For example, the first competitive trend in Brazilian banking started in the 1990s,when inflation was controlled and banks had to cut costs and earn money withoutrelying on “floats” (that is, profits from clients’ money left in the accountsovernight). The second trend, which has been a stronger incentive in the past10 years, relates to Brazil’s technological development, which demanded largeinvestments in Internet functionalities, internal systems, and security. The thirdwave involves the credit boom since 2006. The internationalization of Brazilianbanks will serve as a fourth competitive trend, when new ground will have to beconquered beyond the country’s borders.
In the case of transport services, goods trade explains export growth. Domesticliberalization policies and worldwide liberalization of the 1990s, including at the
Service Exports from Brazil 271

regional level, explain the increase in goods trade and, consequently, transportservice performance. In addition, the domestic transport sector has played a rolein supporting transport service exports.
However, Brazil’s transport service exports seem to be lagging compared toother sectors. The transport service sector has always had the potential to be com-petitive in the global market because of its domestic market size. However, the lackof competition, especially in air transport, has allowed inefficient firms to surviveand, hence, created high margins, which discourage international ventures. Thecreation of Gol Airlines in 2001, for instance, revolutionized the Brazilian airtransport market and coincided with the increasing trend in transport exports.
Physical infrastructure is not playing a significant role in promoting exportdevelopment. The quality of Brazil’s infrastructure is below the Latin American
272 Exporting Services
Source: Central Bank of Brazil balance of payments data.
Figure 8.1. Service Exports by Category, 1970–2009
0
5,000
10,000
15,000
20,000
25,000
US$
mill
ion
30,000
35,000
1970
1972
1974
1976
1978
1980
1982
1984
1986
1988
1990
1992
1994
1996
1998
2000
2002
2004
2006
2008
personal, cultural, and recreational services business, professional, and technical services
merchanting and other trade-related services construction services
communication services government services
operational leasing services royalties and license fees
computer and information services financial services
insurance international travel
transportation

and BRIC (Brazil, the Russian Federation, India, and China) averages; therefore,physical infrastructure actually slows export development, especially transportservice development.
The business environment heavily influences the growth of the ICT sector.Other fundamental factors that encourage software service exports are humanskills, similarity in time zones with other Latin American countries and theUnited States, and low labor costs relative to those in developed countries. Therecent global financial crisis has helped the Brazilian ICT sector because out-sourcing constitutes an effective means of reducing costs. Brazil’s favorable busi-ness environment is among the reasons for its success in exporting services. Thetourism sector also identifies the business environment as a fundamental reasonfor export success.
Human skills and education play a significant role in Brazil’s service perform-ance. Government institutions, associations, and the private sector offer severalcourses that specifically focus on service exports. The Commerce and Services Sec-retariat of the Ministry of Development, Industry, and Foreign Trade and the state-owned Banco do Brasil, one of Brazil’s biggest banks, developed a partnership withthe goal of spreading a service-exporting culture, strengthening entrepreneurs’qualifications, and identifying opportunities for the development of actions that canunderpin the growth of Brazilian service exports. Banco do Brasil offers a coursecalled “Training in International Business: Services Exports,” which educates entre-preneurs about best practices for reaching international service markets.
In the case of the ICT sector, the main concern for future development is skilllevel. Because of increasing demand, most technicians and professionals enter thelabor market before concluding a formal university course. Furthermore, the soft-ware service sector points to the cost of labor as the most important fundamentalaspect underlying its competitiveness, or the lack thereof, particularly when Brazilis compared with competing countries such as India and the Philippines.
Business, professional, and technical (BPT) services are the main Brazilian serv-ices exports, totaling US$12.8 billion and 0.8 percent of GDP in 2009. The generaltrend for all BPT subsectors was to grow reasonably in the 1980s, considerably inthe 1990s, and spectacularly in the first decade of the millennium. Brazil wasclearly no exception in this context to the same world developments that underpingrowth in the sector: the rapid deployment of information technology (IT), theoverall liberalization of trade and investment in the world, and the increasingdemand for offshoring as a business tool at all levels of economic activity.
The Brazilian Development Bank (Banco Nacional de DesenvolvimentoEconômico e Social, or BNDES) is the main financing branch of the federal gov-ernment, offering an extensive number of solutions to firms that support con-struction export services. BNDES has a special focus on supporting exports of
Service Exports from Brazil 273

services with high intellectual content, such as software and computer servicesand engineering services for infrastructure projects.
Service Exports in the Context of the Economy
The service sector represented 68 percent of Brazil’s GDP in 2009, whereas themanufacturing sector’s share was 25 percent and the agriculture sector’s share was6 percent. In terms of employment, the service sector accounted for 77.3 percentof formal jobs, which places Brazil among the most service-intensive emergingeconomies in the world.
The growth of commercial service exports has been impressive in Brazil, reach-ing 135 percent in the 1990s and 192 percent in the 2000s (compared with 177percent growth in goods trade for the same period, despite the so-called com-modities revolution) (figure 8.1). However, the overall service balance has beennegative. Deficit levels at around US$10 billion were seen in 1997 and 1998, anddeficit levels have risen again since 2006. The lowest deficit since 1993 was in 2004.Since then, the deficit has increased by 312 percent, from US$4.7 billion in 2004 toUS$19.3 billion in 2009. The travel sector accounts for almost 30 percent of thatdeficit, and transport services account for 20 percent. In 2009, the biggest surplusitem was that of BPT services at US$7.7 billion. Architectural, engineering, andother technical services accounted for 32 percent of that surplus. In the 2000s,export growth totaled 189 percent.
As a share of total exports, service exports represent 17.2 percent—up from12.6 percent in 2005. Conversely, service exports’ contribution to the economyshrunk slightly; such exports accounted for 1.7 percent of GDP in 2009 comparedwith 1.8 percent in the previous year. Brazilian service exports mainly compriseBPT services (US$12.8 billion), international travel (US$5.3 billion), and trans-port services (US$4.0 billion), which together account for nearly 80 percent of allservice exports (figure 8.2). In 2008, the main destinations of these exports werethe United States (50.8 percent), the United Kingdom (11.1 percent), and Ger-many (4.0 percent).
In Brazil, more than 50 percent of all 2008 service exports and 42 percent of all2008 service imports were transacted with the United States (figure 8.3). TheEuropean Union (EU) accounted for 24 percent of all service exports and 37 per-cent of all service imports in 2008. Thus, the EU and the United States accountedfor 75 percent of Brazilian service exports and 79 percent of imports in 2008.Along with Mercosur and the rest of Latin America, the EU and the United Statesaccounted for 79 percent of all service exports and 86 percent of all serviceimports in that same year.
274 Exporting Services

Figure 8.4 shows the growth rates for each of the three main exporting sectors.During the 1990s, the BPT service sector grew by an astounding 1,252 percent,compared to a 31 percent growth for travel services and a 15 percent decline fortransport services—a clear result of flagship Brazilian companies’ decline in cargotransport generated by the country’s foreign trade. From 1999 to 2009, all threemain sectors had impressive growth rates; however, the BPT sector accounted formost of the growth in service exports from 2004 to 2009, with a 183 percentgrowth rate during that period.
BPT services are the main Brazilian service exports. Totaling US$12.8 billion,they accounted for 46.1 percent of total service exports, 7.1 percent of totalexports, and 0.8 percent of GDP in 2009. These services were the fourth mostimported services in 2009, totaling US$5.1 billion and accounting for 10.1 percentof service imports and 2.9 percent of total imports. In the same year, this subsec-tor had a net balance of US$7.7 billion, the highest surplus in the service sector.
Service Exports from Brazil 275
Figure 8.2. Composition of Service Exports, 2009
BPT46%
internationaltravel19%
commercial5%
government5%
transport15%
financial4%
other6%
Source: Central Bank of Brazil balance of payments data.

276 Exporting Services
Figure 8.3. Brazilian Service Export Markets, 2008
United States51%
European Union24%
Latin America(except
Mercosur)2%
Mercosur2%
rest of theworld21%
Source: Central Bank of Brazil balance of payments data.
Figure 8.4. Growth in Service Exports, 1989–2009
–200
1989–99
1999–2009
2004–09
031
–15
347
1,253
226 254174
65 64200
400
600
grow
th (
%) 800
1,000
1,200
1,400
BPT travel transport
Source: Central Bank of Brazil balance of payments data.

If architectural, engineering, and other technical services are taken out of this sub-sector, the surplus is still US$5.3 billion.
International travel was Brazil’s second-largest service export in 2009. TotalingUS$5.3 billion, international travel accounted for 19.1 percent of total serviceexports, 2.9 percent of total exports (goods and services), and 0.3 percent of GDP.International travel was the most imported service, totaling US$47 billion andaccounting for 23.1 percent of service imports and 6.2 percent of total imports.International travel had a balance of negative US$5.6 billion, the second highestdeficit in the service sector.
Transport services were Brazil’s third largest service export in 2009. TotalingUS$4.0 billion, this subsector represented 14.6 percent of service exports, 2.4 percent of total exports, and 0.3 percent of GDP. Transport services werethe third most imported services, totaling US$9.4 billion and accounting for16.9 percent of service imports and 4.6 percent of total imports. Transportservices had a net balance of negative US$3.9 billion, the third highest deficit inthe service sector.
BPT services, travel, and transport put the dynamism of various Brazilian serv-ice sectors in perspective and further evidenced Brazil’s success in exporting serv-ices (figure 8.5). During 2003–07 (the period for which data were available), mostof the service sectors were champions in exporting to the world; that is, they hadlarge market shares, and their export levels were above world averages. Insuranceservices and computer and information services were also somewhat successful,gaining a much larger market share in the same period and maintaining a growthrate much larger than the world average. The only sector that did not perform wellwas communication services, which lost market share and grew at rates below theworld average.
The State of the Fundamental Factors in Brazil
With a US$1,577 billion GDP and a population of 191 million in 2010, Brazil isthe 10th-largest economy and the 5th most populous nation in the world. Dur-ing the 1990s and 2000s, the country has taken important steps toward achiev-ing macroeconomic stability and liberalizing its economy. The progress madeduring that period is believed to explain Brazil’s rise as a dynamic economyworthy of comparison with China, India, and Russia. Between 2004 and 2008,Brazil experienced an average GDP growth of 4.7 percent, but its economy con-tracted by 0.2 percent in 2009. This negative result can largely be attributed tothe global financial crisis and shows that Brazil fared better than most countriesduring that period. Furthermore, Brazil was one of the first emerging markets tobegin recovering, and its GDP is expected to grow by 5 percent in 2010.
Service Exports from Brazil 277

Brazil ranked 56th in the World Economic Forum’s 2009–10 Global Com-petitiveness Index out of the 134 economies studied (Schwab 2009). However,when considering only the 10 most important indicators related to the businessenvironment, the country ranked 30th. Also, Brazil was listed as one of the topfive countries that would actually gain competitiveness as a result of the globalfinancial crisis (along with Australia, Canada, China, and India). This positionreflects the dynamism, sophistication, and efficiency of Brazil’s business regimeand the capacity for innovation. Those factors, combined with a vast andexpanding domestic market, an abundance of natural resources, and a well-developed industrial sector, put Brazil in an advantageous position in theglobal market.
278 Exporting Services
Figure 8.5. Dynamism and Brazilian International Participation, 2003–07
31,872
18,831
14,985
1,413
58
1,230
3134
433
792
310
–200
–100
0
100
200
300
400
500
600
–100 –50 0 50 100 150 200 250
grow
th (
%)
change in Brazilian market share (%)
losers
underachievers
winners in adversity
champions
BPTconstruction insurance
financial services computers and informationroyalties and license fees personal, cultural, and recreational services
travel transportationcommunications
Source: Author’s representation based on Central Bank of Brazil data.Note: The size of the spheres reflects the level of exports in the 2003–07 period. The thick gray linecorresponds to the world’s average export growth.

Unfortunately, Brazil still has much to do to improve the poor quality ofmost of its institutions, its inadequate infrastructure, and its excessive govern-ment regulation. Brazil was ranked relatively lower (109th) in the Global Com-petitiveness Index in terms of its macroeconomic stability, whereas it did wellin business sophistication and innovation with a ranking of 32nd and 43rdrespectively.
The World Bank’s Doing Business indicators also shed some light on the
business climate in Brazil. Surprisingly, the Brazilian map for ease of doing busi-ness is way below what might be expected for a country that is only second toChina in attracting FDI in the developing world. However, in 2010, the WorldBank ranked Brazil 129th in the world for ease of doing business, two positionslower than its rank in 2009. Brazil especially fares poorly in rankings for payingtaxes (150th), and its ranking is getting worse. Brazilian companies spend astriking 2,600 hours per year doing taxes, compared with the Latin Americanaverage of 385.2 hours Organisation for Economic Co-operation and Develop-ment average (OECD) of 194.1 hours. Brazil performed well, however, withrespect to protecting investors (ranked 73rd) and allowing access to credit(ranked 87th).
The specific effect of Doing Business rankings on service exports is indirect,although extremely relevant, particularly when one compares Brazil with compet-ing countries. Like Brazil, India is also known for being bureaucratic, but Brazilfares better than India when it comes to starting and closing a business, dealingwith construction permits, and enforcing contracts, and paying taxes. However,India tends to do better in employing workers, registering property, getting credit,and protecting investors (figure 8.6).
Similarly, China does not fare as well in the early phases of doing business(such as starting a business and protecting investors) compared to Brazil (figure 8.7). Because exporting normally requires a reasonable level of successin domestic markets, postestablishment factors (such as registering a companyor getting credit) certainly may have a significant bearing on export competi-tiveness, especially in terms of delays.
The ICT industry association, BRASSCOM, attributes most of that sector’ssuccess in exporting services to Brazil’s business environment (figure 8.8). Inother words, the ICT sector is especially sensitive to the business environmentand much of its competitiveness hinges on it. This finding corroborates those ofA.T. Kearney’s (2009b, 2011) study on the most attractive offshoring locations,where Brazil is ranked 12 among 50 countries.
Nevertheless, the ICT sector may fare well despite whether overall economicconditions are good or bad. In 2009, for example, while firms in many sectors ofthe economy were decreasing their number of employees, IT companies were
Service Exports from Brazil 279

aiming for a large number of recruits but were unable to find software profes-sionals. This difference is especially relevant, because most IT jobs are related toexport, as in the case of IBM do Brasil, in which 80 percent of the openings aretargeted for export. IBM has consistently made efforts to close the gap between
280 Exporting Services
Figure 8.6. Doing Business Rankings, Brazil versus India, 2010
getting credit
registering property
employing workers
dealing with constructionpermits
starting a business
closing a business
enforcing contracts
trading across borders
paying taxes
protecting investors
020406080
100120140160180200
Brazil India
Source: World Bank’s Doing Business database, http://www.doingbusiness.org.Note: Brazil is ranked 129th and India is ranked 133rd for overall ease of doing business.
Figure 8.7. Doing Business Rankings, Brazil versus China, 2010
getting credit
registering property
employing workers
dealing with constructionpermits
starting a business
closing a business
enforcing contracts
trading across borders
paying taxes
protecting investors
0
100
50
200
150
Brazil China
Source: World Bank’s Doing Business database, http://www.doingbusiness.org.Note: Brazil is ranked 129th and China is ranked 89th for overall ease of doing business.

the profile of a recent graduate and the desired profile of an employee. Between2005 and 2008, IBM’s number of Brazilian employees grew by more than 50 per-cent, reaching 15,400.
IBM’s executives chose to locate their businesses in Brazil because of the qual-ity of Brazilian workers, the similarity in time zone with the United States, and therelatively low labor costs. They also indicate that the recent global financial crisishelped the Brazilian ICT sector, because outsourcing constitutes an effectivemeans of reducing costs. Thus, the sector can perhaps be seen as countercyclical—growing in times of general economic downturns because struggling firms needIT to reduce costs. Because IT also helps manage growth during expansion peri-ods, however, the sector cannot be characterized as simply countercyclical. Inaddition to the available employee positions in 2009, the IT sector planned to cre-ate 100,000 new jobs by 2011 (not including call centers, which would add 50,000more jobs) (Fuoco 2009).
The downside for the Brazilian IT sector is its cost relative to its Asian competi-tors. The A.T. Kearney (2009b) study indicates that, even if Brazil could match thetax incentives in China and India, it would still be less competitive than those twoBRICs because of its high cost. As late as 2007, Brazil was ranked by A.T. Kearneythe fifth most attractive offshore destination after India, China, Malaysia, andThailand, which is considerable improvement from two years earlier when Brazilranked 10th. Since 2009, though, Brazil is ranked 12th among 50 countries becauseof a strengthening of its currency.
Service Exports from Brazil 281
Figure 8.8. Importance of Each Fundamental Aspect, BRASSCOM
0
2
4
6
8
10business environment
regulatory framework
availability of qualifiedlabor
cost of labor
infrastructure
institutions
language and culturalaffinity
FDI openness
entrepreneurial strategy
government support
Source: Data from BRASSCOM.

The other sector that identified business environment as a fundamental reasonfor export success was tourism. The Brazilian Association of Travel Agencies(Associação Brasileira de Agentes Viagens) listed the item as the second mostimportant reason for export success after entrepreneurial strategy. This findingsuggests that, from a public policy perspective, a special focus on improving thebusiness environment is crucial in diversifying service exports.
The ICT sector has also grown very fast because of its link to the financialsector. According to BRASSCOM, the automatization of banking has placed thefinancial sector among the most promising exporting sectors. Both domesticand foreign banks play a role in the development of exports of ICT solutionsfor financial services providers. Using their in-house resources, Braziliandomestic banks invested in ICT to serve their customers in inflationary envi-ronments during the late 1970s. Later, in a more stable macroeconomic envi-ronment, their focus shifted to providing a diversified range of Internet-basedservices. Between 2000 and 2008, the number of Internet-based bankingaccounts reached 32.5 million with an average annual growth rate of 9.1 percent.In 2008, Brazilian banks’ ICT expenses reached US$8.8 billion. However, duringthe 1990s foreign banks’ access to the financial market allowed the developmentof centers that provide global financial services from Brazil (Bastos Tigre andLemme 2010).
Regulations and Institutions
Brazil started liberalizing and opening its economy in the early 1990s, but,despite significant progress in some areas, the institutional environment stilllags the country’s dynamic entrepreneurial capacity. The regulatory frame-work, which was modernized, improved, and updated to include broad policyreforms, requires further strengthening in several sectors.
Since the 1990s, Brazil has created several regulatory agencies to oversee thefunctioning of various service sectors. The federal government focuses mainlyon economic regulation, and state and local regulatory agencies at times con-tribute to regulatory supervision, as is often the case in environmental matters.The excessive number of agencies often results in bureaucratic disputes, andapproval requirements at various government levels can make business diffi-cult. Furthermore, the independence of these agencies could also be enhanced.Yet improving the overall regulatory framework has been among the govern-ment’s priorities. More specifically, there is growing focus on the need toincrease transparency and accountability and to introduce new tools for evidenced-based regulatory performance decision making (OECD 2008; dosSantos 2010).
282 Exporting Services

The regulatory framework makes Brazil one of the least efficient countries inthe world in terms of the time and number of procedures required to start a busi-ness. Nonfinancial costs represent a significant obstacle to starting businesses, andthere is much room for improvement when it comes to eliminating bureaucracyand red tape in public institutions. To attenuate the burden of regulation andreduce uncertainty, policy makers should better coordinate across agencies andreinforce the independence of those agencies.
Service activities tend to be more prone to red tape and bureaucratic discretionbecause they are usually more regulated and are monitored in a much morediverse and nontransparent manner than are other economic activities. To theextent that services obey national policy objectives that, in turn, require specificregulatory approaches at various levels of the activity chain (for example, atpreestablishment, establishment, and postestablishment), bureaucratic sluggish-ness and reticence can easily become more rampant. Exports, however, are morecomplicated because they involve international money transfers, exchange ratetransactions, and trade-related documents.
Representing the software industry in Brazil, ABES names the regulatoryframework as one of the top reasons for export success, along with low labor costsand availability of qualified labor (figure 8.9). Moreover, adequate regulationsmay also play a positive role in the development of service industries. According toBastos Tigre and Lemme (2010), Brazil’s adoption of international financial stan-dards promoted the development of outsourcing activities.
Skill Availability
In 2009, Brazil ranked 53rd in reading performance, 52nd in mathematics per-formance, and 53rd in science performance out of 65 countries in the OECD’sProgramme for International Student Assessment (OECD 2010). This positionreflects Brazil’s poor quality of education at basic levels (primary and second-ary education), which resulted from a system that lacked investment and focusedon higher education. In recent years, attention has shifted to basic education, andinvestments in overall education have increased significantly, reaching 4.29 percentand 4.09 percent of government investment for basic education and higher educa-tion, respectively.
Federal programs aimed to improve Brazil’s overall education level by address-ing one of the country’s main education issues—the high number of primary andsecondary school dropouts. By granting low-income families financial incentivesfor keeping children in school, these programs significantly raised enrollmentrates and succeeded in keeping children off the streets and from leaving schoolfor substandard jobs. By 2008, Brazil achieved universal enrollment in secondary
Service Exports from Brazil 283

education and close to universal enrollment at the primary level (94.4 percentenrollment). This achievement was an important and necessary step in increasingthe level of education, but it did not address the quality issue. Overall qualityimprovement can be achieved only when policies and investments are put inplace to ensure that children are not only in school but also provided adequateinfrastructure and qualified instructors.
Brazil also lags when it comes to internationalizing education. Only a smallnumber of students travel abroad to receive part, or all, of their higher education inother countries. The main sources of government funding are scholarships fromthe National Council for Scientific and Technological Development (ConselhoNacional de Desenvolvimento Científico e Tecnológico), which can be applied tograduate (not for a master’s degree) and postgraduate study, training, and intern-ships in several areas of study. The scholarships are comprehensive, and no repay-ments are required as long as the graduate returns to Brazil to work for a periodequal to, or longer than, his or her length of study.
When it comes to service exports, executives and experts note that Brazilianeducation continues to be primarily domestic in nature. For instance, legal expertspoint to the virtual nonexistence of Brazilian universities that focus on traininglawyers for export markets at the undergraduate level. Such training is usuallyoffered only at the graduate level, if it is offered at all.
In the case of the ICT sector, the main concern regarding skill level is that mosttechnicians and professionals end up entering the labor market before concluding
284 Exporting Services
Figure 8.9. Importance of Each Fundamental Aspect, ABES
0
2
4
6
8
10business environment
regulatory framework
availability of qualifiedlabor
cost of labor
infrastructure
institutions
language and culturalaffinity
FDI openness
entrepreneurial strategy
government support
Source: Data from ABES.Note: Importance is ranked on a scale of 1 to 10, where 1 is least important and 10 is most important.

a formal university course. In other words, demand is outstripping supply, andnew entrants join the labor market without the necessary skills. Hence, ABES hashelped promote a more market-oriented type of training in an attempt to fill thecurrent skill gap. High domestic demand for professionals also obviates recourseto scholarships in developed countries and explains the low number of candidatesfor existing programs.
IBM do Brasil provides an interesting case. More than 80 percent of the person-nel hired by IBM in Brazil are allocated to the service export segment, making thechallenge of finding qualified people even more difficult given the education andinternational experience required for exporting services. As a result, IBM has todecline projects whenever teams cannot be assembled quickly enough. Sectorexperts and executives note that universities provide a reasonable number of grad-uates, but these graduates leave the academic institutions with very general knowl-edge and not with specialist certification, which the market needs its employeesto have.
Because curricula are not updated to meet certification requirements, compa-nies can spend two to three months training workers. In partnership with a groupof about 700 academic institutions, IBM has worked to provide relevant trainingto students during their undergraduate studies and has advocated teaching stu-dents English starting in high school (Fuoco 2009). In terms of the number ofEnglish-speaking inhabitants, Brazil is only second to India (by a factor of nine).In terms of the quality of English as a second language, Brazil loses only toArgentina and Chile in TOEFL (Test of English as a Foreign Language) scoresamong BRIC and Latin American countries.
Cost and Price Comparisons
In 2009, Brazil ranked 105th in the world in terms of per capita GDP, with eachof its citizens earning an average of US$10,200. This value, however, does notreflect average compensation in the service sector, because Brazil has one of thehighest levels of income inequality. Wages in the sector are, indeed, lower than indeveloped countries, but they are relatively high when compared with wages inother emerging nations. Hence, low wages are not seen as a reason for export-minded FDI as they are in China and India. Instead, FDI in the Brazilian servicesector is mainly market seeking rather than efficiency seeking, and it focuses onbenefiting from the vast and expanding internal market. The cost of labor can behigh, particularly when compared to Brazil’s main competitors (as seen in thesections that follow).
From the point of view of domestic service providers, high income taxes areseen as a burden because they entail extra costs for employers with no gains in
Service Exports from Brazil 285

worker productivity. Furthermore, rigidities in the labor market increase boththe financial and nonfinancial costs of hiring and firing. There are no majordifferences, in this respect, between service and manufacturing activities;therefore, Brazil is often at a disadvantage compared to its competitors in bothgoods and services. Those two factors increase the perceived wage to employ-ers, reducing some of the comparative advantage. However, the large domesticmarket allows firms to enjoy economies of scale and become more competitiveat the global level.
In the case of the software service sector, the cost of labor is the most importantfundamental aspect underlying the sector’s competitiveness. Clearly, the item hasbeen decreasing in relevance compared to other aspects, such as tax burden andstructure, but the cost of labor remains a strong influence in the sector, particu-larly when compared to competing countries (Bastos Tigre and Lemme 2010).
The so-called compensation costs (that is, annual base salaries plus allowances,variable bonuses, and commissions) for analysts and managers in the softwareservice sector reveal Brazil’s vulnerabilities. The cost for analysts is lower in Brazilonly relative to Chile and Mexico in Latin America, whereas it is more than twotimes the cost for analysts in China and three times the cost in China. In the caseof managers, Brazil has the highest cost in the world according to recent estimates(Economist 2011).
The cost proposition in Brazil worsens when one goes beyond compensationand so-called tax benefits—that is, taxes paid to the government on behalf of theworker. Such benefits account for close to 39 percent of the base salary in Brazil, asopposed to 21 percent in Argentina and 22 percent in Mexico. Surprisingly,China’s tax benefits are 35.0 percent. However, the figure for India is 16.8 percent,whereas Chile has a record low of 4.9 percent. Assuming the base salary to be 100.0percent, total labor cost would correspond to 153.1 percent in the case of Brazilcompared to 108.1 percent for Chile, 116.8 percent for India, 129.3 percent forArgentina, 131.4 percent for Mexico, and 135.0 percent for China (which has notake-home benefits or take-home cash in addition to the base salary). Varioussocial benefits granted by the Brazilian labor laws, such as annual maternity andsick leave, also entail considerable additional cost. In this area, Brazil ranks worsethan any of its main competitors (A.T. Kearney 2009a).
Openness to FDI
Brazilian direct investment abroad (BDIA) has been a very important factor inservice exports (figure 8.10). In the past 20 years, particularly in the 2000s,Brazil was transformed from being only a receiver of FDI to being a sender ofFDI as well.2 According to the Central Bank of Brazil, BDIA stock reached
286 Exporting Services

US$164.5 billion in 2009 compared with US$49.7 billion in 2001 (the first year inwhich data are available). The direct participation of residents in the capital ofcompanies totaled US$132.4 billion, a growth of 16.4 percent compared to 2008.The rest corresponds to intercompany loans (US$32 billion). BDIA (excludingintercompany loans) is concentrated in the agricultural and extraction of metallicminerals sectors (32 percent of the total, of which 94 percent are invested inmetallic and minerals activities) and in financial services and ancillary activities(39 percent of the total). Regarding the geographic distribution of these invest-ments abroad, Austria is the largest market of destination, with a share of 27.4 per-cent of the total stock invested abroad, followed by the Cayman Islands (13.8 per-cent), the British Virgin Islands (10.1 percent), The Bahamas (7.8 percent), theUnited States (7.5 percent), Denmark (7.3 percent), and Spain (4.0 percent). Therest is distributed among a large number of countries.3
Service Exports from Brazil 287
Figure 8.10. Distribution of Brazilian Direct Investment Abroad, 2009
manufacturingUS$8.8 billion
39%
6%
6%5%5%
agriculture andmining
US$41.8 billion
servicesUS$81.7 billion
agriculture and mining manufacturing financial services
other professional, scientific, andtechnical activities
office business supportactivities
management consulting activities trade and others
Source: Author’s calculation based on data from the Central Bank of Brazil.

Brazilian investment abroad is diversified in terms of both sectors and markets(ECLAC 2005). Although the biggest investments have been directed to miningand manufacturing activities, Brazilian firms have also invested in services. Con-struction companies that initiated the internationalization process (such asAndrade Gutierrez, Odebrecht, and Camargo Corrêa) have also diversifiedbeyond the construction and engineering activities to include a larger set of sec-tors. Banco Itaú has also expanded its operations to include other Latin Americancountries (see annex 8.A).
Inward FDI in services peaked in the second half of the 1990s, hoveringaround 60 percent of all FDI. This peak was largely the result of Brazil privatizingthe telecommunication and transport sectors, revamping the financial sector,and improving the overall investment climate by stabilizing the Brazilian econ-omy. FDI in services decreased in relative importance to about 30 percent of totalFDI. In 2008 and 2009, FDI in services stabilized at about 39 percent of total FDI(figures 8.11 and 8.12).
Services have figured prominently as a target for FDI in the country over theyears. In 2008, inward FDI in the service sector reached its highest level, totalingUS$16.9 billion. The 2009 results were 16.3 percent lower than those in the previ-ous year—once again reflecting the harsh times of the global financial crisis and
288 Exporting Services
Figure 8.11. FDI in the Service Sector, 2004–09
8,485
12,92412,124
16,556 16,878
14,122
0
2,000
4,000
6,000
8,000
10,000
12,000
14,000
16,000
18,000
2004
2005
2006
2007
2008
2009
FDI (
US$
mill
ion)
Source: Data from Central Bank of Brazil.

its aftermath. The main sources of inward FDI have been Germany, the Nether-lands, Spain, and the United States, which together have accounted for 66.3 per-cent of total FDI in Brazil.
In 2009, 45 percent of FDI inflow was in services. This contrasts starkly withthe FDI stock in 1995 and 2000, when services accounted for 31 percent and 64percent of the total, respectively. The reason for such a high stock in 2000 was theopening of the economy that took place in the 1990s and, especially, the flow ofFDI in the second half of that decade. Contrary to common belief, however, thehigh inflows of FDI in services were not primarily the result of the formidable pri-vatization that took place in Brazil during the period 1996–2000 (figure 8.13). Infact, the Central Bank’s 2001 Foreign Capital Census showed that, of the US$112.6billion in FDI in Brazil in the 1996–2000 period, only US$29.6 billion (or less thana third) was related to privatization. In the case of telecommunications, however,the largest privatization program in the world accounted for much of the FDI inthat sector. In the remaining service sectors (such as the financial sector), the newclimate, which boasted economic stabilization and the beginning of structuralreforms, attracted most investments.4
The service sector’s participation in total FDI has been decreasing rapidlysince 2005, despite nominal increases in total flows, as in the 2006–08 period
Service Exports from Brazil 289
Figure 8.12. FDI in Brazil, 2005–09
106
15
30
13
30
3936
32
42
60
55
49
38
45
0
10
20
30
shar
e of
tot
al F
DI (
%)
40
50
60
70
20052006
20072008
2009
agriculture, mining, and fisheries manufacturing services
Source: Data from Central Bank of Brazil.

(figure 8.12). In 2005, 60.1 percent of total FDI was in services, but that numberhad decreased to 38.5 percent by 2008. The data for 2009 show the agriculture,mining, and fisheries receiving 13 percent of total FDI; manufacturing receiving42 percent; and services receiving 45 percent.
The privatization that occurred in the early 1990s was one of the most exten-sive reforms in the world and drastically changed the dynamics of the Brazilianeconomy, especially in the service sector. Three-fourths of privatizations involvedthe service sector, which brought in large amounts of investment. Yet the consis-tent introduction of competition in areas formerly monopolized by the govern-ment contributed to most of the gains. Privatization was a determinant factor inincreasing firm efficiency and improving the comparative advantage of the econ-omy, in general, and the service sector, in particular.
Of the service sector’s 45 percent of total FDI inflow in 2009, financial servicesaccounted for 11 percent, commerce for 9 percent, insurance for 5 percent, con-struction for 4 percent, transport for 3 percent, and BPT services for 2 percent(figure 8.13). A striking element in this context is the low level of inward FDI forthe most prominent service-exporting sectors—namely, BPT, transport, andtravel. This low level points to FDI inflows’ lack of relevance in determining suc-cess in exporting services.
The breakdown of FDI inflows by sector has varied considerably in the caseof the communication sector, which includes postal and telecommunicationservices. In the beginning of the 2000s, that sector accounted for 34 percent ofall FDI inflows, followed by financial services with 13 percent, utilities with
290 Exporting Services
Figure 8.13. FDI Inflows as a Share of Total FDI, by Sector, 2009
industry42%
agriculture13%
audiovisualservices 1%
financial services11%
real estate2%
communication1%insurance
5%
utilities3%
transport3%BPT services
2% computers andinformation
3%construction4% housing and food
1%
commerce9%
other services< 1%
services45%
Source: Data from Central Bank of Brazil.

8 percent, and commerce with 7 percent. In 2009, communications accountedfor only 1 percent of total inflows.
Relatively low labor costs contribute to Brazil’s attractiveness for export-orientedFDI, and the government has implemented a series of benefits and incentives forexporters, such as the special tax regime for exports of IT services. Despite theseattractive factors, the possibility of exporting does not seem to be a major pro-moter of FDI in Brazil as it is in China and India. This finding may suggest thatmarket seeking has been the main driver of FDI in Brazil, unlike the case ofMexico, where efficiency seeking seems to predominate (ECLAC 2008).
Government Support
BNDES is the main financing branch of Brazil’s federal government, offering anextensive number of solutions to firms. In 1997, BNDES started offering serviceexporters specially designed programs that enable these exporters to compete atthe global level. The first such program began in 1997; BNDES provided financialsupport for a Brazilian firm’s venture to build highways in Ecuador. Such supportin construction service exports peaked in 1998, when construction services’ suc-cess in the international market was at least partially the result of the availabilityof credit. Financing was vital to such projects because extremely large firms dom-inate global construction. According to Engineering News-Record, three Brazilianfirms are the only South American firms among the 225 largest infrastructure andengineering companies (Reina and Tulacz 2008). In the face of intense competition,Brazil’s domestic market size definitely helps ensure comparative advantage—at least relative to Brazil’s South American neighbors.
BNDES’s expenditures in credit lines increased 28-fold from 1998 to 2009,having gone from US$49.0 million to almost US$1.4 billion during the period(figure 8.14). The bank has a special focus on supporting service exports thatare intensive in intellectual content, such as software and computer services andengineering services in infrastructure projects. In the case of construction andengineering service exports, BNDES primarily supports projects in Angolaand Latin America, where the demand for infrastructure is very high becauseof strong competition from third-country companies.
In the case of software and computer services, BNDES’s involvement has takenplace under the program Prosoft Export (Prosoft Exportação), which focuses onsmall and medium-size enterprises (SMEs) in the sector. This program financesthe investments and business plans of companies located in Brazil, assists withdomestic marketing, and exports software and related services through threesubprograms: Prosoft Company, Prosoft Marketing, and Prosoft Export. But theoverall use of the funds has been limited because of several factors, among them
Service Exports from Brazil 291

inadequate human resources for assessing the projects and the cost of financialguarantees (Marques 2009).
Other programs in Brazil also support service exports, including, but not lim-ited to, the following:
• The Exports Financing Program of Brazil (Programa de Financiamento àsExportações Brasileiras) provides financing for micro, small, and medium-sizecompanies that produce goods or provide services to export.
• The Exports Credit Insurance program insures Brazilian goods and serviceexports against commercial, political, and extraordinary risks.
• The Exports Assurance Fund supplies coverage for the export credit insuranceoperations.
Besides the C&RS sector, only the ICT service sector has benefited fromaccess to bank credit. However, of the US$665.0 million financed for serviceexports in 2007, only US$95.2 million (14 percent) went to software and ICTservice exports. In 2008, the corresponding share was even smaller (8.7 percent)for an overall disbursement of more than US$1 billion. In 2009, 100 percent(US$1.38 billion) of the financing went to construction and engineering(Galvão and Catermol 2008).
Factors behind success: The specifics
Generally speaking, Brazil has little, or close to no, special or specific policiesregarding improving service exports (Fonseca Moreira 2007). Policies on general
292 Exporting Services
Figure 8.14. BNDES’s Expenditures in Credit Lines to the Service Sector, 1998–2009
49
1998
1999
20002001
20022003
20042005
20062007
20082009
84 83 73 43121
228 292168
665
1,044
1,381
0
200
400
600
800
1,000
1,200
1,400
1,600
spen
ding
(U
S$ m
illio
n)
Source: Data from BNDES.

services (not focused on exports) tend to be sectoral and domestic in nature, assector ministries and agencies so determine. The predominance of regulatoryand state entities in the economic life of service sectors is evident. Even profes-sional services have federal councils that oversee their activity, which contrastswith the usual practice of delegating regulation and oversight to private bodies.
Service exports, of course, differ from domestic services. Regulatory agenciesthat address service matters, such as telecommunications or transport, do ventureinto the international realm, but not with an exporting mindset. Effectively, muchcould be done to create a culture around the notion that services are exportableand that many international service transactions are now considered serviceexports. ApexBrasil, the export promotion agency, and the Foreign Trade Secre-tariat within the Ministry of Development’s Industry and Foreign Trade are onlynow starting to examine service exports systematically—still far from developinganything that looks like a structured policy on the matter.
In 2004, the software sector was selected as a priority sector for industrial,technological, and foreign trade policy. A set of policies was implemented topromote technological innovation, investment, and software development. Aspecial tax regime for the IT service export platform was implemented, as well asother tax incentives that aimed to expand Brazil’s IT service exports. In addi-tion, the 2005 Law of Technological Innovation encouraged interaction amongcompanies, research centers, and universities, which stimulated the develop-ment of new ideas and innovative products (SOFTEX 2009; Valls Pereira,Sennes, and Muder 2009).
International trade negotiations have played a minor role in service exports.The World Trade Organization remains the sole recipient of service commit-ments. Brazil is known for negotiating only partial and very limited tradeagreements—virtually all devoted to goods trade. Chile, an associate memberof Mercosur, has only recently convinced Brazil and Mercosur’s three originalmembers to negotiate services. Neither the Free Trade Area of the Americas northe Mercosur-EU negotiations have resulted in the inclusion of services in Brazil’sbilateral or regional commitments in the sector. Although Mercosur membersformed a service agreement in 1998, the agreement’s provisions did not enter intoforce until the end of 2005. Moreover, several service-negotiating rounds havebeen conducted under this agreement, but none of their provisions have beenimplemented yet.
Brazil has double taxation agreements with 26 countries, but not with Germany(which recently renounced the agreement) or the United States. Brazil has not beenable to close an agreement, including an investment, with the United States formore than 50 years. In other words, Brazil’s success in exporting services has hardlyanything to do with the existence of free trade, taxation, or investment agreements.
Service Exports from Brazil 293

BPT services
The BPT service subsector experienced a shift in exports after 2003 (figure 8.15).By 2009, the main Brazilian service exports reached US$12.8 billion, or 46.1 per-cent of total service exports, and the highest surplus was in the service sector(US$7.7 billion). Even if the architectural, engineering, and other technicalservices subsector is not taken into account, the surplus is still US$5.3 billion.
294 Exporting Services
0
2,000
4,000
6,000
US$
bill
ion
8,000
10,000
12,000
14,000
19992000
20012002
20032004
20062005
20092008
2007
installation and implementationof technical and economic services
architectural, engineering, and other services
publicity professional athletes’ transfer fees
participation in fairs and exhibits installation and maintainance ofadministrative offices and real estate rental
self-employed remuneration mail orders
Figure 8.15. BPT Service Exports, 1999–2009
Source: Central Bank of Brazil balance of payments data.

Architectural, engineering, and other technical services must be combined withconstruction services to do justice to the market-relevant cluster of servicesthat Brazil exports.
In 2009, three subsectors accounted for more than the 90 percent of BPTexports: architecture, engineering, and other technical services (44.2 percent);office installation and maintenance and real estate rental (29.3 percent); andprofessional fees (21.2 percent).
Most experts and executives attribute the extra boost in the sector to the adventof the Internet as an everyday tool in the work of companies in the subsector.Most of the services that account for BPT exports can be delivered electronicallyand have benefited greatly from the diffusion and advancement of the Internet.Other services that have reportedly benefited from the significant progress inICT were insurance service exports and financial service exports, which grewrapidly after 2004 and 2005, respectively. Although software can also be deliveredelectronically, the software sector did not experience the same growth as the BPTsector because it was not as well developed as other sectors.
The case of legal services
One of the service sectors most sensitive to FDI is the legal service sector. Expertsand representatives from that sector, such as the Center for the Study of LawFirms (Centro de Estudos das Sociedades de Advogados) point to Brazil’s open-ness to FDI as one of the fundamental reasons for the country’s success in serviceexports. The sector is responsive to economic conditions in general and to theentry of FDI in the national market in particular. The entry of FDI brings with itgreat demand for legal services—the type that will produce a successful establish-ment or investment into national borders. Such services are supplied throughmode 2 (that is, through consumption abroad). The Brazilian legal service sup-plier remains in the Brazilian market and works with foreign consumers orclients abroad.
It would be imprecise to affirm that FDI stimulates the export of Brazilian legalservices only in times of growth, because such exports are also stimulated in timesof crises or other stresses on the national economy. The main differences betweenthe effects of positive and negative growth lie in the types of legal services that maybecome exports. When the national economy is bullish (that is, attracting FDI andgrowing), the bulk of legal service exports is related to establishment, real estate,capital markets, and project finance law among other segments. Alternatively,when times are bearish, legal service exports are also demanded, but they arewanted in other legal segments, such as company recovery, general litigation, andtax litigation.
Service Exports from Brazil 295

According to Valls Pereira, Sennes, and Muder (2009), several Brazilian lawfirms have established an international presence through partnership networks,through associations with firms in other countries, or through independentoffices. The firms’ strategy was to follow the internationalization process of theirclients. This process explains the increased participation of legal services in theexports of other business services from 1 percent to 14 percent between 2001/02and 2005/06. South America is the main destination market for these firms.
Other services
Brazilian companies have also chosen to internationalize their operations throughfranchising operations. International brands have become part of domestic mar-keting strategies. Franchise development is in its initial stages among the 400 com-panies that are part of the Brazilian Franchise Association. In 2007, only 35 ofthose companies had gone international. Other service activities that are in theirdeveloping stage are medical services (specifically, remote diagnoses and teleradi-ology) and health tourism (Valls Pereira, Sennes, and Muder 2009).
“Macroeconomic jumping”: Construction and related services
C&RS exports are traditional service exports for Brazil. In the second half of the20th century, these exports grew thanks to the government initiating a majoreffort to develop domestic infrastructure. The strength of this effort allowed com-panies to participate in construction projects in the 1970s and 1980s, initiatingsuccessful internationalization (ECLAC 2005).
C&RS exports have grown significantly since 1993, a phenomenon that wasinversely related to Brazil’s macroeconomic conditions at the time. During the1990s, when economic conditions, in general, were improving considerablybecause of the stabilization of the economy and the end of inflation, C&RS firmswere encouraged to establish abroad in better and more profitable markets. Withmacroeconomic stabilization, firms lacked access to credit, faced high interestrates, and had to reduce their economic activity for a while, which finally forcedthem to look abroad. Thus, firms had to “jump” borders to escape Brazil’s macro-economic conditions. After 1993, the domestic and exporting sectors switchedplaces. Domestic revenues dropped 74 percent in two years and then experiencedvirtually no growth between 1995 and 2004. Conversely, exports grew by 1,647percent between 1993 and 2000, clearly displaying signs of a substitution effect.
C&RS exports, however, peaked in 2000, then shrank by 14.3 percent in 2001,and then grew just 3.1 percent until 2003. After 2003, economic conditions startedto affect exports in a different way. Sales of C&RS services abroad resumed in
296 Exporting Services

2004—the year when the domestic sector also grew significantly. Whereas domes-tic revenues grew by 55.7 percent between 2003 and 2007, foreign sales grew by148.0 percent during the same period.
The strengthening of the domestic market was an important factor contribut-ing to firms’ competitiveness abroad. The 2002–07 period was a time of consoli-dation and growth in the size of firms. Despite the increase in both domestic andexport revenues, the total number of firms decreased, increasing the average rev-enue by 69.9 percent. Growth is also reflected in the average number of employeesper firm, which grew by 36.8 percent as these companies gained strength to com-pete in the global market.
Furthermore, according to the World Bank’s Doing Business data, the cost ofdealing with construction permits significantly decreased from 66 percent of percapita income in 2006 to 51 percent in 2010 (figure 8.16). Construction permitsare inefficient and generate deadweight loss in the economy. As the costs of suchpermits decrease as a share of total expenditure, factors that add value (such asskilled labor or high-quality material) account for a larger portion of the growth
Service Exports from Brazil 297
Figure 8.16. Cost of Dealing with Construction Permits, 2006–10
65.7
62.2
59.4
46.7
50.6
40
45
50
55
60
65
70
20062007
20082009
2010
shar
e of
inco
me
per
cap
ita (
%)
Source: World Bank’s Doing Business database, http://www.doingbusiness.org.

in costs. Increased expenditures in these areas do not harm sector competitive-ness; rather, expenditures greatly increase the competitiveness of national firms,thus increasing firms’ chances of surviving in international markets.
The sector has also benefited from the support of BNDES. Moreover, the con-struction sector considers government support the most important reason for itssuccess in exporting services followed by entrepreneurial strategies and FDI open-ness (figure 8.17).
Significantly lagging: Transport services
Although Brazil seems to be on the right path for economic development, it stilllags its potential, both in terms of GDP growth and international market partic-ipation. One of the main factors hindering Brazil’s progress in exporting serv-ices (in particular, transportation services) is the country’s highly deficientphysical infrastructure. Ineffective regulation, lack of investment, and unbal-anced transportation mode use are some of the reasons for the poor quality ofBrazilian transportation networks. Transportation infrastructure has a major
298 Exporting Services
0
2
4
6
8
10
businessenvironment
regulatoryframework
availability ofqualified labor
cost of labor
infrastructure
institutions
language andcultural affinity
FDI openness
entrepreneurialstrategy
governmentsupport
Figure 8.17. Importance of Each Fundamental Aspect, Construction
Source: Data from São Paulo Association of Entrepreneurs of Public Works.Note: Importance is ranked on a scale of 1 to 10, where 1 is least important and 10 is most important.

effect on the overall performance of the economy. Poor quality of physical infra-structure creates bottlenecks for goods trade, which, in turn, restricts trade intransport services.
Brazil ranked 74th in the Global Competitiveness Report 2009–2010 for infra-structure, which does not even reflect the country’s poor performance in theindividual transportation areas (Schwab 2009). Brazilian general infrastructureranked 81st, while specific infrastructure ranked 65th. The lack of railroadsearned the country the 86th position in that category, and port infrastructureranked 127th. Because most Brazilian airports operate close to or above capac-ity, air transport infrastructure earned the 89th position. Also, the lack of infrastructure in maritime and air transport modes leads to overuse of roadtransport, which already suffers from quality problems. Brazil ranked 106th forroad quality, and overuse of roads further deteriorates the network. The country’sdependence on ground transport is an obstacle to major reconstruction work.Figure 8.18 compares Brazil and the United States in terms of infrastructure andtransport infrastructure.
Service Exports from Brazil 299
Figure 8.18. Competitiveness of Transport Infrastructure, Brazil versus theUnited States, 2009–10
0
1
2
3
4
5
6
overall infrastructure
specific infrastructure
roads
railroad infrastructure
port infrastructure
air transportinfrastructure
Brazil (74th) United States (8th)
Source: Schwab 2009.Note: Competitiveness is ranked on a scale of 1 to 6, where 1 is least competitive and 6 is mostcompetitive.

The Inter-American Development Bank’s publication, “Unclogging theArteries: The Impact of Transport Costs on Latin American and CaribbeanTrade,” estimates that a 10 percent reduction in freight costs in nine LatinAmerican countries, including Brazil, could result, on average, in a 39 percentincrease in goods exports to the United States, compared to only a 2 percentincrease if U.S. tariffs were lowered by 10 percent (Mesquita Moreira, Volpe,and Blyde 2008). The lack of high-quality infrastructure directly affects thetransport industry’s competitiveness abroad, and it indirectly limits transportservice exports by reducing goods trade and making goods more inefficientand expensive.
The transport service subsector has always had the potential to be competitivein the global market because Brazil’s domestic market size and physical dimen-sions could be seen as comparative advantages. However, lack of competition,especially in air transport, allowed for the survival of inefficient firms and for theexistence of high margins, which discouraged international ventures.
Export Promotion Policies
ApexBrasil, the Brazilian trade and investment promotion agency, supports proj-ects comprising export promotion activities (unlike BNDES, which providesfinancial support). In general, sector associations, goods and service exporters, ormicro or small enterprise consortia design and propose the projects. Projects sup-ported by ApexBrasil are grouped into three main categories:
• Integrated sectoral projects benefit companies that are active in a certain sector,with nationwide coverage.
• Projects for groups of small exporters benefit small enterprises organizedunder consortia or cooperatives.
• Single-purpose projects aim to achieve a specific promotional initiative.
In services, ApexBrasil emphasizes the so-called creativity sectors, includingmusic, audiovisual, entertainment, and fashion. The ICT and health servicesectors are also included in current programs by the agency. The following areunder ApexBrasil’s export promotion plans:
• Entertainment and services. ApexBrasil promotes economic activities inwhich creativity is the most important asset, including Brazilian music,musical instruments and accessories, film and television (coproduction oftelevision programs and documentaries), advertising films, franchises, andtourism.
300 Exporting Services

• Projeto Brasil MIXITUP. The main objective of this project is to promote theinternationalization of Brazilian entertainment companies, increase the
number of exporting companies, consolidate existing markets, and open newmarkets for Brazilian goods and services.
• ICT. The Brazilian software industry stands out in the global IT marketbecause of its excellence and the quality of its products. With the goal of lever-aging exports from the sector, ApexBrasil has been actively working in the soft-ware and related service sector. ApexBrasil emphasizes the following verticalsegments: software for banking automation, telecommunications, electronicgovernment, Internet, health care, business management, security, games, andapplication service provider services.
• Health. Initiatives support a variety of high-value-added products in the healthservice sector, such as medical, dental, hospital, and laboratory articles andequipment, as well as health and hospital management services.
The Brazilian government has also been promoting exports through horizontaland vertical policies of a broader nature. In May 2008, Brazil implemented thePolicy for Productive Development (Política de Desenvolvimento Produtivo, orPDP), which aims to expand Brazilian supply capacity, continuously improvethe current account, increase innovative capacity, and strengthen SMEs. ThePDP’s main goals are to increase the investment rate, expand the participationof Brazilian exports in the world market, increase private spending on researchand development, and augment the number of exporting SMEs.
The PDP’s mobilizing programs for strategic areas include ICT, nanotechnol-ogy, and biotechnology, as well as the defense industrial complex, nuclear powerindustrial complex, and health industrial complex. There are also programs tostrengthen the country’s competitiveness, with a focus on productive complexesthat have export potential. Special institutional arrangements are devoted to serv-ice exports, such as the service complex, which aims to increase service exports;provide Brazil with a system for information, management, and operations ininternational service trade; diversify and proliferate Brazilian service exports; andqualify companies that provide services in international trade.
In the specific case of service-related skills and qualifications, studies haveshown that an increase of 1.00 percent in the average time devoted to educationby workers improves the propensity of firms to export services by 0.68 percent,whereas the corresponding figure for the export of goods is only 0.02 percent.In other words, education and skills more significantly influence serviceexports than they do goods exports at the firm level, which points to the greaterbenefits of public policy tailored to human capital capacity-building in servicesectors (Moreira, Alves, and Kubota 2006).
Service Exports from Brazil 301

Role of Private Associations
The Brazilian International Trade Association is a private association that sup-ports goods and service-exporting companies. It gathers statistics and studies rel-evant subjects to develop policy, solve problems, and help improve productionmethods to achieve better productivity, lower costs, and higher quality. TheBrazilian International Trade Association also helps improve financing andinsurance systems for export activities, and it lobbies for policies that facilitateinternational trade. In addition, the association proposes ways to ease the cre-ation of new, export-oriented firms and the expansion of existing ones that focuson trade. Furthermore, it provides legal consulting to its members and connectswith similar entities abroad, as well as with international organizations.
A similar institution is the Center for International Trade Studies Founda-tion, which has the primary objective of developing Brazilian internationaltrade. The foundation is an independent and permanent channel for commu-nication between the public and private sectors. It plays an important role inimplementing international trade policies that correspond to the ambitionsand capacity of entrepreneurs. The Center for International Trade StudiesFoundation conducts and publishes sector-level studies about the main aspectsinvolved in import and export activities, supplying technical support and man-agerial tools to entrepreneurs. Training and qualifying specialized technicalstaff members, providing courses, and contracting studies are also among itsactivities.
Both the Center for International Trade Studies Foundation and the Brazilian International Trade Association are very focused on trade in goods.Trade in services, or service exports for that matter, have rarely been a topic ofstudy, debate, or strategic thinking on the part of those two institutions. All thesame, Brazil is home to national confederations of industry, agriculture, com-merce, transport, and, recently, tourism. Clearly, those confederations andstate-level federations related to service sectors (such as those in commerce,transport, and tourism) do deal with matters related to services, but with astrong domestic focus.
The private sector is also very well organized into national sector associationsrelated to the various service sectors, many of which have been consulted for thisstudy. Most of these associations tend to focus on the domestic market rather thanforeign trade or international markets.
Only recently, an informal group of service-related institutions called theServices Dialogue (Diálogo Serviços) has begun addressing services. The groupmeets at the São Paulo Federation of Commerce. As a general rule, Brazil hasnot yet been amenable to the worldwide movement toward the formation of
302 Exporting Services

business-supported service coalitions, which were much more common in the1980s and 1990s, when multilateral and regional trade negotiations were popu-lar. However, great scope exists for the private sector to increase its involvementin matters relating to general service trade—particularly service exports. As theBrazilian economy continues its internationalization, greater institutionalinvolvement on the part of business entities will tend to increase their influenceand supporting role in government efforts to develop services exports.
Conclusion
Brazilian growth in service exports has witnessed three distinct phases. The firstphase is characterized by the export of construction and C&RSs. As a result oftheir experience in domestic infrastructure projects from the 1950s to the 1970s,several Brazilian construction companies could successfully bid on internationalprojects. The second phase of internationalization in service exports took placeat the end of the 1980s, reaching a broad range of sectors, such as audiovisual,transport, and financial services. The third phase of internationalization of serv-ices started in the 1990s, when new and small ICT companies engaged in serviceexports. The advent of ICT companies owes much to the demand created by thefirst wave of internationalization, because newly internationalized companiesneeded help developing and maintaining software, installing and integratingsoftware and telecommunication systems, processing and storing data, devisingprograms, creating network services, and so on.
The pattern of service export development that Brazil followed is distinct fromthat of other successful countries, such as India and the Philippines. In the case ofBrazil, outward FDI paved the way for cross-border exports in the software servicesector. Thus, for Brazil, outward FDI may be a successful strategy for expandingthe export of a wide range of services.
In some sectors, macroeconomic conditions explain export performance.Macroeconomic instability and strict stabilization policies during the 1990s pushedconstruction services abroad in search of other markets for stability and growthopportunities. In other sectors, a combination of factors (such as macroeco-nomic stability, technology-driven changes, and economic growth) explainssector performance.
In the case of transport services, goods trade explains growth in serviceexports. In this context, domestic liberalization policies and worldwide liberaliza-tion of the 1990s, including at the regional level, explain the increase in goodstrade and, consequently, transport service performance. In addition to promotinggrowth in goods exports, the domestic transport sector plays a role in supportingtransport service exports.
Service Exports from Brazil 303

Yet compared with other sectors in Brazil, transport services seem to be lagging.The transport service sector has always had the potential to be competitive in theglobal market because of its domestic market size. However, the lack of competi-tion, especially in air transport, allowed inefficient firms to survive and, hence,allowed the existence of high margins, which discouraged international ventures.The creation of Gol Airlines in 2001, for instance, revolutionized the Brazilian airtransport market and coincided with the increasing trend in transport exports.
The business environment heavily influences growth of the ICT industry. Otherfundamental factors that encourage software service exports are availability ofhuman skills, similarity in time zones with other Latin American countries and theUnited States, and low labor costs relative to developed service-importing coun-tries. The recent global financial crisis has helped the Brazilian ICT sector, becauseoutsourcing constitutes an effective means of reducing costs. The country’s busi-ness environment is among the reasons for its success in exporting services.
Human skills and education play a significant role in Brazil’s service perform-ance. In the case of the ICT sector, the main concern for future development isskills. Because of increasing demand, most technicians and professionals enter thelabor market before finishing a formal university course. In addition, the softwareservice sector points to the cost of labor as the most important fundamentalaspect underlying its competitiveness, or its lack thereof, particularly when com-pared with competing countries.
BNDES is the main financing branch of the federal government, offering anextensive number of solutions to firms that support construction export services.In 1997, BNDES started programs for promoting service exports. The first pro-gram, which began in 1997, supported the export of Brazilian services for buildinghighways to Ecuador. A year later, in 1998, construction exports peaked in growth.Financing was vital in these construction projects, and large firms dominatedglobal construction. BNDES’s spending on credit lines increased 28-fold between1998 and 2009, having gone from US$49.0 million to almost US$1.4 billion dur-ing the period.
BNDES has a special focus on supporting exports of services that have highintellectual content, such as software and computer services and engineering serv-ices in infrastructure projects. In the case of software and computer services,BNDES’s involvement has taken place under the program Prosoft Export, whichfocuses on SMEs in the sector.
More traditional export promotion activities implemented by the promotionagency ApexBrasil are still in their infancy and seem to have played a minor role inBrazil’s service export success.
304 Exporting Services

Table 8.A.1. The Largest Nonfinancial Companies and Firms in Latin America and the Caribbean and Their Investments outside TheirCountries of Origin, 2007
Company Country
Sales (US$
million)
Sales abroad
(%)
Domestic sales (%)
Employees abroad
(%) Sector
Petróleos de Venezuelaa Venezuela, RB 110,000 98 — 49 Oil and gas
Petrobras Brazil 87,476 21 12 62 Oil and gas
Techint Argentina 39,770 63 63 52 Diversified
Companhia Vale do Rio Doce Brazil 33,115 84 46 50 Mining
Banco Itaú Brazil 31,195 13 23 — Banking
América Móvilb Mexico 29,113 50 32 — Telecommunications
CEMEX Mexico 21,673 82 71 50 Cement
Mexichem Mexico 21,170 50 31 — Petrochemicals
Grupo Modelo Mexico 17,291 37 — 41 Beverages
Gerdau Brazil 17,283 54 39 32 Steel and metallurgy
FEMSA Mexico 16,453 17 44 57 Beverages
Grupo Votorantim Brazil 13,589 16 5 50 Diversified, cement, mining, and steel
Telmexb Mexico 12,108 52 52 — Telecommunications
Braskem Brazil 9,981 20 6 — Petrochemicals
Grupo Alfa Mexico 9,750 53 70 39 Diversified
Annex 8.A: Investments of Nonfinancial Firms in Latin America and the Caribbean
Table 8.A.1 lists the largest nonfinancial companies and firms in Latin America and the Caribbean that had investments outsidetheir country of origin. Brazilian firms are shaded.
30
5 (Table continues on the following page.)

Cencosud Chile 7,623 37 63 97 Retailing
Camargo Corrêa Brazil 7,175 19 26 32 Diversified
Companhia Siderurgica Nacional Brazil 6,978 24 — — Steel
Grupo Bimbo Mexico 6,756 31 60 90 Food
Falabella Chile 5,560 29 27 59 Retailing
Andrade Gutierrez Brazil 5,096 7 4 13 Construction
Odebrecht Brazil 4,950 77 15 54 Diversified and construction
Embraer Brazil 4,896 96 45 24 Aerospace
Sadia Brazil 4,874 46 1 52 Food
TAM Brazil 4,248 10 — 13 Transport and logistics
Sudamericana de Vapores Chile 4,131 90 58 7 Transport and logistics
Perdigão Brazil 3,745 41 — 40 Food
Grupo Elektra Mexico 3,647 55 12 35 Diversified and retailing
LAN Chile 3,525 85 63 15 Transport and logistics
Grupo Maseca Mexico 3,347 66 15 20 Food
Source: ECLAC 2008 based on information provided by the Department of Studies and Special Projects of América Economiá.Note: — = not available. a. Data are estimated sales.b. The sales of América Móvil and Telmex are presented separately.
Table 8.A.1. The Largest Nonfinancial Companies and Firms in Latin America and the Caribbean and Their Investments outside TheirCountries of Origin, 2007 (continued)
Company Country
Sales (US$
million)
Sales abroad
(%)
Domestic sales (%)
Employees abroad
(%) Sector
306

Notes
1. Valls Pereira, Sennes, and Muder (2009) confirm that the dynamic performance of Brazil’s serv-ice exports is associated with the internationalization of Brazilian companies. However, they stress theimportance of the rise of inward FDI in the service sector, which expands Brazil’s export capacity. Theyalso emphasize the role of Brazilian investment abroad, particularly within the region, in the servicesector.
2. This process of internationalization of Brazilian companies has had support from BNDES since2002 (Alem and Cavalcanti 2005).
3. Information on Brazilian FDI can be found on the Central Bank of Brazil website athttp://www4.bcb.gov.br/rex/cbe/port/ResultadoCBE2009.asp.
4. There were no privatizations in the 2000s, which included the last two mandates of PresidentLuiz Inácio Lula da Silva.
References
Alem, Ana Claudia, and Carlos Eduardo Cavalcanti. 2005. “O BNDES e o Apoio à Internacionalizaçãodas Empresas Brasileiras: Algumas Reflexões.” Revista do BNDES 12 (24): 43–76.
A.T. Kearney. 2009a. “Next Steps in the Strategic Agenda for the ‘IT Offshore Outsourcing’ Sector.”Final master report, BRASSCOM, São Paulo, Brazil.
———. 2009b. “The Shifting Geography of Offshoring: The 2009 A.T. Kearney Global ServicesLocation Index.” A.T. Kearney, Chicago. http://www.atkearney.com/images/global/pdf/Global_Services_Location_Index_2009.pdf.
———. 2011. “Offshoring Opportunities amid Economic Turbulence: The A.T. Kearney Global Serv-ices Location Index, 2011.” A.T. Kearney, Chicago. http://www.atkearney.com/images/global/pdf/Offshoring_Opportunities_Amid_Economic_Turbulence-GSLI_2011.pdf.
Bastos Tigre, Paulo, and Marta Lemme. 2010. “Las Exportaciones de Servicios Bancarios en Brasil.” InLa Exportación de Servicios en América Latina: Los Casos de Argentina, Brasil y México, ed. AndrésLópez and Daniela Ramos, 187–97. Montevideo: Red Mercosur de Investigaciones Económicas.
dos Santos, Luiz Alberto. 2010. “Regulation: The Challenge to Govern Better, Learning from Failures toPrepare for the Future.” Paper presented at the Organisation for Economic Co-operation andDevelopment Conference on Regulatory Policy at the Crossroads, Paris. October 29.
ECLAC (United Nations Economic Commission for Latin America and the Caribbean). 2005. ForeignDirect Investment in Latin America and the Caribbean. Santiago: ECLAC.
———. 2008. Foreign Direct Investment in Latin America and the Caribbean. Santiago: ECLAC. Economist. 2011. “Executive Pay in Brazil: Top Whack—Big Country, Big Pay Cheques.” Economist,
January 27.Fonseca Moreira, Benedicto. 2007. “A Construção de uma Política de Exportação de Serviços.” Discus-
sion paper, Brazilian Foreign Trade Association, Rio de Janeiro, Brazil. Fuoco, Taís. 2009. “Na Contramão do Mercado, sobram Vagas No Setor de TI.” Revista Exame,
January 27.Galvão, Bruno, and Fabrício Catermol. 2008. “Exportações de Serviços e o Apoio do BNDES.” BNDES
Setorial: Comércio Exterior 28 (September): 73–104.Marques, Felipe Silveira. 2009. “Brasil: Mercado Interno como Base de Crecimiento.” In Desafíos y
Oportunidades de la Industria del Software en América Latina, ed. Paulo Bastos Tigre and FelipeSilveira Marques, 67–104. Santiago: ECLAC.
Mesquita Moreira, Mauricio, Christian Volpe, and Juan S. Blyde. 2008. “Unclogging the Arteries: TheImpact of Transport Costs on Latin American and Caribbean Trade.” Inter-American Develop-ment Bank, New York.
Moreira, Sérvulo Vicente, Patrick Franco Alves, Luis Cláudio Kubota. 2006. “Firmas de Serviços Expor-tadoras: Um Estudo sobre Setores Selecionados.” In Estrutura e Dinâmica do Setor de Serviços no
Service Exports from Brazil 307

Brasil, ed. João Alberto de Negri and Luis Cláudio Kubota, 231–58. Brasília: Instituto de PesquisaEconômica Aplicada.
OECD (Organisation for Economic Co-operation and Development). 2008. Reviews of RegulatoryReform: Brazil—Strengthening Governance for Growth. Paris: OECD.
———. 2010. PISA 2009 at a Glance. Paris: OECD. http://www.oecd.org/dataoecd/31/28/46660259.pdf.
Reina, Peter, and Gary J. Tulacz. 2008. “The Top 225 International Contractors: Prices Soar in a BoomMarket.” Engineering News-Record, August 13. http://enr.construction.com/features/international/archives/080813c-1.asp.
Schwab, Klaus, ed. 2009. The Global Competitiveness Report 2009–2010. Geneva: World EconomicForum.
SOFTEX. 2009. Software and IT Services: The Brazilian Industry in Perspective. Campinas, Brazil:SOFTEX. http://brazilexportati.files.wordpress.com/2008/11/software-and-it-services-2009_final.pdf.
Valls Pereira, Lia, Ricardo Sennes, and Nanno Muder. 2009. “Brazil’s Emergence as the Regional ExportLeader in Services: A Case of Specialization in Business Services.” Comercio Internacional 94,ECLAC, Santiago.
308 Exporting Services

Chile is well known as an early reformer in Latin America as well as among devel-oping countries. Its reform process and results have been examined extensively byboth the academic world and multilateral organizations. Chilean reforms havethree distinctive features. First, when most developing countries believed inimport substitution policies and the state’s strong role in development, Chileembraced liberalization as early as the mid-1970s. Second, the scope of its reformswas broad, not only covering all dimensions of the economy but also addressingpolitical aspects of the country. And third, although the path of reform wasbumpy, especially in the initial phase, long-term assessments of the reforms havebeen widely positive.
Among the reforms, the trade policy has received significant attention. Thegrowth performance of exports of goods has been strong, and the overall develop-ment strategy is based on an open economy with a low import tariff and a few
309
9
The Elusive Road toService Export
Diversification: The Case of Chile
Francisco J. Prieto, Sebastián Sáez, and Arti Grover Goswami
The authors wish to express their gratitude to Alicia Frohmann, Osvaldo Marinao, and Ignacio Fernández of ProChile; George Lever and Joaquin Piña of the Santiago Chamber of Commerce;Ana Novik and Mario Benavente of the Directorate General of International Economic Relations; andMario Castillo of the Economic Commission for Latin America and the Caribbean, who provided theauthors with valuable insights and information as well as references. Also our thanks is extended toDorotea López and Felipe Muñoz of the University of Chile) for their assistance with the tables and fig-ures in this paper. Errors and omissions are exclusively the authors’ responsibility.

nontariff barriers. Foreign investment has consistently been strong, and investorsenjoy access to a wide set of economic activities.
In contrast to the dynamism of trade in goods, service trade has shown amore modest growth pattern, especially when compared to the activities ofother developing countries in areas such as business, professional, and informa-tion technology (IT)–enabling services (figure 9.1). Service export growth hasbeen strong in transportation services, particularly in maritime and air trans-portation services where Chilean companies such as Compañia Sudamericanade Vapores and LAN Airlines, respectively, have become global and regionalplayers.
However, traditional transport is not the only service export from Chile. Newservice exports have emerged in recent years. For instance, about 6,000 foreignersvisit Chile annually seeking health treatment, and Chilean construction compa-nies have started establishments abroad, particularly in other Latin Americancountries. Engineering service exports, especially mining engineering services,have been growing strongly from less than US$13 million in 2003 to US$30 million in 2008. Special incentive programs established by the Chilean govern-ment have attracted several multinational firms to set up their operations for
310 Exporting Services
0
10,000
20,000
30,000
40,000
50,000
60,000
70,000
80,000
2000
2001
2002
2003
2004
2005
2006
2007
2008
2009
2010
US$
mill
ion
exports of goods exports of services
Figure 9.1. Chile’s Exports of Goods and Services, 2000–10
Source: Central Bank of Chile. Note: Chile has benefited since 2004 from a significant increase in the international prices of keycommodities, which makes comparison between goods and service exports growth more difficult.

providing a wide range of knowledge process operation and business processoperation services. Finally, Chile has been relatively more successful in exportingretail distribution services and financial services through investment in otherLatin American countries. Nonetheless, wide-scale success in cross-border serv-ice exports from Chile is not observed. Thus, the question remains why a countrythat has been successful in its outward-oriented development strategy and main-tains an open trade and investment regime, including in a wide range of servicesectors, has not been able to become a successful cross-border service exporter.This chapter attempts to answer that question.
The following section briefly examines the importance of services in theChilean economy. The second section analyzes the importance of trade in servicesand service exports in the Chilean economy, and the third section focuses onChile’s performance in service exports other than transportation and travel. Thefourth section analyzes the fundamental factors that determine export perform-ance, and the fifth section looks at the specific factors that explain Chile’s positionin service exports. The final section provides an overview of the main findings aswell as policy recommendations.
Services in the Chilean Economy
Chile’s unilateral liberalization and economic reforms from 1975 to 1989 haveplayed a major role in achieving rapid growth of exports of both traditional andnontraditional products and greater diversification in terms of products and mar-ket destinations during this initial phase. The economic reform during this periodmarked a profound change in the economic development strategy that Chile hadadopted since the early 1930s. One of the pillars of this transformation was thechange of the state’s role in the economy.
In achieving this goal, major state-owned enterprises were privatized, includ-ing those in the electric power industry, telecommunications, steel, and othersectors. But privatizations were not the only means of increasing the role of theprivate sector in the economy. Major regulatory reforms were introduced inactivities where the public sector was a dominant service provider, such as pen-sions, education, and health. In all these sectors, the main purpose of reformswas to allow providers from the private sector—both foreign and national—toactively compete with the public sector in supplying services.
Further efforts to secure greater liberalization were made in other service sec-tors from 1990. In particular, in the telecommunication sector, where reformsstarted in the mid-1980s, broad deregulation was introduced in 1994, promptinggreater competition, specifically in long-distance services. In the financial sector,continuing reforms have expanded the range of available services while at the
The Case of Chile 311

same time improving the supervision of banks, insurance companies, and securi-ties (Sáez and Sáez 2006).
The private sector became involved in providing public infrastructure tradi-tionally left in the hands of the state in areas such as construction of highways,management of port and airport services, and management of water and sewagesystems. Finally, the process of privatizing public enterprises continued, albeit at aslower pace than in previous years. Nevertheless, although the government hadprivileged a regulatory function, it also maintained a significant role as a providerin several important economic activities (for example, mining, energy, and bank-ing), although in competition with the private sector.
Despite the Chilean economy’s overall good performance, the share of all servicesectors in gross domestic product (GDP) has remained in the range of middle-income countries. As shown in table 9.1, the service sectors represented 55.5 percentof GDP in 1995 and 52.3 percent in 2008. The share for middle-income countries was51.3 percent and 53.5 percent in 1995 and 2008, respectively. Moreover, in the case ofChile—similar to the patterns observed in Latin America and the Caribbean—theshare of services has fluctuated sharply, not showing a clear upward trend, unlikeother groups of countries or regions such as East Asia and the Pacific or South Asia.1
If one considers a longer-term perspective and compares the Chilean perform-ance to that of different regions, two interesting peculiarities emerge. First, thegrowth of services matches the overall growth of the Chilean economy—as in theLatin American region—but this finding is in contrast to South Asia, wheregrowth in the service sector tends to outpace growth in the economy (figure 9.2).Second, Chile’s growth performance, as well as the growth of services, diminishedfrom 2000 onward.
The composition of Chile’s service sectors has remained relatively stable inrecent years. In 2008, the most important subcategories within the Chilean servicesector, in decreasing order, were financial and business services (26.5 percent);personal services (16.8 percent); and commerce, restaurants, and hotels (15.3 per-cent). Interestingly, the share of financial and business services in GDP increasedfrom almost 24.0 percent to 26.5 percent, whereas transport and personal serviceswere the only subsectors that showed a decrease in their share of GDP.
Service employment increased sharply during the 2000s. Between 2000 and2008, it rose from 70 percent to 74 percent of total employment. The sector withthe highest employment-generating capacity is personal, communal, and socialservices, although its relative weight is declining. Employment in financial andbusiness services has been growing steadily, and in 2008 it represented 12.4 per-cent of all the employment generated by the service sector.2
Average remunerations in mining; electricity, gas, and water; financial andbusiness services; and personal, communal, and social services, in that order,
312 Exporting Services

Table 9.1. Share of Services in GDP, 1990–2008
Share of GDP (%)
Country or region 1990 1995 2000 2001 2002 2003 2004 2005 2006 2007 2008
Chile 49.8 55.5 55.5 55.5 54.8 58.5 55.6 53.5 48.9 48.9 52.3Organisation for Economic Co-operation and Development 65.0 68.3 70.6 71.6 72.3 72.6 72.5 72.8 72.7 73.1 —Middle-income countries 45.7 51.3 53.6 54.7 54.2 53.2 52.8 52.6 52.8 53.0 53.5Latin America and the Caribbean 55.4 63.8 64.7 65.4 63.5 60.7 59.3 59.9 60.8 61.0 60.6East Asia and the Pacific 35.2 36.5 41.0 42.1 43.0 42.7 42.0 41.3 41.2 41.4 40.9South Asia 44.7 46.5 50.3 51.3 52.4 52.7 52.4 52.1 52.4 52.4 53.5
Source: World Bank’s World Development Indicators database. Note: — = not available.
31
3

314 Exporting Services
Figure 9.2. Growth Rate of GDP and Services, 1990–2008
–2.0
0.0
2.0
4.0
6.0
8.0
10.0
12.0
14.0
1990
1991
1992
1993
1994
1995
1996
1997
1998
1999
2000
2001
2002
2003
2004
2005
2006
2007
2008
rate
(%
)
b. Chile and middle-income countries
–2.0
0.0
2.0
4.0
6.0
8.0
10.0
12.0
14.0
1990
1992
1994
1996
1998
2000
2002
2004
2006
2008
rate
(%
)
a. Chile and Latin Americaand the Caribbean
services, Chile GDP, Chileservices, Latin America and the CaribbeanGDP, Latin America and the Caribbean
services, middle-income countries GDP, middle-income countries
services, Chile GDP, Chile

The Case of Chile 315
Figure 9.2. (continued)
–2.0
0.0
2.0
4.0
6.0
8.0
10.0
12.0
14.0
1990
1992
1994
1996
1998
2000
2002
2004
2006
2008
rate
(%
)c. Chile and South Asia
–2.0
0.0
2.0
4.0
6.0
8.0
10.0
12.0
14.0
1990
1992
1994
1996
1998
2000
2002
2004
2006
2008
rate
(%
)
d. Chile and East Asia and the Pacific
services, South Asia GDP, South Asia
services, Chile GDP, Chile
services, East Asia and the Pacific GDP, East Asia and the Pacific
services, Chile GDP, Chile
Source: World Bank’s World Development Indicators database.

are all above the national average. Also, in decreasing order, the remunerationin telecommunication services, commerce, and the construction sectors are allbelow the national average. Variations in average remunerations normallyreflect differences in labor productivity and labor skills among the differentsectors.
Between 58.5 percent and 65.3 percent of all fixed capital formation in2003–07 went to the service sector.3 Although property ownership receives thelargest share of all investment in services (31.2 percent in 2007), it is closely fol-lowed by investment in transport and communications (24.5 percent) and infinancial and business services (13.1 percent). These last two subsectors com-posed close to 38 percent of all investment in service activities during 2007.
Trade in Services: Chile in the Global Economy
In 2008, almost 90 percent of Chile’s GDP was traded. The share of merchandisetrade in GDP increased from 51 percent in 1990 to 76.5 percent in 2008. Thisincrease is largely explained by the increase in the price of the commoditiesexported by Chile, especially after 2005. In contrast, service trade as a share ofGDP has remained relatively constant. But it is worth noting that Chile’s serviceshare in GDP was much higher in 1990—12.4 percent, more than double LatinAmerica and the Caribbean’s 5.6 percent—than in any other region or group ofcountries (table 9.2). Unlike the experience in Chile, the share of trade in serv-ices in GDP has increased in all regions and groups of countries. South Asia, inparticular, shows a spectacular increase, which is mainly explained by India’sperformance.
The export sector’s relative size in the world economy is quite different forChilean goods and services. Chile represents 0.41 percent of world merchandisetrade but only 0.21 percent of world service exports. This factor itself indicatesthat Chile’s service export performance is rather modest when compared withthat of countries such as the Republic of Korea, whose share in world trade is 1.96percent. The corresponding figure for Malaysia is 0.78 percent and for Hungary,0.53 percent. Even Costa Rica, a country with one-fourth of Chile’s population,has a share of 0.11 percent of world service exports.4
Service exports also represent a relatively small share of Chile’s domestic econ-omy. They accounted for only 6.3 percent of GDP in 2008. As a comparison withAsian countries, this share was 15.5 percent in Malaysia; 8.4 percent in India,which has a less open economy than Chile; and 8.0 percent in Korea (table 9.3).The share of service exports in total exports is relatively similar to that ofArgentina and Brazil but below that of countries such as Costa Rica, India, and thePhilippines.
316 Exporting Services

Table 9.2. Trade as a Share of GDP, 1990–2008
Merchandise trade as a share of GDP (%) Trade in services as a share of GDP (%)
Country or region 1990 2000 2005 2006 2007 2008 1990 2000 2005 2006 2007 2008
Chile 51.1 50.1 62.6 66.0 70.0 76.5 12.4 11.8 12.6 11.1 11.5 13.1Organisation for Economic Co-operation and Development 29.9 36.2 40.1 43.0 44.6 46.2 7.6 9.1 10.6 11.1 11.9 12.3Middle-income countries 31.9 45.4 55.0 56.0 55.0 56.2 6.7 8.6 9.7 9.5 9.6 9.6Latin America and the Caribbean 23.0 36.1 40.8 41.3 40.9 41.9 5.6 6.1 6.3 6.0 6.1 6.1East Asia and the Pacific 47.0 59.5 74.7 75.4 72.3 68.0 7.3 9.7 10.2 10.0 10.1 9.4South Asia 16.4 24.0 32.3 34.2 32.8 41.3 4.2 6.8 10.3 11.5 11.0 12.8
Source: World Bank’s World Development Indicators database.
31
7

Evolution and Composition of Chilean Service Exports: Cross-Border Trade
Service exports totaled US$10,754.5 million in 2008, up from US$4,082.9 millionin 2000 and showing an average nominal growth rate for all service exports of 20.4percent a year since 2000. This finding is the result of a 24 percent annual averagegrowth rate in transport service receipts, a 14.3 percent annual rate for travel, anda 17.9 percent annual rate for other commercial services.
Imports of services totaled US$11,400.7 million in 2008, up from US$ 4,801.7million in 2000, with an average annual growth rate of 17.2 percent. Imports oftransport services grew, on average, by 25.8 percent; travel grew by 15.1 percentyearly, and other commercial service (OCS) imports expanded by 8.4 percentannually.
The evolution of service exports and imports led to a net deficit for the wholeperiod. Deficits ranged between US$618 million in 2003 and a high of US$974.9million in 2007. The widest gap is clearly in OCSs. The OCS deficit reached a max-imum of US$966.9 million in 2004. The accumulated deficit in OCS represents116 percent of the total accumulated service trade between 2000 and 2008. Royal-ties and licenses, insurance, and financial services account for the three largestdeficits within this category. Because of its erratic growth pattern and although
318 Exporting Services
Table 9.3. Employment and Service Exports, 2008
Service employment Share in total as a share of total Service exports as a exports of goods
Country employment (%) share of GDP (%) and services (%)
Argentina 67.6 3.6 14.6Brazil 54.6 1.8 12.7Chile 64.7 6.3 13.8Costa Rica 60.7 13.6 29.8Czech Republic 49.6 10.2 13.2Egypt, Arab Rep. 36.9 15.2 45.2Korea, Rep. 63.2 8.0 14.6Hungary 55.9 12.9 15.7India — 8.4 35.3Indonesia 38.4 2.9 9.5Malaysia 50.3 15.5 13.2Mexico 55.5 1.7 6.0Philippines 45.0 6.1 17.4South Africa — 4.5 12.6
Source: World Trade Organization statistics database, services profiles, http://stat.wto.org/Home/WSDBHome.aspx?Language=E. Note: — = not available.

service exports grew faster than service imports, no clear trend for a widening orclosing trade deficit can be identified in the aggregate.5
Chile’s performance with regard to service exports is heavily influenced by theevolution of transport, especially maritime transport (figure 9.3), reflecting theimportance of both geographic location and the close link between transportservices and goods trade. During the decade 1998–2008, the evolution of Chileanservice exports exhibited a relative dynamism, particularly after 2002. The periodwas characterized by a rapid growth of transport services, reflecting the expansionof world demand for these services as well as unusually high transportationcosts.6 However, the OCS and travel categories exhibit a rather modest evolution,especially when compared to the world pattern for trade in OCSs. According toavailable data, OCSs were the least dynamic category of all Chilean serviceexports (figure 9.3).7 Some factors that could help explain why Chile’s OCSexport performance is comparatively weak are explored in box 9.1.
Because of the highly dominant contribution of transport services, the shareof OCS exports to total service exports decreased from 35 percent to 25 percentfrom 1995 to 2000 and remained practically unchanged between 2000 and 2008(figure 9.4).
The Case of Chile 319
Figure 9.3. Chile’s Service Exports, 1998–2008
0
2,000
4,000
6,000
8,000
10,000
12,000
1998
1999
2000
2001
2002
2003
2004
2005
2006
2007
2008
US$
mill
ion
total commercial services (excluding government services)transportationtravelother commercial services (commercial services minus travel and transport)
Source: Data from the World Trade Organization statistics database, http://stat.wto.org/Home/WSDBHome.aspx?Language=E.

320 Exporting Services
Box 9.1: Assessing the Performance of Chile’s Service Exports: An EconometricIllustration
Commercial service exports from Chile are large given per capita income, size of theservice sector, and GDP. In 2008, 60 percent of service exports from Chile were intransport services, and OCS exports constituted only 24 percent, whereas the reversewas true for the world average. In a world where globalization is increasingly leadingto offshoring of OCSs, such as computer and information services or other businessservices, why has Chile not been able to take advantage of this opportunity?
Actual OCS exports from Chile are below the level predicted by the level offundamental variables such as GDP per capita, service value added, and GDP, especiallyin recent years. What are the possible explanations for this underperformance? First,one must assess whether the penetration of the telecommunication networkaffects OCS exports in general and particularly in Chile. In this case, one finds thatInternet penetration in general does significantly affect OCS exports, and in the case ofChile, the extent of Internet penetration is significant in explaining its lack of success inOCS exports. Thus, the lower level of Internet penetration in Chile relative to its percapita income partially explains the relatively low contribution of OCS exports inaggregate service exports.
For a more complete picture, human capital skills were added to evaluate whetherthe level of human skills in Chile explains the level of OCS exports. Human capital, asproxied by average years of schooling, positively and significantly affects OCSexports. This finding means that the level of skills in Chile is also partially responsiblefor the relatively low level of OCS exports from Chile.
Also evaluated was whether the effect of Internet penetration or average years ofschooling has an effect on Chile that is different from that in other countries in thesample. Hence, an interaction term of Internet penetration and average years ofschooling was added. In this case, the coefficients for both these interaction terms areinsignificant, implying that the effect of a better telecommunication network or longeryears of schooling on Chile is no different from such an effect on the rest of the world.
Regarding other explanatory variables, given the state and quality of institutionsin Chile, this analysis finds Chile’s OCS exports are very low. Finally, it finds that thecoefficient for this interaction term is insignificant, implying that institutions affectOCS exports from Chile in the same manner as they do from any country.
This econometric exercise allows the following conclusions to be drawn. First, Chile isan example of a successful exporter of commercial services, but it is rather unsuccessfulin exporting OCSs. Second, telecommunication network density, as proxied by Internetpenetration; human capital skills, as proxied by average years of schooling; and physicalinfrastructure (road-length infrastructure) explain the success of Chile in exporting totalcommercial services, although it may appear as a contradiction that the same factorsexplain the lack of success in OCS exports from Chile.
How can this conclusion be reconciled? The presence of telecommunicationnetwork density or human capital skills in Chile seems to be enough to promotecommercial services such as transport or travel services, but it is low with respect tolevels required for providing OCS exports. Thus, factor endowment in Chile in termsof telecommunication network or human capital skills or road-length infrastructureencourages transport service exports, but because OCS exports are highly intensivein these inputs, Chile is not able to provide these services in the international market.The subsequent sections of this chapter further substantiate these findings.
Source: Authors’ analysis based on the annex to this chapter. Note: The results presented in this box illustrate the influence of a number of variables in serviceexport performance. Because of the data problems in services, the results must be interpretedwith caution.

The Case of Chile 321
Figure 9.4. Service Export Composition, 1995–2008
a. Chile
28
21 17
3525 24
0
10
20
30
40
50
60
70
80
90
100
1995
2000
2008
com
pos
ition
(%
)
37
55 60
b. World
3532
25
40 4551
0
10
20
30
40
50
60
70
80
90
100
1995
2000
2008
com
pos
tion
(%)
26 23 24
transportationtravelother commercial services
Source: WTO statistics database, http://stat.wto.org/Home/WSDBHome.aspx?Language=.
This pattern of Chile’s service exports presents a sharp contrast with recenttrends in world trade in services. As seen in figure 9.4, the relative importance ofOCSs is continuously growing, and today it clearly represents the lion’s share ofworld trade. In a very short period, the dynamism of this category has changedconsiderably the composition of world service trade. The share of OCSs increasedto 51.2 percent of total world exports in 2008, compared with 40 percent in 1995,whereas in Chile the share of OCSs decreased. This increase on the world leveltook place essentially at the expense of travel, which experienced several setbacksin this period.
Furthermore, despite the recent global financial crisis (2008–09), worldexports of OCSs continued to grow—albeit more slowly—during 2008. In thesame context, world exports of transport and travel decreased in absolute value.
Chile’s service trade pattern is markedly different from that of Brazil, China,India, Korea, the Russian Federation, Singapore, and other developing countriesthat have successfully benefited from the opportunities offered by the world mar-ket for OCSs in areas as diverse as information and communication technology(ICT) services, business services, professional and technical services, health serv-ices, construction services, and many others. A careful review of Chile’s data mayhelp identify a few niches of incipient dynamism within Chile’s service industriesand may suggest better prospects for the future of its service exports. Recently

revised figures from the Central Bank of Chile for 2000–09 provide more detailedinformation on the evolution of OCSs (table 9.4).
In 2000–08, although the overall composition of service exports remainedpractically unchanged, some industries within the OCS category performedrather well.8 However, this limited success was not enough to modify the overallcomposition of the country’s export basket. Within this category, sectors withrelatively high growth in the 2000–08 period were royalties and license fees(21.8 percent annually); personal, cultural, and recreational services (15.9 per-cent); insurance services (14.8 percent); informatics and information services(10.7 percent); and other business services (10.5 percent).
The sluggish expansion of other commercial services
In 2007, the Export Promotion Agency (Dirección de Promoción de Exporta-ciones, or ProChile), assisted by the Central Bank of Chile and the National Statis-tical Institute, conducted a preliminary study with the purpose of estimatingChile’s exports in categories other than transport and travel by the four deliverymodes for 2006 and 2007. According to this report, Chilean firms have, on aver-age, a low level of internationalization. The relative importance of foreign sales todomestic service production ranges around 2 percent. However, this study did notcover transport and travel services—two highly internationalized categories—nordid it make a reliable estimate of the importance of foreign sales in the case of for-eign affiliates (particularly important for retail).
Because the most dynamic activities in international trade in services that haveattracted attention in recent years are under the OCS category, in what follows thischapter looks more closely at that category. As previously mentioned, much of therelative dynamism of some specific industries in the past few years had an almostnegligible effect on the composition of Chile’s exports. Many of these exportsfrom Chile were minimal in 2000, and the current levels are still very low inabsolute terms.
Central bank data indicate that the evolution of other business services is note-worthy. Whereas in 2000 “merchanting” activities9 accounted for over 65 percentof this category, that share was down to 44 percent in 2008. Meanwhile, otherbusiness services, which includes professional and IT services, expanded fromUS$188 million in 2000 to US$707 million in 2008, increasing its share within thecategory from 31.4 percent in 2000 to 44.0 percent in 2008. .
A study financed by the Chilean Development Agency (Corporación deFomento, or CORFO) and IDC made further insights (IDC 2009). Using primarydata from the National Customs Service, the study provides 2008 revised valuesand 2009 estimates of global services, including ICT, business, engineering,
322 Exporting Services

Table 9.4. Composition of Other Commercial Service Exports in Chile
Amount (US$ million)
Personal, cultural,Communication Financial Information Royalties and Other business and recreational
Year services Insurance services services licenses services services Total
2000 207.3 76.0 37.5 33.4 10.0 601.6 21.7 987.52001 124.7 70.5 34.2 42.8 24.9 652.0 29.0 978.12002 161.8 137.9 24.6 62.9 41.1 745.3 38.6 1,212.22003 158.1 124.1 29.6 81.4 45.5 829.9 67.6 1,336.22004 162.7 136.2 31.4 70.5 48.5 889.8 58.3 1,397.42005 147.8 163.1 34.0 74.2 54.0 1,087.4 69.2 1,629.72006 142.9 189.3 37.4 78.4 55.2 1,236.3 78.4 1,817.92007 150.8 224.4 39.8 82.0 61.2 1,517.8 84.5 2,160.52008 165.4 258.4 46.6 96.0 63.6 1,759.2 110.6 2,499.82009 153.4 262.4 41.8 83.6 59.2 1,472.6 81.9 2,154.9Average annual growth rate (%) –3.3 14.8 1.2 10.7 21.8 10.5 15.9 9.1
Source: Data from Central Bank of Chile.Note: Construction service exports are not included in the total.
32
3

research and development, medical, and digital media and content services. Dataare organized under four categories: innovation process operations, knowledgeprocess operations, business process operations, and IT operations. All these serv-ices are offshored from Chile through digital means.
According to IDC (2009) estimates, total exports of global services amountedto US$843.6 million in 2008. About 60 percent of all global service exports wereconcentrated in three items: knowledge process operations (32.7 percent), whichcomprise mostly engineering services and to a lesser extent, business, digitalmedia and content, and financial services; horizontal business process operations(18.3 percent), which are mainly process operation services such as marketing,sales, and customer service; and IT software applications (20 percent) (figure 9.5).This study shows evidence of an attractive potential for certain segments of theglobal service category, particularly through the offshoring of engineering servicesand the development of application software.10
Regarding destination markets, the IDC (2009) study identifies Latin Americancountries as the major markets for Chilean global service exports, with 50.4 percentof the total. Peru (43 percent), Mexico (10 percent), and Argentina (9 percent)account for 62 percent of total exports to this region. Brazil, the largest market inLatin America, represents only 3 percent of total exports. Other major destina-tion markets are the United States (21.1 percent), Spain (11.2 percent), and therest of Europe (7.7 percent). The rest of the world has a share in total exports of9.5 percent. Interestingly, foreign firms are the main exporters of offshoring serv-ices (66 percent of the value) although they represent only 29 percent of thenumber of offshoring firms (figure 9.6).
Another important component of the OCS category is retail (box 9.2). Salesthrough foreign affiliates have become particularly relevant in the case of the retailsector, for which about 60 percent of total revenues come from operations abroad.According to a Deloitte study that ranks retail sales for Latin America, Cencosud,the largest Chilean retailer with operations abroad, was ranked first in the regionin 2008–09 with US$11.2 billion in sales.11 In this latest ranking, Cencosud over-took the leading position, which Brazilian group Pão de Açúcar held for manyyears. Over time, retail providers also became financial service providers both inChile and abroad.12
A study prepared by the Center for Retail Studies (CERET 2009) of the Univer-sity of Chile has identified a typology for Chile’s internationalized retail sector. Itnotes that Chilean companies are currently operating internationally in varioussegments of retail business: supermarkets, convenience stores, discount stores,department stores, home improvement stores, and specialized shops such as drug-stores and pharmacies.
324 Exporting Services

Figure 9.5. Chilean Offshoring Exports
9797
0
37844
35276
240
199
154
45
170131
318
0 50 100 150 200 250 300 350 400
total innovation process operationsresearch and development servicesnew product development services
total knowledge process operationsbusiness services
digital media and contentengineering services
financial servicesmedical services
total business process operationshorizontals
verticals
total IT operationsapplications and software outsourcing
IT consultingIT infrastructure
US$ million
Source: IDC 2009.32
5

Figure 9.6. Firms’ Share in Service Exports
52%
26%
35%
22%29%
88%
71%
34%
78%
66%
48%
74%
65%
78%71%
12%
29%
66%
22%
34%
innov
ation
pro
cess
oper
ation
s
know
ledge
pro
cess
oper
ation
s
busin
ess p
roce
ss
oper
ation
s
IT op
erat
ions
tota
l
share of foreign firms (number) share of foreign firms (value)
share of Chilean firms (value)share of Chilean firms (number)
Source: Authors’ calculations based on IDC 2009 data.
326

The Case of Chile 327
Box 9.2: Hidden Service Exports
Many services are indirectly exported through other services or embodied in theexport of goods. Although this trade is less visible than other forms of trade, it can bequite relevant in certain industries. Small firms that are not in a position to reachother markets directly do so by integrating themselves into the value chain of a largersector. This arrangement can be highly attractive for small firms that can learn, grow,and mature as captive outsourcers for a period of time. Eventually, this position canbe the starting point for new exporters on their own merits, once the suppliers ofthese services are in a position to sell their services directly to foreign customers.
During 2008, ProChile financed a study seeking to identify the cluster of servicefirms that supply the retail business in Chile and to explore the potential of thesefirms to become direct exporters. The study proposes the creation of a cluster of retailproviders that is based on the world-class applied knowledge of retail concepts and isintegrated by firms that offer high-value, “made in Chile” services in variousspecialized areas. The study identifies the following service categories: (a) specializedprofessional services; (b) infrastructure, equipment maintenance, and repair; (c) ICTservices; (d) analytical services (that is, ICT and retail management); (e) specializedtelecommunication services; (f) credit financing and other financial services; (g) logistics;and (h) human resources, selection, and training.
Within each of these categories, a number of domestic firms were identified. Themajority of them were small, Chilean-owned firms. According to the report, thesefirms have made a crucial contribution to the development of the retail sector inChile and have set quality standards that have facilitated their penetration intoforeign markets. In addition, the report found that a number of these service providerswere already exporting a wide range of retail-related services to several countries ofthe region. In most cases, these markets were developed on the buyer’s initiative,independently of the Chilean retailer. The countries of destination were Argentina,Brazil, Colombia, Costa Rica, the Dominican Republic, Guatemala, Mexico, Peru, andthe República Bolivariana de Venezuela. Coincidentally, among the firms surveyed,Colombia and Peru were the most attractive markets in the medium term, whereasBrazil and Mexico would require time to develop.
The fresh fruit industry was one of the first industries in which the role ofancillary services was crucial. Growing and marketing of fresh fruit depends on anextensive value chain of services that starts before the seed-planting process andcovers a whole range of value-added activities until the fresh fruit reaches the finalretail store in foreign markets. In the case of a distant country such as Chile,getting to the final market with fruits that are fresh, tasty, and in perfect shape is amajor challenge that involves (a) seed development, sophisticated fruit-growingprocesses, and strict quality and pest control techniques; (b) careful fruit pickingand packing, adequate cold storage, and adequate transport equipment; and (c)maintenance of a very short time span between the fruit-picking process andplacement of the fruit on market shelves. All these service activities provide manyspecialized jobs and help create substantial value added by the time the productreaches the final consumer.
An early study by the United Nations Economic Commission for Latin Americaand the Caribbean researched the situation of the Chilean fruit export industry andfound that about 90 percent of the value of Chilean grapes in a New York store wasadded by numerous service firms that had made an indirect export through theproduce and at the same time had contributed to make the export processpossible.
Source: Authors’ analysis based on CERET 2009 and ECLAC 1989.

Inward and outward investment: Service exports through commercial presence
In 1974, Chile implemented a voluntary foreign investment framework, DecreeLaw (DL) 600.13 DL 600 allows nondiscriminatory access to foreign investors inall sectors except cabotage, air transport, and mass media. In the case of fishing,access is subject to international reciprocity. Although other mechanisms areavailable to foreign investors who wish to enter the Chilean market (among themchapter XIV of the Central Bank’s Compendium of Foreign Exchange Regula-tions), this policy instrument has been the main tool to attract foreign invest-ment since its enactment (about 70 percent of total materialized investments in1990–2008).14
Since 1990, a number of initiatives aimed at improving the investment cli-mate and attracting new flows of investments have been implemented, includ-ing unilateral reforms and negotiations of bilateral investment agreements anddouble taxation agreements. These measures have been particularly significantfor the service sector because of the various modes of supply involved. In addi-tion, some service exports were exempted from indirect taxes (OECD 2007a).
On average, during the period 1974–2010, nearly 54 percent of all the stockaccumulated through DL 600 foreign direct investment (FDI) was destined forservice activities. Italy, the Netherlands, Spain, Switzerland, and the United Stateshave invested heavily in the service sector. Italy, Mexico, Spain, and Switzerlandinvested almost exclusively in service activities. Energy, communications, andfinancial services (including insurance) accounted for almost all accumulated for-eign investment in service industries (Foreign Investment Committee 2011).
Investment and trade reforms created advantages for certain Chilean serviceactivities, which translated into investments in and service exports to Latin Amer-ican countries. In fact, Chilean direct investment abroad surged in the early 1990sand has been mainly directed toward Latin American countries since then. Theseinvestments have focused on service sectors such as finance and retail distribution(see figure 9.7). Table 9.5 provides some examples of the leading Chilean compa-nies investing abroad.
The Directorate General of International Economic Relations (DirecciónGeneral de Relaciones Económicas Internacionales, or DIRECON) estimates atotal outflow of US$54.2 billion of Chilean investment abroad for the period1990–June 2010. The estimate covers 65 countries in the Americas, Europe, Asia,and Africa and involves more than 2,000 projects carried out by more than 900firms (figure 9.7).15 Argentina, Brazil, Peru, and the United States are the maindestinations of Chilean investment abroad. The service and energy sectors capture68 percent of all total investment. Energy is listed under a different headingbecause it covers both generation and distribution. Services entail industries suchas retail, informatics, real estate and construction, and air and maritime transport.
328 Exporting Services

The Case of Chile 329
Figure 9.7. Stock of Chilean Investment Abroad, June 2010
Source: Data from DIRECON.Note: Energy includes gas, water, and electricity generation and distribution. Services include construc-tion, retail, hotels and restaurants, transport and communications, financial, real estate, IT, and otherprofessional services. Mining includes oil and gas.
a. Countries
15,979
10,614
9,402
6,793
3,701
1,063
814
743
702
596
3,818
0 5,000US$ million
10,000 15,000 20,000
Argentina
Brazil
Peru
Colombia
United States
Mexico
Panama
Australia
Uruguay
Venezuela, RB
others
b. Sectors
services40%
energy28%
agroindustry3%
mining5%
industry24%

Table 9.5. Leading Chilean Companies Investing Abroad, 2004–05
Operations in regional marketsa Internationalization categoryb
Sales Latin America Company Sector (US$ million) and the Caribbean Others > 50% 25% to 50% > 25%
Enersisc Electricity 4,863 x — — —Empresa Nacional del Petroleo Petroleum 4,704 x x — — —Falabella Commerce 2,885 x xCencosud Commerce 2,477 x xLAN Airlines Air transport 2,034 x x — — —Arauco Cellulose and paper 2,075 x — — —CMPC Cellulose and paper 1,935 x xCompañia General de Electricidad Electricity 1,276 x xEntel Telecommunications 1,243 x x xFasa Commerce 1,087 x xMolymet Metallurgy 975 x x — — —Ripley Trade 909 x xCCUd Beverages 755 x xEmbotelladora Andinad Beverages 743 x — — —AES Generc Electricity 702 x — — —Madeco Metallurgy 582 x xMasisac Cellulose and paper 398 x x
Sources: Adapted from ECLAC 2005 on the basis of information provided by the companies and AméricaEconomía 2005.Note: — = not available. Data for service companies are shaded.a. Markets are Latin America and the Caribbean, North America, Asia and the Pacific, Europe, and other.b. Calculated as a percentage of sales (or employment) accounted for by subsidiaries outside Chile.c. Chilean trans–Latin American company bought by a transnational corporation.d. Chilean trans–Latin American company controlled by a transnational corporation.
330

Chile’s Fundamentals and the Development of Service Exports
Chile’s early reforms led it onto a strong growth path, especially between 1986and 1997, when GDP annual rates ranged between 3.8 percent in 1990 and 12.2percent in 1993, with six years with annual growth rates above 7 percent. GDPgrowth rates declined considerably between 1998 and 2008, to an average of 4.4percent a year, primarily because of stagnation in Chile’s productivity (OECD2010, 2011).
Compared with many developing countries, Chile has a relatively low level offoreign indebtedness. Total foreign debt increased from US$32.6 billion in 1998 toUS$64.8 billion in 2008, but public debt is only 18.6 percent of that total. Theratio of foreign debt to GDP has consistently fallen since 2002, whereas public sec-tor debt fell in absolute terms from US$3.2 billion in 1995 to US$2.8 billion in2008. Over the same period, international reserves increased from US$16.3 billionto US$23.2 billion.
As a result, Chile enjoys a rather comfortable position in many of the best-known world economic rankings. For instance, Chile ranks 10th in the 2010 Indexof Economic Freedom by the Heritage Foundation and the Wall Street Journal;15th in the Business Environment Rankings of the Economist Intelligence Unit;15th in the 2009 Institute for Management Development World CompetitivenessYearbook; and 28th in the 2008–09 Global Competitiveness Index of the WorldEconomic Forum. Chile also ranks among the lowest-risk countries in theworld,16 as reflected in rankings made by Economist Intelligence Unit (eighth low-est), Moody’s Investor Service (A1), Fitch Ratings (between A and A+), and Stan-dard & Poor’s (between A+ and AA).17
Nevertheless, the Chilean economy has lost dynamism over the years. After the1998 Asian financial crisis, per capita growth was significantly reduced comparedwith the previous 12 years (1986–97). Productivity explains a major part of theslowdown in growth. In fact, the growth of total factor productivity (TFP) hasbeen nearly zero since 1998 in contrast to a growth rate of more than 2 percentannually over the 1986–97 period (OECD 2010; Schwellnus 2010). If the growthrate is decomposed to its determinant factors, one can conclude that the “contri-bution of capital formation to GDP growth has been similar over the past decadeas over the 1986–97 period but both labour input and [TFP] growth have sloweddown. The slowdown in labour input growth accounts for around one-third ofthe slowdown in GDP growth over the past decade and the apparent stagnation ofTFP accounts for the remaining two-thirds” (OECD 2010, 66).
But what explains the poor performance of TFP? As will be shown, the mainfactors behind the slow growth in TFP are also pertinent to explaining the per-formance of Chilean service exports. More specifically, the (OECD 2010) identi-fies a number of weaknesses in structural policies as contributing to the uneven
The Case of Chile 331

productivity performance: (a) product market competition, (b) existing condi-tions for entrepreneurship that do not encourage risk taking and the reallocationof production to new and higher-productivity activities, and (c) low rates of tech-nological (product and process) and nontechnological (marketing and organiza-tion) innovation in firms. Education and labor skills are also important factorsthat influence Chilean TFP performance.
According to the OECD (2010, 72), product market competition measured byprice-cost margins “is higher in Chile than in the comparator group in all indus-tries, except mining. Price-cost margins are higher even in the manufacturingsector, which is open to international trade, and in the retail sector, which has areputation of being competitive.” The largest differences are found in transportand telecommunications and in other services, which mainly include businessservices, indicating that competition, in particular in the service sectors, is weakin Chile.
Among the factors that explain the weak competition environment, regulationson entry and exit (burdensome bankruptcy procedure) have been highlightedbecause of their effect on entrepreneurial risk taking and diversification into newand higher-productivity activities. Although Chile ranks high on broad indicatorsof overall competitiveness and has fewer barriers to trade and investment thanmost OECD countries, administrative burdens on start-ups are higher than inalmost any OECD country. Two sectors stand out as examples: the retail sectorand regulated professional services.18
Regulations and institutions
As in many countries, services are highly regulated, and a complex network ofservice-related regulations and institutions exists. Identifying the trade compo-nent of such regulations was one of the major challenges Chile faced when con-fronted with including services in its trade agreements. The complexity andheterogeneity of the regulatory environment has also made assessing and intro-ducing reforms in the public policies associated with the various service indus-tries difficult.
In general, Chilean norms and regulations dealing with services have very lim-ited discriminatory provisions with respect to the treatment granted to foreignservices or foreign suppliers. Telecommunications, financial services, business serv-ices, and transportation all have a high degree of international integration. Even insocial services such as education, health, and even pension fund management, bothprivate and foreign participation as service providers are important. Restrictionsrelated to foreign ownership of domestic service industries and associated with thetype of legal entity required or the nationality of the service provider or board
332 Exporting Services

member are very limited: radio and television concession activities are two casesin point (Sáez 2008).
Chile’s political and regulatory environment ranks comparatively well in inter-national indexes. It is placed in 34th position when compared with the 134 coun-tries surveyed by the Networked Readiness Index 2008–2009 (Dutta and Mia2009). In the Global Competitiveness Index 2009–10 (Schwab 2009), the countryranks 30th of 133 in the overall ranking, but it ranks lower in health and primaryeducation, higher education and training innovation, and labor market efficiency.Schwab (2009) identifies restrictive business regulations, inefficient governmentbureaucracy, and inadequately educated population as the three most problematicfactors for doing business in Chile.
According to the private sector, some inadequacies still exist in labor legislationas well as with respect to granting of work permits to foreign nationals. Certainlabor rigidities seem to be especially sensitive for the operation of lines of businessthat operate 24 hours a day, seven days a week.19 Visa requirements for certainnationalities may make the timely hiring of foreign professionals more difficult.20
In the fiscal area, despite recent lowering of the tax rate, an additional incometax of 15 percent is still applied to all software imported into Chile. Althoughthe rationale of this tax is to put imports on equal footing with national soft-ware products, the measure is seen as protectionism that negatively affects thecosts of ICT industry inputs. However, even though Chile is not a member of theInformation Technology Agreement of the World Trade Organization, many com-puter-related products enjoy duty-free entry into the country as a consequence ofits preferential trade agreement (PTA) commitments, and this treatment isgranted on a most-favored-nation basis.
Skill availability: Educational indicators
As previously noted, Chile’s difficulties in developing solid comparative advantagein services may be somewhat linked to its educational shortcomings and the skilllevel of its labor force. One of the key constraints in the recent slowdown inChile’s economic growth rate can be found in its educational system. Althoughconsiderable efforts to improve the education system have been made since 1990,results have been noticeable more in coverage than in quality. Even though Chilehas improved its Programme for International Student Assessment (PISA) scoresin recent years, the average scores are still well below those of developed coun-tries.21 According to the PISA 2006 study (OECD 2007b), which included 57countries, Chile ranks 40th in science, 37th in reading, and 44th in mathematics.Nevertheless, Chile ranks better than other Latin American countries in scienceand reading. Only in mathematics does Chile rank below one Latin American
The Case of Chile 333

country—Uruguay. However, PISA average results mask important differenceswhen one accounts for the differences in social and economic backgrounds ofstudents and schools.
The limited number of personnel with technical qualifications and the limitedpool of talent have also been listed as a weakness by a study conducted by theBoston Consulting Group (2007) for the National Council for Innovation forCompetitiveness (Consejo Nacional de Innovación para la Competitividad, orCNIC)22 and used by CORFO to form a program to develop new industries in theoffshoring of global services. Others studies have also identified human capitaland education as one of the most important areas where significant progress mustbe made for further development of Chile’s service exports (see Castillo 2009;CNIC 2010; Fernández-Stark, Bamber, and Gereffi 2010b; IDC 2009; Tholons2010).
At the tertiary level of education, limitations arise with respect to the totalnumber of graduates from universities and from professional and technical insti-tutes. According to the Ministry of Education, during 2007, 10,064 studentsgraduated from professional institutes (about 35 percent in technology-relatededucation), 17,386 graduated from technical institutes, and 41,647 graduatedfrom a university (about 35 percent in technical and scientific professions such asbasic sciences, engineering, and medicine).23 The total number of graduates inChile is a fraction of that in Brazil and Mexico, less than half of that in Argentina,and below the Colombian figure (Boston Consulting Group 2007).
In relation to Chile’s population, the gross enrollment ratio for tertiary educa-tion is reasonably good at the regional level (46.6 percent); it is below that ofArgentina and Cuba and similar to that of Uruguay (ITU 2009). Apparently, how-ever, this ratio is too small to generate a pool of qualified professionals largeenough to sustain a large increase in the country’s supply capacity of specializedservices, particularly in the IT segment.
However, in the world context, Chile ranks rather well with respect to innova-tion. It ranks 29th in the Innovation Capacity Index for 2009–10 (López-Claros2009), well ahead of other countries in the region; Uruguay and Costa Rica, thetwo closest Latin American countries, rank 49th and 58th, respectively. Chile is ina better position than more advanced countries such as the Czech Republic, Italy,Poland, and Portugal. Adaptability and innovation are crucial for developingcompetitive services. The life cycle for services is very short—hence the need toadapt and innovate to stay ahead in the market.
On the basis of the Mercer Consulting Group’s Global Pay Summary for2005/06, the Boston Consulting Group (2007) reports that Chilean salaries are, onaverage, between 50 percent and 71 percent less onerous for employers thansalaries in the United States, yet they are three times higher than salaries in India
334 Exporting Services

for jobs such as account executive, human resources analyst, and program analyst.In functions relevant to the ICT business (personnel analyst, system analyst, jun-ior programmer, accountant, analyst programmer, and account executive), thestudy notes that total remuneration (salary plus benefits) is somewhat in line withthat found in Brazil and Mexico but well above that in Argentina.
Infrastructure
Chile’s physical infrastructure usually rates well when compared with that ofother countries in the region and other developing countries, including many ofthe more successful service exporters. Chile ranks 30th of 133 economies in the2009–10 Global Competitiveness Index with respect to the quality of its infra-structure (Schwab 2009). Regarding its telecommunication infrastructure, in 2007Chile ranked 48th in a survey of 155 countries considered in the ICT Develop-ment Index (ITU 2009) but was down from 45th in 2002. In telecommunicationinfrastructure, Chile ranks at the top of the region, along with Argentina (47th)and Uruguay (49th), followed by Brazil (60th), Panama (61st), and Costa Rica(66th). In the access subindex of the ICT Development Index, Chile ranks 50th,losing five places since 2002. In the use subindex, Chile ranks 48th, down eightplaces since 2002, while in the skill subindex, it ranks 47th, down five places since2002.
Nevertheless, Chile—along with Argentina, Brazil, Costa Rica, Panama, andUruguay—is in the upper group, following the top group of economies thatcomprises developed economies plus some top service exporters from thedeveloping world such as Hong Kong SAR, China; Korea; Macao SAR, China;Singapore; Taiwan, China; and the United Arab Emirates.
In Chile, broadband subscribers represent more than 90 percent of all Inter-net subscribers. Perhaps the two most serious drawbacks regarding ICT infrastruc-ture are, on the one hand, the loss of position in all three categories (access, use, andskills in telecommunications) since 2002 and, on the other, the high access cost forInternet and the limited capacity of Internet connections in Chile (CNIC 2010). Thecountry ranks 73rd in the ICT Price Basket 2008 (ITU 2009). The weighted aver-age for fixed, mobile, and Internet rates is 11 times higher than in Singapore and theUnited States, the countries with the cheapest Internet access. Chile also ranks poorlyin the ICT Price Basket 2008 when compared to Costa Rica (41st), Panama (44th),Uruguay (55th), República Bolivariana de Venezuela (59th), Mexico (60th), andArgentina (62nd). For instance, a 4 megabyte broadband connection costs aboutUS$57 a month in Chile,24 whereas a 100 megabyte connection costs US$24 inKorea and US$16 in Sweden. Moreover, international applications such as tele -presence demand bandwidths of at least 24 megabyte per second. As the Economist
The Case of Chile 335

(2010) points out, “A whole host of applications in education, government, healthcare, public safety and energy management become possible once bandwidth is nolonger a constraint.”
Institutions: The situation of intellectual property protection
Intellectual property protection laws and institutions are still one of the weakestaspects of Chile’s institutional development. However, Chile has made someimportant reforms to improve its ability to deal with intellectual property rightscrimes. One of the most important initiatives is the creation of the National Insti-tute for Industrial Property (Instituto Nacional de Propriedad Industrial, orINAPI) in January 2009. INAPI is responsible for overseeing all administrativeactions related to industrial property, including patents and trademarks. However,certain problems, especially in the pharmaceutical sector, have kept Chile on the2009 Priority Watch List included in the 2009 Special 301 Report of the Office ofthe United States Trade Representative.25
Other limitations in this area, especially those related to the low level of protec-tion of trade and personal data, could become a disadvantage for the developmentof ICT services in general and for the financial sector or research and developmentwork in particular. Nevertheless, in the context of the Latin American region,Chile provides a high standard of property rights protection (A.T. Kearney 2009).
Cultural and language affinities
In terms of its export potential, several disadvantages regarding Chile’s culturaland language abilities have been identified in different studies. First, Chileansappear to experience some adaptation difficulties in foreign environments, evenin neighboring countries. Many firms have admitted to having problems keepingintracorporate transferees in foreign destinations for more than one or two years.Although highly respected professionally by their peers, the business culture ofChilean executives is sometimes resented by their local counterparts, who some-times view them as somewhat rude and indifferent to local culture, habits, andbusiness practices.26
Another limitation relates to the low level of English-language skills within thecountry. About 2 percent of the population and only 8 percent of the graduateswith technical qualifications have English-language skills. The level of Englishskills increases when university graduates and upper socioeconomic groups areconsidered (33 percent) (Boston Consulting Group 2007).27 This finding probablyexplains why only 32 percent of IT outsourcing exports are provided to non- Hispanic countries (IDC 2009).
336 Exporting Services

Another cultural limitation present in many parts of Chile’s export sectorrelates to the reluctance of local firms to enter into strategic alliances and partner-ships, even with other Chilean firms, when attempting to reach foreign markets.The limitation has been described as “weak associability.” ProChile, having recog-nized the importance of firm size in the international market, organizes coachingactivities to promote more associability within the export sector. In contrast, inthe case of India’s service industries, associability is one of the factors that explainIndia’s export successes (Gregory, Nollen, and Tenev 2009).
Several interpretations are given for this reluctance to work in association.Most nontraditional service exporters are small and medium-size firms that haveoperated exclusively in the domestic market. Because the country’s market israther small, competition among local service suppliers can be fierce, and theirmarket positions often depend on well-protected know-how or business connec-tions that they would not share with competitors. Making such attitudinalchanges when going abroad is therefore difficult.
Another interesting fact from a sociological perspective relates to Chile’s rank-ing as having among the most mistrustful people in Latin America. According toLatinobarómetro (2009), the index of interpersonal trust (seen as the transactioncosts among people) has not changed since 1995. Among the 18 Latin Americancountries surveyed, Chile appears as a country with a high level of distrust regard-ing culture, institutions, and life in general within the nation. Whereas countriessuch as the Dominican Republic and Uruguay have the relatively higher trustrankings in the region, Brazil and Chile share the lowest rankings. This findingmay be helpful in understanding why local firms are so reluctant to enter intoassociation schemes when confronting foreign markets. Within Chile, trusttoward business associations is among the lowest of all economic institutions(well below labor unions and even the public health system).
The Specifics of Chile’s Service Export Performance
Early reforms in the Chilean economy were probably responsible for an unprece-dented development of Chilean outward investments in the new service sector.Between the mid-1980s and the first half of the 1990s, Chile seemed headed tobecome a major player in several service industries within Latin America. ManyChilean companies began to look beyond national borders for the expansion oftheir business operations.
Chilean banks, privately managed pension and health insurance funds, electricitytransmitters and distributers, and other companies began to reach out and, whennecessary, buy existing operations or open affiliates and subsidiaries in foreigncountries. Also, a growing number of professionals and specialized consultants
The Case of Chile 337

began to travel around the region providing specialized consulting work on regu-latory reform, privatization, and management for industry-specific reforms inareas as diverse as telecommunications, financial management, and social services.Little of this activity was recorded in the official statistics, but this unprecedentedChilean presence abroad was widely covered by the local and regional media (seetable 9.5).
However, this early internationalization boom was short lived. Soon, manydomestic and foreign operations of Chile’s service industries were overtaken by big-ger multinational companies with greater financial and technological resources. Ingeneral, these multinationals were based in developed countries, especially Spain.
With time, these companies were also attracted by the new business opportuni-ties offered by other Latin American countries, which had also begun implement-ing market-oriented reforms, and they began direct operations in each of thosemarkets.
Despite many government attempts to diversify exports and reduce their vul-nerability to world price fluctuations of natural resources, the composition ofmerchandise exports remains almost unchanged. After 25 years of implementing acomprehensive open trade policy and entering into a record number of PTAs,Chile still depends heavily on the export of basic commodities, particularly cop-per and natural resource–based manufactures.28
Likewise, because they are heavily concentrated in transportation, serviceexport earnings are highly dependent on changes in aggregate world demand,fuel prices, and other costs affecting freight rates. For instance, in 2007, fuel costin the airline industry represented 29 percent of all costs, up from 14 percent in2003. In the case of maritime transport, fuel costs represented 63 percent oftotal costs in 2007 against 33 percent three years earlier (WTO 2008). Thesetypes of fluctuations clearly add damaging uncertainties to the commercial andfinancial prospects of these industries with corresponding negative effects inthe country’s balance of payments. As a result of these developments, Chile hastended to replicate in services the rigidities that have characterized its mer-chandise exports.
Arrangements to facilitate exports
After more than a decade (since the mid-1970s) of implementing a unilateral open-ing of its trade and investment regime, Chile adopted, in the early 1990s, one of themost aggressive open regionalism strategies, seeking PTAs with a wide range ofdeveloping and developed countries.29 Today, Chile enjoys preferential access in60 countries. Many of its agreements include preferential rules and trade commit-ments in the areas of services and investment (Sáez 2008; Sáez and Valdés 1999).
338 Exporting Services

Chile’s more specific objectives in entering into PTAs were twofold. On the onehand, they were meant to create a sort of seal of quality that would help the coun-try in its efforts to build greater international visibility, credibility, and prestige forChile’s trade and investment regime (box 9.3). By binding its commitments withmarket-oriented policies and with the adoption of best practices on rules andinstitutions, Chile felt it earned a right to be part of an elite group of countrieswith well-managed economies. On the other hand, the agreements would providepreferential access to the richest and most attractive markets in the world. Bothobjectives ought to create a virtuous dynamic process leading to a rapid expansionand diversification of Chile’s export sector, powered by large FDI inflows. ThenChile will be regarded as a top-quality platform for manufacturing and service
The Case of Chile 339
Box 9.3: The Importance of Developing Credible Services and ServiceProviders
Because services are usually intangibles whose real value to consumers is rarelyappreciated before they are consumed, exporting services usually starts by exportinga promise. Establishing credibility is a serious challenge for small, developing, andrather unknown countries. Few important markets may be aware of the exportpotential and the services that may be available in a country such as Chile.
Among the recommendations included in an IDC (2009) report, the need topromote the use of international certifications among Chilean service providers,especially in areas such as CMMI (Capability Maturity Model Integration) and ITIL(IT Infrastructure Library), stands as one of the most important. Also, a BostonConsulting Group (2007) study suggests a number of international certificationstandards that could be used in the areas of information technology (CiscoSystems, IBM, Red Hat, Citrix Systems, and others); information security (certifiedinformation security manager and certified protection professional); and others(such as the International Association of Outsourcing Professionals’ CertifiedOutsourcing Professional Program).
Assisted by the CORFO-Innova program, access to partial financing (under acofinancing scheme) for both the preparation of firms for the certification process andthe certification itself has helped generate a growing awareness of the importance ofinternationally certified standards for exporting firms. Such certification is particularlyimportant for ICT services, in which a high level of CMMI certification can beindispensable in reaching more demanding markets. Also, International Organizationfor Standardization (ISO) certification is starting to be more commonly recognized asa source for developing credibility and trust of service providers.
ISO certifications have expanded rapidly in Chile since 2004. For instance,regarding ISO 9001 (management) certifications, Chile ranks fourth in the region.Nevertheless, the country remains quite a distance behind the leaders, Brazil andArgentina, but closer to Mexico. The number of Chilean certifications grew from 924in December 2004 to 4,103 in December 2008. Chile’s ISO 14001 certifications(environmental management systems) grew from 277 in 2005 to 686 in 2008,whereas the ISO survey does not register any Chilean certification for ISO27001:2005 (information technology, information security) up to 2008.
Source: Authors’ construction.

export operations and, at the same time, benefit from preferential access to apotential market of nearly 3 billion people. However, to what extent these objec-tives have been reached cannot be assessed. Negotiations of service agreementswith Latin American countries, which are the most important destination marketof service exports, are relatively recent, meaning that negotiations have not ledservice exports but have followed the process.
In most cases, PTAs were complemented by double taxation agreements. Fol-lowing the OECD model agreement, Chile has already signed or is in the processof negotiating 25 such agreements with countries such as Canada, Denmark,France, Germany, the Netherlands, New Zealand, Norway, Spain, Switzerland, theUnited Kingdom, and the United States. Chile has also entered into a number ofsocial security agreements and investment promotion and protection agreements.The latter were important in cases where the PTAs did not include satisfactoryinvestment rules and commitments.
One drawback of PTAs is that most preferential service agreements are reallyonly formally “preferential.” In fact, trade commitments rarely go beyond listingand binding the existing level of protection at the time of their implementation, andactual liberalization takes place in a limited number of sectors (for example, finan-cial). They cover a diverse number of sectors, usually much smaller than universalcoverage. Furthermore, once a commitment is undertaken in the context of a PTA, itis, in essence, granted on a most-favored-nation basis to the rest of the world. There-fore, the preferential and transparency advantage is greatly diminished.
Chile has made little or no use of targeted, custom-made agreements betweenprivate or public operators that provide special and truly preferential market-access conditions for their exports, such as those advanced by countries like Indiaor Thailand, which have arranged special deals for their health service exportsthrough specific contracts with health insurance companies from developedcountries, or the Philippines, which has promoted bilaterally the temporarymovement of labor to provide services.
Service export promotion policies
Although Chile has been negotiating service PTAs since 1995, government sup-port programs that provide assistance to service exporters are not only modest butalso of recent vintage. Only in 2006 did ProChile open a separate item within theagency’s general promotion fund to be used in promoting service exports. Thesefunds have been partially allocated to the Service Trade Department as well as toProChile’s domestic regional offices. The Service Trade Department handles mostof the work related to promotion of service exporters. The department developed astrategic export plan for the following services: engineering; educational; cultural
340 Exporting Services

(including audiovisual, editing, and printing services as well as the visual arts);environmental (including carbon bonds); film location; and ICT services.Recently, a number of additional sectors have been incorporated into ProChile’sefforts: architectural services, logistics, and a cluster of service providers to retailbusinesses.
The range of instruments available in ProChile covers international trade fairsand strategic export sectoral plans. The latter include activities such as providingmarket intelligence; cofinancing business trips and organizing the businessagenda with the assistance of the ProChile office abroad; and providing coachingseminars, printed and audiovisual promotional material, and other support meas-ures. The overall yearly budget for services in ProChile is under US$1 million. Thebudget allocates about 45 percent to cofinance with the private sector participa-tion in international trade fairs. The remaining 55 percent is used to develop addi-tional activities within the strategic sectoral plans, such as invitations to foreignbuyers; creation of promotional material; and holding of workshops, seminars,and business forums.30
ProChile is currently supporting programs in 12 different service industries.The average resources available for each strategic sectoral plan are aboutUS$40,000 a year per sector, which is used to implement the central plan as well asthe service component contained in the regional plans. Given that every sectoralplan contemplates a number of individual support projects, ProChile estimatesthat the average amount available per project is about US$4,000, ranging betweenUS$2,000 and US$10,000. Normally, through cofinancing with the private sector,an additional 40 percent is added to these resources. Overall, the promotionefforts undertaken by ProChile in services seem insufficient and probably have amodest influence on service exports.
A different government agency, the National Tourism Service (ServicioNacional de Turismo, or Sernatur), deals with tourism. Sernatur was created in1975 and promotes the development of national and foreign tourism in Chile. Ithas several offices in different cities within Chile but no offices abroad. For inter-national efforts, it works jointly with Turismo Chile (a private association of thetourism sector), which jointly promotes Argentina and Chile as tourist destina-tions. The public resources available to Sernatur are rather modest, and most ofthe budget is spent on domestic promotional activities.31
In addition, two fiscal initiatives are worth mentioning. First is the value addedtax exception for services qualified as exports by the National Customs Service.32
A second incentive can be found in the Platform Law (Ley Plataforma).33 Themain purpose of this 2002 law was to grant a fiscal allowance to attract foreigninvestment with the exclusive purpose of exporting services such as offshoringservices from Chile. According to the law, foreign-owned companies established
The Case of Chile 341

with that sole purpose are considered not to have legal residence in Chile and aretherefore not subject to the general income tax law. However, the complexities ofcomplying with all the requirements of the Platform Law have limited its use byforeign investors, who generally opt to use the benefits provided under the doubletaxation agreements to which Chile has subscribed.
Mindful of the importance and prospects of service exports in Chile, the gov-ernment implemented a new policy to develop the offshoring industry in 2000.34
The High-Technology Investment Promotion Program was adopted under theleadership of CORFO. It focuses on promoting foreign investments by acknowl-edging the new patterns of location of high-tech firms. The main components ofthe program are promotion, investment development, and investor services. Pro-motion refers to the dissemination of the location advantages offered by Chile inthe community of international technological business among the officials ofleading companies located in the main world-class technological clusters. Invest-ment development refers to the market intelligence work used to identify decisionmakers, companies, and projects that are assessing Latin America or other con-tinents as an alternative for the location of projects related to IT business areas.CORFO provides financial support in connection with this initiative, which isdescribed further in table 9.6. Finally, investor service activities provide guid-ance for investors and facilitate the processes of assessment, installation, and
342 Exporting Services
Table 9.6. Attracting High-Tech Companies to Chile
Incentives Financial support Maximum
Preinvestment studies orprospecting trips to Chile
Feasibility studies for aninvestment project
Up to 60% of thepreinvestment study cost(maximum US$30,000)
Project launch assistance Execution of a working planto assist in projectimplementation
Up to US$30,000 for start-up activities
On-the-job training New employee trainingprogram
Up to 50% of annual salaries(maximum US$25,000 peremployee)
Equipment and infrastructure Acquisition of technologicalinfrastructure andequipment
Up to 40% of the totalinvestment in fixed assets(maximum US$2,000,000)
Long-term property leasing Long-term lease of propertyassociated with theinvestment project
Up to 40% of total leaseamount during the first 5 years (maximumUS$500,000)
Specialized training andrecruitment
Acquisition of specificknowledge or recruitment of experts
Up to 50% of specializedtraining or recruitment(maximum US$100,000)
Source: Gereffi and Fernández-Stark 2010.

The Case of Chile 343
implementation of investments through incentives. The program’s aim is to facil-itate and influence investment decisions in Chile.
In February 2003, a new strategy was adopted to (a) focus on Europe and theUnited States after the negotiation of free trade agreements with those markets;(b) add new segments to the offshoring industry; and (c) incorporate factors forthe development of this industry in Chile in the field of human resources and reg-ulation, including adjustment of regulatory issues for the offshoring industry,development of human resources with English-language skills, and prospecting ofnew areas of investment attraction in business processes, knowledge processes,and biotechnology.
In December 2007, as part of a wider initiative to promote innovation inChile, the Strategic Public-Private Council of Offshoring Clusters was estab-lished. Initially, the purpose of this body was to design and implement an actionplan to strengthen the development and expansion of offshoring in Chile. Thecouncil is made up of representatives from industry, including foreign compa-nies operating in Chile, entrepreneurial associations, and higher education andpublic sector institutions. It validates the action plan in three main areas: reduc-ing the human capital gap, developing an international promotion strategy, andimproving both infrastructure and the regulatory framework. This coalition isdirected by CORFO and financed by the Chilean Innovation and Competitive-ness Fund, which provided US$23 million for 2008–09 (Gereffi, Castillo, andFernández-Stark 2009).
In addition to the preceding program, CORFO, through its Innova division,supports the Global Services Program. Essentially, this support takes the form offinancing of technological missions (to attract large high-tech firms to invest inChile) and financing of the Business Platform for Innovation, which seeks todevelop a marketing infrastructure in priority foreign markets for the promo-tion and sale of global services offshored from Chile. Innova’s 2008 resourcesavailable for granting subsidies through its various support programs totaledsome US$90 million. Projects submitted to the Business Platform for Innova-tion, when approved, can receive a 70 percent subsidy with an upper limit ofUS$30 million.
Yet some concerns exist that relate to the lack of specificity of the Global Serv-ices Program. First, the program aims at developing knowledge process operationsand innovation process operations rather than business process operations and IToperations. However, these categories of services are so broad that they mask thereal target of the support program. Moreover, the criterion for choosing theseservices is not clear, nor is the mechanism by which funds will be allocated. Sec-ond, from a value-added perspective, knowledge process operations and innova-tion process operations are obviously very attractive categories. However, trying

to compete in one of the world’s most sophisticated markets in areas may be diffi-cult for Chilean industry, which is only in the early stages of its development.Some studies acknowledge that the program did not attract all the investmentsand the types of investments initially expected, but they consider the policy designto be correct and to point in the right direction, though, admittedly, it should havebeen more ambitious in scale (Agosín, Larraín, and Grau 2009; Agosín and Price2009).
More generally, the risks associated with choosing the sectors to be developed,even in the absence of government support, or with choosing to support sectorsthat are not viable have been pointed out. Regulatory capture risks are also a con-cern. Therefore, a set of requirements that would help avoid those risks has beenproposed, and among its provisions are goal setting and monitoring (OECD2011).
Another CORFO initiative is the creation of the National Registry of Individu-als with Advanced English-Language Skills. The registry identifies some 15,000people living in the country who have a level of language skill certified by the Testof English for International Communication. Beginning in 2008, this register wascomplemented with an English training program, subsidized by CORFO, forgraduate technicians and professionals specializing in ICT. Every year 2,000 stu-dents are sponsored by scholarships financed by this program.35 These programssupplement earlier English training initiatives developed by the Ministry of Edu-cation since 2004.
In addition to the CORFO Global Services Program, ProChile has recentlyundertaken some initiatives. Using the two most successful industries withinChile’s service sector—the international maritime and air transport sector andthe retail sector—as the starting point, ProChile has begun two new programsstructured around the cluster approach:
• A special program to develop new service exports around a retail cluster• A program aimed at the development of service exporters related to the inter-
national components within the logistic supply chain associated with interna-tional transport
Both programs represent promising areas associated with sectors that alreadyhave proven experience in internationalization and proven comparative advan-tages and thus may be appropriate for promotion policies. Whether the limitedfinancial resources available to ProChile as well as its limited role in attractinginward FDI or its influence in modifying the regulatory architecture of many serv-ice industries will be an obstacle in achieving the programs’ objectives remains tobe seen.
344 Exporting Services

Private associations in services
Chile’s first private association of service exporters dates to the mid-1990s, whenthe country negotiated with Canada its first comprehensive PTA. The Coalitionof Service Exporters was created under the aegis of the Santiago Chamber ofCommerce. Its associates cover a wide range of service industries that either areexporting or wish to export services. At the time of its inception, the coalition’spurpose was to act as the private counterpart in negotiations for consultationsregarding the industry’s views on the service rules and commitments containedin the Canada-Chile free trade agreement. The coalition is still active today and,together with ProChile, maintains and manages a Web page devoted to theexport of services (http://www.chilexportaservicios.cl). In addition to acting as aconsulting body to the government on trade negotiation matters, the coalitionprovides technical support to its associates on fiscal matters affecting Chileanservice exporters and organizes seminars and coaching activities on service-related matters.
Other private service associations have a more industry-specific character buthave also been very active in developing the Global Services Program, and theEngineers Professional Association has also been active in attempting to imple-ment the recognition agreement provisions included in Chile’s PTAs.36 However,the work of all these associations is somewhat weakened by their limited influenceon the design and implementation of public policies affecting Chile’s service exportpotential. The lack of adequate trade data and the heterogeneity and diversity ofinstitutions and regulations dealing with services are among the many reasons thesector’s commercial interests are not properly expressed either to the general publicor to public authorities.
In Search of a Service Development Policy: Some Lessons Learned
Chile’s search for a less vulnerable and more diversified economy may be traced tothe early 1990s, when it began a trade policy based on the open regionalism concept.Some of the objectives set out in this policy have not yet been fully achieved. First,the country has failed to achieve a substantial degree of export diversification, bothin goods and services.37 Second, it has been unable to become a major internationalinvestment platform and a regional center for transnational companies.
In addition, a number of limitations or inadequacies have been identified.First, supply-side factors, such as the limited pool of human resources, stagnantproductivity of the labor force, scarcity of English-language skills,38 and relativerigidities in Chile’s labor legislation, affect the efficiency of labor in providingservices.39 The small number of internationally certified firms and service
The Case of Chile 345

providers, the perceived lack of adequate export credit financing and insurance(López and Muñoz 2008), and the high costs and limited connectivity of Chile’stelecommunications infrastructure (especially broadband Internet access) havebeen identified as limiting factors (CNIC 2010).
The availability of financial instruments to support the export sector (that is,export credits and export credit insurance) has played a decisive role in the successof Chile as an exporter of goods. Although financial services have a high penetra-tion in Chile and the industry is well developed in different areas, among servicefirms a consistent perception exists (a) that no instruments are available locally tosupport efforts to export services abroad or (b) that the current instruments arenot suitable for service activities. Hence, one must determine whether the finan-cial system needs to improve its technical capacity and human resource knowl-edge to assess and finance service export projects.
In terms of government support, the financing granted by the public sector hasby and large been allocated to facilitate exports of goods, but service exportershave been neglected. Proper design and adequate availability of service exportcredit financing and export credit insurance may be future determinants of exportperformance of Chilean services, particularly at a time when external markets faceacute liquidity constraints.
Other industry-specific limitations have been noted. For instance, a recentstudy (Achá Álvarez and Bravo Lillo 2009) about the software industry in theregion notes that, despite multiple government efforts to promote technologicalactivities in international markets, mainly through agencies such as ProChile andCORFO, a lot of ignorance still exists about Chile’s technological capabilities andsupply potential in foreign markets. The study also mentions inadequacies in thequality of Chile’s postsale services, marketing and managerial skills, and financialbacking. The study quotes a Fundación Chile study that confirms some of themore basic aspects, such as the shortage of professionals with language skills andthe time difference with markets outside the Americas.
Second, Tholons (2010) acknowledges that Chile does not enjoy scale advan-tage as do other Latin American countries. In its analysis, Tholons (2010, 25)assesses Chile’s point of scale resistance, defined as “the number of employeesbeyond which companies find difficulty in ramping up operations in a particularlocation.” Tholons (2010, 25) concludes that despite the limited workforces ofArgentina and Costa Rica, those countries have better points of scale resistancethan does Chile. Costa Rica, the study concludes, “in spite of having only one-fourth the population of Chile, has a Point of Scale Resistance of 1,000, similar toChile.”
These limitations are shared with a number of successful exporting developingcountries; hence, fully grasping how they could be strong enough to offset the
346 Exporting Services

many positive elements that have placed Chile high in many international com-petitiveness index rankings is difficult. Possibly some additional elements have notbeen considered in the general or specific fundamentals previously listed. Asnoted by the OECD (2010, 2011) studies, most OECD countries encourage theformation of industrial clusters under the economic justification that they gener-ate positive externalities for the economy as a whole. OECD (2010, 14) goes fur-ther to conclude that in Chile the promotion “of industrial clusters may foster thediversification into nontraditional high-productivity sectors, but potential risks topublic resources should not be overlooked.”
Policy makers and economists alike reasonably hesitate to implement devel-opment policies that deviate from the free play of market forces and introduceselective promotion policies. The use of public resources in trying to developindustries that may never reach an acceptable level of efficiency and competitive-ness is associated with obvious potential risks. These fears are perhaps stronger incountries that experience exhaustion from the decades of inefficient developmentstrategies based on protectionism and the abuse of the “infant industry” argu-ment. More transparency about the duration of the incentives granted, continu-ous monitoring of progress made, sunset clauses for support programs, and clearexport targets for assessing such policies are essential.
A conclusion that may be drawn is that countries that set out aggressive serviceindustry development and service export development strategies very early in theprocess are currently reaping the benefits of an impressive growth in service worldtrade. Countries such as China, Hungary, India, Ireland, Korea, Singapore, as wellas other Latin American countries such as Costa Rica or Uruguay, took timelymeasures to promote their service exports with special emphasis on value-addedservices. Not many developing countries have followed this path. A majority ofcountries lack a service industry development strategy.
For instance, Chile and Hungary have similar development indicators, yet theirservice trade pattern is quite different. Hungary’s experience can serve as an edu-cational example of how an active industrial policy favoring the development ofwell-targeted service clusters has proved to be highly successful. Hungary’s GDPwas only 83 percent of Chile’s GDP. Employment in service activities was abouthalf the figure for Chile, yet total Hungarian service exports were almost doublethose of Chile. Hungary’s per capita service exports amounted to US$1.22 millionin 2005, whereas Chile’s per capita exports were only US$0.44 million.40 In 2008,Hungary’s exports in the OCS category were almost four times those of Chile.While Hungarian total commercial service exports expanded by 37.2 percent annu-ally between 1998 and 2008, in Chile they expanded by 27.6 percent.41 Even moreremarkably, Hungary’s OCS category expanded by an average 85.3 percent a yearbetween 1998 and 2008. The comparable figure for Chile was only 29.7 percent in
The Case of Chile 347

the same period. A positive element explaining such important differences in theevolution of Chilean and Hungarian exports can be traced to the volume ofinward FDI stock in services, which was 5.3 times higher in Hungary than inChile. Whereas inward FDI in Hungary was US$103.242 million in 2006, the cor-responding figure for Chile was US$19.492 million. Of course, Hungary’s locationin the heart of Europe, membership in the European Union, and highly qualifiedhuman capital are also important factors that explain these divergent trajectories.
The different trade pattern indicates the results that can be achieved through aneutral industrial policy as opposed to an active industrial development policy inservices. Five of six priority sectors defined by the Hungarian Investment andTrade Development Agency are designed for service industries. The incentivepackage provides four types of subsidies and allowances for projects worth at least€10 million (at least €50 million for tourism).
Since the CNIC was created in Chile, several internationally competitive clus-ters have been identified. On some occasions, they have been the basis of new pro-grams that are now are beginning to be implemented. Success will also depend onovercoming some of the systemic weaknesses identified throughout this chapter.ProChile can have an active role in paving the way to remove some of these obsta-cles, particularly in areas such as further developing associative entrepreneurialcapacity, coaching for the development of business models and successful inter-national marketing strategies, facilitating access to private financial sources, andpromoting the use of international standards and certifications by exporters andothers. Also, an increase in ProChile’s promotion resources should be assessedtogether with a more targeted approach toward a narrower set of activities tomake the best use of the limited resources devoted to each of them. Finally,improvements in the overall coordination of promotion activities should beimplemented among different institutions such as ProChile, CORFO, and theForeign Investment Committee.
Beyond trade promotion, the future focus of Chilean trade authorities in serv-ices should aim at addressing trade facilitation in services, including reduction ofregulatory burden. For instance, measures to reduce the processing time and facil-itate foreign recognition of professional titles could help improve the availabilityof skills. Among the facilitation initiatives, the rationale behind the customauthorities’ participation in the process of exporting should be assessed. Also,greater priority should be given to the identification of domestic policies that mayimprove Chile’s position as a service platform; given the nature of service trade, awide array of domestic policies may be needed, including policies related to entre-preneurship, immigration,42 and education (CNIC 2010).
During the 1990s, Chile appeared ready to become a successful and rather well-diversified service exporter. In addition to a well-established air and maritime
348 Exporting Services

international transportation industry, the country’s service providers began ven-turing into foreign markets in areas as diverse as pension fund management,retail, banking, water and energy (transmission and distribution), and a range ofbusiness services offered to both governments and private firms, including man-agement consulting, advisory services on regulatory reform and privatization, andmanagement of international bidding for concessions in public works.
However, this initial success led to a comparatively more moderate perform-ance. In only a few years’ time, this incipient diversification began to elude Chileanexporters. Soon after, the composition of Chilean exports became increasinglydominated by international transport services while the most dynamic categoriesof world service trade (that is, OCSs) began to shrink in its contribution to totalexports. Chile’s early success was associated with the country’s sound managementof its macroeconomic policies, the quality of its institutions and its commitment tothe rule of law, and its relatively adequate endowment of physical infrastructureand human resources (equal to if not better than that of many of its more success-ful competitors from the developing world). Also, for several years Chile hasenjoyed a favorable position in various rankings dealing with development andcompetitive indicators. All these factors should have been strengthened by one ofthe most comprehensive networks of PTAs, which would facilitate and promotetrade and investment with the most dynamic economies on the planet.
This chapter has attempted to provide some explanations for Chile’s serviceexport performance, but more research, better data, and more detailed infor-mation are needed. Perhaps more focus should be given in future research tomidlevel policies or micropolicies as opposed to macropolicies. Services arehighly heterogeneous, and different services seem to be affected differently bymore specific determining factors and sectoral policies. A deeper analysis, onan industry-by-industry basis, may be needed to provide better policy recom-mendations.
Annex 9.A: Service Exports from Chile
This annex illustrates the influence that a number of variables can have on Chile’sservice exports’ performance. Because of the data problems related to services, theresults must be interpreted with caution.
Export (in any industry or sector) from a country i at time t is given by
Exportit = Output – Domestic Consumption. (9.1)
In the commercial service sector, service value added would represent thesupply of services (a proxy of commercial service value added in the country),whereas GDP would represent the domestic demand for the service. Therefore,
The Case of Chile 349

one would estimate the following export equation for commercial serviceexports:
log (Commercial service exports)it = FEi + log (Per capita income)u
+ log(Service value added)it
+ log(GDP)it + eit. (9.2)
One would expect the service value added to positively affect service exports,whereas domestic consumption or absorption would reduce service exports. GDPper capita represents the country’s productivity and therefore is likely to positivelyaffect commercial service exports.
To assess whether the state of commercial service exports from Chile is aboveor below normal for the country’s per capita income, service sector size, and econ-omy, a Chilean dummy is added to the specification in equation 9.2. If the coeffi-cient on the Chilean dummy is significant, it indicates that commercial serviceexports from Chile are not in accord with its economic fundamentals. A positivesign would indicate that they are larger than an average country in the sample,whereas a negative sign conveys the opposite message. The following model(which is referred to as the base model) is estimated:
log(Commercial service exports)it = FEi + log(Per capita income)it
+ log (Service value added)it
+ log (GDP)it + Chile dummy + eit. (9.3)
For this estimation, service exports from 1990 onward are included, andAfrican countries are excluded because of the small size of service exports fromthose countries. The results of the estimation for equation 9.3 are shown in col-umn 1 of table 9.A.1. The signs of the fundamental variables—GDP per capita,service value added, and GDP—are in accordance with expectations.
For a per capita income exceeding US$13,000 in 2008, commercial serviceexports from Chile are significantly larger than those from the average country.The positive and significant coefficient for the Chilean dummy in column 1 oftable 9.A.1 suggests that commercial service exports from Chile are large given itsper capita income, service sector size, and GDP.
Next, whether Chile’s success in exporting commercial services can beexplained by the quality of its telecommunications network, as proxied by thenumber of Internet users per 100 people in the country, is assessed. By incorpo-rating the Internet penetration variable in the base model, one can evaluatewhether ICT innovations have significantly affected service exports:
log(Service exports)it = FEi + log(Per capita income)it
+ log (Service value added)it + log (GDP)it
+ Internet penetration + Chile dummy + eit. (9.4)
350 Exporting Services

Table 9.A.1. Chile’s Position in Commercial Service ExportsDependent variable: commercial service exports
Variable (1) (2) (3) (4) (5) (6) (7)
GDP, per capita (constant US$), in logs 1.909*** 1.560*** 1.959*** 1.960*** 1.959*** 2.155** 2.150**[10.049] [5.919] [4.791] [4.793] [4.788] [2.500] [2.487]
Service value added, in logs 0.985*** 0.982*** 0.979*** 0.979*** 0.979*** 0.788*** 0.788***[79.808] [71.644] [56.794] [56.734] [56.735] [7.625] [7.603]
GDP (constant US$), in logs –1.752*** –1.360*** –1.796*** –1.806*** –1.792*** –2.131** –2.128**[–9.288] [–5.153] [–4.785] [–4.798] [–4.742] [–2.389] [–2.380]
Internet users per 100 0.001 0.002** 0.002** 0.002** 0.001 0.001[1.207] [2.191] [2.197] [2.176] [0.533] [0.538]
Average years of schooling 0.190*** 0.191*** 0.189*** 0.124 0.124[3.344] [3.351] [3.329] [0.865] [0.866]
Chile dummy 3.553*** 2.530*** 0.591 2.829**[7.024] [3.619] [1.271] [2.548]
Internet penetration*Chile dummy 0.004[1.339]
Schooling years*Chile dummy –0.041[–0.315]
Rule of law 0.093 0.094[0.462] [0.465]
Rule of law*Chile dummy –0.326[–0.274]
Constant 20.285*** 14.761*** 22.643*** 22.849*** 27.457*** 28.467* 31.671**[7.180] [3.861] [3.980] [3.999] [3.626] [1.939] [2.025]
Observations 1,004 917 622 622 622 251 251R2 0.984 0.985 0.987 0.987 0.987 0.988 0.988
Source: Authors’ calculations.Note: Robust t-statistics are in brackets.* = significant at the 10 percent level; ** = significant at the 5 percent level; *** = significant at the 1 percent level.
35
1

In column 2, one finds that Internet penetration, by itself, does not signifi-cantly affect commercial service exports. This finding probably reflects the factthat many developing countries have been able to export services even withouthaving a larger percent of their population exposed to new technology. Whatmatters for service exports is that exporting firms have access to ICT, whichmay be provided by the government through special programs such as the soft-ware technology parks. Another reason ICT penetration may not be sufficientin explaining service exports could be that it requires a complementary input(that is, education or human capital skills), without which it cannot be usedmeaningfully. This hypothesis will be tested by adding the level of education, asproxied by average years of schooling, as an explanatory variable in the nextspecification.
Notice that in the specification of column 3, even though Internet penetrationis not significant in affecting service exports for the sample of countries, it doesexplain why Chile is an outlier in exporting services. This finding is clear from thelower magnitude of the Chilean dummy relative to its size in column 1. However,the coefficient for the Chilean dummy is still positive and significant. Hence,although Internet penetration explains part of the Chilean success in exportingservices, it does not provide a complete explanation. ICT penetration may notfully explain service exports from Chile because of the composition of serviceexports in Chile, which is heavily biased toward a service that is not intensive inICT usage (that is, transport services).
Column 3 tests whether Internet penetration, together with skill, explains serv-ice exports in general and particularly from Chile. Not only is human capital con-sequential in explaining service exports from the sample of countries, but it alsoaccentuates the effect of ICT penetration. This effect is seen in the positive andsignificant coefficient for the two variables in this specification. Most notably, thecoefficient for the Chilean dummy loses significance in column 3. Thus, ICT pen-etration and average years of schooling in Chile completely account for Chile’sperformance in commercial service exports.
In column 4, an interaction term of the variable on Internet penetration withthe Chilean dummy is added to evaluate whether the effect of Internet penetra-tion is larger for Chile than for the rest of the countries in the sample. The positivebut insignificant coefficient for this interaction term suggests that the effect ofInternet penetration on commercial service exports in Chile is not significantlylarge vis-à-vis an average country.
Column 5 assesses whether human capital skills have a higher effect on serviceexports from Chile than on such exports from the rest of the countries in the sam-ple. This assessment is done by adding an interaction term of average years ofschooling with the Chilean dummy. The insignificance of the coefficient for this
352 Exporting Services

interaction term suggests that the effect of investment in human capital on Chileis not any different than its effect on the average country in the sample.
Column 6 assesses whether the quality of institutions, over and above ICT net-work and human capital, matter for commercial services exports. The coefficientfor the rule of law variable, obtained from Kaufmann, Kraay, and Mastruzzi(2006), is not significant in explaining commercial service exports. This resultmay be attributable to a high correlation of the rule of law variable with GDP percapita (0.78), Internet penetration (0.69), and human capital (0.81). One can alsosee that, in this specification, the positive and significant coefficient for theChilean dummy returns when this institutional variable is added, which impliesthat, given the state of institutions in Chile, service exports should have beenlower and not higher. Thus, the quality of institutions does not explain Chileansuccess in exporting services.
In column 7, an interaction term of the rule of law variable with the Chileandummy is added to assess whether institutions have higher or lower effect onChile compared with the rest of the world. The coefficient for this interactionterm is found to be insignificant, implying that the effect of the quality of institu-tions on Chilean commercial service exports is no different than their effect onother countries in the sample.
In 2008, 60 percent of service exports from Chile were in transport services,and other commercial service exports comprised only 24 percent of serviceexports, while the reverse was true for the world average. In a world where global-ization is increasingly leading to offshoring of other commercial services, such ascomputer and information services or other business services, one would like toevaluate why Chile has not been able to take advantage of this opportunity. Com-mercial service exports are estimated in a cross-country framework, and a dummyvariable for Chile is introduced (along with interaction of the Chilean dummywith the explanatory variables). The following base model is estimated:
log(Other commercial service exports)it = FEi + log(Per capita income)it
+ log (Service value added)it
+ log (GDP)it + Chile dummy+ eit. (9.5)
As before, service value added is a proxy for the value added in the OCS exportsector and is likely to positively influence exports, whereas GDP reflects domesticconsumption demand for OCSs and therefore is likely to drag down services avail-able for export purposes. GDP per capita represents the productivity level of thecountry and is likely to positively affect OCS exports. The Chilean dummy isadded to assess whether OCS exports from Chile are higher or lower than whatwould be predicted for the level of these fundamental variables: GDP per capita,
The Case of Chile 353

service value added, and GDP. The result of the estimation is presented in table9.A.2. In column 1, the Chilean coefficient is found to be negative and highly sig-nificant, implying that actual OCS exports from Chile are way below the level thatis predicted by these fundamental variables.
The regression output in column 1 of table 9.A.2 reflects that from 1990 onward,given Chile’s GDP, GDP per capita, and service value added, Chilean OCS exportshave been below the prediction on average. The next step is to evaluate whether thepenetration of the telecommunication network affects OCS exports in general andparticularly so for Chile. After a proxy for the telecommunication network (that is,Internet penetration) is added to the econometric specification in equation 9.5, themodel is reestimated. The result for this extended model is presented in column 2. Incontrast to the result for commercial service exports, Internet penetration doessignificantly affect OCS exports. Thus, the reason for the lack of significance ofInternet penetration in the case of commercial or aggregate service exports doesrelate to the fact that OCSs are more intensively involved in telecommunicationnetwork relative to aggregate or commercial services and, therefore, are morelikely to be affected by Internet penetration in the country. Notice that the magni-tude of the coefficient for the Chilean dummy falls by half relative to its size in col-umn 1 when the Internet penetration variable is introduced into the specificationin column 2. This change implies that the extent of Internet penetration in Chileis significant in explaining the lack of success in OCS exports. The lower level ofInternet penetration in Chile relative to its per capita income partially explains therelatively low contribution of OCS exports in aggregate service exports.
In the next specification, in column 3, human capital skills are added to evalu-ate whether the level of human skills in Chile explains the lack of OCS exportsfrom the country. Human capital, as proxied by average years of schooling, isfound to positively and significantly affect OCS exports. Given the decline in mag-nitude for the coefficient of the Chilean dummy in this specification, one can con-clude that the level of skills in Chile is also partially responsible for the relativelylow level of OCS exports from Chile. Notice that even when both the electronicinfrastructure and the human skill endowment variable are added, the signifi-cance of the coefficient for the Chilean dummy does not vanish. Thus, unlike thecase for commercial service exports, Internet penetration and human skill are notsufficient to explain Chilean performance in OCS exports.
As in the case of commercial service exports, whether Internet penetration oraverage years of schooling affect Chile differently from other countries in the sam-ple is also evaluated. An interaction term of Internet penetration with the Chileandummy is added in column 4, while in column 5, average years of schooling isinteracted with the Chilean dummy. The coefficients for both these interactionterms are found to be insignificant, thus implying that the effect of a better
354 Exporting Services

Table 9.A.2. Commercial Service Exports from the Chilean PerspectiveDependent variable: other commercial service exports
Variable (1) (2) (3) (4) (5) (6) (7)
GDP, per capita (constant US$), in logs 3.572*** 2.462*** 2.462*** 2.463*** 2.465*** 3.211** 3.226**[10.096] [5.116] [3.772] [3.769] [3.775] [2.017] [2.021]
Services value added, in logs 0.966*** 0.945*** 0.926*** 0.926*** 0.926*** 0.902*** 0.902***[31.060] [32.115] [35.307] [35.276] [35.243] [4.813] [4.802]
GDP (constant US$), in logs –3.438*** –2.043*** –2.069*** –2.072*** –2.036*** –3.622** –3.630**[–9.405] [–4.049] [–3.342] [–3.336] [–3.265] [–2.164] [–2.164]
Internet users per 100 0.006*** 0.008*** 0.008*** 0.008*** 0.003 0.003[3.694] [4.298] [4.290] [4.250] [1.041] [1.017]
Average years of schooling 0.192* 0.192* 0.188* 0.020 0.019[1.777] [1.776] [1.740] [0.069] [0.065]
Chile dummy –11.706*** –6.370*** –5.630** –13.424**[–8.300] [–3.331] [–2.369] [–2.180]
Internet penetration*Chile dummy 0.001[0.139]
Schooling years*Chile dummy –0.310[–1.369]
Rule of law –0.304 –0.308[–0.753] [–0.756]
Rule of law*Chile dummy 0.895[0.368]
Constant 66.313*** 35.827*** 34.498*** 34.556*** 30.422*** 76.032** 76.119**[8.338] [3.377] [2.632] [2.624] [2.863] [2.175] [2.173]
Observations 992 905 613 613 613 248 248R2 0.955 0.959 0.967 0.967 0.967 0.971 0.971
Source: Authors’ calculations.Note: Robust t-statistics are in brackets.* = significant at the 10 percent level; ** = significant at the 5 percent level; *** = significant at the 1 percent level.
35
5

telecommunication network or longer years of schooling on Chile is not any dif-ferent from that on the rest of the world.
Column 6 presents a model that evaluates the effect of institutions on OCSexports in general and particularly for Chile. For the measure of institutions (thatis, the rule of law), OCS exports from the sample of countries are not criticallyaffected, perhaps because of multicollinearity. For the case of Chile, the negativeand significant coefficient for the Chilean dummy increases in value comparedwith its size in the specification shown in column 3, which implies that given thestate and quality of institutions in Chile, its OCS exports are very low.
In column 7, an interaction term on the quality of institutions is added to theChilean dummy to check whether the effect of institutions on Chile is any differ-ent from their effect on the rest of the countries in the sample. The coefficient forthis interaction term is insignificant, implying that institutions affect OCS exportsfrom Chile in the same manner as they do from any country.
From this econometric exercise, one can draw several conclusions. First, Chileis an example of a successful exporter of commercial services, but it is ratherunsuccessful at exporting other commercial services. Second, telecommunicationnetwork density, as proxied by Internet penetration; human capital skill, as prox-ied by average years of schooling; and physical infrastructure (road-length infra-structure) explain the success of Chile in exporting commercial services. Althoughapparently contradictory, the same factors explain the lack of success in OCSexports from Chile.
How can this last conclusion be reconciled? The presence of telecommunica-tion network density or human capital skills in Chile is enough to promote com-mercial services such as transport or travel services, but it is low with respect tothe level required for providing OCS exports. Thus, factor endowment in Chilein terms of telecommunication network or human capital skill or road-lengthinfrastructure encourages transport service exports. However, because OCSexports are highly intensive in these inputs, Chile is not able to provide OCSservices in the international market owing to insufficient availability of theseendowments.
Notes
1. This fluctuation seems to be explained by the importance of the mining industry in Chile.Service share in GDP tends to move inversely with respect to the relative weight of mining in Chile’sGDP. In turn, this ratio oscillates sharply in response to changes in the world prices of minerals,mainly copper. According to the Central Bank of Chile, services’ share in GDP (in current pesos)accounted for 60.4 percent in 2008, down from 65.7 percent in 2003.
2. Employment and remuneration data are from the weekly economic statistics series pub-lished by the Central Bank of Chile. See http://www.bcentral.cl/eng/economic-statistics/series-indicators/.
3. These data are according to the national accounts of the Central Bank of Chile.
356 Exporting Services

4. These data are from the World Trade Organization statistics database at http://stat.wto.org/Home/WSDBHome.aspx?Language=.
5. Trade statistics are from the Central Bank of Chile (http://www.bcentral.cl).6. See the World Trade Organization statistics database, trade in commercial services data for
2008.7. Commercial services correspond to services minus “government services, not included else-
where.” Other commercial services include communication services; construction; insurance services;financial services; computer and information services; royalties and license fees; other business serv-ices; and personal, cultural, and recreational services.
8. The Central Bank of Chile does not have estimates for construction services; therefore, exportsof this sector are omitted.
9. Merchanting is defined as the purchase of a good by a resident of a country from a nonresidentand the subsequent resale of the good to another nonresident. During the process, the good does notenter or leave the resident country. The difference between the value of goods when acquired and thevalue when they are sold is recorded as the value of merchanting services provided.
10. According to the website of the Chilean Association of Engineering Consulting Companies,(http://www.aic.cl/?page_id=1378&lang=es) 95 percent of engineering exports in Chile correspondto mining engineering services. Also, exports of engineering consulting services have increased fromless than US$13 million in 2003 to US$230 million in 2008. The main destination markets are Peru(35 percent), Argentina (22 percent), and South Africa (12.9 percent).
11. The study results are available on the Deloitte website at http://www.deloitte.com/view/es_CL/cl/servicios/outsourcing/101b00ebfbd46210VgnVCM200000bb42f00aRCRD.htm.
12. For instance, Falabella transformed Financiera CMR in Peru into Banco Falabella, andCencosud broke into the credit card market in Argentina (ECLAC 2007).
13. This section is based on Sáez (2008).14. Between 1985 and 1991, Chile also used a special debt-swap mechanism for the inflow of
foreign direct investment to cope with the 1982 financial crisis. In 2007 and 2008, inflows using thechapter XIV mechanism were higher than those entering under DL 600. According to the ForeignInvestment Committee, total FDI inflows amounted to US$12.2 billion in 2008: US$5.2 billioncame under DL 600 while US$6.9 billion came under chapter XIV. See the committee’s website athttp:// http://www.inversionextranjera.cl/.
15. The DIRECON survey is based on several open sources, and its estimates include not onlydirect materialized investments but also other sources of capital. The criteria followed by DIRECONare based on the methodology proposed by UN and others (2002).
16. See OECD (2010). Similar views can be found in International Evaluation Panel (2010) andKharas and others (2008).
17. For more information, see the websites of the rating agencies: Moody’s (http://www.moodys.com), Fitch (http://www.fitchratings.com), and Standard & Poor’s (http://www.standardandpoors.com).
18. According to the OECD (2011), in professional services (accountants, architects, engineers,and lawyers), entry barriers are comparatively high, in particular regarding exclusive rights of provi-sion, which keep potential entrants out of the market. Advertising bans in these professions furtherrestrict competition.
19. See, for example, the analysis of the call center industries in Chile in Fernández-Stark, Bamber,and Gereffi (2010a) and Manso (2010).
20. See, for example, an analysis in El Mercurio, July 5, 2010, and proposals in CNIC (2010).21. PISA is an OECD-sponsored system of international assessments that focuses on 15-year-olds’
capabilities in reading, mathematics, and science.22. CNIC was created in 2005 and is a public-private institution whose main function is to advise
the president of Chile on the identification and formulation of public policies related to science, tech-nology development, transfer, and diffusion as well human resources qualifications. See http://www.cnic.cl.
23. See the Ministry of Education’s website at http://www.futurolaboral.cl.
The Case of Chile 357

24. The current Movistar monthly connection cost is about US$57 (Ch$29,900 at US$1 =Ch$520) for a four megabyte connection.
25. The list is available at http://www.ustr.gov/sites/default/files/Priority%20Watch%20List.pdf.26. These observations were taken from interviews with Chilean firms as well as news articles of
Chilean and foreign sources (La Tercera 2010; Spencer Ruff 2000).27. These data are based on information from the University of Chile, the Ministry of Education,
and interviews.28. Abundant literature exists on Chile’s failure to diversify exports. The fact is candidly recog-
nized even by official publications such as DIRECON (2009).29. This section is partly based on Sáez (2008).30. ProChile’s work program also has to consider the regional demands arising from the delimited
regional plans (planes regionales acotados), which originate in Chile’s regional development agencies.Hence, the central plan elaborated by ProChile has to be reconciled with the needs of 15 differentregions of the country. Therefore, the Service Trade Department’s budget has to reconcile and beshared with the regions.
31. For more information, see Sernatur’s website at http://www.sernatur.cl.32. To access to this benefit, an exporter must fulfill a number of requirements. The most impor-
tant is that the National Customs Service must confirm exports of services. According to the NationalCustoms Service, cross-border service exports reached a total of US$897 million in 2010. The privatesector has requested that the confirmation of service exports by the National Customs Service be ter-minated (CPC and AmCham Chile 2005).
33. The text of the law is available at http://www.sii.cl/pagina/jurisprudencia/adminis/2003/renta/ja562.htm.
34. The information about this policy comes from Castillo (2009) and Gereffi and Fernández-Stark (2010).
35. Details of the program are available at http://www.corfo.cl/becasdeingles.36. Relevant associations include Engineers Professional Association (Colegio de Ingenieros de
Chile), the Chilean Association of Engineering Consulting Companies (Asociación de Empresas Con-sultoras de Ingeniería de Chile), the Chilean Association of ICT Firms (Asociación Chilena de Empre-sas de Tecnología e Información), and the Chilean Construction Chamber (Cámara Chilena de la Con-strucción).
37. Chile’s export diversification challenge and policy options are discussed in OECD (2011). 38. For instance, Oracle employs only 260 Chileans of a potential total of 500 employees in part
because of the Chilean labor force’s lack of English-language skills. Capgemini has also explicitly men-tioned a shortage of English speakers as a concern that should be addressed (Tholons 2010).
39. For more information, see CPC and AmCham Chile (2005), Kharas and others (2008), andCNIC (2010). Together with rigidities in the labor market, the labor cost is a challenge that must bedealt with if Chile is to compete with attractive new markets in the region. For instance, in the case ofcall centers, an industry highly sensitive to labor costs, which represent 70 percent of total costs, Chilefaces competition from Colombia and Peru. Labor costs are US$4.82 per hour in Chile, whereas theyare only US$1.03 and US$1.10 for Colombia and Peru, respectively (Manso 2010).
40. Information is from the NationMaster database at http://www.nationmaster.com.41. See the services trade time series in the World Trade Organization statistics database. 42. In regard to immigration, the cost of visas can be extremely high, reaching in some cases
almost US$1,000 (see the analysis in El Mercurio, July 5, 2010).
References
Achá Álvarez, Verónica, and Cristian Bravo Lillo. 2009. “Chile: Desarrollo Endógeno con ProyeccionesExternas.” In Desafíos y Oportunidades de la Industria del Software en América Latina, ed. PauloBastos Tigre and Felipe Silveira Marques, 105–38. Bogotá: ECLAC.
358 Exporting Services

Agosín, Manuel, Christian Larraín, and Nicolás Grau. 2009. “Industrial Policy in Chile.” WorkingPaper 294, Economics Department, University of Chile, Santiago.
Agosín, Manuel, and Juan José Price. 2009. “¿Se Justifica una Política Industrial Hacia la InversiónExtranjera? El Programa de Atracción de Inversiones de Alta Tecnología.” Revista Economía yAdministración 15 (November–December): 4–12.
AméricaEconomía. 2005. “Las 500 Mayores Empresas de América Latina.” AméricaEconomía, July 15–August 18.
A.T. Kearney. 2009. “Chile: A Top Destination for Global Services—Quality and Stability of an OECDCountry at Latin American Costs.” Prepared for Invest Chile–Corporación de Fomento, Santiago.
Boston Consulting Group. 2007. “Estudios de Competitividad en Clusters de la Economía Chilena.”Prepared for Corporación de Fomento, Santiago.
Castillo, Mario. 2009. “The Global Services Industry and Opportunities for Chile.” Corporación deFomento, Santiago.
CERET (Centro de Estudios del Retail). 2009. “Estudio sobre el Cluster del Retail: Oferta y Potenciali-dad Exportadora.” CERET–Ingeniería Industrial, University of Chile, Santiago.
CNIC (Consejo Nacional de Innovación para la Competitividad). 2010. Agenda de Innovación yCompetitividad 2010–2020. Santiago: CNIC.
CPC (Confederación de la Producción y del Comercio) and AmCham Chile (Cámara Chileno–Norteamericana de Comercio). 2005. “Fortaleciendo a Chile como Plataforma de Negocios: Prob-lemas y Soluciones.” CPC and AmCham Chile, Santiago.
DIRECON (Dirección de Relaciones Económicas Internacionales). 2009. “Chile: Veinte Años de Nego-ciaciones Comerciales.” DIRECON, Santiago.
Dutta, Soumitra, and Irene Mia, eds. 2009. The Global Information Technology Report 2008–2009:Mobility in a Networked World. Geneva: World Economic Forum.
ECLAC (Economic Commission for Latin America and the Caribbean). 1989. “Los Servicios al Productoren la Fruticultura Chilena de Exportación.” ECLAC LC/R.775, Santiago.
———. 2005. Foreign Direct Investment in Latin America and the Caribbean, 2005. Santiago: UnitedNations.
———. 2007. Foreign Direct Investment in Latin America and the Caribbean, 2007. Santiago: UnitedNations.
Economist. 2010. “Googlenet: A Cure for America’s Lame and Costly Broadband?” Economist, April 1.http://www.economist.com/node/15841658.
Fernández-Stark, Karina, Penny Bamber, and Gary Gereffi. 2010a. “Chile’s Offshore Services ValueChain.” Center on Globalization, Governance, and Competitiveness, Duke University, Durham, NC.
———. 2010b. Engineering Services in the Americas. Durham, NC: Center on Globalization, Gover-nance, and Competitiveness.
Foreign Investment Committee. 2011. “Foreign Direct Investment in Chile Increases by 17.3% in2010.” Press release, March 31. http://www.foreigninvestment.cl/images/stories/pdfs/noticias/Release_FDI_2010.pdf.
Gereffi, Gary, Mario Castillo, and Karina Fernández-Stark. 2009. “The Offshore Services Industry: ANew Opportunity for Latin America.” Policy Brief IDB-PB-101, Inter-American DevelopmentBank, Washington, DC.
Gereffi, Gary, and Karina Fernández-Stark. 2010. “The Offshore Services Value Chain: DevelopingCountries and the Crisis.” Policy Research Working Paper 5262, World Bank, Washington, DC.
Gregory, Neil, Stanley Nollen, and Stoyan Tenev. 2009. New Industries from New Places: The Emergenceof the Hardware and Software Industries in China and India. Washington, DC: World Bank.
IDC. 2009. “Observatorio de la Industria de Servicios Globales en Chile.” Study undertaken for Cor-poración de Fomento, Santiago.
International Evaluation Panel. 2010. Evaluation Report of National Innovation Strategy for Competi-tiveness, Chile. Santiago: Consejo Nacional de Innovación para la Competitividad.
ITU (International Telecommunications Union). 2009. Measuring the Information Society: The ICTDevelopment Index, 2009 Edition. Geneva: ITU.
The Case of Chile 359

Kaufmann, Daniel, Aart Kraay, and Massimo Mastruzzi. 2006. “Governance Matters V: GovernanceIndicators for 1996–2005.” Policy Research Working Paper 4012, World Bank, Washington, DC.
Kharas Homi, Danny Leipziger, William Maloney, R. Thillainathan, and Heiko Hesse, 2008. “ChileanGrowth through East Asian Eyes.” Commission on Growth and Development Working Paper 31,World Bank, Washington, DC.
La Tercera. 2010. “El Esfuerzo por Generar Recursos Humanos Globalizados.” La Tercera, November14. http://www.laborum.cl/portal_prensa/escenario_laboral/escenario_laboral/725.html.
Latinobarómetro. 2009. Informe 2009. Santiago: Latinobarómetro.López, Dorotea, and Felipe Muñoz. 2008. “Financiamiento a la Exportación de Servicios: El Caso de las
Empresas de Tecnologías de la Información y Comunicación.” University of Chile, Santiago.López-Claros, Augusto, ed. 2009. The Innovation for Development Report 2009–2010: Strengthening
Innovation for the Prosperity of Nations. Schloss Reichartshausen, Germany: European BusinessSchool International University.
Manso, Miguel. 2010. “Miles de Trabajadores Pierden Empleos en Call Centers por Falta de Competi-tividad de Industria.” El Mercurio, April 8, 2010.
OECD (Organisation for Economic Co-operation and Development). 2007a. OECD Economic Surveys:Chile 2007. Paris: OECD.
———. 2007b. PISA 2006: Science Competencies for Tomorrow’s World. 2 vols. Paris: OECD.———. 2010. OECD Economic Surveys: Chile 2010. Paris: OECD. ———. 2011. Maintaining Momentum: OECD Perspectives on Policy Challenges in Chile. Paris: OECD. Sáez, Raúl E., and Sebastián Sáez. 2006. “Las Negociaciones de Servicios Financieros de Chile. Comer-
cio Internacional 75, ECLAC, Santiago.Sáez, Sebastián. 2008. “The Chilean Experience in Services Negotiations.” In Opening Markets for Trade
in Services: Countries and Sectors in Bilateral and WTO Negotiations, ed. Juan Marchetti and MartinRoy, 667–705. Cambridge, U.K.: Cambridge University Press.
Sáez, Sebastián, and Juan Gabriel Valdés. 1999. “Chile y Su Política Comercial ‘Lateral.’” Revista de laCEPAL 67 (April): 81–94.
Schwab, Klaus, ed. 2009. The Global Competitiveness Report 2009–2010. Geneva: World EconomicForum.
Schwellnus, Cyrille. 2010. “Chile: Boosting Productivity Growth by Strengthening Competition, Entre-preneurship and Innovation.” OECD Economics Department Working Paper 785, Organisationfor Economic Co-operation and Development, Paris.
Spencer Ruff, Erich. 2000. “Ejecutivos para los Negocios Internacionales: Elementos para el Desarrollode Programas Formativos.” Revista Economía y Administración 54: 7–23.
Tholons. 2010. “Chile Outsourcing: Optimizing Opportunities in Services Globalization.” Integrationand Trade Sector, Inter-American Development Bank, Washington, DC.
UN (United Nations), European Commission, International Monetary Fund, Organisation forEconomic Co-operation and Development, United Nations Conference on Trade and Develop-ment, and World Trade Organization. 2002. Manual on Statistics of International Trade in Serv-ices. New York: UN; Washington, DC: IMF. http://unstats.un.org/unsd/publication/Seriesm/Seriesm _86e.pdf.
WTO (World Trade Organization). 2008. International Trade Statistics 2008. Geneva: WTO.
360 Exporting Services

AABES. See Brazilian Association of Software
CompaniesAbidin, Mahani Zainal, 161, 166accounting services, 256adjacency (geographic) as service export
determinant, 39advertising. See marketing effortsAegis, 262bAFAS (ASEAN Framework Agreement on
Services), 179–80, 189Agenor, Pierre-Richard, 154agriculture sector, 84–85, 85–86f, 115n2Ahluwalia, Montek S., 117n22AirAsia, 168, 174, 177–78Air Philippines, 149airports and air travel, 148–50, 154, 187–88, 189,
299, 338. See also transport services;specific airlines
Alcatel-Lucent, 218American Electronics Association, 77n30American Express, 222American Recovery and Reinvestment Act of
2008, 153Amin, Mohammad, 30–31, 93, 204Anand, Rahul, 193Anderson, James E., 40Angola, engineering projects in, 291animation businesses, 133, 136, 250Annual Report 2009 (Public Works and Highway
Department, Philippines), 148APEC (Asia-Pacific Economic Cooperation), 153ApexBrasil, 15–16, 293, 300–301, 304
architects and architecture services, 183, 250–51,255b. See also construction services
Argentinacertification programs in, 339bChilean investment in, 328English language proficiency in, 285graduates, numbers of, 334infrastructure in, 335Internet access in, 335labor force in, 346salaries in, 335service exports from, 316, 324tax benefits in, 286tourism in, 341
Arora, Ashish, 30, 106ASEAN. See Association of Southeast Asian
NationsASEAN Framework Agreement on Services
(AFAS), 179–80, 189Asian financial crisis (1998), 175Asia-Pacific Economic Cooperation (APEC), 153associability, 337Association of Certified Fraud Examiners, 266Association of Private Hospitals of Malaysia, 183Association of Southeast Asian Nations
(ASEAN)electricity costs and, 132foreign direct investment (FDI) and, 168foreign ownership limits and, 131international students and, 170labor force skills and, 186liberalization agreements and, 179–80mutual recognition agreements and, 182
361
Index
Boxes, figures, notes, and tables are indicated with b, f, n, and t following the page numbers.

Association of Southeast Asian Nations(ASEAN) (continued)
open-skies policies of, 149, 177remittances and, 127btourism and, 146, 172
A.T. Kearney (consulting firm), 12, 138, 205, 218,279, 281
Australiaair carriers in, 188contact center service to, 218Filipino workers in, 127btourism and, 172
Australian Productivity Commission, 37Austria, Brazilian investments in, 287available seat kilometers, 149, 155n15Aviation Information Technology, 220b
BBagde, Surendrakumar, 30, 106The Bahamas, Brazilian investments in, 287Bahrain
economic performance in, 205financial services in, 208, 211higher education in, 188software companies in, 219, 231
Balance of Payments Manual (IMF), 190n4Banaue Rice Terraces (Philippines), 148Banco do Brasil, 273Banco Falabella, 357n12Banco Itaú, 270, 288Bangko Sentral ng Pilipinas, 127bBangladesh
healthcare facilities in, 168higher education institutions in, 168international students from, 169, 170
banking. See financial services and banking;Islamic finance; specific banks
Bank Negara Malaysia, 167, 181–82Bank of America, 3Banque de la Poste Belge, 220bBarro, Robert J., 107BASAs (bilateral air service agreements), 149Bastos Tigre, Paulo, 283BDIA (Brazilian direct investment abroad),
286–87, 287fBeltone Financial, 208, 211Bhattacharya, Rudrani, 99Bhide, Shashanka, 117n22bilateral air service agreements (BASAs), 149Biztour5, 152BNDES (Brazilian Development Bank), 273–74,
307n2Board of Investments (BOI, Philippines),
131, 141, 144Borchert, Ingo, 116n12Boston Consulting Group, 334, 339bBPAP. See Business Processing Association of the
Philippines
BPO. See business process outsourcingBPO Sector Support Programme, 262bBPT services. See business, professional,
and technical servicesbrain drain, 113brand equity, 260branding techniques, 229, 265–66. See also
marketing effortsBRASSCOM. See Brazilian Association of
Information Technology and Communication
Brazil, xv, 5, 269–308business, professional, and technical (BPT)
services, 273, 274–75, 277, 294–95, 294fbusiness climate in, 277–82, 280–81fcertification programs in, 339bChilean exports to, 327b, 328China compared with, 279cost and price comparisons, 285–86destination markets for, 14diasporas from, 13export promotion policies for, 300–301foreign direct investment (FDI) and, 18,
286–91, 288–90f, 295, 298, 303, 305–6tgoods trade, liberalization of, 83government support in, 291–300, 292f, 304
construction and related services, 269, 296–98, 297–98f, 303
legal services, 295–96other services, 296success factors and, 292–93transport services, 298–300, 299f, 303–4
graduates, numbers of, 334India compared with, 273, 279, 280f, 303industry associations in, 17, 19, 302–3information technology (IT) and, 15infrastructure in, 335other commercial services (OCSs) and, 321Philippines compared with, 273, 303regulations and institutions in, 11, 282–83,
284fsalaries in, 335service exports, overview of, 1, 25, 269–74,
272f, 303, 307n1service exports in economic context, 12–13,
274–77, 275–76f, 278f, 304, 316, 324skill availability in, 7, 31, 283–85, 304technology institutes in, 51trust rankings for, 337
Brazilian Association of Information Technologyand Communication (BRASSCOM),270, 279, 281f, 282
Brazilian Association of Software Companies(ABES), 270, 283, 284f, 285
Brazilian Association of Travel Agencies, 282Brazilian Development Bank (BNDES),
15–16, 273–74, 291, 292f, 298, 304, 307n2
362 Index

Brazilian direct investment abroad (BDIA), 286–88, 287f
Brazilian Franchise Association, 296Brazilian International Trade Association, 302Brazilian Trade and Investment Promotion
Agency. See ApexBrasilBRIC (Brazil, Russian Federation, India, and
China), 273, 285. See also specificcountries
British Virgin Islands, Brazilian investments in, 287
broadband. See InternetBrunei Darussalam, tourism and, 172Brunei Darussalam–Indonesia–Malaysia–
Philippines East Asian Growth Area, 149business, professional, and technical (BPT)
services, 273, 274–75, 277, 294–95, 294f.See also business process outsourcing;commercial and business services
Business Daily, awards from, 259Business Environment Ranking, 331Business Platform for Innovation, 343Business Process Enabling South Africa, 264bBusiness Processing Association of the
Philippines (BPAP), 17–18, 132–33, 136,141, 144, 153
business process outsourcing (BPO). See alsobusiness, professional, and technicalservices; commercial and businessservices
clients for, 248customization and, 250development of, 261, 262–64bexport process in, 255bin Indian service exports, 12, 132, 133, 154,
187, 238labor costs of, 194Malaysian service exports and, 263bmarketing and, 254offshoring of, 242, 243fother commercial services (OCSs) and, 96Philippine service exports and, 11–12, 121,
122–23, 132–44, 152–54skill shortages and, 7, 266software service exports and, 98, 116n13turnover in, 246
Business Trust, 262b
CCAD (computer-aided design), 251call centers, 93, 218, 220b. See also contact
centersCambodia
foreign labor from, 175service exports from, 1
Canadabusiness process outsourcing (BPO) in, 132contact center operations in, 33
double taxation agreements with, 340Filipino workers in, 127bgeographical determinants and, 39Indian services export to, 98, 99, 101intraregional trade in, 38preferential trade agreements with, 345regulations in, 36
Canuto, Otaviano, xviCapability Maturity Model Integration
(CMMI), 339bCapgemini, 358n38catch-up argument for services growth, 91–92Cathay Pacific Airlines, 155n13Cattaneo, Olivier, 32, 76n11Cayman Islands, Brazilian investments in, 287CBE (Central Bank of Egypt), 203, 211Cebu Pacific, 149Cencosud, 324, 357n12Center for Business Support, 222Center for International Trade Studies
Foundation, 302Center for Retail Studies (CERET), 324Center for the Study of Law Firms, 295Central Agency for Public Mobilization and
Statistics (Egypt), 214Central Bank of Brazil, 286–87, 289Central Bank of Chile, 322, 356n1Central Bank of Egypt (CBE), 203, 211Central Statistical Organization, 115n2CERET (Center for Retail Studies), 324certification standards, international, 339bChiang Mai (Thailand), 148Chile, xv, 5, 10–11, 309–60
bilateral trade agreements and, 14compensation costs in, 286English language proficiency in, 285, 336, 345industry associations in, 17, 19information and communication technology
(ICT) in, 12, 15institutions in, 77n30offshoring exports, 324, 325–26fservice development policy for, 311, 345–49service exports, cross-border trade and, 13,
311, 318–30, 321fforeign direct investment (FDI) and, 11,
328–30, 329f, 330thidden exports, 327bother commercial services (OCSs) and,
318–19, 320b, 321–27, 323t, 354, 356retail and, 324, 327b, 344transport services and, 319, 319t
service exports, economic context for, 311–18,313t, 314–15f, 317–18t
service exports, fundamentals anddevelopment of, 311, 331–37
cultural and language affinities, 336–37infrastructure and, 335–36, 349intellectual property protection and, 336
Index 363

Chile (continued)regulations and institutions, 332–33, 348skill availability and, 7, 18, 31, 333–35
service exports, overview of, 26, 309–11, 310fservice exports, performance of, 311, 337–45
arrangements facilitating, 338–40credibility in service provision and,
339, 339bdata and variables on, 349–56, 351tprivate associations and, 345promotion policies for, 340–44, 342t,
348, 349service negotiations and, 293tax benefits in, 286
Chilean Association of Engineering ConsultingCompanies, 357n10
Chilean Development Agency (CORFO)on commercial services, 322High-Technology Investment Promotion
Program, 342human capital and, 334Innova division of, 343promotion activities of, 348Registry of Individuals with Advanced
English-Language Skills, 344software industry and, 346
Chilean Innovation and Competitiveness Fund, 343
China, People’s Republic ofBrazil compared with, 279, 280fbusiness process outsourcing (BPO) in, 133compensation costs in, 286diaspora from, 177economy of, 277foreign direct investment (FDI) and, 102, 168,
182, 279, 291higher education institutions in, 168, 188infrastructure and, 335international students from, 169, 170, 171labor costs in, 194, 219manufacturing exports from, 269other commercial services (OCSs) and, 321as outsourcing destination, 218, 281as remittance recipient, 127bservice exports and, 1, 25, 347software parks in, 51talent pool in, 139taxes in, 281, 286time zone advantages and, 219tourism and, 172wages in, 285
Cisco, 221b, 257bCIT Global, 220bCMMI (Capability Maturity Model Integration),
339bCNIC. See National Council for Innovation for
CompetitivenessCoalition of Service Exporters, 345
ColombiaChilean exports to, 327bgraduates, numbers of, 334
colonial history, 37, 40–41, 43, 48commercial and business services. See also
business, professional, and technicalservices; business process outsourcing
defined, 8, 9bEgyptian service exports and, 26, 196,
197f, 238growth in, 89
Commission on Information and Communica-tion Technology, 156n24
Communications Commission of Kenya, 266communications sector, 290–91Compañia Sudamericana de Vapores, 310comparative advantage theory. See also revealed
comparative advantageEgyptian service exports and, 193, 195,
200–205, 230–31information technology (IT) and, 108peaking point for, 271privatization and, 290service exports and, 3, 8
compensation costs, 286computer-aided design (CAD), 251computer service exports, 97–98, 116n13.
See also software servicesconstruction services. See also architects and
architecture servicesbidding and, 269exports of, 303government support for, 291, 298, 298f“macroeconomic jumping” and, 296permits for, 297–98, 297f
contact centers, 133, 136, 152, 153, 224. See alsocall centers
contiguity as service export determinant, 39contracts and contract enforcement
cost of, 107mudaraba contracts, 174mutual recognition agreements, 265procedures for, 82–83
Copyright Act (India), 111–12CORFO. See Chilean Development AgencyCORFO-Innova program, 339bCorporación de Fomento de la Producción de
Chile (Production DevelopmentCorporation), 15, 77n30
corruptionin court systems, 82institutions and, 5joint ventures and, 136perception index for, 33productivity and, 122, 131
Costa RicaChilean exports to, 327bforeign direct investment (FDI) and, 12, 33
364 Index

infrastructure in, 335innovation rankings and, 334Internet rates and, 335labor force in, 346service exports and, 25, 316, 347
creativity sectors, 16, 300–301credibility in service provision, 339, 339bCroatia, geographic distance determinants and, 39Crouch, Geoffrey I., 156n20C3 (outsourcing firm), 220bCuba, tertiary education in, 334cultural affinities. See soft skillsCzech Republic
information and communication technology(ICT) and, 218
innovation rankings and, 334
DDaewoo, 76n16Datamonitor, 217–18Data Protection Act (Philippines), 18, 144, 153data protection laws, 33, 153, 156n22, 156n24Data Security Council of India (DSCI), 112,
117n32Daud, Mohammad Mohd, 176debt-swap mechanisms, 357n14Decree Law 600 on foreign investment (Chile),
328, 357n14deficit levels, 274, 318–19Deloitte on retail sales in Latin America, 324Denmark
Brazilian investments in, 287double taxation agreements with, 340
de Paiva Verheijden, Jan-Willem, 36, 38, 39, 43Desh (garment firm), 76n16determinants of service exports. See service
export determinantsdeveloping countries. See also service exports,
developing-country perspective onforeign direct investment (FDI) and, 102infrastructure in, 190service export determinants in, 25–79. See also
service export determinantsdiasporas, 13, 40–41, 84, 108, 113–14, 177Dihel, Nora, 237Diosdado Macapagal International Airport, 150Directorate General of International Economic
Relations (DIRECON), 328, 357n15distance as service export determinant, 5, 28,
38–39, 43, 48, 77n25Doing Business rankings (World Bank), 107, 122,
131, 175, 204, 204t, 232n8, 279, 280f, 297Dominican Republic
Chilean exports to, 327btrust rankings for, 337
double taxation agreements, 293, 340, 342DSCI (Data Security Council of India), 112,
117n32
EEast African Community (EAC), 248, 250, 260,
265, 266n3Easterly, William, 76n16East Malaysia, ecotourism in, 176Eaton, Jonathan, 99ECCO Outsourcing, 220beconomic freedom indexes, 34, 35Economic Reform and Structural Adjustment
Program, 202, 232n6Economic Times (India) on business process
outsourcing, 155n7Economist
on broadband access, 335–36on Chile’s business environment, 331
ecotourism, 176Ecuador, highways in, 291, 304education and human capital
Brazilian service exports and, 7, 31, 283–85,304
broadband penetration and, 188Egyptian service exports and, 7, 18, 31, 51,
194, 200–202, 229–30financial services and, 212foreign direct investment (FDI) and, 180–82importance of, 18Indian service exports and, 7, 18, 82, 93, 94f,
111, 114for information technology (IT), 111liberalization in, 189Malaysian service exports and, 7, 18, 131,
185–88, 186t, 187t, 190other commercial services (OCSs) and, 354Philippines service exports and, 7, 18, 186,
263bprivate providers of, 179, 180productivity growth and, 116–17n22quality assurance in, 182as service export determinant, 5, 29–31, 30f,
43, 46–47, 48, 51, 77n27service exports and, 5–7, 6f, 27, 168, 170, 188,
213–17, 230, 352–53skill availability and, 186, 186t, 283–85,
333–35software service exports and, 106tourism services and, 228
EduEgypt, 7, 194, 225EFG Hermes, 208, 211Egypt, Arab Republic of, xv, 5, 193–235
business environment in, 19, 204–5, 204tcommercial and business services in, 26, 196,
197f, 238comparative advantage for, 193, 195, 200–205,
230–31diasporas from, 13financial services exports, 194–95, 208,
209–10t, 211–29health services and, 213–17, 216f, 230
Index 365

Egypt (continued)information and communication
technology (ICT) and software services,8, 15, 194, 217–26, 219t, 220–21b, 225t,230–31
tourism, 193, 195, 226–31, 227–28t, 227fwork permits and, 213, 214t
geographic location as advantage, 193, 200,229, 231
human capital in, 7, 18, 31, 51, 194, 200–202,229–30
industry associations in, 17, 19institutional framework in, 204–5, 204tmacroeconomic policies and reform, 202–3market liberalization in, 195, 196–200, 199tpolicy implications for, 229–31service exports, characteristics of, 14, 205–11service-specific reports, 205, 206–7tstrengths, weaknesses, opportunities, and
threats (SWOT) analysis, 229, 230tunemployment in, 201, 201t
Egyptian Exporters Association, 222Egyptian Foundation for Technology Education,
233n23Egyptian Stock Exchange, 208Egypt Post, 224Eichengreen, Barry, 85, 89, 115–16n11, 115n6Electronic Data Systems, 220belectronic infrastructure. See also infrastructure
Internet penetration and, 8as service export determinant, 5, 29, 34–35,
43, 46, 51, 75n6, 75t, 76–77n23service exports and, 5, 6f
Embraer, 270emigrants. See migrant workersEngineering News-Record on infrastructure and
engineering companies, 291engineering services, 106, 251, 255, 256, 260,
357n10Engineers Professional Association, 345English language proficiency
Chilean service exports and, 285, 336, 345IBM and, 285Indian service exports and, 194, 219, 285labor supply and, 153limitations in, 336, 345, 358n38Malaysian service exports and, 178promotion of, 343, 344talent pool for, 138–40, 139t, 140t, 152Test of English as a Foreign Language
(TOEFL), 285Test of English for International Communica-
tion, 344Engman, Michael, 213–14Enterprise Survey (2009), 131, 132entrepreneurial skills, 37, 42EPC (Export Promotion Council, Kenya),
261, 264
EPZs (export processing zones), 109–10, 117n27e-readiness scores, 190Ernst & Young, 258Essar Group, 262bEuropean Union (EU). See also specific countries
Brazilian exports to, 274business process outsourcing (BPO) and, 12Egyptian emigrants to, 213geographic distance determinants and, 39Hungary’s membership in, 348intraregional trade in, 38Mercosur and, 293regulations in, 36software exports to, 219
Eurostat data, 39Everest Research Institute, 133Executive Opinion Survey (2010), 131Executive Order No. 500 on flights
(Philippines), 150EXL Service, 101Export IT, 223bexport processing zones (EPZs), 109–10,
117n27Export Promotion Agency. See ProChileExport Promotion Capital Goods Scheme, 109Export Promotion Council (EPC, Kenya), 261,
264Exports Assurance Fund, 292Exports Credit Insurance program, 292Exports Financing Program of Brazil, 292extranets, 250
FFalabella, 357n12FDI. See foreign direct investmentFédération Internationale de Football
Association World Cup, 263nFernandes, Ana Margarida, 237FIC (Foreign Investment Committee),
180, 182FIML (full information maximum likelihood)
estimates, 36financial crisis
Asian crisis (1998), 175global crisis (2008–09), 144, 273, 277–78,
281, 304Financial Reporting (FiRe) Award of Institute
of Certified Public Accountants of Kenya, 259
financial services and banking, 35, 167, 190n2,271, 282. See also Islamic finance; specificfinancial institutions
Financial Services Master Plan of 2001(Malaysia), 182
Financiera CMR, 357n12FiRe (Financial Reporting) Award of Institute
of Certified Public Accountants of Kenya, 259
366 Index

Fitch Ratings, 331Foreign Capital Census (2001), 289Foreign Corrupt Practices Act of 1977
(U.S.), 136foreign direct investment (FDI)
Brazilian service exports and, 18, 286–91,288–90f, 295, 298, 303, 305–6t
Chilean service exports and, 11, 328–30, 329f, 330t
economic reforms and, 203education and, 180–82firm productivity and, 98–99Indian service exports and, 11, 101–3, 102f,
103t, 104f, 182, 291legal services and, 295Malaysian service exports and, 12, 102,
167–68, 169–70t, 180–82openness to, 286–91, 295, 298, 303, 305–6tservice activities and, 328, 348as service export determinant, 37, 41, 43,
47, 48software service sector and, 270wages and, 285
Foreign Exchange Regulation Act (India), 110,117n29
Foreign Investment Committee (FIC), 180, 182, 348
Foreign Investment Negative lists, 131Foreign Trade Secretariat, 293fragmentation of production, 3France
double taxation agreements with, 340international students and, 171
France Telecom, 218franchising, 126, 296Fraport AG, 155n12freedoms of the air, 149–50, 155n14, 156n17,
156n19Free Trade Area of the Americas, 293Freund, Caroline, 34Frost & Sullivan (market research firm), 262bfruit export industries, 327bFTEs (full-time employees), 133, 153fuel costs, 338full information maximum likelihood (FIML)
estimates, 36full-time employees (FTEs), 133, 153Fundación Chile study, 346
GGartner (research company), 264bGATS. See General Agreement on Trade in
ServicesGaza, violence in, 258bGCASH (mobile remittances and payments
system), 129bGCC (Gulf Cooperation Council), 174, 223bgender, occupations by, 127b, 128f, 214
General Agreement on Trade in Services (GATS),14, 126, 266n2
General Electric, 32generalized method of moments (GMM)
estimators, 31Genpact, 262bgeographic determinants of service exports,
37–40, 193, 200, 229, 231Germany
Brazilian exports to, 274double taxation agreements with, 293, 340foreign direct investment (FDI) and, 289international students and, 171
Ghana, service exports from, 1Ghoneim, Ahmed Farouk, 193Ghosheh, Naj, 138Gicho, Richard, 237Global Competitiveness Index (World
Economic Forum), 131–32, 147, 278–79, 331, 333, 335
Global Competitiveness Report (World EconomicForum), 186, 201, 204, 205, 299
global financial crisis (2008–09)economic performance and, 277–78information and communication technology
(ICT) and, 273, 281, 304tourism and, 144
GlobalOne, 222Global Pay Summary, 334Global Services Location Index (GSLI), 12, 138,
205, 232n9Global Services Program, 343–44, 345Global Services–Tholons, 205, 218, 232n14Global Sukuk, 167Globe Telecom, 129bGMM (generalized method of moments)
estimators, 31Gol Airlines, 272, 304Gordon, James, 117n22Goswami, Arti Grover, 1, 25, 81, 309Go to GCC Program, 223bgravity models
Internet penetration and, 7–8results of, 5, 58–72tof service export determinants, 27–29, 33–34,
36–40, 42–43, 44–45t, 52–75, 53–74tGrowth through Globalization Program, 222Grünfeld, Leo A., 33, 37, 38, 41GSLI. See Global Services Location IndexGuatemala, Chilean exports to, 327bGulf Cooperation Council (GCC), 174, 223bGupta, Poonam
on growth factors, 92on Indian service exports, 81, 89on outsourcing, 115–16n11on service export determinants, 25and “service revolution,” 117n22on service shares, 85, 115n6
Index 367

HHamilton Harrison & Mathews, 259Hausman-Taylor estimations
bilateral service exports and, 47gravity model and, 36, 37human capital and, 31infrastructure and, 34–35other commercial services (OCSs) and, 39telecommunications and, 46
HC Securities & Investment, 211Head, Keith, 38, 39, 40, 43, 47–48Health Insurance Portability and Accountability
Act of 1996 (HIPAA), 156n22health sectors. See also medical tourism
Egyptian service exports and, 213–17, 216f, 230
government support for, 301private providers in, 179, 180quality assurance in, 183
Helmy, Omneia, 226Helpman, Elhanan, 98–99, 101Heng, Loke Wai, 161Heritage Foundation, 331High-Technology Investment Promotion
Program, 342–43HIPAA (Health Insurance and Portability and
Accountability Act of 1996), 156n22Hoekman, Bernard, 200Hong Kong SAR, China
education in, 186, 188Filipino workers in, 129binfrastructure and, 335
hotel room capacities, 151, 228HSBC, 132human capital. See education and human capitalHuman Development Report 2009 (UNDP), 186Human Resource Development in IT program
(India), 111Hungarian Investment and Trade Development
Agency, 348Hungary
information and communication technology(ICT) in, 218
service exports and, 316, 347–48
IIBM, 132, 221b, 280–81, 285ICA. See Investment Climate AssessmentICT. See information and communication
technologyICT Development Index, 335IDA (Industrial Development Agency), 52IDC, 322, 324, 339bIFRS (International Financial Reporting
Standards), 256IMF. See International Monetary FundINAPI (National Institute for Industrial
Property, Chile), 336
incentive schemes, 84income tax holidays (ITHs), 131, 141, 146Index of Economic Freedom, 331India, xv, 5, 81–119
associability in, 337brand equity and, 260Brazil compared with, 273, 279, 280f, 303business environment in, 19business process outsourcing (BPO) in, 12,
132, 133, 154, 187, 238contact centers in, 136domestic markets and, 246earnings in, 285, 334–35economy of, 277elections in, 258belectronic infrastructure in, 46English language proficiency in, 194,
219, 285fiscal incentives in, 17, 141geographic determinants and, 38, 40higher education institutions in, 51, 168, 188investment holding companies in, 168labor costs in, 194, 219, 221preferential market access and, 340as remittance recipient, 127bservice export promotion in, 347service exports, characteristics of, 83,
95–103, 95fcross-border, 95–97destination markets, 98, 98t, 218, 281firm types, 98–101, 100tforeign direct investment (FDI) and, 11,
101–3, 102f, 103t, 104f, 182, 291information technology and IT-enabled
service, 82, 96, 97–98, 108, 218institutions, role of, 52, 107–8, 114revealed comparative advantage (RCA)
and, 96–97, 96fsoftware services, 28–30, 42, 75–76n7,
97–98, 97f, 98t, 99, 100t, 101, 101t,114, 116n14, 269
service exports, success factors for, 84, 103–14diaspora, role of, 40–41, 84, 108, 113–14, 177education and human capital, 7, 18, 82, 93,
94f, 111, 114export processing zones (EPZs), 109–10,
117n27foreign investment policy, 110–11import policy, 84, 108–9industry associations, 17, 19, 82, 112intellectual property, 84, 111–12other commercial services (OCSs), 83–84,
95–96, 103–7, 105t, 106f, 321software technology parks (STPs), 8, 14–15,
51, 84, 109–10, 111f, 114service growth, international perspective on,
1, 83, 84–95, 316concentration of, 89–90, 90f
368 Index

factors explaining, 91–95, 91t, 93t,94f, 270
sectoral shares and growth rates, 25, 84–89, 85–88f
tax policy in, 281, 286time zone advantages and, 219
India-Europe Software Alliance, 112India-Japan Software Alliance, 112Indian Institute of Engineering, 114Indian Institutes of Technology, 111, 113Indonesia
air transport in, 148, 168, 177contact centers in, 136English language proficiency in, 178e-readiness score for, 190foreign labor from, 175healthcare facilities in, 168higher education institutions in, 168infrastructure in, 131–32as outsourcing destination, 218tourism and, 145, 146, 149, 172, 174
The Indus Entrepreneurs (TiE), 113industrial clusters, 347Industrial Development Agency (IDA), 52Industrial Master Plans (Malaysia), 162industry and manufacturing. See also industry
associationsdefined, 115n2foreign direct investment (FDI) and,
102, 181growth factors for, 92, 115–16n11sectoral shares of, 84–86, 85–86f, 88f, 89, 94,
115n3service export significance and, 164transport services and, 165–66, 166f
industry associations, 17, 19, 82, 112, 302–3. Seealso specific associations
“infant industry” arguments, 347inflation rates, 175, 203information and communication technology
(ICT)Chilean service exports and, 12, 15customization and, 250Egyptian service exports and, 8, 15, 194,
217–26, 219t, 220–21b, 225t, 230–31export share of, 165geographic determinants and, 38government support for, 177, 292, 301growth of, 273, 282, 304infrastructure for, 335internationalization of, 270, 303Kenyan service exports and, 237, 239–40,
246, 248labor force skills and, 187, 260, 273, 284–85marketing and, 254penetration rates, 352success of, 279–81training in, 266
information technology (IT). See also IT-enabledservice
development of, 273Indian diaspora and, 113–14Indian service exports and, 82, 96, 97–98,
108, 218institutions and, 33language determinants and, 40offshoring of, 242, 243f
Information Technology Agreement, 82, 333Information Technology Industry Development
Authority (ITIDA), 7, 15, 194, 222, 223b,224, 225
infrastructure. See also electronic infrastructure
endowment of, 349private sector involvement in, 312service exports and, 335–36
Innova, 343Innovation Capacity Index, 334Institute for Management Development World
Competitiveness Yearbook, 331institutional framework
Egypt service exports and, 204–5, 204tIndian service exports and, 52, 107–8, 114quality of, 353as service export determinant, 5, 29, 31–34,
51, 52Intel, 12intellectual property, 84, 111–12, 336Inter-American Development Bank, 300International Accreditation Federation
Council, 183International Centre for Settlement of
Investment Disputes, 155n12International Financial Reporting Standards
(IFRS), 256International Monetary Fund (IMF), 96, 202,
232n6International Network for Quality Assurance
Agencies in Higher Education, 182International Organization for Standardization
(ISO), 339bInternational Society for Quality in Health
(ISQua), 183international students, 168, 170–71, 171t,
179, 183International Trade Centre, 240Internet. See also Internet penetration
banking services and, 282broadband and, 188, 335business, professional, and technical (BPT)
services and, 295costs of, 152electronic infrastructure and, 116n21high-speed connections, 260service export transactions and, 28usage increases for, 111
Index 369

Internet penetrationbilateral service exports and, 27effect of, 104, 106, 352–53electronic infrastructure and, 34, 35, 104gravity model and, 7–8increase in, 82service export determinants and, 43, 46, 48telecommunications network and, 43, 188,
350, 354, 356intranets, 250Investment Climate Assessment (ICA), 131,
132, 140Investment Priorities Plan (IPP), 131, 141, 145, 152Iran, international students from, 169, 170Ireland
Indian software and, 112service exports from, 33, 52, 347trade contracts with, 17
Isenberg, Daniel, 257bIskandar Development Region, 179Islamic Banking Act (Malaysia), 178Islamic finance
export services and, 188, 189financial products and, 178foreign direct investment (FDI) and, 180–82global reach of, 167Gulf Cooperation Council and, 174Malaysia as hub of, 179regulatory framework for, 183–85Singapore competition in, 188
ISO (International Organization for Standardization), 339b
ISQua (International Society for Quality inHealth), 183
IsraelIndian software and, 112trade contracts with, 17
Italyforeign direct investment (FDI) and, 328innovation rankings and, 334
IT-enabled service (ITeS). See also informationtechnology
export experience in, 262–64bIndian service exports and, 82, 96, 97–98, 108,
218institutions and, 33labor force skills and, 260marketing and, 254training in, 266
ITHs. See income tax holidaysITIDA. See Information Technology Industry
Development AuthorityIT Infrastructure Library (ITIL), 339bITWorx, 224, 233n22
JJapan
business process outsourcing (BPO) and, 12
Filipino workers in, 126Indian software cooperation with, 17, 112, 114Malaysian bilateral agreements with, 180Philippine business process outsourcing to,
133, 136tourism and, 145, 172
JCI (Joint Commission International), 183Jetstar, 188Joint Commission International (JCI), 183joint ventures, 103, 136, 177Jordan
financial services and, 208migration and, 217software exports and, 218
JPMorgan Chase, 133
KKashangaki, John, 237Kaufmann, Daniel, 353KenCall, 237, 242, 257bKenya, xv, 5, 237–67
clients and destinations for, 248–50, 249f, 250tcustomization and exported services, 250–51,
252–53tdelivery modes, 246–48exporting process, 251–55, 255b, 266–67n5incentives in, 16industry associations in, 17, 19information and communication technology
(ICT), 237, 239–40, 246, 248offshoring in, 241–42, 243–44fpolicy recommendations, 242, 260–66, 261t
export opportunities, knowledge about,259, 261–64
regulatory and branding issues, 265–66skilled labor and, 3, 7, 260, 266
revealed comparative advantage (RCA), 240,240t, 266n1
service exports, challenges in, 18, 242, 259–60service exports, characteristics of, 242–46, 247fservice exports, overview of, 26, 237–42, 239f,
240t, 241f, 243–45fsuccess stories, 256–59, 257–58b
Kenya Airlines, 258bKenya Chamber of Commerce, 259Kenya Economic Update (World Bank), 237Kenya ICT Board, 265Kenya Tourist Board, 265Kimura, Fukunari, 33–34, 37, 38, 39–40, 43knowledge process outsourcing (KPO), 242Korea, Republic of
business climate in, 176education in, 186foreign direct investment (FDI) and, 102infrastructure and, 335international students and, 171Islamic finance in, 188labor force skills in, 185
370 Index

other commercial services (OCSs) and, 321service exports and, 316, 347tourism and, 145, 146
Kortum, Samuel, 99Kox, Henk, 36, 38, 43, 47KPJ Healthcare, 168KPO (knowledge process outsourcing), 242, 243fKraay, Aart, 353Kramarz, Francis, 99Kumar, Utsav, 92Kumpulan Guthrie Berhad, 167Kuwait, financial services in, 208
Llabor, skilled. See skilled laborLabor Code (Philippines), 121Labor Force Sample Survey, 214labor mobility, xv–xvi, 4, 11–14Lall, Sanjaya, 42LAN Airlines, 310language skills. See English language proficiency;
soft skillsLatinobarómetro, 337Law 73/1971 on public sector employees
(Egypt), 215Law 88/2003 on banking sector reform (Egypt),
195, 211Law 111/1983 on emigration (Egypt), 215Law of Technological Innovation of 2005
(Brazil), 15, 293Lebanon
financial services and, 208software services and, 231
Lee, Hyun-Hoon, 33–34, 37, 38, 39–40, 43Lee, Jong-Wha, 107legal framework, 43, 47–48, 52. See also
regulatory frameworklegal services, 260, 295–96legal transcription. See transcription servicesLejour, Arjan, 36, 38, 39, 43, 47Lemme, Marta, 283Lennon, Carolina
on bilateral trade in goods, 31on commercial services, 39on distance, effects of, 38on institutions, 33on Internet penetration, 35, 46on language, 40, 43on O-ring theory, 76n9on school enrollment, 47
Libyaeducation and health services exports to,
213, 214, 215financial services in, 209migration and, 217
Limkokwing University, 168Lin, Justin Yifu, xvilinkage analyses, 162–64, 190n1
literacy rates, 93location readiness index, 267n6logistics costs, 156n26Loke, Wai Heng, 166London Stock Exchange, 208Low-Cost Carrier Terminal, 178low-income countries. See developing countriesLula da Silva, Luiz Inácio, 307n4Lundstrom, Susanna, 193
MMaadi Park, 224Macao SAR, infrastructure in, 335“macroeconomic jumping,” 296Maersk Line, 166Malawi, advertising in, 265Malaysia, xv, 10, 161–92
business process outsourcing (BPO) in, 263bcomparative advantage for, 164, 164tecotourism in, 176foreign direct investment (FDI) and, 12, 102,
167–68, 169–70t, 180–82government support, 177–78, 189institutions in, 77n30international students and, 168, 170–71,
171t, 179Internet penetration in, 8liberalization in, 12, 161, 179–80, 189medical tourism and, 172, 172t, 178–79, 188multiplier effect and, 162, 163tnatural endowment and cultural factors,
176–77, 189as outsourcing destination, 218, 281quality assurance, 182–83, 189regulatory framework for, 11, 183–85, 184t, 189service exports, constraint factors for, 162,
185–88, 189–90broadband, 188competition from other countries,
187–88, 190skills shortages, 7, 18, 131, 185–87, 187t,
190tertiary education and, 186, 186t, 188trade restrictions and, 185, 190
service exports, destination of, 168–74service exports, success factors for, 162,
174–85, 189business climate, 175–76, 175–76tdomestic competition, 179economic performance, 175special factors, 177–85strategic positioning, 178–79
service sector in, 162–74balance of payments data and, 165, 166–67composition of, 165–66, 166fsignificance of, 164
tourism in, 149, 151, 167, 172, 173–74tworld economy and, 316
Index 371

Malaysian Airlines, 177Malaysian Medical Association, 183Malaysian Qualifications Agency (MQA),
182, 185Malaysian Qualifications Framework, 182Malaysian Society for Quality in Health
(MSQH), 183Malaysian Sukuk Ijarah, 167management skills, 37, 42Manova, Kalina, 99, 116n18manufacturing. See industry and manufacturingMarconini, Mário, 269marine protected areas, 176maritime transport, 166, 200marketing efforts, 150–52, 151f, 154, 254, 262b,
265. See also branding techniquesMassoud, Nada, 226Mastruzzi, Massimo, 353Mattoo, Aaditya
on barriers to trade in services, 185on comparative advantage, 200on data availability, 5on Indian service exports, 81, 116n12on institutions, 204on service exports, 1, 25on skilled labor, 30–31, 93
Maurer, Andreas, 5Mauritius, investment holding companies in, 168Mayer, Thierry, 38, 39, 40, 43, 47–48MCI, 222MCIT. See Ministry of Communications and
Information Technology (Egypt)McKinsey Global Institute, 141, 238medical tourism
competition in, 188Malaysian service exports and, 172, 172t,
178–79, 188Philippine service exports and, 172
medical transcription. See transcription servicesMedium-Term Philippine Development Plan
2004–2010 (MTPDP), 148, 150Melitz, Marc J., 98–99, 101men, migration of, 127bMercer Consulting Group, 334“merchanting” activities, 322, 357n9Mercosur, 14, 23n9, 270, 274, 293Messenger, Jon, 138MetroBank, 129bMexico
certification programs in, 339bChilean exports to, 327bChina compared with, 280fcompensation costs in, 286foreign direct investment (FDI) and, 291, 328Indian software and, 112Internet rates and, 335as remittance recipient, 127bsalaries in, 335
service exports from, 26, 324tax benefits in, 286trade contracts with, 17
Microsoft, 218, 220b, 221b, 257bmigrant workers
education and health services and, 213–14,217, 230
labor force skills and, 187service exports and, 18unemployment rates and, 215
mining industries, 356n1, 357n10Ministerial Decree 548/2005 on residential units
(Egypt), 229Ministry of Communications and Information
Technology (MCIT, Egypt), 194, 220b,222, 224–25
Mira, P. Ricardo, 153Mirza, Daniel, 31, 35, 36, 38, 47, 76nn9–10Mishra, Saurabh, 193M-Kesha, 258bmobile service providers, 257–58b. See also
telecommunicationsmonopolies, natural, 32Monopolistic and Restrictive Trade Practices Act
(India), 110, 117n30Moody’s Investor Service, 331Moreno-Dodson, Blanca, 154Morocco
economic performance in, 205education and health services and, 215financial services in, 208Indian software and, 112service exports from, 1, 26trade contracts with, 17
Moxnes, Andreas, 33, 37, 38, 41Mozambique, Kenyan exports to, 266–67n5M-Pesa, 258bMQA (Malaysian Qualifications Agency),
182, 185MSC. See Multimedia Super CorridorMSQH (Malaysian Society for Quality in
Health), 183MTPDP (Medium-Term Philippine
Development Plan 2004–2010), 148, 150
mudaraba contracts, 174Muder, Nanno, 296, 307n1Multimedia Super Corridor (MSC), 77n30, 165,
177, 187, 189mutual recognition agreements for professional
qualifications, 265Myanmar, foreign labor from, 175
NNAIA (Ninoy Aquino International Airport),
148–49, 155n13NASSCOM Assessment of Competence (NAC),
17, 112
372 Index

National Association of Software and ServicesCompanies (NASSCOM)
bilateral service export and, 40offshoring services and, 52public opinion of, 8role of, 17, 84software services and, 97, 99, 112, 114
National Association of Software and ServicesCompanies of India, 133
National Council for Innovation for Competi-tiveness (CNIC, Chile), 334, 348, 357n22
National Council for Scientific and Technologi-cal Development (Brazil), 284
National Customs Service (Chile), 322, 341,358n32
National Data Protection Commission(Philippines), 153
National Institute for Industrial Property(INAPI, Chile), 336
National Registry of Individuals with AdvancedEnglish-Language Skills (Chile), 344
National Reintegration Center for OverseasFilipino Workers, 126
National Skills Registry (NSR), 112, 117n31National Statistical Institute (Chile), 322National Telecommunications Commission
(Philippines), 140National Tourism Service (Sernatur, Chile), 341National Tourism Sustainable Development Plan
(Egypt), 229near-hires, 7, 156n21“near-shoring,” 136NEM (New Economic Model), 162, 185Nepal, foreign labor from, 175Nestlé Waters, 220bNetherlands
double taxation agreements with, 340foreign direct investment (FDI) and, 289, 328
NetOne, 220bNetworked Readiness Index 2008–2009, 333Neuf Cegetel, 220bNew Economic Model (NEM), 162, 185New Economic Policy, 180New Zealand
contact center service to, 218double taxation agreements with, 340Malaysian bilateral agreements with, 180
Nexia, 266n5Next Wave Cities scorecard, 144Nicoletti, Giuseppe, 31, 35, 36, 38, 47, 76nn9–10NIESA (NASSCOM’s India-Europe Software
Alliance), 17Nigeria, service exports from, 1Nile University, 224–25NINJSA (NASSCOM’s India-Japan Software
Alliance), 17Ninoy Aquino International Airport (NAIA),
148–49, 155n13
Nok Air, 188Norway
double taxation agreements with, 340geographic distance determinants and, 39
NSDL Database Management Limited, 117n31NSR. See National Skills Registrynursing as service export, 194, 213, 230Nyahoho, Emmanuel, 52
OObama, Barack, business process outsourcing
(BPO) and, 155n7OBS (Orange Business Services), 218, 220–21bObservatory on Borderless Higher Education
(OBHE), 170OCSs. See other commercial servicesOECD. See Organisation for Economic
Co-operation and DevelopmentOffice of the United States Trade Representative,
336offshoring. See also business process outsourcing
exports, 324, 325–26fpotential for, 241–42, 243–44fpromotion policies for, 342, 343
OFWs. See overseas Filipino workersoligopolies, 32OLS methodology. See ordinary least squaresOman
financial services in, 208software companies in, 219
One-Two-Go (airline), 188Oracle, 218, 358n38Oracle Global Product Support Center, 220b, 221bOrange Business Services (OBS), 218, 220–21bordinary least squares (OLS) methodology
commercial service exports and, 47gravity model and, 52product market regulations (PMRs) and, 36regression results for, 43, 44–45tservice export determinants and, 48service trade and, 31, 37, 39, 41
Organisation for Economic Co-operation andDevelopment (OECD)
bilateral service trade data from, 29, 42, 47,76nn20–21
on corruption, 33double taxation agreements and, 340on foreign direct investment (FDI), 41on industrial clusters, 347product markets and, 36, 332on professional services entry barriers, 357n18regulatory barriers and, 37service growth and, 89on service trade determinants, 75n3on student assessment, 283tax rankings and, 279telecommunication index of, 35on tertiary education, 31, 168
Index 373

O-ring theory, 31, 35, 76nn8–9other commercial services (OCSs)
Chilean service exports and, 318–19, 320b,321–27, 323t, 354, 356
defined, 8, 9–10b, 10demand for, 353growth in, 95–96, 347Indian service exports and, 83–84, 95–96,
103–7, 105t, 106f, 321outsourcing. See business process outsourcing;
knowledge process outsourcing;offshoring
Outsourcing to Africa (Commonwealth Business Council & Cyber Media India), 218
overseas Filipino workers (OFWs), 121, 127b,128t
Overseas Workers Welfare Administration, 126
PPakistan
e-readiness score for, 190investment holding companies in, 168Malaysian bilateral agreements with, 180
Panamainfrastructure in, 335Internet rates and, 335
Pão de Açúcar, 324Patnaik, Ila, 99PDP (Policy for Productive Development), 301Peru
Chilean exports to, 327binvestment in, 328service exports from, 324
Petroliam Nasional Berhad (PETRONAS), 181PEZA. See Philippine Economic Zone AuthorityPhilippine Airlines, 149Philippine Chamber of Commerce and Industry
for Tourism, 152Philippine Economic Zone Authority (PEZA),
122, 131, 141, 152Philippine Franchise Association (PFA), 126Philippine International Air Terminals Co.
(PIATCO), 155n12Philippines, xv, 5, 11, 121–59
Brazil compared with, 273, 303business environment in, 19business process outsourcing (BPO) in, 11–12,
121, 122–23, 132–44, 152–54characteristics of, 132–37, 134–37t, 155n6factors contributing to, 137–44, 138tgovernment supports, 17–18, 141–44,
142–43tgrowth in, 123, 124fincentives for, 187labor costs, 138, 139f, 152private sector, 122, 144real estate costs, 140–41
challenges ahead, 152–54contract enforcement in, 83education and human capital in, 7, 18,
186, 263bindustry associations in, 17, 19IT-enabled service in, 33labor costs in, 194, 219labor movement in, 121, 127–30b, 129f, 340medical tourism and, 172overseas Filipino workers (OFWs), 121,
127b, 128tremittances and, 13service exports in economic context, 123–32,
270, 316broad picture of, 126–32snapshot of, 123–26, 124f
software technology parks (STPs) in, 8tourism sector in, 16, 121, 122, 123, 144–52,
145f, 146t, 154competitiveness in, 174export constraints, 146–47, 147fgovernment supports and, 149–50industry-specific conditions and, 151–52marketing and product development and,
150–52, 151f, 154safety and security and, 150, 154transport infrastructure, 122, 147–49, 154
Philippines Overseas Employment Administra-tion, 126
Philippine Tourism Authority, 145–46Philippine Travel Agencies Association, 151PIATCO (Philippine International Air Terminals
Co.), 155n12Piermartini, Roberta, 149Pioneers Holding Co., 208, 211PISA. See Programme for International Student
AssessmentPlatform Law (Chile), 341–42PMRs (product market regulations), 36points of scale resistance, 346Poisson pseudo maximum likelihood (PPML), 39Poland
information and communication technology(ICT) and, 218
innovation rankings and, 334Policy for Productive Development (PDP), 301Portugal, innovation rankings and, 334power outages, 132PPML (Poisson pseudo maximum likelihood), 39Pradhan, Jaya Prakash, 102preferential trade agreements (PTAs), 19, 37,
333, 338–40, 345, 349Presidential Decree 2000/1997 on migration
(Egypt), 215, 217Prieto, Francisco J., 309Prime Group, 211Priority Watch List, 336Privacy Principles (APEC), 153
374 Index

private sectorsassociations in, 302–3business process outsourcing (BPO) and, 263beconomic reform and, 311infrastructure and, 312quality standards and, 32tourism and, 152, 154
privatizationeconomic reform and, 311foreign direct investment (FDI) and, 289, 290
ProChile (Export Promotion Agency)associability and, 337delimited regional plans and, 358n30on export categories, 322promotion policies and, 16, 340–41, 344–45, 348on retail business, 327bsoftware industry and, 346
Production Development Corporation(Corporación de Fomento de laProducción de Chile), 15, 77n30
product market regulations (PMRs), 36Programme for International Student
Assessment (PISA), 283, 333–34, 357n21Projeto Brasil MIXITUP, 301Prosoft Company, 291, 304PTAs. See preferential trade agreementspublic-private partnerships, 122, 148
QQantas, 188Qatar
Filipino workers in, 129bfinancial services in, 208, 211higher education institutions in, 188migration and, 217
quality control, 32, 153, 182–83, 189, 220bQuarterly Survey of International Investment
and Services (QSIIS), 181, 190n4
RRaya Contact Center, 220bRBI. See Reserve Bank of IndiaRCA. See revealed comparative advantagereal estate costs, 140–41regional trade agreements (RTAs), 37, 43regulatory framework
barriers to trade in services and, 2–3Kenyan service exports and, 265–66Malaysian service exports and, 11, 183–85,
184t, 189service export determinants and, 35–37
remittances, 13, 127–29b, 127f, 152Reserve Bank of India (RBI), 97, 98, 99, 101,
116n14, 116n17retail exports, 324, 327b, 344revealed comparative advantage (RCA). See also
comparative advantage theoryin disaggregate services, 96–97, 96f
education and health services and, 214formula for, 155n2index of, 123, 125tfor Indian service exports, 96–97, 96ffor Kenyan service exports, 240,
240t, 266n1liberalization and, 198, 199t, 200Malaysian service exports and, 164, 164t
Reyes, Myla Rose M., 156n25Ries, John, 38, 39, 40, 43, 47–48Ritchie, J. R. Brent, 156n20Roadmap 2010 (BPAP), 144Roadmap 2016 (BPAP), 144Rodrik, Dani, 117n22Romania, contract enforcement in, 83room capacities for hotels, 151, 228Rose, Andrew K., 47Rousová, Linda, 149RTAs (regional trade agreements), 37, 43rule of law, 47, 349, 353, 356Russian Federation
economy of, 277foreign direct investment (FDI) and, 102other commercial services (OCSs) and, 321service exports from, 1
Rwandaengineering firms in, 246Kenyan export clients in, 248, 254services growth in, 238
SSáez, Sebastián, 1, 25, 309Safaricom, 237, 242, 258bSakhr (ICT firm), 224, 233n21Sakr, Hala, 226Sakr, Mohamed, 226San Jose Business Incubator, 77n30Santiago Chamber of Commerce, 345São Paulo Federation of Commerce, 302SARS (severe acute respiratory syndrome), 150Saudi Arabia
Filipino workers in, 129bfinancial services in, 208, 211healthcare facilities in, 168software demand in, 194, 219
Schwab, Klaus, 333SDP. See state domestic productSECC (Software Engineering Competence
Center), 223bSecurities Commission, 178seemingly unrelated regression (SUR)
techniques, 36, 76n10Sennes, Ricardo, 296, 307n1September 11 terrorism attacks, 202Sernatur (National Tourism Service), 341service export determinants, 4, 25–79
adjacency factors, 39contiguity factors, 39
Index 375

service export determinants (continued)definitions, variables, and data sources on,
52–75for developing countries, 27–28, 48–51,
49–50tdistance, 5, 28, 38–39, 43, 48, 77n25education and, 5, 29–31, 30f, 43, 46–47, 48,
51, 77n27electronic infrastructure and, 5, 29, 34–35, 43,
46, 51, 75n6, 75t, 76–77n23foreign direct investment (FDI) and, 37, 41,
43, 47, 48geography and, 37–40gravity model of, 27–29, 33–34, 36–40, 42–43,
44–45t, 52–75, 53–74tillustration of, 42–48income groups and, 25, 26finstitutions and, 5, 29, 31–34, 51, 52language, colonial history, and culture and, 37,
40–41, 43, 48literature survey of, 18, 28–42management or entrepreneurial skills and,
37, 42policy and regulations and, 35–37policy conclusions, 28, 51–52remoteness and, 40
service exports, developing-country perspectiveon, 1–24
barriers in, 2–3, 20–21tdata inadequacies and, 5, 22tdeterminants for, 4–18. See also service export
determinantsfundamentals, role of, xv, 4, 5–18investment, labor mobility, and trade
policies and, xv–xvi, 4, 11–14proactive policies in services and, xvi,
4, 14–18supply modes and, 2
“service revolution,” 1, 117n22Services Dialogue, 302Service Trade Department (Chile), 340–41,
358n30Shah, Ajay, 99Shand, Ric, 117n22Shariah, 174, 178, 184Shariah Advisory Council, 178Shastry, Gauri Kartini, 99, 116n18Shingal, Anirudh, 31, 34, 37, 38, 46, 47Sieh Lee, Mei Ling, 166Silicon Valley, Indian diaspora in, 113, 114Silicon Valley Indian Professionals Association
(SIPA), 113Singapore
air travel and, 177–78, 188bilateral air service agreements and, 149education in, 186, 188electricity costs in, 132Filipino workers in, 127b
Indian software and, 112infrastructure and, 335international students and, 171Internet rates in, 335Islamic finance in, 188labor force skills in, 185Malaysians working in, 168Malaysia’s strategic positioning and, 178–79other commercial services (OCSs) and, 321tourism and, 172, 174trade contracts with, 17
SIPA (Silicon Valley Indian ProfessionalsAssociation), 113
skilled labor, 3, 7, 260, 266skills development and availability. See
education and human capitalsmall and medium-size enterprises (SMEs)
associability and, 337government support for, 291, 301, 304labor productivity of, 136medical transcription firms as, 137
Smart Village, 51, 194, 221b, 222, 223b, 224Smarzynska, Beata K., 136SMEs. See small and medium-size enterprisessoft skills
competitive advantage and, 256as fundamental skills, 336–37investment decisions and, 263–64bas service export determinant, 37, 40–41, 43, 48
Software Engineering Competence Center(SECC), 223b
software services. See also software technologyparks
Egyptian service exports and, 8, 15, 194, 217–26, 219t, 220–21b, 225t, 230–31
foreign direct investment (FDI) and, 270government support for, 291–92, 304human capital and, 106import policy and, 108–9India service exports and, 28–30, 42, 75–76n7,
97–98, 97f, 98t, 99, 100t, 101, 101t, 114,116n14, 269
labor cost and, 286policies for, 293
software technology parks (STPs)electronic infrastructure and, 51establishment of, 8, 16, 46, 84, 114export growth from, 111fexport processing zones (EPZs) and, 109–10Indian service exports and, 8, 14–15, 51, 84,
109–10, 111f, 114Philippine service exports and, 8proactive policies and, 14–15
Software Technology Parks of India (STPI), 110Somali pirates, 200South Africa
advertising in, 265brand equity and, 260
376 Index

business process outsourcing (BPO) in, 261,262–64b
business services in, 238cultural skills and, 256information and communication technology
(ICT) and, 218Kenyan export clients in, 248service exports from, 26service growth in, 238–39technology institutes in, 51
Southern Sudan, engineering firms in, 246South Korea. See Korea, Republic ofSouth-South Migration and Remittances data
sets, 232n13south-south service trade, 26–27Spain
Brazilian investments in, 287Chilean exports to, 324double taxation agreements with, 340foreign direct investment (FDI) and, 289multinational corporations and, 338
Special 301 Report (Office of U.S. Trade Representative), 336
Standard & Poor’s, 331state domestic product (SDP), 92, 93t, 94STPI. See Software Technology Parks of IndiaSTPs. See software technology parksStrategic Public-Private Council of Offshoring
Clusters, 343strengths, weaknesses, opportunities, and threats
(SWOT) analysis, 229, 230tStrychacz, Nicholas, 237students. See international studentsSubramanian, Arvind, 117n22Sudan
Kenyan exports to, 248, 251migration and, 217
Sudan, Randeep, 51, 267n6Suez Canal, 193, 196, 200Sukuk issuances, 167SUR (seemingly unrelated regression)
techniques, 36, 76n10Survey of Tourism Establishments, 151Sweden, Internet rates and, 335Swinscoe, Adrian, 226Switzerland
double taxation agreements with, 340foreign direct investment (FDI) and, 328
SWOT (strengths, weaknesses, opportunities,and threats) analysis, 229, 230t
Syrian Arab Republic, EFG Hermes (bank) in, 208
TTaiwan, China
Filipino workers in, 129binfrastructure and, 335labor force skills in, 186
takaful operators, 181Tanzania, Kenyan export clients in, 248, 251tariffs, 82, 108–9taxation and tax policies
benefits, 286business process outsourcing (BPO) and, 263bdouble taxation agreements, 293, 340, 342economic reform and, 203incentives, 281income taxes, 285–86, 333income tax holidays (ITHs), 131, 141, 146information technology (IT) and, 293market development and, 264rankings on, 279service exports and, 231value added tax exceptions, 341, 358n32
Technical Education and Skills DevelopmentAgency (TESDA), 7, 156n21
Technology Incubation Program, 223bTelecom Egypt, 220b, 224telecommunications
challenges for, 152costs of, 140electronic infrastructure and, 34–35Internet penetration and, 43, 188, 350,
354, 356liberalization in, 12, 311networks for, 83, 356private providers for, 180
Telecommunications Regulatory Authority, 8Telekom Malaysia Berhad, 168, 169tTeleperfomance, 262bTele2, 220bTenaga Nasional Berhad, 16810 crore rule, 109TESDA (Technical Education and Skills
Development Agency), 156n21Test of English as a Foreign Language
(TOEFL), 285Test of English for International Communica-
tion, 344Texas Instruments, 110TEZs. See tourism enterprise zonesTFP (total factor productivity), 331–32Thailand
air transport in, 148, 168, 177, 188available seat kilometers and, 149business climate in, 176English language proficiency in, 178higher education institutions in, 188labor skills in, 186as outsourcing destination, 218, 281preferential market access and, 340tourism and, 6, 144, 146, 151, 172, 174
Tham, Siew Yean, 180Tharakan, P. K. M., 38, 40–41, 43Tholons, 346TiE (The Indus Entrepreneurs), 113
Index 377

TIEZA (Tourism Infrastructure and EnterpriseZone Authority), 145–46
Tiger Airways, 150, 188time-zone differences, 39, 219, 281, 304TOEFL (Test of English as a Foreign
Language), 285Tohamy, Sahar, 226TOKTEN. See Transfer of Knowledge through
Expatriate Nationalstotal factor productivity (TFP), 331–32Tourism Act of 2009 (Philippines), 145–46,
151, 152tourism and travel services. See also medical
tourism; transport servicescomparative advantage in, 164defined, 9becotourism, 176Egyptian service exports and, 193, 195,
226–31, 227–28t, 227fexport share of, 165growth in, 95–96Malaysian service exports and, 149, 151, 167,
172, 173–74tnatural resources and, 176Philippine service exports and, 16, 121, 122,
123, 144–52, 145f, 146t, 154promotion of, 341
Tourism Congress, 152tourism enterprise zones (TEZs), 131, 146, 155n11Tourism Infrastructure and Enterprise Zone
Authority (TIEZA), 145–46Tourism Promotion Board, 151Trade and Industry Department (Philippines), 138“Training in International Business: Services
Exports” course (Banco do Brasil), 273transcription services, 136–37, 140, 153–54Transfer of Knowledge through Expatriate
Nationals (TOKTEN), 113transport services. See also airports and air
travel; tourism and travel servicesChilean service exports and, 319, 319tdefined, 9bexport share of, 165–66, 166f, 277, 319, 319tgovernment support for, 177–78, 298–300growth in, 89, 95–96, 303–4infrastructure and, 298–300liberalization of, 271–72Philippine service exports and, 122, 147–49, 154promotion of, 344
Travel and Tourism Competitiveness Index(TTCI), 145, 147f, 148, 150, 154, 174, 174t
Travel and Tourism Competitiveness Report 2009(World Economic Forum), 226, 228
travel services. See tourism and travel servicesTrends in International Mathematics and
Science Study (2007), 186trust rankings, 337
Tunisiaeconomic performance and, 205engineers from, 6–7, 23n7information and communication technology
(ICT) and, 218service exports from, 26tourism and, 228
Turismo Chile, 341Turkey
economic performance in, 205geographic distance determinants and, 39tourism and, 228
turnover, export, 246, 247fTV Globo, 270Txteagle, 257b
UUBS, 3Uganda
engineering firms in, 246Kenyan export clients in, 248
“Unclogging the Arteries: The Impact ofTransport Costs on Latin American andCaribbean Trade” (Inter-AmericanDevelopment Bank), 300
unemployment rates, 175, 201, 201t, 214–15, 216fUnited Arab Emirates
economic performance and, 205Filipino workers in, 127b, 129bfinancial services in, 208, 211higher education institutions in, 188infrastructure and, 335software demand in, 194, 218–19, 231
United KingdomBrazilian exports to, 274, 300contact center service to, 218double taxation agreements with, 340Indian services export to, 83Kenyan exports to, 248, 251, 266–67n5Limkokwing University in, 168programmers in, 258
United Nations Conference on Trade andDevelopment (UNCTAD), 26, 161, 238
United Nations Economic Commission for LatinAmerica and the Caribbean, 327b
United Nations Human Development Program, 113
United Nations Statistical Division (UNSTATS),28, 42, 46, 75n3, 76nn20–21
United StatesBrazilian exports to, 14, 116n12, 274Brazilian investments in, 287business process outsourcing (BPO) and,
12, 133Chilean exports to, 324, 328Chinese exports to, 116n12customer care services to, 101double taxation agreements with, 293, 340
378 Index

Filipinos in, 13, 127b, 129b, 139–40, 152financial services in, 211foreign direct investment (FDI) and,
289, 328franchising in, 126free trade agreements with, 343geographic determinants and, 38, 39Indian diaspora in, 113, 114Indian services export to, 81, 83, 98, 99, 101,
116n12Internet in, 34, 335Kenyan exports to, 248Malaysian researchers in, 168medical tourism and, 6medical transcription and, 153Oracle Global Support Center in, 221bsalaries in, 334satellite launch exports from, 3time zones in, 281, 304tourism and, 145transport infrastructure and, 299, 299f
University of Nottingham, 178UNSTATS. See United Nations Statistical
DivisionUruguay
educational rankings and, 334infrastructure in, 335innovation rankings and, 334Internet rates and, 335service exports and, 25, 347trust rankings for, 337
Ushahidi (Kenyan firm), 257–58b
VValls Pereira, Lia, 296, 307n1value added tax exceptions, 341, 358n32Van Beveren, Ilke, 38, 40–41, 43Van Ourti, Tom, 38, 40–41, 43Van Wincoop, Eric, 40Venezuela, República Bolivariana de
Chilean exports to, 327bInternet rates and, 335
Vietname-readiness score for, 190foreign direct investment (FDI) and, 182foreign labor from, 175global financial crisis of 2009 in, 144infrastructure in, 132labor costs in, 194, 221tourism in, 145, 151
visas, 185, 333, 358n42Vodafone, 218Voice over Internet Protocol (VoIP),
140, 262–63b
WWall Street Journal, economic rankings by, 331Wall Street Journal Europe, contact center
services for, 220bWalsh, Keith, 36–37, 38–39, 40, 43Washington Accord, 182“weak associability,” 337Wei, Shang-Jin, 136Weinhold, Diana, 34women
migration of, 127bunemployment rates for, 214
work permits, 213, 214t, 265World Bank
on business climate, 122, 175, 232n8, 279economic reforms and, 202on emigrants, numbers of, 232n13on infrastructure, 22n2on Kenyan economy, 237on labor skills, 131on road quality, 148on trade in services, 4on unemployment, 201World Development Indicators, 30, 114
World Congress on Information and Communication Technologies, 144
World Development Indicators, 30, 114World Economic Forum
on corruption, 131on global competitiveness, 278, 331on higher education, 201on tourism, 145, 174, 226
World Heritage sites, 145World Tourism Council, 151World Trade Organization (WTO), 82, 111, 149,
293, 333worldwide web. See InternetWTO. See World Trade Organization
XXbox technical support, 218Xceed, 218, 220bXoom.com, 129b
YYankee Group, 218, 232n16Yean, Tham Siew, 161Yeaple, Stephen R., 98–99, 101Yemen, education and health services exports to,
213–15Yi, Soonhwa, 121
ZZambia, advertising in, 265
Index 379

ECO-AUDIT
Environmental Benefits Statement
The World Bank is committed to preservingendangered forests and natural resources. TheOffice of the Publisher has chosen to printExporting Services: A Developing CountryPerpsective on recycled paper with 50 per-cent postconsumer fiber in accordance withthe recommended standards for paper usageset by the Green Press Initiative, a nonprofitprogram supporting publishers in using fiberthat is not sourced from endangered forests.For more information, visit www.greenpressinitiative.org.
Saved:• 6 trees• 2 million British thermal
units of total energy• 664 pounds of net
greenhouse gases• 2,992 gallons of waste
water• 190 pounds of solid
waste


The past two decades have seen exciting changes with developing countries emerging as dynamic exporters of services. Technological developments now make it easier to trade services across borders. But other avenues are also being exploited: tourists visit not just to sightsee but also to be treated and educated, individual service providers move abroad under innovative new schemes, and some developing countries defy traditional notions by investing abroad in services. Can this dynamism be sustained and replicated in other countries?
To answer this question, Exporting Services: A Developing Country Perspective takes an eclectic approach, combining exploratory econometric analysis with detailed case studies of representative countries: Brazil, Chile, the Arab Republic of Egypt, India, Kenya, Malaysia, and the Philippines. Several questions lead the analysis: How did these developing countries succeed in exporting services? What policy mix was successful and what strategies failed to deliver expected results? The analysis evaluates the role of three sets of factors: the fundamentals, which include a country’s factor endowments, infrastructure, and institutional quality; policies affecting trade, investment, and labor mobility in services; and proactive policies in services designed to promote exports or investment.
The case studies illustrate the complex nature of reforms and policy making in the service sector as well as the benefits of well-implemented reforms. This resource will be valuable for policy makers, experts, and academics who are engaged in efforts to reform services and investment policies in their own country.
ISBN 978-0-8213-8816-7
SKU 18816