Exploring the Service Management Standard ISO 20000
28
1 This is an Accepted Manuscript of an article published by Taylor & Francis in Total Quality Management & Business Excellence on 07 Jan 2014 available online: http://dx.doi.org/10.1080/14783363.2013.856544 Exploring the Service Management Standard ISO 20000 Santi Cots Universitat de Girona Servei Informàtic C/ Maria Aurèlia Campmany, 40 17003 Girona (Spain) [email protected] Martí Casadesús Profesor Universitat de Girona Departament d'Organització, Gestió Empresarial i Desenvolupament de Producte Av. Lluis Santaló, s/n 17003 Girona (Spain) [email protected] Abstract This paper is the first exploratory and quantitative study on a global scale of the current and future impact of ISO 20000, a standard that is forecast to play an important role in the IT service management field. For the analysis of the current situation, this article first describes the standard and other related. This is followed by a diffusion analysis using worldwide certification data. It also analyzes geographical distribution by continents and countries and examine its evolution over time through comparison with other management- system standards. Te analysis extends to relationships existing between countries, and a clear correlation is detected between different countries regarding number of certifications and certification intensity. Regarding future forecasts, a logistic curve is used to detect the theoretical saturation point, which is earlier than previously thought. Therefore, and comparing it with an updated forecast for other parallel
Transcript of Exploring the Service Management Standard ISO 20000

1
This is an Accepted Manuscript of an article published by Taylor & Francis in Total Quality Management & Business Excellence on 07 Jan 2014 available online: http://dx.doi.org/10.1080/14783363.2013.856544
Exploring the Service Management Standard ISO 20000
Santi Cots Universitat de Girona
Servei Informàtic C/ Maria Aurèlia Campmany, 40
17003 Girona (Spain) [email protected]
Martí Casadesús
Profesor Universitat de Girona
Departament d'Organització, Gestió Empresarial i Desenvolupament de Producte Av. Lluis Santaló, s/n 17003 Girona (Spain)
Abstract
This paper is the first exploratory and quantitative study on a global scale of the current and future impact
of ISO 20000, a standard that is forecast to play an important role in the IT service management field.
For the analysis of the current situation, this article first describes the standard and other related. This is
followed by a diffusion analysis using worldwide certification data. It also analyzes geographical distribution
by continents and countries and examine its evolution over time through comparison with other management-
system standards. Te analysis extends to relationships existing between countries, and a clear correlation is
detected between different countries regarding number of certifications and certification intensity.
Regarding future forecasts, a logistic curve is used to detect the theoretical saturation point, which is
earlier than previously thought. Therefore, and comparing it with an updated forecast for other parallel

2
standards (viz: ISO 9001, ISO 14001 and ISO 27001), the analysis presents a new scenario in the field of
management-system standardization.
Keywords: ISO 20000; ITIL; IT Service Management; Service Science; Management standards;
ISO 9000; ISO 27000
1. Introduction
The rise in importance of information technologies (IT) services in modern society has highlighted
the need of quality in the production of those services. Clients of organizations producing IT services
are increasingly demanding for more secure, effective and efficient services. This customer exigency
and the maturity of technology is making IT organizations to a shift their focus from technology
centered operations to a clear service paradigm (Bitner, 2001; Demirkan et al., 2008). In order to
meet this management need, the discipline known as ITSM, Information Technology Service
Management, has been developed and expanded. Within this framework, different management
standards have been designed, implemented and improved, whether they be formal or de facto
(Kumbakara, 2008; Cater-Steel, 2009; Iden and Eikebrokk, 2013).
Without doubt, one of the standards of greatest current, and possibly future, impact is the ISO 20000,
which defines an IT service management system. This article therefore analyses its current impact
and future diffusion. In order to determine its relevance and detect possible parallelisms, said
standard’s current certification level is first analyzed, comparing it with other Management
Standards (MS). Secondly, projection models, previously utilized in the study of the most common
standards and related to ISO 20000, are also used; these models permit an analysis of their evolution

3
over time and their geographical impact. This all serves to obtain a clear vision of their current
impact and, in particular, a projection of their future impact. 1
2. Literature review
In the past, the industrialization process highlighted the need to ensure the quality of goods
produced. Standardization has permitted the establishment of common practices and references both
within and between organizations and internationally. It is for this reason that standardization is
implemented in many areas, among which it is logical to find that of management, giving rise to
what is known as Management Standards (MS).
On an international scale, the main standardization body is the International Organization for
Standardization, known by its initials ISO. Founded in 1947, it currently has a portfolio of over
19,400 standards, and comprises 164 countries (ISO, 2012). Irrespective of their aims, management
standards promoted by ISO share many common characteristics, whether in their form or in the
principles that inspire them. A common characteristic of most ISO-promoted MS is that they are
auditable. Auditability, therefore, gives these standards a value in itself, since it allows organizations
to verify the implementation and use of MS. When a third-party audit is carried out, the third party
usually issues a “certificate” that recognizes and demonstrates the audited party’s monitoring of, and
1 Use of conventions
This study makes repeated reference to management standards ISO/IEC 20000, in both its 2005 and
2011 versions, as well as ISO 9001 (2008), ISO 14001 (2004) and ISO/IEC 27001 (2005). For the
purpose of simplicity, and following conventions that are widely used in publications, they are
referred to here in a generic, simplified form as ISO 20000, ISO 9001, ISO 14001 and ISO 27001,
respectively. The use of specific names or versions is reserved for those cases that require an explicit
reference or for the sake of clarity.
4
compliance with, the standard. A large part of the value of these certificates is down to the issuing
body’s prestige. Those companies specialized in auditing and certification are, therefore, generally
predisposed to guarantee and demonstrate the quality and rigour of said certifications. For this
reason, they usually submit themselves to control by other organizations that accredit them in
accordance with what are called “certification schemes”. Certified companies are normally disposed
to, and interested in, making it known that they have been certified (Wu and Chen, 2011).
There are already numerous studies in existence on the field of management standardization
(Sampaio et al., 2009a; Dahlgaard-Park, 2011; Dahlgaard-Park et al., 2013), its benefits and impact
(Rubio-Andrada et al., 2011), and the synergies produced by integrating or combining a number of
MS together (Casadesús et al., 2011; Matias and Coelho, 2011; Zeng et al., 2011; Garengo and
Biazzo, 2013; Simon et al., 2013).
Related MS
Standard ISO 9001, which defines the requirements of a quality-management system, stands out
above all other MS for its diffusion and impact. With 1,111,698 certificates issued worldwide in
2011 (ISO, 2012), it is the oldest and most widely-diffused standard and that which has been
analyzed most in publications. It is also important to mention its influence in the development of ISO
20000. The possibility of an integrated use of both standards should also be highlighted, a use
explicitly mentioned in the standard’s text, and one demonstrated by the fact that ISO develops
ISO/IEC DTR 90006: “Guidelines for the application of ISO 9001:2008 to IT service management
and its integration with ISO/IEC 20000-1:2011”.
The second most-widely diffused MS is the ISO 14001 standard for environmental management. Its
relevance to this study derives from the fact that it has also been widely written about, and that the
current number of certifications stands at 267,457 (ISO, 2012). Many of the studies analyzed that do
5
not limit themselves to ISO 9001 are based on ISO 14001, whether dealing with the comparison between,
or integrated use of, both standards.
Noteworthy in the specific IT field is the existence and diffusion of ISO 27001, focused to the
security management with a global total of 17,509 certificates in 2011 (ISO, 2012). As it is ISO that
collects and annually publishes certification data for ISO 27001 in the ISO Survey, this is a good
reference point for the study of ISO 20000. Also underly the existence of an international standard
ISO/IEC 27013:2012 entitled “Guidance on the integrated implementation of ISO/IEC 27001 and
ISO/IEC 20000-1”, which defines a guide to integrate both. It is remarcably that both, ISO 20000
and ISO 27001, are standard management system originally developed for the IT field but they can
also be used in wider fields, as seen, for example in Lezcano (2010) and Gilles (2011).
ISO 20000, a step beyond ITIL®
In the IT Service Management (ITSM) field, there is a wide range of standards, tools and
frameworks, among which one finds: ITIL®, CMMI-SVC, COBIT, ISO 20000, ISO 27001, LEAN
IT, USMBOK, PMBOK, Six Sigma, PRINCE2, ISO9000, ValIT, ISO 38500. Many of these
standards have overlapping implementation areas or are complementary.
Of all the standards in the ITSM field, the one that stands out for its importance, diffusion and
development is ITIL® (Information Technologies Infrastructure Library). ITIL® is known as
“Library” since it refers to a group of books, which have changed with each version of the standard.
ITIL®, intellectual property of the British government’s OGC (Office of Government Commerce),
developed the standard at the end of the 1980s. ITIL defines itself as a group of good practices for
the management of IT services. As its maxim “adopt and adapt” suggests, it should not be mistaken
for a standard. No organization can, therefore, claim ITIL® compliance. This difficults knowing the
exact number of implementations, even though it does have a great impact, as proved by the number
of official personal certifications. According to the official level scheme also run by APMG (official

6
acrediting agency of the Office of Government Commerce, a branch of the UK government), the
number of ITIL-certified professionals in the world currently stands at over 1,400,000 at foundations
level and over 16,000 at expert level (Tucker, 2012).
While ITIL and ISO 20000 are, by their very nature, different, the first being a group of good
practices and the second a management-system standard, the numerous similarities as stated by
Dugmore and Taylor (2008) have caused many authors to study them as a whole, or to consider ISO
20000 a derivative of ITIL or a means for companies to “certify themselves in ITIL”.
ISO 20000 is currently in its second version, the first document of which was published in 2011, and
the full identification of this document is ISO/IEC 20000-1:2011. As a whole, the standard is
comprised of different documents, which we refer to as “parts”; these are detailed in Table 3.
Table 1 Published parts of ISO/IEC 20000
ISO/IEC 20000-1:2011 Service-management system requirements
ISO/IEC 20000-2:2012 Guidance on the application of service-management systems
ISO/IEC 20000-3:2012 Guidance on scope definition and applicability of ISO/IEC
20000-1
ISO/IEC 20000-4:2010 Process-reference model
ISO/IEC 20000-5:2010 Exemplar implementation plan for ISO/IEC 20000-1
When considering the standard in its entirety, the first part definning the management system
requirements is most relevant. It is the only part with enforceable requirements for certification. The
remainder are just complementary advice or recommendations. References to part 1 are often
confused, or used indistinctively, with the standard as a whole. Note that ISO 20000 certification
scheme formely promoted by itSMF (IT Service Management Forum), and been managed by APMG
since 2011, is the most widely-recognised and the only one of worldwide reach. Complemently,

7
certifications emitted under this scheme are collected and published by APMG in a website (APMG
Group)
3. Aims and methodology
The aim of the present study is to determine the current impact of ISO 20000, and forecast its impact
over coming years. It should be pointed out that only one previous study has been found on ISO
20000, with a much narrower scope and using previously used methodologies. Based on the
registrations of certifications issued by APMG, it carries out a basic analysis of geographical
distribution by continent. Its main contribution is the study of incentives and benefits provided by
ISO 20000, based on a survey of companies registered in German-speaking countries (Germany,
Austria, Switzerland and Liechtenstein). Although with a very preliminary focus, Disterer (2012)
said study shows the interest ISO 20000 may generate in the near future.
Considering this previous research, this article will provide answers to two relevant questions.
Firstly, whether ISO 20000 diffusion follows similar patterns to those of the other MS; in other
words, the degree to which the diffusion of standards depends on their area of implementation. And
secondly, placing the standard in context in order to use it as a useful indicator of implementation
trends for other IT standards or frameworks, the uncertified nature of which make a quantitative
analysis of their implementation and use problematic.
For the above reasons, the present article adapts methodologies used in previous MS studies – and
specifically on the most analyzed standards, ISO 9001 and ISO 14001- to ISO 20000. It should be
noted that many of these previous studies are qualitative, focusing their analysis on the motivations,
benefits and problems of MSS implementation and/or certification (Gotzamani and Tsiotras, 2002).
Some quantitative studies have also been detected; These generally use the number of certifications
for a specific MS, and they focus on the study of their historical diffusion or geographical
distribution, and on the correlation between the number of certificates and any economic or financial

8
indicator (Sampaio et al., 2009b). Some authors also infer future diffusion of the various standards
(Casadesús et al., 2010).
Knowledge of the geographical distribution of certifications and their evolution over time is
fundamental to the present study with regards to the diffusion analysis. But when comparing between
different countries, beyond use the absolute number of certifications in a given country, we have
choose to use the ISO Intensity Indicator suggested in (Marimon et al., 2006).
In order to calculate the Certification Intensity index for a standard in a given country, the number of
countries’ certifications has been divided by the country’s GDP (Gross Domestic Product), which is
weighted according to the same relationship regarding the total for the area, as reflected in the
formula.
Certificaction Intensity!"#$%&' =ISO Certificates!"#$%&'/GDP!"#$%&'ISO Certificates!"#!/GDP!"#!
Given that we carry out a worldwide analysis, and not considering divisions in it, our area is the sum
of values for all the countries analyzed.
Although many indicators could be chosen to measure the country’s size, the advantage of GDP is its
availability for every country and its robustness against other more specific indicators.
This way, we can get an indicator which characterizes each country according to the proportion of
certificates regarding their economic weight, allowing a fair comparison among countries regardless
of their size.
Regarding the study of diffusion over time, we propose the use of the logistic equation to model the
worldwide evolution of ISO 20000 certifications, as used initially by Franceschini (2004) analyzing
ISO 9001. This model is based on the hypothesis that the increase in a standard’s certification is
proportional to the number of existing certifications, and that the growth ratio is also a function of
the number of certifications, but that, as long as conditions do not change, there is also an upper limit
9
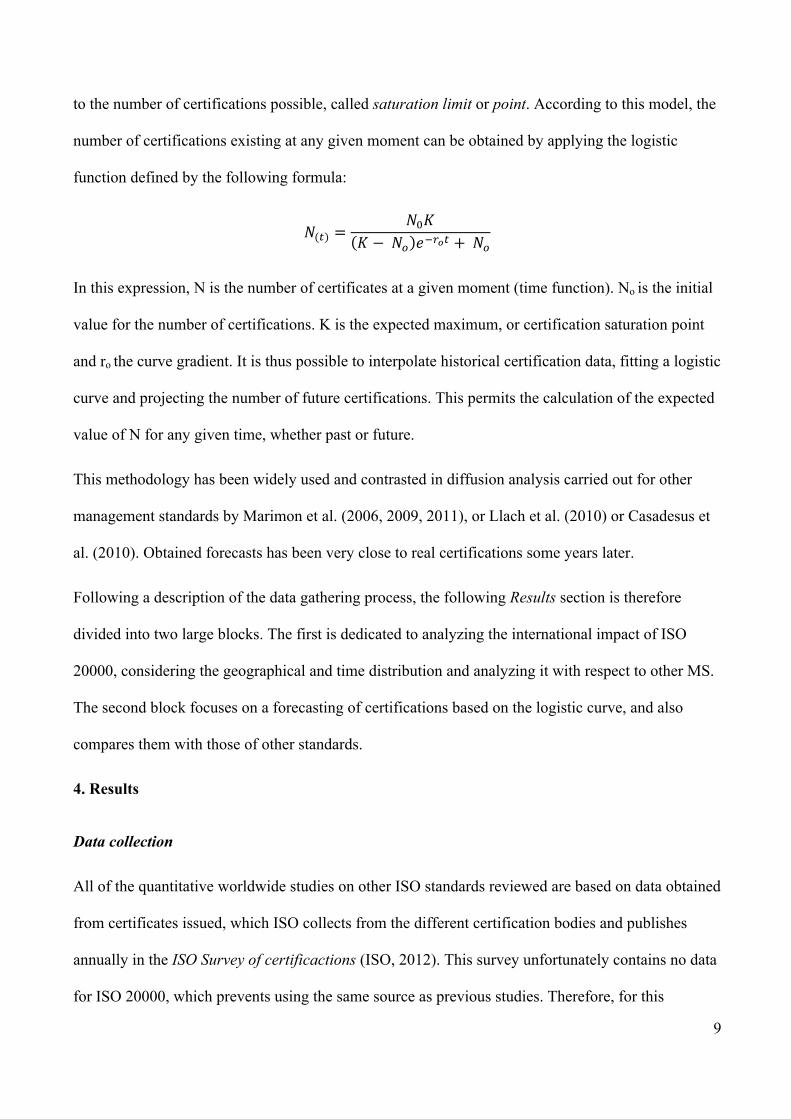
to the number of certifications possible, called saturation limit or point. According to this model, the
number of certifications existing at any given moment can be obtained by applying the logistic
function defined by the following formula:
𝑁(!) =𝑁!𝐾
𝐾 − 𝑁! 𝑒!!!! + 𝑁!
In this expression, N is the number of certificates at a given moment (time function). No is the initial
value for the number of certifications. K is the expected maximum, or certification saturation point
and ro the curve gradient. It is thus possible to interpolate historical certification data, fitting a logistic
curve and projecting the number of future certifications. This permits the calculation of the expected
value of N for any given time, whether past or future.
This methodology has been widely used and contrasted in diffusion analysis carried out for other
management standards by Marimon et al. (2006, 2009, 2011), or Llach et al. (2010) or Casadesus et
al. (2010). Obtained forecasts has been very close to real certifications some years later.
Following a description of the data gathering process, the following Results section is therefore
divided into two large blocks. The first is dedicated to analyzing the international impact of ISO
20000, considering the geographical and time distribution and analyzing it with respect to other MS.
The second block focuses on a forecasting of certifications based on the logistic curve, and also
compares them with those of other standards.
4. Results
Data collection
All of the quantitative worldwide studies on other ISO standards reviewed are based on data obtained
from certificates issued, which ISO collects from the different certification bodies and publishes
annually in the ISO Survey of certificactions (ISO, 2012). This survey unfortunately contains no data
for ISO 20000, which prevents using the same source as previous studies. Therefore, for this
10
research, the first step was to capture records of certifications available on the APMG website on an
ongoing basis (APMG Group). This was done in October 2011, December 2011 and May 2012.
During this period, the records were extracted and some identified inconsistencies reported to
APMG, which led to some records being corrected. Thus, although at the time of writing this article
records are no longer published for certifications prior to 2009, the records collected and analyzed
started in 2006, just one year after the first appearance of the standard.
From the set of records obtained, a total of 729 were considered valid for certifications issued up
until December 2011. Later records were discarded as there is no fixed deadline for publishing
certificates and empirically it was noted that many take several months to be reflected. Therefore, the
time period elapsed between those certifications that are considered for the study (31 December
2011) and the last capture (May 2012) allows to assume that all certifications published for 2011 has
been included.
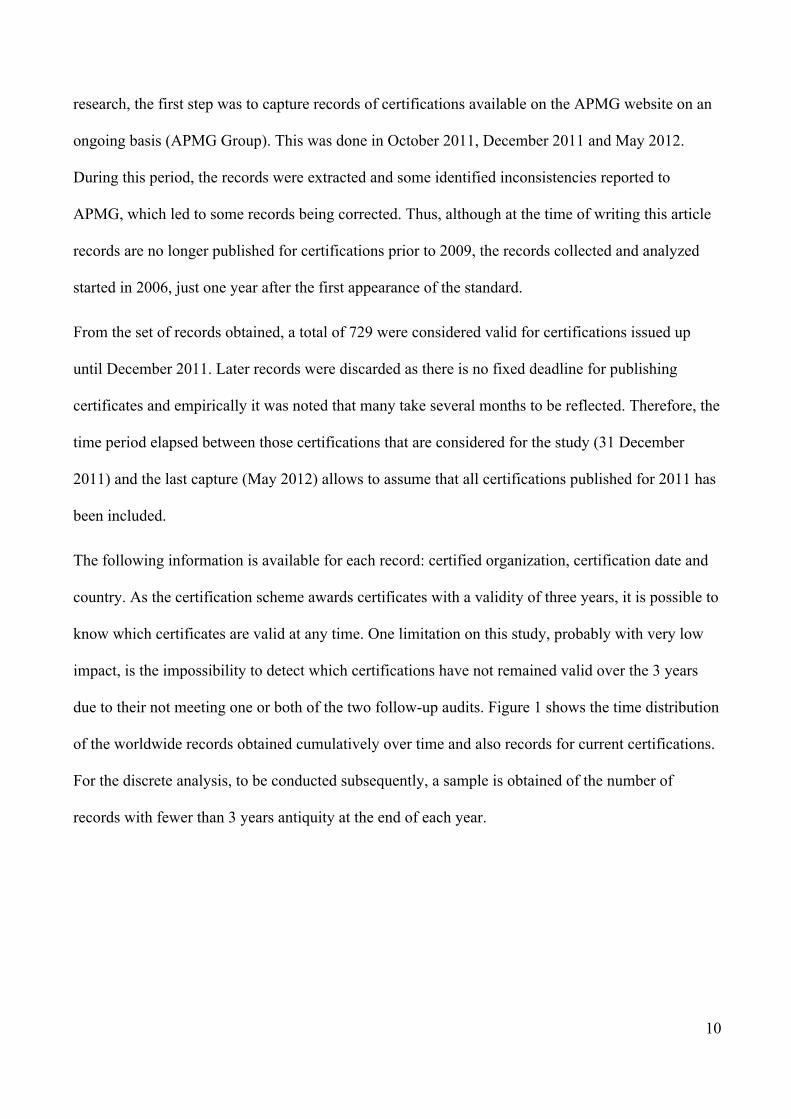
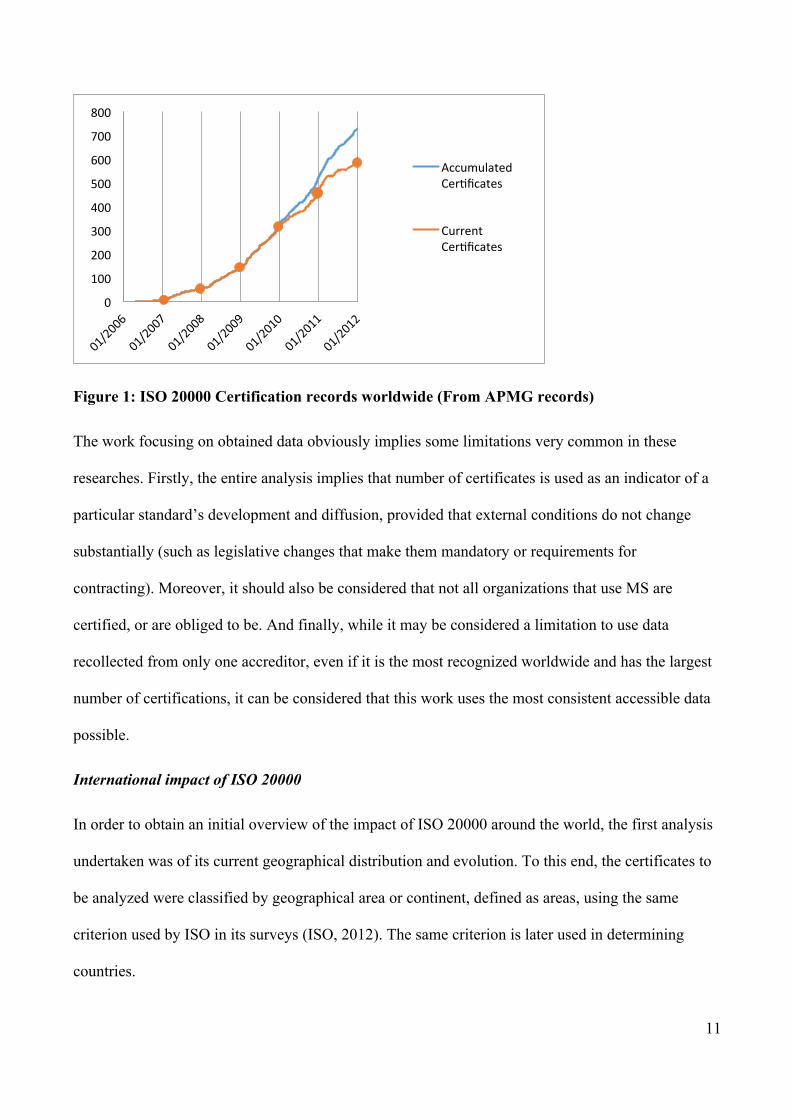
The following information is available for each record: certified organization, certification date and
country. As the certification scheme awards certificates with a validity of three years, it is possible to
know which certificates are valid at any time. One limitation on this study, probably with very low
impact, is the impossibility to detect which certifications have not remained valid over the 3 years
due to their not meeting one or both of the two follow-up audits. Figure 1 shows the time distribution
of the worldwide records obtained cumulatively over time and also records for current certifications.
For the discrete analysis, to be conducted subsequently, a sample is obtained of the number of
records with fewer than 3 years antiquity at the end of each year.
11
Figure 1: ISO 20000 Certification records worldwide (From APMG records)
The work focusing on obtained data obviously implies some limitations very common in these
researches. Firstly, the entire analysis implies that number of certificates is used as an indicator of a
particular standard’s development and diffusion, provided that external conditions do not change
substantially (such as legislative changes that make them mandatory or requirements for
contracting). Moreover, it should also be considered that not all organizations that use MS are
certified, or are obliged to be. And finally, while it may be considered a limitation to use data
recollected from only one accreditor, even if it is the most recognized worldwide and has the largest
number of certifications, it can be considered that this work uses the most consistent accessible data
possible.
International impact of ISO 20000
In order to obtain an initial overview of the impact of ISO 20000 around the world, the first analysis
undertaken was of its current geographical distribution and evolution. To this end, the certificates to
be analyzed were classified by geographical area or continent, defined as areas, using the same
criterion used by ISO in its surveys (ISO, 2012). The same criterion is later used in determining
countries.
0
100
200
300
400
500
600
700
800
Accumulated Cer6ficates
Current Cer6ficates
12
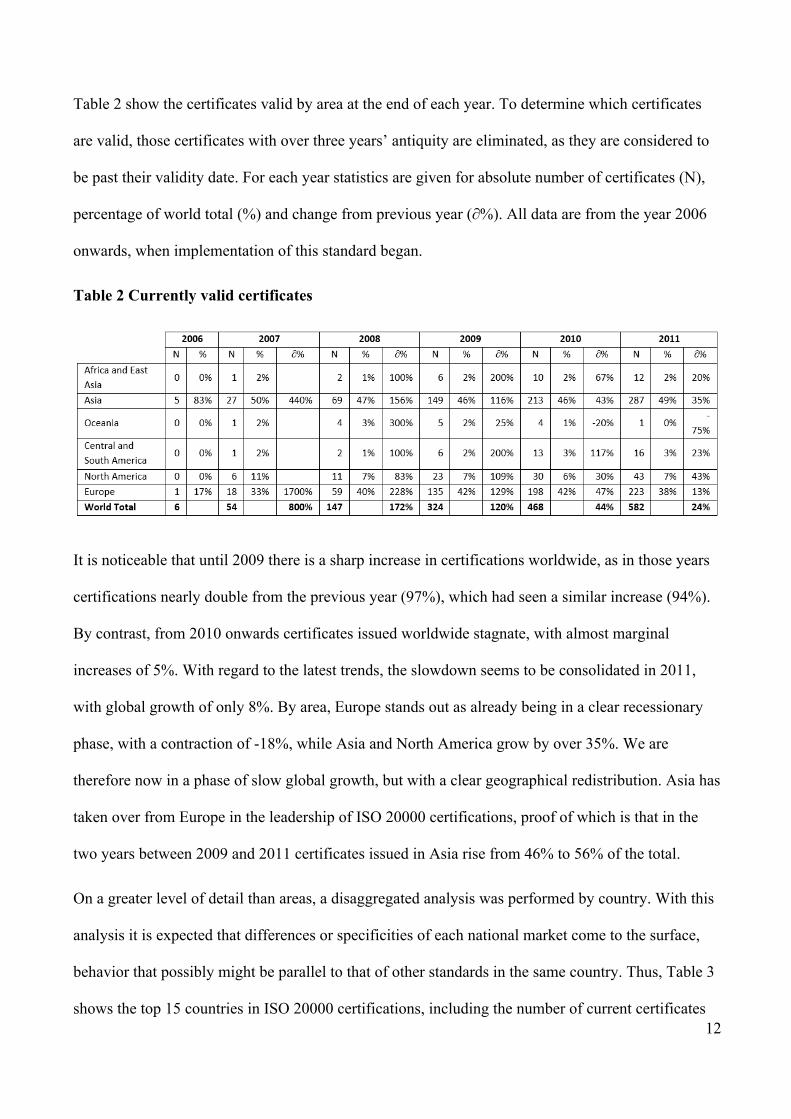
Table 2 show the certificates valid by area at the end of each year. To determine which certificates
are valid, those certificates with over three years’ antiquity are eliminated, as they are considered to
be past their validity date. For each year statistics are given for absolute number of certificates (N),
percentage of world total (%) and change from previous year (∂%). All data are from the year 2006
onwards, when implementation of this standard began.
Table 2 Currently valid certificates
It is noticeable that until 2009 there is a sharp increase in certifications worldwide, as in those years
certifications nearly double from the previous year (97%), which had seen a similar increase (94%).
By contrast, from 2010 onwards certificates issued worldwide stagnate, with almost marginal
increases of 5%. With regard to the latest trends, the slowdown seems to be consolidated in 2011,
with global growth of only 8%. By area, Europe stands out as already being in a clear recessionary
phase, with a contraction of -18%, while Asia and North America grow by over 35%. We are
therefore now in a phase of slow global growth, but with a clear geographical redistribution. Asia has
taken over from Europe in the leadership of ISO 20000 certifications, proof of which is that in the
two years between 2009 and 2011 certificates issued in Asia rise from 46% to 56% of the total.
On a greater level of detail than areas, a disaggregated analysis was performed by country. With this
analysis it is expected that differences or specificities of each national market come to the surface,
behavior that possibly might be parallel to that of other standards in the same country. Thus, Table 3
shows the top 15 countries in ISO 20000 certifications, including the number of current certificates

13
and their share of the world total. This is compared with the 15 countries with the most successful
management standards certifications in the world, namely the ISO 9001, ISO 140001 and ISO
27001. The number of certificates is also shown for ISO 20000.
Table 3 Top 15 countries for each standard
From the list of leading countries for ISO 20000, Japan stands out as the undisputed leader due to
absolute number of certifications, almost doubling China in second place. This Asian leadership is
confirmed by the presence of four other Asian countries (South Korea, India, Taiwan and Hong
Kong) for a total of six of the top ten. Comparing the number of ISO 20000 certifications with the
three aforementioned standards, it could observed that most countries are leaders for all or several
standards. In fact, what is important is to observe how all countries situated in first place coincide at
the top of other standards, indicating that countries with a widespread diffusion of general
14
management standards such as ISO 9001 and ISO 14001 are also leaders in the more specific field,
specifically technology management, the scope of ISO 20000 and ISO 27001.
It is interesting to note that those countries only appearing in the ISO 20000 list are countries of a
smaller size but with high technological development in services. Specifically, Taipei, Hong Kong
and Switzerland.
Moreover, it is worth noting the leading countries for the other standards which do not appear as
leaders in the case of ISO 20000: the Russian Federation and France for ISO 9001 and Romania for
ISO 27001. Although it would be hazardous to venture an explanation without going into a more
detailed study, it is worth to note that not all of the relevant certifying bodies in different countries
adhere to the itSMF / AMPG scheme, meaning they would not be included in this article. This may
cause some one-off distortions for a particular country, but they should not be generalized.
This first exploratory analysis certainly indicates some trends, which might clearly be erroneous if
the size of the different countries is not taken into account. In order to improve the analysis, and as
detailed in the methodology section, certification intensity is used. This is calculated by means of
number of certificates and GDP and population size as indicators of country size. This information
was obtained from data published by the World Bank for 2011, except for Taipei, for which the
World Bank provides no data. Data from the International Monetary Found were used for this
country. Thus, Table 4 shows certification intensity the four analized MSS in the leading 15
countries in terms of ISO 20000 certifications confirming the previous analysis. In general, those
countries that have had a higher certification intensity for standards such as ISO 9001 and ISO 14001
also do so for ISO 20000. For example, the Czech Republic is the country with the highest intensity
in three of the four standards, whereas the United States has three of the lowest four. This parallelism
is seen even more clearly looking only at the two standards relating to technology: ISO 20000 and
ISO 27000. To this end, it is sufficient to observe the behavior of countries like Taipei, Japan and the
UK. In short, this highlights the huge impact countries can have in the diffusion of these standards

15
when it comes to implementing laws, promotional activities and stakeholders previous experience
(firms, consultants, ...).
Table 4 Certification intensity in ISO 20000 top 15 countries
In order to analyze this aspect, namely, the parallelism detected between implementations of the
different standards, the number of certificates and intensity of certificates of each country were
correlated, obtaining the results shown in Table 5. This confirms the previous results, by identifying
first a clear correlation between countries with a higher number of ISO 9001 and ISO 14001
certifications, but also a clear relationship between certification intensity.
Table 5 Pearson Correlations

16
However, what is most novel is finding that there is a clear correlation between the countries with
most ISO 20000 and most ISO 27001 certifications, also confirming first findings. This high
correlation also appears when analyzing countries’ certification intensity for both standards,
indicating that countries with an intensive implementation of ISO 20000 also have the same for ISO
27001. This therefore confirms that if ISO 9001 and ISO 14001 are correlated together, so are ISO
20000 and ISO 27001. The appearance of these pairs in correlations suggests the existence of
countries which are clearly more “technically advanced” or more “service-oriented” than others, a
finding which should be analyzed in more detail.
Further analysis also shows a negative correlation between a country’s certification intensity and its
GDP. This should be interpreted as the countries with the highest GDP being less intensive in terms

17
of certification. These results coincide with the initial perception of the great impact these
regulations have in small-sized countries with great technological potential.
Diffusion of ISO 20000 and future outlook
Having analyzed the current situation, the aim of this paper is to predict future behavior. In this
respect, and as mentioned above, several previous studies (Franceschini et al., 2004; Marimon et al.,
2006) support the use of the logistic curve to model the behavior in time of the number of
certifications for a previous standard, specifically ISO 9001 and ISO 14001. Therefore, we
performed a non-linear regression to forecast the future status of ISO 20000 certifications, allowing
us to determine the value of the dependent variables and obtain the equation of the logistic curve that
best fits existing data. The same exercise was conducted previously for the other reference standards
using ISO data, with the results provided in Table 6.
Table 6 Data for logistic curve regressions
First, it is observed the obtained goodness-of-fit for the resulting model from the regression analysis,
as the determination coefficients (R squared) are greater than 0.99 in all cases. This allows to obtain
values for the three dependent variables (No, k and r0) that characterize each of the logistic curves for
each standard. Furthermore, the parameters of the curves were subjected to a confidence interval of

18
95%, with the result that the values obtained represent the lower confidence limit (LL) and upper
confidence limit (UL).
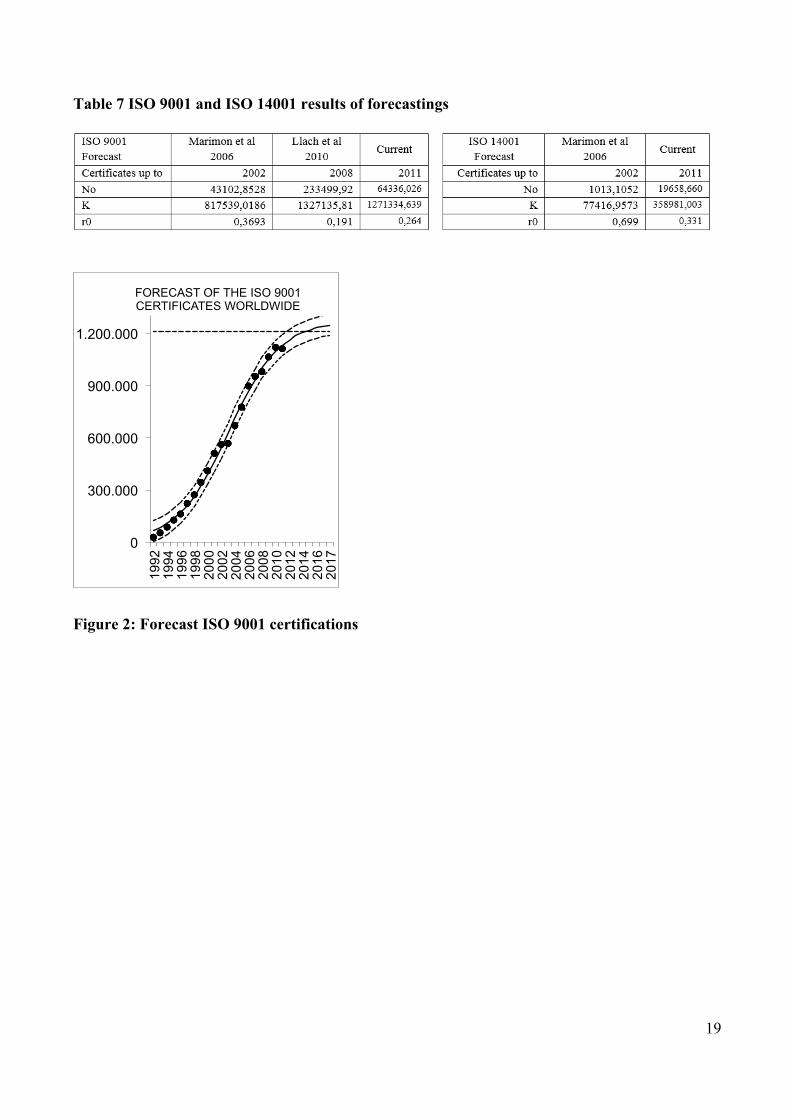
In the cases of the reference standards used, ISO 9001 and ISO 14001, there is further confirmation
of the findings identified in previous studies (Marimon et al., 2006; Llach et al., 2010), even
including the new available data. Thus, the behavior of both standards is perfectly modelable
following the pattern of the logistic curve, confirming the predictions made by previous studies while
generating new forecasts for the coming years. Specifically, the saturation level is on 1,200,000 ISO
9001 certifications in 2016, and 350,000 ISO 14001 in 2019. Table 7 shows the characteristics of the
generated model, and Figures 2 and 3 the worldwide forecast evolution over time. These Figures
show the points representing certifications for each year and the logistic curve with the parameters
obtained in the regression. The dotted lines represent the curves corresponding to the upper and
lower limits at 95% confidence interval. Thus, it is clearly observe that all points representing
certification values remain within the confidence intervals for both standards.
19
Table 7 ISO 9001 and ISO 14001 results of forecastings
Figure 2: Forecast ISO 9001 certifications
0
300.000
600.000
900.000
1.200.000
1992
19
94
1996
19
98
2000
20
02
2004
20
06
2008
20
10
2012
20
14
2016
20
17
FORECAST OF THE ISO 9001 CERTIFICATES WORLDWIDE
20
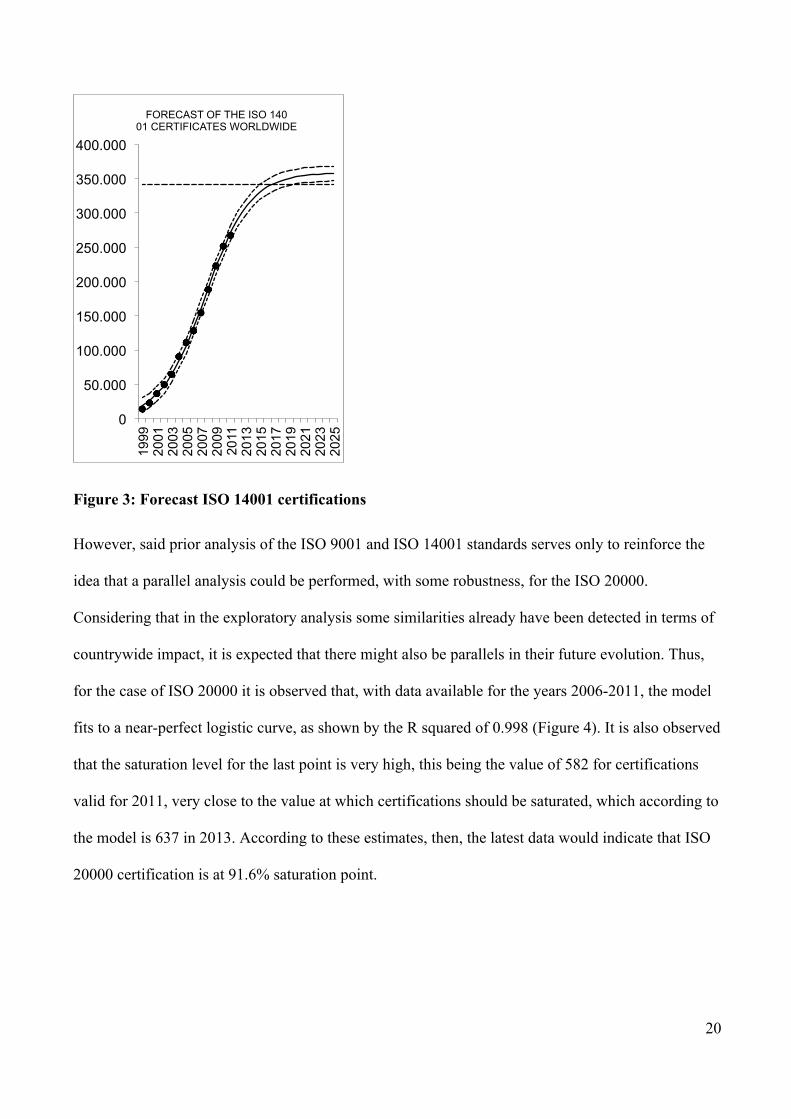
Figure 3: Forecast ISO 14001 certifications
However, said prior analysis of the ISO 9001 and ISO 14001 standards serves only to reinforce the
idea that a parallel analysis could be performed, with some robustness, for the ISO 20000.
Considering that in the exploratory analysis some similarities already have been detected in terms of
countrywide impact, it is expected that there might also be parallels in their future evolution. Thus,
for the case of ISO 20000 it is observed that, with data available for the years 2006-2011, the model
fits to a near-perfect logistic curve, as shown by the R squared of 0.998 (Figure 4). It is also observed
that the saturation level for the last point is very high, this being the value of 582 for certifications
valid for 2011, very close to the value at which certifications should be saturated, which according to
the model is 637 in 2013. According to these estimates, then, the latest data would indicate that ISO
20000 certification is at 91.6% saturation point.
0
50.000
100.000
150.000
200.000
250.000
300.000
350.000
400.000 19
99
2001
20
03
2005
20
07
2009
20
11
2013
20
15
2017
20
19
2021
20
23
2025
FORECAST OF THE ISO 140 01 CERTIFICATES WORLDWIDE
21
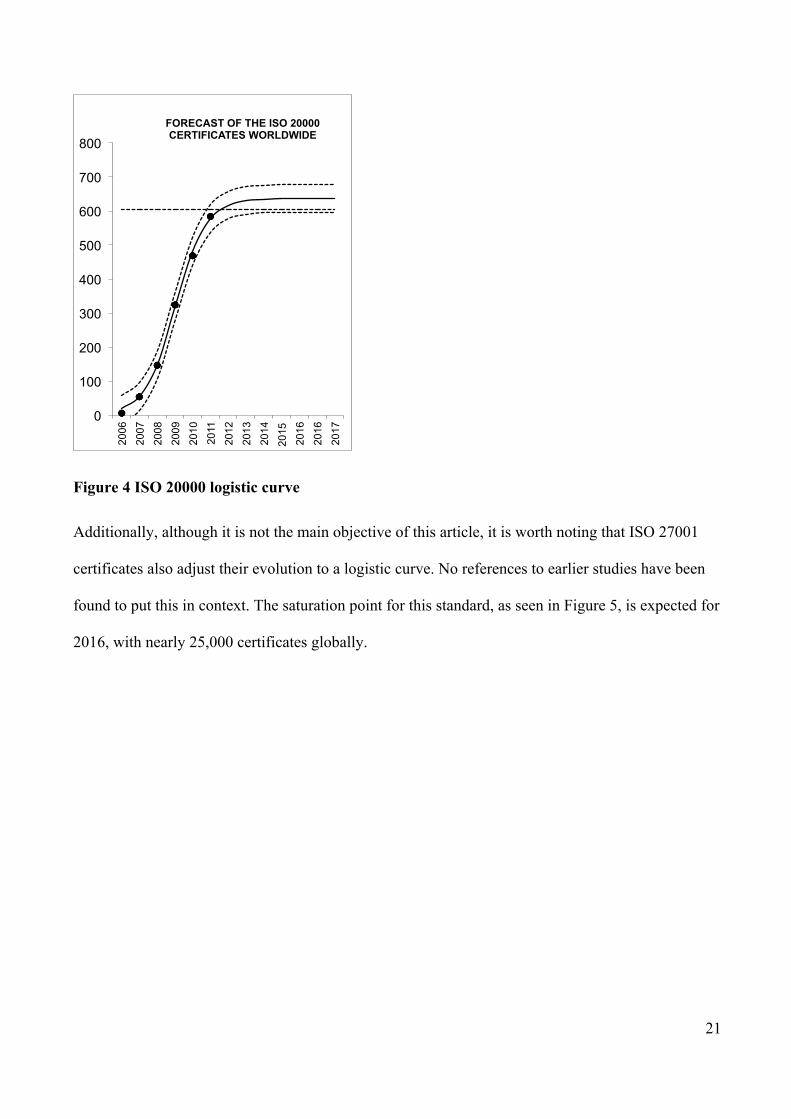
Figure 4 ISO 20000 logistic curve
Additionally, although it is not the main objective of this article, it is worth noting that ISO 27001
certificates also adjust their evolution to a logistic curve. No references to earlier studies have been
found to put this in context. The saturation point for this standard, as seen in Figure 5, is expected for
2016, with nearly 25,000 certificates globally.
0
100
200
300
400
500
600
700
800
2006
2007
2008
2009
2010
2011
2012
2013
2014
2015
2016
2016
2017
FORECAST OF THE ISO 20000 CERTIFICATES WORLDWIDE
22
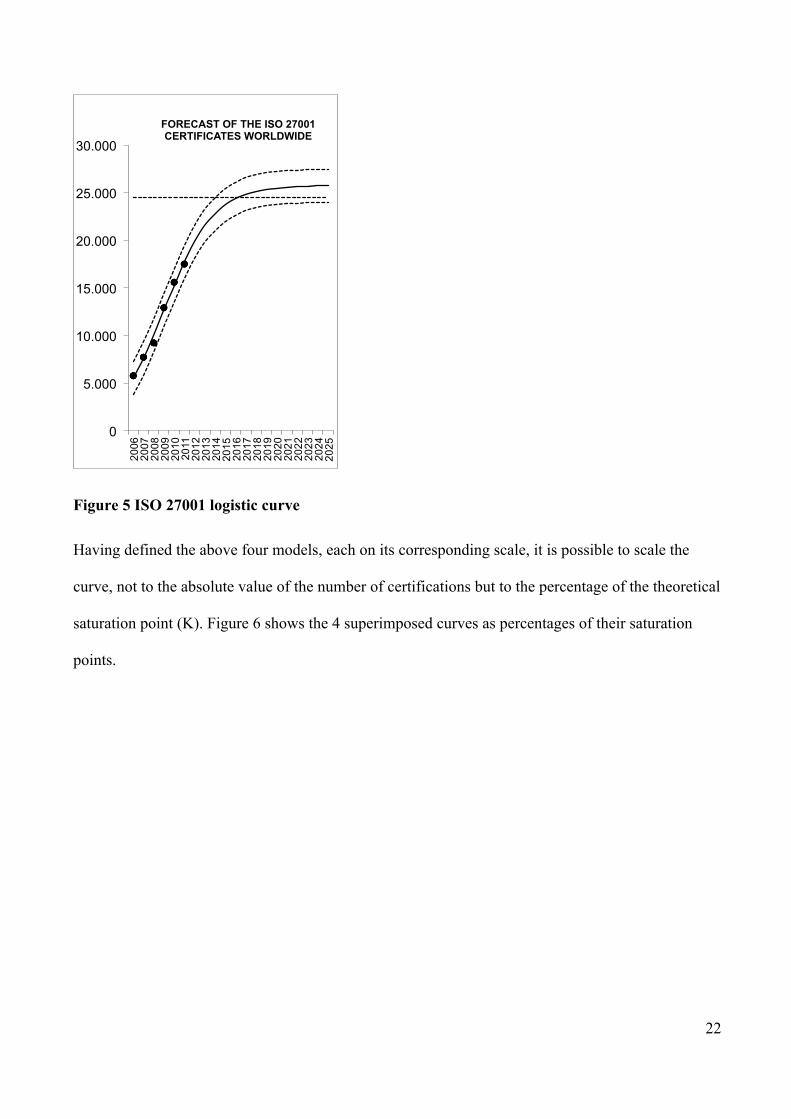
Figure 5 ISO 27001 logistic curve
Having defined the above four models, each on its corresponding scale, it is possible to scale the
curve, not to the absolute value of the number of certifications but to the percentage of the theoretical
saturation point (K). Figure 6 shows the 4 superimposed curves as percentages of their saturation
points.
0
5.000
10.000
15.000
20.000
25.000
30.000 20
06
2007
20
08
2009
20
10
2011
20
12
2013
20
14
2015
20
16
2017
20
18
2019
20
20
2021
20
22
2023
20
24
2025
FORECAST OF THE ISO 27001 CERTIFICATES WORLDWIDE
23
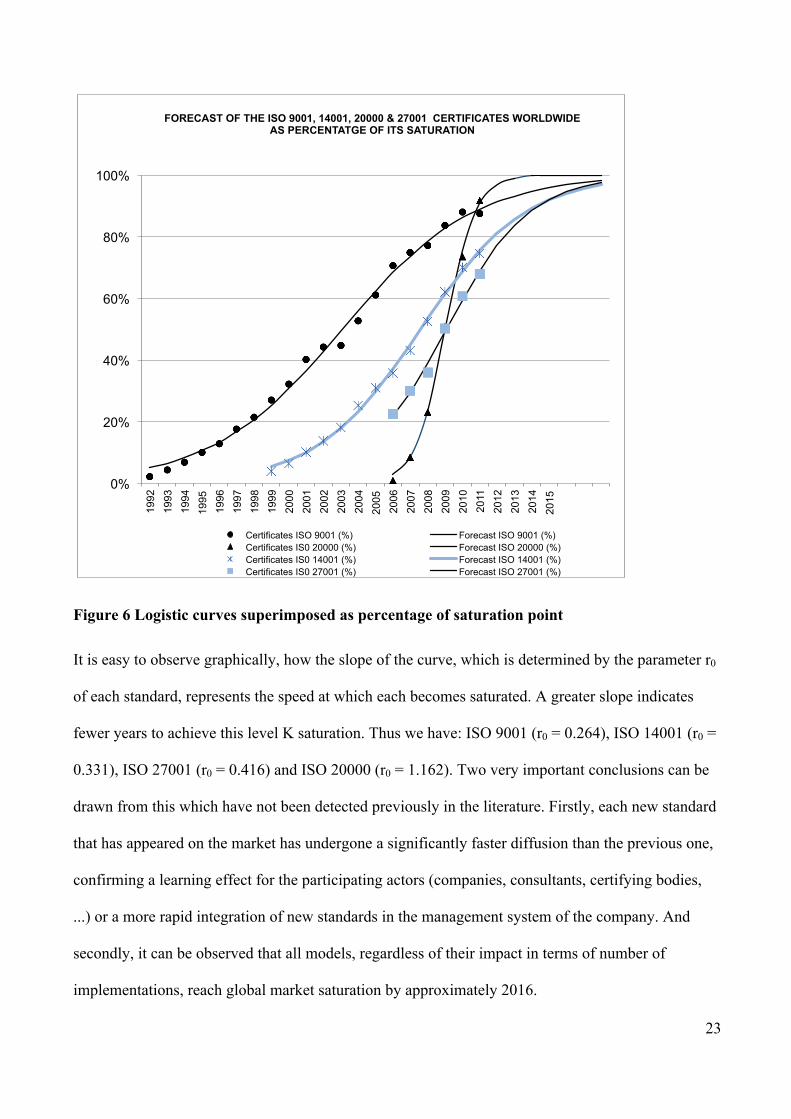
Figure 6 Logistic curves superimposed as percentage of saturation point
It is easy to observe graphically, how the slope of the curve, which is determined by the parameter r0
of each standard, represents the speed at which each becomes saturated. A greater slope indicates
fewer years to achieve this level K saturation. Thus we have: ISO 9001 (r0 = 0.264), ISO 14001 (r0 =
0.331), ISO 27001 (r0 = 0.416) and ISO 20000 (r0 = 1.162). Two very important conclusions can be
drawn from this which have not been detected previously in the literature. Firstly, each new standard
that has appeared on the market has undergone a significantly faster diffusion than the previous one,
confirming a learning effect for the participating actors (companies, consultants, certifying bodies,
...) or a more rapid integration of new standards in the management system of the company. And
secondly, it can be observed that all models, regardless of their impact in terms of number of
implementations, reach global market saturation by approximately 2016.
0%
20%
40%
60%
80%
100%
1992
19
93
1994
19
95
1996
19
97
1998
19
99
2000
20
01
2002
20
03
2004
20
05
2006
20
07
2008
20
09
2010
20
11
2012
20
13
2014
20
15
FORECAST OF THE ISO 9001, 14001, 20000 & 27001 CERTIFICATES WORLDWIDE AS PERCENTATGE OF ITS SATURATION
Certificates ISO 9001 (%) Forecast ISO 9001 (%) Certificates IS0 20000 (%) Forecast ISO 20000 (%) Certificates IS0 14001 (%) Forecast ISO 14001 (%) Certificates IS0 27001 (%) Forecast ISO 27001 (%)
24
In fact, this diffusion of different standards together seems to reinforce the proposal that the logistic
curve model can, over time, be integrated into a higher order curve, with a possible fractal logistic
curve appearing or a sequence of linked curves (Modis, 1994). Within this, smaller scale logistic
curves would exist as components of larger logistic curves. It may prove possible to confirm that this
is precisely the case with the diffusion of different management standards.
5. Conclusions
This paper has explored the impact of ISO 20000; the first international standard that defines a
service management system. Initially designed for IT services, the standard can be applied to other
types of services, as demonstrated by various real-life experiences. This flexibility is one of the
characteristics that can make this a standard with a promising future and a significant capacity to
evolve. In fact, it has been detected how certification progressed very fast up until the end of 2009,
even if this increase has slowed sharply in the past two years.
In order to explore the impact of this standard, this article is focused on various analyses. Initially,
the impact study by continents permits to observe a clear dominance of Asia and Europe, with a
slight downward trend in Europe and slightly increasing in Asia and North America. Moreover, in
the country analysis it is detected the importance of smaller countries with strong technological
capabilities (Taipei, South Korea, Switzerland, ..). In addition, it should also be noted that the leading
countries in ISO 20000 certifications largely coincide with the leading countries for the other
analyzed standards ISO 27001, ISO 9001 and ISO 14001, whether in terms of the absolute number of
certifications or ISO 20000 certification intensity. There is also a strong correlation between
countries with most ISO 20000 and ISO 27001 certifications, from which it can be deduced the
major impact that countries’ promotion and regulatory activities have on the diffusion of standards.
Furthermore, forecasts have been made for certifications of the standard, using a logistic curve model
that has proved very effective in previous studies on other management standards. In the case of ISO

25
20000, this model has also proved itself to be very strong, and it have been deduced from this that, if
there are no major changes in the environment, the number of certificates is already very close to
anticipated saturation levels: just over 600 certifications worldwide.
The most interesting contribution of this paper, however, is related precisely to the analysis provided
by these projection models. It has been detected that each new standard requires much less time to
reach its saturation level. In fact, it has been reduced from almost 20 years forISO 9001 to about 6
years for ISO 20000. Therefore, the lower diffusion a standard has with regard to the total number of
certifications, the faster it approaches its saturation level. This suggests an important learning process
on the part of the organizations involved (companies, certifying bodies, etc.) and possibly a high
capacity for integration of new MSS standards previously existing in the company. Finally, it has
been also detected that the four standards analyzed will reach their saturation level at the same time,
around the year 2016.
All of these contributions can be added to those of the only one previous study, Disterer (2012),
detected in the field on the diffusion of ISO 20000.
The main limitation of this study is its use of the only possible source of data, offered by a single
accreditation body. While it is very prestigious, drawing together a large number of certifying
bodies, it does not include all of them. Thus, in each country different certifying bodies dominate or
capture greater market share and as not all of them are accredited under the same scheme, there may
appear isolated cases of countries with a number of certifications that do not appear in this study. To
this must be added, like all analyses in the field, the impossibility of including companies that apply
this standard but are not certified. In any event, it would be desirable for future studies that ISO
collect and publish certification data for ISO 20000, thus facilitating comparisons.
Finally, it is worth pointing out that further study will be required on the behavior of the standard,
not only to validate or refute the present research, but to do so in light of new evidence as it emerges.

26
It would be interesting to study the future evolution of certifications in the light of a larger set of data
in order to compare the actual performance with the forecasts included in this article.
It would also be interesting to carry out a detailed study of motivations, challenges, benefits and
integration of ISO 20000 with other MS, aspects not analyzed in the literature, which could include
not only companies with current certification, but also those which have abandoned certification after
having it and even companies that have dismissed the idea of certification despite using the standard.
BIBLIOGRAPHY
APMG Group ISO/IEC 20000 certification website.
Bitner, M.J. (2001). Service and technology : opportunities and paradoxes. Managing Service Quality 11, 375 – 379.
Casadesús, M., Marimon, F., and Alonso, M. (2010). The future of standardised quality management in tourism: evidence from the Spanish tourist sector. The Service Industries Journal 30, 2457–2474.
Casadesús, M., Karapetrovic, S., and Heras, I. (2011). Synergies in standardized management systems: some empirical evidence. The TQM Journal 23, 73–86.
Cater-Steel, A. (2009). Information technology governance and service management: frameworks and adaptations (Information Science Reference).
Dahlgaard-Park, S.M. (2011). The quality movement: Where are you going? Total Quality Management & Business Excellence 22, 493–516.
Dahlgaard-Park, S.M., Chen, C.-K., Jang, J.-Y., and Dahlgaard, J.J. (2013). Diagnosing and prognosticating the quality movement – a review on the 25 years quality literature (1987–2011). Total Quality Management & Business Excellence 24, 1–18.
Demirkan, H., Kauffman, R.J., Vayghan, J. a., Fill, H.-G., Karagiannis, D., and Maglio, P.P. (2008). Service-oriented technology and management: Perspectives on research and practice for the coming decade. Electronic Commerce Research and Applications 7, 356–376.
Disterer, G. (2012). Why firms seek ISO 20000 certification - A study of ISO 20000 adoption. In European Conference on Information Systems,.
Dugmore, J., and Taylor, S. (2008). ITIL V3 and ISO/IEC 20000 Alignement White Paper.
Franceschini, F., Galetto, M., and Giannì, G. (2004). A new forecasting model for the diffusion of ISO 9000 standard certifications in European countries. International Journal of Quality & Reliability Management 21, 32–50.

27
Garengo, P., and Biazzo, S. (2013). From ISO quality standards to an integrated management system: an implementation process in SME. Total Quality Management & Business Excellence 24, 310–335.
Gillies, A. (2011). Improving the quality of information security management systems with ISO27000. The TQM Journal 23, 367–376.
Gotzamani, K., and Tsiotras, G. (2002). The true motives behind ISO 9000 certification: their effect on overall certification benefits and long term contribution towards TQM. International Journal of Quality & Reliability Management 19, 151–169.
Iden, J., and Eikebrokk, T.R. (2013). Implementing IT Service Management: A systematic literature review. International Journal of Information Management 33, 512–523.
ISO (2012). The ISO Survey of Certifications 2011.
Kumbakara, N. (2008). Managed IT services: the role of IT standards. Information Management & Computer Security 16, 336–359.
Lezcano, J.-M., Adachihara, H., and Prunier, M. (2010). Experimenting Design and Implementation of an Educational Services Management System Based on ISO/IEC 20000 Standard. In Technology Enhanced Learning. Quality of Teaching and Educational Reform, M. Lytras, P. Ordonez De Pablos, D. Avison, J. Sipior, Q. Jin, W. Leal, L. Uden, M. Thomas, S. Cervai, and D. Horner, eds. (Springer Berlin Heidelberg), pp. 55–60.
Llach, J., Marimon, F., and Bernardo, M. (2010). ISO 9001 diffusion analysis according to activity sectors. Industrial Management & Data Systems 111, 298–316.
Marimon, F., Casadesús, M., and Heras, I. (2006). ISO 9000 and ISO 14000 standards: an international diffusion model. International Journal of Operations & Production Management 26, 141–165.
Marimon, F., Heras, I., and Casadesús, M. (2009). ISO 9000 and ISO 14000 standards: A projection model for the decline phase. Total Quality Management & Business Excellence 20, 1–21.
Marimon, F., Llach, J., and Bernardo, M. (2011). Comparative analysis of diffusion of the ISO 14001 standard by sector of activity. Journal of Cleaner Production 19, 1734–1744.
Matias, J.C. de O., and Coelho, D.A. (2011). Integrated total quality management: Beyond zero defects theory and towards innovation. Total Quality Management & Business Excellence 22, 891–910.
Modis, T. (1994). Fractal aspects of natural growth. Technological Forecasting and Social Change 47, 63–73.
Rubio-Andrada, L., Del Mar Alonso-Almeida, M., and Rodríguez-Antón, J.M. (2011). Motivations and impacts in the firm and stakeholders of quality certification: Evidence from small- and medium-sized service enterprises. Total Quality Management & Business Excellence 22, 833–852.
Sampaio, P., Saraiva, P., and Rodrigues, A.G. (2009a). ISO 9001 certification research: questions, answers and approaches. International Journal of Quality & Reliability Management 26, 38–58.
Sampaio, P., Saraiva, P., and Guimarães Rodrigues, a. (2009b). An analysis of ISO 9000 data in the world and the European Union. Total Quality Management & Business Excellence 20, 1303–1320.
Simon, A., Bernardo, M., Karapetrovic, S., and Casadesús, M. (2013). Implementing integrated management systems in chemical firms. Total Quality Management & Business Excellence 24, 294–309.

28
Tucker, G. (2012). ITIL Exam Statistics Updated for July 2012 - http://itsminfo.com/itil-exam-statistics-updated-for-july-2012/.
Wu, S.-I., and Chen, J.-H. (2011). Comparison between manufacturing companies that are ISO certified and those that are not certified using performance measurement model. Total Quality Management & Business Excellence 22, 869–890.
Zeng, S.X., Xie, X.M., Tam, C.M., and Shen, L.Y. (2011). An empirical examination of benefits from implementing integrated management systems (IMS). Total Quality Management & Business Excellence 22, 173–186.