Exploring the Limits of Cell Adhesion under Shear Stress ...
15
diagnostics Article Exploring the Limits of Cell Adhesion under Shear Stress within Physiological Conditions and beyond on a Chip Melanie E. M. Stamp 1,2 , Anna M. Jötten 1 , Patrick W. Kudella 1 , Dominik Breyer 1 , Florian G. Strobl 1,2 , Thomas M. Geislinger 1,2,3 , Achim Wixforth 1,2,3 and Christoph Westerhausen 1,2,3, * 1 Chair for Experimental Physics 1, University of Augsburg, Augsburg 86159, Germany; [email protected] (M.E.M.S.); [email protected] (A.M.J.); [email protected] (P.W.K.); [email protected] (D.B.); fl[email protected] (F.G.S.); [email protected] (T.M.G.); [email protected] (A.W.) 2 Nanosystems Initiative Munich (NIM), Schellingstraße 4, Munich 80799, Germany 3 Augsburg Center for Innovative Technologies (ACIT), Augsburg 86159, Germany * Correspondence: [email protected]; Tel.: +49-821-598-3311 Academic Editor: Sandeep Kumar Vashist Received: 10 August 2016; Accepted: 13 October 2016; Published: 21 October 2016 Abstract: Cell adhesion processes are of ubiquitous importance for biomedical applications such as optimization of implant materials. Here, not only physiological conditions such as temperature or pH, but also topographical structures play crucial roles, as inflammatory reactions after surgery can diminish osseointegration. In this study, we systematically investigate cell adhesion under static, dynamic and physiologically relevant conditions employing a lab-on-a-chip system. We screen adhesion of the bone osteosarcoma cell line SaOs-2 on a titanium implant material for pH and temperature values in the physiological range and beyond, to explore the limits of cell adhesion, e.g., for feverish and acidic conditions. A detailed study of different surface roughness R q gives insight into the correlation between the cells’ abilities to adhere and withstand shear flow and the topography of the substrates, finding a local optimum at R q = 22 nm. We use shear stress induced by acoustic streaming to determine a measure for the ability of cell adhesion under an external force for various conditions. We find an optimum of cell adhesion for T = 37 ◦ C and pH = 7.4 with decreasing cell adhesion outside the physiological range, especially for high T and low pH. We find constant detachment rates in the physiological regime, but this behavior tends to collapse at the limits of 41 ◦ C and pH 4. Keywords: cell adhesion; shear stress; pH; temperature; medical implants; microfluidics; lab-on-a-chip 1. Introduction With an aging population, the need for medical implants is increasing rapidly. For example, a study from the Organization for Economic Co-operation and Development (OECD) in 2015 stated that per year 282 out of 100,000 citizen of the OECD countries will need knee or hip replacements [1]. Projections claimed that the number of arthroplasty surgeries will reach over 4 million annual procedures by the year 2030 [2], not even counting the numerous revision surgeries due to inflammatory complications. After surgery, implants connect to the bone via the process of osseointegration. Therein, cells adhere to the implant to form a direct structural and functional connection between bone and implant. Important for osseointegration are cell-substrate contacts. This non-specific binding is a complex mechanism involving a variety of proteins and their interaction with materials. Most important are Diagnostics 2016, 6, 38; doi:10.3390/diagnostics6040038 www.mdpi.com/journal/diagnostics
-
Upload
khangminh22 -
Category
Documents
-
view
2 -
download
0
Transcript of Exploring the Limits of Cell Adhesion under Shear Stress ...

diagnostics
Article
Exploring the Limits of Cell Adhesion under ShearStress within Physiological Conditions and beyondon a Chip
Melanie E. M. Stamp 1,2, Anna M. Jötten 1, Patrick W. Kudella 1, Dominik Breyer 1, Florian G. Strobl 1,2,Thomas M. Geislinger 1,2,3, Achim Wixforth 1,2,3 and Christoph Westerhausen 1,2,3,*
1 Chair for Experimental Physics 1, University of Augsburg, Augsburg 86159, Germany;[email protected] (M.E.M.S.); [email protected] (A.M.J.);[email protected] (P.W.K.); [email protected] (D.B.);[email protected] (F.G.S.); [email protected] (T.M.G.);[email protected] (A.W.)
2 Nanosystems Initiative Munich (NIM), Schellingstraße 4, Munich 80799, Germany3 Augsburg Center for Innovative Technologies (ACIT), Augsburg 86159, Germany* Correspondence: [email protected]; Tel.: +49-821-598-3311
Academic Editor: Sandeep Kumar VashistReceived: 10 August 2016; Accepted: 13 October 2016; Published: 21 October 2016
Abstract: Cell adhesion processes are of ubiquitous importance for biomedical applications such asoptimization of implant materials. Here, not only physiological conditions such as temperature orpH, but also topographical structures play crucial roles, as inflammatory reactions after surgery candiminish osseointegration. In this study, we systematically investigate cell adhesion under static,dynamic and physiologically relevant conditions employing a lab-on-a-chip system. We screenadhesion of the bone osteosarcoma cell line SaOs-2 on a titanium implant material for pH andtemperature values in the physiological range and beyond, to explore the limits of cell adhesion,e.g., for feverish and acidic conditions. A detailed study of different surface roughness Rq givesinsight into the correlation between the cells’ abilities to adhere and withstand shear flow and thetopography of the substrates, finding a local optimum at Rq = 22 nm. We use shear stress induced byacoustic streaming to determine a measure for the ability of cell adhesion under an external force forvarious conditions. We find an optimum of cell adhesion for T = 37 ◦C and pH = 7.4 with decreasingcell adhesion outside the physiological range, especially for high T and low pH. We find constantdetachment rates in the physiological regime, but this behavior tends to collapse at the limits of 41 ◦Cand pH 4.
Keywords: cell adhesion; shear stress; pH; temperature; medical implants; microfluidics; lab-on-a-chip
1. Introduction
With an aging population, the need for medical implants is increasing rapidly. For example,a study from the Organization for Economic Co-operation and Development (OECD) in 2015stated that per year 282 out of 100,000 citizen of the OECD countries will need knee or hipreplacements [1]. Projections claimed that the number of arthroplasty surgeries will reach over4 million annual procedures by the year 2030 [2], not even counting the numerous revision surgeriesdue to inflammatory complications.
After surgery, implants connect to the bone via the process of osseointegration. Therein, cellsadhere to the implant to form a direct structural and functional connection between bone and implant.Important for osseointegration are cell-substrate contacts. This non-specific binding is a complexmechanism involving a variety of proteins and their interaction with materials. Most important are
Diagnostics 2016, 6, 38; doi:10.3390/diagnostics6040038 www.mdpi.com/journal/diagnostics

Diagnostics 2016, 6, 38 2 of 15
the extracellular matrix proteins (fibronectin, collagen, laminin, vitronectin), cytoskeletal proteins(actin, talin, vinculin), and integrins serving as membrane receptors [3]. The process of cell adhesioncan be separated into three stages. First, the cell body attaches to the substrate (initial stage) byphysico-chemical linkages, e.g., ionic forces and van der Waals forces, between the cell and theimplant [4]. Second, the cell body flattens and spreads with adhesion sites formed by integrinsto anchor the cell to a matrix or to adhesion molecules on other cells [5]. In the final phase thecells’ actin skeleton reorganizes and forms focal adhesion between the cell and its substrate [6].Some focal adhesions disassemble while others enlarge and nucleate associated stress fibers, allowingnon-muscular cells to withstand shear flow in blood streams [7]. Those stress fibers consist of bundlesof actin filaments, mainly held together by the actin-crosslinking protein α-actinin. These stress fibersare of particular importance for cellular motility as fiber contractility helps endothelial cells to remainflat under flow and hence to reduce the experienced fluid shear forces [8].
After surgery, inflammation of the implant’s surrounding is caused for example by wear debris [9]or macrophage activated inflammatory cytokines that are released into the joint fluid, where theystimulate the differentiation of bone marrow cells into osteoclasts, leading to bone resorption [10].The main reason for joint revision surgeries lies in the loosing of the implant material due toinflammation caused by such wear debris or bacterial infections [9–11]. Hereby infections andinflammatory reactions often result in changes of temperature, particularly feverish conditions [12],or decrease of the intercellular pH [13]. Depending on the extent of the inflammation, the implant willpossibly fail, causing high costs for revision surgeries [11].
Thus, to ensure the reliability and durability of medical implants is of particular interest, and thestrength of cell adhesion needs to be investigated in detail to understand the underlying processes.Several groups have already studied cell adhesion under static and dynamic conditions [14–20]. Oneof the first approaches to dynamically study cell adhesion used a rotating disk in a fluid abovea substrate with adhered cells to generate a shear force field [14]. Using this setup, Weiss et al.demonstrated that shear stress strongly influences cell adhesion. However, due to its construction,the method does not allow for in situ observation of the cells, which hinders a detailed time-dependentinvestigation and high amounts of sample volume are needed in the setup’s recent developmentstage [15]. In contrast, the technique of surface acoustic wave (SAW)-induced streaming has beenshown to enable the construction of much smaller setups to study cell adhesion with respect to shearflow [16–18]. Bussonnière et al. investigated the de-adhesion of cells directly from a piezoelectricsubstrate [16]. They demonstrated that SAW fluid actuation can be used to selectively detach andsort cells in a droplet. However, presuming the cells to adhere directly on the piezoelectric substrateprohibits the investigation of different substrate materials. Furthermore, the cells are not only exposedto shear flow but also to electric, thermal and mechanic influences of the propagating SAW which hasbeen shown to alter the cells’ behavior [17]. We recently developed a SAW-activated system that workswith small sample volumes and allows to decouple the single environmental influences from eachother. It additionally provides the possibility to observe the cells in situ and to implement arbitrarysubstrate materials [18].
Here, we used this lab-on-a-chip system to study cell adhesion on titanium substrates as a modelfor medical implants and vary temperature, pH, and surface roughness to explore the limits ofcell adhesion under various physiological conditions and beyond. Our experiments demonstratean impaired cell adhesion above and below the regular physiological conditions of T = 37 ◦C andpH = 7.4. Inside the physiological range, cells withstand aggravated conditions, even when exposedto shear flow, which we use to actively add an external force working against cell adhesion. We onlyfind significant changes in the cells’ adhesion for T > 41 ◦C, pH < 6.5 and pH > 8.0 in terms of a morethan 50% increased cell detachment. Surface roughness also shows a clear effect on the cells ability toadhere and form bonds that effectively withstand shear forces. Although we find the highest adhesionon rough surfaces under static conditions, the optimum shifts to smoother surfaces if a shear flowis applied.

Diagnostics 2016, 6, 38 3 of 15
2. Materials and Methods
2.1. The De-Adhesion Number Investigator (DANI)
To measure cell de-adhesion under dynamic conditions, we employed the previously introducedmicrofluidic method De-Adhesion Number Investigator (DANI) [18] as illustrated in Figure 1.Described in brief, it consists of a cylindrical polydimethylsiloxane (PDMS) chamber with a volumeof V ≈ 160 µL between a piezoelectric LiNbO3 chip and a circular substrate of arbitrary material(here: titanium) with adhered cells on top. We fastened the whole setup using a brass bridge, which isalso thermally connected in order to heat the system using a heat bath. Here, the heat bath temperatureis chosen about ∆T = 7 ◦C lower than the desired temperature. Together with the small SAW-generatedtemperature increase of the sample, this results in the temperatures given below. By applying a radiofrequency signal to the interdigital transducer (IDT) on the piezoelectric substrate, surface acousticwaves were generated. These caused acoustic streaming leading to a fluid flow towards the cells underan angle of α = 21◦ relative to the surface normal [19].
Diagnostics 2016, 6, 38 3 of 15
2. Materials and Methods
2.1. The De-Adhesion Number Investigator (DANI)
To measure cell de-adhesion under dynamic conditions, we employed the previously introduced microfluidic method De-Adhesion Number Investigator (DANI) [18] as illustrated in Figure 1. Described in brief, it consists of a cylindrical polydimethylsiloxane (PDMS) chamber with a volume of V ≈ 160 µL between a piezoelectric LiNbO3 chip and a circular substrate of arbitrary material (here: titanium) with adhered cells on top. We fastened the whole setup using a brass bridge, which is also thermally connected in order to heat the system using a heat bath. Here, the heat bath temperature is chosen about ΔT = 7 °C lower than the desired temperature. Together with the small SAW-generated temperature increase of the sample, this results in the temperatures given below. By applying a radio frequency signal to the interdigital transducer (IDT) on the piezoelectric substrate, surface acoustic waves were generated. These caused acoustic streaming leading to a fluid flow towards the cells under an angle of α = 21° relative to the surface normal [19].
Figure 1. (a) Computer animation of the De-Adhesion Number Investigator (DANI) setup showing the acoustic streaming in the chamber towards the substrate with adhered cells (indicated by the black dots) that is generated by the interdigital transducer (IDT) (gold, comb-like structure) (by courtesy of C. Hohmann, Nanosystems Initiative Munich (NIM)); (b) Schematic drawing of the same setup. The IDT is located on the LiNbO3 chip inside the polydimethylsiloxane (PDMS)-chamber, which holds the substrate 2 mm above the chip. The fluid flow induced by the SAW is directed towards the cell substrate under an angle of α = 21°.
2.2. Scanning Particle Image Velocimetry
We determined the average shear rate on the cells using scanning particle image velocimetry (SPIV) [20] to correlate the applied shear forces with cell detachment. In brief, SPIV is an automated acquisition and analysis approach based on the PIVlab toolkit by Thielicke [21][22][23]. It automatically scans an area larger than a single field of view and combines the multiple micro-particle image velocimetry (µPIV, for details see e.g., [24]) measurements to a single velocity field. It is able to repeat this process at several different heights and to correlate the data of the different height levels. This enables the semi-automated determination of three dimensional velocity fields in large sample areas. In this study, we added latex microbeads (diameter: 3 µm, Polybead®, Polysciences Inc, Hirschberg an der Bergstraße, Germany) as tracer particles to the fluid and recorded videos with a high-time resolution using a high-speed video camera (FASTCAM 1024PCI, Photron,
Figure 1. (a) Computer animation of the De-Adhesion Number Investigator (DANI) setup showing theacoustic streaming in the chamber towards the substrate with adhered cells (indicated by the blackdots) that is generated by the interdigital transducer (IDT) (gold, comb-like structure) (by courtesyof C. Hohmann, Nanosystems Initiative Munich (NIM)); (b) Schematic drawing of the same setup.The IDT is located on the LiNbO3 chip inside the polydimethylsiloxane (PDMS)-chamber, which holdsthe substrate 2 mm above the chip. The fluid flow induced by the SAW is directed towards the cellsubstrate under an angle of α = 21◦.
2.2. Scanning Particle Image Velocimetry
We determined the average shear rate on the cells using scanning particle image velocimetry(SPIV) [20] to correlate the applied shear forces with cell detachment. In brief, SPIV is an automatedacquisition and analysis approach based on the PIVlab toolkit by Thielicke [21–23]. It automaticallyscans an area larger than a single field of view and combines the multiple micro-particle imagevelocimetry (µPIV, for details see e.g., [24]) measurements to a single velocity field. It is able torepeat this process at several different heights and to correlate the data of the different height levels.This enables the semi-automated determination of three dimensional velocity fields in large sampleareas. In this study, we added latex microbeads (diameter: 3 µm, Polybead®, Polysciences Inc.,Hirschberg an der Bergstraße, Germany) as tracer particles to the fluid and recorded videos witha high-time resolution using a high-speed video camera (FASTCAM 1024PCI, Photron, Pfullingen,Germany). We determined the flow field in x–y direction in the plane as close as possible to the samplesurface, since this is the relevant region to appraise its influence on the cells. For our experiments,
Diagnostics 2016, 6, 38 4 of 15
we applied a power of p = 28 dBm to the IDT, which results in an average shear rate of.γ = 4314 s−1.
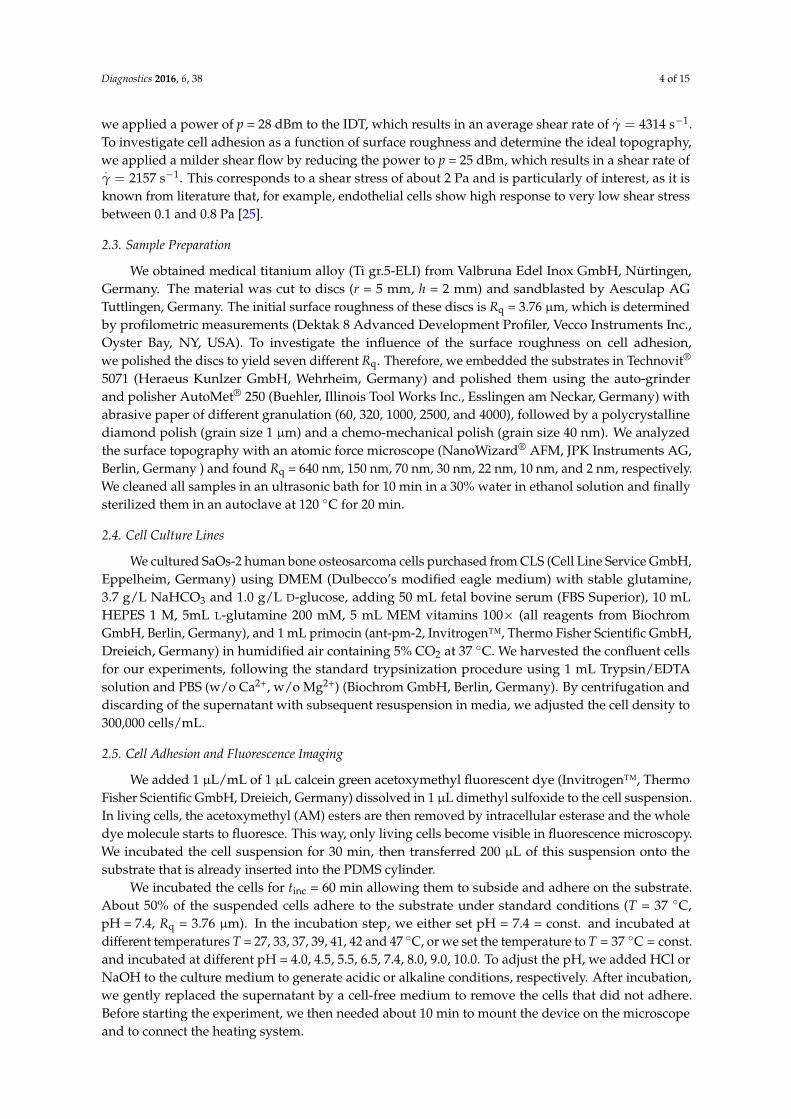
To investigate cell adhesion as a function of surface roughness and determine the ideal topography,we applied a milder shear flow by reducing the power to p = 25 dBm, which results in a shear rate of.γ = 2157 s−1. This corresponds to a shear stress of about 2 Pa and is particularly of interest, as it isknown from literature that, for example, endothelial cells show high response to very low shear stressbetween 0.1 and 0.8 Pa [25].
2.3. Sample Preparation
We obtained medical titanium alloy (Ti gr.5-ELI) from Valbruna Edel Inox GmbH, Nürtingen,Germany. The material was cut to discs (r = 5 mm, h = 2 mm) and sandblasted by Aesculap AGTuttlingen, Germany. The initial surface roughness of these discs is Rq = 3.76 µm, which is determinedby profilometric measurements (Dektak 8 Advanced Development Profiler, Vecco Instruments Inc.,Oyster Bay, NY, USA). To investigate the influence of the surface roughness on cell adhesion,we polished the discs to yield seven different Rq. Therefore, we embedded the substrates in Technovit®
5071 (Heraeus Kunlzer GmbH, Wehrheim, Germany) and polished them using the auto-grinderand polisher AutoMet® 250 (Buehler, Illinois Tool Works Inc., Esslingen am Neckar, Germany) withabrasive paper of different granulation (60, 320, 1000, 2500, and 4000), followed by a polycrystallinediamond polish (grain size 1 µm) and a chemo-mechanical polish (grain size 40 nm). We analyzedthe surface topography with an atomic force microscope (NanoWizard® AFM, JPK Instruments AG,Berlin, Germany ) and found Rq = 640 nm, 150 nm, 70 nm, 30 nm, 22 nm, 10 nm, and 2 nm, respectively.We cleaned all samples in an ultrasonic bath for 10 min in a 30% water in ethanol solution and finallysterilized them in an autoclave at 120 ◦C for 20 min.
2.4. Cell Culture Lines
We cultured SaOs-2 human bone osteosarcoma cells purchased from CLS (Cell Line Service GmbH,Eppelheim, Germany) using DMEM (Dulbecco’s modified eagle medium) with stable glutamine,3.7 g/L NaHCO3 and 1.0 g/L D-glucose, adding 50 mL fetal bovine serum (FBS Superior), 10 mLHEPES 1 M, 5mL L-glutamine 200 mM, 5 mL MEM vitamins 100× (all reagents from BiochromGmbH, Berlin, Germany), and 1 mL primocin (ant-pm-2, Invitrogen™, Thermo Fisher Scientific GmbH,Dreieich, Germany) in humidified air containing 5% CO2 at 37 ◦C. We harvested the confluent cellsfor our experiments, following the standard trypsinization procedure using 1 mL Trypsin/EDTAsolution and PBS (w/o Ca2+, w/o Mg2+) (Biochrom GmbH, Berlin, Germany). By centrifugation anddiscarding of the supernatant with subsequent resuspension in media, we adjusted the cell density to300,000 cells/mL.
2.5. Cell Adhesion and Fluorescence Imaging
We added 1 µL/mL of 1 µL calcein green acetoxymethyl fluorescent dye (Invitrogen™, ThermoFisher Scientific GmbH, Dreieich, Germany) dissolved in 1 µL dimethyl sulfoxide to the cell suspension.In living cells, the acetoxymethyl (AM) esters are then removed by intracellular esterase and the wholedye molecule starts to fluoresce. This way, only living cells become visible in fluorescence microscopy.We incubated the cell suspension for 30 min, then transferred 200 µL of this suspension onto thesubstrate that is already inserted into the PDMS cylinder.
We incubated the cells for tinc = 60 min allowing them to subside and adhere on the substrate.About 50% of the suspended cells adhere to the substrate under standard conditions (T = 37 ◦C,pH = 7.4, Rq = 3.76 µm). In the incubation step, we either set pH = 7.4 = const. and incubated atdifferent temperatures T = 27, 33, 37, 39, 41, 42 and 47 ◦C, or we set the temperature to T = 37 ◦C = const.and incubated at different pH = 4.0, 4.5, 5.5, 6.5, 7.4, 8.0, 9.0, 10.0. To adjust the pH, we added HCl orNaOH to the culture medium to generate acidic or alkaline conditions, respectively. After incubation,we gently replaced the supernatant by a cell-free medium to remove the cells that did not adhere.Before starting the experiment, we then needed about 10 min to mount the device on the microscopeand to connect the heating system.

Diagnostics 2016, 6, 38 5 of 15
Using an inverted fluorescence microscope (Axiovert 200M, Zeiss) equipped with a 2.5× objectiveand a digital camera (Orca 5G, Hamamatsu Photonics Deutschland GmbH, Herrsching am Ammersee,Germany), we observed an area of Atot = 3.48 mm × 2.65 mm = 9.22 mm2 (compare Figure 2).We recorded micrographs of the cells before applying a shear flow (static measurement, t = 0 min = t0),and one micrograph every 5 min with applied shear flow for a period of 60 min (0 ≤ ti ≤ 60 min) andquantified the amount of adhered cells as the fraction of the total field of view covered by cells
Ac,t = Acovered ·Atot (1)
The static measurement thus corresponds to the initial value of Ac,t0 = Ac,0 min.To determine Ac,t time-dependently, we converted the recorded micrographs into an 8-bit black
and white format using the software ImageJ [26]. For each experiment, we set an individual butconstant threshold to distinguish adherent cells from the background. The intensity is then invertedand the area covered with cells (black) on the free area (white) is quantified using the ImageJ particleanalysis function and correlated with the starting value Ac,t0 to determine the detached cells under flow.
Comparing the following images to this initial state, we determined the migration of cells onthe substrate (area covered with cells at ti > 0 min but not at t0) and their detachment (area coveredwith cells at t0 but not at ti > t0) time-dependently, ending up with Ac,(t = 60 min) = Ac,60 min. Figure 2visualizes this image analysis process. The magnified images show the initial and final state as well astheir superposition created with the colocalization finder macro for ImageJ [26]. In the superposition,the yellow cells remain at their positions throughout the whole experiment, while spots where cellshave been detached are labelled with red and cells that appear in the final image but not in the initialone and thus must have moved on the substrate are shown in green.
Diagnostics 2016, 6, 38 5 of 15
Before starting the experiment, we then needed about 10 min to mount the device on the microscope and to connect the heating system.
Using an inverted fluorescence microscope (Axiovert 200M, Zeiss) equipped with a 2.5× objective and a digital camera (Orca 5G, Hamamatsu Photonics Deutschland GmbH, Herrsching am Ammersee, Germany), we observed an area of Atot = 3.48 mm × 2.65 mm = 9.22 mm2 (compare Figure 2). We recorded micrographs of the cells before applying a shear flow (static measurement, =0min = ), and one micrograph every 5 min with applied shear flow for a period of 60 min (0 ≤ ≤ 60min) and quantified the amount of adhered cells as the fraction of the total field of view covered by cells
, = ∙ (1)
The static measurement thus corresponds to the initial value of , = , . To determine Ac,t time-dependently, we converted the recorded micrographs into an 8-bit black
and white format using the software ImageJ [26]. For each experiment, we set an individual but constant threshold to distinguish adherent cells from the background. The intensity is then inverted and the area covered with cells (black) on the free area (white) is quantified using the ImageJ particle analysis function and correlated with the starting value , to determine the detached cells under flow.
Comparing the following images to this initial state, we determined the migration of cells on the substrate (area covered with cells at > 0min but not at t0) and their detachment (area covered with cells at t0 but not at > ) time-dependently, ending up with , min = , . Figure 2 visualizes this image analysis process. The magnified images show the initial and final state as well as their superposition created with the colocalization finder macro for ImageJ [26]. In the superposition, the yellow cells remain at their positions throughout the whole experiment, while spots where cells have been detached are labelled with red and cells that appear in the final image but not in the initial one and thus must have moved on the substrate are shown in green.
Figure 2. Micrograph of the adhered cells on the substrate with magnification of (a) initial state at t0 = 0 min; and (b) final state at t = 60 min; (c) Superposition of both images using the colocalization finder macro for ImageJ [26]. Cells remaining fixed throughout the whole measurement are colored in yellow, detached cells are colored in red and moved or newly adhered cells are green.
3. Results and Discussion
Using DANI, we examined the de-adhesion of SaOs-2 human bone osteosarcoma cells from titanium substrates that are commonly used as implant material and investigated the cell detachment under static and dynamic conditions. First, static measurements delivered information on gravity induced cell detachment as well as artifacts like bleaching of the fluorescent dye. Second, we varied either the temperature, the pH or the surface roughness of the substrate while keeping the respective
Figure 2. Micrograph of the adhered cells on the substrate with magnification of (a) initial state att0 = 0 min; and (b) final state at t = 60 min; (c) Superposition of both images using the colocalizationfinder macro for ImageJ [26]. Cells remaining fixed throughout the whole measurement are colored inyellow, detached cells are colored in red and moved or newly adhered cells are green.
3. Results and Discussion
Using DANI, we examined the de-adhesion of SaOs-2 human bone osteosarcoma cells fromtitanium substrates that are commonly used as implant material and investigated the cell detachmentunder static and dynamic conditions. First, static measurements delivered information on gravityinduced cell detachment as well as artifacts like bleaching of the fluorescent dye. Second, we variedeither the temperature, the pH or the surface roughness of the substrate while keeping the respectiveother two parameters constant. Finally, we applied shear stress on the cells to determine its influenceon the de-adhesion under various conditions. The SAW-induced shear rate was primarily used not to

Diagnostics 2016, 6, 38 6 of 15
simulate biologic flow conditions inside the body, as we explain below, but to create a measurefor examining and characterizing the ability and strength of cell adhesion with a well-definedhydrodynamic force.
3.1. Time-Dependent Cell Detachment
We used the standard substrate with Rq = 3.76 µm to investigate the time-dependency of celladhesion under static and dynamic conditions for T = 37 ◦C and pH = 7.4.
In a first step, we determined the gravity-induced cell detachment and characterized thesystematic influence of bleaching of the fluorescence stain. Detachment of cells by gravity appears inour system since the cells adhere to the lower side of the substrate serving as a lid of our flow chamber(compare Figure 1). Thus, a fraction of the cells detaches over time by falling from the substrate.Bleaching occurs for calcein green AM since it is constantly metabolized by living cells. Due to thedecreasing fluorescence signal over time the thinner fringe areas of the cells happen to fall below theintensity threshold.
We quantify both effects by determining the cell covered area Ac,t in time steps of 5 min for upto 60 min under static conditions. We normalize Ac,ti to the initial value for the cell covered areaAc,t = 31% ± 3% and plot it over time, as shown for a typical example in Figure 3a. We find a lineardecrease of Ac,t down to Ac,60 min = 0.94 ± 0.03 * Ac,0 min meaning that gravity and bleaching result ina decrease of Ac,t of approximately 6% within 60 min. The experiments are repeated at least five timesto compensate for deviations of the initially seeded cell number and cell viability.
The results of the dynamic experiments reveal the influence of shear on cell adhesion and areplotted in Figure 3a. We also find an exponential decay for Ac,t down to Ac,60 min = (0.79 ± 0.03) *Ac,0 min. To decouple gravity and bleaching from the influence of shear, we now normalize the resultsof the dynamic experiment using the linear fit function from the static measurement as baseline (usedin all later dynamic measurements). The resulting graph (as shown exemplarily in Figure 3b) finallyshows only the cell detachment due to shear forces.
We fit an exponential function to the normalized dynamic measurement, which is given by
Ac,t = A∞ + (1− A∞) ∗ e−Rt (2)
where A represents the cell covered area for t→∞, AD : = (1− A∞) the fraction of detached cellsand R as detachment rate to determine the cell covered area Ac,t at given time t. The calibrated,shear-induced decay now leads to Ac,60 min = (0.85 ± 0.03) * Ac,0 min.
Diagnostics 2016, 6, 38 6 of 15
other two parameters constant. Finally, we applied shear stress on the cells to determine its influence on the de-adhesion under various conditions. The SAW-induced shear rate was primarily used not to simulate biologic flow conditions inside the body, as we explain below, but to create a measure for examining and characterizing the ability and strength of cell adhesion with a well-defined hydrodynamic force.
3.1. Time-Dependent Cell Detachment
We used the standard substrate with Rq = 3.76 µm to investigate the time-dependency of cell adhesion under static and dynamic conditions for T = 37 °C and pH = 7.4.
In a first step, we determined the gravity-induced cell detachment and characterized the systematic influence of bleaching of the fluorescence stain. Detachment of cells by gravity appears in our system since the cells adhere to the lower side of the substrate serving as a lid of our flow chamber (compare Figure 1). Thus, a fraction of the cells detaches over time by falling from the substrate. Bleaching occurs for calcein green AM since it is constantly metabolized by living cells. Due to the decreasing fluorescence signal over time the thinner fringe areas of the cells happen to fall below the intensity threshold.
We quantify both effects by determining the cell covered area Ac,t in time steps of 5 min for up to 60 min under static conditions. We normalize Ac,ti to the initial value for the cell covered area Ac,t = 31% ± 3% and plot it over time, as shown for a typical example in Figure 3a. We find a linear decrease of Ac,t down to Ac,60 min = 0.94 ± 0.03 * Ac,0 min meaning that gravity and bleaching result in a decrease of Ac,t of approximately 6% within 60 min. The experiments are repeated at least five times to compensate for deviations of the initially seeded cell number and cell viability.
The results of the dynamic experiments reveal the influence of shear on cell adhesion and are plotted in Figure 3a. We also find an exponential decay for Ac,t down to Ac,60 min = (0.79 ± 0.03) * Ac,0 min. To decouple gravity and bleaching from the influence of shear, we now normalize the results of the dynamic experiment using the linear fit function from the static measurement as baseline (used in all later dynamic measurements). The resulting graph (as shown exemplarily in Figure 3b) finally shows only the cell detachment due to shear forces.
We fit an exponential function to the normalized dynamic measurement, which is given by
, = 1 ∗ (2)
where A represents the cell covered area for t→∞, := 1 the fraction of detached cells and R as detachment rate to determine the cell covered area Ac,t at given time t. The calibrated, shear-induced decay now leads to Ac,60 min = (0.85 ± 0.03) * Ac,0 min.
Figure 3. (a) Cell covered area over time under static and dynamic conditions for T = 37 °C, pH = 7.4 and Rq = 3.76 µm. We fit a linear function to the static results (black line) and use it as calibration
Figure 3. (a) Cell covered area over time under static and dynamic conditions for T = 37 ◦C, pH = 7.4and Rq = 3.76 µm. We fit a linear function to the static results (black line) and use it as calibrationbaseline to decouple the shear-induced detachment from the effects of gravity and bleaching. The datapoints and error bars show the mean and standard deviation respectively from n ≥ 5 measurements;(b) Dynamic measurement from (a) normalized to the linear fit extracted from the static experiments.

Diagnostics 2016, 6, 38 7 of 15
3.2. Influence of Temperature, pH and Surface Roughness on Cell Adhesion
As mentioned above, inflammatory conditions can lead to changes in temperature and pH.Therefore, we examined in the following cell detachment under static and dynamic conditions andvary temperature, pH as well as the surface roughness. We studied their respective influence andfind the results shown in Figures 4 and 5. We individually compared the static result in terms ofthe initial adhesion Ac,0 min as well as the dynamic results in terms of the final adhesion Ac, 60 min
and the normalized final adhesion Ac,60 min/Ac,0 min as a function of temperature (Figure 5a,d,g),pH (Figure 5b,e,h) and surface roughness (Figure 5c,f,i), respectively.
• Temperature
The normal temperature of the human body is 37 ◦C and can vary from 33 ◦C during therapeutichypothermia up to 42 ◦C during high fever, which is a reaction of the body to inflammation orinfection [12]. Therefore, we chose various temperatures within and beyond this physiological range toexplore the cell adhesion and its limits. During incubation and the experiments, we set the temperatureto T = 27, 33, 37, 39, 41, 43, and 47 ◦C, respectively, while keeping the pH and surface roughnessconstant at pH = 7.4 and Rq = 3.76 µm.
The results under static conditions are shown in Figure 5a. We find an asymmetric behavior of Ac
over T with a clear maximum of Ac,0 min = 31% ± 3% for T = 37 ◦C. For lower temperatures, Ac,0 min
decreases only slightly to Ac,0 min = 26% ± 5% at T = 33 ◦C at the lower end of the physiological range.Even for a temperature as low as T = 27 ◦C, Ac,0 min = 24% ± 3% and thus about 78% of its maximumvalue at 37 ◦C, while it decreases strongly for T ≥ 37 ◦C, down to Ac,0 min = 22%± 4% for T = 41 ◦C, justbelow the upper physiological limit. A significant change can then be observed for T = 43 ◦C, wherethe cell-covered area falls to Ac,0 min = 13% ± 5% (corresponds to 32% of the maximum). The highesttemperature T = 47 ◦C only shows traces of cell adhesion with Ac,0 min = 3% ± 1%.
The results with applied shear flow for t = 60 min are shown in Figure 5d. Here we finda maximum Ac,60 min = 27% ± 3%. Low temperatures show a final adhesion of Ac,60 min = 23% ± 3%for T = 27 ◦C and Ac,60 min = 26% ± 5%. Even for 39 ◦C and 41 ◦C with Ac,60 min = 21% ± 3% andAc,60 min = 19% ± 2% there is no significantly increased detachment under shear flow. Only at hightemperatures with T ≥ 43 ◦C the final adhesion drops down to Ac,60 min = 5% ± 1%. For T = 47 ◦C noadhered cells can be found after shear flow exposure.
To compare the individual changes during shear flow exposure we normalize the time-dependentcell adhesion to the initial adhesion and show the results with applied shear flow in Figure 4. Underdynamic conditions we find an exponential decrease of the cell covered area Ac,t with time. Applyingour rate model (Equation (2)) for temperatures inside the physiological range (33 ◦C ≤ T ≤ 41 ◦C),we can calculate the detachment rate R and A∞, whereas going to extreme conditions (T = 27 ◦C andT ≥ 43 ◦C), the rate model collapses. At T = 27 ◦C we find only minor cell detachment in the beginningand an increase of cell detachment at t = 40 min as well as a final cell covered area of A∞ = 0. This isno reasonable result and is due to the flat slope and the concomitant large error of the fit. At T = 43 ◦CAc,t shows an almost linear decrease and, after t = 40 min, an abrupt decline. For T = 47 ◦C we findthe same effect but with a stronger decline and no remaining cells on the substrate for t = 60 min.The abrupt change of the detachment rate prohibits to fit Equation (2) to the data.
Thus, to be able to quantitatively discuss and classify our results of the dynamic experiments,we use the final adhesion Ac,60 min and normalized final adhesion Ac,60 min/Ac,0 min instead of A∞.Doing so, we find the maximal cell adhesion for T = 33 ◦C (Ac,60 min/Ac,0 min = 0.92 ± 0.09) andan equally high value of Ac,60 min/Ac,0 min = 0.91 ± 0.6 for T = 27 ◦C. Both values are higher thanthe one for T = 37 ◦C (Ac,60 min/Ac,0 min = 0.85 ± 0.07), although the values overlap clearly and areabout equal to Ac,60 min/Ac,0 min = 0.92 ± 0.05 for T = 39 ◦C. Obviously, temperatures just below thephysiological range and close to the normal body temperature do not have significant impact on celladhesion. However, for temperatures of T ≥ 41 ◦C, which approach the physiological limit, we finda decrease of Ac,60 min/Ac,0 min down to Ac,60 min/Ac,0 min = 0.72 ± 0.04. Here, the detachment rate is

Diagnostics 2016, 6, 38 8 of 15
increased by a factor of 1.2 compared to T = 37 ◦C. Exceeding the physiological limits (T = 43 ◦C)leads to even higher detachment rates, leaving only a fraction of 40% of the initially attached cellswith Ac,60 min/Ac,0 min = 0.45 ± 0.05 on the substrates (about half of the according value for T = 37 ◦C).For T = 47 ◦C, no cells are left on the substrate after 60 min. This behavior of Ac,60 min/Ac,0 min asfunction of temperature is qualitatively similar compared to the static measurements (see Figure 5a,g).
Diagnostics 2016, 6, 38 8 of 15
normal body temperature do not have significant impact on cell adhesion. However, for temperatures of T ≥ 41 °C, which approach the physiological limit, we find a decrease of Ac,60 min/Ac,0 min down to Ac,60
min/Ac,0 min = 0.72 ± 0.04. Here, the detachment rate is increased by a factor of 1.2 compared to T = 37 °C. Exceeding the physiological limits (T = 43 °C) leads to even higher detachment rates, leaving only a fraction of 40% of the initially attached cells with Ac,60 min/Ac,0 min = 0.45 ± 0.05 on the substrates (about half of the according value for T = 37 °C). For T = 47 °C, no cells are left on the substrate after 60 min. This behavior of Ac,60 min/Ac,0 min as function of temperature is qualitatively similar compared to the static measurements (see Figure 5a,g).
Figure 4. Temperature-dependent cell detachment with time and exponential fit for detachment rate in the physiological range of 27 °C ≤ T ≤ 39 °C.
To our best knowledge no detailed studies on temperature-dependent cell adhesion are available to date, thus, we compare our results to studies on the influence of temperature on cell viability and protein stability, which both contribute to cell adhesion. The rather small impact of temperatures below the physiological standard can be understood by the fact that cell vitality is slowed down significantly, but is not entirely interrupted. Additionally, proteins remain operational at such low temperatures. This is supported by a long-term study, which even revealed that culturing cells at lower temperatures hardly effects their proliferation [13]. Although the metabolic rates of the glucose uptake and lactate production are lowered, the growth rate at T = 33.5 °C was shown to be only 8% lower than at 37 °C [13]. Even lower cultivation temperatures of T < 30 °C have been proposed as a means to control cell proliferation [27], stating that a controlled growth rate can be used to inhibit the lactate dehydrogenase (LDH) activity which has been shown to directly affect the cell’s viability [28]. Combining these studies with our findings, we find that the minor initial cell coverage at T = 33 °C can even promote cell adhesion under flow. These studies support our assumption that small deviations in temperature from 37 °C do not affect cell adhesion.
Our experiments reveal that medium temperatures of 27 °C ≤ T ≤ 41 °C provide excellent environmental conditions for cells to adhere and withstand shear flow. The time-dependent detachment shown in Figure 4 indicates a change of the detachment behavior at higher temperatures (T ≥ 43 °C) and even total detachment after 60 min for T = 47 °C. We propose this behavior to be caused by cytotoxic effects due to the high temperatures. This conclusion is supported by medical studies on hypothermal treatment in cancer therapy, focusing on cell exposure to thermal dose [29]. Here, a dose dependency of thermal cell killing with temperature and exposure time was found. The study found nearly no changes in cell viability at T = 41 °C even after 6 h, but heat-induced cytotoxicity for T > 42.5 °C [30].
The faster cell detachment for higher temperatures (T ≥ 41 °C) can be understood by relating it to the temperature-induced denaturation of proteins at high temperatures, leading to a break of the
Figure 4. Temperature-dependent cell detachment with time and exponential fit for detachment rate inthe physiological range of 27 ◦C ≤ T ≤ 39 ◦C.
To our best knowledge no detailed studies on temperature-dependent cell adhesion are availableto date, thus, we compare our results to studies on the influence of temperature on cell viability andprotein stability, which both contribute to cell adhesion. The rather small impact of temperaturesbelow the physiological standard can be understood by the fact that cell vitality is slowed downsignificantly, but is not entirely interrupted. Additionally, proteins remain operational at such lowtemperatures. This is supported by a long-term study, which even revealed that culturing cells atlower temperatures hardly effects their proliferation [13]. Although the metabolic rates of the glucoseuptake and lactate production are lowered, the growth rate at T = 33.5 ◦C was shown to be only 8%lower than at 37 ◦C [13]. Even lower cultivation temperatures of T < 30 ◦C have been proposed asa means to control cell proliferation [27], stating that a controlled growth rate can be used to inhibit thelactate dehydrogenase (LDH) activity which has been shown to directly affect the cell’s viability [28].Combining these studies with our findings, we find that the minor initial cell coverage at T = 33 ◦C caneven promote cell adhesion under flow. These studies support our assumption that small deviations intemperature from 37 ◦C do not affect cell adhesion.
Our experiments reveal that medium temperatures of 27 ◦C ≤ T ≤ 41 ◦C provide excellentenvironmental conditions for cells to adhere and withstand shear flow. The time-dependentdetachment shown in Figure 4 indicates a change of the detachment behavior at higher temperatures(T ≥ 43 ◦C) and even total detachment after 60 min for T = 47 ◦C. We propose this behavior to becaused by cytotoxic effects due to the high temperatures. This conclusion is supported by medicalstudies on hypothermal treatment in cancer therapy, focusing on cell exposure to thermal dose [29].Here, a dose dependency of thermal cell killing with temperature and exposure time was found.The study found nearly no changes in cell viability at T = 41 ◦C even after 6 h, but heat-inducedcytotoxicity for T > 42.5 ◦C [30].
The faster cell detachment for higher temperatures (T ≥ 41 ◦C) can be understood by relatingit to the temperature-induced denaturation of proteins at high temperatures, leading to a break ofthe bonds between cell and substrate or even cell death [31]. Furthermore, thermal changes effectthe fluidity and stability of cellular membranes and impede the function of transmembrane transportproteins and cell surface receptors, leading to cytotoxic influences and eventually cell death [32]. Thus,

Diagnostics 2016, 6, 38 9 of 15
the cytotoxic effect of hyperthermia is mainly based on denaturation of cytoplasmic and membraneproteins [30]. Here, most important for cell adhesion is the thermal destruction of integrins [33] andthe cytoskeleton [34]. We finally propose the cytotoxic effect of temperature to be the reason for theabrupt increase of cell detachment over time at higher temperatures and for their complete detachmentat T = 47 ◦C.
Considering medical implants, our results suggest successful osseointegration under flowconditions for temperatures below 41 ◦C. For higher temperatures that may occur due to inflammations,cell adhesion and in turn osseointegration becomes problematic.
• pH
The physiological pH of intercellular body fluids is around pH = 7.4. Although changes between6.8 ≤ pH ≤ 7.8 may occur during infections, inflammation or medication, cells are still able to surviveunder such conditions [35]. However, in some severe infections the intercellular pH can even dropdown to pH = 6.0 [36].
In this study, we varied the pH of the nutrient medium in the range of 4.0 ≤ pH ≤ 10.0 asdescribed in the methods section while keeping the temperature and surface roughness constant atT = 37 ◦C and Rq = 3.76 µm.
Again, we find our rate model (Equation (2)) to be applicable only within the physiological rangeand use again Ac,60 min to quantify the cell adhesion under dynamic conditions.
Figure 5b displays the results for the static case in terms of Ac,0 min as a function of thepH. Qualitatively, we find an asymmetric distribution of Ac,0 min with a stronger cell detachmentfor acidic pH than in the alkaline range. A more quantitative analysis shows a maximum ofAc,0 min,max = 31% ± 3% at pH = 7.4. In the acidic direction, we observe a strong decrease at theborder of the physiological range (pH = 6.5) down to Ac,0 min = 17%± 3% = 0.54 * Ac,0 min,max . For evenlower pH, the final cell adhesion decreases strongly and we find only Ac,0 min = 4% ± 1% for pH = 4.5.As a limit of the cells’ adhesion capability, we identify pH = 4, where the cells do not adhere to thesubstrate at all. In an alkaline environment (pH = 8.0) we find Ac,0 min = 22% ± 4% = 0.7 * Ac,0 min,max .A stronger alkaline pH of 9.0 results in Ac,0 min = 11%. ± 2% = 0.35 * Ac,0 min,max and we find the limitfor cell adhesion in alkaline media to be for pH ≥ 10.
After applying shear force for a time period of 60 min we find a residual adhesion ofAc,60 min = 27% ± 3% for pH = 7.4 as depicted in Figure 5e. For the acidic environment we findAc,60 min = 15% ± 3% for pH = 6.5 and only about Ac,60 min = 3% ± 1% remaining cells at the lower endwith pH = 4.5. Deviations from ideal pH towards alkaline milieu result in stronger detachment of cells,leaving a remaining Ac,60 min = 17% ± 3% for pH = 8 and Ac,60 min = 8% ± 5% for pH = 9.
The dynamic measurements normalized to the initial adhesion (depicted in Figure 5h) indicatea shift of the maximum value of initial covered area from pH = 7.4 (Ac,60 min/Ac,0 min = 0.85 ± 0.03)to pH = 6.5 with Ac,60 min/Ac,0 min = 0.87 ± 0.07, although the standard deviation of these valuesoverlap strongly. To the alkaline side, we observe only a slight decrease of cell adhesion downto Ac,60 min/Ac,0 min = 0.79 ± 0.07 at pH = 9. In contrast, towards the acidic side, we find the celldetachment to be increased (Ac,60 min/Ac,0 min = 0.67 ± 0.09 for pH = 4.5). However, the effect of theseextreme deviations of the pH from its optimum is less pronounced than the influence of temperature.
Both our static and dynamic measurements indicate that an acidification of the environmentleads to a stronger inhibition of cell adhesion than an alkalization and that cells show much strongerresistance to pH changes even outside the physiological range compared to temperature deviations.This behavior can be explained by the cells’ strategies to regulate their intracellular pH usingion-exchange mechanisms [37]. The main challenge faced by pH regulatory mechanisms is torelieve the cell of excess protons, originating from accumulation of metabolically generated acids andfrom passive diffusion of H+ into the cell due to the internally negative membrane potential [38].Therefore, cells have evolved several methods for pH regulation, e.g., Na+/H+ antiporters andNa+ dependent HCO3
−/Cl− exchanger for acidic regulation, as well as the Na+ independentHCO3
−/Cl− exchanger in alkaline pH [39]. It is expected that the cell metabolism is affected by

Diagnostics 2016, 6, 38 10 of 15
intracellular (cytoplasmic) pH, which is influenced by Na+/H+ exchangers acting on the enzymephosphofructokinase, the rate-controlling enzyme in the glycolytic pathway. Irreversible cytoplasmicacidification starts at pH 6.8 and below as here the pH leads to an enzyme inactivity [38] and a decreasein adhesion molecule expression which is responsible for unspecific binding processes [40].
Regarding our results, we consider these pH regulations to be active in the physiological range,as we can find the strongest cell adhesion for pH = 7.4. Under static conditions, we find Ac,0 min
decreasing as the expression of adhesion molecules will decline. Nevertheless, the unspecific bindingmechanisms are still able to withstand shear flow.
A study conducted by Serrano et al. [40] investigated the pH-dependency of adhesion moleculeexpression on endothelial cells under static conditions with 6.5 ≤ pH ≤ 8.4. They find vascularcell adhesion molecule expression to not exhibit a pH-dependency, whereas a strong decrease ofintercellular adhesion molecules, responsible for specific binding, exists with pH deviations from 7.4.As we focus on cell-substrate interactions, these results confirm our findings for non-specific binding.Therefore, we can state that cell adhesion for small changes in pH is hardly affected, as in this rangethe pH regulating mechanism are active.
Concerning cell adhesion of human cell lines under dynamic conditions, there exist no otherstudies focusing on the influence of pH variations. However, our results are in good qualitativeagreement with Crouch et al. [41], who studied the effect of pH on the adhesion of baby hamsterkidney (BHK) cells to glass under static conditions, finding the strongest adhesive force at pH = 7.6and a similar trend with pH as in our experiments.
A long term observation of the cells in our actual approach is not possible, due to the bleaching ofthe Calcein Green. In future studies, using green fluorescent protein (GFP)-transfected cell lines mayopen new possibilities and allow for studies of long term reaction of cells to extreme pH under flow.
• Surface Roughness
Apart from temperature and pH, surface roughness is an important factor for controlling celladhesion, especially for a desired rapid and successful osseointegration of implants and their long-termstability. Bone bioactivity involves physicochemical surface reactions and cellular mechanisms.The surface composition and structure of bones influence the kinetics of protein adsorption, leading tobond formation and spreading [42]. Thus, the surface morphology obviously impacts cell adhesion.We here analyze the role of surface roughness on cell adhesion by preparing a set of samples of differentsurface roughness as described in the methods section. In these experiments, the temperature and pHwere kept constant at T = 37 ◦C and pH = 7.4 for all samples.
Figure 5c shows the influence of the surface roughness on the initial cell adhesion under staticconditions. A maximum in cell density (Ac,0 min = 31% ± 3%), is reached at the sandblasted surfaceroughness of Rq = 3.76 µm, whereas the use of polished surfaces leads to lower cell adhesion ofAc,0min ≈ 15%, nearly independent of the surface roughness.
In contrast, under dynamic conditions, Ac,60 min shows a maximum of adherent cells at Rq = 22 nm(Ac,0 min,max = 14% ± 4%) as can be seen in Figure 5f and therefore a remaining fraction ofAc,60 min/Ac,0 min = 0.96 ± 0.04 normalized to the initial adhesion (see Figure 5i). Above and belowthis value, we find a decrease of Ac,60 min. However, we still find Ac,60 min = 8% ± 7% and respectivelyAc,60 min/Ac,0 min = 0.84 ± 0.08 for the smoothest surface with Rq = 2 nm. Eying the rough surfaces,we find a decline in remaining cells with increasing roughness with a minimum for Rq = 640 nmwith Ac,60 min = 10% ± 3% and respectively Ac,60 min/Ac,0 min = 0.68 ± 0.12 = (0.8 ± 0.14) * Ac,0 min,max.For the untreated standard sample with Rq = 3.76 µm the maximum in adhered cells can be found againwith Ac,60 min = 27% ± 3%. Although normalized to the initial adhesion, the detachment increases toAc,60 min/Ac,0 min = 0.85 ± 0.03 =(0.90 ± 0.03) * Ac,0 min,max and therefore shows a medium adhesionbehavior compared to all substrates.
The reason for this behavior can be found in the interactions of cells with the substrates thatare mediated by subcellular microstructures resulting in focal attachment [43]. The focal contacts areanchored in the cell’s cytoskeleton and permit the cell to bind to an extracellular matrix via integrin [44].

Diagnostics 2016, 6, 38 11 of 15
For high rates of integrin binding, these focal contacts are of a certain length to efficiently promoteadhesion and a maximum contact area of the cell with the substrate [6]. Additionally, cells align withthe substrate’s topography in a way to minimize distortions of their cytoskeleton [45]. Therefore,variations in the substrate’s microtopography directly affect the cellular adhesion to an implant.However, the preferred roughness varies between different cell lines. Osteoblast-like cells attachedbetter to rougher surfaces, whereas fibroblasts prefered smoother surfaces [44]. We here find thatSaOs-2 cells show an osteoblast-like behavior with a local maximum at Rq = 22 nm.
Diagnostics 2016, 6, 38 11 of 15
promote adhesion and a maximum contact area of the cell with the substrate [6]. Additionally, cells align with the substrate’s topography in a way to minimize distortions of their cytoskeleton [45]. Therefore, variations in the substrate’s microtopography directly affect the cellular adhesion to an implant. However, the preferred roughness varies between different cell lines. Osteoblast-like cells attached better to rougher surfaces, whereas fibroblasts prefered smoother surfaces [44]. We here find that SaOs-2 cells show an osteoblast-like behavior with a local maximum at Rq = 22 nm.
Figure 5. Percentage of area covered with cells after an incubation time of 60 min under standard culture conditions but for different temperatures (a), pH (b) and surface roughness (c); Physiological standard conditions of T= 37 °C and pH = 7.4 show the highest adhesion Ac,0 min while increasing roughness leads to higher Ac,0 min. After applying shear flow for 60 min cell detach leading to a remaining adhesion Ac,60 min for different temperatures (d), pH (e) and surface roughness (f). While the effect of low temperatures hardly effect the cells, high temperatures and deviations from pH = 7.4 lead to strong detachment. For the influence of the topography, a peak in cell adhesion appears for Rq = 22 nm, although the highest final adhesion can be found for Rq = 3.76 µm. Ac,60 min/Ac,0 min denotes the fraction of the field of view that is covered with cells after 60 min exposure to shear flow. Similar to static conditions, the influence of temperature (g), and pH (h) inside the physiological range changes Ac,60 min/Ac,0 min only slightly, whereas high temperatures and low pH exhibit a strong effect; Ac,60 min/Ac,0
min as a function of surface roughness (i) shows a maximum at Rq = 22 nm. The data points and error bars show the mean and standard deviation respectively from n ≥ 5 measurements and the dashed lines are guides to the eye.
Figure 5. Percentage of area covered with cells after an incubation time of 60 min under standard cultureconditions but for different temperatures (a), pH (b) and surface roughness (c); Physiological standardconditions of T = 37 ◦C and pH = 7.4 show the highest adhesion Ac,0 min while increasing roughnessleads to higher Ac,0 min. After applying shear flow for 60 min cell detach leading to a remainingadhesion Ac,60 min for different temperatures (d), pH (e) and surface roughness (f). While the effectof low temperatures hardly effect the cells, high temperatures and deviations from pH = 7.4 lead tostrong detachment. For the influence of the topography, a peak in cell adhesion appears for Rq = 22 nm,although the highest final adhesion can be found for Rq = 3.76 µm. Ac,60 min/Ac,0 min denotes thefraction of the field of view that is covered with cells after 60 min exposure to shear flow. Similarto static conditions, the influence of temperature (g), and pH (h) inside the physiological rangechanges Ac,60 min/Ac,0 min only slightly, whereas high temperatures and low pH exhibit a strong effect;Ac,60 min/Ac,0 min as a function of surface roughness (i) shows a maximum at Rq = 22 nm. The datapoints and error bars show the mean and standard deviation respectively from n ≥ 5 measurementsand the dashed lines are guides to the eye.

Diagnostics 2016, 6, 38 12 of 15
We compare our results to Huang et al. [46], who studied the adhesion of osteoblast-like cellsunder static conditions on a similar set of surfaces. They find that the cell attachment is highlyinfluenced by surface roughness in the range of 50 nm ≤ Ra ≤ 1.20 µm, with Ra = 150 nm showingthe best cell adhesion and spreading compared to smoother (Ra ≤ 70 nm) or rougher (Ra ≥ 330 nm)substrates. We, too, see a strong increase in cell adhesion with increasing roughness up to Rq = 150 nm,but no further increase for 640 nm. Therefore, we conclude that an appropriate surface roughness canproduce beneficial mechanical interlocking at the initial adhesion stage and foster further cell adhesionwith its ideal spacing at Rq = 150 nm [47].
In contrast, under dynamic conditions we find increased detachment with increasing surfaceroughness Rq. This observation can be explained by shear flow-induced activation of focal adhesions,leading to an enhancement of stress fibers [7]. Integrin receptors function as mechano-sensors andinduce an activation on signaling proteins which act on the cytoskeletal anchorage [48]. It has beenreported that surface topography correlates with binding of focal adhesion and thus formation ofstress fibers. Ideal spacing for focal contacts was found to be 30 nm [6], which is in good agreementwith our results that show maximal cell adhesion under dynamic conditions for Rq = 22 ± 5 nm.Along the same lines, we compare our results to the ones reported by Cavalcanti-Adam et al. [49],who used nano-patterned surfaces to investigate the influence of ligand spacing to cell adhesion understatic conditions. They found the initial attachment of cells to be independent of the surface, but forthe formation of stable focal adhesion and persistent spreading they found a critical ligand density(interligand spacing < 70 nm). Our findings indicate that we see a similar effect, although we arevarying the sample topography and not the ligand density.
Combining those results, we conclude that surface roughness in the range of filopodia size(≈70 nm) should offer the highest adhesion strength under dynamic conditions for relatively smoothsurfaces. For increased surface roughness in the range of several microns, additional effects likeshielding may appear. These results indicate that if for other reasons smooth implant surfaces arenecessary, the roughness should be designed to be in the range of 22 ± 5 nm to offer good premisesfor osseointegration.
The existence of an optimum is intuitively plausible: a smooth, polished surface does not provideany contact points for a cell to form strong bonds, while a very uneven profile requires strong bendingof the cell’s membrane to attain a large contact area. A moderate roughness could comply with injuredtissue as small fractures in bone material, where growth and adhesion of bone cells is essential.
Based on these findings we claim that the introduced method by characterization of cell adhesionusing shear flow could be used as an indicator for the examination of novel materials regarding theirability for osseointegration. Of course, this needs in-depth studies to correlate cell adhesion in vitrounder flow with in vivo studies of the same materials. In this sense, our data on titanium implantswould predict sufficient osteoblastic cell adhesion even when exposed to deviations from standardbody conditions but inside the physiological possible range. A direct conclusion from the resultspresented here on cells in intraosseous blood flow cannot be drawn. To our best knowledge thereis a lack of reports in literature on appearing intraosseous blood flow conditions regarding vesselgeometry and flow rates. The best information on this is reported for overall intraosseous flow rates inanimal tissue per mass [50–52]. Thus, a precise estimation of acting hydrodynamic shear forces onosteoblasts in vivo cannot be given to date.
4. Conclusions and Outlook
Summing up, our static experiments show the strongest adhesion of SaOs-2 cells on titaniumsubstrates with Rq = 3.76 µm under physiological standard conditions of T = 37 ◦C and pH = 7.4.Applying shear flow reveals an even more pronounced decrease of cell adhesion for deviations fromthese conditions. High temperatures and low pH are especially critical. Under extreme conditions wefind our rate model collapses due to cell death during the experiment. Regarding surface roughness,we found a local optimum of adhesion at an average roughness of Rq = 22 nm. Future studies should

Diagnostics 2016, 6, 38 13 of 15
also account for the influence of cell density on the de-adhesion rate, since, for example, cells areshielded from the flow by cells positioned further upstream or adhesive forces between cells mayappear. A quantitative correlation between local shear rates and time-dependent detachment of cellsmight give further insight into the shear sensitivity of arbitrary cell-substrate-combinations. Interestingsystems thereby include novel metal ion releasing implant materials [53] and osteoblasts. On the otherhand, cell biologists may apply the DANI-setup to study the internal response of adaptive processesof adherent cells to shear flow. Such processes are, for example, the mobility of adhesive bridges,the creation of reactive oxygen species, the structure and the orientation of the cytoskeleton as wellas gene expression. A comparison of the results with in vivo experiments could then highlight thebiological relevance of such studies.
Acknowledgments: The authors thank the “Deutsche Forschungsgemeinschaft (DFG)” for the financial supportof this work by means of the “Erkenntnistransferprojekt antibakterielle und abriebarme Beschichtung vonGleitflächen in orthopädischen Implantaten”. We thank Matthias F. Schneider for fruitful discussions as well asRoland Marstatt, Sidonie Lieber and Andreas Spörhase for technical assistance. Furthermore, M.E.M.S. thanksthe Bayerische Forschungsallianz and A.M.J. the University of Augsburg (Programm zur Chancengleichheit fürFrauen in Forschung und Lehre) for funding. We acknowledge funding by Nanosystems Initiative Munich (NIM)and the Center for NanoScience (CeNS).
Author Contributions: Melanie E. M. Stamp, Achim Wixforth and Christoph Westerhausen conceivedand designed the experiments; Thomas M. Geislinger, Anna M. Jötten, Dominik Breyer, Florian G. Strobl,Patrick W. Kudella and Melanie E. M. Stamp performed the experiments; Thomas M. Geislinger, Anna M. Jötten,Patrick W. Kudella, Melanie E. M. Stamp and Christoph Westerhausen analyzed the data; Thomas M. Geislinger,Anna M. Jötten, Melanie E. M. Stamp, Achim Wixforth and Christoph Westerhausen wrote the paper.
Conflicts of Interest: The authors declare no conflict of interest.
Abbreviations
The following abbreviations are used in this manuscript:
DANI De-Adhesion Number InvestigatorSPIV scanning Particle Image VelocimetrySAW Surface Acoustic WavesIDT Inter Digital Transducer
References
1. OECD Indicators. Health at a Glance 2015; OECD Publishing: Paris, France, 2015.2. Kurtz, S.; Ong, K.; Lau, E.; Mowat, F.; Halpern, M. Projections of Primary and Revision Hip and Knee
Arthroplasty in the United States from 2005 to 2030. J. Bone Jt. Surg. 2007, 89, 780–785. [CrossRef] [PubMed]3. Anselme, K.; Bigerelle, M.; Noel, B.; Dufresne, E.; Judas, D.; Iost, A.; Hardouin, P. Qualitative and quantitative
study of human osteoblast adhesion on materials with various surface roughnesses. J. Biomed. Mater. Res.2000, 49, 155–166. [CrossRef]
4. Anselme, K. Osteoblast adhesion on biomaterials. Biomaterials 2000, 21, 667–681. [CrossRef]5. Khalili, A.; Ahmad, M. A Review of Cell Adhesion Studies for Biomedical and Biological Applications. Int. J.
Mol. Sci. 2015, 16, 18149–18184. [CrossRef] [PubMed]6. Burridge, K. Focal Adhesions: Transmembrane Junctions between the Extracellular Matrix and the
Cytoskeleton. Annu. Rev. Cell Dev. Biol. 1988, 4, 487–525. [CrossRef] [PubMed]7. Shyy, J.Y.J.; Chien, S. Role of integrins in endothelial mechanosensing of shear stress. Circ. Res. 2002, 91,
769–775. [CrossRef] [PubMed]8. Pellegrin, S.; Mellor, H. Actin stress fibres. J. Cell Sci. 2007, 120, 3491–3499. [CrossRef] [PubMed]9. Nine, M.J.; Choudhury, D.; Hee, A.C.; Mootanah, R.; Osman, N.A.A. Wear Debris Characterization and
Corresponding Biological Response: Artificial Hip and Knee Joints. Materials 2014, 7, 980–1016. [CrossRef]10. Hirashima, Y.; Ishiguro, N.; Kondo, S.; Iwata, H. Osteoclast induction from bone marrow cells is due to
pro-inflammatory mediators from macrophages exposed to polyethylene particles: A possible mechanism ofosteolysis in failed THA. J. Biomed. Mater. Res. 2001, 56, 177–183. [CrossRef]
11. Pye, A.D.; Lockhart, D.E.A.; Dawson, M.P.; Murray, C.A.; Smith, A.J. A review of dental implants andinfection. J. Hosp. Infect. 2009, 72, 104–110. [CrossRef] [PubMed]

Diagnostics 2016, 6, 38 14 of 15
12. Physiologie des Menschen, 22nd ed.; Schmidt, R.F.; Thews, G., Eds.; Springer: Berlin/Heidelberg,Germany, 1997.
13. Ducommun, P.; Ruffieux, P.-A.; Kadouri, A.; von Stockar, U.; Marison, I. W. Monitoring of temperatureeffects on animal cell metabolism in a packed bed process. Biotechnol. Bioeng. 2002, 77, 838–842. [CrossRef][PubMed]
14. Weiss, L. Cell contact phenomena. In Vitro 1970, 5, 48–78. [CrossRef] [PubMed]15. Usami, S.; Chen, H.-H.; Zhao, Y.; Chien, S.; Skalak, R. Design and construction of a linear shear stress flow
chamber. Ann. Biomed. Eng. 1993, 21, 77–83. [CrossRef] [PubMed]16. Bussonnière, A.; Miron, Y.; Baudoin, M.; Bou Matar, O.; Grandbois, M.; Charette, P.; Renaudin, A. Cell
detachment and label-free cell sorting using modulated surface acoustic waves (SAWs) in droplet-basedmicrofluidics. Lab Chip 2014, 14, 3556–3563. [CrossRef] [PubMed]
17. Stamp, M.E.M.; Brugger, M.S.; Wixforth, A.; Westerhausen, C. Acoustotaxis—In vitro stimulation in a woundhealing assay employing surface acoustic waves. Biomater. Sci. 2016, 4, 1092–1099. [CrossRef] [PubMed]
18. Hartmann, A.; Stamp, M.; Kmeth, R.; Buchegger, S.; Stritzker, B.; Saldamli, B.; Burgkart, R.; Schneider, M.F.;Wixforth, A. A novel tool for dynamic cell adhesion studies—The De-Adhesion Number Investigator DANI.Lab Chip 2014, 14, 542–546. [CrossRef] [PubMed]
19. Frommelt, T.; Gogel, D.; Kostur, M.; Talkner, P.; Hänggi, P. Flow Patterns and Transport in Rayleigh SurfaceAcoustic Wave Streaming: Combined Finite Element Method and Raytracing Numerics versus Experiments.IEEE Trans. Ultrason. Ferroelectr. Freq. Control 2008, 55, 2298–2305. [CrossRef] [PubMed]
20. Strobl, F.G.; Breyer, D.; Link, P.; Torrano, A.A.; Brauchle, C.; Schneider, M.F.; Wixforth, A. A surface acousticwave-driven micropump for particle uptake investigation under physiological flow conditions in very smallvolumes. Beilstein J. Nanotechnol. 2015, 6, 414–419. [CrossRef] [PubMed]
21. Thielicke, W.; Stamhuis, E.J. PIVlab—Towards User-friendly, Affordable and Accurate Digital Particle ImageVelocimetry in MATLAB. J. Open Res. Softw. 2014, 2, e30. [CrossRef]
22. Thielicke, W.; Stamhuis, E.J. PIVlab—Time-Resolved Digital Particle Image Velocimetry Tool for MATLAB(Version: 1.4). 2015. Available online: http://pivlab.blogspot.com/ (accessed on 19 October 2016).
23. Thielicke, W. The Flapping Flight of Birds—Analysis and Application. Ph.D. Thesis, Rijksuniversiteit,Groningen, The Netherlands, 2014.
24. Lindken, R.; Rossi, M.; Große, S.; Westerweel, J. Micro-Particle Image Velocimetry (µPIV): Recentdevelopments, applications, and guidelines. Lab Chip 2009, 9, 2551–2567. [CrossRef] [PubMed]
25. Davies, P.F.; Dewey, C.F.; Bussolari, S.R.; Gordon, E.J.; Gimbrone, M.A. Influence of hemodynamic forceson vascular endothelial function. In vitro studies of shear stress and pinocytosis in bovine aortic cells.J. Clin. Investig. 1984, 73, 1121–1129. [CrossRef] [PubMed]
26. Schneider, C.A.; Rasband, W.S.; Eliceiri, K.W. NIH Image to ImageJ: 25 years of image analysis. Nat. Methods2012, 9, 671–675. [CrossRef] [PubMed]
27. Kaufmann, H.; Mazur, X.; Fussenegger, M.; Bailey, J.E. Influence of low temperature on productivity,proteome and protein phosphorylation of CHO cells. Biotechnol. Bioeng. 1999, 63, 573–582. [CrossRef]
28. Goergen, J.L.; Marc, A.; Engasser, J.M. Determination of cell lysis and death kinetics in continuous hybridomacultures from the measurement of lactate dehydrogenase release. Cytotechnology 1993, 11, 189–195. [CrossRef][PubMed]
29. Wust, P.; Rau, B.; Gellermann, J.; Pegios, W.; Löffel, J.; Riess, H.; Felix, R.; Schlag, P.M. Radiochemotherapyand Hyperthermia in the Treatment of Rectal Cancer. Recent Results Cancer Res. 1998, 146, 175–191. [PubMed]
30. Hildebrandt, B.; Wust, P.; Ahlers, O.; Dieing, A.; Sreenivasa, G.; Kerner, T.; Felix, R.; Riess, H. The cellularand molecular basis of hyperthermia. Crit. Rev. Oncol. Hematol. 2002, 43, 33–56. [CrossRef]
31. Holme, T.A. Denaturation. Available online: http://www.encyclopedia.com/topic/denaturation.aspx(accessed on 21 July 2016).
32. Konings, A.W.T.; Ruifrok, A.C.C. Role of Membrane Lipids and Membrane Fluidity in Thermosensitivityand Thermotolerance of Mammalian Cells. Radiat. Res. 1985, 102, 86–98. [CrossRef] [PubMed]
33. Majda, J.A.; Gerner, E.W.; Vanlandingham, B.; Gehlsen, K.R.; Cress, A.E. Heat Shock-Induced Sheddingof Cell Surface Integrins in A549 Human Lung Tumor Cells in Culture. Exp. Cell Res. 1994, 210, 46–51.[CrossRef] [PubMed]
34. Coss, R.A.; Linnemans, W.A.M. The effects of hyperthermia on the cytoskeleton: A review. Int. J. Hyperth.1996, 12, 173–196. [CrossRef]

Diagnostics 2016, 6, 38 15 of 15
35. Allgemeine und spezielle Pharmakologie und Toxikologie, 7th ed.; Forth, W.; Henschler, D.; Rummel, W.;Starke, K., Eds.; Elsevier: Berlin, Germany, 1996. (In German)
36. Punnia-Moorthy, A. Evaluation of pH changes in inflammation of the subcutaneous air pouch lining inthe rat, induced by carrageenan, dextran and staphylococcus aureus. J. Oral Pathol. Med. 1987, 16, 36–44.[CrossRef] [PubMed]
37. McQueen, A.; Bailey, J.E. Effect of ammonium ion and extracellular pH of hybridoma cell metabolism andantibody production. Biotechnol. Bioeng. 1990, 35, 1067–1077. [CrossRef] [PubMed]
38. Tannock, I.; Rotin, D. Acid pH in tumors and its potential for therapeutic exploitation. Cancer Res. 1989, 49,4373–4384. [PubMed]
39. Modenaar, H. Effects of growth factors on intracellular pH regulation. Annu. Rev. Physiol. 1986, 48, 363–376.40. Serrano, C.V.; Fraticelli, A.; Paniccia, R.; Teti, A.; Noble, B.; Corda, S.; Faraggiana, T.; Ziegelstein, R.C.;
Zweier, J.L.; Capogrossi, M.C. pH dependence of neutrophil-endothelial cell adhesion and adhesion moleculeexpression. Am. J. Physiol. 1996, 271, C962–C970. [PubMed]
41. Crouch, C.F.; Fowler, H.W.; Spier, R.E. The adhesion of animal cells to surfaces: The measurement of criticalsurface shear stress permitting attachment or causing detachment. J. Chem. Technol. Biotechnol. Biotechnol.1985, 35, 273–281. [CrossRef]
42. Deligianni, D.D.; Katsala, N.D.; Koutsoukos, P.G.; Missirlis, Y.F. Effect of surface roughness of hydroxyapatiteon human bone marrow cell adhesion, proliferation, differentiation and detachment strength. Biomaterials2000, 22, 87–96. [CrossRef]
43. Meyle, J.; Gültig, K.; Wolburg, H.; von Recum, A.F. Fibroblast anchorage to microtextured surfaces. J. Biomed.Mater. Res. 1993, 27, 1553–1557. [CrossRef] [PubMed]
44. Boyan, B. Role of material surfaces in regulating bone and cartilage cell response. Biomaterials 1996, 17,137–146. [CrossRef]
45. Oakley, C.; Brunette, D.M. The sequence of alignment of microtubules, focal contacts and actin filaments infibroblasts spreading on smooth and grooved titanium substrata. J. Cell Sci. 1993, 106, 343–354. [PubMed]
46. Huang, H.H.; Ho, C.T.; Lee, T.H.; Lee, T.L.; Liao, K.K.; Chen, F.L. Effect of surface roughness of groundtitanium on initial cell adhesion. Biomol. Eng. 2004, 21, 93–97. [CrossRef] [PubMed]
47. Den Braber, E.T.; de Ruijter, J.E.; Smits, H.T.J.; Ginsel, L.A.; von Recum, A.F.; Jansen, J.A. Quantitative analysisof cell proliferation and orientation on substrata with uniform parallel surface micro-grooves. Biomaterials1996, 17, 1093–1099. [CrossRef]
48. Schmidt, C. Mechanical Stressing of Integrin Receptors Induces Enhanced Tyrosine Phosphorylation ofCytoskeletally Anchored Proteins. J. Biol. Chem. 1998, 273, 5081–5085. [CrossRef] [PubMed]
49. Cavalcanti-Adam, E.A.; Volberg, T.; Micoulet, A.; Kessler, H.; Geiger, B.; Spatz, J.P. Cell Spreading andFocal Adhesion Dynamics Are Regulated by Spacing of Integrin Ligands. Biophys. J. 2007, 92, 2964–2974.[CrossRef] [PubMed]
50. Heitmann, S. Messung des Intraossealen Blutflusses zur Bestimmung der Klärfunktion im Gesunden und imHeilenden Knochen Mittels Laser- Dopplerflussmessung im Kaninchenmodell. Ph.D. Thesis, TierärztlicheHochschule Hannover, Hannover, Germany, 2008. (In German)
51. Laroche, M. Intraosseous circulation from physiology to disease. Jt. Bone Spine 2002, 69, 262–269. [CrossRef]52. Cowin, S.C.; Cardoso, L. Blood and interstitial flow in the hierarchical pore space architecture of bone tissue.
J. Biomech. 2015, 48, 842–854. [CrossRef] [PubMed]53. Buchegger, S.; Vogel, C.; Herrmann, R.; Stritzker, B.; Wixforth, A.; Westerhausen, C. Antibacterial metal
ion release from diamond-like carbon modified surfaces for novel multifunctional implant materials.J. Mater. Res. 2016, 31, 2571–2577. [CrossRef]
© 2016 by the authors; licensee MDPI, Basel, Switzerland. This article is an open accessarticle distributed under the terms and conditions of the Creative Commons Attribution(CC-BY) license (http://creativecommons.org/licenses/by/4.0/).