Exploring high-dimensional data space: Identifying optimal process conditions in photovoltaics
8
NREL is a national laboratory of the U.S. Department of Energy, Office of Energy Efficiency & Renewable Energy, operated by the Alliance for Sustainable Energy, LLC. Contract No. DE-AC36-08GO28308 Exploring High-Dimensional Data Space: Identifying Optimal Process Conditions in Photovoltaics Preprint Changwon Suh, Stephen Glynn, John Scharf, Miguel A. Contreras, Rommel Noufi, and Wesley B. Jones National Renewable Energy Laboratory David Biagioni University of Colorado, Boulder Presented at the 37 th IEEE Photovoltaic Specialists Conference (PVSC 37) Seattle, Washington June 19-24, 2011 Conference Paper NREL/CP-2C00-50693 July 2011
-
Upload
independent -
Category
Documents
-
view
0 -
download
0
Transcript of Exploring high-dimensional data space: Identifying optimal process conditions in photovoltaics

NREL is a national laboratory of the U.S. Department of Energy, Office of Energy Efficiency & Renewable Energy, operated by the Alliance for Sustainable Energy, LLC.
Contract No. DE-AC36-08GO28308
Exploring High-Dimensional Data Space: Identifying Optimal Process Conditions in Photovoltaics Preprint Changwon Suh, Stephen Glynn, John Scharf, Miguel A. Contreras, Rommel Noufi, and Wesley B. Jones National Renewable Energy Laboratory
David Biagioni University of Colorado, Boulder
Presented at the 37th IEEE Photovoltaic Specialists Conference (PVSC 37) Seattle, Washington June 19-24, 2011
Conference Paper NREL/CP-2C00-50693 July 2011

NOTICE
The submitted manuscript has been offered by an employee of the Alliance for Sustainable Energy, LLC (Alliance), a contractor of the US Government under Contract No. DE-AC36-08GO28308. Accordingly, the US Government and Alliance retain a nonexclusive royalty-free license to publish or reproduce the published form of this contribution, or allow others to do so, for US Government purposes.
This report was prepared as an account of work sponsored by an agency of the United States government. Neither the United States government nor any agency thereof, nor any of their employees, makes any warranty, express or implied, or assumes any legal liability or responsibility for the accuracy, completeness, or usefulness of any information, apparatus, product, or process disclosed, or represents that its use would not infringe privately owned rights. Reference herein to any specific commercial product, process, or service by trade name, trademark, manufacturer, or otherwise does not necessarily constitute or imply its endorsement, recommendation, or favoring by the United States government or any agency thereof. The views and opinions of authors expressed herein do not necessarily state or reflect those of the United States government or any agency thereof.
Available electronically at http://www.osti.gov/bridge
Available for a processing fee to U.S. Department of Energy and its contractors, in paper, from:
U.S. Department of Energy Office of Scientific and Technical Information
P.O. Box 62 Oak Ridge, TN 37831-0062 phone: 865.576.8401 fax: 865.576.5728 email: mailto:[email protected]
Available for sale to the public, in paper, from:
U.S. Department of Commerce National Technical Information Service 5285 Port Royal Road Springfield, VA 22161 phone: 800.553.6847 fax: 703.605.6900 email: [email protected] online ordering: http://www.ntis.gov/help/ordermethods.aspx
Cover Photos: (left to right) PIX 16416, PIX 17423, PIX 16560, PIX 17613, PIX 17436, PIX 17721
Printed on paper containing at least 50% wastepaper, including 10% post consumer waste.

1
EXPLORING HIGH-DIMENSIONAL DATA SPACE: IDENTIFYING OPTIMAL PROCESS CONDITIONS IN PHOTOVOLTAICS
Changwon Suh1, David Biagioni2, Stephen Glynn1, John Scharf1, Miguel A. Contreras1, Rommel Noufi1, and Wesley B. Jones1
1National Renewable Energy Laboratory, 1617 Cole Blvd., Golden, CO 80401, United States 2Department of Applied Mathematics, University of Colorado, Boulder, CO 80309, United States
ABSTRACT
We demonstrate how advanced exploratory data analysis coupled to data-mining techniques can be used to scrutinize the high-dimensional data space of photovoltaics in the context of thin films of Al-doped ZnO (AZO), which are essential materials as a transparent conducting oxide (TCO) layer in CuInxGa1-xSe2 (CIGS) solar cells. AZO data space, wherein each sample is synthesized from a different process history and assessed with various characterizations, is transformed, reorganized, and visualized in order to extract optimal process conditions. The data-analysis methods used include parallel coordinates, diffusion maps, and hierarchical agglomerative clustering algorithms combined with diffusion map embedding.
INTRODUCTION
Recent advances in wide variety of synthetic routes and characterizations in photovoltaics (PV) have created a critical need to understand complex synthesis/growth-mechanism relationships in terms of process-property-performance relationships (PPPRs.) Inherent in this process is dealing with the high-dimensional (i.e., having myriad variables) PV data space, which creates greater challenges for visualizing and exploring such relationships.
In TCO development, for instance, process parameters in sputtering processes include multiple film growth conditions such as target composition, substrate temperature, and atmosphere of the chamber. Characterizing TCOs as a baseline mainly involves various structural, transport, and optical parameters termed as primary descriptors, which often comprise thickness of structure, Hall measurement for transport mechanisms, and analysis such as refractive index/extinction coefficient for the materials’ optical responses. Further advanced analysis for a more physical interpretation can be performed with other metrology tools such as photoluminescence.
On the other hand, it is common that the information from the above-mentioned characterizations performed independently is not sufficient to fully understand growth mechanisms in terms of synthesis history. For this reason, it is often necessary to include non-measurable characteristics such as structural disorder or figures of merit, which are termed secondary descriptors. Here, the secondary descriptors are combinations achieved through
mathematical and theoretical transformations of the primary descriptors.
Therefore, it is highly desirable to develop tools for high-dimensional data explorations, merging process conditions, various characterization data, and properties to gain a complete insight into physical phenomena such as growth mechanisms of complex PV materials. Augmenting this type of knowledge could inform a functional understanding of PV materials in terms of targeted properties, optimize process controls for desired performance, and contribute to shifting the current PV manufacturing industry to implementing better low-cost materials and processes.
In this paper, we demonstrate approaches to exploring PV data in a more meaningful way for better PV design. This is done in the context of a case study on the data of AZO films generated from different process histories involving sputtering methods.
EXPERIMENTAL
An example of the challenges faced in PV research is the development of the CIGS solar cell. The immediate goal of CIGS device designers is to achieve bench-scale results (~20% efficiency), but increasing the efficiency of CIGS is difficult based on the complexity of its multiple layers. Therefore, it is critical to use components of the PPPRs for each layer—from the molybdenum back contact to the AZO transparent front contact—and fuse them together for an entire device. An AZO layer with its superior optical and electric properties is a key component as the TCO layer for CIGS. The multiple requirements for good AZO, based on a 20%-efficient CIGS device, are: (i) carrier density of 5.6×1020 cm-3, (ii) mobility of 13 cm2/V⋅sec, and (iii) thickness 1200 Å [1].
Syntheses of AZO Layer
AZO thin films were synthesized onto Corning Eagle 2000 glass with various RF sputtering conditions. From the syntheses, we chose one isolated set of AZO data, which consists of 40 samples. The selected samples do not represent best properties for reference AZO. Rather, they possess the wide variety of TCO properties that needs to be enhanced via fine-tuning of process conditions. For baseline measurements, each film was analyzed with a four-point probe and Hall measurement for electric properties and n&k analysis for optical properties.

2
High-Dimensional AZO Data Generation
With an eye toward meeting above-mentioned multi-functional needs of the AZO layer, numerous studies have examined the effects of process conditions on the properties of thin films (e.g., [2, 3].) However, most attempts describe correlations between only two or three variables to circumvent the difficulty of simultaneously exploring multiple properties of AZO materials.
Our current research on TCO layers in CIGS devices aims at practically optimizing the properties and then finding standard recipes for synthesizing the layer by tuning process variables to achieve the final desired optical and electrical requirements simultaneously. Therefore, it is valuable to evaluate AZO qualities with a wide variety of characterizations as well as secondary descriptors generated from miscellaneous physical theories. For example, it is typical to investigate defects, structural disorder, or optical energy gap with the absorption edge of distinct regions based on the single oscillator model [4].
Having baseline film properties, we chose and compiled various secondary descriptors of TCOs (Table 1). The details of secondary descriptors are not described here, but the reader is referred to numerous texts in the field as shown in Table 1. High-dimensional AZO data incorporate various theoretical and phenomenological secondary descriptors into primary descriptors and process conditions to delineate characteristics of engineered TCO materials in minute detail.
APPROACH
High-dimensional AZO data are explored with various exploratory data analysis tools to uncover PPPRs between multiple variables in Table 1. Assuming that variables in the AZO data are intimately correlated, the exploration used to extract meaningful information is threefold:
• Direct visualization without data treatment • Non-linear dimensionality reduction • Data reorganization for revealing hierarchical data
structure.
Direct Data Visualization Using Parallel Coordinates
The AZO data space can be explored using parallel coordinates that visualize high-dimensional information directly into two-dimensional space [5]. The advantage of using a simple yet powerful algorithm is that it extracts hidden correlations without transforming the original multivariate data set, and therefore leads to uncomplicated data interpretation. It maps an N-dimensional data space onto the two-dimensional space by drawing N parallel axes. The abscissa in parallel coordinates represents each variable, whereas the ordinate represents different levels of variables (e.g., ten different levels in this study).
Factor Description
Process Condition
Base pressure (PBase), forward power of target (WTarget), process pressure (PProcess), heater temperature (TEHeater), Ar flow rate (FLAr), 2% O2/Ar flow rate (FL2% O2/Ar), scan speed (νScan), number of pass (NOPass), and crystal rate (XtalRate)
Primary Descriptor
Thickness of film (t), sheet resistance by 4-point probe (Rs-4pp), sheet resistance by Hall measurement (Rs-Hall), electrical resistivity by 4-point probe (ρ4pp), electrical resistivity by Hall measurement (ρHall), mobility (µ), free carrier concentration (ne), and optical responses as spectral data (i.e. transmittance, reflectance, refractive index, and extinction coefficient)
Secondary Descriptor
Electronic mean free path (l1 [6] and l2 [7]), Urbach tail energy (E0), dispersion energy (Ed), single oscillator energy (EOsc), long wavelength refractive index (n∞), n∞ squared (ε∞), average oscillator wavelength (λ0), average oscillator strength (S0), optical band gap energy from Tauc’s plot (Eg(Tauc)), refractive index at 500 nm (n500nm), extinction coefficient at 500 nm (k500nm), real dielectric constant at 500 nm (ε1-500nm), imaginary part of dielectric constant at 500 nm (ε2-500nm), position of the maxima of the first derivative of the transmission ((dT/dλ)Max-eV), absorption coefficient at (dT/dλ)Max-eV (α(dT/dλ)Max-eV), overall transmittance between 400 and 900 nm (TAvg. (400-900nm)), degree of inhomogeneity of refractive index ((∆n/ñ)%), measure of TCO performance at 500 nm ((σ/α)500nm), and figure of merit of TCO at 550 nm (φTC-550nm) [8-13]
Table 1. High-dimensional data space of AZO films.
The parallel-coordinates system is particularly suitable for mapping AZO data. First, it enables one to discriminate among samples having similar process conditions in the space of nine process variables, because the AZO data set contains many samples repeatedly synthesized with process conditions that are quite similar, but not identical. Second, the point of view to explore the data set is interchangeable among processing conditions, properties, and performance. For instance, the effects of processing conditions on properties of AZO films are shown in Fig. 1, in which it is also possible to visualize the effects of properties such as ρHall on processing conditions. This approach of changing viewpoints is often far more effective than other approaches for choosing targeted

3
levels of specific properties to scrutinize the control of processing conditions in inverse engineering.
Diffusion Maps for Dimensionality Reduction
Because of the limitations of human perception, low-dimensional representation of high-dimensional data is of great importance to science, including the PV area. For instance, principal component analysis (PCA) is a global method of characterizing covariance in a high-dimensional data set to find the low-dimensional space that delineates high-dimensional data with minimal loss of information. It uses linear projections that minimize the least-squares error for a given number of components by rotating the original coordinate system for high-dimensional data so as to maximize the variance in the data, while minimizing the loss of information. However, the dependence of PCA on linear projections is not suitable for all data sets. In particular, if the data points lie on a nonlinear surface, linear projections may not lead to proper dimensionality compression because the projection planes may not coincide with the surface of interest. Linear projection-based analysis is often inadequate for TCO data, because the PV data may be interrelated nonlinearly.
A recently developed alternative to PCA is diffusion map embedding [14,15]. Unlike PCA, which projects the data onto linear subspaces, diffusion maps construct a graph (or network) on the data in which features are connected by weighted edges. A common choice of weight function is the Gaussian or heat kernel,
wij = exp{−ρ(xi , xj )
2
ε} (1)
where ρ is a function measuring the distance between features xi and xj, and ε is a non-negative parameter. Because the Gaussian kernel decays quickly, the resulting graph places a high emphasis on local distances and can therefore lead to discovery of nonlinear relationships between the features. Computationally, the weight matrix W is row normalized, yielding a row-stochastic Markov matrix
P = D−1W (2)
where D is diagonal with elements
Dii = wijj∑ (3)
The eigenvalues (λk) and eigenvectors (ϕk) of P are then computed as a coordinate system of the original data set, and the data are embedded into a low-dimensional subspace corresponding to the first, say r, eigenvectors that are considered efficient data representatives. The eigenbasis corresponds to modes of a random walk (or diffusion) on the data, so points that are nearby on the graph will also be close in the embedded space. Like
PCA, this procedure can lead to drastic dimension reduction when the number of eigenvectors needed for the embedding is small. It differs, however, in the sense that local, and potentially nonlinear, relationships between features may become apparent in the embedding that would be missed if only linear projections were used.
Diffusion maps are commonly used for clustering: a typical algorithm embeds the data into a low-dimensional subspace, and then applies a standard clustering algorithm to the embedded data.
Hierarchical Clustering with Diffusion Maps
It is often the case that scientific data are obtained in such a way that no clear ordering of either the variables or the samples is apparent at first glance. In AZO design, for example, it is far more useful to have a clearer organization of the data matrix (and hence visualization of the data) in order of “similarity,” which elucidates relationships between both the processing conditions and properties via a hierarchical tree structure known as a dendrogram. To this end, cluster analysis (CA) can be applied to explore similarities of the data space and partition them into a number of clusters where observations or variables in the same cluster are “similar,” whereas dissimilar samples/variables are in different clusters.
Among CA approaches, hierarchical clustering algorithms provide a simple and systematic way to organize and visualize discrete data. In this study, we consider only bottom-up algorithms in which smaller clusters are successively combined in larger ones. Given a data matrix with m samples or observations (rows) and n features, characteristics, or responses (columns), the goal of agglomerative algorithms is to iteratively merge clusters according to their similarity. The way in which this is achieved depends fundamentally on the choice of:
• A non-negative distance or dissimilarity function between two clusters A and B, denoted by ρ(A,B)
• A linkage rule for recomputing the distance between old and new clusters.
In particular, given the distance function ρ(A,B), we first compute the pairwise distances between all of the features. Next, the minimal pairwise distance is identified and recorded, the corresponding features are merged, and the distance between this new cluster and the remaining clusters is computed according to the linkage rule selected. Three common linkage rules are single, complete, and average [16]. After (n-1) steps, all features are contained in a single cluster, and the algorithm stops.
Diffusion mapping can be incorporated for more clearly understanding cluster structures by placing emphasis on local distances between points in the feature space. In particular, given a distance function ρ(A,B), the similarity between clusters is described by weights in a data-derived network as shown in Eq. 1. This formalism is easily
4
adapted to the hierarchical clustering schemes described above. In particular, given a probability of transition between A and B (i.e., element P(A,B) of the Markov matrix), we define a new distance function by, for example,
ρ(A, B) = 1− PAB (4)
where 0≤ρ≤1 because 0≤P≤1. The advantage of this approach compared to CA is its emphasis on local distances, which intuitively may be a more natural setting to search for meaningful clusters. Given the diffusion map distance defined above, any of the linkage rules can be applied.
RESULTS AND DISCUSSION
Parallel Coordinates
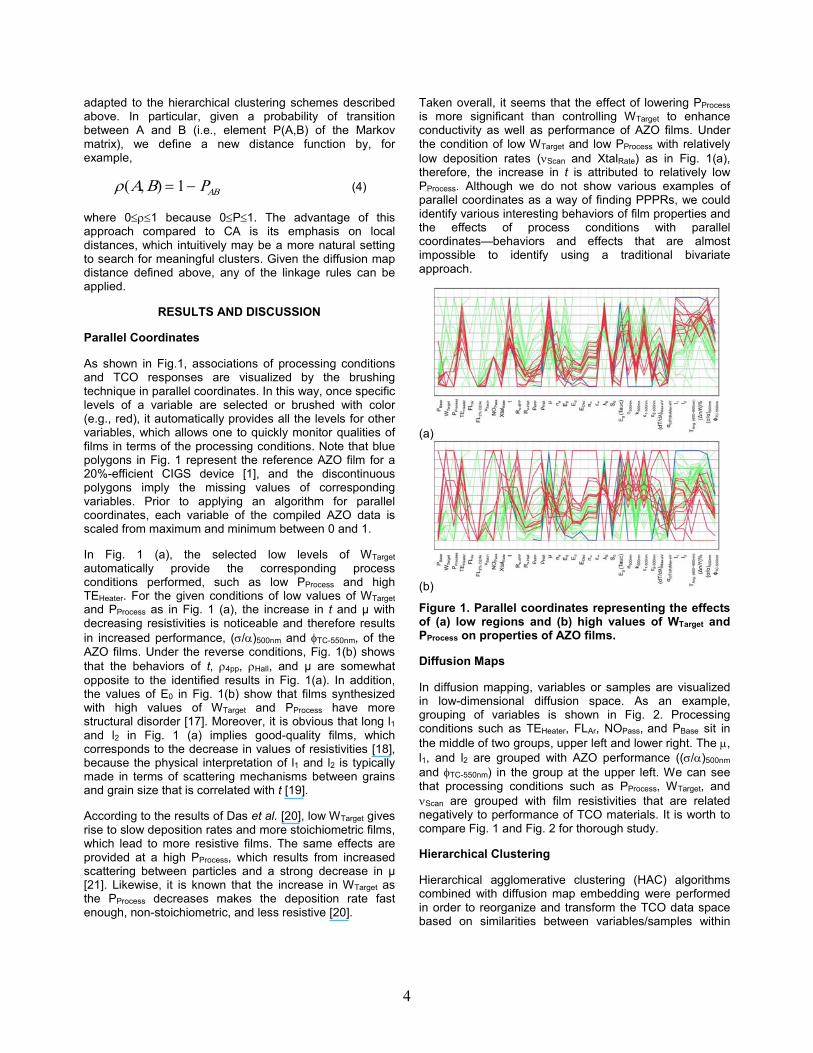
As shown in Fig.1, associations of processing conditions and TCO responses are visualized by the brushing technique in parallel coordinates. In this way, once specific levels of a variable are selected or brushed with color (e.g., red), it automatically provides all the levels for other variables, which allows one to quickly monitor qualities of films in terms of the processing conditions. Note that blue polygons in Fig. 1 represent the reference AZO film for a 20%-efficient CIGS device [1], and the discontinuous polygons imply the missing values of corresponding variables. Prior to applying an algorithm for parallel coordinates, each variable of the compiled AZO data is scaled from maximum and minimum between 0 and 1.
In Fig. 1 (a), the selected low levels of WTarget automatically provide the corresponding process conditions performed, such as low PProcess and high TEHeater. For the given conditions of low values of WTarget and PProcess as in Fig. 1 (a), the increase in t and μ with decreasing resistivities is noticeable and therefore results in increased performance, (σ/α)500nm and φTC-550nm, of the AZO films. Under the reverse conditions, Fig. 1(b) shows that the behaviors of t, ρ4pp, ρHall, and μ are somewhat opposite to the identified results in Fig. 1(a). In addition, the values of E0 in Fig. 1(b) show that films synthesized with high values of WTarget and PProcess have more structural disorder [17]. Moreover, it is obvious that long l1 and l2 in Fig. 1 (a) implies good-quality films, which corresponds to the decrease in values of resistivities [18], because the physical interpretation of l1 and l2 is typically made in terms of scattering mechanisms between grains and grain size that is correlated with t [19].
According to the results of Das et al. [20], low WTarget gives rise to slow deposition rates and more stoichiometric films, which lead to more resistive films. The same effects are provided at a high PProcess, which results from increased scattering between particles and a strong decrease in μ [21]. Likewise, it is known that the increase in WTarget as the PProcess decreases makes the deposition rate fast enough, non-stoichiometric, and less resistive [20].
Taken overall, it seems that the effect of lowering PProcess is more significant than controlling WTarget to enhance conductivity as well as performance of AZO films. Under the condition of low WTarget and low PProcess with relatively low deposition rates (νScan and XtalRate) as in Fig. 1(a), therefore, the increase in t is attributed to relatively low PProcess. Although we do not show various examples of parallel coordinates as a way of finding PPPRs, we could identify various interesting behaviors of film properties and the effects of process conditions with parallel coordinates—behaviors and effects that are almost impossible to identify using a traditional bivariate approach.
(a)
(b)
Figure 1. Parallel coordinates representing the effects of (a) low regions and (b) high values of WTarget and PProcess on properties of AZO films.
Diffusion Maps
In diffusion mapping, variables or samples are visualized in low-dimensional diffusion space. As an example, grouping of variables is shown in Fig. 2. Processing conditions such as TEHeater, FLAr, NOPass, and PBase sit in the middle of two groups, upper left and lower right. The µ, l1, and l2 are grouped with AZO performance ((σ/α)500nm and φTC-550nm) in the group at the upper left. We can see that processing conditions such as PProcess, WTarget, and νScan are grouped with film resistivities that are related negatively to performance of TCO materials. It is worth to compare Fig. 1 and Fig. 2 for thorough study.
Hierarchical Clustering
Hierarchical agglomerative clustering (HAC) algorithms combined with diffusion map embedding were performed in order to reorganize and transform the TCO data space based on similarities between variables/samples within

5
high-dimensional space. To elucidate linear/nonlinear process-property relationships of TCOs, the adapted HAC algorithm in this study is a much more robust and systematic data analysis technique than the conventional HAC approach. The reason is that the adapted algorithm emphasizes local distance between points in the high-dimensional variable space and captures nonlinearities in the data via diffusion map embedding [14, 15]. The results are summarized with heat-map representation to identify interdependencies between all variables with each role of the variables (Fig. 3). Figure 3(a) is a heat-map representation of original AZO data with no clustering applied. The heat map here can be considered as a color-coded data table for representing raw data. In heat maps, an intersection of a pair of rows and columns creates a grid associated with a pair of sample and property.
Figure 2. Low-dimensional embedding of AZO variables using the top three nontrivial eigenfunctions in diffusion space. Four processing conditions shaded with a blue ellipse form a boundary that separates the two groups.
Figure 3(a) provides raw AZO data, but they need to be organized in a more meaningful way. Figure 3(b) is a heat map after the order of the AZO samples and variables determined in terms of dissimilarity measure by hierarchical cluster analysis. With this data visualization, the domain scientist can quickly identify critical regions and interdependencies between AZO films or variables by combining heat-map representation with dendrograms (Fig. 3 (c)) from cluster analysis. We chose the average linkage rule and ρ(xi , xj ) = 2 − 2corr(xi , xj ) as our
dissimilarity function with ε=4. The color of each rectangle corresponds to a scaled value in the AZO films.
CONCLUSIONS AND FUTURE WORK
We have demonstrated how the merger of high-dimensional visualization with complex PV data sets such as AZO data provides a significant “value added” level to simultaneously find hidden PPPRs for optimizing the AZO layer and enhancing process controls.
(a)
(b)
(c)
Figure 3. (a) Heat map of the original AZO data without CA; (b and c) heat map and dendrogram of the AZO data arranged by HAC according to the dissimilarity measure from the diffusion map, respectively.

6
Based on the identified correlations, we can expand our approaches to linear/nonlinear regression techniques, leading to explicit optimization of the desired features.
In addition, we will expand our discussion to the concept of virtual metrology as unique “information probes” for exploring characterization data sets across different length scales by exposing relationships between diverse types of data. This is data exploitation to correlate, predict, and ultimately control measurable parameters such as thickness, as well as non-measurable properties such as structural disorder for better process controls toward achieving high-efficiency solar devices.
ACKNOWLEDGEMENT
We would like to thank Kwiseon Kim for critical comments. This work was supported by the U.S. Department of Energy under Contract No. DE-AC36-08-GO28308 with the National Renewable Energy Laboratory.
REFERENCES
[1] I. Repins et al., “Required Material Properties for High-Efficiency CIGS Modules”, Proc. SPIE, 7409, 2009, pp. 1-14.
[2] N.P. Dasgupta et al., “Atomic Layer Deposition of Al-doped ZnO Films: Effect of Grain Orientation on Conductivity”, Chem. Mater. 22, 2010, pp. 4769-4775.
[3] O. Kluth et al., “Texture Etched ZnO:Al Coated Glass Substrates for Silicon Based Thin Film Solar Cells”, Thin Solid Films 351, 1999, pp. 247-253.
[4] S.H. Wemple and M. DiDomenico Jr., “Optical Dispersion and the Structure of Solids”, Phys. Rev. Lett. 23,1969, pp. 1156-1160.
[5] A. Inselberg, Parallel Coordinates: Visual Multidimensional Geometry and Its Applications. Dordrecht, Springer, 2009.
[6] H. Ali et al., “Optimization of the Optical and Electrical Properties of Electron Beam Evaporated Aluminum-doped Zinc Oxide Flms for Opto-electronic Applications”, J. Phys. Chem. Solids, 67, 2006, pp. 1823-1829.
[7] J.G. Lu et al., “Structural, Optical, and Electrical Properties of (Zn, Al)O Films Over a Wide Range of Compositions”, J. Appl. Phys., 100, 2006, pp.073714-073711.
[8] E.Ş. Tüzemen et al., “Dependence of Film Thickness on the Structural and Optical Properties of ZnO Thin Films”, Appl. Surf. Sci., 255, 2009, pp. 6195-6200.
[9] V. Gupta and A. Mansingh, “Influence of Postdeposition Annealing on the Structural and Optical Properties of Sputtered Zinc Oxide Film”, J. Appl. Phys., 80,1996, pp.1063-1073.
[10] E.Ş. Tüzemen, H. Kavak, and R. Esen, “Influence of Oxygen Pressure of ZnO/Glass Substrate Produced by Pulsed Fltered Cathodic Vacuum Arc Deposition”, Physica B, 390, 2007, pp. 366-372.
[11] R. Romero et al., “Compositional and Physico-Optical Characterization of 0–5% Al-doped Zinc Oxide Films Prepared by Chemical Spray Pyrolysis”, J. Phys. D: Appl. Phys., 43, 2010, pp. 095303-095301.
[12] G.J. Exarhos and X.-D. Zhou, “Discovery-based Design of Transparent Conducting Oxide Films”, Thin Solid Films, 515, 2007, pp. 7025-7052.
[13] G. Haacke, “New Figure of Merit for Transparent Conductors”, J.Appl.Phys., 47, 1976, pp. 4086-4089.
[14] R.R. Coifman and S. Lafon, “Diffusion Maps”, Applied and Computational Harmonic Analysis, 21, 2006, pp. 5-30.
[15] G. Beylkin, J. Garcke, and M.J. Mohlenkamp, “Multivariate Regression and Machine Learning with Sums of Separable Functions”, SIAM J. Sci. Comput. 31, 2009, pp. 1840-1857.
[16] J. Han and M. Kamber, Data Mining: Concepts and Techniques. 2nd Ed. San Francisco, Morgan Kaufmann Publishers, 2006.
[17] M. Mamat et al., “Optical and Electrical Properties of Aluminum Doped Zinc Oxide Thin Films at Various Doping Concentrations”, J. Ceram. Soc. Jpn., 117, 2009, pp. 1263-1267.
[18] K. Kim, R. Wibowo, and B. Munir, “Properties of Al-doped ZnO Thin Film Sputtered from Powder Compacted Target”, Mater. Lett., 60, 2006, pp.1931-1935.
[19] K. Shimakawa and T. Itoh, “Grain Boundary Scattering of Free Electrons in Ga-Doped Microcrystalline Zinc Oxide Films”, Jpn. J. Appl. Phys., 46, 2007, pp. L577-L579.
[20] R. Das, K. Adhikary, and S. Ray, “Comparison of Electrical, Optical, and Structural Properties of RF-Sputtered ZnO Thin Films Deposited Under Different Gas Ambients”, Jpn. J. Appl. Phys. 47, 2008, pp. 1501-1506.
[21] O. Kluth et al., “Modified Thornton Model for Magnetron Sputtered Zinc Oxide: Film Structure and Etching Behaviour”, Thin Solid Films, 442, 2003, pp. 80-85.