Combining Pareto-Optimal Clusters Using Supervised Learning for Identifying Co-Expressed Genes
16
BioMed Central Page 1 of 16 (page number not for citation purposes) BMC Bioinformatics Open Access Methodology article Combining Pareto-optimal clusters using supervised learning for identifying co-expressed genes Ujjwal Maulik* 1 , Anirban Mukhopadhyay 2 and Sanghamitra Bandyopadhyay 3 Address: 1 Department of Computer Science and Engineering, Jadavpur University, Kolkata – 700032, India, 2 Department of Computer Science and Engineering, University of Kalyani, Kalyani – 741235, India and 3 Machine Intelligence Unit, Indian Statistical Institute, Kolkata – 700108, India Email: Ujjwal Maulik* - [email protected]; Anirban Mukhopadhyay - [email protected]; Sanghamitra Bandyopadhyay - [email protected] * Corresponding author Abstract Background: The landscape of biological and biomedical research is being changed rapidly with the invention of microarrays which enables simultaneous view on the transcription levels of a huge number of genes across different experimental conditions or time points. Using microarray data sets, clustering algorithms have been actively utilized in order to identify groups of co-expressed genes. This article poses the problem of fuzzy clustering in microarray data as a multiobjective optimization problem which simultaneously optimizes two internal fuzzy cluster validity indices to yield a set of Pareto-optimal clustering solutions. Each of these clustering solutions possesses some amount of information regarding the clustering structure of the input data. Motivated by this fact, a novel fuzzy majority voting approach is proposed to combine the clustering information from all the solutions in the resultant Pareto-optimal set. This approach first identifies the genes which are assigned to some particular cluster with high membership degree by most of the Pareto-optimal solutions. Using this set of genes as the training set, the remaining genes are classified by a supervised learning algorithm. In this work, we have used a Support Vector Machine (SVM) classifier for this purpose. Results: The performance of the proposed clustering technique has been demonstrated on five publicly available benchmark microarray data sets, viz., Yeast Sporulation, Yeast Cell Cycle, Arabidopsis Thaliana, Human Fibroblasts Serum and Rat Central Nervous System. Comparative studies of the use of different SVM kernels and several widely used microarray clustering techniques are reported. Moreover, statistical significance tests have been carried out to establish the statistical superiority of the proposed clustering approach. Finally, biological significance tests have been carried out using a web based gene annotation tool to show that the proposed method is able to produce biologically relevant clusters of co-expressed genes. Conclusion: The proposed clustering method has been shown to perform better than other well-known clustering algorithms in finding clusters of co-expressed genes efficiently. The clusters of genes produced by the proposed technique are also found to be biologically significant, i.e., consist of genes which belong to the same functional groups. This indicates that the proposed clustering method can be used efficiently to identify co- expressed genes in microarray gene expression data. Supplementary Website The pre-processed and normalized data sets, the matlab code and other related materials are available at http://anirbanmukhopadhyay.50webs.com/mogasvm.html . Published: 20 January 2009 BMC Bioinformatics 2009, 10:27 doi:10.1186/1471-2105-10-27 Received: 11 September 2008 Accepted: 20 January 2009 This article is available from: http://www.biomedcentral.com/1471-2105/10/27 © 2009 Maulik et al; licensee BioMed Central Ltd. This is an Open Access article distributed under the terms of the Creative Commons Attribution License (http://creativecommons.org/licenses/by/2.0 ), which permits unrestricted use, distribution, and reproduction in any medium, provided the original work is properly cited.
Transcript of Combining Pareto-Optimal Clusters Using Supervised Learning for Identifying Co-Expressed Genes

BioMed CentralBMC Bioinformatics
ss
Open AcceMethodology articleCombining Pareto-optimal clusters using supervised learning for identifying co-expressed genesUjjwal Maulik*1, Anirban Mukhopadhyay2 and Sanghamitra Bandyopadhyay3Address: 1Department of Computer Science and Engineering, Jadavpur University, Kolkata – 700032, India, 2Department of Computer Science and Engineering, University of Kalyani, Kalyani – 741235, India and 3Machine Intelligence Unit, Indian Statistical Institute, Kolkata – 700108, India
Email: Ujjwal Maulik* - [email protected]; Anirban Mukhopadhyay - [email protected]; Sanghamitra Bandyopadhyay - [email protected]
* Corresponding author
AbstractBackground: The landscape of biological and biomedical research is being changed rapidly with the invention ofmicroarrays which enables simultaneous view on the transcription levels of a huge number of genes acrossdifferent experimental conditions or time points. Using microarray data sets, clustering algorithms have beenactively utilized in order to identify groups of co-expressed genes. This article poses the problem of fuzzyclustering in microarray data as a multiobjective optimization problem which simultaneously optimizes twointernal fuzzy cluster validity indices to yield a set of Pareto-optimal clustering solutions. Each of these clusteringsolutions possesses some amount of information regarding the clustering structure of the input data. Motivatedby this fact, a novel fuzzy majority voting approach is proposed to combine the clustering information from all thesolutions in the resultant Pareto-optimal set. This approach first identifies the genes which are assigned to someparticular cluster with high membership degree by most of the Pareto-optimal solutions. Using this set of genesas the training set, the remaining genes are classified by a supervised learning algorithm. In this work, we haveused a Support Vector Machine (SVM) classifier for this purpose.
Results: The performance of the proposed clustering technique has been demonstrated on five publicly availablebenchmark microarray data sets, viz., Yeast Sporulation, Yeast Cell Cycle, Arabidopsis Thaliana, HumanFibroblasts Serum and Rat Central Nervous System. Comparative studies of the use of different SVM kernels andseveral widely used microarray clustering techniques are reported. Moreover, statistical significance tests havebeen carried out to establish the statistical superiority of the proposed clustering approach. Finally, biologicalsignificance tests have been carried out using a web based gene annotation tool to show that the proposedmethod is able to produce biologically relevant clusters of co-expressed genes.
Conclusion: The proposed clustering method has been shown to perform better than other well-knownclustering algorithms in finding clusters of co-expressed genes efficiently. The clusters of genes produced by theproposed technique are also found to be biologically significant, i.e., consist of genes which belong to the samefunctional groups. This indicates that the proposed clustering method can be used efficiently to identify co-expressed genes in microarray gene expression data.
Supplementary Website The pre-processed and normalized data sets, the matlab code and other related materials are available at http://anirbanmukhopadhyay.50webs.com/mogasvm.html.
Published: 20 January 2009
BMC Bioinformatics 2009, 10:27 doi:10.1186/1471-2105-10-27
Received: 11 September 2008Accepted: 20 January 2009
This article is available from: http://www.biomedcentral.com/1471-2105/10/27
© 2009 Maulik et al; licensee BioMed Central Ltd. This is an Open Access article distributed under the terms of the Creative Commons Attribution License (http://creativecommons.org/licenses/by/2.0), which permits unrestricted use, distribution, and reproduction in any medium, provided the original work is properly cited.
Page 1 of 16(page number not for citation purposes)
BMC Bioinformatics 2009, 10:27 http://www.biomedcentral.com/1471-2105/10/27
BackgroundThe progress in the field of microarray technology hasmade it possible to simultaneously study the expressionlevels of a large number of genes across different experi-mental conditions. Microarray technology has applica-tions in the areas of medical diagnosis, bio-medicine,gene expression profiling, etc [1-4]. Usually, the geneexpression values during a biological experiment aremeasured at different time points. A microarray geneexpression data, consisting of g genes and h time points, istypically organized in a 2D matrix E = [eij] of size g × h.
Each element eij gives the expression level of the ith gene
at the jth time point. Clustering [5], an important micro-array analysis tool, is used to identify the sets of geneswith similar expression profiles. Clustering methods par-tition a set of n objects into K groups based on some sim-ilarity/dissimilarity metric where the value of K may ormay not be known a priori. Unlike hard clustering, a fuzzyclustering algorithm produces a K × n membership matrixU(X) = [ukj], k = 1, ..., K and j = 1, ..., n, where ukj denotes
the probability of assigning pattern xj to cluster Ck. For
probabilistic non-degenerate clustering, 0 <ukj < 1 and
, 1 ≤ j ≤ n [6].
Genetic algorithms [7] have been effectively used todevelop efficient clustering techniques [8,9]. These tech-niques use a single cluster validity measure as the fitnessfunction to reflect the goodness of an encoded clustering.However, a single cluster validity measure is seldomequally applicable for different kinds of data sets. Thisarticle poses the problem of fuzzy partitioning as one ofmultiobjective optimization (MOO) [10-13]. Unlike sin-gle objective optimization, in MOO, search is performedover a number of, often conflicting, objective functions.The final solution set contains a number of Pareto-opti-mal solutions, none of which can be further improved onany one objective without degrading it in another. A Non-dominated Sorting GA-II (NSGA-II) [13] based multiob-jective fuzzy clustering algorithm has been adopted thatoptimizes the Xie-Beni (XB) index [14] and the fuzzy C-means (FCM) [6] measure (Jm) simultaneously [11]. Acharacteristic of any MOO approach is that it often pro-duces a large number of Pareto-optimal solutions, fromwhich selecting a particular solution is difficult. The exist-ing methods use the characteristics of the Pareto-optimalsurface or some external measure for this purpose. How-ever, these approaches almost always pick up one solutionfrom the Pareto-optimal set as the final solution, althoughevidently all the solutions in this set have some informa-tion that is inherently good for the problem in hand.Motivated by this observation, this article describes a
novel method to obtain the final solution while consider-ing all the Pareto-optimal solutions by utilizing the inputdata as a guiding factor. The approach is to integrate themultiobjective clustering technique with a support vectormachine (SVM) [15] based classifier to obtain the finalsolution from the Pareto-optimal set. The procedureinvolves utilizing the points which are given a high mem-bership degree to a particular class by a majority of thenon-dominated solutions. These points are taken as thetraining points to train the SVM classifier. The remainingpoints are then classified by the trained SVM classifier toyield the class labels for these points.
Many approaches that solve clustering problems withmachine learning algorithms, such as Artificial NeuralNetworks, Genetic Algorithms, Simulated Annealing etc.,can be found in the literature. In [16], an unsupervisedself organizing neural network based hierarchical cluster-ing algorithm for gene expression data has been devel-oped. The unsupervised neural network grows adoptingthe topology of a binary tree. The algorithm combines theadvantages of both hierarchical clustering and Self Organ-izing Map (SOM). In [17], an unsupervised clusteringtechnique based on self-optimizing neural network hasbeen presented. The algorithm is able to find out the mostdifferentiating features for training data and recursivelydivides them into subgroups. The division of the data isrecursively performed till the differences among the sub-groups become imperceptible. In [18], a multiple-levelhybrid classifier, which combines the supervised decisiontree classifiers and unsupervised Bayesian clustering todetect intrusions has been proposed. Clustering usingGenetic Algorithms (GA) [8-12] and Simulated Annealing(SA) [19-23] have widely been studied in the literature.The clustering method proposed in this article differsfrom those mentioned above in the sense that in this algo-rithm, a novel approach to boost the clustering perform-ance of the multiobjective genetic fuzzy clustering byintegrating it with a supervised learning approach is pro-posed. In this regard, a fuzzy majority voting techniquefollowed by SVM classification is applied on the resultantset of non-dominated solutions in order to obtain thefinal solution.
The performance of the Multiobjective GA (MOGA) basedfuzzy clustering followed by SVM classification (MOGA-SVM) has been demonstrated on five real-life gene expres-sion data sets, viz., Yeast Sporulation, Yeast Cell Cycle,Arabidopsis Thaliana, Human Fibroblasts Serum and RatCNS data. The superiority of the proposed technique, ascompared to MOGA clustering [11], a crisp version ofMOGA-SVM, termed as MOGAcrisp-SVM, FCM algorithm[6], single objective GA (SGA) [9], hierarchical averagelinkage clustering, Self Organizing Map (SOM) clustering[24] and Chinese Restaurant Clustering (CRC) [25], is
ukjk
K ==∑ 11
Page 2 of 16(page number not for citation purposes)

BMC Bioinformatics 2009, 10:27 http://www.biomedcentral.com/1471-2105/10/27
demonstrated both quantitatively and visually. The use ofdifferent SVM kernels has been explored. The superiorityof the MOGA-SVM clustering technique has been provedto be statistically significant through statistical tests.Finally a biological significance test has been conductedto establish that the proposed technique produces func-tionally enriched clusters.
Results and DiscussionThe performance of the proposed MOGA-SVM clusteringhas been evaluated on five publicly available real life geneexpression data sets, viz., Yeast Sporulation, Yeast CellCycle, Arabidopsis Thaliana, Human Fibroblasts Serumand Rat CNS data. First, the effect of the parameter β(majority voting threshold) on the performance ofMOGA-SVM clustering has been examined. Thereafter, weexamined the use of different kernel functions and com-pared their performances. The performance of the pro-posed technique has also been compared with those offuzzy MOGA clustering (without SVM) [10,11], FCM [6],single objective genetic clustering scheme which mini-mizes XB validity measure (SGA) [9], average linkagemethod [26], SOM [24] and CRC [25]. Moreover, a crispversion of MOGA-SVM clustering (MOGAcrisp-SVM) isconsidered for comparison in order to establish the utilityof incorporating fuzziness. Unlike fuzzy MOGA-SVM,which uses the FCM based chromosome update, inMOGAcrisp-SVM, chromosomes are updated using the K-means like center update process and the crisp versions ofJm and XB indices are optimized simultaneously. Toobtain the final clustering solution from the set of non-dominated solutions, similar procedure as in fuzzyMOGA-SVM is followed. Note that in the case of MOGAc-
risp-SVM, as membership degrees are either 0 or 1, hencethe membership threshold parameter α is not required.The statistical and biological significance of the clusteringresults have also been evaluated.
Effect of Majority Voting Threshold βIn this section we have analyzed how the parameter β(majority voting threshold) affects the performance of theproposed MOGA-SVM clustering technique. The algo-rithm has been executed for a range of β values startingfrom 0.1 to 0.9 with a step size of 0.05 for all the data sets.The results reported in this section are for the Radial BasisFunction (RBF) [15,27]. Experiments with other kernelfunctions are also found to provide similar behavior. Foreach value of β, the average value of the silhouette index(s(C)) scores over 20 runs has been considered. Theparameter α (membership threshold) has been kept con-stant at 0.5. The variation of average s(C) scores for differ-ent values of β are demonstrated in Fig. 1 for the five datasets.
It is evident from Fig. 1 that for all the data sets, MOGA-SVM behaves similarly in terms of variation of average
s(C) over the range of β values. The general trend is thatfirst the average s(C) scores get improved with increasingβ value, then remains almost constant in the range ofaround 0.4 to 0.6, and then deteriorates with furtherincrease in β value. This behavior is quite expected, as forsmall value of β, the training set will contain lot of low-confidence points, which causes the class boundaries tobe defined incorrectly for SVM. On the other hand, whenβ value is very high, the training set is small and containsonly a few high confidence points. Thus the hyperplanesbetween the classes cannot be properly defined. In somerange of β (around 0.4 to 0.6), a tradeoff is obtainedbetween the size of the training set and its confidencelevel. Hence in this range, MOGA-SVM provides the bests(C) index scores. With this observation, in all the experi-ments hereafter, β value has been kept constant at 0.5.
Performance of MOGA-SVM for Different KernelsFour kernel functions, viz., linear, polynomial, sigmoidaland RBF are considered in this article. In this section, astudy has been made on how the different kernel func-tions perform for the five data sets. Table 1 reports thes(C) scores (averaged over 20 runs) produced by MOGA-SVM with the four different kernel functions for the fivedata sets. The average s(C) scores provided by MOGA(without SVM) over 20 runs is also reported for each dataset. Moreover, the number of clusters K (corresponding tothe solution providing the best silhouette index score)found for the different data sets has been shown.
As is evident from the table, irrespective of the kernelfunction considered, use of SVM provides better s(C) scorecompared to the MOGA(without SVM). This is expectedsince the MOGA-SVM techniques provide equal impor-tance to all the non-dominated solutions, rather than asingle one. Thus through fuzzy voting, the core group ofgenes for each cluster is identified and the class labels ofthe remaining genes are predicted by the SVM. It can alsobe noticed from the table that the silhouette index pro-duced by the RBF kernel is greater than those produced bythe other kernels. This is because RBF kernels are knownto perform well in case of spherical shaped clusters, whichis very common in case of gene expression data sets.Henceforth, MOGA-SVM will indicate MOGA-SVM withRBF kernel only.
Comparative ResultsTable 2 reports the average s(C) index values provided byMOGA-SVM (RBF), MOGA (without SVM), MOGAcrisp-SVM (RBF), FCM, SGA, Average linkage, SOM and CRCclustering over 20 runs of the algorithms for the five reallife data sets considered here. Also the number of clustersK obtained corresponding to the maximum s(C) indexscore for each algorithm is reported. The values reportedin the tables show that for all the data sets, MOGA-SVMprovides the best s(C) index score. MOGAcrisp-SVM (RBF)
Page 3 of 16(page number not for citation purposes)

BMC Bioinformatics 2009, 10:27 http://www.biomedcentral.com/1471-2105/10/27
Page 4 of 16(page number not for citation purposes)
Variation of average s(C) index values produced by MOGA-SVM (RBF) clustering over different β values ranging from 0.1 to 0.9 for the data sets (a) Sporulation, (b) Cell cycle, (c) Arabidopsis, (d) Serum, (e) Rat CNSFigure 1Variation of average s(C) index values produced by MOGA-SVM (RBF) clustering over different β values rang-ing from 0.1 to 0.9 for the data sets (a) Sporulation, (b) Cell Cycle, (c) Arabidopsis, (d) Serum, (e) Rat CNS.

BMC Bioinformatics 2009, 10:27 http://www.biomedcentral.com/1471-2105/10/27
also provides reasonably good s(C) index scores, but isoutperformed by MOGA-SVM for all the data sets. Thisindicates the utility of incorporating fuzziness in MOGAclustering. Interestingly, while incorporation of SVMbased training improves the performance of MOGA clus-tering, the latter also provides, in most cases, better s(C)values than SGA and the other non-genetic approaches.Only for Yeast Sporulation and Arabidopsis Thaliana datasets, the results for MOGA (without SVM) are slightly infe-rior to those of SOM and CRC, respectively. However, theperformance of the proposed MOGA-SVM is the best forall the data sets.
MOGA has determined 6, 5, 4, 6 and 6 number of clustersfor the Sporulation, Cell Cycle, Arabidopsis, Serum andRat CNS data sets, respectively. This conforms to the find-ings in the literature [28-31]. Hence it is evident from thetable that while MOGA (without SVM) and MOGAcrisp-SVM (RBF) are generally superior to the other methods,MOGA-SVM is the best among all the competing methodsfor all the data sets considered here.
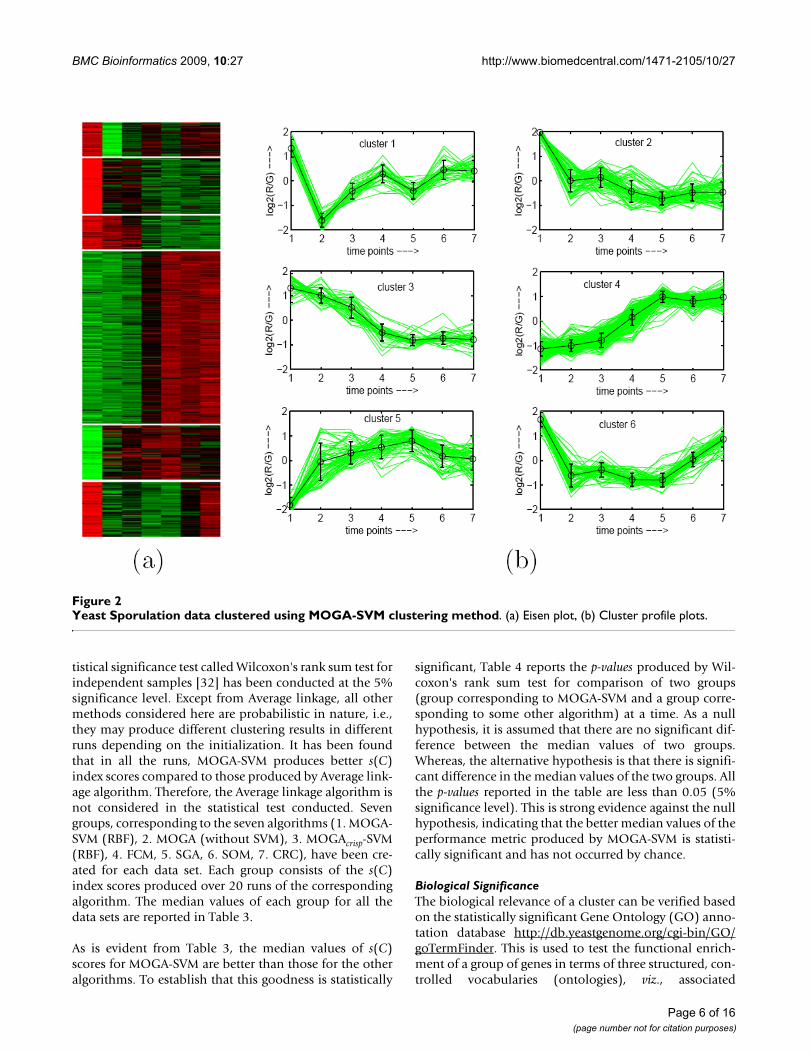
To demonstrate visually the result of MOGA-SVM cluster-ing, Figs. 2, 3, 4, 5, 6 show the Eisen plot and cluster pro-file plots provided by MOGA-SVM on the five data sets,respectively. For example, the 6 clusters of the YeastSporulation data are very prominent as shown in theEisen plot (Fig. 2(a)). It is evident from the figure that the
expression profiles of the genes of a cluster are similar toeach other and they produce similar color patterns. Thecluster profile plots (Fig. 2(b)) also demonstrate how theexpression profiles for the different groups of genes differfrom each other, while the profiles within a group are rea-sonably similar. Similar results are obtained for the otherdata sets also.
The proposed technique performs better compared to theother clustering methods mainly because of the followingreasons: first of all, this is a multiobjective clusteringmethod. Simultaneous optimization of multiple clustervalidity measures helps to cope with different characteris-tics of the partitioning and leads to higher quality solu-tions and an improved robustness towards the differentdata properties. Secondly, the strength of supervisedlearning has been integrated with the multiobjective clus-tering efficiently. As each of the solutions in the final non-dominated set contains some information about the clus-tering structure of the data set, combining them with thehelp of majority voting followed by supervised classifica-tion yields a high quality clustering solution. Finally,incorporation of fuzziness makes the proposed techniquebetter equipped in handling overlapping clusters.
Statistical Significance TestTo establish that MOGA-SVM is significantly superiorcompared to the other algorithms, a non-parametric sta-
Table 1: Average Silhouette index scores over 20 runs of MOGA-SVM with different kernel functions for the five gene expression data sets along with the average Silhouette index score of the MOGA (without SVM)
Algorithm Sporulation Cell Cycle Arabidopsis Serum Rat CNS
K = 6 K = 5 K = 4 K = 6 K = 6
MOGA-SVM (linear) 0.5852 0.4398 0.4092 0.4017 0.4966MOGA-SVM (polynomial) 0.5877 0.4127 0.4202 0.4112 0.5082MOGA-SVM (sigmoidal) 0.5982 0.4402 0.4122 0.4112 0.5106MOGA-SVM (RBF) 0.6283 0.4426 0.4312 0.4154 0.5127MOGA (without SVM) 0.5794 0.4392 0.4011 0.3947 0.4872
Table 2: Average Silhouette index scores over 20 runs of different algorithms for the five gene expression data sets
Algorithm Sporulation Cell Cycle Thaliana Serum Rat CNS
K s(C) K s(C) K s(C) K s(C) K s(C)
MOGA-SVM (RBF) 6 0.6283 5 0.4426 4 0.4312 6 0.4154 6 0.5127MOGA (without SVM) 6 0.5794 5 0.4392 4 0.4011 6 0.3947 6 0.4872MOGAcrisp-SVM (RBF) 6 0.5971 5 0.4271 4 0.4187 6 0.3908 6 0.4917FCM 7 0.4755 6 0.3872 4 0.3642 8 0.2995 5 0.4050SGA 6 0.5703 5 0.4221 4 0.3831 6 0.3443 6 0.4486Average linkage 6 0.5007 4 0.4388 5 0.3151 4 0.3562 6 0.4122SOM 6 0.5845 6 0.3682 5 0.2133 6 0.3235 5 0.4430CRC 8 0.5622 5 0.4288 4 0.4109 10 0.3174 4 0.4423
Page 5 of 16(page number not for citation purposes)
BMC Bioinformatics 2009, 10:27 http://www.biomedcentral.com/1471-2105/10/27
tistical significance test called Wilcoxon's rank sum test forindependent samples [32] has been conducted at the 5%significance level. Except from Average linkage, all othermethods considered here are probabilistic in nature, i.e.,they may produce different clustering results in differentruns depending on the initialization. It has been foundthat in all the runs, MOGA-SVM produces better s(C)index scores compared to those produced by Average link-age algorithm. Therefore, the Average linkage algorithm isnot considered in the statistical test conducted. Sevengroups, corresponding to the seven algorithms (1. MOGA-SVM (RBF), 2. MOGA (without SVM), 3. MOGAcrisp-SVM(RBF), 4. FCM, 5. SGA, 6. SOM, 7. CRC), have been cre-ated for each data set. Each group consists of the s(C)index scores produced over 20 runs of the correspondingalgorithm. The median values of each group for all thedata sets are reported in Table 3.
As is evident from Table 3, the median values of s(C)scores for MOGA-SVM are better than those for the otheralgorithms. To establish that this goodness is statistically
significant, Table 4 reports the p-values produced by Wil-coxon's rank sum test for comparison of two groups(group corresponding to MOGA-SVM and a group corre-sponding to some other algorithm) at a time. As a nullhypothesis, it is assumed that there are no significant dif-ference between the median values of two groups.Whereas, the alternative hypothesis is that there is signifi-cant difference in the median values of the two groups. Allthe p-values reported in the table are less than 0.05 (5%significance level). This is strong evidence against the nullhypothesis, indicating that the better median values of theperformance metric produced by MOGA-SVM is statisti-cally significant and has not occurred by chance.
Biological SignificanceThe biological relevance of a cluster can be verified basedon the statistically significant Gene Ontology (GO) anno-tation database http://db.yeastgenome.org/cgi-bin/GO/goTermFinder. This is used to test the functional enrich-ment of a group of genes in terms of three structured, con-trolled vocabularies (ontologies), viz., associated
Yeast Sporulation data clustered using MOGA-SVM clustering methodFigure 2Yeast Sporulation data clustered using MOGA-SVM clustering method. (a) Eisen plot, (b) Cluster profile plots.
Page 6 of 16(page number not for citation purposes)
BMC Bioinformatics 2009, 10:27 http://www.biomedcentral.com/1471-2105/10/27
biological processes, molecular functions and biologicalcomponents. The degree of functional enrichment (p-value) is computed using a cumulative hypergeometricdistribution. This measures the probability of finding thenumber of genes involved in a given GO term (i.e., func-tion, process, component) within a cluster. From a givenGO category, the probability p of getting k or more geneswithin a cluster of size n, can be defined as [33]:
where f and g denote the total number of genes within acategory and within the genome, respectively. Statisticalsignificance is evaluated for the genes in a cluster by com-puting the p-value for each GO category. This signifies howwell the genes in the cluster match with the different GOcategories. If the majority of genes in a cluster have thesame biological function, then it is unlikely that this takesplace by chance and the p-value of the category will beclose to 0.
The biological significance test for Yeast Sporulation datahas been conducted at the 1% significance level. For dif-ferent algorithms, the number of clusters for which themost significant GO terms have a p-value less than 0.01
p
f
i
g f
n ig
ni
k
= −
⎛
⎝⎜
⎞
⎠⎟
−−
⎛
⎝⎜
⎞
⎠⎟
⎛
⎝⎜
⎞
⎠⎟=
−
∑10
1
, (1)
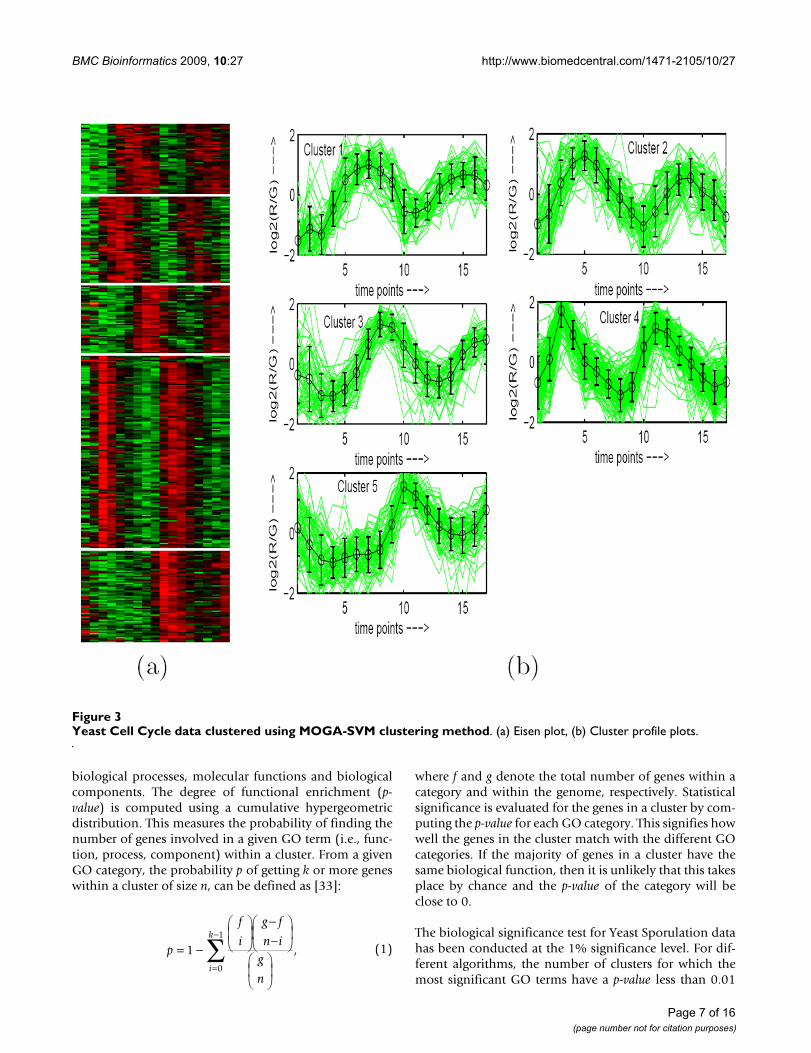
Yeast Cell Cycle data clustered using MOGA-SVM clustering methodFigure 3Yeast Cell Cycle data clustered using MOGA-SVM clustering method. (a) Eisen plot, (b) Cluster profile plots.
Page 7 of 16(page number not for citation purposes)
BMC Bioinformatics 2009, 10:27 http://www.biomedcentral.com/1471-2105/10/27
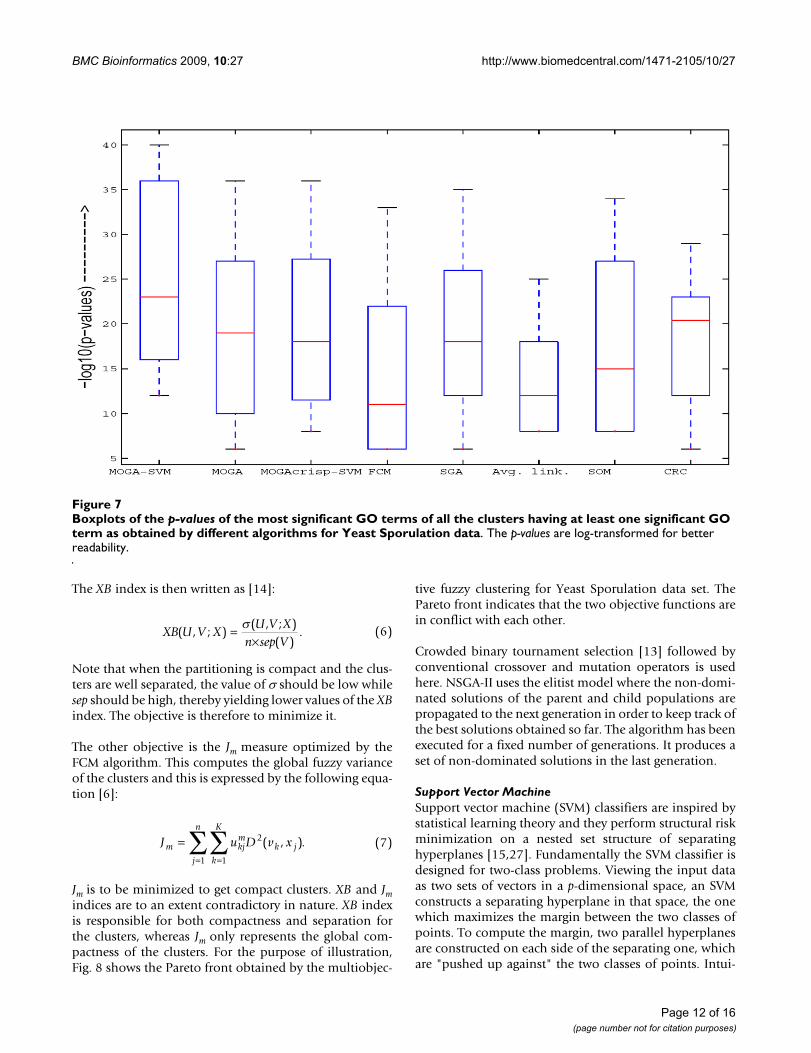
(1% significance level) are as follows: MOGA-SVM – 6,MOGA (without SVM) – 6, MOGAcrisp-SVM (RBF) – 6,FCM – 4, SGA – 6, Average linkage – 4, SOM – 4 and CRC– 6. In Fig. 7, the boxplots of the p-values of the most sig-nificant GO terms of all the clusters having at least one sig-nificant GO term as obtained by the different algorithmsare shown. The p-values are log-transformed for betterreadability. It is evident from the figure that the boxplotcorresponding to MOGA-SVM method has lower p-values(i.e., higher -log10 (p-value)). This indicates that the clus-ters identified by MOGA-SVM are more biologically sig-nificant and functionally enriched compared to the otheralgorithms.
As an illustration, Table 5 reports the three most signifi-cant GO terms (along with the corresponding p-values)shared by the genes of each of the 6 clusters identified byMOGA-SVM technique (Fig. 2). As is evident from thetable, all the clusters produced by MOGA-SVM clusteringscheme are significantly enriched with some GO catego-ries, since all the p-values are less than 0.01 (1% signifi-cance level). This establishes that the proposed MOGA-SVM clustering scheme is able to produce biologically rel-evant and functionally enriched clusters.
ConclusionThis article proposes a novel method for obtaining a finalsolution from the set of non-dominated solutions pro-
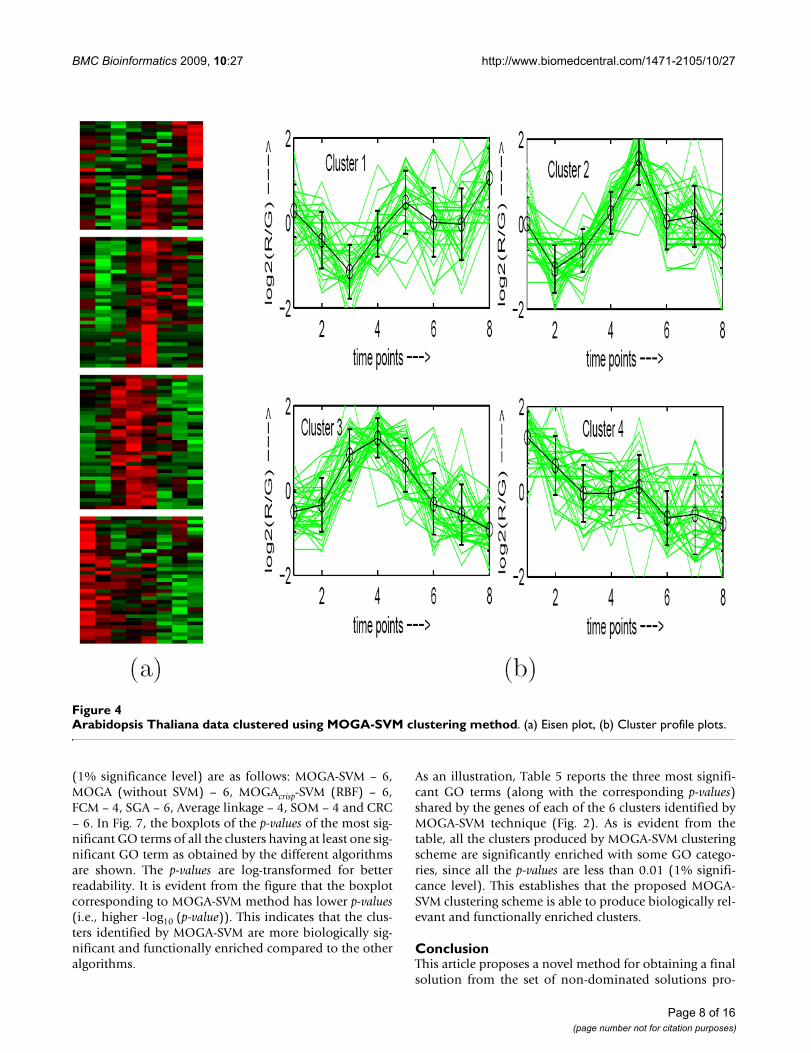
Arabidopsis Thaliana data clustered using MOGA-SVM clustering methodFigure 4Arabidopsis Thaliana data clustered using MOGA-SVM clustering method. (a) Eisen plot, (b) Cluster profile plots.
Page 8 of 16(page number not for citation purposes)

BMC Bioinformatics 2009, 10:27 http://www.biomedcentral.com/1471-2105/10/27
duced by an NSGA-II based real-coded multiobjectivefuzzy clustering scheme, that optimizes Xie-Beni (XB)index and the Jm simultaneously. In this regard, a fuzzyvoting technique followed by support vector machinebased classification has been utilized. Results on five real-life gene expression data sets have been demonstrated.Use of different kernel methods is investigated whence theRBF kernel is found to perform the best.
The performance of the proposed technique has beencompared with those of MOGA (without SVM), MOGAc-
risp-SVM (RBF), FCM, SGA, Average linkage, SOM and CRC
clustering methods. The results have been demonstratedboth quantitatively and visually using cluster visualiza-tion tools. The proposed MOGA-SVM clustering tech-nique consistently outperformed the other algorithmsconsidered here as it integrates multiobjective optimiza-tion, fuzzy clustering and supervised learning in an effec-tive manner. Statistical superiority has been establishedthrough statistical significance tests. Moreover biologicalsignificance tests have been conducted to establish thatthe clusters identified by the proposed technique are bio-logically significant.
Human Fibroblasts Serum data clustered using MOGA-SVM clustering methodFigure 5Human Fibroblasts Serum data clustered using MOGA-SVM clustering method. (a) Eisen plot, (b) Cluster profile plots.
Page 9 of 16(page number not for citation purposes)

BMC Bioinformatics 2009, 10:27 http://www.biomedcentral.com/1471-2105/10/27
As a scope of further research, performance of otherMOGA techniques, such as AMOSA [23] is to be tested.Also, combination of MOGA clustering with differentpopular supervised classification tools other than SVMcan also be studied.
MethodsMultiobjective Optimization
The multiobjective optimization can formally be stated as
[34]: Find the vector of decision vari-
ables which satisfies a number of equality and inequalityconstraints and optimizes the vector function
. The constraints define the
feasible region which contains all the admissible solu-tions. Any solution outside this region is inadmissible
since it violates one or more constraints. The vector
denotes an optimal solution in . The concept of Paretooptimality is useful in the domain of multiobjective opti-mization. A formal definition of Pareto optimality fromthe viewpoint of the minimization problem may be given
as follows: A decision vector is called Pareto-optimal if
and only if there is no that dominates , i.e., there is
x x x xnT∗ ∗ ∗ ∗= [ , ,..., ]1 2
f x f x f x f xkT( ) [ ( ), ( ),..., ( )]= 1 2
x ∗
x ∗
x x ∗
Rat CNS data clustered using MOGA-SVM clustering methodFigure 6Rat CNS data clustered using MOGA-SVM clustering method. (a) Eisen plot, (b) Cluster profile plots.
Page 10 of 16(page number not for citation purposes)
BMC Bioinformatics 2009, 10:27 http://www.biomedcentral.com/1471-2105/10/27
no such that ∀i ∈ {1, 2, ..., k}, and ∃i ∈
{1, 2, ..., k}, . In words, is Pareto-opti-
mal if there exists no feasible vector which causes areduction on some criterion without a simultaneousincrease in at least one other. In general, Pareto optimalityusually admits a set of solutions called non-dominatedsolutions.
There are a number of multiobjective optimization tech-niques available. Among them, the GA based techniquessuch as NSGA-II [13], SPEA and SPEA2 [35] are very pop-ular. The multiobjective fuzzy clustering scheme [11] con-sidered here uses NSGA-II as an underlying multiobjectiveframework for developing the proposed fuzzy clusteringalgorithm.
Multiobjective Fuzzy ClusteringThis section briefly describes the NSGA-II based multiob-jective fuzzy clustering scheme (MOGA) [11]. The algo-rithm MOGA uses real valued chromosomes that denotethe co-ordinates of the cluster centers and each has lengthK × d, where K is the number of clusters and d is dimen-sion of the data. Each chromosome in the initial popula-tion consists of the co-ordinates of K random points fromthe data set. Two cluster validity indices, Xie-Beni (XB)[14] and fuzzy C-means (FCM) measure (Jm) [6] aresimultaneously optimized. For computing the objectivefunctions, first the centers V = {v1, v2, ..., vK} encoded in agiven chromosome are extracted. The fuzzy membership
values uik, i = 1, 2, ..., K, k = 1, 2, ..., n are computed usingthe following equation [6]:
where D(vi, xk) denotes the distance between ith clustercenter and kth data point and m ∈ {1, ∞} is the fuzzyexponent. In this article, the Correlation based distancemeasure is used. Subsequently each cluster center vi, i = 1,2, ..., K, is updated using the following equation [6]:
The membership values are then recomputed using Eq.(2). The XB index is defined as a function of the ratio ofthe total variation σ to the minimum separation sep of theclusters. Here σ and sep can be written as:
and
x f x f xi i( ) ( )≤ ∗
f x f xi i( ) ( )< ∗ x ∗
xu
D vi xkD v j xk
mjK
i K k nik =
−=∑
≤ ≤ ≤ ≤12
11
1 1
(( , )( , )
)
, ; ,for
(2)
vuik
mxkkn
uikm
kn
i Ki = =∑
=∑≤ ≤
( )
( ), .1
1
1 (3)
s( , ; ) ( , ),U V X u D v xik i k
k
n
i
K
===∑∑ 2 2
11
(4)
sep V D v vi j
i j( ) min{ ( , )}.=≠
2 (5)
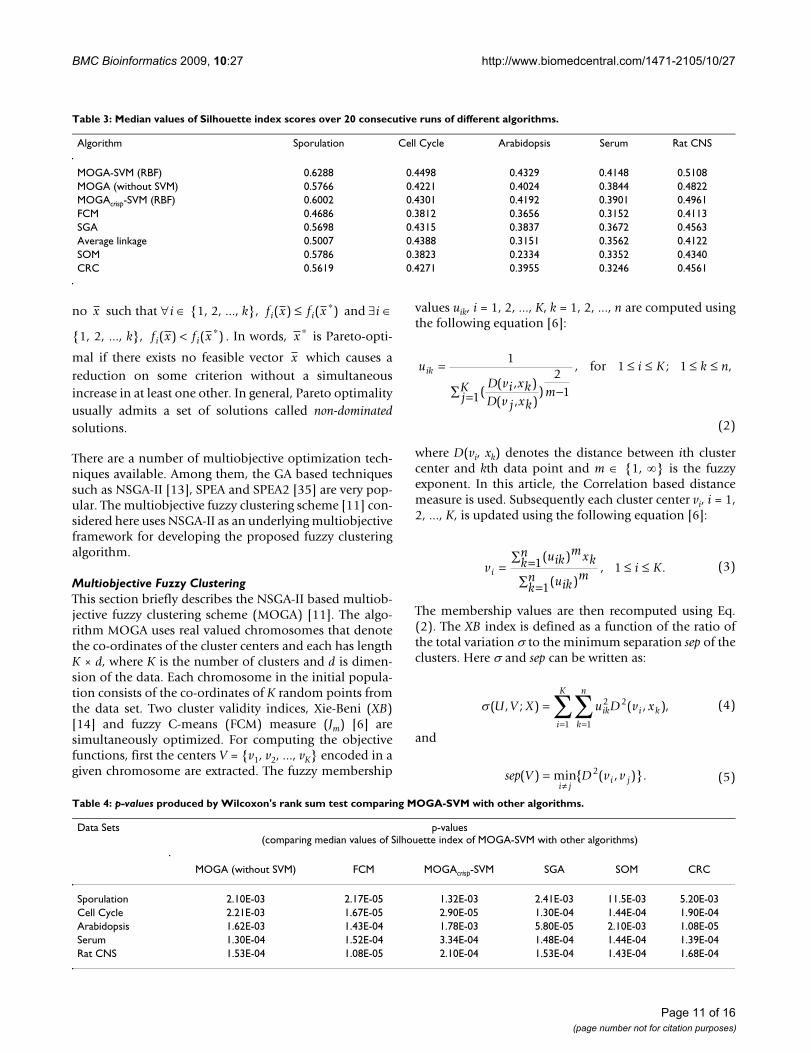
Table 3: Median values of Silhouette index scores over 20 consecutive runs of different algorithms.
Algorithm Sporulation Cell Cycle Arabidopsis Serum Rat CNS
MOGA-SVM (RBF) 0.6288 0.4498 0.4329 0.4148 0.5108MOGA (without SVM) 0.5766 0.4221 0.4024 0.3844 0.4822MOGAcrisp-SVM (RBF) 0.6002 0.4301 0.4192 0.3901 0.4961FCM 0.4686 0.3812 0.3656 0.3152 0.4113SGA 0.5698 0.4315 0.3837 0.3672 0.4563Average linkage 0.5007 0.4388 0.3151 0.3562 0.4122SOM 0.5786 0.3823 0.2334 0.3352 0.4340CRC 0.5619 0.4271 0.3955 0.3246 0.4561
Table 4: p-values produced by Wilcoxon's rank sum test comparing MOGA-SVM with other algorithms.
Data Sets p-values(comparing median values of Silhouette index of MOGA-SVM with other algorithms)
MOGA (without SVM) FCM MOGAcrisp-SVM SGA SOM CRC
Sporulation 2.10E-03 2.17E-05 1.32E-03 2.41E-03 11.5E-03 5.20E-03Cell Cycle 2.21E-03 1.67E-05 2.90E-05 1.30E-04 1.44E-04 1.90E-04Arabidopsis 1.62E-03 1.43E-04 1.78E-03 5.80E-05 2.10E-03 1.08E-05Serum 1.30E-04 1.52E-04 3.34E-04 1.48E-04 1.44E-04 1.39E-04Rat CNS 1.53E-04 1.08E-05 2.10E-04 1.53E-04 1.43E-04 1.68E-04
Page 11 of 16(page number not for citation purposes)
BMC Bioinformatics 2009, 10:27 http://www.biomedcentral.com/1471-2105/10/27
The XB index is then written as [14]:
Note that when the partitioning is compact and the clus-ters are well separated, the value of σ should be low whilesep should be high, thereby yielding lower values of the XBindex. The objective is therefore to minimize it.
The other objective is the Jm measure optimized by theFCM algorithm. This computes the global fuzzy varianceof the clusters and this is expressed by the following equa-tion [6]:
Jm is to be minimized to get compact clusters. XB and Jmindices are to an extent contradictory in nature. XB indexis responsible for both compactness and separation forthe clusters, whereas Jm only represents the global com-pactness of the clusters. For the purpose of illustration,Fig. 8 shows the Pareto front obtained by the multiobjec-
tive fuzzy clustering for Yeast Sporulation data set. ThePareto front indicates that the two objective functions arein conflict with each other.
Crowded binary tournament selection [13] followed byconventional crossover and mutation operators is usedhere. NSGA-II uses the elitist model where the non-domi-nated solutions of the parent and child populations arepropagated to the next generation in order to keep track ofthe best solutions obtained so far. The algorithm has beenexecuted for a fixed number of generations. It produces aset of non-dominated solutions in the last generation.
Support Vector MachineSupport vector machine (SVM) classifiers are inspired bystatistical learning theory and they perform structural riskminimization on a nested set structure of separatinghyperplanes [15,27]. Fundamentally the SVM classifier isdesigned for two-class problems. Viewing the input dataas two sets of vectors in a p-dimensional space, an SVMconstructs a separating hyperplane in that space, the onewhich maximizes the margin between the two classes ofpoints. To compute the margin, two parallel hyperplanesare constructed on each side of the separating one, whichare "pushed up against" the two classes of points. Intui-
XB U V XU V X
n sep V( , ; )
( , ; )( )
.=×
s(6)
J u D v xm kjm
k j
k
K
j
n
===∑∑ 2
11
( , ). (7)
Boxplots of the p-values of the most significant GO terms of all the clusters having at least one significant GO term as obtained by different algorithms for Yeast Sporulation dataFigure 7Boxplots of the p-values of the most significant GO terms of all the clusters having at least one significant GO term as obtained by different algorithms for Yeast Sporulation data. The p-values are log-transformed for better readability.
Page 12 of 16(page number not for citation purposes)

BMC Bioinformatics 2009, 10:27 http://www.biomedcentral.com/1471-2105/10/27
tively, a good separation is achieved by the hyperplanethat has the largest distance to the neighboring data pointsof both the classes. The larger the margin or distancebetween these parallel hyperplanes, the better is the gen-eralization error of the classifier. It can be extended tohandle multi-class problems by designing a number ofone-against-all or one-against-one two-class SVMs.
Kernel functions are used for mapping the input space toa higher dimensional feature space so that the classesbecome linearly separable. Use of four popular kernelfunctions has been studied in this article. These are:
Linear: K(xi, xj) =
Polynomial: K(xi, xj) =
Sigmoidal: K(xi, xj) =
Radial Basis Function (RBF): K(xi, xj) = .
The extended version of the two-class SVM that deals withmulti-class classification problem by designing a numberof one-against-all two-class SVMs [27,36] is used here. Forexample, a K-class problem is handled with K two-class
SVMs, each of which is used to separate a class of pointsfrom all the remaining points.
Proposed MOGA-SVM ClusteringThis section describes the proposed scheme for integratingthe multiobjective fuzzy clustering algorithm (MOGA)with the SVM classifier. The combined approach is calledMOGA-SVM. The basic observation motivating MOGA-SVM is that if a subset of points are almost always clus-tered together by most of the non-dominated solutions,then they may safely be considered to be clustered prop-erly. Hence these points may be used for training a classi-fier, which can thereafter be used for grouping theremaining low confidence points. In MOGA-SVM, all thefinal non-dominated solutions are given equal impor-tance and a fuzzy majority voting technique is applied toidentify the training set. Since SVM is considered one ofthe best state-of-art classifiers, it is used here for classifica-tion. The steps of MOGA-SVM are as follows:
1. Apply MOGA clustering on the given data set to obtaina set S = {s1, s2, ..., sN}, N ≤ P, (P is the population size) ofnon-dominated solution strings consisting of cluster cent-ers.
2. Using Eq. (2), compute the fuzzy membership matrixU(i) for each of the non-dominated solutions si, 1 ≤ i ≤ N.
x xiT
j
( )g x x riT
jd+
tanh( ( ) )k qx xiT
j +
e x xi j− −g | |2
Table 5: The three most significant GO terms and the corresponding p-values for each of the 6 clusters of Yeast Sporulation data as found by MOGA-SVM clustering technique
Clusters Significant GO term p-value
Cluster 1 ribosome biogenesis and assembly – GO:0042254 1.4E-37intracellular non-membrane-bound organelle – GO:0043232 1.38E-23organelle lumen – GO:0043233 9.46E-21
Cluster 2 nucleotide metabolic process – GO:0009117 1.32E-8glucose catabolic process – GO:0006007 2.86E-4external encapsulating structure – GO:0030312 3.39E-4
Cluster 3 organic acid metabolic process – GO:0006082 1.86E-14amino acid and derivative metabolic process – GO:0006519 4.35E-4external encapsulating structure – GO:0030312 6.70E-4
Cluster 4 spore wall assembly (sensu Fungi) – GO:0030476 8.97E-18sporulation – GO:0030435 2.02E-18cell division – GO:0051301 7.92E-16
Cluster 5 M phase of meiotic cell cycle – GO:0051327 1.71E-23M phase – GO:0000279 1.28E-20meiosis I – GO:0007127 5.10E-22
Cluster 6 cytosolic part – GO:0044445 1.4E-30cytosol – GO:0005829 1.4E-30ribosomal large subunit assembly and maintenance – GO:0000027 7.42E-8
Page 13 of 16(page number not for citation purposes)

BMC Bioinformatics 2009, 10:27 http://www.biomedcentral.com/1471-2105/10/27
3. Reorganize the membership matrices to make themconsistent with each other, i.e., cluster j in the first solu-tion should be equivalent to cluster j in all the other solu-tions. For example, the solution string {(p, q, r), (a, b, c)}is equivalent to {(a, b, c), (p, q, r)}.
4. Mark the points whose maximum membership degree(to cluster j, j ∈ {1, 2, ..., K}) is greater than a membershipthreshold α (0 ≤ α ≤ 1), for at least βN solutions, as train-ing points. Here β (0 ≤ β ≤ 1) is the threshold of the fuzzymajority voting. These points are labeled with class j.
5. Train the multi-class SVM classifier (i.e., K one-against-all two-class SVM classifiers, K being the number of clus-ters) using the selected training points.
6. Predict the class labels for the remaining points (testpoints) using the trained SVM classifier.
7. Combine the label vectors corresponding to trainingand testing points to obtain the final clustering for thecomplete data set.
The sizes of the training and testing sets depend on thetwo threshold parameters α and β. Here α is the member-ship threshold, i.e., it is the maximum membershipdegree above which a point can be considered as a train-ing point. Hence if α is increased, the size of the trainingset will decrease, but the confidence on the training pointswill increase. On the other hand, if α is decreased, the sizeof the training set will increase but the confidence of the
training points will decrease. The parameter β determinesthe minimum number of non-dominated solutions thatagree with each other in the fuzzy voting context. If β isincreased, the size of the training set will decrease but itindicates that more number of non-dominated solutionsagree with each other. On the contrary, if β is decreased,the size of the training set increases but it indicates asmaller number of non-dominated solutions have agree-ment among them. Hence both the parameters α and βare needed to be tuned in such a way so that a tradeoff isachieved between the size and confidence of the trainingset of SVM. To achieve this, after several experiments, wehave set both the parameters to a value of 0.5.
Data Sets and PreprocessingYeast SporulationThis data set [29] consists of 6118 genes measured across7 time points (0, 0.5, 2, 5, 7, 9 and 11.5 hours) during thesporulation process of budding yeast. The data set is thenlog-transformed. The Sporulation data set is publiclyavailable at the website http://cmgm.stanford.edu/pbrown/sporulation. Among the 6118 genes, the geneswhose expression levels did not change significantly dur-ing the harvesting have been ignored from further analy-sis. This is determined with a threshold level of 1.6 for theroot mean squares of the log2-transformed ratios. Theresulting set consists of 474 genes.
Yeast Cell CycleThe Yeast Cell Cycle data set was extracted from a data setthat shows the fluctuation of expression levels of approx-imately 6000 genes over two cell cycles (17 time points).Out of these 6000 genes, 384 genes have been selected tobe cell-cycle regulated [37]. This data set is publicly avail-able at the following website: http://faculty.washington.edu/kayee/cluster.
Arabidopsis ThalianaThis data set consists of expression levels of 138 genes ofArabidopsis Thaliana. It contains expression levels of thegenes over 8 time points viz., 15 min, 30 min, 60 min, 90min, 3 hours, 6 hours, 9 hours, and 24 hours [38]. It isavailable at http://homes.esat.kuleuven.be/~thijs/Work/Clustering.html.
Human Fibroblasts SerumThis dataset [39] contains the expression levels of 8613human genes. The data set has 13 dimensions corre-sponding to 12 time points (0, 0.25, 0.5, 1, 2, 4, 6, 8, 12,16, 20 and 24 hours) and one unsynchronized sample. Asubset of 517 genes whose expression levels changed sub-stantially across the time points have been chosen. Thedata is then log2-transformed. This data set can be down-loaded from http://www.sciencemag.org/feature/data/984559.shl.
The final non-dominated Pareto-optimal front obtained by MOGA clustering for Yeast Sporulation data setFigure 8The final non-dominated Pareto-optimal front obtained by MOGA clustering for Yeast Sporulation data set.
Page 14 of 16(page number not for citation purposes)
BMC Bioinformatics 2009, 10:27 http://www.biomedcentral.com/1471-2105/10/27
Rat CNSThe Rat CNS data set has been obtained by reverse tran-scription-coupled PCR to examine the expression levels ofa set of 112 genes during rat central nervous system devel-opment over 9 time points [30]. This data set is availableat http://faculty.washington.edu/kayee/cluster.
All the data sets are normalized so that each row has mean0 and variance 1.
Performance MetricsFor evaluating the performance of the clustering algo-rithms silhouette index [40] is used. Moreover, two clustervisualization tools, namely, Eisen plot and cluster profileplot, have been utilized.
Silhouette IndexSilhouette index [40] is a cluster validity index that is usedto judge the quality of any clustering solution C. Supposea represents the average distance of a point from the otherpoints of the cluster to which the point is assigned, and brepresents the minimum of the average distances of thepoint from the points of the other clusters. Now the sil-houette width s of the point is defined as:
silhouette index s(C) is the average silhouette width of allthe data points (genes) and it reflects the compactness andseparation of clusters. The value of silhouette index variesfrom -1 to 1 and higher value indicates better clusteringresult.
Eisen PlotIn Eisen plot [2] (see Fig. 2(a) for an example), the expres-sion value of a gene at a specific time point is representedby coloring the corresponding cell of the data matrix witha color similar to the original color of its spot on themicroarray. The shades of red represent higher expressionlevels, the shades of green represent lower expression lev-els and the colors towards black represent absence of dif-ferential expression. In our representation, the genes areordered before plotting so that the genes that belong tothe same cluster are placed one after another. The clusterboundaries are identified by white colored blank rows.
Cluster Profile PlotThe cluster profile plot (see Fig. 2(b) for an example)shows for each cluster the normalized gene expression val-ues (light green) of the genes of that cluster with respect tothe time points. Also, the average expression values of thegenes of a cluster over different time points are plotted asa black line together with the standard deviation withinthe cluster at each time point.
Input ParametersThe values of the different parameters of MOGA and sin-gle objective GA are as follows: number of generations =100, population size = 50, crossover probability = 0.8 andmutation probability = 0.01. Both α and β are set to 0.5.The parameter values have been set after several experi-ments. The fuzzy exponent m is chosen as in [41,42], andthe values of m for the data sets Sporulation, Cell Cycle,Arabidopsis, Serum and Rat CNS are obtained as 1.34,1.14, 1.18, 1.25 and 1.21, respectively. The fuzzy C-meansalgorithm has been run for 200 iterations unless it con-verges before that. Each algorithm has been executed fordifferent number of clusters and the solution giving thebest silhouette index score is considered.
Authors' contributionsU. Maulik carried out the literature study and pre-workplanning, collected the data sets, developed the code, per-formed the experiments and prepared the draft of themanuscript. A. Mukhopadhyay did the literaure study,collected the data sets, developed the code, performed theexperiments and prepared the draft of the manuscript. S.Bandyopadhyay carried out the pre-work planning,worked on the conceptual part and corrected the draft. Allthe authors read and approved the final manuscript.
AcknowledgementsThe authors gratefully acknowledge the comments of the anonymous reviewers which helped them in improving the quality of the paper. Sang-hamitra Bandyopadhyay gratefully acknowledges the financial support from the grant no. DST/SJF/ET-02/2006-07 under the Swarnajayanti Fellowship scheme of the Department of Science and Technology, Government of India.
References1. Alizadeh AA, Eisen MB, Davis R, Ma C, Lossos I, Rosenwald A, Bold-
rick J, Warnke R, Levy R, Wilson W, Grever M, Byrd J, Botstein D,Brown PO, Straudt LM: Distinct types of diffuse large B-celllymphomas identified by gene expression profiling. Nature2000, 403:503-511.
2. Eisen MB, Spellman PT, Brown PO, Botstein D: Cluster analysisand display og genome-wide expression patterns. Proc NatAcademy of Sciences, USA 1998:14863-14868.
3. Bandyopadhyay S, Maulik U, Wang JT: Analysis of Biological Data: A SoftComputing Approach World Scientific; 2007.
4. Lockhart DJ, Winzeler EA: Genomics, Gene Expreesion andDNA Arrays. Nature 2000, 405:827-836.
5. Jain AK, Dubes RC: Algorithms for Clustering Data Englewood Cliffs, NJ:Prentice-Hall; 1988.
6. Bezdek JC: Pattern Recognition with Fuzzy Objective Function AlgorithmsNew York: Plenum; 1981.
7. Goldberg DE: Genetic Algorithms in Search, Optimization and MachineLearning New York: Addison-Wesley; 1989.
8. Maulik U, Bandyopadhyay S: Genetic Algorithm Based Cluster-ing Technique. Pattern Recognition 2000, 33:1455-1465.
9. Maulik U, Bandyopadhyay S: Fuzzy partitioning using a real-coded variable-length genetic algorithm for pixel classifica-tion. IEEE Transactions on Geoscience and Remote Sensing 2003,41(5):1075-1081.
10. Bandyopadhyay S, Mukhopadhyay A, Maulik U: An Improved Algo-rithm for Clustering Gene Expression Data. Bioinformatics2007, 23(21):2859-2865.
11. Bandyopadhyay S, Maulik U, Mukhopadhyay A: MultiobjectiveGenetic Clustering for Pixel Classification in Remote Sens-
sb a
max a b= −
{ , }. (8)
Page 15 of 16(page number not for citation purposes)

BMC Bioinformatics 2009, 10:27 http://www.biomedcentral.com/1471-2105/10/27
Publish with BioMed Central and every scientist can read your work free of charge
"BioMed Central will be the most significant development for disseminating the results of biomedical research in our lifetime."
Sir Paul Nurse, Cancer Research UK
Your research papers will be:
available free of charge to the entire biomedical community
peer reviewed and published immediately upon acceptance
cited in PubMed and archived on PubMed Central
yours — you keep the copyright
Submit your manuscript here:http://www.biomedcentral.com/info/publishing_adv.asp
BioMedcentral
ing Imagery. IEEE Transactions on Geoscience and Remote Sensing2007, 45(5):1506-1511.
12. Handl J, Knowles J: An evolutionary approach to multiobjectiveclustering. IEEE Transactions on Evolutionary Computation 2006,11:56-76.
13. Deb K, Pratap A, Agrawal S, Meyarivan T: A fast and elitist multi-objective genetic algorithm: NSGA-II. IEEE Transactions on Evo-lutionary Computation 2002, 6:182-197.
14. Xie XL, Beni G: A Validity Measure for Fuzzy Clustering. IEEETransactions on Pattern Analysis and Machine Intelligence 1991,13:841-847.
15. Vapnik V: Statistical Learning Theory New York, USA: Wiley; 1998. 16. Herrero J, Valencia A, DopazoM J: A Hierarchical Unsupervised
Growing Neural Network for Clustering Gene ExpressionPatterns. Bioinformatics 2001, 17(2):126-136.
17. Horzyk A: Unsupervised Clustering using Self-OptimizingNeural Networks. In Proc 5th Int Conf Intelligent System Design andApplications Washington DC, USA: IEEE Computer Society;2005:118-123.
18. Xiang C, Yong PC, Meng LS: Design of multiple-level hybrid clas-sifier for intrusion detection system using Bayesian cluster-ing and decision trees. Pattern Recognition Letters 2008, 918–924(29):7.
19. Selim SZ, Alsultan K: A Simulated Annealing Algorithm for theClustering Problem. Pattern Recognition 1991, 24:1003-1008.
20. Davidson I: Clustering Using the Minimum Message LengthCriterion and Simulated Annealing. In 3rd International Work-shop on Artificial Intelligence Prague, Czech Republic; 1996.
21. Lukashin AV, Fuchs R: Analysis of temporal gene expressionprofiles: clustering by simulated annealing and determiningthe optimal number of clusters. Bioinformatics 2001,17(5):405-419.
22. Bandyopadhyay S, Maulik U, Pakhira MK: Clustering using Simu-lated Annealing with Probabilistic Redistribution. Int J PatternRecognition and Artificial Intelligence 2001, 15(2):269-285.
23. Bandyopadhyay S, Saha S, Maulik U, Deb K: A Simulated Anneal-ing-based Multiobjective Optimization Algorithm: AMOSA.IEEE Transactions on Evolutionary Computation 2008, 12(3):269-283.
24. Tamayo P, Slonim D, Mesirov J, Zhu Q, Kitareewan S, Dmitrovsky E,Lander E, Golub T: Interpreting patterns of gene expressionwith self-organizing maps: Methods and application tohematopoietic differentiation. Proc Natl Acad Sci U S A 1999,96(6):2907-2912.
25. Qin ZS: Clustering microarray gene expression data usingweighted Chinese restaurant process. Bioinformatics 2006,22(16):1988-1997.
26. Tou JT, Gonzalez RC: Pattern Recognition Principles Reading: Addison-Wesley; 1974.
27. Crammer K, Singer Y: On the Algorithmic Implementation ofMulticlass Kernel-based Vector Machines. J Machine LearningResearch 2001, 2:265-292.
28. Sharan R, Adi MK, Shamir R: CLICK and EXPANDER: a systemfor clustering and visualizing gene expression data. Bioinfor-matics 2003, 19:1787-1799.
29. Chu S, DeRisi J, Eisen M, Mulholland J, Botstein D, Brown PO, Her-skowitz I: The Transcriptional Program of Sporulation in Bud-ding Yeast. Science 1998, 282:699-705.
30. Wen X, Fuhrman S, Michaels GS, Carr DB, Smith S, Barker JL, Som-ogyi R: Large-scale temporal gene expression mapping ofcentral nervous system development. Proc Natl Acad Sci U S A1998, 95(1):334-339.
31. Xu Y, Olman V, Xu D: Minimum Spanning Trees for GeneExpression Data Clustering. Genome Informatics 2001, 12:24-33.
32. Hollander M, Wolfe DA: Nonparametric Statistical Methods Second edi-tion. 1999.
33. Tavazoie S, Hughes J, Campbell M, Cho R, Church G: Systematicdetermination of genetic network architecture. Nature Genet1999, 22:281-285.
34. Coello Coello CA: Evolutionary multiobjective optimization:A historical view of the field. IEEE Computational Intelligence Mag-azine 2002, 1:28-36.
35. Zitzler E, Laumanns M, Thiele L: SPEA2: Improving the StrengthPareto Evolutionary Algorithm. Tech. Rep. 103, Gloriastrasse35, CH-8092 Zurich, Switzerland; 2001.
36. Hsu CW, Lin CJ: A comparison of methods for multi-class sup-port vector machines. IEEE Transactions on Neural Networks 2002,13(2):415-425.
37. Cho RJ, Campbell MJ, Winzeler EA, Steinmetz L, Conway A, WodicaL, TGW , et al.: A genome-wide transcriptional analysis ofmitotic cell cycle. Mol Cell 1998, 2:65-73.
38. Reymonda P, Webera H, Damonda M, Farmera EE: DifferentialGene Expression in Response to Mechanical Wounding andInsect Feeding in Arabidopsis. Plant Cell 2000, 12:707-720.
39. Iyer VR, Eisen MB, Ross DT, Schuler G, Moore T, Lee J, Trent JM,Staudt LM, Hudson JJ, Boguski MS, Lashkari D, Shalon D, Botstein D,Brown PO: The Transcriptional Program in the Response ofthe Human Fibroblasts to Serum. Science 1999, 283:83-87.
40. Rousseeuw P: Silhouettes: a graphical aid to the interpretationand validation of cluster analysis. J Comp App Math 1987,20:53-65.
41. Kim SY, Lee JW, Bae JS: Effect of data normalization on fuzzyclustering of DNA microarray data. BMC Bioinformatics 2006,7:134.
42. Dembele D, Kastner P: Fuzzy C-means method for clusteringmicroarray data. Bioinformatics 2003, 19(8):973-980.
Page 16 of 16(page number not for citation purposes)
http://www.ncbi.nlm.nih.gov/entrez/query.fcgi?cmd=Retrieve&db=PubMed&dopt=Abstract&list_uids=9784122
http://www.ncbi.nlm.nih.gov/entrez/query.fcgi?cmd=Retrieve&db=PubMed&dopt=Abstract&list_uids=9784122
http://www.ncbi.nlm.nih.gov/entrez/query.fcgi?cmd=Retrieve&db=PubMed&dopt=Abstract&list_uids=9419376
http://www.ncbi.nlm.nih.gov/entrez/query.fcgi?cmd=Retrieve&db=PubMed&dopt=Abstract&list_uids=9419376
http://www.ncbi.nlm.nih.gov/entrez/query.fcgi?cmd=Retrieve&db=PubMed&dopt=Abstract&list_uids=9702192
http://www.ncbi.nlm.nih.gov/entrez/query.fcgi?cmd=Retrieve&db=PubMed&dopt=Abstract&list_uids=9702192
http://www.ncbi.nlm.nih.gov/entrez/query.fcgi?cmd=Retrieve&db=PubMed&dopt=Abstract&list_uids=9872747