Exploration on Automated Software Requirement Document ...
73
Master of Science in Software Engineering June 2017 Faculty of Computing Blekinge Institute of Technology SE-371 79 Karlskrona Sweden Exploration on Automated Software Requirement Document Readability Approaches CHEN, MINGDA and HE, YAO
-
Upload
khangminh22 -
Category
Documents
-
view
1 -
download
0
Transcript of Exploration on Automated Software Requirement Document ...

Master of Science in Software Engineering June 2017
Faculty of Computing Blekinge Institute of Technology SE-371 79 Karlskrona Sweden
Exploration on Automated Software
Requirement Document Readability
Approaches
CHEN, MINGDA and HE, YAO
ii
This thesis is submitted to the Faculty of Computing at Blekinge Institute of Technology in partial fulfillment of the requirements for the degree of Master of Science in Software Engineering. The thesis is equivalent to 20 weeks of full time studies.
Contact Information: Author(s): MINGDA CHEN E-mail: [email protected] YAO HE Email: [email protected]
University advisor: Dr. Michael Unterkalmsteiner Department of Software Engineering E-mail: [email protected]
Faculty of Computing Blekinge Institute of Technology SE-371 79 Karlskrona, Sweden
Internet : www.bth.se Phone : +46 455 38 50 00 Fax : +46 455 38 50 57

ABSTRACT
Context. The requirements analysis phase, as the very beginning of software development process,
has been identified as a quite important phase in the software development lifecycle. Software
Requirement Specification (SRS) is the output of requirements analysis phase, whose quality factors
play an important role in the evaluation work. Readability is a quite important SRS quality factor, but
there are few available automated approaches for readability measurement, because of the tight
dependency on readers' perceptions. Low readability of SRS documents has a serious impact on the
whole process of software development. Therefore, it's extremely urgent to propose effective
automated approaches for SRS documents readability measurement. Using traditional readability
indexes to analyze readability of SRS documents automatically is a potentially feasible approach.
However, the effectiveness of this approach is not systematically evaluated before.
Objectives. In this study, firstly, we aim to understand the readability of texts and investigate
approaches to score texts readability manually. Then investigate existing automated readability
approaches for texts with their working theories. Next, evaluate the effectiveness of measuring the
readability of SRS documents by using these automated readability approaches. Finally, rank these
automated approaches by their effectiveness.
Methods. In order to find out the way how human score the readability of texts manually and
investigate existing automated readability approaches for texts, systematic literature review is chosen
as the research methodology. Experiment is chosen to explore the effectiveness of automated
readability approaches.
Results. We find 67 articles after performing systematic literature review. According to systematic
literature review, human judging the readability of texts through reading is the most common way of
scoring texts readability manually. Additionally, we find four available automated readability
assessments tools and seven available automated readability assessments formulas. After executing
the experiment, we find the actual value of effectiveness of all selected approaches are not high and
Coh-Metrix presents the highest actual value of effectiveness of automated readability approach
among the selected approaches.
Conclusions. Coh-Metrix is the most effective automated readability approach, but the feasibility in
directly applying Coh-Metrix in SRS documents readability assessments cannot be permitted. Since
the actual value of evaluated effectiveness is not high enough. In addition, all selected approaches are
based on metrics of readability measures, but no semantic factors are blended in readability
assessments. Hence studying more on human perception quantifying and adding semantic analysis in
SRS documents readability assessment could be two research directions in future.
Keywords: Readability Measurement, Software
Requirement Specification, Automated Approach

ACKNOWLEDGEMENT First and foremost, we would like to acknowledge our supervisor Dr. Michael
Unterkalmsteiner for his help, guidance and patience on our research. He guided us to determine the research direction and provide professional opinions on our research process. In addition, he helped us improve the quality of thesis report. It's our honor to invite him as our supervisor and we are appreciated to work with him.
In addition, we would like to acknowledge the examiner Dr. Jürgen Börstler for his professional advice and feedback on our thesis topic and proposal report. He helped us to determine the research direction.
Then we would like to acknowledge with all the participants who help us with the experiment, and thank for their patience with our experiment materials. They provide valuable results which provide plenty of help for our research.
Finally, we would like to acknowledge our families and friends for supporting and encouraging us to step further in this research topic. We cannot accomplish this research and thesis without their supports and help.

iii
CONTENTS ABSTRACT ............................................................................................................. I
ACKNOWLEDGEMENT .......................................................................................... II
CONTENTS........................................................................................................... III
1 INTRODUCTION ............................................................................................. 1
1.1 AIMS AND OBJECTIVES ....................................................................................... 2 1.2 RESEARCH QUESTIONS ......................................................................................... 2 1.3 EXPECTED OUTCOMES ......................................................................................... 3
2 BACKGROUND AND RELATED WORK .............................................................. 4 2.1 SOFTWARE REQUIREMENTS SPECIFICATIONS ............................................................ 4 2.2 QUALITY OF SRS DOCUMENTS .............................................................................. 4 2.3 READABILITY ASSESSMENT ................................................................................... 5 2.4 RELATED WORK .................................................................................................. 5
3 METHODOLOGY ............................................................................................ 7
4 SYSTEMATIC LITERATURE REVIEW ................................................................. 9 4.1 REVIEW QUESTION ............................................................................................. 9 4.2 NEED FOR REVIEW .............................................................................................. 9 4.3 SEARCH STRATEGY .............................................................................................. 9
4.3.1 Data Sources ......................................................................................... 10 4.3.2 Keywords .............................................................................................. 10
4.4 STUDY SELECTION CRITERIA AND PROCEDURE ....................................................... 11 4.4.1 First Round Selection Criteria ............................................................... 12 4.4.2 Second Round Selection Criteria ........................................................... 13 4.4.3 Full-text reading ................................................................................... 15
4.5 STUDY QUALITY ASSESSMENT CRITERIA ............................................................... 15 4.5.1 Scoring for Rigor ................................................................................... 15 4.5.2 Scoring for Relevance ........................................................................... 16 4.5.3 Pilot Study of Quality Assessment ........................................................ 17
4.6 DATA EXTRACTION STRATEGY ............................................................................. 17 4.7 VALIDITY THREATS ............................................................................................ 18 4.8 SYSTEMATIC RESULT OF LITERATURE REVIEW ........................................................ 19
4.8.1 Research domain .................................................................................. 20 4.8.2 Approach .............................................................................................. 21 4.8.3 Cross Analysis of Research domain and Approach .............................. 21 4.8.4 Rigor/Relevance ................................................................................... 23
4.9 CONCLUSION OF LITERATURE REVIEW .................................................................. 23 4.10 DISCUSSION ................................................................................................. 30
5 EXPERIMENT ............................................................................................... 32 5.1. SCOPING ...................................................................................................... 32
5.1.1. Goal Definition ..................................................................................... 32 5.1.2. Summary of Scoping ............................................................................. 33
5.2 CONTEXT SELECTION ................................................................................. 33

iv
5.3 HYPOTHESIS FORMULATION ...................................................................... 33 5.4 VARIABLES SELECTION .............................................................................. 34 5.5 SELECTION OF SUBJECTS ............................................................................ 34 5.6 SELECTION OF OBJECTS ............................................................................. 34 5.7 EXPERIMENT DESIGN .................................................................................. 34 5.8 INSTRUMENTATION ..................................................................................... 38 5.9 PRE-DESIGNED SRS DOCUMENT DESIGN................................................... 38 5.10 READABILITY LEVEL DEFINE ................................................................. 39 5.11 THREATS TO VALIDATE .......................................................................... 40 5.12 OPERATION .............................................................................................. 41 5.13 RESULT .................................................................................................... 41 5.14 CONCLUSION ........................................................................................... 44
6 CONCLUSION AND FUTURE WORK ............................................................... 46 6.1 CONCLUSION ............................................................................................... 46 6.2 FUTURE WORK ............................................................................................ 47
REFERENCES ....................................................................................................... 49
APPENDIX ONE ................................................................................................... 54
APPENDIX TWO .................................................................................................. 57
APPENDIX THREE ................................................................................................ 64

v
List of Table Table 4.3.1-1 E-databases Used in the Literature Review ......................................... 10 Table 4.3.2-1 Search sting used for each E-databases ............................................... 10 Table 4.4.2-1 Different situations about the reviewer opinion .................................. 13 Table 4.4.2-2 Results of the pilot second round selection ......................................... 14 Table 4.4.2 3 Results of the second round selection .................................................. 15 Table 4.5.3-1 Results of the pilot study of study quality assessment ........................ 17 Table 4.8-1 Result of Literature Review classification indexes ................................ 19 Table 4.8.1-1 Research domain of Literature ............................................................. 20 Table 4.8.2-1 Approach of Literature ........................................................................ 21 Table 4.8.3-1 Result of Cross Analysis ...................................................................... 22 Table 4.9-1 Advantages and disadvantages of 0-100 and easy/medium/hard ........... 24 Table 4.9-2 Advantages and disadvantages of different identities of participants..... 24 Table 4.9-3 Definition of Parameters ......................................................................... 26 Table 4.9-4 Specification Metrics .............................................................................. 26 Table 4.9-5 Rules of ranking Flesch reading ease score ............................................ 28 Table 4.9-6 Rules of ranking Dale-Chall score .......................................................... 29 Table 4.9-7 Summary of seven formulas ................................................................... 29 Table 5.7-1 Example of an automated approach evaluation result (30RQs) ............. 35 Table 5.7-2 Example of testing oracle (30RQs) ......................................................... 36 Table 5.7-3 Example of categorizing ranked requirements (30RQs) ........................ 36 Table 5.13-1 The summary of experiment participants' characteristics ..................... 41 Table 5.13-2 Matched requirement ID for Low readability ....................................... 43 Table 5.13-3 The quantity of matched requirement and matched ratio for different
approaches .......................................................................................................... 43 Table 6.2-1 Example of applying automated approaches .......................................... 47

vi
List of Figure Figure 3-1Relation among Research Questions and Methodologies ........................... 7 Figure 4.4-1 Overview of literature selection of primary studies .............................. 12 Figure 4.8.3-1 Overview of cross analysis of research domain and approach ........... 22 Figure 4.8.4 1 Overview of literature quality score ................................................... 23 Figure 5.7-1 Experiment process ............................................................................... 37 Figure 5.13-1 Requirement count for different readability sets ................................. 42 Figure 5.13-2 Total matched requirement percentage for different approaches ........ 44

1
1 INTRODUCTION With the rapid development of software, software developers pay more attention to how
to develop the software product well. There are sources and assistance programs helping developers do better work in all software development phases, including requirements analysis, architecture design, coding and testing. However, the requirements analysis phase, as the very beginning of software development process, has been identified as the source of the majority of the defects due to poor requirements analysis; furthermore, these defects are rather difficult to repair [1] [2]. Thus, controlling the quality of the software requirement analysis phase plays an important role in the whole software development [3]. One of the essential issues of this phase is that stakeholders, especially customers and users who have certain needs and expectations to the software product. However, they often state what they want in an incomplete, contradicting and inconsistent way [ 4 ], because they lack professional software development knowledge. Therefore, it is necessary to establish stable and reliable agreement among stakeholders. More unambiguous and complete requirements can raise the probability of software project success [5]. There are techniques, tools and approaches aiming at improving the agreement and helping requirement engineers gather, analyze and document requirements. However, there are still some requirements problems [6]. They result from kinds of reasons, and quality of Software Requirement Specification (SRS) is one of the most important factors that can be measured in requirements problems analysis. Hence we are interested in the SRS quality measurement.
As natural language requirements are widely used in software development domain [7], we focus on natural language SRS. It is risky to use natural language to document SRS [8] due to drawbacks of natural language such as informality and inherent ambiguity [7]. For example, the SRS may be documented by multiple analysts, which may cause different linguistic quality and language styles in SRS. This problem may lead to difficulty in correctness and understandability. However, there are also some advantages to using natural language in SRS. For instance, it is easy to share natural language SRS with people that have different roles in the software project [9]. Because of the risk of documenting natural language SRS, it is important to use techniques and approaches to evaluate the quality of natural language SRS [10].
Readability, a quite important SRS quality factor [64], is difficult to be measured automatically because of tight dependency on readers' perceptions [113]. Besides, paper [65] points out that SRS defects that caused by the low readability of SRS documents have a serious impact on the whole process of software development. It indicates the necessity of measuring the readability of SRS documents. For the sake of improving the effectiveness and efficiency of SRS readability measurement, we aim at measuring the readability of SRS in an automated way. In detail, effectiveness refers to if accuracies of automated readability approaches are acceptable, and efficiency refers to less time cost than existing SRS readability measurement. In our study, efficiency can be achieved by automated manner. Thus, we focus more on effectiveness of SRS readability measurement. However, the gap in SRS readability measurement domain is that software requirement engineers are trained and required to improve readability of SRS by applying some methods with automated tools [6], but there are no advisable automated approaches of SRS readability evaluation according to our primary study. According to paper [ 11 ], traditional texts readability indexes F.K. Reading Ease and the F.K. Grade Level has been tested to evaluate SRS automatically. However, the volume of experiment sample in this paper is too small so that the conclusion of this paper is questionable from our perspective. Although we do not agree with the conclusion, this paper presents potentially feasible idea that SRS can be measured in an automated way. Hence the goal of this study is to evaluate that if existing automated texts readability approaches can measure SRS documents accurately. In order to achieve the goal, there are two main steps: Search for available automated texts readability approaches and

2
then evaluate the feasibility of applying these automated readability approaches to measuring the readability of SRS documents.
The contribution of this research is: This research provides the result of systematic literature review for human
readability approach and automated text readability measurement approach. This research provides a possible approach for SRS document readability
measurement, that is use automated text readability measurement approach to measure the readability of SRS document readability.
This research identify the existing automated readability measurement approach have no relationship with semantics analysis.
This research provides a way to reflect readability measurement results from human judgment and automated approach measurement.
This research provides the ranking way to use automated SRS document readability measurement approach in real practice.
This thesis report is structured as follows: Section 1 discusses aims and objectives,
research question and expected outcome. Section 2 presents related background. Section 3 explains the motivation and selection of methodologies. Section 4 introduces the process of systematic literature review and its results. Section 5 introduces the process of experiment methodology and its result. Section 6 summaries the conclusion of this research and discusses the future work.
1.1 Aims and objectives
The overall aim of our research is to evaluate to what extent it is possible to use automated texts readability approaches to assess the readability of SRS documents. For the sake of meeting our research aim, the aim is decomposed into five study objectives and they are defined as follows:
a. Understand readability of texts and investigate approaches to scoring text readability. b. Investigate existing automated texts readability approaches. c. Investigate theories about searched readability approaches. d. Evaluate the accuracy of measuring the readability of SRS by using these automated
readability approaches. e. Rank these automated approaches by their effectiveness.
1.2 Research questions
For our research, we focus on assessing the readability of SRS automatically. Thus, the primary task it that we need to understand readability clearly. In other word, we need to know how to score readability of texts since we need to compare the results from human judgment approaches and automated readability approaches. Human judgment approaches refer to human judge the readability of texts through reading. This part mainly focuses on approaches that score texts readability according to human perceptions instead of readability index. Hence the first Research Question is generated as follows:
RQ1: How do humans score readability of text?
Secondly, we need to find out the existing approaches for measuring the readability of texts as well as the theories support for readability measurement. Hence we can formulate the Research Question 2 and Research Question 2.1 as:
RQ2: What automated approaches are used to measure the readability of text? RQ2.1: What are the theories of these automated approaches?

3
Finally, we need to evaluate whether automated readability approaches perform as good as human judgment. In other words, if a person judges that a requirement is written understandably, do automated readability approaches come to the same conclusion? Formally, we need to evaluate the effectiveness of automated readability approaches. The Research Question 3 is generated as:
RQ3: What is the performance of automated SRS readability approaches in terms of effectiveness?
1.3 Expected outcomes Following are the expected outcomes of this study:
a. A list, comparison and discussion of existing approaches of how humans can score the readability of texts.
b. A list, comparison and discussion of existing automated approaches for measuring the readability of texts.
c. A discussion of the theoretical foundations about these automated approaches. d. An evaluation of whether automated readability SRS approaches are effective.

4
2 BACKGROUND AND RELATED WORK Nowadays software-related industries are in a state of rapid development, so it is
important to improve the quality and success rate of software development. For software development, there are four main phases, including requirements analysis, architecture design, coding and testing. As the very beginning of software development, requirements analysis is very important for the whole life cycle, if any defects happen because of bad requirements analysis, these defects will influence the whole life cycle of development and cost much more efforts to fix later [1]. Hence it's important to monitor the quality of requirements. Requirements, often addressed by natural language, which cause a potential problem in requirements analysis phase, that is the misunderstanding of requirement [3]. Stakeholders may have different understandings to the same natural language requirement due to background difference of stakeholders and low level quality of requirements when they validate the SRS [4].
In this section, we illustrate what is software requirements specifications, quality criteria of SRS documents, SRS readability assessment and related work.
2.1 Software requirements specifications
Software requirements specifications are the output of requirements analysis phase of software development. In general, it should specify inputs to the software system and corresponding output for each input [6]. Software requirements analysts direct the creation of SRS documents, but other stakeholders should be also involved in this phase, such as customers, users, suppliers and so on. Because as the beginning of software development, software analysts need to understand real needs of the software accurately and ensure the way of how to achieve the needs [6]. SRS documents are regarded as the agreements among all stakeholders and when SRS documents are generated, they become guidelines for following development. For example, software developers should follow the requirements description of SRS documents.
There are five kinds of requirements that should be specified, including data requirements, functional requirements, non-functional requirements, managerial requirements and other related deliveries. Presenting techniques are chosen to state requirement clearly, such as task descriptions and scenarios [6].
In addition, it is necessary to explain the difference between SRS document and general text. Compare to general text, the target readers of SRS document are software development related stakeholders. These stakeholders have certain background knowledge or specify needs of the software. On the other hand, compare to general text, SRS document is a professional document, which means there are specific standards of writing SRS document. Besides, as a professional document, terminologies, which are always not understandable for general reader, appear in SRS documents inevitably.
2.2 Quality of SRS documents
According to IEEE Std. 830-1998 and descriptions in book [6], eight quality criteria are defined for SRS. SRS documents should be correct, complete, unambiguous, consistent, ranked for importance and stability, modifiable, verifiable and traceable. In detail, Correctness refers to that all requirements are correct. Completeness refers to that all user needs are included and have been stated as software
requirements. Unambiguity refers to that all parties state the same meaning for each requirements.
Readability, or named as understandability in some papers, is part of this quality criterion. It refers to the ease about how readers understand the written requirements.

5
Consistency refers to that all parts in SRS documents do not conflict. Ranked for importance and stability refers to that all requirements should contain their
priorities and expected frequency of changes. Modifiability refers to that SRS documents should be easy to modify consistency
should be ensured after modifying. Verifiability refers to that there are economically feasible ways to check if
requirements meet original needs. Traceability refers to that all requirements should be backward-traceable to goals of the
software projects and forwards-traceable to design and code that come from following phases.
2.3 Readability assessment Readability, as the part of quality criterion, refers to the ease about how readers
understand the written requirements. There are three types of checks for SRS documents, including contents check, structure check and consistency checks. Those checks are used to validate above quality criteria. Readability is measured by human reading since those checks require human participation. One of the techniques that used to improve the readability of SRS documents is adding term glossary [6]. Term glossary is a list of special terms that used in SRS documents with corresponding definitions. However, there are few formal techniques that used to measure the readability of SRS documents. Hence human reading is the wide-used assessment for SRS readability. Readability also influences the quality of requirements. Poor readability directly influence the accurate understanding for people towards natural language requirements [113]. However, due to the tight relationship with readability and readers' perceptions, it's very hard to measure the readability in an objective way. Besides, due to the heavy workload of analyzing readability of SRS, it is not efficient enough to measure the readability in manual ways.
2.4 Related work
According to primary study, we find that readability is an important quality factor of a SRS document [64]. Hence, the readability of SRS documents should be underlined. On the other hand, if the readability of SRS documents cannot be ensured, subsequent work can be in a mess [65]. However, there are only two automated approaches that directly point to automated SRS documents readability measurement. According to study [59], a solution that checking the conformance of software requirement boilerplates is advised. However, the limitation of this solution is that only one of the software requirement boilerplates can be checked. Paper [11] provides another solution to assess the readability of SRS documents, that is, using traditional texts readability indexes F.K. Reading Ease and the F.K. Grade Level. The paper points out that using traditional texts readability indexes to assess the readability of SRS documents is useless. However, Paper [105] gives us more optimistic attitudes to apply readability indexes in SRS document readability assessment. It indicates that readability indexes are good at evaluating the readability of texts, but assessing the readability in expertise domain by readability indexes requires more studies. According to study [46] , assessing the readability of the texts in medical field with readability indexes and their complementary approach are feasible. Besides, researchers in education field and medical care filed directly use readability measure tools, like Coh-Metrix to analyze the readability of professional documents in these field [12,13 ]. Based on [18], limitations and drawbacks of readability formulas should be noticed.
Considering the difficulty of generating a totally new solution to assess the readability of SRS documents automatically, we decide to borrow the idea that applying automated texts readability approaches in SRS documents readability assessments. With respect to the related work, our contributions include sort out readability assessments approaches that can be run

6
in automated ways and figure out if assessing readability of SRS documents by using these approaches directly is effective.

7
3 METHODOLOGY Systematic literature review and experiment are chosen in this study, Figure 3-1 shows
the relation among research questions and methodologies.
Figure 3-1Relation among Research Questions and Methodologies
In this study, we select systematic literature review as the research methodology for
background knowledge collection and experiment preparation. This decision is based on following advantages and discussions.
Advantages of systematic literature review: Systematic literature review is a suitable methodology for us to summary the result
of primary study, and find out the knowledge we need for the experiment study. In addition, it can provide existing evidence for our research topic [16].
Systematic literature review can identify the existing gaps for readability related research especially towards software requirements [16].
Systematic literature review can provide more background for new research [16].
Alternatives discussions: Systematic literature review is more complex than traditional literature review at
the beginning. In detail, we need to define review protocols, search strategies, strict inclusion and exclusion criteria, and quantitative analysis strategies. Then follow the protocols and strategies to avoid biased situations. This process costs much more effort than traditional literature review, but the effectiveness and quality can be improved [17].
In this study, deep knowledge and insights of readability measurement approaches are highly required. Thus, systematic literature review is more suitable than mapping study under this circumstance.
Another method is snowballing. However, in our research, we don't select snowballing, because one of the disadvantages of snowballing is sometimes we

8
may miss some articles through snowballing. In addition, since our research request us to step into medical field, educational field and software engineering field, which means this is a Multi-field search. For example, we start from a medical field article which is related to readability. Through snowballing, we may get hundreds of articles which provide medical knowledge but not readability related.
Experiment is chosen to explore the effectiveness of automated readability approaches. This decision is based on following advantages and discussions:
Advantages of Experiment: Experiment can provide the comparison among different variables [14]. In our
study, comparing readability assessments results from human judgment and automated approaches is required.
According to our primary study, there is no convincing results about the effectiveness assessments of automated SRS documents readability measurement. Therefore, performing an experiment is necessary to evaluate the effectiveness of automated SRS readability measurement.
In this study, the research situation is required to be controlled over, the research process is required to be systematical and precise, and more than two treatments are required to be considered in the process. Hence experiment is advisable to launch [44].
As we mentioned before, readability have tight dependency on readers' perceptions, which indicates the experiment is performed in real life context. Besides, we need to ensure that the research results are based on real life work. In this situation, an experiment is the best option [44].
Alternative discussions: Except for experiment, another alternative methodology is case study. These
research methodologies both allow researchers to analyze the main subjects by several different approaches [44]. However, case study is more like a methodology that explores a research topic in depth [15], and experiment focuses on comparing two or more different variables when we use them to test a hypothesis [44]. In our study, we want to compare different approaches when we use them to test the readability of SRS documents. Thus, experiment is a better option. In addition, experiment is easier to control than case study and costs less than case study [44].

9
4 SYSTEMATIC LITERATURE REVIEW For the sake of answering research question 1, 2 and 2.1, a systematic literature review
is performed based on the guideline of Kitchenham et al.[16]. Through the systematic literature review, we aim at finding out how do humans score the readability of texts and the existing automated texts readability approaches for the experiment methodology.
4.1 Review Question
To satisfy the purpose of this research, in this systematic literature review, we generate the following research questions:
RQ1: How do humans score readability of text? RQ2: What automated approaches are used to measure the readability of text? RQ2.1: What are the theories of these automated approaches?
4.2 Need for Review
Before starting the systematic literature review, the first and the most important thing is to identify any existed literature review for this research topic and field. For this purpose, a search was performed in different databases. In order to maximize the discovery scale of related literature review reports, we set the keywords based on the search string that are listed in Ali et al.[17]. The search work was performed in 2017 and databases we chose are introduced in section 4.3.1. We set following search string:
readability AND (measurement OR approach OR tool) AND ("systematic literature review" OR "literature review" OR "systematic research synthesis" OR "research synthesis" OR "systematic review" OR "research review" OR "research integration" OR "integrative research review" OR "integrative review" OR "systematic overview")
By searching this string, we get 25 related reports totally without repetition. After validating report by its titles, abstracts and conclusions, we find out one target report[18]. It reports some related results of a systematic literature review about the readability formula in George Klare's The Measurement of Readability [19].
After reading this report, we find several limitations of this systematic literature review. In detail, we summarize three main limitations as follows:
They came out with the results of the literature review in 2000, so it did not include improved formulas or new formulas during the next 17 years.
Detail information of different formulas are not given. Only a conclusion is presented that readability formulas are poor at dealing with readability deviation that caused by reader differences and other factors. Hence these formulas are not valuable as the base of assessment tools.
Solutions about mitigating above limitations of readability formulas are not given.
Although there are limitations in this report, we still think it's meaningful to our research. First of all, this report points out that regular readability formulas and related automated tools are not advisable to assess the readability of some technical material. It indicates the gap in assessing the readability of expertise documents. Besides, this article explains the reasons why these readability formulas do not work well, which broaden our horizons for future work.
4.3 Search Strategy

10
In this section, we discuss search strategies such as selection of E-databases with the motivation.
4.3.1 Data Sources
Our study focuses on the automated SRS documents readability measures, which indicates that we need to find related literature or researches in the E-databases about software engineering(SE) and computer science(CS) domain. However, we may need to step into education field since there are some researches on readability that are mainly related to education work [20, 21, 22]. To find out as much related literature as possible, following E-databases are chosen for this systematic literature review. Table 4.3.1-1 shows the E-databases used in the systematic literature review.
Table 4.3.1-1 E-databases Used in the Literature Review Database Motivation IEEE These E-databases will cover the literature
published in Software Engineering and Computer Science. To reduce the duplicate literature, we choose some E-databases that return unique literature according to Petersen et al.[23].
ACM Inspec Scopus Science direct Wiley Online Library
4.3.2 Keywords
Based on the topic of this study and the research questions, we set following keywords t as search string:
Population: Approach or method. Alternative keywords: approach, method, measure, measurement, tool.
Intervention: Readability. Alternative keywords: readability, text readability, document readability.
Context: Readability for English Language. Not used in the search string but used in selection inclusion criteria.
Outcome: Related knowledge, using experience, research for readability assessment approach or method. Not used in the search string.
Boolean operator OR and Boolean operator AND are used to connect the different keyword categories and form the search string based on the relationship among keywords. Operator NEAR limit the distance of two keywords, the first word must near the second word. The search string is generated as follows:
((text* NEAR readability) AND (approach* OR method* OR measure*) OR
(document* NEAR readability) AND (approach* OR method* OR measure*))
However, considering the different grammar rules and syntax standards in different E-databases search engine, we cannot just directly use this search string in all the E-databases. There are some variations as shown in table 4.3.2-1 in order to follow syntax standards of different database.
Table 4.3.2-1 Search sting used for each E-databases
E-database Search String Inspec (((text* NEAR readability) AND (approach* OR method* OR
measure*)) OR ((document* NEAR readability) AND (approach* OR method* OR measure*)))
Scopus (((text* pre/4 readability) AND (approach* OR method* OR

11
measure*)) OR ((document* pre/4 readability) AND (approach* OR method* OR measure*)))
IEEE ((text* OR document*) NEAR readability) AND (approach* OR method* OR measure*)
Science Direct TITLE-ABSTR-KEY ((text* PRE/4 readability) AND (approach* OR method* OR measure*)) OR TITLE-ABSTR-KEY((document* PRE/4 readability) AND (approach* OR method* OR measure*))
ACM recordAbstract:(+readability +text* method* approach* measure*)
Wiley Online Library text OR document in Abstract AND readability in Abstract AND approach* OR method* OR measure* in Abstract
Based on different rules of different E-databases, operator * in some E-databases means
search all the words that use same root. For example, if we search 'text*' the E-databases will return all the results that related to the words which have 'text' as the root, such as texts, texting, textbook, textual and so on. NEAR operator is used to limit the distance relationship with two keywords. For example, if we search 'text NEAR readability', the E-database will return all the results that including 'text' and 'readability', and they are very close in position in the literature. Operator PRE/X is similar with operator NEAR and PRE/X will limit the distance of two keywords by the number X it means the distance between two keywords will not exceed X words. Typically, X is 4.
We limit the search field in titles, abstracts and keywords. Alternative choice is searching in the full-text. When we try to apply full-text searching in IEEE database, too much literature (more than 30 thousands) is returned back. Then we conduct a selective examination to these results. The result of selective examination shows that plenty of literature has little relevance with our research topic. Thus, we limit the search field in titles, abstracts and keywords. 4.4 Study Selection Criteria and Procedure
All the literature that E-databases return back need to be validated by following basic exclusion criteria:
Not available in English language. Duplicate literature. Lots of literature will be published in different E-databases, so
there is high possibility that we get duplicate literature from different E-databases.
The first basic exclusion criterion is easy to achieve since all E-databases provide the option to limit the results in English.
The second basic exclusion criterion is complex. Managing the literature manually is not suitable in our study. Because the number of duplicate literature is so large that the workload of this management is heavy. Hence the software called Zotero Standalone1 is chosen to manage literature. Removing duplicate literature can be done automatically.
Figure 4.4-1 shows an overview about our literature selection, including two rounds of selection and the results after each selection process. Detailed illustration of principles of the two rounds will be discussed in next section.
1 https://www.zotero.org

12
Figure 4.4-1 Overview of literature selection of primary studies
4.4.1 First Round Selection Criteria The first round selection mainly focus on the titles, abstracts and keywords of the
articles. It is aimed at distinguishing whether these articles are truly related to our research topic and whether these articles can directly or indirectly answer our research questions. The first round selection is run by us separately. Then based on the two independent selection results, especially the difference of these two results, we discuss together to explain the motivation of included or excluded articles to each other, and make the final decision of first round selection. Following are the first round selection criteria (Index numbers in the end of each criterion refer to the example of excluded papers):
Exclude any articles related to the readability of web language, for example, UML,
HTML and so on [24, 25]. Exclude any articles related to the readability of programming language, for
example, C++, Java and so on [26]. Exclude any articles related to the document clustering because document
clustering is not readability judgment related [27, 28]. Exclude any articles related to the readability of handwritten language[29, 30]. Exclude any articles related to cultural relics repair work (how to improve the
readability of old things)[31]. Exclude any articles related to abstract automated generation technology[32, 33].
Because this is related to automatically extracting keywords from each paragraph, and then automatically generating the abstract based on these keywords, which is not related to readability judgment.
Exclude any articles related to the readability of picture or the understandability of video and audio[34].
Exclude any articles related to the document text detection for similarity to avoid the plagiarism[35].
Because of different search rules of different search engines, the E-databases return back all the literature which including the search string we set. The result of searching is in a
13
mess. Through the reviewing of abstracts, we find that plenty of articles are related to other topics but appear in searching results. This is the reason why we set the exclusion selection criteria in the first round.
4.4.2 Second Round Selection Criteria
For second round selection, we read the main content of all literature. Following are the second selection criteria we set (Index numbers in the end of each criterion refer to the example of excluded papers):
Exclude any articles related to readability assessment but not for English language [36, 37].
Exclude any articles only discuss the limitation of readability formulas but didn't give any advices or improvement [38].
Exclude any articles that discuss the quality of documents and just mention readability is one of quality metrics [39, 40].
Exclude any articles that discuss the selection of suitable reading resources for children and teenagers [41].
Include an article related to readability formulas and have some real experiment data inside.
Include an article related to automated readability assessment tools.
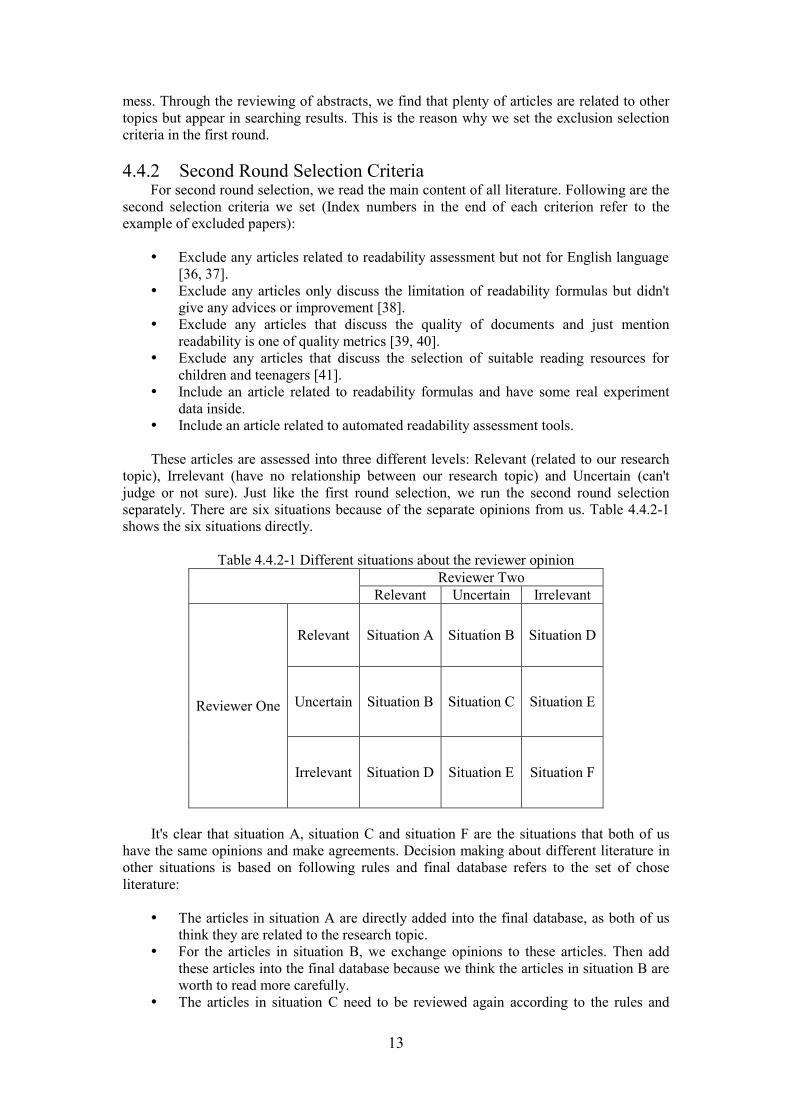
These articles are assessed into three different levels: Relevant (related to our research topic), Irrelevant (have no relationship between our research topic) and Uncertain (can't judge or not sure). Just like the first round selection, we run the second round selection separately. There are six situations because of the separate opinions from us. Table 4.4.2-1 shows the six situations directly.
Table 4.4.2-1 Different situations about the reviewer opinion Reviewer Two
Relevant Uncertain Irrelevant
Reviewer One
Relevant Situation A Situation B Situation D
Uncertain Situation B Situation C Situation E
Irrelevant Situation D Situation E Situation F
It's clear that situation A, situation C and situation F are the situations that both of us
have the same opinions and make agreements. Decision making about different literature in other situations is based on following rules and final database refers to the set of chose literature:
The articles in situation A are directly added into the final database, as both of us think they are related to the research topic.
For the articles in situation B, we exchange opinions to these articles. Then add these articles into the final database because we think the articles in situation B are worth to read more carefully.
The articles in situation C need to be reviewed again according to the rules and

14
steps of adaptive reading (discussed in following field). Because we think that we are lack of information to make a certain judgment. More reading is required to gain more information for decision making.
It is complex to deal with the articles in situation D, because situation D means there are huge difference of opinions between us. One thinks it's relevant but the other one think it's irrelevant. We need further discussions till agreements are made.
For the articles in situation E, we exchange opinions to these articles and exclude these articles.
Exclude the articles in the situation F since both of us think they are not related to our research topic.
Adaptive reading for articles in situation C: When both of us are uncertain with the judgment of literature in situation C, it means
that we are lack of information for judgment after two rounds selections. To solve this problem, adaptive reading is required.
From the result of our pilot study (discussed below), the number of literature in situation C is acceptable. It means that it's available to read the contents of literature carefully to gain more information. Although reading all the contents is very effective, it is time-consuming. Hence we make following rules to increase both effectiveness and efficiency of contents reviewing.
Introduction part of the literature must be read carefully, because introduction part always provides useful and effective information.
Conclusion part of the literature must be read carefully. because conclusion part usually includes authors’ research results, personal opinions and new ideas.
Another good idea is to search the keywords in the literature to find out the usage of these keywords to gain more information about the article [21].
Every articles need to be assessed by the rules above. However, it's hard to ensure the
effectiveness and efficiency of the selection work since it's complex. To ensure the effectiveness and efficiency as well as raise the familiarity with the selection process, a pilot study is performed [42]. We select 10 articles randomly from those articles that pass the first round selection as the input for the pilot study. Table 4.4.2-2 shows the result of this pilot study of second round selection.
Table 4.4.2-2 Results of the pilot second round selection Reviewer Two
Relevant Uncertain Irrelevant
Reviewer One
Relevant 4 1 0
Uncertain 1 1 0
Irrelevant 0 0 3
As we can in table 4.4.2-2. four articles are in situation A and two articles are in
situation B. Only one article is in situation C and three articles were in situation F. From the result of pilot study, 8 articles have the same relevance judgment It indicates
that we have similar abilities to judge the relationship between articles and our research

15
topics. In addition, the adaptive reading for the one article in the situation C is useful. We find concrete information support for final decision making. It indicates the feasibility to apply adaptive reading for second round selection.
The second round selection is applied separately and independently by us. The input of this phase is totally 120 articles that pass first round selection. Table 4.4.2-3 shows the results of second round selection.
Table 4.4.2 3 Results of the second round selection Reviewer Two
Relevant Uncertain Irrelevant
Reviewer One
Relevant 32 14 4
Uncertain 5 11 3
Irrelevant 2 3 13
Only 6 of 120 articles that we have huge differences of judgments. After discussion, we
eliminated the differences. Following the rules for each situation, we get 67 articles totally that related to our
research topic after two rounds selections. Full-text reading and quality assessment are required to these 67 articles. 4.4.3 Full-text reading
Full-text reading refers to reading all contents of the articles, aiming at finding out the key information to solve our research problems or answer our research questions. It is run independently by us. During full-text reading, some information need to be recorded in order to make quality assessment for the selected 67 articles. We introduce the type of information need to be recorded in section 4.6 (Data Extraction Strategy).
4.5 Study Quality Assessment Criteria
The study quality assessment is conducted to all the 67 articles that pass the two rounds of selections. For this study, the assessment work follows the checklist provided by Ivarsson et.al[43]. Following the checklist, we assess the Rigor and Relevance of the articles.
4.5.1 Scoring for Rigor
Rigor is important metric in the study quality assessment and we use three criteria to assess the literature, including Context, Design and Validity threats[43].
Context means the scope of the study and it includes the factors of the research such as the main research target, research process, research subject type (graduate, professional and so on), tools they use, techniques they implement, the type of research methodology and motivation, and duration of research. Following filed presents the detail study quality assessment criteria for scoring the Context part.
If the description of context includes four and more of the context factors mentioned above, the score of this part is '1'. [43]
If the description of context includes at least two of the context factors mentioned above but less than four, the score of this part is '0.5'.

16
If the description of context includes less than two of the context factors mentioned above, the score of this part is '0'.
In general, sometimes one context factor may contain other factors. For example, in the
research process, author may mention the research targets, research subjects and so on. We admit this situation and count all these factors.
Design means the study design description. It is required that the authors should introduce their research design descriptions well enough so that readers can understand them easily. Study design description factors generally include the description of outcome, treatment, measurement, method, number of subjects and sample, the data collection approach and data analysis approach[43]. One important thing is that the data should be traceable. Following are the detail study quality assessment criteria for scoring the Design part.
If the description of study design includes all the research design factors mentioned above, the score of this part is '1'.
If the description of context misses any of the research design factors mentioned above, the score of this part is '0.5'.
If there is no description of context including in the literature, the score of this part is '0'(Include the situation that the source of data is not traceable).
The criteria of this part are stricter than the context part because we think the design of study is important. This is an integrated part and anything missing will directly influence the credibility and reliability of the research.
Validity threats means the analysis of research threats. There are four types of validity: internal validity, external validity, construct validity and conclusion validity[44]. Following are the detail study quality assessment criteria for scoring the validity threats part.
If all the four types of validity threats are introduced and discussed in the literature, the score of this part is '1'.
If at least two types of validity threats are introduced and discussed in the literature, the score of this part is '0.5'.
If no types of validity threats are introduced and discussed in the literature, the score of this part is '0'.
Validity threats is something must be discussed in order to improve the credibility and
reliability of the study.
4.5.2 Scoring for Relevance Relevance is important metric in the study quality assessment and we use three criteria
to assess the literature, including Users/Subjects, Scale and Research Methodology[43]. Users/Subjects means the research subjects and their research reflection. Following are
the detail study quality assessment criteria for scoring the Users/Subjects part.
If the users or subjects are described, readability measures method, approach or tools are used and the measuring experience and measuring results are reflected, the score of this part is '1'.
If the users or subjects are described, readability measures method, approach or tools are used but the measuring experience and measuring results are not reflected, the score of this part is '0.5'.
If the users and subjects are not described, or no readability measures method, approach or tools are used, the score of this part is '0'.
Scale means if the research is based on the real-world or industry data. Following are
the detail study quality assessment criteria for scoring the Scale part.

17
If the readability measures method, approach or tools are used in real-world or
industry situation and real-world or industry outputs are reflected, the score of this part is '1'.
If the readability measures method, approach or tools are not used in real-world or industry situation and no real-world or industry outputs is reflected, the score of this part is '0'.
Research Methodology means the research method that author used in his research.
Several research methods are related to real-world situation (case study, surveys, interviews or industry interviews, experiment for a real world problem, action research). Following are the detail study quality assessment criteria for scoring the Research Methodology part.
If the research methodology belongs to any of the real-world related research methodologies above, the score of this part is '1'.
If there is no any usage of real-world related method, the description of this part is missed or not understandable for us, the score of this part is '0'.
4.5.3 Pilot Study of Quality Assessment
To ensure the quality of study quality assessment and reduce the influence of researchers’ bias, we should perform the study quality assessment based on the criteria separately and independently. To ensure the efficiency and effectiveness of study quality assessment, a pilot study is performed for 5 randomly selected articles. Table 4.5.3-1 shows the results of this pilot study (C means the first reviewer; H means the second reviewer).
Table 4.5.3-1 Results of the pilot study of study quality assessment First
Article Second Article
Third Article
Forth Article
Fifth Article
C H C H C H C H C H Context 1 0.5 0.5 0.5 0.5 0.5 0.5 0.5 0.5 0.5 Design 0.5 0.5 1 0.5 0.5 0.5 0.5 0.5 0.5 0.5
Validity Threats 0 0 0 0 0 0 0 0 0 0 Total of Rigor 1.5 1 1.5 1 1 1 1 1 1 1 Users Subjects 1 0.5 0 1 0.5 0.5 1 0.5 1 1
Scale 1 0 0 0 0 0 1 1 0 0 Research
Methodology 1 1 0 0 1 1 0 0 0 0
Total of Relevance 3 1.5 0 1 1.5 1.5 2 1.5 1 1 Total 4.5 2.5 1.5 2 2.5 2.5 3 2.5 2 2
During pilot study, both of us have common understanding about the study quality
assessment process and criteria. In addition, we have similar judgment for the selected five articles. All the deviated quality assessment results are eliminated after the discussion between us. Then we start quality assessment for all selected 67 articles. All the quality assessment scores of the 67 literature are presented in Appendix One. 4.6 Data Extraction Strategy
Before performing data extraction for the 67 articles, we design a pilot study of data extraction work on 5 randomly selected articles. The results of the pilot study are discussed and evaluated by us together. Data extraction is very important in systematic literature review, because data extraction will influence how much related and necessary information we can find from the 67 literature.
After the pilot study, following forms for the data are chosen to be extracted:
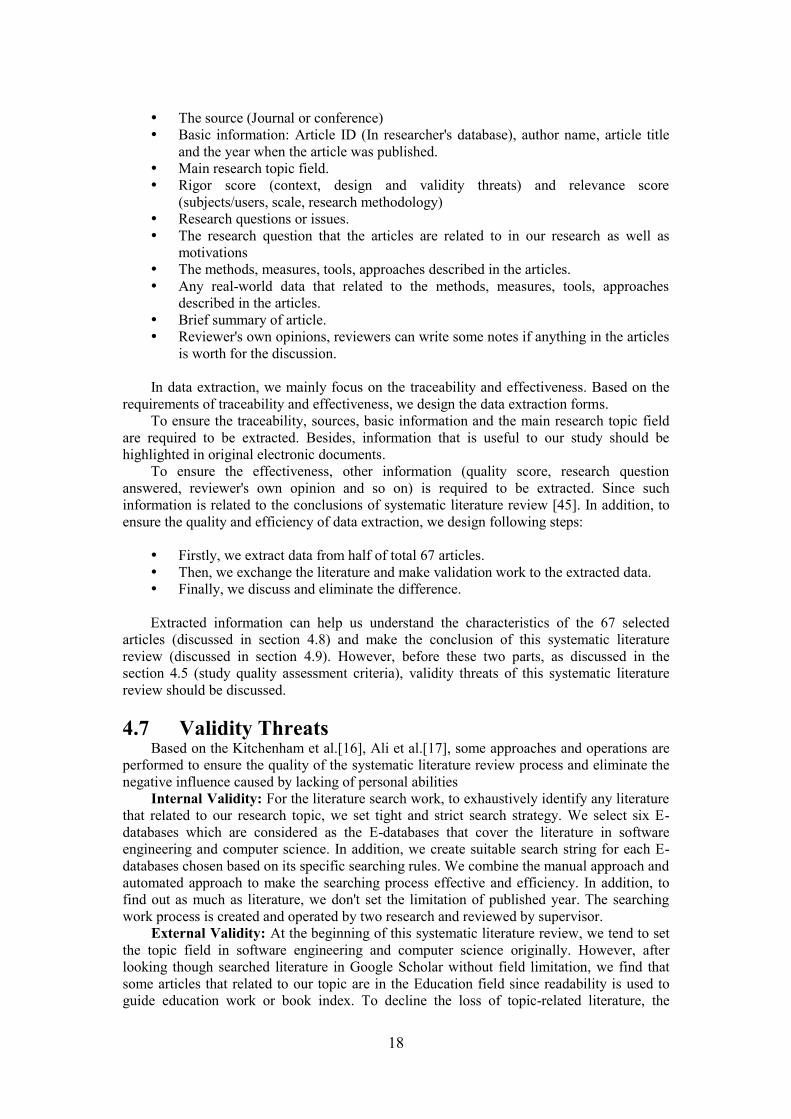
18
The source (Journal or conference) Basic information: Article ID (In researcher's database), author name, article title
and the year when the article was published. Main research topic field. Rigor score (context, design and validity threats) and relevance score
(subjects/users, scale, research methodology) Research questions or issues. The research question that the articles are related to in our research as well as
motivations The methods, measures, tools, approaches described in the articles. Any real-world data that related to the methods, measures, tools, approaches
described in the articles. Brief summary of article. Reviewer's own opinions, reviewers can write some notes if anything in the articles
is worth for the discussion.
In data extraction, we mainly focus on the traceability and effectiveness. Based on the requirements of traceability and effectiveness, we design the data extraction forms.
To ensure the traceability, sources, basic information and the main research topic field are required to be extracted. Besides, information that is useful to our study should be highlighted in original electronic documents.
To ensure the effectiveness, other information (quality score, research question answered, reviewer's own opinion and so on) is required to be extracted. Since such information is related to the conclusions of systematic literature review [45]. In addition, to ensure the quality and efficiency of data extraction, we design following steps:
Firstly, we extract data from half of total 67 articles. Then, we exchange the literature and make validation work to the extracted data. Finally, we discuss and eliminate the difference.
Extracted information can help us understand the characteristics of the 67 selected
articles (discussed in section 4.8) and make the conclusion of this systematic literature review (discussed in section 4.9). However, before these two parts, as discussed in the section 4.5 (study quality assessment criteria), validity threats of this systematic literature review should be discussed.
4.7 Validity Threats
Based on the Kitchenham et al.[16], Ali et al.[17], some approaches and operations are performed to ensure the quality of the systematic literature review process and eliminate the negative influence caused by lacking of personal abilities
Internal Validity: For the literature search work, to exhaustively identify any literature that related to our research topic, we set tight and strict search strategy. We select six E-databases which are considered as the E-databases that cover the literature in software engineering and computer science. In addition, we create suitable search string for each E-databases chosen based on its specific searching rules. We combine the manual approach and automated approach to make the searching process effective and efficiency. In addition, to find out as much as literature, we don't set the limitation of published year. The searching work process is created and operated by two research and reviewed by supervisor.
External Validity: At the beginning of this systematic literature review, we tend to set the topic field in software engineering and computer science originally. However, after looking though searched literature in Google Scholar without field limitation, we find that some articles that related to our topic are in the Education field since readability is used to guide education work or book index. To decline the loss of topic-related literature, the

19
education field is added into the search strategy. In addition, we do not set the limitation of published years. Because this limitation may result in the loss of potentially related literature. Wide range of related literature as the input of selection process and quality assessment process are advisable, which will not influence the generalizability of our result.
Construct Validity: Our review questions are same with the research question 1, 2 and 2.1. They are tightly related to our research topic. Hence based on these review questions, we can find out the literature that directly or indirectly related to our research.
Conclusion Validity: As we mentioned in the systematic literature review process, pilot study is performed before literature selection work, quality assessment work and data extraction work. All the results of pilot study are presented and the results are analyzed in order to improve the process or criteria to ensure the validity of this systematic literature review. Performing pilot study is aimed at reducing or eliminating any uncontrollable and unpredictable factors that influence the quality of systematic literature review. For example, personal bias is one of the uncontrollable factors. Besides, pilot study is also a good way to enhancing the coordination and cooperation between us.
In addition, during pilot studies, there are some disagreements for literature selection work, quality assessment work and data extraction work. First of all, the disagreements mean that the criteria are understandable. In detail, we can make conclusions based on the criteria. Besides, all these disagreements are recorded and then eliminated by discussion. It declines negative impacts on the quality of systematic literature review results caused by personal mistakes and disagreements. Because all the results have been reviewed by us together.
In fact, even though all the disagreements have been discussed and final results have been made, we still hold different opinions and assessment results for some literature. We are inclusive against disagreements. Hence we include all these controversial articles. It definitely increases the workload but decreases the risk of missing something that helpful to our study.
During the full-text reading, we find that some articles focus on same research field or research questions, but show quite different conclusions. When the situation occur we analyze the different conclusions mainly based on following rules:
Literature's quality score. Higher score means higher validity of the research
conclusion. Hence we prefer the conclusion from the paper with higher quality score.
We also focus on published year. Since the development of software engineering and computer science is so very fast that new technology may directly influence the conclusion of research in some field. Hence we prefer the conclusion from the paper with later published year.
If rules above are controversial, we will discuss them according to the whole contents of these literature.
4.8 Systematic Result of Literature Review
In this section, we present the result of this systematic literature review study based on three different classification indexes: Research domain, Related Approach and Rigor/Relevance. Table 4.8-1 shows detail information of each classification indexes.
Table 4.8-1 Result of Literature Review classification indexes
Classification Indexes Definition Classification

20
Research domain The research research domain of the literature
After performing full-text reading of these literature, we find that there are four main research domain of these literature: Medical field, Educational field, Software Engineering (Computer Science) field and General Text Analysis field.
Related Approach
The main approach related to readability mentioned in the literature
Based on the review questions, we mainly divide these articles into four aspects: Metrics/Formula, Tools, Related Approach, Others
Rigor/Relevance
The articles are divided into different levels based on their quality score.
Four levels, illustrated in section 4.8.4
4.8.1 Research domain
Table 4.8.1-1 shows the result of classification of these literature based on the research domain aspect. The major field is about the General Text Analysis field, we find 35 articles in this field; 12 articles in Educational field; 11 articles in Medical field; Only 9 articles in Software Engineering field.
Table 4.8.1-1 Research domain of Literature
Research domain
Number of Article Reference
Medical Field 11 [46, 47, 48, 49, 50, 51, 52, 53, 54, 55, 56]
Software Engineering
Field 9 [57, 58, 59, 60, 61, 62, 63, 64, 65]
Educational Field 12 [66, 67, 68, 69, 70, 71, 72, 73, 74, 75,
76, 77]
General Text Analysis Field 35
[78, 79, 80, 81, 82, 83, 84, 85, 86, 87, 88, 89, 90, 91, 92, 93, 94, 95, 96, 97, 98, 99, 100, 101, 102, 103, 104, 105, 106, 107, 108, 109, 110, 111, 112]
Medical Field: For medical field, we find 11 related articles. In these literature, four of
them make research on readability of health information and mainly related to the online health information [46, 49, 52, 53]. Six of them are related to the readability of patient diagnostic document or medical report [48, 50, 51, 54, 55, 56]. Only one literature make research on helping the patients with mental retardation to understand the document [47].
Software Engineering Field: For software engineering field, we find 9 related articles. Among these articles, one of them make research on readability of a introduction document about an information system [57]. One of them is related to a introduction document about a programming language [60]. Seven of them are related to the software documentation such as software maintaining document and software testing document [58, 59, 61, 62, 63, 64, 65]. Especially, four of these seven literature are related to requirement documentation which are very close with our research topic [59, 62, 63, 65].
Educational Field: For educational field, we find 12 related articles. Among these articles, two of them make research on the readability of introduction document about lecture designing [66, 73]. Five articles are related to the readability of textbook and teaching

21
materials [67, 68, 69, 70, 76]. Four articles are about the introduction documentation of teaching tools [72, 74, 75, 77]. Only one articles makes research on the linguistics [71].
General Text Analysis Field: For General Text Analysis field, three articles are related to the readability of concordance result texts [78, 91, 109]. Nine articles make research on the readability of web related texts [85, 86, 88, 90, 92, 102, 103, 105, 112]. The other articles do not mention particular text types, so they are related to general texts [79, 80, 81, 82, 83, 84, 87, 89, 93, 94, 95, 96, 97, 98, 99, 100, 101, 104, 106, 107, 108, 110, 111].
4.8.2 Approach
Table 4.8.2-1 shows the result of classification of these articles based on the approach aspect. We find 17 articles that related to the readability metrics or readability formulas, 20 articles mention some information about readability assessment tools, 7 articles propose some readability related new approaches, and 23 articles describe some other approaches that have less relationship with our research topic.
Table 4.8.2-1 Approach of Literature
Approach Number of Article Reference
Metric/Formula 17 [48, 49, 51, 52, 55, 57, 60, 76, 77, 78, 87, 90, 91, 97, 98, 101, 106]
Tool 20 [46, 47, 50, 53, 54, 56, 61, 62, 69, 70,
71, 73, 83, 84, 89, 94, 96, 99, 104, 112]
Related New Approach 7 [59, 63, 79, 86, 105, 107, 109]
Other 23 [58, 64, 65, 66, 67, 68, 72, 74, 75, 80, 81, 82, 85, 88, 92, 93, 95, 100, 102,
103, 108, 110, 111] Metric/Formula: For metric/formula, we find17 articles in this part. There are six
articles that make research on the Flesch Reading Ease Formula [48, 57, 60, 90, 91, 98], and one is related to the compare of Flesch Reading Ease Formula and Gunning Fog Index [48]. One article is related to the Dale-Chall [78]. Other literature mention other metrics or formulas, such as Coleman-Liau, Flesch-Kincaid, Flesch Reading Ease Index, FORCAST Readability Formula, Fry Graph, Gunning Fog Index, New Dale-Chall Formula, SMOG index New Fog Count, Raygor Readability Estimate and Automated Readability Index [49, 51, 52, 55, 76, 77, 87, 97, 101, 106].
Tool: For tool, we find 20 articles in this part. Two of them provide us the website tools, one is readable.io [94] and the other one is www.readabilityformulas.com [56]. One article mentions a tool called TextEvaluator [83], one article mentions the RUBRIC [59], seven articles are related to Coh-Metrix [62, 70, 71, 73, 84, 89, 112], and the others are some tools that have less relationship with our research topic [46, 47, 50, 53 54, 61, 69, 96, 99, 104].
New Related Approach: For new related approach, there are only 7 articles. Two of them are related to the quality of requirement [59, 63]. Two articles propose an crowd sourcing way to analyze the readability [79, 109] and one for electric books [86]. Besides, there are two special new approaches, one is related to a weirdness measure [105] and the other one is for lexical density [107].
Other: For this part, we put all the other articles that related to approaches but have less relationship with readability assessment [58, 64, 65, 66, 67, 68, 72, 74, 75, 80, 81, 82, 85, 88, 92, 93, 95, 100, 102, 103, 108, 110, 111].
4.8.3 Cross Analysis of Research domain and Approach

22
To have better understanding of the result of systematic literature review, we perform a cross analysis for the research domain aspect and approach aspect. Table 4.8.3-1 shows the cross analysis result of research domain and approach.
Table 4.8.3-1 Result of Cross Analysis
Metric/Formula Tool New Related
Approach Other
Medical Field
[48, 49, 51, 52, 55]
[46, 47, 50, 53, 54, 56] None None
Software Engineering
Field [57, 60] [61, 62] [59, 63] [58, 64, 65]
Educational Field [76, 77] [69, 70, 71,
73] None [66, 67, 68, 72, 74, 75]
General Text Analysis
Field
[78, 87, 90, 91, 97, 98, 101, 106]
[83, 84, 89, 94, 96, 99, 104, 112]
[79, 86, 105, 107, 109]
[80, 81, 82, 85, 88, 92, 93, 95, 100, 102, 103, 108, 110,
111] Figure 4.8.3-1 shows the quantity distribution of cross analysis.
Figure 4.8.3-1 Overview of cross analysis of research domain and approach
For medical field, we find that five articles are related to readability metrics or formulas.
Six articles are related to automated readability assessment tools. However, no new related approaches or other approaches is in medical field.
For software engineering field, we find that two articles provide readability metrics or formulas and two articles mention automated readability assessment tools. Two articles discuss new related approaches and three articles discuss other approaches. This field is the most important one in our research, especially the total six articles that related to metrics/formulas, tools and new related approaches.

23
For educational field, we find that two articles are related to readability metrics or formulas, four articles are related to tools and no articles mention any new related approaches. Besides, six articles provided other approaches which have less relevance to our research. Most of articles are in the General Text Analysis field. We find that eight articles are
related to readability metrics and formulas, eight articles are related to readability tools. Only five articles propose new related approaches and 14 articles provided other approaches.
4.8.4 Rigor/Relevance After performing full-text reading, we divide all articles into four sets based on their
rigor score and relevance score. Following are the rules of set division (For example, if a article is set as Level A, which means it has higher rigor score than middle level and lower relevance score than middle level). Level C: The literature with Low Rigor and Low relevance (Rigor Score ≤ 1.5 and Relevance Score ≤ 1.5).
Level B: The literature with Low Rigor and High relevance (Rigor Score ≤ 1.5 and Relevance Score > 1.5).
Level A: The literature with High Rigor and Low relevance (Rigor Score > 1.5 and Relevance Score ≤ 1.5).
Level D: The literature with High Rigor and High relevance (Rigor Score > 1.5
and Relevance Score > 1.5).
Figure 4.8.4-1 shows the quality score of the selected literature based on the Rigor/Relevance criteria.
Figure 4.8.4-1 Overview of literature quality score
As it’s shown in Figure 4.8.4-1, there are 36 articles in the Level C set, 29 articles in the
Level B set, 2 articles in the Level D set and no articles in the Level A set.
4.9 Conclusion of Literature Review

24
In this section, we summary the conclusion of systematic literature review based on the answer to our review questions. As the preparation of experiment, we generate three review questions. Following are the conclusion of this systematic literature review.
RQ1: How do humans score readability of text? The first review question is to find out how do human assess the readability and judge it.
Readability is difficult to be measured because of tight dependency on readers' perceptions [113].Based on our findings through the systematic literature review, human can score readability of texts through human reading and two special methodologies called Specifications Metrics Methodology and Weirdness Measure.
Human Reading: Human reading refers to human judge the readability of texts through reading. As we mentioned before, readability is a special quality factor of texts because of the tight dependency on readers' perceptions. Hence the first judgment is based on human's perceptions and feelings. This kind of way is mentioned in many articles [46, 75, 98, 94]. In some articles, the experiment participants are required to score the texts into ratio-scale values, for example, 0(difficult to read) to 100(easy to read) [83]. In some articles, the experiment participants are required to score the texts into ordinal-scale values, such as easy, medium and hard level [60].
Table 4.9-1 shows the advantages and disadvantages of these two scoring approaches. Compare these two approaches, ordinal-scale values appear more in primary research.
Table 4.9-1 Advantages and disadvantages of 0-100 and easy/medium/hard
Type Assessment Criteria Advantage Disadvantage
Ration-scale
values(0 to 100)
75-100 means very high readability 50-75 means high readability 25-50 means low readability 0-25 means very low readability
Participants get more space to present their perceptions and results are more clear.
Human are not good at distinguishing subtle difference(For example, human cannot give explaining for the difference of scoring 67 and 68)
Ordinal-scale
values (Easy
Medium Hard)
Easy means high readability Medium means medium readability Hard means low readability
This way is more in line with human intuition and results are more controllable.
Human can be confused about the division criteria of low, medium and hard, and put most texts into one of these three level.
When we categorize different types of experiments by identities of experiment subject
(refers to participants who judge the readability), we find four ways of subject selections. Some researchers invited some experts from specific field to help them judge the readability of experiment texts. Besides, human reading can be performed via internet websites, so the participant is huge number of internet users [94]. Furthermore, subject can be students or teachers/professors whose majors are related to the research topic [31]. Table 4.9-2 shows the advantages and disadvantages of these four identities of participants.
Table 4.9-2 Advantages and disadvantages of different identities of participants Identity Advantage Disadvantage Students Results are not very professional.

25
1. Easy to find and invite. 2. Large number of sample.
Teachers/Professors
1. Provide professional results. 2. Easy to find.
Time schedule is unclear, which increase the time costs of experiment.
Internet Users
1. Unlimited number of sample. 2. Very fast.
1. Experiment environment is uncontrollable. 2. Results are uncontrollable.
Experts
1. Provide the most professional results with industry experience. 2. Provide some advices for the research.
1. May cost lots to invite an expert. 2. Hard to find.
Compare these identities of participants, students are considered more as participants in
human readability judgment in primary research. In general, human reading is the most common and manual way to judge the readability
of texts according the systematic literature review, most researchers considered it as the testing oracle of texts readability.
Special Approach: We mainly find two very useful special approaches. One is
Specifications Metrics Methodology [63] and the other one is called Weirdness Measure [105]. We put them into special approach category since both approaches are neither regular human reading approach nor the assessment by automated approaches. Although both of the two approaches are based on formulas, human participation plays an important role in applying these approaches. The one needs to count special word from human perspective and the other one requires manual calculating since there is no existing automated tools.
Specifications Metrics Methodology is a method that analyze quality factors of SRS including readability, which is tightly related to our research topic. It's special because it adds the human subjective views into traditional formula calculation. The calculation is based on the number of different attributes in the sentences [63]. For instance, attributes of sentences include Initiator of Action, Condition for Action and so on. One important factor, called ambiguous attributes, is needed to calculate the readability. It means that human need to count the ambiguous attributes inside the sentences firstly, and then calculate the readability by formulas.
Weirdness Measure is a method that provides similar results with the common readability formulas. It's special because this approach can be used to assess the readability of single sentence, while some common readability formulas have the minimum limitation of word number or sentence number. In addition, the authors of the Weirdness Measure present an argument that if readers have similar reading level, interest and background knowledge with writers, the readability judgment from these readers is accurate and convincible. It points out the importance of personal characteristic in readability judgments, which also indicates the necessity for human participation.
Following are the detail introductions of these two special approaches. Specifications Metrics Methodology is a software specification document quality
assessment methodology, including completeness, readability and accuracy measurement. It is developed by Ron S. Kenett. Here we only focus on the readability part. This methodology divide requirements sentences into nine different parts [63].
Initiator of Action: the things which cause the action (subsystems, functions). Action: including positive actions and negative actions.

26
Conditions for Action: very important for the occurrence of actions. Constraints on Action: the limitation of actions. Object of Action: the target of actions (subsystems, functions). Source of Object: the origin of the action targets (subsystems, functions). Destination of Object: where the objects will send to. Mechanization of Action: how will be the action accomplished. Reason for Action: rationale of the action.
Table 4.9-3 shows the definition of parameters and Table 4.9-4 shows how to compute
the specification metrics (SM).
Table 4.9-3 Definition of Parameters Number Definition
N1 Total number of sentences N2 Total number of attributes N3 Total number of attributes missed N4 Total number of ambiguous attributes N5 Total number of source attributes missed N6 Total number of destination attributes missed N7 Total number of ambiguous source attributes N8 Total number of ambiguous destination attributes N9 Total number of source attributes N10 Total number of destination attributes N11 Total number of valid attributes(less than 9) N12 Total number of TBD N13 Total number of conditions attributes missed N14 Total number of constraints missed N15 Total number of descriptive sentences
Table 4.9-4 Specification Metrics
SM Formula SM1 Missing information = N3/N2 SM2 Ambiguous information = N4/N2 SM3 (N5+N6+N7+N8)/(N9+N10) SM4 N11 SM5 TBD frequency = N12/N2 SM6 Missing condition information = N13N1 SM7 Missing constraints = N14/N1 SM8 Descriptive information = N15/N1
According to the description in this methodology, the requirement readability can be
calculated by following formula [63]:
Weirdness Measure is a new readability formula based on the word frequency and it is
developed by Neil Newbold and Lee Gillam. It's special since it can be used to assess the readability of single sentence. Weirdness Measure promote that some basic factors must be consistent between authors and readers in order to ensure the accuracy of readability measurement. In detail, the authors think readers' reading level must be consistent with vocabulary familiarity and syntactic complexity of text; readers' interests and knowledge must match the assumed knowledge in texts; and readers' intelligence must match the logical incoherence and propositional density of texts [105].

27
Weirdness Measure provide following formula to help with the readability calculation work:
nSL is a word count at sentence level, nGL is a word count at corpus level, fSL is a word
frequency at sentence level, fGL is a word frequency at corpus level. According to author's experiment, weirdness measure provides similar results of
readability measures with other common readability formulas. RQ2: What automated approaches are used to measure the readability of text? The second review question is to find out automated approaches which can be used to
measure the readability of texts. Through the systematic literature review, we find out following automated tools (We only list the available tools which can be accessed and used for our experiment):
Readable.io Readabilityformulas.com TextEvaluator Coh-Metrix Readable.io is an online readability measures tool which provides a readability score for
the input texts from user to judge the readability of texts. Readable.io can automatically detect the text factors such as sentence length, syllable count and so on, and then use them on several formulas for measuring scores. Following formulas are included: Flesch Reading Ease, Flesch-Kincaid Grade Level, Gunning Fog Index, Coleman-Liau Index and SMOG Index [94].
Readbilityformulas.com is an online readability measures tool that helps user score the texts and identity reading levels and grade levels of texts. In addition, readabilityformulas.com can analyze the number of sentences, number of words and so on. Then use six readability formulas to calculate the score, including: Flesch Reading Ease, Flesch-Kincaid Grade Level, Gunning Fog Formula, SMOG Index, Coleman-Liau Index and Automated Readability Index [56].
TextEvaluator is a scoring engine that developed to help score professionally edited texts in 2010. This is a fully-automated technology that can provide great feedback about the complexity and readability of reading passages. User can use it to assess an grade-level placement of texts and the comprehension difficulty of any specified text [83].
Coh-Metrix is a readability measures tool, appearing in many readability-related researches, which can help user to compute the computational cohesion and coherence metrics. Coh-Metrix can analyze basic information from texts such as sentence length, number of sentence, referential cohesion, latent semantic analysis, lexical diversity, connectives, situation mode, syntactic complexity, syntactic pattern density and so on [62, 73, 112].
RQ2.1: What are the theories of these automated approaches? We need to learn basic working theories of these tools in order to obtain better
understanding of readability assessment. Based on the results of systematic literature review, all the existing automated readability assessment tools we find are based on the readability metrics and readability formulas. We find following metrics and formulas: Coleman-Liau, Flesch-Kincaid, Flesch Reading Ease Index, FORCAST Readability Formula, Fry Graph, SMOG Index, Gunning Fog Index, New Dale-Chall Formula, New Fog Count, Raygor Readability Estimate, Automated Readability Index [49, 51, 52, 55, 76, 77, 87, 97, 101, 106].

28
Four formulas that are not used in selected tools and other tool-related formulas are introduced below.
Coleman-Liau is a readability assessment index designed by Meri Coleman and T. L.Liau which is used to analyze the readability and understandability of texts [97]. Coleman-Liau can be calculated by following formula:
CLI means the Coleman-Liau Index, L means the number of letters per one hundred
words, S means the average number of sentences per one hundred words. Flesch-Kincaid is a reading grade level which is developed by J. Peter Kincaid and his
team, and it is designed for some high technology education problem [101]. Flesch-Kincaid can be calculated by following formula:
FK means the Flesch-Kincaid grade level. Similarly, a formula called Flesch reading
ease formula is widely mentioned, which can be calculated by following formula [51, 52, 56, 60]:
FKES means the Flesch reading ease score. Flesch reading ease score can be interpreted
by following rules, table 4.9-5 shows the rules [51, 41].
Table 4.9-5 Rules of ranking Flesch reading ease score Score Description Reading Grade
100.0-90.0 Very Easy 5th Grade 90.0-80.0 Easy 6th Grade 80.0-70.0 Fairly Easy 7th Grade 70.0-60.0 Standard 8th-9th Grade 60.0-50.0 Fairly Difficult 10th-12th Grade 50.0-30.0 Difficult College grade
30.0-0 Very Difficult College graduate Gunning Fog Index is a readability assessment index only for English, which is
developed by Robert Gunning. After selecting a passage which including about 100 words, Gunning Fog Index can be calculated as follow [41, 45]:
GFI means Gunning Fog Index. Complex words mean the words with three or more
syllables but do not include proper nouns, familiar jargon, compound words or common suffixes.
SMOG index means Simple Measure of Gobbledygook developed by G. Harry
McLaughlin. It is a widely used readability measure and can be calculated by following formula [94]:

29
Dale-Chall Formula is used to determine the readability of texts for readers, which is
developed by Edgar Dale and Jeanne Chall: Dale-Chall can be calculated as follows [52, 101]:
DC means the Dale-Chall score and difficult words means the words which is not
included in Dale-Chall familiar words list. If the percentage of difficult words is above 5%, add 3.6365 to the final results. Dale-Chall score can be judged by following rules, table 4.9-6 shows the rules.
Table 4.9-6 Rules of ranking Dale-Chall score
Score Reading Grade 9.0-9.9 13th-15th grade student 8.0-8.9 11th-12th grade student 7.0-7.9 9th-10th grade student 6.0-6.9 7th-8th grade student 5.0-5.9 5th-6th grade student
4.9 or lower 4th grade or lower Automated Readability Index is a readability measure index which outputs a score to
judge the read level of text. It can be calculated by following formula:
ARI means the automated readability index, characters means the number of letters and
numbers. Table 4.9-7 shows the summary of the seven formulas:
Table 4.9-7 Summary of seven formulas Formulas Needed Inputs/Metrics Output types
Coleman-Liau Index
1. Number of letters per 100 words 2. Average number of sentences per 100 words
Grade Level needed to read and understand the text, lower grade level means higher readability, higher grade level means lower readability.
Flesch-Kincaid
1. Total number of words 2. Total number of sentences 3. Total number of syllables
Grade Level needed to read and understand the text, lower grade level means higher readability, higher grade level means lower readability.
Flesch Reading Ease
Score
1. Total number of words 2. Total number of sentences 3. Total number of syllables
Score from 0 to 100, higher score means higher readability, lower score means lower readability.
Gunning Fog Index
1. Total number of words
Grade Level needed to read and understand the text, lower grade

30
2. Total number of sentences 3. Total number of complex words
level means higher readability, higher grade level means lower readability.
Simple Measure of
Gobbledygook
1. Total number of poly syllables. 2. Total number of sentences
Grade Level needed to read and understand the text, lower grade level means higher readability, higher grade level means lower readability.
Dale-Chall Formula
1. Total number of words. 2. Total number of sentences. 3. Total number of difficult words.
Score from 0 to 10, higher score means lower readability, lower score means higher readability.
Automated Readability
Index
1. Total number of words. 2. Total number of sentences. 3. Total number of characters (letters and numbers).
Score from 0 to 14, higher score means lower readability, lower score means higher readability
4.10 Discussion
Since the conclusion of systematic literature review influence our experiment. Hence before the experiment, we analyze and discuss the conclusion.
For the first review question, we get three kinds of ways for human to measure the readability of texts manually, including human reading, Specifications Metrics Methodology and Weirdness Measure.
Human reading appears in many readability-related researches during the systematic literature review work. Human reading is a direct way for researchers to identify the readability level of text. For our research, we think this method must be included in our experiment since human reading is the only available way in manual readability judgment through systematic literature review and the testing oracle of our experiment is based on human judgment. However, human reading has several limitations. The two main limitations are subjective and ambiguous. Subjective means human judge the readability mainly based on personal feelings so that the results are influenced by them. However, this can be solved by large sample numbers. Ambiguous means it's easy and accuracy for human to give an ordinal-scale value for the readability (Low, Medium, High), but it's hard and difficult for human to give a ratio-scale value for the readability (for example, human cannot give explaining for the difference of scoring 67 and 68). In other words, it's hard for human to make a distinction among similar readability level texts, since human perceptions are hard to quantified. Hence we think in our experiment, asking human for ordinal-scale value for readability is advisable. As for the identities of participants, we think it's better to invite students and teachers/professors to judge readability. Since they are easier to find and invite, and the experiment environment and process can be controlled.
For the two special methodologies, we think Specifications Metrics Methodology is good because it focuses on the readability of requirements. The problem is that author do not present enough evidence to ensure the efficiency of applying this methodology. In addition, in this methodology, readers are required to find out ambiguous words to calculate readability score. However, author do not provide any definition of ambiguous words. Furthermore, no existing tool supports the automated calculating for the formula that presents in the paper. Hence we judge that this methodology is immature but the attributes that related to readability are meaningful for human readability judgment. Then come to Weirdness Measure. The problem for this measure is that the authors do not provide enough experiment data to ensure its efficiency. In addition, as a new measure, it presents similar results with some wide-used readability formulas, but it cannot be calculated automatically.
31
It is not advisable to manually calculate the score of readability as human judgment. However, though we do not use these two special methodologies in our experiment, we borrow useful information from these two approaches. Specifications Metrics Methodology emphasize the importance of human's judgment and perception again, so we need to add human's judgment into the experiment in order to improve the quality of experiment results. It also indicates the importance of understanding each word in readability judgment. Weirdness Measure present that the readers' personal background knowledge would directly influence the readability judgment of these readers. Hence the background knowledge of requirements need to be presented in order to improve the accuracy of readers’ judgment.
We notice that two of the four selected tools, Coh-Metrix and TextEvaluator are integrated tools. In other words, they have build-in readability formulas analysis processes and results from these two tools are processed. As a contrast, the other two tools show the results of each formulas they provide independently and there is no build-in comprehensive analysis in the two tools. It indicates that the result from above formulas can be assessed separately. In addition, these two tools can simply provide average score for the formulas.
In order to expand the number of automated approaches, both the four tools and the seven formulas are regarded as automated approaches. These eleven approaches are the input of experiment and the effectiveness of them is evaluated in experiment phase.

32
5 EXPERIMENT Consider the particularity of RQ3 of our thesis, we perform an experiment to answer the
question. According to previous systematic literature review, we learn how do human score the readability of texts as well as selected automated readability measurement approaches for texts. Mainly based on the experiment process mentioned in [44], we design the experiment in following aspect. 5.1. Scoping 5.1.1. Goal Definition This experiment is motivated by the need to determine if readability of SRS documents can be evaluated in automated ways. SRS documents require high quality of readability to avoid ambiguity and if automated readability measurement approaches are available, the efficiency of SRS readability measure can be raised. Object of study
The object of study are 11 automated readability approaches and the people who are invited to judge the readability of SRS documents. These approaches including Flesch-Kincaid Grade Level, Flesch-Kincaid Reading Ease, Gunning-FOG Score, New Dale-Chall formula, TextEvaluator Measurement Approach, Coh-Metrix, SMOG Index, Coleman-Liau Index, Automated Readability Index, Readable.io and Readabilityformulas.com. Besides, some people are invited to judge the readability of the same SRS documents and the processed human judgment result is the testing oracle to quantify the result of automated readability approaches. The people include the student in Blekinge Tekniska Högskola (BTH) who major in software engineering and computer science, and the teacher in BTH who study on software domain. In order to simplify the term in following documentation, we call both students and teachers who will take participant in judging SRS readability volunteers. Purpose The purpose of the experiment is to evaluate if these automated readability approaches can work well in SRS readability testing. The experiment can evaluate if the eleven automated approaches can make the same conclusion as human judgment and find out which automated approaches have highest similarity results with human beings. Perspective The perspective in this experiment is from the point of view of the researchers (Mingda Chen and Yao He). The researches compare the SRS documents readability evaluation result between automated approaches and human judgments. Conclusion is made after comparison. Quality focus We focus on the effectiveness of applying automated readability approaches to evaluate SRS documents. However, it is quite difficult work to compare evaluation results between automated approaches and human judgment. Because the results of approaches are presented with scores and corresponding scores illustrations while human judgments are always presented with their perceptions, such as easy, medium and difficulty. There are existing reflections between scores and readability level according to previous studies. However, all these reflections of selected automated approaches aim at making distinctions on education domain instead of software requirement field. Thus, these reflections are not suitable in this experiment. Context
The experimental context characterization is multi-object variation study [44], which means there is a single subject and multiple objects in our study. There are two types of
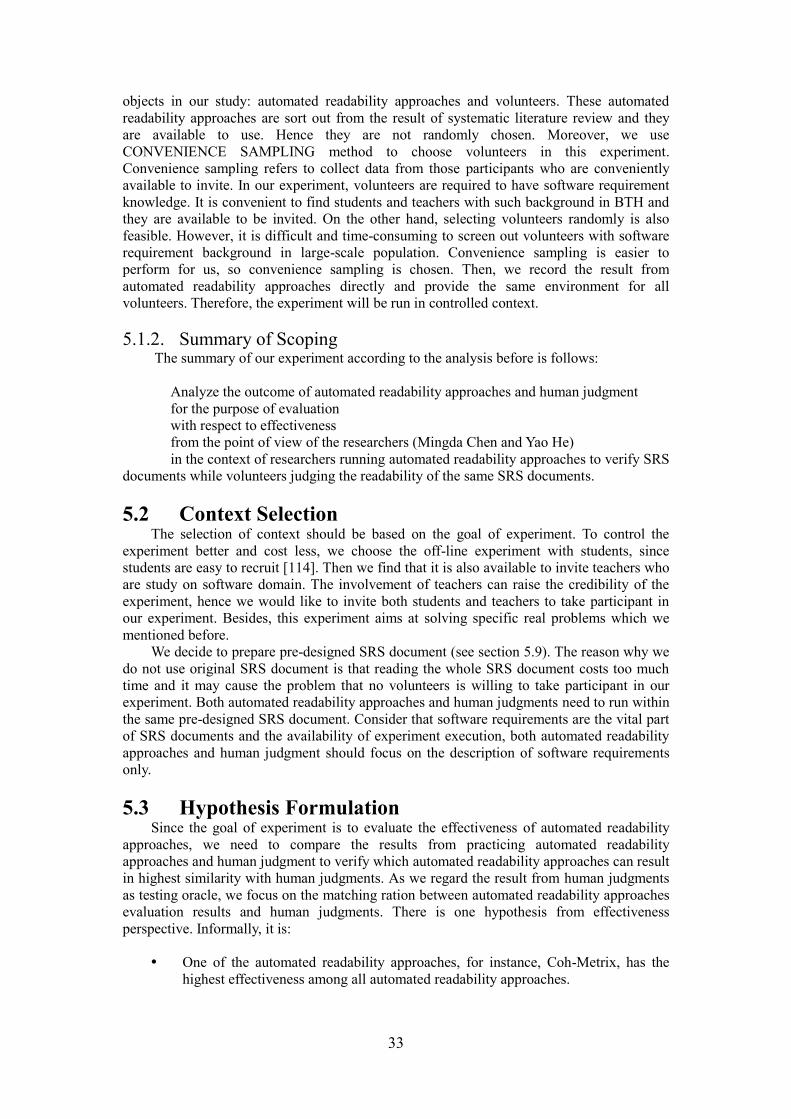
33
objects in our study: automated readability approaches and volunteers. These automated readability approaches are sort out from the result of systematic literature review and they are available to use. Hence they are not randomly chosen. Moreover, we use CONVENIENCE SAMPLING method to choose volunteers in this experiment. Convenience sampling refers to collect data from those participants who are conveniently available to invite. In our experiment, volunteers are required to have software requirement knowledge. It is convenient to find students and teachers with such background in BTH and they are available to be invited. On the other hand, selecting volunteers randomly is also feasible. However, it is difficult and time-consuming to screen out volunteers with software requirement background in large-scale population. Convenience sampling is easier to perform for us, so convenience sampling is chosen. Then, we record the result from automated readability approaches directly and provide the same environment for all volunteers. Therefore, the experiment will be run in controlled context. 5.1.2. Summary of Scoping
The summary of our experiment according to the analysis before is follows:
Analyze the outcome of automated readability approaches and human judgment for the purpose of evaluation with respect to effectiveness from the point of view of the researchers (Mingda Chen and Yao He) in the context of researchers running automated readability approaches to verify SRS
documents while volunteers judging the readability of the same SRS documents. 5.2 Context Selection
The selection of context should be based on the goal of experiment. To control the experiment better and cost less, we choose the off-line experiment with students, since students are easy to recruit [114]. Then we find that it is also available to invite teachers who are study on software domain. The involvement of teachers can raise the credibility of the experiment, hence we would like to invite both students and teachers to take participant in our experiment. Besides, this experiment aims at solving specific real problems which we mentioned before.
We decide to prepare pre-designed SRS document (see section 5.9). The reason why we do not use original SRS document is that reading the whole SRS document costs too much time and it may cause the problem that no volunteers is willing to take participant in our experiment. Both automated readability approaches and human judgments need to run within the same pre-designed SRS document. Consider that software requirements are the vital part of SRS documents and the availability of experiment execution, both automated readability approaches and human judgment should focus on the description of software requirements only. 5.3 Hypothesis Formulation
Since the goal of experiment is to evaluate the effectiveness of automated readability approaches, we need to compare the results from practicing automated readability approaches and human judgment to verify which automated readability approaches can result in highest similarity with human judgments. As we regard the result from human judgments as testing oracle, we focus on the matching ration between automated readability approaches evaluation results and human judgments. There is one hypothesis from effectiveness perspective. Informally, it is:
One of the automated readability approaches, for instance, Coh-Metrix, has the
highest effectiveness among all automated readability approaches.

34
According to the informal statements of hypothesis, we can generate it formally and define measures which are required to evaluate the hypothesis. For each automated readability approach, we can formulate that: Let SAPn be the effectiveness of the automated readability approach and n represents the identity of different approaches. For example, SAP1 represents the effectiveness of approach Flesch-Kincaid Grade Level and SAP2 represents the effectiveness of approach Fry Readability Graph;
Then the formal hypothesis is formulated as follows [44]: Null hypothesis, H0: There is no difference in effectiveness among all automated readability approaches. H0: SAP1 = SAP2 = … = SAPn Alternative hypothesis, H1: SAP1 > SAP2 ≥ … ≥ SAPn H2: SAP1 = SAP2 > SAP3 ≥ … ≥ SAPn … Hn-1: SAP1 = SAP2 = … = SAPn-1 > SAPn Measures needed: automated readability approach and its effectiveness.
The hypothesis indicates that we need to collect following data:
Automated readability approach: measured by unique approach identity name. Effectiveness is measured as the matching ration between automated readability
approaches evaluation results and human judgments. The higher percentages, the better effectiveness.
5.4 Variables Selection
As the goal defined, we need to evaluate the effectiveness of automated readability approaches. Hence the independent variables in this experiment are the automated readability approaches identities and human judgment. The dependent variable in this experiment is effectiveness. Furthermore, to ensure the quality of experiment, the same pre-designed SRS document is used for each treatments. 5.5 Selection of Subjects
For the human judgment part, students and teachers in BTH are chosen as our experiment subjects. However, in this case, it's important to ensure the voluntary of volunteer participation without any penalty for the individual [44].
For the automated readability approaches part, we plan to practice automated readability approaches to test the pre-designed SRS document by ourselves. It can reduce the cost and this is the best way to control the process, since we have better understanding about the experiment. 5.6 Selection of Objects
The experiment objects, in this experiment, is the pre-designed SRS document. Detail discussion about how to generate the pre-designed SRS document has been illustrated in Context Selection part. 5.7 Experiment Design
In order to distinguish different readability levels, we define three readability levels: high readability level, medium readability level and low readability level. Concrete conceptions of the three terms are defined in section 5.10.The reason why only three sets of readability levels are defined is that ranking all requirements by human judgment is seldom possible. It takes far more time to rank all requirements and we also cannot ensure the if ranking order is reasonable since human perception is hard to quantified accurately. When

35
volunteers are required to categorize into three sets, the negative impact from ranking all requirements can be mitigated.
We notice a fact that, in software requirement domain, there is no direct reflection between the results from human judgments and the scores from automated readability approaches. Hence the readability results from these two aspects are hard to compare directly. To solve this problem, one potential way is to quantify human perceptions in ratio-scale. However, according to the result of systematic literature review, it's easy and accuracy for human to give an ordinal-scale values for the readability (Low, Medium, High), but it's hard and difficult for human to give a ratio-scale values for the readability (for example, human cannot give explaining for the difference of scoring 67 and 68). Hence we tend to quantify human perceptions in ordinal-scale values instead of ratio-scale value. However, one problem is that not all automated approaches can present ordinal-scale values as results. We are also lack of literature support to transform ratio-scale values to ordinal-scale values.
According to study [97, 101], automated readability approaches are good at ranking texts based on their readability. We can take advantage of such characteristics of automated readability approaches to transform ratio-scale value to ordinal-scale value. For instance, we rank the requirements from high readability to low readability, based on the scores (ratio-scale value) from automated readability approaches. The serial number of ranked requirements is in ordinal-scale. Now the problem is that the serial number and readability levels are not one-to-one relationship. Hence, based on the number of readability levels, we need to split ranked requirements into three sets in real practice.
Based on above discussion, we design our experiment as follows: Split every software requirement in pre-designed SRS document and regard each
software requirement as a text block. Run automated readability approaches to score these text block and then rank these text
blocks based on readability. Table 5.7-1 shows an example of an automated approach evaluation result. As we can see in the table, 30 requirements are ranked based their readability score.
Table 5.7-1 Example of an automated approach evaluation result (30RQs)
Ranking No. Readability Score
Requirement No.
1 100 No.16 RQ
2 95 No.3 RQ
3 87 No.22 RQ
… … …
… … …
29 29 No.1 RQ
30 19 No.7 RQ
Volunteers categorize these text blocks into three sets: high readability level, medium
readability level and low readability level. Analyze the result from human judgment. In this phase, we re-categorize all text blocks
after integrating all human judgment results. The final result of this phase is testing oracle for automated readability approaches evaluation. Basically, majority voting is used to generate testing result. In detail, if majority of volunteers categorize a requirement into high readability level according to original human judgment results, this requirement will be categorized into high readability level in testing oracle.

36
Similarly, if majority of volunteers categorize a requirement into medium readability level, this requirement will be categorized into medium readability level in testing oracle. if majority of volunteers categorize a requirement into low readability level, this requirement will be categorized into low readability level in testing oracle. If majority voting does not make sense, for example, the number of volunteers who categorize a requirement into high readability level is the same as the number of volunteers who categorize a requirement into medium readability level, other factors will be involved in categorizing work. As there are two main parts of the volunteers, students and teachers, we hold the view that results from teachers are more reliable. Hence majority voting will be performed among the results from teachers. In detail, categorizing result of such requirement in testing oracle is consistent with the judgment from majority of teachers. Table 5.7-2 shows an example of testing oracle. As we can see in table, three requirements are categorized into high readability level, only one requirement is categorized into low readability level and the rest of 26 requirements are categorized into medium readability level.
Table 5.7-2 Example of testing oracle (30RQs)
Requirement No. Readability level
No.15 RQ High
No.4 RQ High
No.22 RQ High
No.29 RQ Medium
… …
No.13 RQ Medium
No.1 RQ Low
Categorize the ranked requirements into three sets. The number of text blocks that one
set can contain is consistent with testing oracle. Table 5.7-3 shows an example of categorizing ranked requirements. As we can see in the table, 30 requirements are ranked based on their readability score. As we discussed for table 5.7-2, three requirements are categorized into high readability level in testing oracle. Thus, three requirements that evaluated with highest readability score are categorized into high readability level in an automated approach evaluation result. Similarly, one requirement is categorized into low readability level and the rest 26 requirements into medium readability level.
Table 5.7-3 Example of categorizing ranked requirements (30RQs)
Ranking No.
Readability Score
Requirement No.
Readability level
1 100 No.16 RQ High
2 95 No.3 RQ High
3 87 No.22 RQ High

37
… … … Medium
… … … …
29 29 No.1 RQ Medium
30 19 No.7 RQ Low
Analyze result. In this phase, we focus on comparing the categorized result from
automated readability approaches with testing oracle. Verify each software requirement from automated evaluation by checking if the requirement is categorized into the same set from human judgments. For instance, as we can see in table 5.7-3. No.16 requirement is categorized into high readability level from automated evaluation. What we need to do is to verify if No.16 requirement is categorized into high readability level in testing oracle. If so, No.16 requirement is judged as a matched requirement. Finally, we count all matched requirements and calculate the percentage by dividing matched number by total number.
Figure 5.7-1 shows overview process of the experiment in visual way and gives an
example of pre-designed SRS document with nine software requirements.
Figure 5.7-1 Experiment process

38
5.8 Instrumentation The experiment objects, as we mentioned before, is the pre-designed SRS document.
Before the experiment, we plan to write a human judgments process description as the Guidelines for the participants to help them learn how to categorize software requirements. In order to ensure the background and skills of the participants are suitable for our experiment, we plan to make a very simple questionnaire as the measurements for the participants [44]. The questionnaire includes the questions about name, major, if he or she is a native English speaker and other personal information. Paper [71] points out that native English speaker and nonnative English speaker may have different perception to the same English document. If this factor has significant impact in practice, we will set two testing oracles: native English speaker testing oracle and non-native English speaker testing oracle. Significant impact means that the results of human judgment from native English speaker and non-native English speaker have majority of difference.
In order to ensure the experiment is run in controlled environment, following operation will be done: For automated readability approaches evaluation part, we need to record scores from
these approaches directly as well as corresponding scores illustration. For human judgments part, considering that organize all volunteers to take part in the
experiment at one specific time may lead to an issue that not all volunteers are free at the same time segmentation. We plan to organize the human judgment experiment separately. The principle for volunteers is that while they are performing readability judgments, discussion between volunteers is no allowed. When they complete the readability judgments, they are not allowed to modify judgments results. Besides, quiet room is needed.
5.9 Pre-designed SRS Document Design Before perform the experiment, we need to generate pre-designed SRS document including background, requirements and term glossary. The pre-designed SRS document is extracted from an original SRS document, because requirements of the SRS document from multiple sources may cause confusion of volunteers. Besides, we plan to select formal open source SRS document as original SRS document and then extract the background, software requirements as well as term glossary. Background is included to improve the accuracy of readers’ judgment [105]. Term glossary is included for the sake of eliminating the confusion of some terms for volunteers. We select an original SRS document from http://fmt.isti.cnr.it/nlreqdataset/ which presents a list of formal SRS documents from industry or university. We do not select the original SRS document randomly, because many SRS documents present software requirements with images or other specific techniques, which is hard to measure the readability. Besides, raising reading interests is beneficial to perform the experiment [105]. Hence we select a SRS document about smart house as original SRS document. There are more than 80 software requirements in the original SRS document. In order to balance the workload of volunteers and feasibility of experiment, we finally extract 62 software requirements. Through randomly removing, requirements of user description part and developer constraints part are chosen to be removed. Besides, some requirements that have high dependency with other requirements are removed. For instance, the description of RQ1.2 is "the condition of RQ1.1 is that the user should log in the system with user name and password." Following is the discussion about why we remove some parts of requirements and the accuracy of the experiment can be ensured though some parts of requirements are removed: First of all, some requirements have tight dependency with others, for example, the
description of RQ1.2 is "the condition of RQ1.1 is that the user should log in the system with user name and password." It is not hard for human to understand the description but difficult for automated approaches. On the other hand, high dependency among

39
requirements may cause inconvenience in human reading. Hence we remove the requirements that have very tight dependency with others.
Secondly, our experiment needs volunteer involvement, so the engagement and activeness of volunteers need to be considered. If they are required to judge too many requirements, they may feel bored during experiment. Then the negative attitude will directly influence the judgment from volunteers. Hence it is a must to balance workload of volunteers and feasibility of the experiment.
Thirdly, our aim is to analysis the effectiveness of automated approaches. Slightly reduce the number of requirements will reduce the number of matched requirements, but the matching ratio is supposed to be the same. On the other hand, manual readability judgment is performed for every requirement separately, hence the judgment is also made separately. It indicates that readability judgment for each requirement is not supposed to have tight dependency with others. Therefore, removing some parts of requirements does not have huge impact on the accuracy of the experiment in human reading part.
Then, the background and the term glossary is extracted. Some terms that do not appear in extracted requirements are also removed from term glossary. Finally, we reformat extracted background, term glossary and requirements as pre-designed SRS document. In addition, several traps are set in pre-designed SRS document to remove hasty-completing human judgments. In detail, some pairs of requirements are quite similar and if a volunteer presents different readability judgments results of the pairs of requirements, we invalidate all human judgment results from this volunteer. The pre-designed SRS document which we use in experiment is presented in Appendix Two. 5.10 Readability Level Define As described in section 5.7, three sets of readability level are required to determine the readability in human judgment. Concrete conceptions of high readability level, medium readability level and low readability level should be defined. There is no direct definition approach in software requirements domain according to systematic literature review. Hence we perform a pilot study to define them by ourselves. The reason why the number of readability levels we define is three is that these definitions are based on our experience and we can only make rough definitions. The boundary between serial readability levels is hard to clarify because readability is tightly related to human perceptions and human perceptions are difficult to quantify. Three is an acceptable choice to balance the feasibility of the experiment and accuracy of each readability level definition. The goal of the pilot study is to find an acceptable approach to determine the readability of requirements. According to the result of systematic literature review, human reading, Specifications Metrics Methodology [63] and Weirdness Measure [105] are three ways for human to assess texts readability. Human reading is mainly based on human perceptions. However, human perceptions are hard to quantify. In other words, it is difficult for human to explain the reason why the judgment is made. The other two ways are not advisable according to the discussion in section 4.10. Hence we regard human reading as human judgment approach and we need to explore human reading approach. We find that understanding of each word in texts and structures of each sentence have impacts on the readability. We plan to quantify human perceptions in these two perspectives. The pilot study is performed as following process: We read each requirement in pre-designed SRS document and make readability
judgment individually, focusing on if we could understand the requirement. Exchange readability judgment results and if any of us judges that the requirement is not
understandable, then discuss the reason why it is not understandable.

40
During the pilot study, we find that unfamiliar words, ambiguous words and structures of sentences definitely influence the readability judgment. However, we cannot summarize a universal approach to evaluate readability by taking unfamiliar words, ambiguous words and the structures of sentences into consideration formulaically. In addition, we find an interesting thing that sometimes though there are unfamiliar words, ambiguous words or complex structures of sentences, we can still understand the requirements after repeated reading. Because we can guess the meaning of unfamiliar words and ambiguous words according to contexts, or understand the structures of sentences clearly. Such finding indicates that those understandable requirements can be categorized into more sets based on reading times for volunteers to understand the requirements. Since three sets of readability levels (high, medium and low) are required to be reflected, except those requirements that are not understandable, we still need to categorize understandable requirements into two sets based on reading times. Considering we have read the requirements, we invited five students to read the pre-designed SRS document and record reading times to understand the requirements. To balance the number of requirements in the two understandable sets, we finally choose “two” as the watershed based on recorded reading times. In addition, when we set twice reading as watershed, we find that the quantity of requirements in the three sets is similar. Following are the definition of high readability level, medium readability level and difficult understanding: High readability level: The requirement sentence structure is clear with no unfamiliar
words or ambiguous words in the sentence. You can understand the meaning of the requirement within twice reading.
Medium readability level: 1. You can understand the meaning of this requirement with more than twice reading. 2. You find some unfamiliar words or ambiguous words but it doses not influence you in understanding the requirement.
Low readability level: You can't understand the meaning of this requirement even though you have already read it for several times. (Maybe caused by unclear sentence structure, unfamiliar words or ambiguous words)
5.11 Threats to Validate
According to study [115], we plan to validate the experiment in four aspects. Conclusion Validity: Validate the statistical relationship between different treatments
and the related outcomes [44]. As human readability judgment results are from different volunteers and we need to generate a testing oracle, we use majority voting to ensure the accuracy of the testing oracle. The results from automated approaches evaluation are recorded directly and then checked by us separately, hence the accuracy of these results can be permitted. Since matching ratio is calculated based on data from these two aspects directly, no foreseeable factors can influence this process. Therefore, the conclusion is acceptable. One potential risk is that definitions of different readability levels are not accurate enough and then lead to wrong result. A pilot study is performed to mitigate this risk.
Internal Validity: Internal validity in this experiment is focused on the effectiveness of automated readability approaches. As the effectiveness is measured by matching ratio between human readability judgment and automated approaches, it is important to ensure the readability assessment results from these two aspects are reliable. The results from automated approaches are static and easy to control, but the results from human judgment are more flexible and hard to control. The difficulty in human judgment is to define acceptable and feasible readability levels. Hence pilot studies are performed to increase the reliability of this part. On the other hand, we gather personal information of volunteers, which can help us process human readability judgment result better. Furthermore, effectiveness in this experiment is evaluated after ranking requirements based on their readability instead of judging if one requirement is understandable directly. We also provide the process how to apply automated approach in SRS documents readability assessment in future work section.

41
Construct Validity: After the Internal Validity, we need to consider about the construct level. In more detail, we must make sure that the treatments we measured can reflects the construct of the cause and in other hand, the outcomes we get can reflects the construct of the effect well [44, 115]. In our experiment, we are aimed at evaluating the effectiveness of applying automated approaches in SRS document readability assessments and the effectiveness is evaluated by matching ration between human readability judgment and automated approaches results. As there is no existing reflection between human readability judgment and automated approaches results, we have to other effectiveness assessment approach. Then calculating matching ration by ranking requirements based on their readability is chosen. Hence effectiveness in this study refers to the effectiveness of ranking ability of automated approaches. On the other hand, as readability is tightly related to human perceptions, we choose human judgment result as testing oracle to evaluate automated approaches. Although our experiment is not designed precisely enough in readability level distinction, the experiment result is acceptable. Because our readability level definitions do distinguish different readability levels roughly. Higher matching ratio refers to more matched requirements and it can reflect that the automated approach is more effective.
External Validity: The process of this experiment can be regarded as a feasible approach to evaluate the readability for SRS documents. In detail, automated approaches can be placed by other readability evaluation approaches; Evaluation document can be placed by other SRS documents. However, the definitions of different readability levels require to be modified because they are not defined by universal approach. In detail, such definitions are tightly related to our perceptions and may not suitable under other circumstances. Hence, more study on quantifying human perceptions is required. 5.12 Operation For the experiment, there are 24 volunteers who take participant in our experiment, including 15 students and 9 teachers who study in software engineering related domain. 20 volunteers send back the pre-designed SRS document with their experiment results. As we mentioned in 5.9, we set several trap requirements in the document. 2 of 20 experiment results do not pass the trap set. Hence totally we get 18 valid experiment results. 5.13 Result Firstly, we summary personal information of 18 volunteers. The result is shown in table 5.13-1.
Table 5.13-1 The summary of experiment participants' characteristics Characteristics Classification Quantity
Major Domain
Software Engineering 14 Software Process Improvement 1 Software Engineering & Testing 1 Informatics-Statistics-Software
Engineering 1
Software Engineering & Requirement Engineering 1
Education Level
Master Student 12 Master 1
Licentiate 1 PhD Student 1
PhD 3 Experience with
industry requirement
document
Have 8
Don't have 10

42
Native English Speaker
Yes 0 No 18
English using time
0 to 4 years 1 5 to 9 years 1
10 to 14 years 9 15 to 19 years 5
20 years or more 2 Then, we generate testing oracle from the result of human judgments. The result of human judgments from all volunteers is shown in Appendix Three. The result of testing oracle is shown in figure 5.13-1.
Figure 5.13-1 Requirement count for different readability sets
As we can see in table 5.13-1 and figure 5.13-1, 40 requirements are judged as high
readability level, 13 requirements are judged as medium readability level and only 9 requirements are judged as low readability level. It is out of our expectations because the quantity of requirements in high readability set is too large while the quantity of requirements in each set is supposed to be similar. It may result from the difference of proficiency in using English between volunteers and pilot study (readability level define, see section 5.10) participants. Anyhow, we need to respect the fact.
Next, count matched requirements in each set for each automated approach. As mentioned in section 5.7, a requirement is judged as matched requirement if the requirement is categorized into the same set from both automated evaluation and human judgments. Table 5.13-2 shows the number of matched requirements for high readability, medium readability and low readability. We present results from the same formulas in different tools, because during performing automated approaches, we find that same formula in different tools may present different results sometimes. In addition, Readablie.io support seven formulas and Readabilityformulas.com support six formulas. Adding average score from Readable.io and Readabilityformulas.com, and the rest of two tools, we totally present 17 results.
There are nine abbreviations presented in table 5.13-2:
RB means Readable.io. RF means Readabilityformulas.com. ARI means Automated Readability Index.
40
13
9
0
5
10
15
20
25
30
35
40
45
High Readability Medium Readability Low Readability

43
CLI means Coleman-Liau Index. FKGL means Flesch-Kincaid Grade Level. FKRE means Flesch-Kincaid Reading Ease. GFI means Gunning Fog Index. SMOG means SMOG index. NDCS means New Dale-Chall Score.
Table 5.13-2 Matched requirement ID for Low readability
Approach
Number of matched
requirements for high readability
Number of matched
requirements for medium
readability
Number of matched
requirements for low readability
Coh-Metrix 28 4 1 TextEvaluator 25 2 0
RB-ARI 27 4 1 RF-ARI 27 4 1 RB-CLI 25 2 1 RF-CLI 23 3 1
RB-FKGL 27 3 1 RF-FKGL 27 4 1 RB-FKRE 25 2 1 RF-FKRE 24 1 1 RB-GFI 27 4 1 RF-GFI 27 3 1
RB-SMOG 26 3 1 RF-SMOG 26 3 1 RB-NDCS 26 2 1
RB-Average 26 2 1 RF-Average 27 4 1
As table 5.13-2 shows, the quantity of matched requirements in high readability set is
between 23 to 28; In medium readability set, it's between 1 to 4. For all approaches, only one requirement is matched in low readability set expect TextEvaluator. No requirement is matched in low readability set for TextEvaluator.
Finally, sum the total number of matched requirements for each automated readability approach and calculate the matching ratio. The result is shown in table 5.13-3 and the ratio is also drawn as figure 5.13-2.
Table 5.13-3 The quantity of matched requirement and matched ratio for different
approaches
Approach Quantity of matched requirement Matching Ratio
Coh-Metrix 33 53.23% RB-ARI 32 51.61% RF-ARI 32 51.61%
RF-FKGL 32 51.61% RB-GFI 32 51.61%

44
RF-Average 32 51.61% RB-FKGL 31 50.00%
RF-GFI 31 50.00% RB-SMOG 30 48.39% RF-SMOG 30 48.39% RB-NDCS 29 46.77%
RB-Average 29 46.77% RB-CLI 28 45.16%
RB-FKRE 28 45.16% TextEvaluator 27 43.55%
RF-CLI 27 43.55% RF-FKRE 26 41.94%
Figure 5.13-2 Total matched requirement percentage for different approaches
As we can see in table 5.13-3 and figure 5.13-2, all automated approaches have similar
matching ratio which is around 40% and 50%, but Coh-Metrix is the highest.
5.14 Conclusion According to experiment results and our hypothesis, Coh-Metrix is the most effective
automated readability approach for SRS documents. However, we cannot make such arbitrary conclusion now, because we cannot neglect three facts. The first is that the quantity of requirements in high readability set is too large, which is unexpected during experiment design phase, because the quantity of requirements in each set is supposed to be similar The second fact is that the matching ratios of all approaches are similar. Besides, the most important fact is that though Coh-Metrix has the highest matching ratio, the value of the ratio is just 53.23%. It indicates that almost half of the automated readability evaluation results do not match human judgments.
For the first fact, the quantity of requirements in high readability set is too large, it confirms the difficulty in quantifying human perceptions. In detail, definitions of each readability set are created by our pilot study. In the pilot study, we invite five friends who are SE students to test it. The result is that the quantities of requirements in three levels are

45
similar, which means the definitions are suitable. Hence we think such definitions are suitable to quantify readability levels in our experiment. As we discussed in section 5.10, if volunteers understand a requirement within twice reading, the requirement will be judged as high readability level. If volunteers understand a requirement more than twice reading, the requirement will be judged as medium readability level. If volunteers do not understand a requirement, the requirement will be judged as low readability level. The quantity of requirements in these three sets is supposed to be similar. However, the result shows that the number of requirements in these three sets quite different. In other words, the readability level definitions are not accurate enough for volunteers. It confirms that individual perceptions are not easy to quantify in a universal way and it also indicates the limitation of human perceptions quantification through pilot study. This result may result from that there are differences and gaps of English skills and familiarity between the pilot study participants and experiment volunteers. In addition, some experiment volunteers have real experience with SRS documents in industry, which will make different judgment of requirements. Although readability level definitions are flawed, other part of experiment is advisable. For instance, it is feasible to evaluate the effectiveness of automated approaches by ranking requirements based on readability. If human perception quantifying is more valid and more appropriate, the experiment can present more accurate result. On the other hand, another potential reason for causing unexpected experiment result is that some volunteers may be hasty in completing the readability judgment. Therefore, expanding the volume of volunteers is advisable.
For the second fact, we guess that the reason why these approaches show similar results is related to the mechanism of measuring readability. According to the result of systematic literature review, all approaches are based on metrics of readability measurements. Such as Average length of sentences and average syllables of words. It indicates that inputs of these approaches are similar. We also notice that the same formula in different tools preset different results in some cases. We guess that the difference may be caused by design in different tools to extract metrics of readability measurements. Fortunately, it does not have serious impacts on our experiment because the ranking order of the same formula in different tools are almost the same.
For the third fact, we can make a conclusion that Coh-Metrix is the most effective automated readability approach for SRS documents among selected approaches. However, we cannot ensure the feasibility of directly applying Coh-Metrix in SRS documents readability assessment in real practice. When we create hypothesis to determine effectiveness of each automated approach, one potential way is to set threshold. When matching ratio of an automated readability approach is higher than the threshold, we judge that this approach is effective. However, this idea is not feasible in our experiment, because there is no evidence showing which value of the threshold is appropriate. Hence we chose to find the most effective approach, but it does not mean that we can ignore the actual value of matching ratio. The result indicates the high rate of unmatched requirements, so it is controversial to directly apply Coh-Metrix in SRS documents readability assessment. This is the reason why we cannot ensure the feasibility of directly applying Coh-Metrix in real practice. On the other hand, according to the result of systematic literature review, metrics of readability measurement do influence the readability of texts. All selected automated approaches are based on texts readability formulas. Hence the third fact confirms the argument that applying texts readability formulas to measure the readability of expertise documents requires more studies [105]. SRS documents, as expertise field documents, require more semantic factors in readability measures.
To sum up, though the definitions of readability levels have limitations, other part of experiment is advisable. Coh-Metrix is the most effective approach in automated SRS documents readability assessment among selected approaches. However, applying Coh-Metrix in automated readability assessment of SRS documents in real practice is not advisable. These automated approaches require more studies before implementing in real practice.

46
6 CONCLUSION AND FUTURE WORK In this section, we make conclusion for this research by answering each research
question and presenting future work.
6.1 Conclusion SRS document, as the outcome of software requirement phase, is important to whole
software software process. This study is aimed at exploring an automated way to evaluate the readability of SRS documents. In order to achieve this goal, we firstly perform systematic literature review to gather background knowledge about readability and find out potential approach for automated readability assessment for SRS documents. After this, we choose to apply existing freely available general text readability evaluation approaches in SRS documents readability assessment. Finally, we perform experiment to evaluate the effectiveness of these approaches. We have found the most effective automated approach, but this approach is not advisable in real practice. Following is answers to each research question.
RQ1: How do humans score readability of text? For this research question, we get three kinds of ways for human judgments to measure
the readability of texts manually, including human reading, Specifications Metrics Methodology and Weirdness Measure.
Human reading refers to human judge the readability of texts throng reading. It is the most commonly used way in readability measurements. However, human reading has several limitations, and the two main limitations are subjective and ambiguous. Subjective means that human judge the readability mainly based on personal feelings. In other words, human can judge the readability but it is hard to explain the reason why the judgment is made. Ambiguous means that it is hard for human to make distinctions among texts in similar readability level, since human perceptions are hard to quantified. It also indicates that human reading is hard to score readability in ratio-scale.
Specifications Metrics Methodology blends human subjective views in readability formula calculation. The calculation is based on the number of different attributes in the sentences [63]. For instance, attributes of sentences include Initiator of Action, Condition for Action and so on. It requires human participation to count special attributes. However, no existing automated tools support the calculation for the formula described in this methodology.
Weirdness Measure is a method that provides similar results with common readability formulas. The authors of the Weirdness Measure present the idea that if readers have similar reading level, similar interest and similar background knowledge with writers, the readability judgment from these readers will be accurate and convincible. It points out the importance of personal characteristics in readability judgments, which also indicates the necessity of human participation. Weirdness Measure is based on readability formula, but no existing automated tools support the calculation for the formula described in this approach.
RQ2: What automated approaches are used to measure the readability of text? RQ2.1: What are the theories of readability measurement?
We find a list of automated readability measurement approaches, including Flesch-
Kincaid Grade Level, Flesch Reading Ease, Gunning-FOG Score, New Dale-Chall formula, TextEvaluator, Coh-Metrix, SMOG Index, Coleman-Liau Index, Automated Readability Index, Readable.io and Readbilityformulas.com. Among them, Coh-Metrix and TextEvaluator are integrated tools. In other words, they have build-in readability formulas analysis processes and results from these two tools are processed. Readable.io and
47
Readbilityformulas.com show the results of each formulas they provide independently and there is no build-in comprehensive analysis in the two tools. In addition, these two tools can simply provide average score for the formulas. The other seven approaches are readability formulas which can be assessed separately in Readable.io and Readbilityformulas.com. All these approaches are based on metrics of readability measurement, such as average length of each sentence and average syllable of each word. It indicates that all these approaches are not semantic-analysis-related. Detail description of each approach has been discussed in section 4.9.
RQ3: What is the performance of automated SRS readability approaches in terms of
effectiveness? According to the result of the experiment, we can make a conclusion that Coh-Metrix is
the most effective automated readability approach among selected automated approaches. However, we cannot ensure the feasibility in directly applying Coh-Metrix in SRS documents readability assessment real practice. Because the result shows that almost half of requirements do not match human judgments. Through the experiment, we find that it is hard to quantify human perceptions in universal ways. Although readability level definitions are flawed, other part of experiment is advisable. If human perception can be quantified more validly and more appropriately, the result of the experiment can be more accurate.
6.2 Future Work
As mentioned in section 5.14, it is feasible to evaluate the effectiveness of automated approaches by ranking requirements based on readability. We also need to illustrate the way how to achieve automated readability assessments of SRS documents by ranking requirements. Assume that Coh-Metrix is suitable for automated SRS documents readability assessment and the readability of a SRS document is required to be improved. Table 6.2-1 shows an example of applying Coh-Metrix in SRS documents readability assessment. Rank requirements according to the measurement results from Coh-Metrix at first. As
we can see in the example, requirements are ranked based on their readability grades. The higher readability grade, the lower readability level.
Check the readability of these requirements by human reading from low readability level to high readability level. In this example, check from No.3 RQ to No.7 RQ. Assume that No.5 RQ is judged as understandable enough, the rest of un-read requirements (from No.7 RQ to No.5 RQ) can be ignored in readability assessment by human reading. Because the rest of requirements have been evaluated as higher readability than No.5 RQ.
Those read requirements (From No.3 RQ to No.5 RQ) are target part that need to be improved on readability. Human resource in SRS document readability assessment can be saved by applying such automated approach.
Table 6.2-1 Example of applying automated approaches Requirement No. Readability Grade
No.3 RQ 12.1
No.27 RQ 10.8
… …
No. 5 RQ 7.7
… …
No.81 RQ 3

48
No.7 RQ 2.8
In the future, there will be two aspects of improvement for this study. One of them is to
study more on human perception quantifying. Only when human perception quantifying is more valid and more appropriate can the experiment present more accurate result. The other aspect is to generate new solutions for automate SRS documents readability assessments. According to study [46], researchers develop a vocabulary-based complementary approach with existing readability approaches to assess expertise documentations in medical field and they obtain achievement with such approach. Vocabulary-based complementary approach refers to add semantic analysis in automated readability evaluation to existing general text readability assessment approaches. It indicates the feasibility of developing automated readability approaches for expertise field documents. As we discussed before, most of existing automated readability approaches are based on metrics of readability measurement. It limits the usage of applying texts readability approaches to measure the readability of SRS documents. If we can develop a vocabulary-based complementary approach with suitable automated readability approaches for software domain, automated SRS documents readability measurement can be achieved in real practice.
49
REFERENCES
[1] Braude E (2001) Software engineering. An object oriented per- spective. Wiley, London. [2] Brooks FP (1987) No silver bullet. Essence and accidents of software engineering. IEEE Comput 20(4):10–
19, April 1987. Reprinted in: Brooks FP The mytical man-month, essays on software engineering. Addison-Wesley, 1995 (20th anniversary edition).
[3] Zeist R, Hendriks P (1996) Specifying software quality with the extended ISO model. Softw Qual J 5(4):273–284.
[4] Christel M, Kang K (1992) Issues in requirements elicitation. Carnegie Mellon University, Software Engineering Institute. Technical report CMU/SEI-92-TR-012.
[5] Kiyavitskaya N, Zeni N, Mich L, Berry DM (2008) Requirements for tools for ambiguity identification and measurement in natural language requirements specifications. Requir Eng 13(3):207–239.
[6] Lauesen, Soren. Software requirements: styles and techniques. Pearson Education, 2002. [7] Fabbrini F, Fusani M, Gnesi S, et al. The linguistic approach to the natural language requirements quality:
benefit of the use of an automatic tool[C]//Software Engineering Workshop, 2001. Proceedings. 26th Annual NASA Goddard. IEEE, 2001: 97-105.
[8] B. Regnell, P. Beremark, O. Eklundh A Market-Driven Requirements Engineering Process: Results From an Industrial Process Improvement Programme, Requirements Engineering, 3(2), 1998, pp. 121-129.
[9] N. Power Variety and Quality in Requirements Documentation Seventh International Workshop on Requirements Engineering: Foundation for Software Quality, Interlaken, Switzerland, June 4-5 2001.
[10] G. Lami Towards an Automatic Quality Evaluation of Natural Language Software Specifications. Technical Report. B4-25-11-99. IEI-CNR, 1999.
[11] Kanter H A, Ed. D, Muscarello T J, et al. Measuring the Readability of Software Requirement Specifications: An Empirical Study[J]. 2008.
[12] T. Miller, G. Leroy, S. Chatterjee, J. Fan, and B. Thoms, “A classifier to evaluate language specificity of medical documents,” in Proceedings of the 40th Annual Hawaii International Conference on System Sciences, 3-6 Jan. 2007, 2007, p. 7 pp.
[13] N. Vanderschantz, C. Timpany, and A. Hill, “Children’s Reading of Text on Interactive Whiteboards,” in Proceedings of the 24th Australian Computer-Human Interaction Conference, New York, NY, USA, 2012, pp. 624–632.
[14] Binmore K. Why Experiment in Economics?[J]. The Economic Journal, 1999, 109(453):16-24. [15] Dufour S. and Fortin D. (1992) Annotated bibliography on case-study method. Current Sociology (Sociologie
Contemporaine) 40 (1) 167-181 Golby M. (2002) Case study method: Key issues, key texts. British Journal of Educational Psychology 72 303-304
[16] B. Kitchenham, S. Charters, Guidelines for performing systematic literature reviews in software engineering, Tech. Rep. EBSE 2007-001, Keele, University and Durham University Joint Report (2007).
[17] Ali N B, Petersen K, Wohlin C. A systematic literature review on the industrial use of software process simulation[J]. Journal of Systems and Software, 2014, 97: 65-85.
[18] Redish J. Readability formulas have even more limitations than Klare discusses[J]. ACM Journal of Computer Documentation (JCD), 2000, 24(3): 132-137.
[19] Klare G R. The Measurement of Readability[J]. Acm Journal of Computer Documentation, 2000, 24(3):107-121.
[20] K. M. Sheehan, I. Kostin, D. Napolitano, and M. Flor, “The textevaluator tool: Helping teachers and test developers select texts for use in instruction and assessment,” Elementary School Journal, vol. 115, no. 2, pp. 185–209, 2014.
[21] J. S. Kim and J. Guryan, “The Efficacy of a Voluntary Summer Book Reading Intervention for Low-Income Latino Children From Language Minority Families,” Journal of Educational Psychology, vol. 102, no. 1, pp. 20–31, 2010.
[22] J. P. Williams and L. 1998. ‘Observing R. L. U. F. F. to T. E. M. . T. S. 26: 62–68. Leblanc, “Teaching and Learning Guide for: Youth-Subculture Studies: Sociological Traditions and Core Concepts,” Sociology Compass, vol. 2, no. 2, pp. 765–774, 2008.
[23] Kai P. Measuring and predicting software productivity: A systematic map and review[J]. Information & Software Technology, 2011, 53(4):317-343.
[24] J. Palotti, G. Zuccon, and A. Hanbury, “The influence of pre-processing on the estimation of readability of web documents,” in International Conference on Information and Knowledge Management, Proceedings, 2015, vol. 19-23-Oct-2015, pp. 1763–1766.
[25] J.-W. Chung, H.-J. Min, J. Kim, and J. C. Park, “Enhancing Readability of Web Documents by Text Augmentation for Deaf People,” in Proceedings of the 3rd International Conference on Web Intelligence, Mining and Semantics, New York, NY, USA, 2013, p. 30:1–30:10.
[26] G. A. Rose and J. Welsh, “Formatted programming languages,” Software - Practice and Experience, vol. 11, no. 7, pp. 651–69, Jul. 1981.
[27] C. Wu, H. Yang, J. Zhu, J. Zhang, I. King, and M. R. Lyu, “Sparse Poisson coding for high dimensional document clustering,” in 2013 IEEE International Conference on Big Data, 2013, pp. 512–517.

50
[28] R. Huang and W. Lam, “Semi-supervised Document Clustering via Active Learning with Pairwise
Constraints,” in Seventh IEEE International Conference on Data Mining (ICDM 2007), 2007, pp. 517–522. [29] D. Hebert, P. Barlas, C. Chatelain, S. Adam, and T. Paquet, “Writing Type and Language Identification in
Heterogeneous and Complex Documents,” in 2014 14th International Conference on Frontiers in Handwriting Recognition, 2014, pp. 411–416.
[30] O. A. Nina, “Interactive enhancement of handwritten text through multi-resolution Gaussian,” in Proceedings - International Workshop on Frontiers in Handwriting Recognition, IWFHR, 2012, pp. 769–773.
[31] F. Drira, “Towards restoring historic documents degraded over time,” in Proceedings - Second International Conference on Document Image Analysis for Libraries, DIAL 2006, 2006, vol. 2006, pp. 350–357.
[32] A. Khan, N. Salim, and Y. J. Kumar, “Genetic semantic graph approach for multi-document abstractive summarization,” in 2015 Fifth International Conference on Digital Information Processing and Communications (ICDIPC), 2015, pp. 173–181.
[33] S. Banerjee, P. Mitra, and K. Sugiyama, “Generating Abstractive Summaries from Meeting Transcripts,” in Proceedings of the 2015 ACM Symposium on Document Engineering, New York, NY, USA, 2015, pp. 51–60.
[34] G. Hallema, M. Veenstra, and S. Bank, “The Impact of Rhetorical Devices in Text on Public Displays,” in Proceedings of the 5th ACM International Symposium on Pervasive Displays, New York, NY, USA, 2016, pp. 148–153.
[35] S. Gomathi, R. U. Devi, and S. Mohanavel, “Trimming approach for word segmentation with focus on overlapping characters,” in 2013 International Conference on Computer Communication and Informatics, 2013, pp. 1–4.
[36] A. A. Al-Ajlan, H. S. Al-Khalifa, and A. M. S. Al-Salman, “Towards the development of an automatic readability measurements for arabic language,” in 3rd International Conference on Digital Information Management, ICDIM 2008, 2008, pp. 506–511.
[37] “STIL 2009 - 2009 7th Brazilian Symposium in Information and Human Language Technology,” in STIL 2009 - 2009 7th Brazilian Symposium in Information and Human Language Technology, 2010.
[38] J. Redish, “Readability Formulas Have Even More Limitations Than Klare Discusses,” ACM J. Comput. Doc., vol. 24, no. 3, pp. 132–137, Aug. 2000.
[39] A. Fantechi, S. Gnesi, G. Lami, and A. Maccari, “Application of linguistic techniques for Use Case analysis,” in Proceedings IEEE Joint International Conference on Requirements Engineering, 2002, pp. 157–164.
[40] J. Polpinij, “An ontology-based text processing approach for simplifying ambiguity of requirement specifications,” in 2009 IEEE Asia-Pacific Services Computing Conference (APSCC), 2009, pp. 219–226.
[41] C. Litsas, M. Mastropavlou, and A. Symvonis, “Text classification for children with dyslexia employing user modelling techniques,” in IISA 2014 - 5th International Conference on Information, Intelligence, Systems and Applications, 2014.
[42] K. Petersen, N. Ali, Identifying strategies for study selection in systematic reviews and maps, in: Proceedings of the International Symposium on Empirical Software Engineering and Measurement (ESEM), IEEE, 2011, pp. 351–354.
[43] Ivarsson M, Gorschek T. A method for evaluating rigor and industrial relevance of technology evaluations[J]. Empirical Software Engineering, 2011, 16(3):365-395.
[44] C.Wohlin, P. Runeson, M. Höst, M. C. Ohlsson, B. Regnell, A.Wessl´en, Experimentation in software engineering, Springer, 2012.
[45] Beecham S, Baddoo N, Hall T, et al. Motivation in Software Engineering: A systematic literature review[J]. Information & Software Technology, 2008, 50(9–10):860-878.
[46] G. Leroy, T. Miller, G. Rosemblat, and A. Browne, “A balanced approach to health information evaluation: A vocabulary-based naïve Bayes classifier and readability formulas,” Journal of the American Society for Information Science and Technology, vol. 59, no. 9, pp. 1409–1419, 2008.
[47] L. Feng, “Automatic Readability Assessment for People with Intellectual Disabilities,” SIGACCESS Access. Comput., no. 93, pp. 84–91, 2009.
[48] S. M. Sharp, “Consent documents for oncology trials: Does anybody react these things?,” American Journal of Clinical Oncology: Cancer Clinical Trials, vol. 27, no. 6, pp. 570–575, 2004.
[49] D. Kauchak and G. Leroy, “Moving beyond readability metrics for health-related text simplification,” IT Professional, vol. 18, no. 3, pp. 45–51, 2016.
[50] M. K. Paasche-Orlow, D. M. Jacob, M. Hochhauser, and R. M. Parker, “National survey of patients’ bill of rights statutes,” Journal of General Internal Medicine, vol. 24, no. 4, pp. 489–494, 2009.
[51] C. R. Patel, D. V. Cherla, S. Sanghvi, S. Baredes, and J. A. Eloy, “Readability assessment of online thyroid surgery patient education materials,” Head & Neck, vol. 35, no. 10, pp. 1421–1425, 2013.
[52] A. K. Seth, C. R. Vargas, D. J. Chuang, and B. T. Lee, “Readability Assessment of Patient Information about Lymphedema and Its Treatment,” Plastic and Reconstructive Surgery, vol. 137, no. 2, p. 287e–295e, 2016.
[53] K. Kasabwala et al., “Readability assessment of the American Rhinologic Society patient education materials,” International Forum of Allergy & Rhinology, vol. 3, no. 4, pp. 325–333, 2013.
[54] B. B. Ott and T. L. Hardie, “Readability of Advance Directive Documents,” Image: the Journal of Nursing Scholarship, vol. 29, no. 1, pp. 53–57, 1997.
[55] G. Rubiera, R. Arbizu, A. Alzueta, J. J. Agúndez, and J. R. Riera, “Readability of informed consent documents used in the hospitals of Asturias,” Gaceta sanitaria / S.E.S.P.A.S, vol. 18, no. 2, pp. 153–158, 2004.
51
[56] A. E. M. Eltorai et al., “Readability of Invasive Procedure Consent Forms,” Clinical and Translational
Science, vol. 8, no. 6, pp. 830–833, 2015. [57] G. B. Dronberger and G. T. Kowitz, “Abstract readability as a factor in information systems,” Journal of the
American Society for Information Science, vol. 26, no. 2, pp. 108–11, Mar. 1975. [58] K. K. Aggarwal, Y. Singh, and J. Kumar, “An integrated measure of software maintainability,” in
Proceedings of the Annual Reliability and Maintainability Symposium, 2002, pp. 235–241. [59] C. Arora, M. Sabetzadeh, L. Briand, F. Zimmer, and R. Gnaga, “Automatic Checking of Conformance to
Requirement Boilerplates via Text Chunking: An Industrial Case Study,” in 2013 ACM / IEEE International Symposium on Empirical Software Engineering and Measurement, 2013, pp. 35–44.
[60] R.S. Lemos, “On the readability of COBOL manuals,” International Journal of Man-Machine Studies, vol. 19, no. 4, pp. 377–89, Oct. 1983.
[61] F. Lehner, “Quality control in software documentation based on measurement of text comprehension and text comprehensibility,” Information Processing and Management, vol. 29, no. 5, pp. 551–568, 1993.
[62] D.C. Rine and A. Fraga, “Requirements quality knowledge representation using chunking complexity measurement: prior to formal inspections,” in SKY 2013. 4th International Workshop on Software Knowledge in conjunction with IC3K 2013, 22 Sept. 2013, 2013, pp. 20–30.
[63] R.S. Kenett, “Software specifications metrics: a quantitative approach to assess the quality of documents,” in Proceedings of 19th Convention of Electrical and Electronics Engineers in Israel, 5-6 Nov. 1996, 1996, pp. 166–9.
[64] R. Plosch, A. Dautovic, and M. Saft, “The value of software documentation quality,” in 2014 14th International Conference on Quality Software (QSIC), 2-3 Oct. 2014, 2014, pp. 333–42.
[65] R. Elghondakly, S. Moussa, and N. Badr, “Waterfall and agile requirements-based model for automated test cases generation,” in 2015 IEEE Seventh International Conference on Intelligent Computing and Information Systems (ICICIS), 2015, pp. 607–612.
[66] Y. Liu and Z. Liu, A corpus-based study of college English coursebooks, vol. 204–210. 2011. [67] M. D. Jacobson and M. A. MacDougall, “Automated evaluation and analysis of computer-based instructional
systems,” in 6th annual national colloquium on information retrieval; the information bazaar, 8-9 May 1969, 1969, pp. 281–91.
[68] M. J. Embrechts, J. Linton, W. F. Bogaerts, B. Heyns, and P. Evangelista, “Automated text categorization based on readability fingerprints,” in Artificial Neural Networks - ICANN 2007. 17th International Conference, 9-13 Sept. 2007, 2007, pp. 408–16.
[69] T. P. Lau and I. King, “Bilingual Web Page and Site Readability Assessment,” in Proceedings of the 15th International Conference on World Wide Web, New York, NY, USA, 2006, pp. 993–994.
[70] A. C. Graesser, Moongee Jeon, Yan Yan, and Zhiqiang Cai, “Discourse cohesion in text and tutorial dialogue,” Information Design Journal, vol. 15, no. 3, pp. 199–213, 2007.
[71] L. Zhang, Z. Liu, and J. Ni, “Feature-based assessment of text readability,” in Proceedings - 2013 7th International Conference on Internet Computing for Engineering and Science, ICICSE 2013, 2013, pp. 51–54.
[72] T. P. Lau, S. Wang, Y. Man, C. F. Yuen, and I. King, “Language Technologies for Enhancement of Teaching and Learning in Writing,” in Proceedings of the 23rd International Conference on World Wide Web, New York, NY, USA, 2014, pp. 1097–1102.
[73] S. Tonelli, K. T. Manh, and E. Pianta, “Making Readability Indices Readable,” in Proceedings of the First Workshop on Predicting and Improving Text Readability for Target Reader Populations, Stroudsburg, PA, USA, 2012, pp. 40–48.
[74] H. Nishikawa, T. Hasegawa, Y. Matsuo, and G. Kikui, “Opinion Summarization with Integer Linear Programming Formulation for Sentence Extraction and Ordering,” in Proceedings of the 23rd International Conference on Computational Linguistics: Posters, Stroudsburg, PA, USA, 2010, pp. 910–918.
[75] H. Nishikawa, T. Hasegawa, Y. Matsuo, and G. Kikui, “Optimizing Informativeness and Readability for Sentiment Summarization,” in Proceedings of the ACL 2010 Conference Short Papers, Stroudsburg, PA, USA, 2010, pp. 325–330.
[76] R.A. Guillemette, “Readability assessments of college data processing texts,” Interface: The Computer Education Quarterly, vol. 10, no. 3, pp. 30–6, Fall 1988.
[77] K. Bargate, “The readability of Managerial Accounting and Financial Management textbooks,” Meditari Accountancy Research, vol. 20, no. 1, pp. 4–20, 2012.
[78] Xuri Tang, Zi Peng, and Dongmei Zhou, “Adaptive approach to concordance readability,” in 2007 Workshop on Intelligent Information Technology Application, 2-3 Dec. 2007, 2007, pp. 239–42.
[79] O. De Clercq and V. Hoste, “All Mixed Up? Finding the Optimal Feature Set for General Readability Prediction and Its Application to English and Dutch,” Comput. Linguist., vol. 42, no. 3, pp. 457–490, Sep. 2016.
[80] Fukun Xing, Dongyuan Cheng, and Jianzhong Pu, “A new approach to readability study based on information computing,” in 2008 International Conference on Advanced Language Processing and Web Information Technology Conference, 23-25 July 2008, 2008, pp. 156–61.
[81] Zhiwei Jiang, Gang Sun, Qing Gu, Lixia Yu, and Daoxu Chen, “An Extended Graph-Based Label Propagation Method for Readability Assessment,” in Web Technologies and Applications. 17th Asia-Pacific Web Conference, APWeb 2015, 18-20 Sept. 2015, 2015, pp. 485–96.

52
[82] P. van Oosten, V. Hoste, and D. Tanghe, “A posteriori agreement as a quality measure for readability
prediction systems,” in Computational Linguistics and Intelligent Text Processing. 12th International Conference, CICLing 2011, 20-26 Feb. 2011, 2011, vol. pt.2, pp. 424–35.
[83] K. M. Sheehan, “A Review of Evidence Presented in Support of Three Key Claims in the Validity Argument for the TextEvaluator® Text Analysis Tool,” ETS Research Report Series, vol. 2016, no. 1, pp. 1–15, 2016.
[84] S. A. Crossley, J. Greenfield, and D. S. McNamara, “Assessing text readability using cognitively based indices,” TESOL Quarterly, vol. 42, no. 3, pp. 475–493, 2008.
[85] E. Eika and F. E. Sandnes, Assessing the reading level of web texts for WCAG2.0 compliance—can it be done automatically?, vol. 500. 2016.
[86] S. Khurana, M. Relan, and V. K. Singh, “A text analytics-based approach to compute coverage, readability and comprehensibility of eBooks,” in 2013 Sixth International Conference on Contemporary Computing (IC3), 8-10 Aug. 2013, 2013, pp. 256–61.
[87] M. Sydes and J. Hartley, “A thorn in the Flesch: observations on the unreliability of computer-based readability formulae,” British Journal of Educational Technology, vol. 28, no. 2, pp. 143–5, Apr. 1997.
[88] E. Eika and F. E. Sandnes, “Authoring WCAG2.0-Compliant Texts for the Web Through Text Readability Visualization,” in Universal Access in Human-Computer Interaction. Methods, Techniques and Best Practices. 10th International Conference, UAHCI 2016, held as part of HCI International 2016, 17-22 July 2016, 2016, vol. pt.I, pp. 49–58.
[89] A. C. Graesser, D. S. McNamara, M. M. Louwerse, and Z. Cai, “Coh-Metrix: Analysis of text on cohesion and language,” Behavior Research Methods, Instruments, and Computers, vol. 36, no. 2, pp. 193–202, 2004.
[90] R. S. Lemos, “Comparative readability of ten introductory cobol textbooks,” Computers and Education, vol. 6, no. 3, pp. 277–285, 1982.
[91] T. François and E. Miltsakaki, “Do NLP and Machine Learning Improve Traditional Readability Formulas?,” in Proceedings of the First Workshop on Predicting and Improving Text Readability for Target Reader Populations, Stroudsburg, PA, USA, 2012, pp. 49–57.
[92] L. Moreno, P. Martínez, I. Segura-Bedmar, and R. Revert, “Exploring Language Technologies to Provide Support to WCAG 2.0 and E2R Guidelines,” in Proceedings of the XVI International Conference on Human Computer Interaction, New York, NY, USA, 2015, p. 57:1–57:8.
[93] S. Williams and E. Reiter, “Generating basic skills reports for low-skilled readers,” Natural Language Engineering, vol. 14, no. 4, pp. 495–525, Oct. 2008.
[94] S. Zhou, H. Jeong, and P. A. Green, “How Consistent Are the Best-Known Readability Equations in Estimating the Readability of Design Standards?,” 2017.
[95] J. Redish, “Readability formulas have even more limitations than Klare discusses,” ACM Journal of Computer Documentation, vol. 24, no. 3, pp. 132–7, Aug. 2000.
[96] J. D. Hayden, “Readability in the British Journal of Surgery,” British Journal of Surgery, vol. 95, no. 1, pp. 119–124, 2008.
[97] W. A. Wagenaar, R. Schreuder, and G. J. Wijlhuizen, “Readability of instructional text, written for the general public,” Applied Cognitive Psychology, vol. 1, no. 3, pp. 155–167, 1987.
[98] P. Heydari and A. Mehdi Riazi, “Readability of texts: Human evaluation versus computer index,” Mediterranean Journal of Social Sciences, vol. 3, no. 1, pp. 177–190, 2012.
[99] R. Qumsiyeh and Y.-K. Ng, “ReadAid: A robust and fully-automated readability assessment tool,” in Proceedings - International Conference on Tools with Artificial Intelligence, ICTAI, 2011, pp. 539–546.
[100] M. Jansche, L. Feng, and M. Huenerfauth, “Reading Difficulty in Adults with Intellectual Disabilities: Analysis with a Hierarchical Latent Trait Model,” in Proceedings of the 12th International ACM SIGACCESS Conference on Computers and Accessibility, New York, NY, USA, 2010, pp. 277–278.
[101] D. Janan and D. Wray, “Reassessing the accuracy and use of readability formulae,” Malaysian Journal of Learning and Instruction, vol. 11, no. 1, pp. 127–145, 2014.
[102] U. Waltinger and A. Mehler, “Social Semantics and Its Evaluation by Means of Semantic Relatedness and Open Topic Models,” in 2009 IEEE/WIC/ACM International Joint Conference on Web Intelligence and Intelligent Agent Technology, 2009, vol. 1, pp. 42–49.
[103]Y. Yamamoto, D. Miyamoto, and M. Nakayama, “Text-Mining Approach for Estimating Vulnerability Score,” in 2015 4th International Workshop on Building Analysis Datasets and Gathering Experience Returns for Security (BADGERS), 2015, pp. 67–73.
[104] I. W. Othman et al., “Text readability and fraud detection,” in ISBEIA 2012 - IEEE Symposium on Business, Engineering and Industrial Applications, 2012, pp. 296–301.
[105] Neil Newbold and Lee Gillam, “The Linguistics of Readability: The Next Step for Word Processing,” in Proceedings of the NAACL HLT 2010 Workshop on Computational Linguistics and Writing: Writing Processes and Authoring Aids, Stroudsburg, PA, USA, 2010, pp. 65–72.
[106] P. Heydari, “The validity of some popular readability formulas,” Mediterranean Journal of Social Sciences, vol. 3, no. 2, pp. 423–435, 2012.
[107] Sandra Harrison and Paul Bakker, “Two new readability predictors for the professional writer: pilot trials,” Journal of Research in Reading, vol. 21, no. 2, pp. 121–138, 1998.
[108] J. C. Redish, “Understanding the limitations of readability formulas,” IEEE Transactions on Professional Communication, vol. PC-24, no. 1, pp. 46–48, Mar. 1981.
[109] O. De Clercq, V. Hoste, B. Desmet, P. Van Oosten, M. De Cock, and L. Macken, “Using the crowd for readability prediction,” Natural Language Engineering, vol. 20, no. 3, pp. 293–325, 2014.

53
[110] S. Karmakar and Y. Zhu, “Visualizing multiple text readability indexes,” in ICEMT 2010 - 2010 International
Conference on Education and Management Technology, Proceedings, 2010, pp. 133–137. [111] S. Karmakar and Y. Zhu, “Visualizing text readability,” in Proc. - 6th Intl. Conference on Advanced
Information Management and Service, IMS2010, with ICMIA2010 - 2nd International Conference on Data Mining and Intelligent Information Technology Applications, 2010, pp. 291–296.
[112] F. Zhang, “Writing papers using nivivo8 and coh-metrix,” in Computer-Enhanced and Mobile-Assisted Language Learning: Emerging Issues and Trends, 2011, pp. 235–248.
[113] Saavedra R, Ballejos L, Ale M. Software Requirements Quality Evaluation: State of the art and research challenges[C]//14th Argentine Symposium on Software Engineering. 2013.
[114] Höst M, Regnell B, Wohlin C. Using Students as Subjects-A Comparative Study of Students and Professionals in Lead-Time Impact Assessment.[J]. Empirical Software Engineering, 2000, 5(3):201-214.
[115] Cook T D, Campbell D T. Quasi-experimentation : design & analysis issues for field settings[M]. Rand McNally College Pub. Co. 1979.

54
APPENDIX ONE
Title
Author
Context
Design
Validity threats
Users/Subjects Scale
Research MethodologyTotal ScoreRelated Research Question
1
A balanced approach to health information evaluation: A
vocabulary-based naïve Bayes classifier and readability
formulas
Gondy Leroy, Trudi Miller, Graciela
Rosemblat and Allen Browne
1 0.5
01
11
4.5
1,2,2.1
2 Abstract readability as a factor in information systems
Dronberger, Gladys and
Kowitz, Gerald
0.5
0.5
00
00
1none
3 A corpus-based study of college English coursebooks
YH Liu,ZQ Liu
0.5
0.5
00
00
1none
4 Adaptive approach to concordance readability
Xuri Tang, Zi Peng, Dongmei Zhou
0.5
0.5
01
01
32,2.1
5
All Mixed Up? Finding the Optimal Feature Set for
General Readability Prediction and Its Application to
English and Dutch
Orphee De Clercq
∗ , Veronique
Hoste
∗∗
1 0.5
01
11
4.5
2,2.1
6A new approach to readability study based on information
computing
Fukun Xing, Dongyuan Cheng,
Jianzhong Pu
0.5
0.5
00.5
00
1.5
2,2.1
7An Extended Graph-Based Label Propagation Method for
Readability Assessment
Zhiwei Jiang, Gang Sun, Qing Gu
⋆
,
Lixia Yu, and Daoxu Chen
1 0.5
01
01
3.5
2,2.1
8 An integrated measure of software maintainability
K.K. Aggarwal, Y. Singh, J.K.
Chhabra
0.5
0.5
00
00
1none
9A posteriori agreement as a quality measure for readability
prediction systems
Philip van Oosten, V eeronique Hoste,
and Dries Tanghe
0.5
0.5
00
00
1none
10
A Review of Evidence Presented in Support of Three Key
Claims in the Validity Argument for the TextEvaluator®
Text Analysis Tool
Kathleen M. Sheehan
0 0
00
00
02,2.1
11
Assessing text readability using cognitively based indices
SCOTT A. CROSSLEY, JERRY
GREENFIELD, DANIELLE S.
McNAMARA
1 0.5
01
11
4.5
2,2.1
12
Assessing the reading level of web texts for WCAG2.0
compliance—can it be done automatically?
Eika and Sandnes
0 0
00
00
0none
13
A text analytics-based approach to compute coverage,
readability and comprehensibility of eBooks
Swati Khurana, Mahima Relan and
Vivek Kumar Singh
0.5
0.5
00
00
1
little relation with readability
measument, some argument
may be useful
14
A thorn in the Flesch: observations on the unreliability of
computer-based readability formulae
Matthew Sydes and James Hartley
0 0
00
00
0none
15
Authoring WCAG2.0-Compliant Texts for the Web
Through Text Readability Visualization
Evelyn Eikal and Frode Eika Sandnes
0 0
00
00
0
Visulization way to present
text, may be useful for
suggestion of how to write
down SRS
16
Automated evaluation and analysis of computer-based
instructional systems
Jacobson and MacDougall
0 0
00
00
0none
17
Automated text categorization based on readability
fingerprints
Mark J. Embrechts, Jonathan Linton,
Walter F. Bogaerts, Bram Heyns, and
Paul Evangelista
0 0
00
00
0none
18
Automatic Checking of Conformance to Requirement
Boilerplates via Text Chunking: An Industrial Case Study
Chetan Arora, Mehrdad Sabetzadeh,
Lionel Briand, Frank Zimmer, Raul
Gnaga
1 0.5
11
11
5.5
2,2.1
19
Automatic Readability Assessment for People with
Intellectual Disabilities
Lijun Feng
0.5
0.5
00.5
10
2.5
2,2.1
20
Bilingual Web Page and Site Readability Assessment
Tak Pang Lau, Irwin King
0.5
0.5
00.5
00
1.5
2
21
Coh-Metrix: Analysis of text on cohesion and language
Arthur C. Graesser, Max M
Louwerse, Zhiqiang Cai
0 0
01
10
22,2.1
22
Comparative readability of ten introductory cobol
textbooks
Lemos
1 0.5
01
11
4.5
2,2.1
Paper Information
Scoring for Rigor
Scoring for Relevance

55
Title
Author
ContextDesign
Validity threats
Users/Subjects
Scale
Research MethodologyTotal ScoreRelated Research Question
23Consent documents for oncology trials: Does anybody
react these things?
Sharp
0 0
00
00
0none
24Discourse cohesion in text and tutorial dialogue
Arthur C. Graesser, Zhiqiang Cai
0 0
00
00
02.1
25Do NLP and Machine Learning Improve Traditional
Readability Formulas?
Thomas Franc ois, Eleni Miltsakaki
1 0.5
01
01
3.5
none
26Exploring Language Technologies to Provide Support to
WCAG 2.0 and E2R Guidelines
Lourdes Moreno, Paloma Martenez,
Isabel Segura-Bedmar, Ricardo
Revert
0 0
00
00
0none
27Feature-based assessment of text readability
Lixiao Zhang, Zaiying Liu and Jun Ni 0.5
0.5
01
01
3
native and second-language
readers have different congtive
for the same text
28Generating basic skills reports for low-skilled readers
SANDRA WILLIAMS and EHUD
REITER
0.5
0.5
00.5
11
3.5
none
29
How Consistent Are the Best-Known Readability
Equations in Estimating the Readability of Design
Standards?
SHIXIANG ZHOU, HEEJIN
JEONG, AND PAUL A. GREEN
1 0.5
01
11
4.5
2,2.1
30Language Technologies for Enhancement of Teaching and
Learning in Writing
Tak Pang Lau, Shuai Wang,
Yuanyuan Man, Chi Fai Yuen, and
Irwin King
0 0
00
00
0
little content about readability
accessment and it is focused
on Chinese
31Making Readability Indices Readable
Sara Tonelli, Ke Tran Manh,
Emanuele Pianta
0.5
0.5
01
01
32
32Moving beyond readability metrics for health-related text
simplification
Kauchak and Leroy
0.5
0.5
00.5
00
1.5
2
33National survey of patients' bill of rights statutes
Michael K. Paasche-Orlow, Dan M.
Jacob, Mark Hochhauser, and Ruth
M. Parker
0.5
0.5
00
00
12
34On the readability of COBOL manuals
R.S. Lemos
0.5
0.5
01
00
2none
35Opinion Summarization with Integer Linear Programming
Formulation for Sentence Extraction and Ordering
H Nishikawa,T Hasegawa,Y
Matsuo,G Kikui
0.5
0.5
01
00
2none
36Optimizing Informativeness and Readability for Sentiment
Summarization
H Nishikawa,T Hasegawa,Y
Matsuo,G Kikui
0.5
0.5
01
00
2none
37
Quality control in software documentation based on
measurement of text comprehension and text
comprehensibility
F. Lehner
0.5
0.5
01
10
32
38Readability assessment of online thyroid surgery patient
education materials
CR Patel,DV Cherla,S Sanghvi,
S Baredes,JA Eloy
0.5
0.5
01
00
2.5
1
39Readability Assessment of Patient Information about
Lymphedema and Its Treatment
AK Seth,CR Vargas,DJ
Chuang,BT Lee
1 0.5
01
00
2.5
1
40Readability assessment of the American Rhinologic
Society patient education materials
K Khushabu,M Poonam,DR
Hansberry,A Nitin,B Soly
1 0.5
01
10
3.5
1,2,2.1
41Readability assessments of college data processing texts
R.A. Guillemette
0.5
0.5
01
00
2none
42Readability formulas have even more limitations than
Klare discusses
J. Redish
0 0
01
00
1background
43Readability in the British Journal of Surgery
J. D. Hayden
0.5
0.5
01
10
31,2
44Readability of Advance Directive Documents
BB Ott,TL Hardie
0.5
0.5
01
00
22
Paper Information
Scoring for Rigor
Scoring for Relevance

56
Title
Author
ContextDesign
Validity threats
Users/Subjects Scale
Research MethodologyTotal ScoreRelated Research Question
45Readability of informed consent documents used in the
hospitals of Asturias
G Rubiera,R Arbizu,A Alzueta,
JJ Agúndez,JR Riera
0 0
00
00
0none
46Readability of instructional text, written for the general
public
WA Wagenaar,R Schreuder,GJ
Wijlhuizen
0.5
0.5
01
10
31
47Readability of Invasive Procedure Consent Forms
AE Eltorai,SS Naqvi,S
Ghanian,CP Eberson,AC Weiss
1 0.5
01
10
3.5
1
48Readability of texts: Human evaluation versus computer
index
P. Heydari, A. Mehdi Riazi
0.5
0.5
01
10
31,2
49ReadAid: A robust and fully-automated readability
assessment tool
R. Qumsiyeh,Y.-K. Ng
1 0.5
01
10
3.5
2,2.1
50Reading Difficulty in Adults with Intellectual Disabilities:
Analysis with a Hierarchical Latent Trait Model
M Jansche,L Feng,M Huenerfauth
0.5
0.5
00
10
2none
51Reassessing the accuracy and use of readability formulae
D. Janan,D. Wray
0.5
0.5
01
01
31
52
Requirements quality knowledge representation using
chunking complexity measurement: prior to formal
inspections
D.C. Rine,A. Fraga
1 0.5
01
11
4.5
1
53Social Semantics and Its Evaluation by Means of Semantic
Relatedness and Open Topic Models
U. Waltinger,A. Mehler
0.5
0.5
00
10
2none
54Software specifications metrics: a quantitative approach to
assess the quality of documents
R.S. Kenett
0.5
0.5
01
11
41,2,2.1
55Text-Mining Approach for Estimating Vulnerability ScoreD Miyamoto
∗ ,Y Yamamoto†,M
Nakayama
∗
1 0.5
00
00
1.5
none
56Text readability and fraud detection
IW Othman,H Hasan,R Tapsir,
NA Rahman
1 0.5
01
11
4.5
2,2.1
57The Linguistics of Readability: The Next Step for Word
Processing
Neil Newbold,Lee Gillam
1 0.5
01
01
3.5
1 and background
58The readability of Managerial Accounting and Financial
Management textbooks
K. Bargate
0.5
0.5
01
10
31
59The validity of some popular readability formulas
P. Heydari
1 0.5
01
10
3.5
1
60The value of software documentation quality
R. Plosch,A. Dautovic,M. Saft
0.5
0.5
0.5
00
01.5
background
61Two new readability predictors for the professional writer:
pilot trials
Sandra Harrison,Paul Bakker
1 0.5
01
11
4.5
1
62Understanding the limitations of readability formulas
J. C. Redish
0 0.5
00
00
0.5
none
63Using the crowd for readability prediction
OD Clercq,V Hoste,B Desmet,
PV Oosten,MD Cock
1 1
01
11
51
64Visualizing multiple text readability indexes
Karmakar.S, Zhu.Y
1 0.5
01
00
2.5
1 but too complex for
experiement
65Visualizing text readability
Karmakar.S, Zhu.Y
1 0.5
01
00
2.5
1 but too complex for
experiment
66Waterfall and agile requirements-based model for
automated test cases generation
R. Elghondakly, S. Moussa, N. Badr
1 0.5
00
11
3.5
background
67Writing papers using nivivo8 and coh-metrix
Zhang.F
1 0.5
01
10
3.5
2 , 2.1
Scoring for Relevance
Scoring for Rigor
Paper Information

57
APPENDIX TWO Name___________________________
Major/Study domain___________________________
Education level___________________________
Experience with requirement document for industry (Have/Do not have) ___________________________
Native English speaker (Yes/No) ___________________________
How long do you use English (If you are native English speaker, skip this question)? ___________________________

58
Reader Guideline This document is used to evaluate the readability of software requirements. You should read following instructions carefully and you cannot turn to next page until you are permitted. There are three levels of readability, described as following: High Level Readability(H) - The requirement sentence structure is clear with no unfamiliar words or ambiguous words in the sentence. You can understand the meaning of the requirement within twice reading. Low Level Readability(L) - You can't understand the meaning of this requirement even though you have already read it for several times. (Maybe caused by unclear sentence structure, unfamiliar words or ambiguous words) Medium Level Readability(M) - You can understand the meaning of this requirement with more than twice reading. 2. You find some unfamiliar words or ambiguous words but it doses not influence you in understanding the requirement. Background and term glossary are given. You should judge the readability of each requirement and mark H, M or L before sequent number of each requirement.

59
Background This document specifies the requirements for the development of a “Smart House”, called DigitalHome (DH), by the DigitalHomeOwner Division of HomeOwner Inc. A “Smart House” is a home management system that allows home residents to easily manage their daily lives by providing for a lifestyle that brings together security, environmental and energy management (temperature, humidity and lighting), entertainment, and communications. The Smart House components consist of household devices (e.g., a heating and air conditioning unit, a security system, and small appliances and lighting units, etc.), sensors and controllers for the devices, communication links between the components, and a computer system, which will manage the components. Term Glossary ASHRAE - American Society of Heating, Refrigerating and Air-Conditioning Engineers
Authentication - any process by which it is verified that someone is who they claim they are. This typically involves submission and verification of a username and a password.
Broadband Internet - a high data rate Internet access, typically contrasted with slower dial-up access
DH (Digital Home) - the name of the prototype smart home product that is be produced by DigitalHomeOwner
DigitalHomeOwner – the division of HomeOwner Inc. responsible for producing DigitalHome products
DSL (Digital Subscriber Line) - a family of technologies that provides digital data transmission over the wires of a local telephone network
Encryption - the process of transforming information (referred to as plaintext) using an algorithm (called cipher) to make it unreadable to anyone except those possessing special knowledge, usually referred to as a key.
Gateway Device - a home networking device used to connect devices in the home to the Internet or other Wide Area Networks.
HomeOwner Inc. - the largest national retail chain serving the needs of home owners in building, furnishing, repairing, and improving their homes
HVAC - Heating, Ventilation and Air Conditioning Humidistat - an instrument that measures and controls relative humidity ISP -Internet Service Provider PDA – Personal Digital Assistant RF – Radio Frequency
Security Breach – an external act that bypasses or contravenes the digital home security system. For example, if an intruder opens a door where the contact sensor is set to “on”, the system will sense a ‘security breach”.
Transport Layer Security - cryptographic protocols that provide security for communications over networks such as the Internet

60
Requirements 1. Operational Environment
1.1 The home system shall require an Internet Service Provider (ISP). The ISP should be widely available (cable modem, high speed DSL), such as Bright House or Bellsouth FastAccess.
1.2 Home DH Gateway Device
1.2.1 The DH Gateway device shall provide communication with all the DigitalHome devices and shall connect with a broadband Internet connection.
1.2.2 The Gateway shall contain an RF Module, which shall send and receive wireless communications between the Gateway and the other DigitalHome devices (sensors and controllers).
1.2.3 The Gateway device shall operate up to a 1000-foot range for indoor transmission.
1.3 Sensors and Controllers
1.3.1 The system shall include digital programmable thermostats, which shall be used to monitor and regulate the temperature of an enclosed space.
1.3.2 The system shall include digital programmable humidistats, which shall be used to monitor and regulate the humidity of an enclosed space.
1.3.3 The system shall include magnetic alarm contact switches which shall be used to monitor entry through a door or window when the switch is active.
1.3.4 The system shall include security sound and light alarms, which can be activated when DigitalHome senses a security breach from a magnetic contact.
1.3.5 The system shall include digital programmable power switches which shall be used to monitor the current state of an appliance (e.g., a coffee maker is off or on).
1.3.6 The system shall be able to use a power switch to change the state of the appliance (e.g., from “off” to “on”).
2. Functional Requirements
2.1 General Requirements
2.1.1 The DigitalHome System shall allow a web-ready computer, cell phone or PDA to control a home's temperature, humidity, lights, security, and the state of small appliances.
2.1.2 The communication center of the DH system shall be a DH home web server, through which a user shall be able to monitor and control home devices and systems.
2.1.3 Each DigitalHome shall contain a master control device (the DH Gateway Device) that connects to the home’s broadband Internet connection, and uses wireless communication to send and receive communication between the DigitalHome system and the home devices and systems.
2.1.4 The DigitalHome shall be equipped with various environmental controllers and sensors (temperature controller-sensors: thermostats, humidity controller-sensors: humidistats, contact sensors, security sound and light alarms, and power switches).

61
2.1.5 Using wireless communication, sensor values can be read and saved in the home database.
2.1.6 Controller values can be sent to controllers to change the DH environment.
2.2 Thermostat Requirements
2.2.1 The DigitalHome programmable thermostat shall allow a user to monitor and control a home’s temperature from any location, using a web ready computer, cell phone, or PDA.
2.2.2 A DH user shall be able to read the temperature at a thermostat position.
2.2.3 A DH user shall be able to set the thermostat temperatures to between 60 °F and 80 °F, inclusive, at one degree increments.
2.2.4 Up to eight thermostats shall be placed in rooms throughout the home.
2.2.5 The thermostats may be controlled individually or collectively, so that temperature can be controlled at different levels in different home spaces.
2.2.6 A single thermostat shall be placed in an enclosed space (e.g., a room in the house) for which the air temperature is to be controlled.
2.2.7 For each thermostat, up to twenty-four one hour settings per day for every day of the week can be scheduled.
2.2.8 If a thermostat device allows a user to make a manual temperature setting, the setting shall remain in effect until the end of the planned or default time period, at which time the planned or default setting will be used for the next time period.
2.2.9 A thermostat unit shall communicate, through wireless signals, with the master control unit.
2.2.10 The system shall support Fahrenheit and Celsius temperature values.
2.2.11 The system shall be compatible with a centralized HVAC (Heating, Ventilation and Air Conditioning) systems: gas, oil, electricity, solar, or a combination of two or more. The system shall adhere to the standards, policies and procedures of the American Society of Heating, Refrigerating and Air-Conditioning Engineers [ASHRAE 2010].
2.3 Humidistat Requirements
2.3.1 The DigitalHome programmable humidistat shall allow a user to monitor and control a home’s humidity from any location, using a web ready computer, cell phone, or PDA.
2.3.2 A DH user shall be able to read the humidity at a humidistat position.
2.3.3 A DH user shall be able to set the humidity level for a humidistat, from 30% to 60%, inclusive a 1% increments.
2.3.4 Up to eight humidistats shall be placed in rooms throughout the home.
2.3.5 A single humidistat shall be placed in an enclosed space (e.g., a room in the house) for which the humidity is to be controlled.

62
2.3.6 If a humidistat device allows a user to make a manual temperature setting, the setting shall remain in effect until the end of the planned or default time period, at which time the planned or default setting will be used for the next time period.
2.3.7 For each humidistat, up to twenty-four one hour settings per day for every day of the week can be scheduled.
2.3.8 A DigitalHome system shall use wireless signals to communicate, through the master control unit, with the humidistats.
2.4 Security System Requirements
2.4.1 The DigitalHome security system consists of contact sensors and a set security alarms.
2.4.2 A DigitalHome system shall be able to manage up to fifty door and window contact sensors.
2.4.3 A DigitalHome system shall be able to activate both light and sound alarms: one sound alarm and one light alarm subsystem, with multiple lights.
2.4.4 When a security breach occurs and a contact sensor is set OPEN, the alarm system shall be activated.
2.5 Appliance Management Requirements
2.5.1 The DigitalHome programmable Appliance Manager shall provide for management of a home’s small appliances, including lighting units, by allowing a user to turn them on or off as desired.
2.5.2 The Appliance Manager shall be able to manage up to one hundred 115 volt, 10 amp power switches.
2.5.3 The system shall be able to provide information about the state of a power switch (OFF or ON), indicating the whether an appliance connected to the power switch is OFF or ON.
2.5.4 The system shall be able to change the state of a power switch (OFF to ON, or ON to OFF), in turn changing the state of an appliance connected to the power switch.
2.5.5 If a user changes the state of power switch device manually, the device shall remain in that state until the end of the planned or default time period, at which time the planned or default setting will be used for the next time period.
2.6 DH Planning and Reporting Requirements
2.6.1 DigitalHome Planner shall provide a user with the capability to direct the system to set various preset home parameters (temperature, humidity, security contacts, and on/off appliance/light status) for certain time periods.
2.6.2 For a given month and year, a user shall be able to create or modify a month plan that specifies for each day, for up to four daily time periods, the environmental parameter settings (temperature, humidity, contact sensors and power switches).
2.6.3 A user shall be able to override planned parameter values, through the DH website, or if available, through manual switches on household devices
2.6.4 For a given month and year, in the past two years, DigitalHome shall be able to provide a report on the management and control of the home.

63
2.6.5 The month report shall contain daily average, maximum (with time) and minimum (with time) values of temperature and humidity for each thermostat and humidistat, respectively.
2.6.6 The month report shall provide the day and time for which any security breaches occurred, that is, when the security alarms were activated.
2.6.7 The month report shall provide a section that indicates the periods of time when the DH System was not in operation.
3. Other Non-Functional Requirements
3.1 Performance Requirements
3.1.1 Displays of environmental conditions (temperature, humidity, contact sensors and power switches) shall be updated at least every two seconds.
3.1.2 Sensor (temperature, humidity, contact sensor, power state) shall have a minimum data acquisition rate of 10 Hz.
3.1.3 An environmental sensor or controller device shall have to be within 1000 feet of the master control device, in order to be in communication with the system.
3.2 Reliability
3.2.1 The DigitalHome System must be highly reliable with no more than 1 failure per 10,000 hours of operation.
3.2.2 The Digital Home System shall incorporate backup and recovery mechanisms.
3.2.3 The DH System will backup all system data (configuration, default parameter settings, planning, and usage data) on a daily basis, with the backup time set by the DH Technician at system set up.
3.2.4 If the DH System fails (due to power loss, loss of internet access, or other software or hardware failure), the system recovery mechanism shall restore system data (configuration, default parameter settings, planning, and usage data) from the most recent backup.
3.2.5 All DigitalHome operations shall incorporate exception handling so that the system responds to a user with a clear, descriptive message when an error or an exceptional condition occurs.
3.2.6 Although there are no specific safety requirements, high system reliability is important to insure there are no system failures in carrying out user requests. Such failures might affect the safety of home dwellers (e.g., security breaches, inadequate lighting in dark spaces, inappropriate temperature and humidity for people who are in ill-health, or powering certain appliances when young children are present).
3.2.7 Upon installation, a DigitalHome user account shall be established. The DigitalHome web system shall provide for authentication and information encryption through a recognized reliable and effective security technology, such as Transport Layer Security.
3.2.8 Log in to an account shall require entry of an account name and a password.

64
APPENDIX THREE Requirement No.
High Level Medium Level
Low Level Final Level
1.1 14 4 0 H 1.2.1 15 2 1 H 1.2.2 12 6 0 H 1.2.3 5 6 7 L 1.3.1 12 5 1 H 1.3.2 11 5 2 H 1.3.3 8 9 1 M 1.3.4 13 3 2 H 1.3.5 15 3 0 H 1.3.6 16 2 0 H 2.1.1 14 4 0 H 2.1.2 13 2 3 H 2.1.3 6 11 1 M 2.1.4 11 6 1 H 2.1.5 14 3 1 H 2.1.6 11 6 1 H 2.2.1 7 11 0 M 2.2.2 8 10 0 M 2.2.3 12 4 2 H 2.2.4 8 8 2 M 2.2.5 10 6 2 H 2.2.6 4 5 9 L 2.2.7 4 5 9 L 2.2.8 5 10 3 M 2.2.9 12 5 1 H 2.2.10 16 1 1 H 2.2.11 9 6 3 H 2.3.1 11 5 2 H 2.3.2 11 4 3 H 2.3.3 6 3 9 L 2.3.4 9 6 3 H 2.3.5 11 4 3 H 2.3.6 5 10 3 M 2.3.7 6 4 8 L 2.3.8 13 3 2 H 2.4.1 12 4 2 H 2.4.2 14 1 3 H 2.4.3 12 4 2 H 2.4.4 13 4 1 H 2.5.1 11 5 2 H 2.5.2 5 6 8 L 2.5.3 12 5 1 H 2.5.4 7 10 1 M 2.5.5 6 9 3 M 2.6.1 11 5 2 H 2.6.2 5 5 8 L 2.6.3 4 5 9 L 2.6.4 15 1 2 H 2.6.5 9 9 0 M

65
2.6.6 12 5 1 H 2.6.7 15 2 1 H 3.1.1 15 3 0 H