Energy Requirement Calculator for Passenger Vehicles Using ...
20
Copyright © 2012 Mahindra & Mahindra Ltd. All rights reserved. Energy Requirement Calculator for Passenger Vehicles Using Parameter Based Vehicle Model Developed in MATLAB Lakshmi Nair Mahindra Research Valley Mahindra and Mahindra Ltd [email protected]
-
Upload
khangminh22 -
Category
Documents
-
view
0 -
download
0
Transcript of Energy Requirement Calculator for Passenger Vehicles Using ...

Copyright © 2012 Mahindra & Mahindra Ltd. All rights reserved.
Energy Requirement Calculator for Passenger Vehicles Using Parameter Based Vehicle Model
Developed in MATLAB
Lakshmi Nair
Mahindra Research Valley
Mahindra and Mahindra [email protected]

Copyright © 2012 Mahindra & Mahindra Ltd. All rights reserved.
Introduction
Vehicle Energy Calculations
Approach to Problem Statement
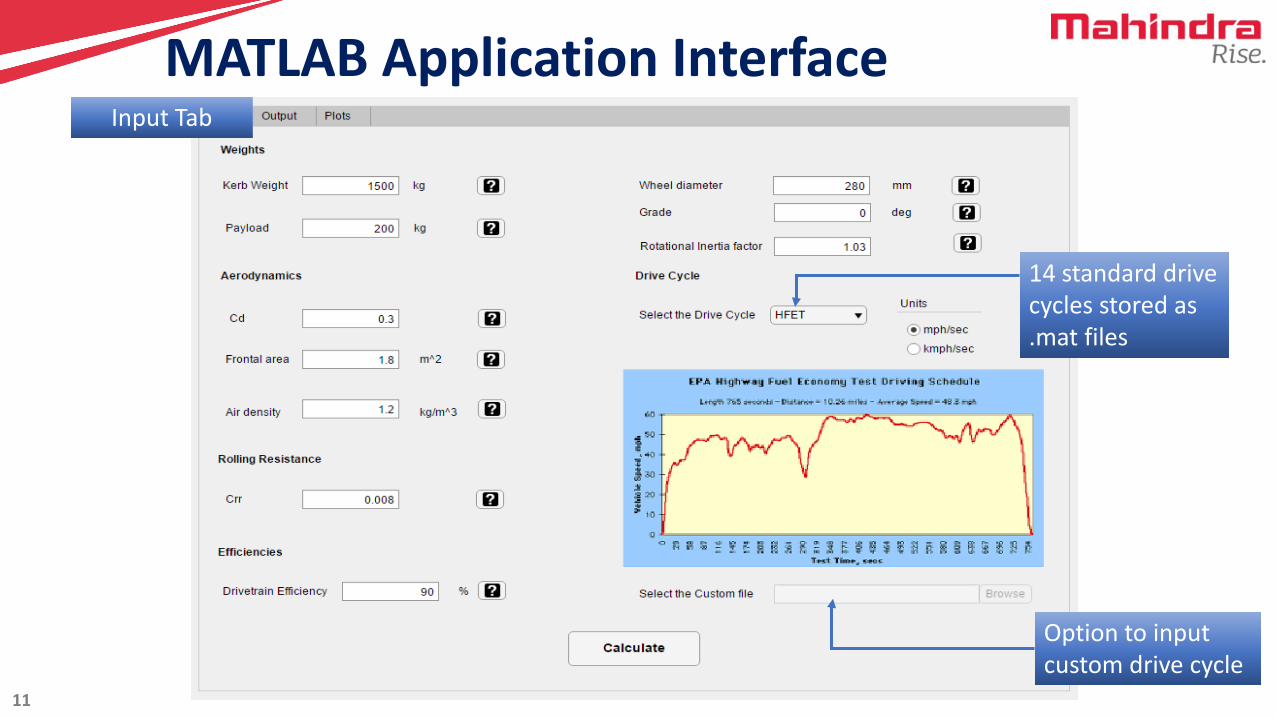
MATLAB Application Interface
Results and Representative Plots
Use of MATLAB Tools
Conclusions
Contents

Introduction
03
Vehicle mass Inertias
AerodynamicsRolling resistance
Drive cycles
Aerodynamic DragRolling Resistance
Inertial Force
Total energy consumption
Vehicle Design Parameters
Forces acting during Drive cycle
Automotive Product
Development
Inputs to the application
Outputs from the application

05
Vehicle Energy Calculations
where, Ftot = total (resultant) forceFRR = force due to tire rolling resistanceFAD = force due to aerodynamic dragFI = force necessary to overcome inertia (acceleration, deceleration, and traversing a grade)
Tire rolling resistance
where, m = vehicle mass (kg) g = 9.81 m/s2 (gravitational constant) CRR = coefficient of rolling resistance (dimensionless)
Source: http://www.virtual-car.org/wheels/hybrid_road_load_model.htmlhttps://www.carswithcords.net/2015/01/rolling-resistance.html
Total Tractive Force and its components
𝐹𝐹𝑡𝑡𝑡𝑡𝑡𝑡 = 𝐹𝐹𝑅𝑅𝑅𝑅 + 𝐹𝐹𝐴𝐴𝐴𝐴 + 𝐹𝐹𝐼𝐼
𝐹𝐹𝑅𝑅𝑅𝑅 = 𝑚𝑚𝑚𝑚𝐶𝐶𝑟𝑟𝑟𝑟

06
Aerodynamic Drag
where, rho = density of air (kg/m3)CD = drag coefficient (dimensionless)AF = projected frontal area (m2)v = average velocity during a time increment of the driving cycle (m/s)
Inertia Force
where, m = vehicle mass (kg)dv/dt = acceleration (or deceleration) rateg = 9.81 m/s2 (gravitational constant)
= grade of the road
Vehicle Energy Calculations
Source: http://www.virtual-car.org/wheels/hybrid_road_load_model.htmlhttps://gr8autotech.wordpress.com/2013/06/16/vehicular-aerodynamics/
Total Tractive Force and its components
Aero Drag
𝐹𝐹𝐼𝐼 = 𝑚𝑚 �d𝑣𝑣d𝑡𝑡 + 𝑚𝑚𝑚𝑚 sin𝛼𝛼
𝛼𝛼
𝐹𝐹𝐴𝐴𝐴𝐴 =12𝜌𝜌𝐶𝐶𝑑𝑑𝐴𝐴𝑓𝑓𝑣𝑣2

07
Source: http://www.virtual-car.org/wheels/hybrid_road_load_model.html
Tractive Power
where, v = average velocity during a time increment of the driving cycle (m/s)
Vehicle Energy Calculations
𝑃𝑃 = 𝐹𝐹𝑅𝑅𝑅𝑅 + 𝐹𝐹𝐴𝐴𝐴𝐴 + 𝐹𝐹𝐼𝐼 𝑣𝑣

08
Approach to Problem StatementComputation Procedure
Acceleration Mode
Cruising
Braking

09
Identification of driving modes
Approach to Problem Statement
Total Tractive Force
Positive Inertia Force
Positive Positive Acceleration
Zero Cruising
Negative Powered Deceleration
Zero Coast Down
Negative Braking
11
MATLAB Application Interface
14 standard drive cycles stored as .mat files
Option to input custom drive cycle
Input Tab

12
ResultsEnergy Analysis Time Split
47%
37%
16%
Energy Consumption in %
Energy Consumed inAerodynamic Drag
Energy Consumed in RollingResistance
Energy Consumed inOvercoming Inertia
44%
1%16%
26%
13%
Time Split
Acceleration
Idle
Cruising
PoweredDecelerationBraking

13
Representative Plots- Total Power

14
Representative Plots- Inertia Power

15
Representative Plots- Aerodynamic Drag

16
Representative Plots- Rolling Resistance

17
Representative Plots- Brake Power

18
Use of MATLAB ToolsApplication was created with the help of App Designer
interface in MATLAB
Executable (.exe) file for the application created with
MATLAB Application Compiler
This application has been deployed in our Mahindra
server based centralized application platform, MathApps

19
Quick and easy to use calculator , beneficial to design and
platform engineers
The designers can evaluate multiple design iterations
The results can be further used for feasibility analysis
Plots can help to visualize the performance of the vehicle
and can aid the designer in his decision-making process
Conclusions

19
Questions?