Continuously-tunable Cherenkov-radiation-based detectors ...
Upload
independentCategory
view
0download
0
Exploration Of Activity Measurements And Equilibrium Checks For Sediment Dating Using Thick-Window
Germanium Detectors
Jacob A. Warnera, Kathryn E. Fitzsimmonsb, Eva M. Reynoldsc, Laura G. Gladkisa, Heiko Timmersa
aSchool of Physical, Environmental and Mathematical Sciences, University of New South Wales at the Australian Defence Force Academy, Canberra ACT 2602, Australia
bDepartment of Human Evolution, Max Planck Institute for Evolutionary Anthropology, Deutscher Platz 6, D-04103 Leipzig, Germany
cResearch School of Earth Sciences, Australian National University, Canberra ACT 0200, Australia
Abstract. Activity measurements on sediment samples for trapped-charge geological dating using gamma-ray spectroscopy are an important verification of the field-site dose rate determination. Furthermore gamma-ray spectroscopy can check if the natural decay series are in secular equilibrium which is a crucial assumption in such dating. Typically the activities of leading members of the Thorium and Uranium decay series are measured, which requires Germanium detectors with thin windows and good energy resolution in order to effectively detect the associated low energy gamma-rays. Such equipment is not always readily available. The potential of conventional Germanium detectors with thick entrance window has been explored towards routine gamma-ray spectroscopy of sediment samples using higher energy gamma-rays. Alternative isotopes, such as Ac-228 and Pb-212 for the Thorium series, and Pa-234m, Ra-226 and Bi-214 for the Uranium series, have been measured in order to determine the mass-specific activity for the respective series and possibly provide a check of secular equilibrium. In addition to measurements of the K-40 activity, with the alternative approach, the activities of both decay series can be accurately determined. The secular equilibrium condition may be tested for the Thorium series. Measurement accuracy for Pa-234m is, however, not sufficient to permit also a reliable check of equilibrium for the Uranium series.
Keywords: Natural Decay Series, Gamma-Ray Detection, Trapped-Charge Dating, Luminescence Dating. PACS: 07.85.Nc, 93.30.Fd, 93.85.Np
INTRODUCTION
A commonly used group of techniques for determining the age of geological sediment samples is trapped-charge dating, which includes the methods of optically stimulated luminescence (OSL), thermoluminescence (TL) and electron spin resonance (ESR). These techniques measure the total dose of ionizing radiation received by a sediment sample since burial. Combining this result with a measurement of the dose rate of ionizing radiation in the sediment then gives the age according to
DoseAge
Dose Rate
(1)
For optimal dating, the accuracy achievable with the TL, OSL and ESR techniques and that of the dose rate determination need to be similar. This is aided, if field recordings of total gamma-ray dose rates from portable sodium iodide detectors are verified by laboratory gamma-ray spectroscopy with Germanium detectors [1]. Such spectroscopy is particularly important if field recordings are impossible. The main contributions to the dose rate are from radioactive potassium (K-40; ~46%), see Figure 1(a), with a typical mass-specific activity of the order of 310 Bq/kg, and from the Thorium, Uranium and Actinium natural decay series (~53%) with mass-specific activities of the order of 41 Bq/kg, 37.3 Bq/kg and 1.7 Bq/kg, respectively [2].
The K-40 activity can be measured via the characteristic 1461 keV gamma-ray line. Since the half-life of the mother of each of the three decay series
Application of Accelerators in Research and IndustryAIP Conf. Proc. 1336, 213-218 (2011); doi: 10.1063/1.3586091
© 2011 American Institute of Physics 978-0-7354-0891-3/$30.00
213Downloaded 04 Aug 2011 to 194.94.96.198. Redistribution subject to AIP license or copyright; see http://proceedings.aip.org/about/rights_permissions
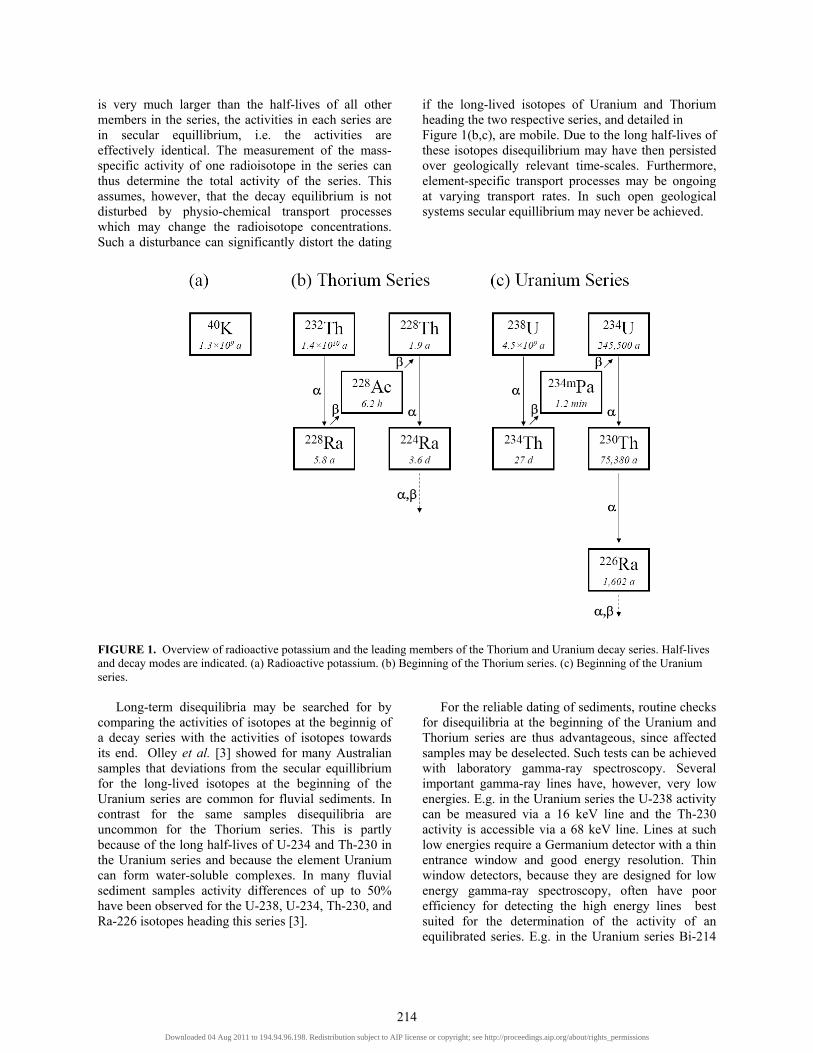
is very much larger than the half-lives of all other members in the series, the activities in each series are in secular equillibrium, i.e. the activities are effectively identical. The measurement of the mass-specific activity of one radioisotope in the series can thus determine the total activity of the series. This assumes, however, that the decay equilibrium is not disturbed by physio-chemical transport processes which may change the radioisotope concentrations. Such a disturbance can significantly distort the dating
if the long-lived isotopes of Uranium and Thorium heading the two respective series, and detailed in Figure 1(b,c), are mobile. Due to the long half-lives of these isotopes disequilibrium may have then persisted over geologically relevant time-scales. Furthermore, element-specific transport processes may be ongoing at varying transport rates. In such open geological systems secular equillibrium may never be achieved.
FIGURE 1. Overview of radioactive potassium and the leading members of the Thorium and Uranium decay series. Half-lives and decay modes are indicated. (a) Radioactive potassium. (b) Beginning of the Thorium series. (c) Beginning of the Uranium series.
Long-term disequilibria may be searched for by
comparing the activities of isotopes at the beginnig of a decay series with the activities of isotopes towards its end. Olley et al. [3] showed for many Australian samples that deviations from the secular equillibrium for the long-lived isotopes at the beginning of the Uranium series are common for fluvial sediments. In contrast for the same samples disequilibria are uncommon for the Thorium series. This is partly because of the long half-lives of U-234 and Th-230 in the Uranium series and because the element Uranium can form water-soluble complexes. In many fluvial sediment samples activity differences of up to 50% have been observed for the U-238, U-234, Th-230, and Ra-226 isotopes heading this series [3].
For the reliable dating of sediments, routine checks for disequilibria at the beginning of the Uranium and Thorium series are thus advantageous, since affected samples may be deselected. Such tests can be achieved with laboratory gamma-ray spectroscopy. Several important gamma-ray lines have, however, very low energies. E.g. in the Uranium series the U-238 activity can be measured via a 16 keV line and the Th-230 activity is accessible via a 68 keV line. Lines at such low energies require a Germanium detector with a thin entrance window and good energy resolution. Thin window detectors, because they are designed for low energy gamma-ray spectroscopy, often have poor efficiency for detecting the high energy lines best suited for the determination of the activity of an equilibrated series. E.g. in the Uranium series Bi-214
214Downloaded 04 Aug 2011 to 194.94.96.198. Redistribution subject to AIP license or copyright; see http://proceedings.aip.org/about/rights_permissions
may be effectively measured via a 1764 keV line and the K-40 activity is accessible via a 1461 keV line. Furthermore, specialized Germanium detectors with thin entrance windows are not readily available, whereas conventional Germanium detectors without entrance window and suitable lead shielding exist in many research labs.
In order to faciliate routine measurements of mass-specific activities in sediment samples and also to search for disequilibria, the potential of a conventional Germanium detector for such measurements has been explored. In order to widen the applicability of the results to non-ideal detection conditions, a Germanium detector with somewhat deteriorated energy resolution has been used in comparison with state-of-the-art gamma-ray spectroscopy.
Some of the samples studied in this work are from Pilot Creek, a small ephemeral channel located in the southeastern Australian highlands. This site is of interest since since the remains of terrestrial megafauna have been found, the timing and causes of their extinction being uncertain.
EXPERIMENTAL DETAILS
Two sets of sediment samples were investigated. Five samples were from aeolian desert dunes from the Strzelecki and Tirari Deserts in Australia [4]. Due to the type of sedimentation and its location, deviations from secular equilibrium in these samples are unlikely. Six further samples were collected from the fluvial sediments at Pilot Creek near Canberra, Australia. Since these samples have experienced water through-flow during their burial history, Uranium mobility, and consequently disequilibrium, is of potential concern for the reliability of dating at this site.
Following retrieval on site samples were dried at 121°C and then milled to a fine, consistent powder using a titanium mill. Approximately 80 g of the material was weighed, then compressed into standard containers forming approximately 10-15 mm thin disks to ensure reproducible detection geometry. The containers were sealed with an O-ring to avoid Radon escape. Sample geometry and thickness were chosen to maximize sample mass and minimize self-absorption within the sample. For gamma-ray spectroscopy the sample container was placed on top of the Aluminum can of a conventional, upright, cylindrical high purity Germanium detector (Ortec). Both, detector and sample were inside the bore of a cylindrical lead castle. The thickness of the low radiation lead shielding around and above the sample and detector was in excess of 100 mm. Underneath, detector and sample were shielded by the filled liquid nitrogen dewar of the Germanium detector. On the
inside the lead bore was lined with a Cd/Cu shield to suppress neutrons from the lead and associated x-rays.
Due to previous applications in high radiation environments the energy resolution of the detector had deteriorated to a FWHM of about 10 keV for the Co-60 lines, thus simulating non-ideal measurement conditions, which may prevail in a routine analysis situation. Measurement times of 144 h per sample were deliberately chosen to be relatively long to maximize counting statistics. Detector operation was stable and detection dead time was insignificant.
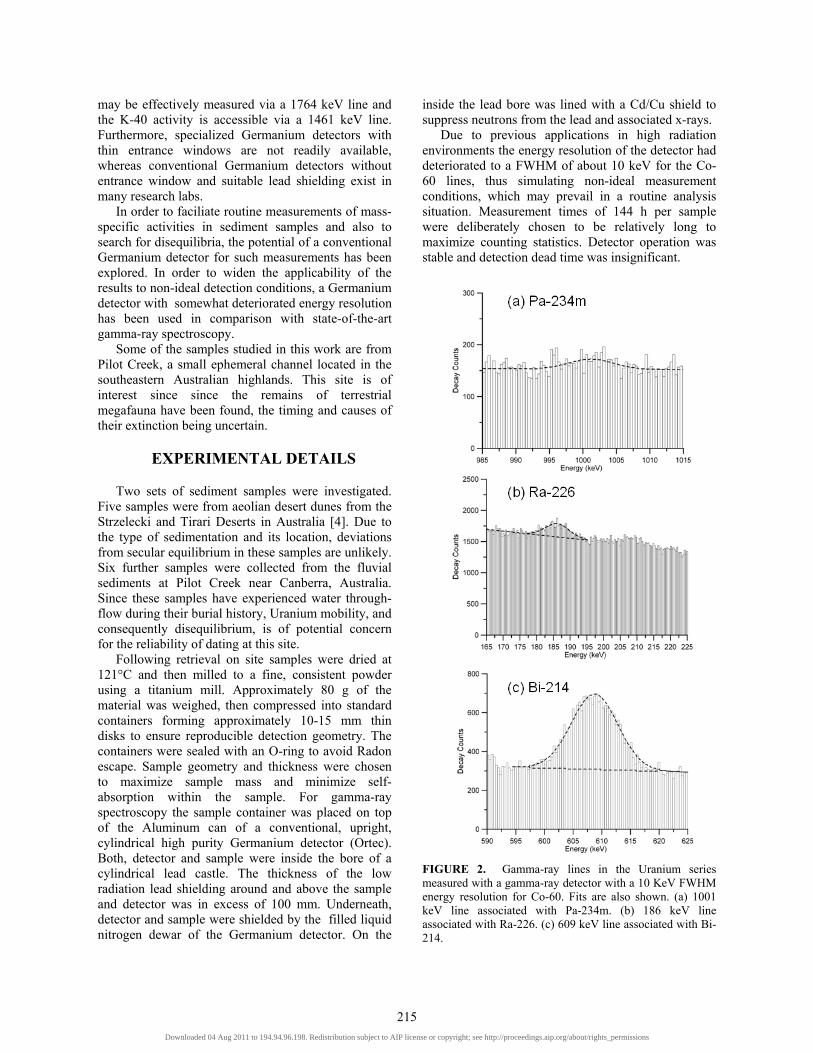
FIGURE 2. Gamma-ray lines in the Uranium series measured with a gamma-ray detector with a 10 KeV FWHM energy resolution for Co-60. Fits are also shown. (a) 1001 keV line associated with Pa-234m. (b) 186 keV line associated with Ra-226. (c) 609 keV line associated with Bi-214.
215Downloaded 04 Aug 2011 to 194.94.96.198. Redistribution subject to AIP license or copyright; see http://proceedings.aip.org/about/rights_permissions
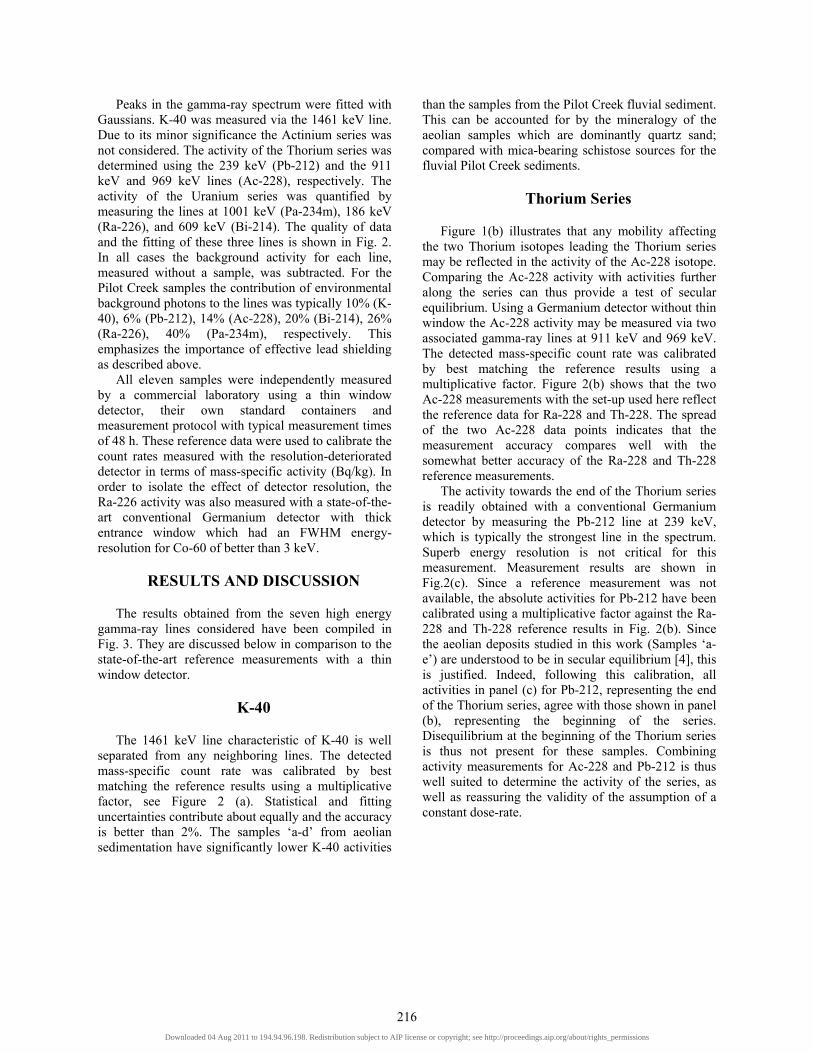
Peaks in the gamma-ray spectrum were fitted with Gaussians. K-40 was measured via the 1461 keV line. Due to its minor significance the Actinium series was not considered. The activity of the Thorium series was determined using the 239 keV (Pb-212) and the 911 keV and 969 keV lines (Ac-228), respectively. The activity of the Uranium series was quantified by measuring the lines at 1001 keV (Pa-234m), 186 keV (Ra-226), and 609 keV (Bi-214). The quality of data and the fitting of these three lines is shown in Fig. 2. In all cases the background activity for each line, measured without a sample, was subtracted. For the Pilot Creek samples the contribution of environmental background photons to the lines was typically 10% (K-40), 6% (Pb-212), 14% (Ac-228), 20% (Bi-214), 26% (Ra-226), 40% (Pa-234m), respectively. This emphasizes the importance of effective lead shielding as described above.
All eleven samples were independently measured by a commercial laboratory using a thin window detector, their own standard containers and measurement protocol with typical measurement times of 48 h. These reference data were used to calibrate the count rates measured with the resolution-deteriorated detector in terms of mass-specific activity (Bq/kg). In order to isolate the effect of detector resolution, the Ra-226 activity was also measured with a state-of-the-art conventional Germanium detector with thick entrance window which had an FWHM energy-resolution for Co-60 of better than 3 keV.
RESULTS AND DISCUSSION
The results obtained from the seven high energy gamma-ray lines considered have been compiled in Fig. 3. They are discussed below in comparison to the state-of-the-art reference measurements with a thin window detector.
K-40
The 1461 keV line characteristic of K-40 is well separated from any neighboring lines. The detected mass-specific count rate was calibrated by best matching the reference results using a multiplicative factor, see Figure 2 (a). Statistical and fitting uncertainties contribute about equally and the accuracy is better than 2%. The samples ‘a-d’ from aeolian sedimentation have significantly lower K-40 activities
than the samples from the Pilot Creek fluvial sediment. This can be accounted for by the mineralogy of the aeolian samples which are dominantly quartz sand; compared with mica-bearing schistose sources for the fluvial Pilot Creek sediments.
Thorium Series
Figure 1(b) illustrates that any mobility affecting the two Thorium isotopes leading the Thorium series may be reflected in the activity of the Ac-228 isotope. Comparing the Ac-228 activity with activities further along the series can thus provide a test of secular equilibrium. Using a Germanium detector without thin window the Ac-228 activity may be measured via two associated gamma-ray lines at 911 keV and 969 keV. The detected mass-specific count rate was calibrated by best matching the reference results using a multiplicative factor. Figure 2(b) shows that the two Ac-228 measurements with the set-up used here reflect the reference data for Ra-228 and Th-228. The spread of the two Ac-228 data points indicates that the measurement accuracy compares well with the somewhat better accuracy of the Ra-228 and Th-228 reference measurements.
The activity towards the end of the Thorium series is readily obtained with a conventional Germanium detector by measuring the Pb-212 line at 239 keV, which is typically the strongest line in the spectrum. Superb energy resolution is not critical for this measurement. Measurement results are shown in Fig.2(c). Since a reference measurement was not available, the absolute activities for Pb-212 have been calibrated using a multiplicative factor against the Ra-228 and Th-228 reference results in Fig. 2(b). Since the aeolian deposits studied in this work (Samples ‘a-e’) are understood to be in secular equilibrium [4], this is justified. Indeed, following this calibration, all activities in panel (c) for Pb-212, representing the end of the Thorium series, agree with those shown in panel (b), representing the beginning of the series. Disequilibrium at the beginning of the Thorium series is thus not present for these samples. Combining activity measurements for Ac-228 and Pb-212 is thus well suited to determine the activity of the series, as well as reassuring the validity of the assumption of a constant dose-rate.
216Downloaded 04 Aug 2011 to 194.94.96.198. Redistribution subject to AIP license or copyright; see http://proceedings.aip.org/about/rights_permissions
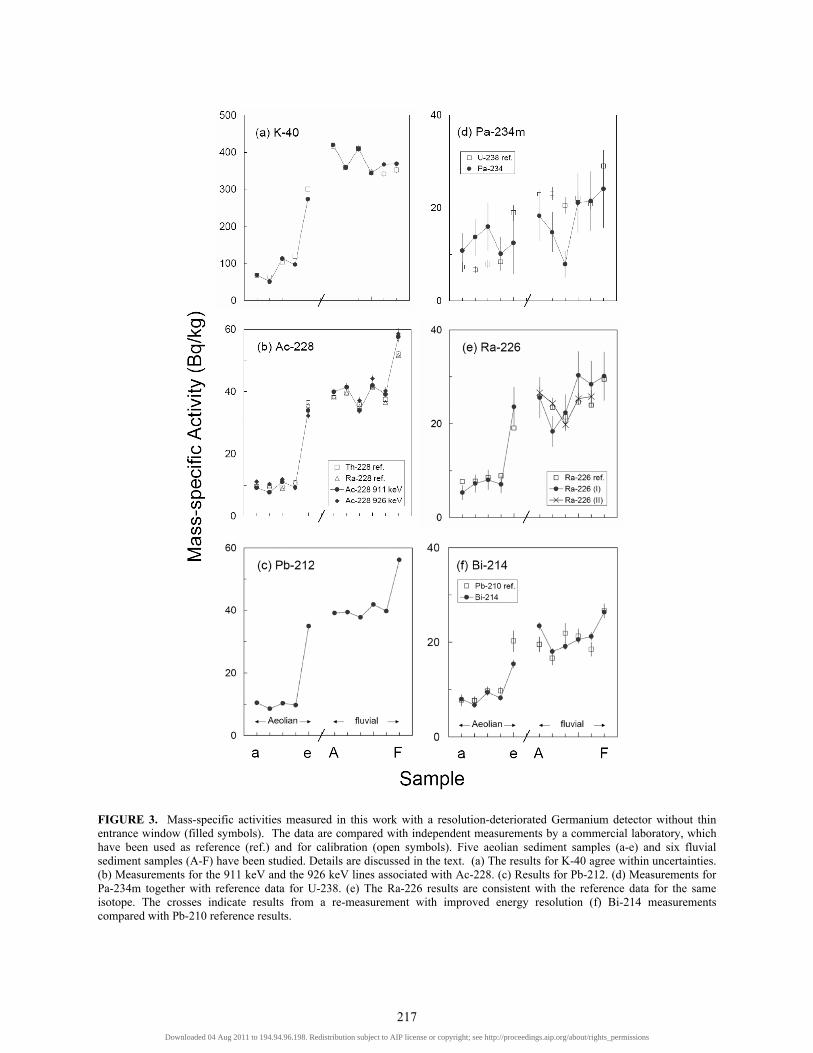
FIGURE 3. Mass-specific activities measured in this work with a resolution-deteriorated Germanium detector without thin entrance window (filled symbols). The data are compared with independent measurements by a commercial laboratory, which have been used as reference (ref.) and for calibration (open symbols). Five aeolian sediment samples (a-e) and six fluvial sediment samples (A-F) have been studied. Details are discussed in the text. (a) The results for K-40 agree within uncertainties. (b) Measurements for the 911 keV and the 926 keV lines associated with Ac-228. (c) Results for Pb-212. (d) Measurements for Pa-234m together with reference data for U-238. (e) The Ra-226 results are consistent with the reference data for the same isotope. The crosses indicate results from a re-measurement with improved energy resolution (f) Bi-214 measurements compared with Pb-210 reference results.
217Downloaded 04 Aug 2011 to 194.94.96.198. Redistribution subject to AIP license or copyright; see http://proceedings.aip.org/about/rights_permissions
Uranium Series
Without using the conventional lines below 150 keV, the activity of the members of the Uranium series above Ra-226 may only be measured effectively via two gamma-ray lines which are associated with Pa-234m. Both, the 760 keV and 1001 keV lines have, however, very weak intensities [1]. The stronger one of the two lines at 1001 keV is typically 100 times weaker than the 1460 keV line associated with K-40. Figure 2 (a) shows that due to the long counting time of 144 h the 1001 keV line could be detected with typically 400 total counts above Compton background. The associated statistical uncertainty of about 5% is, however, outweighed by fitting uncertainties in excess of 20%. The experimental accuracy of the Pa-234m measurements shown in Fig. 3(d) is therefore only sufficient to hint at the pronounced difference in activity between samples ‘a-d’ and ‘A-F’. The measured mass-specific count-rate could only be matched to the reference results for U-238, the grandmother of Pa-234m, by using in addition to a multiplicative factor the additive constant of 7 Bq/kg, implying that the detection sensitivity is of that order.
The Ra-226 activity is known to be often in disequilibrium with the activities of its supporting isotopes U-238 and U-234 [2]. The line at 186 keV is sufficiently high in energy to be detected without thin entrance window. However, the peak shown in Fig. 2(b) is contaminated by a 185 keV line associated with the Actinium series. Without separating the contamination this measurement is thus only representative of the Ra-226 activity, if the activity ratio of the Actinium and Uranium series is relatively constant, which is often the case. The peak was integrated as shown in Fig. 2(b) and mass-specific count rates were calibrated using in addition to a multiplicative factor an additive constant of 4 Bq/kg indicating that this is a lower sensitivity limit. The data in Fig. 3(e) agree within the relatively large error bars dominated by the fitting uncertainty with the reference results for the same isotope. Using an improvised lead castle and a Germanium detector with better energy resolution some of the samples were measured again, which is shown in Fig. 2(e) as Ra-226 (II). The better energy resolution reduced the fitting uncertainty and improved the agreement with the reference data.
Finally, the 609 keV line representative of Bi-214 was measured, see Figure 2(c). In Fig. 3(f) the Bi-214 data were calibrated with a multiplicative factor and an additive constant of 3 Bq/kg using the Pb-210 reference result also shown. As indicated by the error bars, the Pb-210 measurement, via the 47 keV line, has limited accuracy, so that the 609 keV line provides a good alternative for the determination of the mass-
specific activity of the Uranium series. The results suggest that using the set-up explored the activity of the Uranium series can be determined with acceptable accuracy, however, equilibrium checks are only of limited assistance.
CONCLUSIONS
A constant dose rate is assumed for trapped-charge dating. Field measurements of that dose rate can be supported by laboratory gamma-ray spectroscopy with Germanium detectors. Furthermore, this allows for checks of the assumption of a constant dose rate, which may be affected by disequilibria in the natural decay series. This is particularly relevant for samples from water-lain sediments.
The use of higher energy gamma-ray lines for the determination of the mass-specific activities of the Thorium and Uranium series, as well as that of radioactive potassium, has been explored. A resolution-limited Germanium detector was used to simulate a less-than-ideal routine measurement situation. Furthermore the efficacy of such a set-up for providing routine tests of activity equilibration at the beginning of the Thorium and Uranium series has been evaluated.
With the gamma-ray lines selected and the detector used, the mass-specific activities of both decay series can be accurately determined in addition to that of K-40. The secular equilibrium condition may be tested for the Thorium series. Measurement accuracy for the Pa-234m and Ra-226 activities are, however, not sufficient to permit also reliable checks for the Uranium series, where disequilibrium is common in water-lain environments.
REFERENCES
1. H. L. Oczkowski, Physica Scripta, 64, pp. 518-528, 2001.
2. M. J. Aitken, Thermoluminescence Dating, Academic Press, London, 1985.
3. J. M. Olley, A. Murray, R. G. Roberts, Quarternary Science Reviews, 15, 1996, pp. 751-760.
4. K. E. Fitzsimmons et al., Quaternary Science Reviews 26, 2007, pp. 2598–2616.
218Downloaded 04 Aug 2011 to 194.94.96.198. Redistribution subject to AIP license or copyright; see http://proceedings.aip.org/about/rights_permissions
Copyright © 2022 FDOKUMEN