Exploration and modulation of brain network interactions with noninvasive brain stimulation in...
44
Exploration and Modulation of Brain Network Interactions with Noninvasive Brain Stimulation in Combination with Neuroimaging Mouhsin M. Shafi 1,2,3 , M. Brandon Westover 1,2,3 , Michael D. Fox 1,2,3 , and Alvaro Pascual- Leone 1,3,4,* 1 Berenson-Allen Center for Noninvasive Brain Stimulation, Division of Cognitive Neurology, Department of Neurology, Beth Israel Deaconess Medical Center, Boston, MA, USA 2 Department of Neurology, Massachusetts General Hospital, Boston, MA, USA 3 Department of Neurology, Harvard Medical School, Boston, MA, USA 4 Institut Universitari de Neurorehabilitació Guttmann, Universidad Autónoma de Barcelona, Badalona, Spain Abstract Much recent work in systems neuroscience has focused on how dynamic interactions between different cortical regions underlie complex brain functions such as motor coordination, language, and emotional regulation. Various studies using neuroimaging and neurophysiologic techniques have suggested that in many neuropsychiatric disorders, these dynamic brain networks are dysregulated. Here we review the utility of combined noninvasive brain stimulation and neuroimaging approaches towards greater understanding of dynamic brain networks in health and disease. Brain stimulation techniques, such as transcranial magnetic stimulation and transcranial direct current stimulation, use electromagnetic principles to noninvasively alter brain activity, and induce focal but also network effects beyond the stimulation site. When combined with brain imaging techniques such as functional MRI, PET and EEG, these brain stimulation techniques enable a causal assessment of the interaction between different network components, and their respective functional roles. The same techniques can also be applied to explore hypotheses regarding the changes in functional connectivity that occur during task performance and in various disease states such as stroke, depression and schizophrenia. Finally, in diseases characterized by pathologic alterations in either the excitability within a single region or in the activity of distributed networks, such techniques provide a potential mechanism to alter cortical network function and architectures in a beneficial manner. Keywords Humans; transcranial magnetic stimulation; transcranial direct current stimulation; EEG; fMRI; functional connectivity * Correspondence: Alvaro Pascual-Leone, M.D., Ph.D., Berenson-Allen Center for Noninvasive Brain Stimulation, Beth Israel Deaconess Medical Center, 330 Brookline Ave, Boston, MA 02215, USA, T: +1.617.667-0203; Fax: +1.617.975-5322, [email protected]. Conflict of interest APL serves on the scientific advisory boards for Nexstim, Neuronix, Starlab Neuroscience, Allied Mind, Neosync, and Novavision, and is an inventor on patents and patent applications related to noninvasive brain stimulation and the real-time integration of transcranial magnetic stimulation with electroencephalography and magnetic resonance imaging. MMS, MBW, and MDF declare no conflicts. NIH Public Access Author Manuscript Eur J Neurosci. Author manuscript; available in PMC 2013 March 1. Published in final edited form as: Eur J Neurosci. 2012 March ; 35(6): 805–825. doi:10.1111/j.1460-9568.2012.08035.x. NIH-PA Author Manuscript NIH-PA Author Manuscript NIH-PA Author Manuscript
-
Upload
hms-harvard -
Category
Documents
-
view
1 -
download
0
Transcript of Exploration and modulation of brain network interactions with noninvasive brain stimulation in...

Exploration and Modulation of Brain Network Interactions withNoninvasive Brain Stimulation in Combination withNeuroimaging
Mouhsin M. Shafi1,2,3, M. Brandon Westover1,2,3, Michael D. Fox1,2,3, and Alvaro Pascual-Leone1,3,4,*
1Berenson-Allen Center for Noninvasive Brain Stimulation, Division of Cognitive Neurology,Department of Neurology, Beth Israel Deaconess Medical Center, Boston, MA, USA2Department of Neurology, Massachusetts General Hospital, Boston, MA, USA3Department of Neurology, Harvard Medical School, Boston, MA, USA4Institut Universitari de Neurorehabilitació Guttmann, Universidad Autónoma de Barcelona,Badalona, Spain
AbstractMuch recent work in systems neuroscience has focused on how dynamic interactions betweendifferent cortical regions underlie complex brain functions such as motor coordination, language,and emotional regulation. Various studies using neuroimaging and neurophysiologic techniqueshave suggested that in many neuropsychiatric disorders, these dynamic brain networks aredysregulated. Here we review the utility of combined noninvasive brain stimulation andneuroimaging approaches towards greater understanding of dynamic brain networks in health anddisease. Brain stimulation techniques, such as transcranial magnetic stimulation and transcranialdirect current stimulation, use electromagnetic principles to noninvasively alter brain activity, andinduce focal but also network effects beyond the stimulation site. When combined with brainimaging techniques such as functional MRI, PET and EEG, these brain stimulation techniquesenable a causal assessment of the interaction between different network components, and theirrespective functional roles. The same techniques can also be applied to explore hypothesesregarding the changes in functional connectivity that occur during task performance and in variousdisease states such as stroke, depression and schizophrenia. Finally, in diseases characterized bypathologic alterations in either the excitability within a single region or in the activity ofdistributed networks, such techniques provide a potential mechanism to alter cortical networkfunction and architectures in a beneficial manner.
KeywordsHumans; transcranial magnetic stimulation; transcranial direct current stimulation; EEG; fMRI;functional connectivity
*Correspondence: Alvaro Pascual-Leone, M.D., Ph.D., Berenson-Allen Center for Noninvasive Brain Stimulation, Beth IsraelDeaconess Medical Center, 330 Brookline Ave, Boston, MA 02215, USA, T: +1.617.667-0203; Fax: +1.617.975-5322,[email protected] of interestAPL serves on the scientific advisory boards for Nexstim, Neuronix, Starlab Neuroscience, Allied Mind, Neosync, and Novavision,and is an inventor on patents and patent applications related to noninvasive brain stimulation and the real-time integration oftranscranial magnetic stimulation with electroencephalography and magnetic resonance imaging. MMS, MBW, and MDF declare noconflicts.
NIH Public AccessAuthor ManuscriptEur J Neurosci. Author manuscript; available in PMC 2013 March 1.
Published in final edited form as:Eur J Neurosci. 2012 March ; 35(6): 805–825. doi:10.1111/j.1460-9568.2012.08035.x.
NIH
-PA Author Manuscript
NIH
-PA Author Manuscript
NIH
-PA Author Manuscript

INTRODUCTIONTraditionally, insights into brain function have been largely derived from studying thedeficits caused by specific brain lesions. The view emerging from this approach posits asimplified structure-function relationship, in which anatomically distinct brain regionsperform specialized, relatively independent computations (e.g. visual cortex is responsiblefor early visual processing). More recently, this approach has been extended by studies usingbrain imaging modalities such as electroencephalography (EEG), positron emissiontomography (PET), and functional MRI (fMRI) to study brain function both in the restingstate (Fox & Raichle, 2007) and during performance of various behavioral tasks. It hasbecome increasingly apparent that complex brain functions, such as coordinated movement,memory and language, depend critically on interactions between brain areas, leading to theconcept of functional connectivity networks— distributed brain regions interacting (oftentransiently) to perform a particular neural function. Studies have suggested thatabnormalities in the interactions of network components play a critical role in commonneuropsychiatric disorders ranging from depression to epilepsy (Mayberg et al., 2005;Lytton, 2008), and damage to specific functional connectivity networks can lead to distinctneurological syndromes (Seeley et al., 2009). Furthermore, the deficits and functionalrecovery after damage from strokes or traumatic brain injury may depend on the architectureand adaptability of these networks (He et al., 2007b; Ween, 2008; Kumar et al., 2009).Consequently, there is active research exploring functional connectivity in normal subjectsand in patients suffering from various neuropsychiatric disorders, with the hope that it maylead to valuable biomarkers of disease and new therapeutic approaches.
Most neuroscience techniques utilized in humans either passively measure brain activity indifferent ways, or require invasive procedures. However, a number of noninvasivetechniques for manipulating brain activity have been developed, permitting targetedinterventions on human brain function and behavior. The two most common noninvasivebrain stimulation techniques, transcranial magnetic stimulation (TMS) and transcranialdirect current stimulation (tDCS), both rely on electromagnetic principles to influence brainactivity. Combination of these brain stimulation techniques with traditional neuroimagingmethods enables more sophisticated studies of the mechanisms and dynamics of brainactivity, and their relationship with specific cognitive processes. Thus it becomes possible totest hypotheses regarding causal interactions between different brain regions in health anddisease. Furthermore, by producing potentially long-lasting changes in cortical function,brain stimulation techniques provide a new therapeutic modality whose utility is beingexplored in a variety of diseases.
In this review, begin with a brief review of functional connectivity and network theory. Wethen explore how neuroimaging and neurophysiology are being used to study functionalconnectivity networks, and provide insight into the distributed nature of common braindiseases. Next, we review basic principles of noninvasive brain stimulation techniques andthe evidence that these techniques have network effects beyond the stimulation site. Finally,we provide examples of how these tools can be combined to understand, and selectivelymanipulate functional connectivity networks. We focus on three clinical conditions (stroke,depression, and schizophrenia) to illustrate how abnormal network dynamics may underliecommon brain diseases, and how manipulation of these networks through noninvasive brainstimulation represents a promising therapeutic intervention.
FUNCTIONAL CONNECTIVITY AND NETWORK THEORYMost early studies using either neuroimaging or electrophysiology were concerned withidentifying individual brain regions or cells that were modulated by a particular stimulus or
Shafi et al. Page 2
Eur J Neurosci. Author manuscript; available in PMC 2013 March 1.
NIH
-PA Author Manuscript
NIH
-PA Author Manuscript
NIH
-PA Author Manuscript
task. From the electrophysiology work of Hubel and Wiesel (1962) to cognitive activationparadigms in human neuroimaging (Posner & Raichle, 1994) this approach has been verysuccessful. However, no brain region operates in isolation. Instead, brain regions areintegrated in complex, distributed neural networks, and studying the interactions betweenregions is proving to be just as important as understanding the response properties ofindividual regions. The interaction between brain regions has been termed “functionalconnectivity” and can refer to any examination of inter-regional correlations in neuronalvariability (Friston et al., 1993; Horwitz, 2003).
Mathematically, networks can be represented as graphs, i.e. a group of interacting entities(nodes), connected by lines (edges), indicating which pairs of nodes directly interact. Forour purposes these nodes can represent neurons, populations of neurons within specificanatomical brain regions, or the locations of sensors which measure neural activity (as inEEG). Certain important generic network properties turn out to depend solely on topologicalproperties, independent of the details of individual network function. We illustrate this ideaby discussing two simple intuitive properties, global and local efficiency of informationtransfer. For more complete discussions of network structure-function dependencies thereader is referred to several excellent recent reviews (Albert & Barabasi, 2000; Strogatz,2001; Bassett & Bullmore, 2006; Stam & Reijneveld, 2007; Reijneveld et al., 2007; Sporns,2010).
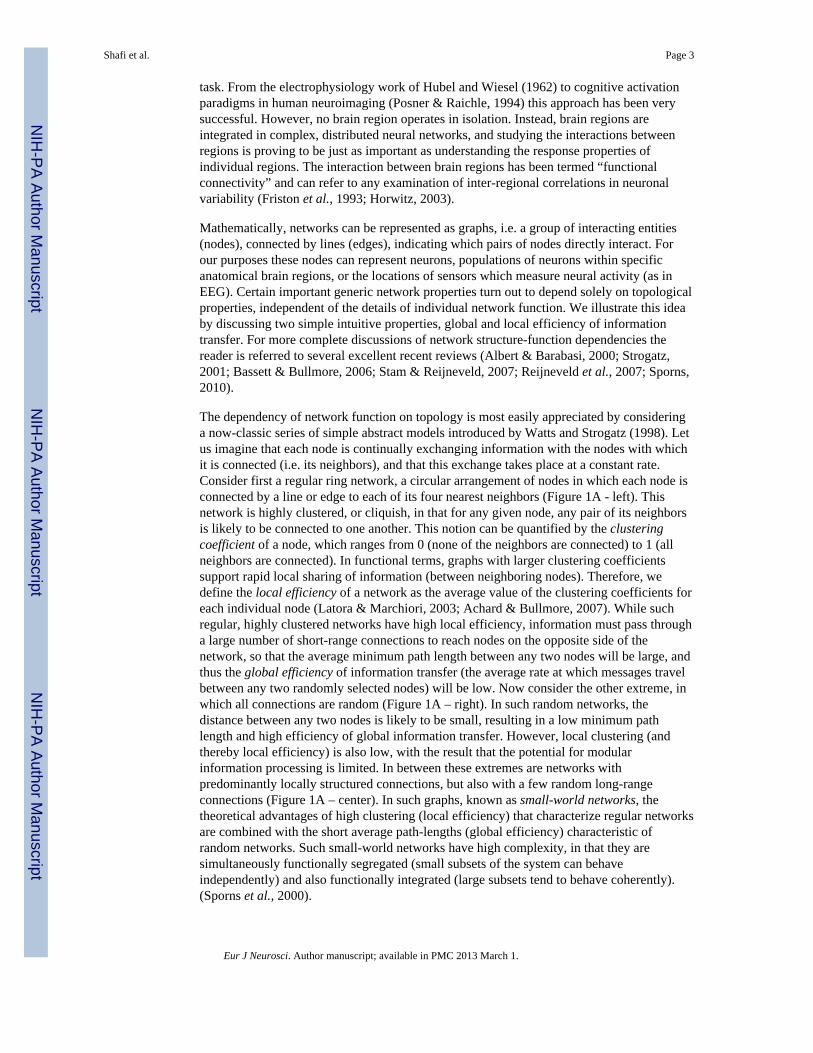
The dependency of network function on topology is most easily appreciated by consideringa now-classic series of simple abstract models introduced by Watts and Strogatz (1998). Letus imagine that each node is continually exchanging information with the nodes with whichit is connected (i.e. its neighbors), and that this exchange takes place at a constant rate.Consider first a regular ring network, a circular arrangement of nodes in which each node isconnected by a line or edge to each of its four nearest neighbors (Figure 1A - left). Thisnetwork is highly clustered, or cliquish, in that for any given node, any pair of its neighborsis likely to be connected to one another. This notion can be quantified by the clusteringcoefficient of a node, which ranges from 0 (none of the neighbors are connected) to 1 (allneighbors are connected). In functional terms, graphs with larger clustering coefficientssupport rapid local sharing of information (between neighboring nodes). Therefore, wedefine the local efficiency of a network as the average value of the clustering coefficients foreach individual node (Latora & Marchiori, 2003; Achard & Bullmore, 2007). While suchregular, highly clustered networks have high local efficiency, information must pass througha large number of short-range connections to reach nodes on the opposite side of thenetwork, so that the average minimum path length between any two nodes will be large, andthus the global efficiency of information transfer (the average rate at which messages travelbetween any two randomly selected nodes) will be low. Now consider the other extreme, inwhich all connections are random (Figure 1A – right). In such random networks, thedistance between any two nodes is likely to be small, resulting in a low minimum pathlength and high efficiency of global information transfer. However, local clustering (andthereby local efficiency) is also low, with the result that the potential for modularinformation processing is limited. In between these extremes are networks withpredominantly locally structured connections, but also with a few random long-rangeconnections (Figure 1A – center). In such graphs, known as small-world networks, thetheoretical advantages of high clustering (local efficiency) that characterize regular networksare combined with the short average path-lengths (global efficiency) characteristic ofrandom networks. Such small-world networks have high complexity, in that they aresimultaneously functionally segregated (small subsets of the system can behaveindependently) and also functionally integrated (large subsets tend to behave coherently).(Sporns et al., 2000).
Shafi et al. Page 3
Eur J Neurosci. Author manuscript; available in PMC 2013 March 1.
NIH
-PA Author Manuscript
NIH
-PA Author Manuscript
NIH
-PA Author Manuscript

Over the past decade, converging theoretical and experimental results have indicated thatbrain functional networks typically have small-world topology, with short average pathlength (high global efficiency) and high clustering (high local efficiency). Brain functionalnetworks tend to be robust to random lesions, but highly vulnerable to targeted lesions, dueto the existence of hubs, i.e. highly connected nodes which account for a large fraction of thegraph’s overall connectivity (Achard et al., 2006; He et al., 2007c, 2007a; Xia et al., 2010).Brain functional networks are sparse, that is, only a relatively small fraction of the totalnumber of pairs is directly connected. Finally, brain functional networks often operate in acritical dynamical state, supporting rapid reconfiguration of graph topology, a featurethought to be related to the need to rapidly switch cognitive states.
Theoretically, different neuropsychiatric disorders could result from a variety of differentnetwork pathologies. Consider a simplified network comprised of clusters of nodes withdense local connectivity and a few long-range connections (Figure 2A), consistent with thesmall-world topographies identified in human brains. One set of brain pathologies couldresult from direct elimination of node(s), with resulting network dysfunction (Figure 2B).Ischemic stroke represents a classical example of a neuropsychiatric disease with such amechanism. Alternatively, the functional network could be disrupted by elimination ofconnections between different nodes (Figure 2C), as may occur in diseases in which theprimary pathology is in the white matter connections between brain regions, such asmultiple sclerosis. A third possibility is that the strength of the connections between nodes isaltered in a manner that results in relative hypo- or hyperactivity within a specificsubnetwork (Figure 2D). Epilepsy may be a paradigmatic example of a disease resultingfrom such a process (Bettus et al., 2008), while recent work suggests that such alterations inthe strength of connectivity between different brain regions are also critical in depressionand schizophrenia. A shift in the topology of network connectivity (for example, a decreasein long-distance connections with increases in local connectivity; Figure 2E) could affect theefficiency of information processing in the brain. Studies have suggested that such networktopology changes might be occurring in autism (Barttfeld et al., 2011). Finally, anotherpossibility is that network connectivity is unchanged, but the operations carried out bydifferent subnetworks are somehow altered. It is worth emphasizing that studies focusedonly on anatomic pathologies (ie. structural MRI) may not detect any abnormalities indiseases with preserved structural connectivity but altered functional connectivity (such as infigure 2D), emphasizing the critical need for further studies investigating brain connectivitynetworks.
STUDYING BRAIN NETWORKS IN HUMANSA key technical question in studying brain networks is the way in which connectivity isdefined and measured. Structural connectivity, the stable direct physical pathways linkingspatially distinct brain regions, is distinguished from the dynamical or state-dependentfunctional connectivity and effective connectivity. Effective connectivity describes thedirectional flow of information, or more generally, the causal relationships between nodes ina graph, e.g. relationships such as “changes in the activity of A lead to changes in theactivity of B”. However, the techniques for determining effective connectivity are complex,and the tools available to analyze the resulting networks are limited. It is often significantlymore straightforward, and much more common, to simply compute measures of statisticaldependence (correlation) between nodes, which is dubbed functional connectivity.
In humans, functional connectivity has been studied across a broad range of spatial andtemporal scales. Using neuroimaging, functional connectivity has been studied using PET,near-infrared spectroscopy, and fMRI. With these methods, variability has been correlatedacross subjects, runs, blocks, trials, or individual blood-oxygen-level dependence (BOLD)
Shafi et al. Page 4
Eur J Neurosci. Author manuscript; available in PMC 2013 March 1.
NIH
-PA Author Manuscript
NIH
-PA Author Manuscript
NIH
-PA Author Manuscript
time points and has been studied both during resting and task conditions, an ambiguitywhich can become confusing (Horwitz, 2003; Rogers et al., 2007). It is yet unclear iffunctional connectivity assessed in these various ways reflects similar phenomena (Fox &Raichle, 2007), but it is clear that these inter-regional interactions play a critical role inbehavior and disease.
Currently, the most popular neuroimaging approach for studying functional connectivity isusing fMRI to examine inter-regional correlations across individual BOLD time-points(functional connectivity MRI, or fcMRI). Often, these correlations are examined duringspecific tasks and have been related to individual subject’s task performance (Ranganath etal., 2005; Hampson et al., 2006b), genetics (Pezawas et al., 2005), and even personality(Pezawas et al., 2005). However, a recent advance with important clinical applications hasbeen the discovery of robust inter-regional correlations in spontaneous BOLD fluctuationspresent even in the absence of an assigned task, referred to as resting state functionalconnectivity (for review see (Fox & Raichle, 2007)). These spontaneous fluctuations areconsistently correlated between regions with similar functional properties and knownanatomical connections including somatomotor, visual, auditory, language, default mode,and corticothalamic networks (Fox & Raichle, 2007). For example, one can extract thespontaneous BOLD modulations from a region such as the left somatomotor cortex andcompute the correlation between this extracted signal and all other brain regions to obtain amap of the human somatomotor system (Biswal et al., 1995) (Figure 3). Anticorrelationsbetween regions with apparent opposing functional properties have also been observed (Foxet al., 2005; Fransson, 2005). These spontaneous fluctuations predict the task-responseproperties of brain regions (De Luca et al., 2005; Vincent et al., 2006), identify subjects’aptitude for different cognitive tasks (Hampson et al., 2006a; Seeley et al., 2007), facilitaterefinement of neuro-anatomical models (Fox et al., 2006; Dosenbach et al., 2007), andaccount for trial-to-trial variability in behavior (Fox et al., 2007). Significant resting statefcMRI abnormalities have been identified across almost every major neurological andpsychiatric disease (for reviews see (Greicius, 2008; Fox & Greicius, 2010; Zhang &Raichle, 2010)). As these resting state fcMRI abnormalities continue to be replicated,refined, and clarified, the next step will be translating this information into practical clinicalinterventions.
Neurophysiologic techniques have also been used to probe functional connectivity in thehuman brain. Compared with fMRI, EEG and magnetoencephalography (MEG) have poorerspatial resolution (millimeters for fMRI vs centimeters for EEG/MEG), but superiortemporal resolution (milliseconds for EEG/MEG vs seconds for fMRI). Consequently, EEGand MEG permit study of temporal dynamics across a much broader bandwidth (on theorder of order of 1–100Hz for EEG vs 0.001–0.5Hz for fMRI). Functional networks derivedfrom fMRI data may thus in principle be more easily and directly related to preciseanatomical structures, while EEG / MEG signals more directly reflect neuronal activity.
Intriguingly, recent studies have shown that EEG/MEG network topologies change over thecourse of a lifetime (Micheloyannis et al., 2009), and that individual differences in graphtheoretic network properties may be related to intelligence (IQ) and cognitive performance(Micheloyannis et al., 2006b; Bassett et al., 2009). A number of recent papers havesuggested that alterations in EEG network properties may be seen in variousneuropsychiatric diseases. In Alzheimer’s disease, EEG functional connectivity (fcEEG)analysis has shown promise as a diagnostic aid in early stages of the disease (Dauwels et al.,2010). In another fcEEG study, the severity of cognitive dysfunction in Alzheimer’s diseasewas found to be a monotonically decreasing function of path length, while the averageclustering coefficients were similar to control subjects, suggesting that Alzheimer’sdementia may be related to loss of “small-worldliness” (Stam et al., 2007). To a lesser
Shafi et al. Page 5
Eur J Neurosci. Author manuscript; available in PMC 2013 March 1.
NIH
-PA Author Manuscript
NIH
-PA Author Manuscript
NIH
-PA Author Manuscript

degree, loss of small-worldliness and lower levels of synchronization within high frequencyEEG rhythms (beta and gamma) has also been reported in normal aging (Micheloyannis etal., 2009). As another example, in patients presenting after a first seizure, mean functionalconnectivity within the theta band has been reported to be a predictor of subsequentepilepsy, and thus may prove useful in identifying patients at risk for epilepsy who lackother markers such as epileptic spikes (Douw et al., 2010). Enhanced fcEEG across a broadrange of frequencies has also been suggested as a characteristic feature within the seizureonset zone in patients with mesial temporal lobe epilepsy (Bettus et al., 2008).
Thus, both neurophysiological techniques, such as EEG, and neuroimaging techniques, suchas fMRI, have been used to assess the functional connectivity of the human brain duringboth the resting state and during task activity, and to explore the structure of brain activity.Furthermore, alterations in functional connectivity have been associated with severalneuropsychiatric diseases. Consequently, there is a pressing need for tools that enable moreprecise study and manipulation of human cortical networks in vivo. Noninvasive brainstimulation techniques hold significant promise in this regard. Manipulation of diffuseneurotransmitter systems through pharmacological therapy may prove useful in normalizingaltered network dynamics (Anand et al., 2005a). However, brain network dynamics inhealth and disease may be more directly addressed through spatially and temporally morespecific and more precisely quantifiable interventions such as TMS or tDCS.
BRAIN STIMULATION TECHNIQUESTranscranial Magnetic Stimulation (TMS)
TMS is based on the principle of electromagnetic induction; briefly, a changing electriccurrent in the stimulation coil produces a magnetic flux, which in turn induces electriccurrents in brain tissue. The basic TMS stimulator design involves a capacitive high-voltage,high-current charge-discharge system connected via a switch (usually a thyristor or asilicon-controlled rectifier to prevent ringing in the circuit) to the inductor of the stimulationcoil (see Wagner et al, (2007) for further review). The effect of a TMS pulse on corticalactivity is dependent on a number of different factors, including the strength of the magneticflux, the shape of the stimulation coil, the shape and duration of the pulse, the distance andangle between the coil and the cortical surface, the direction of the induced electricalcurrents, the precise stimulation sequence, and the underlying cortical architecture andactivity. One commonly used coil design is the “figure-8” or “butterfly”, in which two roundcoils are placed side by side such that the currents flow in the same direction at the junctionpoint. As a result, the induced electric fields add up to a maximum in the region below thejunction of the two coils, thereby limiting the area in which the induced currents aresufficient to significantly alter neuronal activity. The precise extent of the cortical surfacethat is intensely stimulated has been debated, but models and some experimental data onevoked responses suggest that it is on the order of approximately 1 cm2 (Cowey & Walsh,2000; Wagner et al., 2004).
Unfortunately, relatively little is known about the precise mechanisms of TMS activation ofneural tissue in vivo. One study utilizing extracellular recordings in the visual cortex ofanesthetized cats assessed the effects of single-pulse TMS on neuronal activity (Moliadze etal., 2003) and demonstrated that a single TMS pulse was associated with a strong facilitationof spontaneous and visual-evoked spiking activity during the first 500ms after the TMSpulse. This was followed by a subsequent long-lasting (several second) suppression ofactivity, the duration of which increased with increasing stimulus strength. In another studyutilizing different TMS pulse trains (1 to 4 seconds, 1 to 8 Hz), TMS increased thespontaneous activity for up to sixty seconds; in contrast, visual evoked responses weresignificantly decreased for approximately five minutes (Allen et al., 2007). A number of
Shafi et al. Page 6
Eur J Neurosci. Author manuscript; available in PMC 2013 March 1.
NIH
-PA Author Manuscript
NIH
-PA Author Manuscript
NIH
-PA Author Manuscript
recent studies have evaluated the effect of TMS on motor cortex during epidural recordingsfrom human patients with electrodes implanted in the spinal cord for treatment of chronicpain (see Di Lazzaro (2008) for review). These studies have demonstrated that the variousTMS protocols all produce effects that are believed to be mediated primarily via trans-synaptic intracortical pathways, rather than by direct axonal activation. However, therecontinues to be significant uncertainty regarding the precise cellular mechanisms by whichTMS exerts its effects. Furthermore, several studies have suggested that the effects of singlepulses of TMS are significantly affected by the underlying pre-existing cortical state(Silvanto et al., 2008; Romei et al., 2008; Silvanto & Pascual-Leone, 2008; Sauseng et al.,2009; Thut et al., 2011). Consequently, the relationship between the local effects of TMSand the network changes that result remain almost entirely unknown. Despite thisuncertainty, TMS continues to be used to probe and to alter cortical excitability in a varietyof different experimental paradigms.
TMS of motor cortex produces muscle responses, termed motor-evoked potentials (MEPs),which provide a particularly useful metric for measuring cortical responses to TMS. TheMEP size varies with the intensity of stimulus, with stronger TMS stimuli producing largerMEPs (van der Kamp et al., 1996). TMS-evoked MEPs are also facilitated if the subjectvoluntarily contracts the target muscle slightly (Hess et al., 1986, 1987; Andersen et al.,1999). Another stimulation paradigm, paired-pulse TMS, involves the application of aconditioning stimulus pulse prior to the test stimulus delivered, for example, over motorcortex. If the conditioning stimulus alters the MEP, then a functional interaction between thetarget of the conditioning stimulus and the location of the test stimulus is inferred.
Another important stimulation method is repetitive TMS (rTMS), which involves thedelivery of trains of TMS pulses, often at high frequencies, to produce changes in corticalexcitability that persist beyond the duration of the stimulus. The mechanisms through whichthese protocols alter excitability are unknown, but are believed to involve processes similarto synaptic long-term potentiation and long-term depression (Fitzgerald et al., 2003). In oneof the earliest studies of the effects of rTMS, Pascual-Leone et al demonstrated that high-frequency (>5 Hz) rTMS trains generally increased cortical excitability, as measured viaMEP size (Pascual-Leone et al., 1994). Significantly, these effects persisted for 3–4 minutesafter the end of stimulation. In contrast, rTMS at frequencies of 1 Hz or below generallydecreases cortical excitability (Chen et al., 1997). A recent review of studies of the effects ofrTMS on cortical excitability (as measured with simultaneous EEG) notes that both low-frequency and high-frequency rTMS produce an approximately 30% change in TMS-evokedresponse (depression with low-frequency rTMS, and facilitation with high-frequencyrTMS), with the excitability changes persisting for a mean of about 30 minutes (Thut &Pascual-Leone, 2010). Significantly however, one study demonstrated that if an identicalrTMS protocol was repeated on consecutive days, the evoked change in cortical excitabilitywas larger on day 2, implying a carryover effect (Maeda et al., 2000). More recently, Huanget al. developed a patterned repetitive stimulation protocol to rapidly induce changes incortical plasticity (Huang et al., 2005). The “theta-burst” rTMS stimulation paradigmconsists of 3 pulses at 50 Hz and intensity of 80% active motor threshold, repeated every200 ms (ie. at 5 Hz). In the continuous protocol, a 40-second train of uninterrupted theta-burst stimulation was applied for a total of 600 pulses, resulting in a decrease in MEPamplitude of over 40%, with suppression persisting for as long as 60 minutes. In theintermittent theta burst protocol, a two-second train of theta burst stimulation was repeatedevery 10 seconds, also for a total of 600 pulses; the MEP amplitude was increased by up to75%, with the facilitation lasting for about 15 to 20 minutes. In the studies of rTMS withEEG, theta-burst effects on evoked responses persisted for up to 90 minutes, longer than forconventional (fixed-rate) rTMS protocols (Thut & Pascual-Leone, 2010).
Shafi et al. Page 7
Eur J Neurosci. Author manuscript; available in PMC 2013 March 1.
NIH
-PA Author Manuscript
NIH
-PA Author Manuscript
NIH
-PA Author Manuscript
Transcranial Direct Current Stimulation (tDCS)In tDCS, static weak polarizing electrical currents applied to the scalp penetrate corticalregions of the brain. These currents are believed to preferentially modulate the activity ofneurons with axons that are oriented longitudinally in the plane of the applied electric field,producing changes in the activity of individual cortical neurons (Creutzfeldt et al., 1962;Bindman et al., 1962; Purpura & McMurtry, 1965). The induced changes in excitabilityoccur primarily via modulation of voltage-sensitive cation channels (Lopez et al., 1991).Unlike TMS, tDCS does not directly induce cell firing, but rather modulates neuronalactivity. Anodal stimulation of the cortex generally increases the excitability of underlyingneurons by depolarizing cell membranes, while cathodal stimulation decreases corticalexcitability via hyperpolarization (although this is not always the case (Creutzfeldt et al.,1962)). More recent studies have combined tDCS with single-pulse TMS to assess theexcitability changes produced by tDCS (Nitsche & Paulus, 2000, 2001; Nitsche et al., 2003,2005). These studies demonstrated that anodal tDCS significantly increases the size of theTMS evoked MEP, while cathodal tDCS decreases MEP size. Furthermore, theseexcitability changes persisted after the end of the tDCS stimulation, with the duration andmagnitude of the effects varying as a function of the current intensity and duration of tDCS(Nitsche & Paulus, 2000). A subsequent study demonstrated that if tDCS is applied at 1milli-ampere for at least 9 minutes, the induced excitability changes after cessation ofstimulation were long-lasting (90 minutes when anodal tDCS was applied for 13 minutes)(Nitsche & Paulus, 2001). These long-lasting changes are believed to occur at anintracortical level, perhaps mediated through NMDA receptor activity (Liebetanz et al.,2002; Nitsche et al., 2003, 2004b, 2004a, 2005).
TRANSCRANIAL BRAIN STIMULATION AND NETWORK ANALYSISAs summarized above (see section, “Studying Brain Networks in Humans”), much recentwork has suggested that cognitive functions are carried out by a dynamic network ofinteracting brain regions. The integration of brain stimulation techniques and neuroimagingenables further identification and evaluation of these dynamic network interactions. TMSchanges neural activity directly in a spatially and temporally focused manner. By studyinghow the changes induced by TMS are then propagated throughout the rest of the brain, theconnectivity of the stimulated brain region can be causally assessed, and the resultscompared with the findings of traditional functional connectivity analysis (Pascual-Leone etal., 2000; Paus, 2005; Lee et al., 2006; O’Shea et al., 2008; Bestmann et al., 2008; Miniussi& Thut, 2010). Furthermore, since different rTMS and tDCS protocols produce somewhatlong-lasting changes in neural activity in a relatively predictable manner, noninvasive brainstimulation techniques permit the directed manipulation of neural activity. The potentialimplications for our understanding and treatment of network dysfunction in neuropsychiatricdiseases are significant.
TMS enables the assessment of dynamical changes in the interactions between corticalregions. One of the earliest uses of TMS involved producing a “virtual lesion” to assess thetemporal relationship of involvement of different cortical regions in specific cognitivefunctions (Walsh & Pascual-Leone, 2005). For example, Amassian et al demonstrated thatTMS to the occipital pole was effective in abolishing visual perception of a letter if the pulsewas administered between 80 and 100ms after stimulus onset; pulses administeredsignificantly before or after this interval had no such effect (Amassian et al., 1989). Suchstudies can reveal surprising results. For example, Chambers et al (2004) demonstrated thatthe right angular gyrus is involved in the reorienting of spatial attention at two distinctlydifferent time points (between 90 and 120 ms after stimulus onset, and again between 210and 240 ms after stimulus onset), suggesting that the same cortical region can be involved atdifferent time points during a single task (Chambers et al., 2004). Furthermore, experiments
Shafi et al. Page 8
Eur J Neurosci. Author manuscript; available in PMC 2013 March 1.
NIH
-PA Author Manuscript
NIH
-PA Author Manuscript
NIH
-PA Author Manuscript
with TMS can delineate the time-course of interactions between different cortical regions.As an example, Silvanto et al (2006) studied the effects of single-pulse stimulation to thefrontal eye fields (FEF) on the excitability of area V5/MT (as measured by phosphenethreshold, the minimum TMS intensity required to produce a phosphene). Theydemonstrated that FEF stimulation 20 to 40 milliseconds before stimulation of area V5/MTlowered the phosphene threshold significantly. Stimulation of the FEF at other time pointshad no such effects.
The paired-pulse technique has also been used to explore network connectivity andinterregional interactions, particularly in the motor system (see Rothwell, 2010 for a recentreview). For example, studies have shown that a conditioning stimulus applied to one motorcortex inhibits the response to a subsequent test stimulus delivered to the contralateral motorcortex (Ferbert et al., 1992; Chen et al., 2003). Similarly, TMS of motor cortex suppressesvoluntary contraction of the ipsilateral hand for a short period of time (Ferbert et al., 1992;Meyer et al., 1995; Chen et al., 2003). In patients with agenesis of the corpus callosum, nosuch inhibition was seen (Meyer et al., 1995). Similarly, other studies have demonstratedthat a conditioning TMS pulse applied to the right dorsal premotor cortex affected the MEPproduced by stimulation of the contralateral primary motor cortex (Mochizuki et al., 2004),helping to confirm that the premotor cortex and motor cortex are functionally connected. Inanother paired-pulse study exploring cortical processing, Pascual-Leone and Walsh (2001)utilized paired-pulse protocols to demonstrate that backprojections from area V5 to V1 areimportant in the perception and awareness of visual motion.
Paired-pulse protocols can also be used to assess dynamic changes in functional connectivitybetween brain regions. For example, in an elegant experiment Davere et al (2008) showedthat a conditioning stimulus applied to the ventral premotor cortex in the resting stateinhibited the subsequent MEP produced by a test stimulus to the primary motor cortex. Incontrast, if the conditioning stimulus was applied during a precision grasping task, thesubsequent TMS-evoked MEP was facilitated, suggesting that the influence of ventralpremotor cortex on motor cortex varied as a function of the task state. Thus, paired-pulseTMS can be used to not only elucidate the task-related dynamics of interhemisphericfunctional connectivity, but also to explore how that connectivity is altered by disease.
The combination of TMS with other neuroimaging technologies such as PET, EEG andfMRI is particularly promising for our understanding of brain network interactions.Specifically, these imaging techniques provide a richer and more sensitive toolbox forassessing the results of brain stimulation, particularly in non-eloquent areas. Furthermore,because neuroimaging data is amenable to functional connectivity and network analysistechniques, the combination of brain stimulation and neuroimaging permits the study of theeffects of brain stimulation techniques on widespread networks composed of a number ofdifferent cortical regions. In addition, the time course of activity changes in these differentregions can be used to assess the causal relationship between them.
One seminal early study performed PET scanning while rTMS trains of varying lengthswere applied to the frontal eye fields (Paus et al., 1997) to demonstrate a significant positiverelationship between blood flow and TMS in the region being stimulated (the left frontalFEF), as well as in a number of distant cortical regions, including the left medial parieto-occipital cortex, the bilateral superior parietal cortex, and the right supplementary eye field(Figure 4). Thus, TMS produced changes in cerebral blood flow not only at the site ofstimulation, but in a distributed network of functionally connected regions. A subsequentstudy showed that the pattern of blood flow changes varies as a function of the stimulatedregion (Chouinard et al., 2003): rTMS to premotor cortex modulated a widespread network,including several regions in the prefrontal and parietal cortices; in contrast, rTMS to motor
Shafi et al. Page 9
Eur J Neurosci. Author manuscript; available in PMC 2013 March 1.
NIH
-PA Author Manuscript
NIH
-PA Author Manuscript
NIH
-PA Author Manuscript
cortex modulated activity in a smaller number of brain regions, primarily confined to thecortical and subcortical motor systems. More recent studies combining TMS with fMRIhave confirmed and extended the above findings, demonstrating that even subthresholdTMS can activate a widespread cortical and subcortical network (Bestmann et al., 2003,2004, 2005); (Figure 5a).
Similarly, early studies combining TMS with EEG demonstrated that single-pulse TMS tothe motor cortex produced a complex sequence of successive activations, with EEG activitychanges under the TMS coil occurring immediately, then spreading over a few millisecondsto ipsilateral motor, premotor and parietal regions, and then spreading several millisecondslater to the contralateral motor cortex (Ilmoniemi et al., 1997; Komssi et al., 2002), (Figure5b). Subsequent studies utilizing fcEEG measures, such as coherence, have providedquantitative evidence that rTMS can alter the strength of the connection between differentcortical regions (Jing & Takigawa, 2000; Plewnia et al., 2008); the behavioral significanceof these changes is as yet unknown.
The combination of TMS with other technologies also permits more sophisticated analysisof the dynamics of interactions between different cortical regions. For example, in one novelstudy, the TMS-evoked response was studied using functional connectivity analysis of EEGdata in the awake and sleeping state (Massimini et al., 2005). The authors hypothesized thatconsciousness is based on the brain’s ability to integrate information from disparate sources,which in turn is contingent on effective connectivity between different specialized regions ofthe thalamocortical system. As a consequence of this hypothesis, the authors predicted thateffective connectivity decreases during sleep. To test this hypothesis, they applied single-pulse TMS to the frontal cortex of subjects in either wakefulness or different sleep stages,and studied the resulting TMS-evoked potential using EEG. The authors found that duringwakefulness TMS induced a sustained response of recurrent waves of activity, with theunderlying cortical currents shifting over time to different regions across the cortex. Incontrast, during non-REM sleep, TMS induced a much larger immediate local response thatthen terminated rapidly. Furthermore, the TMS-evoked potential was confined to the regionof stimulation, and did not propagate to any other cortical region (Figure 6). These resultsthus supported the hypothesis that the loss of consciousness during sleep is associated with abreakdown in effective connectivity between different cortical regions. A recent follow-upstudy utilizing TMS demonstrated a similar breakdown in effective connectivity during theloss of consciousness induced by midazolam anesthesia (Ferrarelli et al., 2010).
Such combined-modality studies permit analysis of precisely how different regions interact.Because the TMS pulse produces a change in brain activity at a particular place and time,various techniques that assess how that change is propagated through the brain can be usedto assess metrics of effective connectivity. For example, in a recent study, TMS was appliedto the left motor hand region while brain activity was imaged with PET (Laird et al., 2008).Structural equation modeling was then applied to the PET data to evaluate the connectivity,focusing on regions known to be activated during TMS to motor cortex. Since TMS wasbeing applied to a single (known) location at a specific time point, the sequence anddirection of interactions with other cortical regions could be precisely delineated, permittingthe construction of a detailed activity-path model. Following TMS of left motor cortex,activity initially propagated to five regions: the supplementary motor area, the cingulategyrus, the left ventral nucleus of the thalamus, the right secondary somatosensory cortex,and the right cerebellum. From these initial points, activity then propagated through anumber of additional regions (Figure 7).
Combined-modality studies involving TMS can also be used to assess how neural functionalconnectivity changes during different cognitive tasks and after various interventions. In one
Shafi et al. Page 10
Eur J Neurosci. Author manuscript; available in PMC 2013 March 1.
NIH
-PA Author Manuscript
NIH
-PA Author Manuscript
NIH
-PA Author Manuscript

recent study combining TMS and EEG, single-pulse TMS was applied to the human FEFwhile subjects performed either a face discrimination or motion discrimination task(Morishima et al., 2009). Notably, there was a significant difference between the two tasksin the TMS event-related potentials in the right parieto-occipital region. Furthermore, theTMS pulse during the motion task preferentially activated a current source in the regioncorresponding to area MT (known from fMRI studies to be involved in motion perception),while the fusiform face area was the preferential source of the currents evoked by the TMSpulse during the face task. Taken together, these results suggest that the activity provoked byFEF TMS propagated along different pathways depending on which visual task was beingperformed, and that the functional connectivity of the FEF varied dynamically as a functionof the task parameters.
BRAIN STIMULATION TECHNIQUES AND NETWORK ANALYSIS INNEUROPSYCHIATRIC DISEASE
There has been an explosion of recent research suggesting that the pathophysiologyunderlying a variety of different neuropsychiatric disease states is a network phenomenon.Despite this, the findings of studies of traditional EEG, fMRI and PET functionalconnectivity networks have had limited application in clinical neuropsychiatry, for reasonsthat could be substantially addressed by combining them with brain stimulation techniques.The reasons why traditional neuroimaging network techniques have not been clinicallyuseful to date include: (1) The specific alterations in network connectivity that have beenidentified in different disease states tend to vary considerably across studies and dependingon the precise analysis technique utilized, and therefore reliable & consistent EEG/fMRInetwork biomarkers of disease and recovery are not currently available. (2) The techniquescurrently used in EEG, fMRI and PET functional connectivity studies are essentiallycorrelational, and the interactions they identify have not been validated in experiments thatdirectly manipulate neural activity. Consequently, while various techniques may identifycorrelated activity between two different cortical regions, a direct interaction between thetwo can only be confirmed by direct and focal stimulation that changes the activity of one ofthe regions. (3) Therapeutic interventions that modulate neural networks in a specific andtargeted fashion have not been developed, as most traditional pharmaceutical measuresmodulate the activity of entire networks rather than by targeting specific dysfunctionalnodes or connections.
The integration of brain stimulation techniques with traditional neuroimaging networkanalysis provides a unique set of tools to potentially address all of these issues. By studyingthe distributed changes in brain activity that can be produced by focal transcranial brainstimulation, the connectivity pathways identified by traditional network analysis techniquescan be validated in both normal subjects and in different disease states. Furthermore, bydirectly changing the activity of a single region in a controlled manner, brain stimulationtechniques enable the identification of causal interactions between different cortical areas.As such, their use has added significantly to our understanding of the pathophysiology ofcortical networks in various disease states.
Because transcranial brain stimulation techniques provide a means to modulate corticalactivity in a noninvasive, safe and targeted fashion, they have naturally come underinvestigation as potentially useful therapeutic tools. While the application of theseapproaches in the therapeutic realm is still in preliminary stages, early results are promising.In this section, we use the examples of motor recovery after stroke, depression andschizophrenia to illustrate how transcranial brain stimulation techniques can be used toexplore and modify cortical networks in various disease states.
Shafi et al. Page 11
Eur J Neurosci. Author manuscript; available in PMC 2013 March 1.
NIH
-PA Author Manuscript
NIH
-PA Author Manuscript
NIH
-PA Author Manuscript

Motor recovery after strokeStroke, once the prime example of how a focal brain lesion can lead to a neurologicaldeficit, is being increasingly recognized as a disorder of interacting brain networks (Grefkeset al., 2008; Carter et al., 2010; van Meer et al., 2010). Hemiparesis has been related toreduced interhemispheric connectivity during rest (Carter et al., 2010), as well as reducedeffective connectivity between the supplementary motor area and primary motor area (M1)during hand movements, both of which are correlated with the severity of the movementdeficit (Grefkes et al., 2008). Neglect has been related to decreased connectivity within thedorsal and ventral attention networks (He et al., 2007b; Carter et al., 2010). Not only doesthe severity of neglect correlate with these connectivity abnormalities, but recovery ofneglect over time is associated with restoration of normal connectivity patterns (He et al.,2007b). Similarly, EEG studies have demonstrated changes in functional connectivity withinboth the ipsilesional hemisphere and the contralesional hemisphere (as well as theconnections between them) after ischemic stroke (Gerloff et al., 2006; Zhu et al., 2009).
Experiments utilizing TMS have provided insights into the network mechanisms of strokerecovery, as well as factors that may inhibit this process. Intriguingly, studies using paired-pulse TMS have demonstrated that in cortical strokes, short-interval intracortical inhibitionis decreased in the acute stage, whereas intracortical facilitation is unchanged, suggestingthat the balance of excitability in these cortical circuits is shifted towards excitation(Cicinelli et al., 1997; Liepert et al., 2000b, 2000a; Nardone & Tezzon, 2002; Manganotti etal., 2002). However, other studies have demonstrated that the cortical silent period isinitially prolonged, suggesting increased inhibition (Braune & Fritz, 1995; Traversa et al.,1997; Ahonen et al., 1998; Liepert et al., 2000a; Nardone & Tezzon, 2002); thisprolongation normalizes with clinical recovery (Traversa et al., 1997; Classen et al., 1997;Cicinelli et al., 1997; Byrnes et al., 2001). Stroke patients undergoing rehabilitation alsodemonstrate an increase in the number of cortical sites from where an MEP of the paretichand can be obtained (Traversa et al., 1997; Liepert et al., 1998, 2000b; Wittenberg et al.,2003). Another study demonstrated that TMS pulses to ipsilesional dorsal premotor cortexcan produce much greater delays in reaction time in stroke patients with infarcts in motorcortex but preserved premotor cortices than in healthy controls (Fridman et al., 2004).Furthermore, TMS to the premotor cortex in the intact cortex produces MEPs in theipsilateral (paretic) hand (Caramia et al., 2000), suggesting that the contralesional premotorcortex also plays a role in motor activation after stroke. The importance of the contralesionalhemisphere was also demonstrated in a study by Lotze et al (2006), who evaluated theimpact of inhibitory rTMS to various locations in the contralesional hemisphere in patientswho had recovered fully from subcortical strokes. They found that stimulation of thecontralesional M1, dorsal premotor cortex, and superior parietal lobule all producedsignificant decreases in performance of motor tasks by the ipsilateral hand (that was affectedby the stroke). Taken together, these studies suggest that the excitability of the lesionedhemisphere is altered after a stroke, and non-primary motor cortices can be recruited tocompensate for the decrease in motor cortex activity.
TMS in combination with neuroimaging techniques can be used to study the dynamicmechanisms that the brain utilizes to compensate for focal disruptions in activity. In oneelegant study, O’Shea et al (2007) used repetitive TMS to induce mild, transient disruptionsto a focal cortical region, and then used fMRI to study compensatory changes in the brain.They focused on the left dorsal premotor region, which shows increased activation aftermotor stroke and is involved in action selection. Inhibitory rTMS applied to the left dorsalpremotor cortex initially resulted in a disruption in performance on an action selection task.However, within a few minutes, performance returned to baseline. fMRI demonstrated thatduring task performance prior to rTMS, blood flow increased to a left-hemisphere dominantpremotor-parietal network. fMRI several minutes after rTMS of the left premotor cortex,
Shafi et al. Page 12
Eur J Neurosci. Author manuscript; available in PMC 2013 March 1.
NIH
-PA Author Manuscript
NIH
-PA Author Manuscript
NIH
-PA Author Manuscript

after behavioral performance had recovered to baseline, demonstrated increased activation inthe right premotor cortex, left supplementary motor area, and bilateral cingulate motor areas(Figure 8). Thus, recovery of task performance was associated with increased activity inmultiple other cortical regions. These compensatory increases in activity were not seen whensubjects performed a control motor task that did not involve the left premotor cortex, andthese changes were also not seen when rTMS was applied to primary motor cortex,suggesting that the observed changes were occurring in a task- and region-specific manner.To show that this compensatory activity in right premotor cortex is behaviorally relevant,TMS was then also applied to the right premotor cortex. TMS to the right premotor cortexalone had no effect on task performance, suggesting that right premotor cortex is usually notcritical for task performance. However, if right premotor cortex was stimulated after rTMSof left premotor cortex, task performance was impaired. Thus, the results suggest that thecompensatory increase in right premotor activity seen after inhibitory rTMS of left premotorcortex is causally involved in behavioral recovery, a finding with significant clinicalimplications for motor recovery after stroke.
Similarly, another important TMS/PET study (Chouinard et al., 2006) explored the effectsof physical therapy on brain connectivity, as measured via TMS-induced blood flow changesin the resting state. The authors applied rTMS trains to both ipsilesional and contralesionalM1, before and after three weeks of constraint-induced movement therapy. Improvements inmotor performance were negatively correlated with local cerebral blood flow changes whenrTMS was delivered to both ipsilesional and contralesional M1. There were also changes inthe cerebral blood flow response to rTMS in the cingulate motor area, basal ganglia andthalamus that correlated with motor performance. Thus, the authors utilized the combinationof brain stimulation and PET to demonstrate that the motor performance changes producedby physical therapy are associated with changes in cortical effective connectivity.
Another clinically significant study assessed the impact of interhemispheric inhibition fromthe unaffected hemisphere to the affected hemisphere. In normal subjects, the amount oftranscallosal inhibition from the “resting” hemisphere to the “active” hemisphere initiallydecreases and then becomes facilitation just before movement onset (stimulation of onehemisphere leads to a larger response in contralateral stimulation); however, in strokepatients, interhemispheric inhibition remained significant (Murase et al., 2004).Furthermore, the degree of interhemispheric inhibition to the lesioned cortex was correlatedwith slower performance on a finger-tapping task. Based on these results, the authorspostulated that inhibition from the unaffected hemisphere might actually inhibit motoractivity from the lesioned hemisphere after stroke.
These and other studies have motivated research investigating the therapeutic potential ofnoninvasive brain stimulation techniques in stroke recovery. A number of proof-of-principletherapeutic trials have been completed, with the results suggesting that excitatory brainstimulation to the lesioned hemisphere, or inhibitory brain stimulation to the unaffectedhemisphere, may have beneficial effects in promoting recovery after stroke (Murase et al.,2004; Hummel et al., 2005; Khedr et al., 2005; Fregni et al., 2005, 2006a; Takeuchi et al.,2005; Kirton et al., 2008; Nowak et al., 2009; Emara et al., 2010).
In a particularly intriguing recent study, Grefkes et al (2010) utilized fMRI and functionalconnectivity analysis techniques to explore the network changes produced by rTMS of thecontralesional hemisphere in stroke patients. This study was motivated by previous workthat demonstrated significant disturbances in the effective connectivity between differentcortical regions in stroke patients: reduced coupling between ipsilesional SMA and M1,reduced coupling between the bilateral SMAs, and increased interhemispheric inhibitionfrom contralesional M1 to ipsilesional M1 during movements with the paretic hand (Grefkes
Shafi et al. Page 13
Eur J Neurosci. Author manuscript; available in PMC 2013 March 1.
NIH
-PA Author Manuscript
NIH
-PA Author Manuscript
NIH
-PA Author Manuscript

et al., 2008). Interestingly, the weaker the coupling between ipsilesional SMA and M1, andthe greater the interhemispheric inhibition from contralesional M1 to ipsilesional M1, theworse the performance was in the paretic hand. After 1Hz rTMS to the contralesional cortex,motor performance of the paretic hand improved. rTMS was also associated with an increasein the endogenous coupling of ipsilesional SMA and M1, and with a significant decrease ofthe pathologic inhibition from contralesional M1 to ipsilesional M1 with movement of theparetic hand. The magnitude of the reduction in this pathologic inhibition was correlatedwith the degree of improvement in motor performance of the paretic hand (Grefkes et al.,2010). Thus, this study demonstrated that rTMS might promote more efficient networkinteractions in both ipsilesional and contralesional cortex. The techniques utilized in thisstudy hold significant potential for understanding how brain stimulation techniques affectcortical networks, and thus should enable the development of more effective therapeuticprotocols.
DepressionSimilar to stroke, psychiatric diseases including depression and schizophrenia are beingincreasingly viewed as network disorders involving abnormal interactions between multiplebrain regions. However, unlike stroke, the regions and networks involved are notimmediately obvious using routine clinical imaging. While this has lead to great interest inthe potential of functional connectivity for revealing previously hidden pathology, there hasbeen a large degree of heterogeneity in the networks of interest and results (Greicius, 2008;Fox & Greicius, 2010; Zhang & Raichle, 2010). Early neuroimaging studies suggested thatone of the changes seen in depressed subjects is a relative hypoactivity of the left dorsalprefrontal cortex (Baxter et al., 1989; Martinot et al., 1990; Drevets, 2000), with anormalization of activity accompanying response to treatment (Bench et al., 1995; Mayberget al., 2000). More recent studies using functional connectivity techniques have focused onthe subgenual cingulate cortex (Mayberg et al., 2005), dorsolateral prefrontal cortex (forexample see (Seminowicz et al., 2004)) and the default mode network (DMN). Reportedfunctional connectivity abnormalities include decreased corticolimbic connectivity(especially with the dorsal anterior cingulate), increased connectivity within the DMN,especially in the subgenual prefrontal cortex, and decreased connectivity between DMN andcaudate (Seminowicz et al., 2004; Anand et al., 2005a, 2005b, 2009; Greicius et al., 2007;James et al., 2009; Bluhm et al., 2009a). Increased subbgenual connectivity has been relatedto depression severity (Greicius et al., 2007), and algorithms based on functionalconnectivity can distinguish between depressed and control subjects (Craddock et al., 2009)and predict treatment response (Seminowicz et al., 2004). Similarly, EEG functionalconnectivity studies have suggested a role for a pathological global increase in functionalconnectivity within alpha and theta frequency bands (Fingelkurts et al., 2007), and thatfunctional networks during sleep are topologically different in acutely depressed patientsversus normal controls (Leistedt et al., 2009). Most intriguingly, a recent analysis applyinggraph theoretic techniques to resting-state fMRI functional connectivity data demonstrated asignificant decrease in mean path length in depressed patients, primarily due to an increasein functional connectivity within a network comprised of several DMN regions (Zhang et al,2011).
To date, the strongest support for noninvasive brain stimulation techniques in clinicalneuropsychiatry (and the only FDA-approved therapeutic indication) comes from thetreatment of certain forms of medication-resistant depression. The potential utility of brainstimulation techniques for treating depression was illustrated in several early studies thatdemonstrated that rTMS to prefrontal cortex had effects on mood (George et al., 1996;Pascual-Leone et al., 1996b). Based on these findings, one early study conducted a trial ofdaily high-frequency versus sham rTMS to left or right dorsolateral prefrontal cortex, with
Shafi et al. Page 14
Eur J Neurosci. Author manuscript; available in PMC 2013 March 1.
NIH
-PA Author Manuscript
NIH
-PA Author Manuscript
NIH
-PA Author Manuscript

each site stimulated for five consecutive days (Pascual-Leone et al., 1996a); they showedthat only high-frequency rTMS to the left dorsolateral prefrontal cortex significantlyimproved depression scores, with the effects lasting for approximately two weeks. A largenumber of subsequent trials have been carried out, with the majority finding high-frequencyrTMS to the left dorsolateral prefrontal cortex to be effective in relieving symptoms ofdepression. Several studies have also looked at the effects of low-frequency (inhibitory)rTMS to the right prefrontal cortex, with most finding that inhibitory rTMS to the rightprefrontal cortex is also efficacious in the treatment of depression (Klein et al., 1999; Januelet al., 2006; O’Reardon et al., 2007). A recent meta-analysis combined randomized trial datafrom 38 studies with a total of 1383 patients (Slotema et al., 2010); 28/34 studiesdemonstrated a benefit with rTMS, with a mean weighted effect size (mean difference /standard deviation) for all studies of 0.55 (p < 0.001). The single largest randomizedplacebo-controlled trial conducted to date involved the application of high-frequency (10Hz) rTMS to the left prefrontal cortex, in daily sessions occurring five times a week for amaximum of 30 sessions over six weeks (O’Reardon et al., 2007). The authors found thatactive rTMS was consistently and significantly superior to sham treatment on a variety ofdifferent outcome measures.
The neural mechanisms by which rTMS modulates depression are unknown, but two (non-exclusive) hypotheses are that 1) rTMS directly modulates activity (e.g. via synapticplasticity mechanisms) in the frontocingulate network that is associated with depression, or2) rTMS may facilitate monoaminergic transmission, with a likely diverse impact on theneurochemical milieu (Paus & Barrett, 2004). Indeed, several studies have suggested thatprefrontal rTMS affects serotonin synthesis and dopamine release in a number of othercortical regions (Pogarell et al., 2006; Sibon et al., 2007; Cho & Strafella, 2009). To explorehow rTMS of frontal cortex affects cortical activity in other regions, Paus et al. (2001)conducted a study combining rTMS of dorsolateral prefrontal cortex with PET. Intriguingly,the authors demonstrated that an initial test stimulus (double-pulse TMS) caused decreasedblood flow in both the area being stimulated and in a number of other regions (including theanterior cingulate, implicated in the functional connectivity studies above). After excitatoryrTMS, the same double-pulse TMS now caused an increase in blood flow in the sameregions, thereby demonstrating that rTMS modulates activity in a widespread corticalnetwork. Another study evaluated changes in regional blood flow in depressed patients after10 daily treatments of either 20-Hz or 1-Hz rTMS to the left dorsolateral prefrontal cortex(Speer et al., 2000). As predicted, 20-Hz rTMS increased blood flow in a widespreadnetwork including the L>R prefrontal cortex, the L>R cingulate gyrus, limbic cortex,thalamus and cerebellum (Figure 9). In contrast, low-frequency rTMS caused significantdecreases in blood flow in right prefrontal cortex, left mesial temporal lobe, left basalganglia and left amygdala. Importantly, patients whose mood improved after 20-Hz rTMShad worsening of their mood after 1-Hz rTMS – and for uncertain reasons, the reversepattern was also observed in some patients. In a follow-up study (Speer et al., 2009), it wasdemonstrated that depressed patients with global baseline hypoperfusion had improvementafter 20-Hz rTMS and worsening after 1-Hz rTMS; conversely, patients with hyperperfusionin specific cortical regions showed improvement after 1-Hz rTMS (no relationship wasfound for 20-Hz rTMS in this subpopulation). Another study looking at blood flow changesafter rTMS also demonstrated relatively increased blood flow in prefrontal cortex after high-frequency stimulation, and relatively decreased blood flow after low-frequency stimulation(Loo et al., 2003). However, the pattern of changes in other cortical regions after high orlow frequency rTMS was complex, with increases in some regions and decreases in others.Fregni et al (2006b) used SPECT to study the effects of rTMS of left prefrontal cortexversus an SSRI (fluoxetine) in patients with Parkinson’s Disease and comorbid depression.rTMS produced blood flow changes in a widespread cortical network involving theprefrontal and temporal cortices, as well as the posterior cingulate. Importantly, the clinical
Shafi et al. Page 15
Eur J Neurosci. Author manuscript; available in PMC 2013 March 1.
NIH
-PA Author Manuscript
NIH
-PA Author Manuscript
NIH
-PA Author Manuscript
improvement in depression was significantly correlated with the rTMS-induced blood flowchanges. Thus, these studies all demonstrated that prefrontal rTMS modulates the activity ofa widespread network involving regions known from prior functional connectivity studies tobe involved in depression. These studies also suggest that rTMS0 may exert its effects via anormalization of abnormal network activity. Approaches combining noninvasive brainstimulation with neurophysiologic and neuroimaging functional network analysis promise toenable more individually-tailored stimulation protocols that may enhance the efficacy ofrTMS.
SchizophreniaFunctional connectivity abnormalities in schizophrenia have received even more attentionthan depression, but with the result of even greater heterogeneity in the reportedabnormalities (Greicius, 2008; Fox & Greicius, 2010; Zhang & Raichle, 2010). Reportedfunctional connectivity abnormalities include decreased correlations between the lefttemporoparietal junction and the right homotope of Broca, decreased or increasedcorrelations within the DMN, and decreased, increased or unchanged correlations andanticorrelations between the DMN and other systems (Liu et al., 2006, 2008; Liang et al.,2006; Salvador et al., 2007; Zhou et al., 2007; Bluhm et al., 2007, 2009b; Jafri et al., 2008;Whitfield-Gabrieli et al., 2009; Vercammen et al., 2010a). Decreased correlations betweenactivity in the posterior cingulate cortex and the rest of the DMN have been related to theseverity of positive symptoms (Bluhm et al., 2007), while reduced coupling between the lefttemporoparietal junction and the bilateral anterior cingulate as well as the bilateral amygdalawas associated with worse auditory hallucinations (Vercammen et al., 2010a). With regardsto the underlying cerebral pathology, the most consistent abnormalities have been noted inthe posterior superior temporal cortex of the dominant left hemisphere. However, structural/functional abnormalities have also been noted in a distributed network of brain regions,including Broca’s area and the amygdala-hippocampal network (Allen et al., 2008). fcEEGanalysis has suggested that in schizophrenic patients, brain networks resemble randomgraphs, with relatively small ratios of clustering-coefficients (local efficiency) to path-lengthvalues, compared to the larger ratios characteristic of the small-world networks which areseen in healthy controls (Micheloyannis et al., 2006a; Rubinov et al., 2009), suggesting arelative breakdown of local processing efficiency.
Thus, while neuroimaging techniques have indicated that there are significant alterations infunctional connectivity in schizophrenic patients, the precise abnormalities and theirrelationship to disease expression are uncertain. For this reason, over the past decade therehave been a number of studies utilizing brain stimulation techniques to explore some ofthese altered connectivity patterns and to treat the associated symptoms. The current datasuggests that low-frequency rTMS to the left temporo-parietal junction is useful in thetreatment of auditory hallucinations, while high-frequency stimulation of the leftdorsolateral prefrontal cortex may be beneficial for treatment of negative symptoms (Freitaset al., 2009; Dlabac-de Lange et al., 2010; Matheson et al., 2010).
One recent study (Horacek et al., 2007) combined brain imaging with PET and EEGanalysis in patients receiving rTMS for auditory hallucinations. Importantly, PET and EEGwere done in the resting state before and after rTMS therapy, which consisted of ten 20-minute sessions of rTMS at 0.9 Hz delivered to the left temporoparietal region. The authorsfound that rTMS significantly improved auditory hallucinations. The analysis of the PETdata revealed that rTMS caused a pronounced decrease in metabolic activity in the lefttemporal cortex and cerebellum, and an increase in metabolism in the bilateral middlefrontal gyrus and in the right temporo-occipital cortex, suggesting that the improvement inauditory hallucinations might be secondary to a relative increase in frontal executive controland interhemispheric inhibition from the contralateral cortex. The authors then explored how
Shafi et al. Page 16
Eur J Neurosci. Author manuscript; available in PMC 2013 March 1.
NIH
-PA Author Manuscript
NIH
-PA Author Manuscript
NIH
-PA Author Manuscript
the metabolism of different brain regions covaried with metabolism in the left superiortemporal gyrus. Prior to rTMS, metabolism within the left superior temporal gyrus waspositively correlated with a large distributed network including the bilateral temporalcortices and anterior cingulate, and negatively correlated with a number of regions includingthe inferior parietal lobule, precuneus, and primary sensorimotor cortices. After rTMS, thesize of both the positive and negatively correlated regions decreased, suggesting that rTMSwas decreasing the functional connectivity of the stimulated region (Figure 10). The EEGanalysis revealed increased delta power in the anterior cingulate bilaterally, and decreasedbeta power in the left temporal cortex. Intriguingly, beta activity was increased in thecontralateral (right) temporal lobe and inferior parietal lobule, again raising the possibility ofincreased interhemispheric inhibition to the pathologically hyperactive cortex. Thus, thisstudy also supported the notion that rTMS alters activity in a widespread cortical network,with the pattern of changes (a decrease in functional connectivity from the lefttemporoparietal junction and an increase in functional connectivity in the contralateralcortex and frontal areas) suggesting a mechanism for observed behavioral effects. A morerecent study using resting-state fMRI (Vercammen et al., 2010b) also found that rTMSaltered brain connectivity by significantly increasing the functional connectivity between thetargeted left temporo-parietal junction and the right insula. However, there was no change inthe strength of the specific connections that were previously shown to be correlated withsymptom severity (Vercammen et al., 2010a), suggesting that further work needs to be doneto determine the role of these different interactions in the pathophysiology of schizophrenia.
A complementary study by Fitzgerald et al (2007) combined rTMS with fMRI to evaluatethe effects of 1Hz rTMS for the treatment of auditory hallucinations on verbal task-inducedbrain activation. They scanned 3 patients while performing a word generation task, beforeand after receiving rTMS. Four control subjects were also scanned during task performance(but did not receive rTMS). The authors found that hallucination severity was substantiallyreduced in all three patients, with increases in task-evoked brain activity noted in variousbrain areas including the left temporoparietal junction, the left frontal-precentral cortex, andthe left inferior frontal gyrus. There was also a significant decrease in task-evoked activity inthe right middle occipital gyrus. Intriguingly, before treatment patients showed decreasedtask-evoked activation compared with controls in a number of cortical regions, includingbilateral anterior cingulate, left fronto-temporal regions, left frontal-precentral gyrus, amongothers. Following rTMS, the areas of reduced activation (in comparison with controls) weresignificantly smaller, suggesting a normalization of pathologic distributed networks.
A recent study combining TMS with simultaneous EEG also showed intriguing networkpathology in schizophrenic patients (Ferrarelli et al., 2008). The authors applied single TMSpulses to the right premotor cortex, and assessed differences in the resulting TMS-evokedpotential between schizophrenic patients and healthy controls. They found that the totalbrain activation evoked by TMS, as measured via the global mean-field power, wassignificantly decreased for schizophrenic patients between 12 and 100ms after each stimuluspulse, with the maximum decrease occurring at the peaks of two TMS-evoked gammaoscillations, 22 and 55 ms after the TMS pulse. In schizophrenic patients, the amplitude ofthese peaks was significantly reduced in a subset of frontocentral electrodes (Figure 11). Theauthors then demonstrated that this decrease was due to both decreased amplitude anddecreased phase-locking of the TMS-evoked gamma activity. Using source analysistechniques the authors demonstrated that in healthy subjects, the current maxima shiftedrapidly from premotor cortex to right sensorimotor cortex and then left premotor andsensorimotor regions, whereas, in schizophrenic patients, cortical activation was morelocalized, shifting slowly between premotor and motor areas along the midline. Takentogether, these results suggest that effective connectivity in schizophrenic patients isimpaired, especially with regards to the capacity to produce and synchronize gamma
Shafi et al. Page 17
Eur J Neurosci. Author manuscript; available in PMC 2013 March 1.
NIH
-PA Author Manuscript
NIH
-PA Author Manuscript
NIH
-PA Author Manuscript

activity. These results mesh well with the findings of Fitzgerald et al (2007) and Vercammenet al (2010a), which also suggested decreased functional connectivity.
BRAIN STIMULATION TECHNIQUES AND ADVANCED NETWORKANALYSES
More recently, studies have begun to integrate brain stimulation techniques with some of themore advanced network analysis techniques, including resting-state network analysis andgraph theoretical analysis. For example default-mode network activity was assessed aftersham and real low-frequency rTMS to dorsolateral prefrontal cortex (van der Werf et al.,2010). The authors demonstrated that real rTMS decreased the default-mode networkactivity in the lateral temporal cortices and bilateral hippocampi as compared to sham, whileincreasing activity in the right caudate nucleus. Another recent study (Eldaief et al., 2011)demonstrated the ability of brain stimulation techniques to inform the results of these newneuroimaging network analysis techniques. rTMS at low and high frequencies was appliedat low and high frequencies (on separate days) to the left inferior parietal lobule, an integralcomponent of the default mode network, to study the effect on functional connectivity withthe other elements of the default mode network. Following low-frequency (1 Hz)stimulation, functional connectivity between the targeted region and the bilateralhippocampal formations was significantly increased. However, following high-frequencystimulation, functional connectivity with the hippocampal formation was essentiallyunchanged, while functional connectivity with the medial prefrontal cortex, posteriorcingulate cortex and contralateral inferior parietal lobule was decreased. Thus, whiletraditional fMRI resting state analysis suggested that the default-mode network is comprisedof an integrated system encompassing all of these regions, the perturbational approachenabled by TMS demonstrated that the default mode network may actually be comprised oftwo distinct subsystems. Given the abnormal resting state networks identified in psychiatricdiseases such as major depression (Greicius et al., 2007; Sheline et al., 2009), and theclinical utility of rTMS as a treatment for depression (see above), this study has importanttheoretical and practical implications.
Recent work has also begun to utilize the tools of graph theoretical analysis to characterizethe effects of brain stimulation techniques on cortical network topology. Polania et al (2010)applied facilitatory anodal tDCS to the left primary motor cortex with the cathode situatedover the contralateral orbit, and applied real versus sham stimulation. EEG was recordedbefore and after tDCS, during both resting state and performance of a simple motor task, andfcEEG between all electrode pairs was assessed using the synchronization likelihoodconnectivity measure (Stam & Dijk, 2002). The authors demonstrated that in the restingstate networks, tDCS produced an increase in synchronization between the frontal areaswithin multiple frequency bands. A comparison of brain activity during performance of themotor task demonstrated increased synchronization within parieto-occipital and frontalregions of the left hemisphere in the θ and α bands, no change in the β and low-γ bands, andincreased synchronization within the left premotor, motor and sensorimotor regions in thehigh-γ range. There was also significant interhemispheric desynchronization in the α, β andhigh-γ bands (Figure 12). Another study combining left motor tDCS with fMRI resting stateactivity analysis (Polanía et al., 2011) showed increased connectivity within the leftposterior cingulate cortex and the right dorsolateral prefrontal cortex, and an increase inmean path length within the left sensorimotor cortex. Intriguingly, seeded functionalconnectivity analysis of the left sensorimotor cortex revealed increased functionalconnectivity with left motor and premotor cortex, and with part of the superior parietalcortex, and no regions of decreased functional connectivity, suggesting that the increase inpath length may be due to a strengthening of the motor network at the relative (but notabsolute) expense of connections with other parts of the cortex. Functional connectivity
Shafi et al. Page 18
Eur J Neurosci. Author manuscript; available in PMC 2013 March 1.
NIH
-PA Author Manuscript
NIH
-PA Author Manuscript
NIH
-PA Author Manuscript

analysis of the right dorsolateral prefrontal cortex showed increased connectivity with theright anterior insula, while that of the posterior cingulate demonstrated activation withinregions corresponding to the default-mode network. Thus, these studies togetherdemonstrate that tDCS produces widespread changes in the topology of brain functionalconnectivity, and that these changes can be studied using the tools developed for analysis offMRI and EEG functional connectivity networks.
The finding that brain stimulation techniques modify the activity of entire networks arguesagainst the view that noninvasive brain stimulation techniques produce largely locallyrestricted modifications in cortical excitability. Rather, noninvasive brain stimulationtechniques modify the activity and connectivity of distributed cortical networks, extendingwell beyond the region of direct stimulation. Recognition of this fact implies that thefindings of previous studies utilizing brain stimulation techniques to probe the function ofspecific regions may need to be reinterpreted. Also, more effective utilization of noninvasivebrain stimulation techniques in both research and clinical therapeutics will requireexploration and evaluation of how focal brain stimulation modifies network activities as afunction of baseline state, stimulation protocol, baseline functional connectivity, task, andregion of stimulation.
CONCLUSIONSIn recent decades, a range of noninvasive techniques for studying and manipulating brainactivity have been developed. EEG, PET and fMRI are complementary methods of assessingneural activity. A number of analytic techniques have been applied to data collected usingthese methods to help delineate the brain’s functional connectivity, i.e. the interactionsbetween different brain regions both at rest and during performance of various tasks, andtheir use has led to the understanding that cognitive functions are carried out by widespreadcortical networks. The same decades have witnessed the introduction of TMS and tDCS, twotechniques which rely on electromagnetic principles to noninvasively modulate brainactivity. A number of interesting studies have combined brain stimulation techniques withneuroimaging modalities to evaluate and modify brain activity. As such, they providepowerful tools for probing the connectivity of different cortical regions, and for causallyinvestigating the role of network activity in various cognitive functions. These studies havealso demonstrated that TMS and tDCS affect not only the focal region to which stimulationis being applied, but also affect widespread cortical areas that are connected to the targetregion. Consequently, these techniques permit the modulation of functional connectivitynetworks. The application of these tools has provided unique insights into the networkdysfunctions underlying human neuropsychiatric disease, and there have been a number ofrecent studies focusing on understanding and modulating these networks for therapeuticbenefit, with promising results in diseases such as depression, stroke recovery andschizophrenia. Thus, noninvasive brain stimulation in combination with neuroimagingtechniques offer considerable potential to further our understanding and treatment of thenetwork activity underlying human brain function and pathology.
AcknowledgmentsWork on this study was supported by grants from the National Center for Research Resources: Harvard Clinical andTranslational Science Center (UL1 RR025758), Center for Integration of Medicine and Innovative Technology(CIMIT), the Sidney R. Baer, Jr. Foundation, and Nexstim to APL. MS was supported by funds from the NationalCenter for Research Resources: Harvard Clinical and Translational Science Center (UL1 RR025758), and theCenter for Integration of Medicine and Innovative Technology (CIMIT). MBW was supported by NIH Grant R01-NS062092. MDF was supported by NIH Grant R25-NS065743.
Shafi et al. Page 19
Eur J Neurosci. Author manuscript; available in PMC 2013 March 1.
NIH
-PA Author Manuscript
NIH
-PA Author Manuscript
NIH
-PA Author Manuscript
Abbreviations
EEG electroencephalography
PET positron emission tomography
fMRI functional MRI
TMS transcranial magnetic stimulation
tDCS transcranial direct current stimulation
BOLD blood-oxygen-level dependence
fcMRI functional connectivity MRI
MEG magnetoencephalography
fcEEG functional connectivity EEG
MEP motor-evoked potentials
rTMS repetitive transcranial magnetic stimulation
FEF frontal eye fields
M1 primary motor area
DMN default mode network
REFERENCESAchard S, Bullmore E. Efficiency and Cost of Economical Brain Functional Networks. PLoS Comput
Biol. 2007; 3:e17. [PubMed: 17274684]Achard S, Salvador R, Whitcher B, Suckling J, Bullmore E. A resilient, low-frequency, small-world
human brain functional network with highly connected association cortical hubs. J Neurosci. 2006;26:63–72. [PubMed: 16399673]
Ahonen JP, Jehkonen M, Dastidar P, Molnár G, Häkkinen V. Cortical silent period evoked bytranscranial magnetic stimulation in ischemic stroke. Electroencephalogr Clin Neurophysiol. 1998;109:224–229. [PubMed: 9741788]
Albert, Barabasi. Topology of evolving networks: local events and universality. Phys Rev Lett. 2000;85:5234–5237. [PubMed: 11102229]
Allen EA, Pasley BN, Duong T, Freeman RD. Transcranial Magnetic Stimulation Elicits CoupledNeural and Hemodynamic Consequences. Science. 2007; 317:1918–1921. [PubMed: 17901333]
Allen P, Larøi F, McGuire PK, Aleman A. The hallucinating brain: A review of structural andfunctional neuroimaging studies of hallucinations. Neuroscience & Biobehavioral Reviews. 2008;32:175–191. [PubMed: 17884165]
Amassian VE, Cracco RQ, Maccabee PJ, Cracco JB, Rudell A, Eberle L. Suppression of visualperception by magnetic coil stimulation of human occipital cortex. Electroencephalogr ClinNeurophysiol. 1989; 74:458–462. [PubMed: 2480226]
Anand A, Li Y, Wang Y, Lowe MJ, Dzemidzic M. Resting state corticolimbic connectivityabnormalities in unmedicated bipolar disorder and unipolar depression. Psychiatry Res. 2009;171:189–198. [PubMed: 19230623]
Anand A, Li Y, Wang Y, Wu J, Gao S, Bukhari L, Mathews VP, Kalnin A, Lowe MJ. Activity andconnectivity of brain mood regulating circuit in depression: a functional magnetic resonance study.Biol Psychiatry. 2005a; 57:1079–1088. [PubMed: 15866546]
Anand A, Li Y, Wang Y, Wu J, Gao S, Bukhari L, Mathews VP, Kalnin A, Lowe MJ. Antidepressanteffect on connectivity of the mood-regulating circuit: an FMRI study. Neuropsychopharmacology.2005b; 30:1334–1344. [PubMed: 15856081]
Andersen B, Rösler KM, Lauritzen M. Nonspecific facilitation of responses to transcranial magneticstimulation. Muscle Nerve. 1999; 22:857–863. [PubMed: 10398202]
Shafi et al. Page 20
Eur J Neurosci. Author manuscript; available in PMC 2013 March 1.
NIH
-PA Author Manuscript
NIH
-PA Author Manuscript
NIH
-PA Author Manuscript

Barttfeld P, Wicker B, Cukier S, Navarta S, Lew S, Sigman M. A big-world network in ASD:dynamical connectivity analysis reflects a deficit in long-range connections and an excess of short-range connections. Neuropsychologia. 2011; 49:254–263. [PubMed: 21110988]
Bassett DS, Bullmore E. Small-world brain networks. Neuroscientist. 2006; 12:512–523. [PubMed:17079517]
Bassett DS, Bullmore ET, Meyer-Lindenberg A, Apud JA, Weinberger DR, Coppola R. Cognitivefitness of cost-efficient brain functional networks. Proc Natl Acad Sci USA. 2009; 106:11747–11752. [PubMed: 19564605]
Baxter LR, Schwartz JM, Phelps ME, Mazziotta JC, Guze BH, Selin CE, Gerner RH, Sumida RM.Reduction of prefrontal cortex glucose metabolism common to three types of depression. ArchGen Psychiatry. 1989; 46:243–250. [PubMed: 2784046]
Bench CJ, Frackowiak RS, Dolan RJ. Changes in regional cerebral blood flow on recovery fromdepression. Psychol Med. 1995; 25:247–261. [PubMed: 7675913]
Bestmann S, Baudewig J, Siebner HR, Rothwell JC, Frahm J. Subthreshold high-frequency TMS ofhuman primary motor cortex modulates interconnected frontal motor areas as detected byinterleaved fMRI-TMS. Neuroimage. 2003; 20:1685–1696. [PubMed: 14642478]
Bestmann S, Baudewig J, Siebner HR, Rothwell JC, Frahm J. Functional MRI of the immediate impactof transcranial magnetic stimulation on cortical and subcortical motor circuits. Eur J Neurosci.2004; 19:1950–1962. [PubMed: 15078569]
Bestmann S, Baudewig J, Siebner HR, Rothwell JC, Frahm J. BOLD MRI responses to repetitive TMSover human dorsal premotor cortex. Neuroimage. 2005; 28:22–29. [PubMed: 16002305]
Bestmann S, Ruff CC, Blankenburg F, Weiskopf N, Driver J, Rothwell JC. Mapping causalinterregional influences with concurrent TMS-fMRI. Exp Brain Res. 2008; 191:383–402.[PubMed: 18936922]
Bettus G, Wendling F, Guye M, Valton L, Régis J, Chauvel P, Bartolomei F. Enhanced EEGfunctional connectivity in mesial temporal lobe epilepsy. Epilepsy Research. 2008; 81:58–68.[PubMed: 18547787]
Bindman LJ, Lippold OC, Redfearn JW. Long-lasting changes in the level of the electrical activity ofthe cerebral cortex produced bypolarizing currents. Nature. 1962; 196:584–585. [PubMed:13968314]
Biswal B, Yetkin FZ, Haughton VM, Hyde JS. Functional connectivity in the motor cortex of restinghuman brain using echo-planar MRI. Magn Reson Med. 1995; 34:537–541. [PubMed: 8524021]
Bluhm R, Williamson P, Lanius R, Théberge J, Densmore M, Bartha R, Neufeld R, Osuch E. Restingstate default-mode network connectivity in early depression using a seed region-of-interestanalysis: decreased connectivity with caudate nucleus. Psychiatry Clin Neurosci. 2009a; 63:754–761. [PubMed: 20021629]
Bluhm RL, Miller J, Lanius RA, Osuch EA, Boksman K, Neufeld RWJ, Théberge J, Schaefer B,Williamson P. Spontaneous low-frequency fluctuations in the BOLD signal in schizophrenicpatients: anomalies in the default network. Schizophr Bull. 2007; 33:1004–1012. [PubMed:17556752]
Bluhm RL, Miller J, Lanius RA, Osuch EA, Boksman K, Neufeld RWJ, Théberge J, Schaefer B,Williamson PC. Retrosplenial cortex connectivity in schizophrenia. Psychiatry Res. 2009b;174:17–23. [PubMed: 19783410]
Braune HJ, Fritz C. Transcranial magnetic stimulation-evoked inhibition of voluntary muscle activity(silent period) is impaired in patients with ischemic hemispheric lesion. Stroke. 1995; 26:550–553.[PubMed: 7709395]
Byrnes ML, Thickbroom GW, Phillips BA, Mastaglia FL. Long-term changes in motor corticalorganisation after recovery from subcortical stroke. Brain Res. 2001; 889:278–287. [PubMed:11166720]
Caramia MD, Palmieri MG, Giacomini P, Iani C, Dally L, Silvestrini M. Ipsilateral activation of theunaffected motor cortex in patients with hemiparetic stroke. Clin Neurophysiol. 2000; 111:1990–1996. [PubMed: 11068234]
Shafi et al. Page 21
Eur J Neurosci. Author manuscript; available in PMC 2013 March 1.
NIH
-PA Author Manuscript
NIH
-PA Author Manuscript
NIH
-PA Author Manuscript
Carter AR, Astafiev SV, Lang CE, Connor LT, Rengachary J, Strube MJ, Pope DLW, Shulman GL,Corbetta M. Resting interhemispheric functional magnetic resonance imaging connectivitypredicts performance after stroke. Ann Neurol. 2010; 67:365–375. [PubMed: 20373348]
Chambers CD, Payne JM, Stokes MG, Mattingley JB. Fast and slow parietal pathways mediate spatialattention. Nat Neurosci. 2004; 7:217–218. [PubMed: 14983182]
Chen R, Classen J, Gerloff C, Celnik P, Wassermann EM, Hallett M, Cohen LG. Depression of motorcortex excitability by low-frequency transcranial magnetic stimulation. Neurology. 1997;48:1398–1403. [PubMed: 9153480]
Chen R, Yung D, Li J-Y. Organization of ipsilateral excitatory and inhibitory pathways in the humanmotor cortex. J Neurophysiol. 2003; 89:1256–1264. [PubMed: 12611955]
Cho SS, Strafella AP. rTMS of the left dorsolateral prefrontal cortex modulates dopamine release inthe ipsilateral anterior cingulate cortex and orbitofrontal cortex. PLoS ONE. 2009; 4:e6725.[PubMed: 19696930]
Chouinard PA, Van Der Werf YD, Leonard G, Paus T. Modulating neural networks with transcranialmagnetic stimulation applied over the dorsal premotor and primary motor cortices. J Neurophysiol.2003; 90:1071–1083. [PubMed: 12702714]
Chouinard PA, Leonard G, Paus T. Changes in effective connectivity of the primary motor cortex instroke patients after rehabilitative therapy. Exp Neurol. 2006; 201:375–387. [PubMed: 16828743]
Cicinelli P, Traversa R, Rossini PM. Post-stroke reorganization of brain motor output to the hand: a 2–4 month follow-up with focal magnetic transcranial stimulation. Electroencephalogr ClinNeurophysiol. 1997; 105:438–450. [PubMed: 9448645]
Classen J, Schnitzler A, Binkofski F, Werhahn KJ, Kim YS, Kessler KR, Benecke R. The motorsyndrome associated with exaggerated inhibition within the primary motor cortex of patients withhemiparetic. Brain. 1997; 120(Pt 4):605–619. [PubMed: 9153123]
Cowey A, Walsh V. Magnetically induced phosphenes in sighted, blind and blindsighted observers.Neuroreport. 2000; 11:3269–3273. [PubMed: 11043562]
Craddock RC, Holtzheimer PE, Hu XP, Mayberg HS. Disease state prediction from resting statefunctional connectivity. Magn Reson Med. 2009; 62:1619–1628. [PubMed: 19859933]
Creutzfeldt OD, Fromm GH, Kapp H. Influence of transcortical d-c currents on cortical neuronalactivity. Exp Neurol. 1962; 5:436–452. [PubMed: 13882165]
Dauwels J, Vialatte F, Musha T, Cichocki A. A comparative study of synchrony measures for the earlydiagnosis of Alzheimer’s disease based on EEG. NeuroImage. 2010; 49:668–693. [PubMed:19573607]
Davare M, Lemon R, Olivier E. Selective modulation of interactions between ventral premotor cortexand primary motor cortex during precision grasping in humans. J Physiol (Lond). 2008; 586:2735–2742. [PubMed: 18403420]
Dlabac-de Lange JJ, Knegtering R, Aleman A. Repetitive transcranial magnetic stimulation fornegative symptoms of schizophrenia: review and meta-analysis. J Clin Psychiatry. 2010; 71:411–418. [PubMed: 20361909]
Dosenbach NUF, Fair DA, Miezin FM, Cohen AL, Wenger KK, Dosenbach RAT, Fox MD, SnyderAZ, Vincent JL, Raichle ME, Schlaggar BL, Petersen SE. Distinct brain networks for adaptive andstable task control in humans. Proc Natl Acad Sci USA. 2007; 104:11073–11078. [PubMed:17576922]
Douw, L.; de Groot, M.; van Dellen, E.; Heimans, JJ.; Ronner, HE.; Stam, CJ.; Reijneveld, JC.“Functional Connectivity” Is a Sensitive Predictor of Epilepsy Diagnosis after the First Seizure. In:Sporns, O., editor. PLoS ONE. Vol. 5. 2010. p. e10839
Drevets WC. Functional anatomical abnormalities in limbic and prefrontal cortical structures in majordepression. Prog Brain Res. 2000; 126:413–431. [PubMed: 11105660]
Eldaief MC, Halko MA, Buckner RL, Pascual-Leone A. Transcranial magnetic stimulation modulatesthe brain’s intrinsic activity in a frequency-dependent manner. Proc Natl Acad Sci USA. 2011;108:21229–21234. [PubMed: 22160708]
Emara TH, Moustafa RR, Elnahas NM, Elganzoury AM, Abdo TA, Mohamed SA, Eletribi MA.Repetitive transcranial magnetic stimulation at 1Hz and 5Hz produces sustained improvement inmotor function and disability after ischaemic stroke. Eur J Neurol. 2010
Shafi et al. Page 22
Eur J Neurosci. Author manuscript; available in PMC 2013 March 1.
NIH
-PA Author Manuscript
NIH
-PA Author Manuscript
NIH
-PA Author Manuscript
Ferbert A, Priori A, Rothwell JC, Day BL, Colebatch JG, Marsden CD. Interhemispheric inhibition ofthe human motor cortex. J Physiol (Lond). 1992; 453:525–546. [PubMed: 1464843]
Ferrarelli F, Massimini M, Peterson MJ, Riedner BA, Lazar M, Murphy MJ, Huber R, Rosanova M,Alexander AL, Kalin N, Tononi G. Reduced evoked gamma oscillations in the frontal cortex inschizophrenia patients: a TMS/EEG study. Am J Psychiatry. 2008; 165:996–1005. [PubMed:18483133]
Ferrarelli F, Massimini M, Sarasso S, Casali A, Riedner BA, Angelini G, Tononi G, Pearce RA.Breakdown in cortical effective connectivity during midazolam-induced loss of consciousness.Proc Natl Acad Sci USA. 2010; 107:2681–2686. [PubMed: 20133802]
Fingelkurts AA, Fingelkurts AA, Rytsälä H, Suominen K, Isometsä E, Kähkönen S. Impairedfunctional connectivity at EEG alpha and theta frequency bands in major depression. Hum BrainMapp. 2007; 28:247–261. [PubMed: 16779797]
Fitzgerald PB, Brown TL, Marston NAU, Daskalakis ZJ, De Castella A, Kulkarni J. Transcranialmagnetic stimulation in the treatment of depression: a double-blind, placebo-controlled trial. ArchGen Psychiatry. 2003; 60:1002–1008. [PubMed: 14557145]
Fitzgerald PB, Sritharan A, Benitez J, Daskalakis ZJ, Jackson G, Kulkarni J, Egan GF. A preliminaryfMRI study of the effects on cortical activation of the treatment of refractory auditoryhallucinations with rTMS. Psychiatry Res. 2007; 155:83–88. [PubMed: 17398078]
Fox MD, Greicius M. Clinical applications of resting state functional connectivity. Front SystNeurosci. 2010; 4:19. [PubMed: 20592951]
Fox MD, Raichle ME. Spontaneous fluctuations in brain activity observed with functional magneticresonance imaging. Nat Rev Neurosci. 2007; 8:700–711. [PubMed: 17704812]
Fox MD, Corbetta M, Snyder AZ, Vincent JL, Raichle ME. Spontaneous neuronal activitydistinguishes human dorsal and ventral attention systems. Proc Natl Acad Sci USA. 2006;103:10046–10051. [PubMed: 16788060]
Fox MD, Snyder AZ, Vincent JL, Raichle ME. Intrinsic fluctuations within cortical systems accountfor intertrial variability in human behavior. Neuron. 2007; 56:171–184. [PubMed: 17920023]
Fox MD, Snyder AZ, Vincent JL, Corbetta M, Van Essen DC, Raichle ME. The human brain isintrinsically organized into dynamic, anticorrelated functional networks. Proc Natl Acad Sci USA.2005; 102:9673–9678. [PubMed: 15976020]
Fransson P. Spontaneous low-frequency BOLD signal fluctuations: an fMRI investigation of theresting-state default mode of brain function hypothesis. Hum Brain Mapp. 2005; 26:15–29.[PubMed: 15852468]
Fregni F, Boggio PS, Mansur CG, Wagner T, Ferreira MJL, Lima MC, Rigonatti SP, Marcolin MA,Freedman SD, Nitsche MA, Pascual-Leone A. Transcranial direct current stimulation of theunaffected hemisphere in stroke patients. Neuroreport. 2005; 16:1551–1555. [PubMed: 16148743]
Fregni F, Boggio PS, Valle AC, Rocha RR, Duarte J, Ferreira MJL, Wagner T, Fecteau S, RigonattiSP, Riberto M, Freedman SD, Pascual-Leone A. A sham-controlled trial of a 5-day course ofrepetitive transcranial magnetic stimulation of the unaffected hemisphere in stroke patients.Stroke. 2006a; 37:2115–2122. [PubMed: 16809569]
Fregni F, Ono CR, Santos CM, Bermpohl F, Buchpiguel C, Barbosa ER, Marcolin MA, Pascual-LeoneA, Valente KD. Effects of antidepressant treatment with rTMS and fluoxetine on brain perfusionin PD. Neurology. 2006b; 66:1629–1637. [PubMed: 16769932]
Freitas C, Fregni F, Pascual-Leone A. Meta-analysis of the effects of repetitive transcranial magneticstimulation (rTMS) on negative and positive symptoms in schizophrenia. Schizophr Res. 2009;108:11–24. [PubMed: 19138833]
Fridman EA, Hanakawa T, Chung M, Hummel F, Leiguarda RC, Cohen LG. Reorganization of thehuman ipsilesional premotor cortex after stroke. Brain. 2004; 127:747–758. [PubMed: 14749291]
Friston KJ, Frith CD, Liddle PF, Frackowiak RS. Functional connectivity: the principal-componentanalysis of large (PET) data sets. J Cereb Blood Flow Metab. 1993; 13:5–14. [PubMed: 8417010]
George MS, Wassermann EM, Williams WA, Steppel J, Pascual-Leone A, Basser P, Hallett M, PostRM. Changes in mood and hormone levels after rapid-rate transcranial magnetic stimulation(rTMS) of the prefrontal cortex. J Neuropsychiatry Clin Neurosci. 1996; 8:172–180. [PubMed:9081553]
Shafi et al. Page 23
Eur J Neurosci. Author manuscript; available in PMC 2013 March 1.
NIH
-PA Author Manuscript
NIH
-PA Author Manuscript
NIH
-PA Author Manuscript

Gerloff C, Bushara K, Sailer A, Wassermann EM, Chen R, Matsuoka T, Waldvogel D, Wittenberg GF,Ishii K, Cohen LG, Hallett M. Multimodal imaging of brain reorganization in motor areas of thecontralesional hemisphere of well recovered patients after capsular stroke. Brain. 2006; 129:791–808. [PubMed: 16364955]
Grefkes C, Nowak DA, Eickhoff SB, Dafotakis M, Küst J, Karbe H, Fink GR. Cortical connectivityafter subcortical stroke assessed with functional magnetic resonance imaging. Ann Neurol. 2008;63:236–246. [PubMed: 17896791]
Grefkes C, Nowak DA, Wang LE, Dafotakis M, Eickhoff SB, Fink GR. Modulating corticalconnectivity in stroke patients by rTMS assessed with fMRI and dynamic causal modeling.Neuroimage. 2010; 50:233–242. [PubMed: 20005962]
Greicius M. Resting-state functional connectivity in neuropsychiatric disorders. Curr Opin Neurol.2008; 21:424–430. [PubMed: 18607202]
Greicius MD, Flores BH, Menon V, Glover GH, Solvason HB, Kenna H, Reiss AL, Schatzberg AF.Resting-State Functional Connectivity in Major Depression: Abnormally Increased Contributionsfrom Subgenual Cingulate Cortex and Thalamus. Biological Psychiatry. 2007; 62:429–437.[PubMed: 17210143]
Hampson M, Driesen NR, Skudlarski P, Gore JC, Constable RT. Brain connectivity related to workingmemory performance. J Neurosci. 2006a; 26:13338–13343. [PubMed: 17182784]
Hampson M, Tokoglu F, Sun Z, Schafer RJ, Skudlarski P, Gore JC, Constable RT. Connectivity-behavior analysis reveals that functional connectivity between left BA39 and Broca’s area varieswith reading ability. Neuroimage. 2006b; 31:513–519. [PubMed: 16497520]
He BJ, Shulman GL, Snyder AZ, Corbetta M. The role of impaired neuronal communication inneurological disorders. Current Opinion in Neurology. 2007a; 20:655–660. [PubMed: 17992085]
He BJ, Snyder AZ, Vincent JL, Epstein A, Shulman GL, Corbetta M. Breakdown of functionalconnectivity in frontoparietal networks underlies behavioral deficits in spatial neglect. Neuron.2007b; 53:905–918. [PubMed: 17359924]
He BJ, Snyder AZ, Vincent JL, Epstein A, Shulman GL, Corbetta M. Breakdown of FunctionalConnectivity in Frontoparietal Networks Underlies Behavioral Deficits in Spatial Neglect. Neuron.2007c; 53:905–918. [PubMed: 17359924]
Hess CW, Mills KR, Murray NM. Responses in small hand muscles from magnetic stimulation of thehuman brain. The Journal of Physiology. 1987; 388:397–419. [PubMed: 3079553]
Hess CW, Mills KR, Murray NMF. Magnetic stimulation of the human brain: Facilitation of motorresponses by voluntary contraction of ipsilateral and contralateral muscles with additionalobservations on an amputee. Neuroscience Letters. 1986; 71:235–240. [PubMed: 3785745]
Horacek J, Brunovsky M, Novak T, Skrdlantova L, Klirova M, Bubenikova-Valesova V, Krajca V,Tislerova B, Kopecek M, Spaniel F, Mohr P, Höschl C. Effect of low-frequency rTMS onelectromagnetic tomography (LORETA) and regional brain metabolism (PET) in schizophreniapatients with auditory hallucinations. Neuropsychobiology. 2007; 55:132–142. [PubMed:17641545]
Horwitz B. The elusive concept of brain connectivity. Neuroimage. 2003; 19:466–470. [PubMed:12814595]
Huang Y-Z, Edwards MJ, Rounis E, Bhatia KP, Rothwell JC. Theta burst stimulation of the humanmotor cortex. Neuron. 2005; 45:201–206. [PubMed: 15664172]
Hubel DH, Wiesel TN. Receptive fields, binocular interaction and functional architecture in the cat’svisual cortex. J Physiol (Lond). 1962; 160:106–154. [PubMed: 14449617]
Hummel F, Celnik P, Giraux P, Floel A, Wu W-H, Gerloff C, Cohen LG. Effects of noninvasivecortical stimulation on skilled motor function in chronic stroke. Brain. 2005; 128:490–499.[PubMed: 15634731]
Ilmoniemi RJ, Virtanen J, Ruohonen J, Karhu J, Aronen HJ, Näätänen R, Katila T. Neuronal responsesto magnetic stimulation reveal cortical reactivity and connectivity. Neuroreport. 1997; 8:3537–3540. [PubMed: 9427322]
Jafri MJ, Pearlson GD, Stevens M, Calhoun VD. A method for functional network connectivity amongspatially independent resting-state components in schizophrenia. Neuroimage. 2008; 39:1666–1681. [PubMed: 18082428]
Shafi et al. Page 24
Eur J Neurosci. Author manuscript; available in PMC 2013 March 1.
NIH
-PA Author Manuscript
NIH
-PA Author Manuscript
NIH
-PA Author Manuscript

James GA, Kelley ME, Craddock RC, Holtzheimer PE, Dunlop BW, Nemeroff CB, Mayberg HS, HuXP. Exploratory structural equation modeling of resting-state fMRI: applicability of group modelsto individual subjects. Neuroimage. 2009; 45:778–787. [PubMed: 19162206]
Januel D, Dumortier G, Verdon C-M, Stamatiadis L, Saba G, Cabaret W, Benadhira R, Rocamora J-F,Braha S, Kalalou K, Vicaut PE, Fermanian J. A double-blind sham controlled study of rightprefrontal repetitive transcranial magnetic stimulation (rTMS): therapeutic and cognitive effect inmedication free unipolar depression during 4 weeks. Prog Neuropsychopharmacol Biol Psychiatry.2006; 30:126–130. [PubMed: 16242826]
Jing H, Takigawa M. Observation of EEG coherence after repetitive transcranial magnetic stimulation.Clin Neurophysiol. 2000; 111:1620–1631. [PubMed: 10964074]
van der Kamp W, Zwinderman AH, Ferrari MD, van Dijk JG. Cortical excitability and responsevariability of transcranial magnetic stimulation. J Clin Neurophysiol. 1996; 13:164–171. [PubMed:8849971]
Khedr EM, Ahmed MA, Fathy N, Rothwell JC. Therapeutic trial of repetitive transcranial magneticstimulation after acute ischemic stroke. Neurology. 2005; 65:466–468. [PubMed: 16087918]
Kirton A, Chen R, Friefeld S, Gunraj C, Pontigon A-M, Deveber G. Contralesional repetitivetranscranial magnetic stimulation for chronic hemiparesis in subcortical paediatric stroke: arandomised trial. Lancet Neurol. 2008; 7:507–513. [PubMed: 18455961]
Klein E, Kreinin I, Chistyakov A, Koren D, Mecz L, Marmur S, Ben-Shachar D, Feinsod M.Therapeutic efficacy of right prefrontal slow repetitive transcranial magnetic stimulation in majordepression: a double-blind controlled study. Arch Gen Psychiatry. 1999; 56:315–320. [PubMed:10197825]
Komssi S, Aronen HJ, Huttunen J, Kesäniemi M, Soinne L, Nikouline VV, Ollikainen M, Roine RO,Karhu J, Savolainen S, Ilmoniemi RJ. Ipsi- and contralateral EEG reactions to transcranialmagnetic stimulation. Clin Neurophysiol. 2002; 113:175–184. [PubMed: 11856623]
Kumar S, Rao SL, Chandramouli BA, Pillai SV. Reduction of functional brain connectivity in mildtraumatic brain injury during working memory. J Neurotrauma. 2009; 26:665–675. [PubMed:19331523]
Laird AR, Robbins JM, Li K, Price LR, Cykowski MD, Narayana S, Laird RW, Franklin C, Fox PT.Modeling motor connectivity using TMS/PET and structural equation modeling. Neuroimage.2008; 41:424–436. [PubMed: 18387823]
Latora V, Marchiori M. Economic small-world behavior in weighted networks. The European PhysicalJournal B - Condensed Matter. 2003; 32:249–263.
Di Lazzaro V, Ziemann U, Lemon RN. State of the art: Physiology of transcranial motor cortexstimulation. Brain Stimul. 2008; 1:345–362. [PubMed: 20633393]
Lee L, Siebner H, Bestmann S. Rapid modulation of distributed brain activity by TranscranialMagnetic Stimulation of human motor cortex. Behav Neurol. 2006; 17:135–148. [PubMed:17148833]
Leistedt SJJ, Coumans N, Dumont M, Lanquart J-P, Stam CJ, Linkowski P. Altered sleep brainfunctional connectivity in acutely depressed patients. Hum Brain Mapp. 2009; 30:2207–2219.[PubMed: 18937282]
Liang M, Zhou Y, Jiang T, Liu Z, Tian L, Liu H, Hao Y. Widespread functional disconnectivity inschizophrenia with resting-state functional magnetic resonance imaging. Neuroreport. 2006;17:209–213. [PubMed: 16407773]
Liebetanz D, Nitsche MA, Tergau F, Paulus W. Pharmacological approach to the mechanisms oftranscranial DC-stimulation-induced after-effects of human motor cortex excitability. Brain.2002; 125:2238–2247. [PubMed: 12244081]
Liepert J, Bauder H, Wolfgang HR, Miltner WH, Taub E, Weiller C. Treatment-induced corticalreorganization after stroke in humans. Stroke. 2000a; 31:1210–1216. [PubMed: 10835434]
Liepert J, Miltner WH, Bauder H, Sommer M, Dettmers C, Taub E, Weiller C. Motor cortex plasticityduring constraint-induced movement therapy in stroke patients. Neurosci Lett. 1998; 250:5–8.[PubMed: 9696052]
Liepert J, Storch P, Fritsch A, Weiller C. Motor cortex disinhibition in acute stroke. ClinNeurophysiol. 2000b; 111:671–676. [PubMed: 10727918]
Shafi et al. Page 25
Eur J Neurosci. Author manuscript; available in PMC 2013 March 1.
NIH
-PA Author Manuscript
NIH
-PA Author Manuscript
NIH
-PA Author Manuscript
Liu H, Liu Z, Liang M, Hao Y, Tan L, Kuang F, Yi Y, Xu L, Jiang T. Decreased regional homogeneityin schizophrenia: a resting state functional magnetic resonance imaging study. Neuroreport.2006; 17:19–22. [PubMed: 16361943]
Liu Y, Liang M, Zhou Y, He Y, Hao Y, Song M, Yu C, Liu H, Liu Z, Jiang T. Disrupted small-worldnetworks in schizophrenia. Brain. 2008; 131:945–961. [PubMed: 18299296]
Loo CK, Sachdev PS, Haindl W, Wen W, Mitchell PB, Croker VM, Malhi GS. High (15 Hz) and low(1 Hz) frequency transcranial magnetic stimulation have different acute effects on regionalcerebral blood flow in depressed patients. Psychol Med. 2003; 33:997–1006. [PubMed:12946084]
Lopez L, Chan CY, Okada YC, Nicholson C. Multimodal characterization of population responsesevoked by applied electric field in vitro: extracellular potential, magnetic evoked field,transmembrane potential, and current-source density analysis. J Neurosci. 1991; 11:1998–2010.[PubMed: 2066771]
Lotze M, Markert J, Sauseng P, Hoppe J, Plewnia C, Gerloff C. The role of multiple contralesionalmotor areas for complex hand movements after internal capsular lesion. J Neurosci. 2006;26:6096–6102. [PubMed: 16738254]
De Luca M, Smith S, De Stefano N, Federico A, Matthews PM. Blood oxygenation level dependentcontrast resting state networks are relevant to functional activity in the neocortical sensorimotorsystem. Exp Brain Res. 2005; 167:587–594. [PubMed: 16284751]
Lytton WW. Computer modelling of epilepsy. Nat Rev Neurosci. 2008; 9:626–637. [PubMed:18594562]
Maeda F, Keenan JP, Tormos JM, Topka H, Pascual-Leone A. Modulation of corticospinal excitabilityby repetitive transcranial magnetic stimulation. Clin Neurophysiol. 2000; 111:800–805.[PubMed: 10802449]
Manganotti P, Patuzzo S, Cortese F, Palermo A, Smania N, Fiaschi A. Motor disinhibition in affectedand unaffected hemisphere in the early period of recovery after stroke. Clin Neurophysiol. 2002;113:936–943. [PubMed: 12048054]
Martinot JL, Hardy P, Feline A, Huret JD, Mazoyer B, Attar-Levy D, Pappata S, Syrota A. Leftprefrontal glucose hypometabolism in the depressed state: a confirmation. Am J Psychiatry.1990; 147:1313–1317. [PubMed: 2399999]
Massimini M, Ferrarelli F, Huber R, Esser SK, Singh H, Tononi G. Breakdown of cortical effectiveconnectivity during sleep. Science. 2005; 309:2228–2232. [PubMed: 16195466]
Matheson SL, Green MJ, Loo C, Carr VJ. A change in the conclusions of a recent systematic meta-review: repetitive transcranial magnetic stimulation is effective for the negative symptoms ofschizophrenia. Schizophr Res. 2010; 122:276–277. [PubMed: 20558042]
Mayberg HS, Brannan SK, Tekell JL, Silva JA, Mahurin RK, McGinnis S, Jerabek PA. Regionalmetabolic effects of fluoxetine in major depression: serial changes and relationship to clinicalresponse. Biol Psychiatry. 2000; 48:830–843. [PubMed: 11063978]
Mayberg HS, Lozano AM, Voon V, McNeely HE, Seminowicz D, Hamani C, Schwalb JM, KennedySH. Deep brain stimulation for treatment-resistant depression. Neuron. 2005; 45:651–660.[PubMed: 15748841]
van Meer MPA, van der Marel K, Wang K, Otte WM, El Bouazati S, Roeling TAP, Viergever MA,Berkelbach van der Sprenkel JW, Dijkhuizen RM. Recovery of sensorimotor function afterexperimental stroke correlates with restoration of resting-state interhemispheric functionalconnectivity. J Neurosci. 2010; 30:3964–3972. [PubMed: 20237267]
Meyer BU, Röricht S, Gräfin von Einsiedel H, Kruggel F, Weindl A. Inhibitory and excitatoryinterhemispheric transfers between motor cortical areas in normal humans and patients withabnormalities of the corpus callosum. Brain. 1995; 118(Pt 2):429–440. [PubMed: 7735884]
Micheloyannis S, Pachou E, Stam CJ, Breakspear M, Bitsios P, Vourkas M, Erimaki S, Zervakis M.Small-world networks and disturbed functional connectivity in schizophrenia. Schizophr Res.2006a; 87:60–66. [PubMed: 16875801]
Micheloyannis S, Pachou E, Stam CJ, Vourkas M, Erimaki S, Tsirka V. Using graph theoreticalanalysis of multi channel EEG to evaluate the neural efficiency hypothesis. Neurosci Lett. 2006b;402:273–277. [PubMed: 16678344]
Shafi et al. Page 26
Eur J Neurosci. Author manuscript; available in PMC 2013 March 1.
NIH
-PA Author Manuscript
NIH
-PA Author Manuscript
NIH
-PA Author Manuscript

Micheloyannis S, Vourkas M, Tsirka V, Karakonstantaki E, Kanatsouli K, Stam CJ. The influence ofageing on complex brain networks: a graph theoretical analysis. Hum Brain Mapp. 2009;30:200–208. [PubMed: 17990300]
Miniussi C, Thut G. Combining TMS and EEG offers new prospects in cognitive neuroscience. BrainTopogr. 2010; 22:249–256. [PubMed: 19241152]
Mochizuki H, Huang Y-Z, Rothwell JC. Interhemispheric interaction between human dorsal premotorand contralateral primary motor cortex. J Physiol (Lond). 2004; 561:331–338. [PubMed:15459244]
Moliadze V, Zhao Y, Eysel U, Funke K. Effect of transcranial magnetic stimulation on single-unitactivity in the cat primary visual cortex. J Physiol (Lond). 2003; 553:665–679. [PubMed:12963791]
Morishima Y, Akaishi R, Yamada Y, Okuda J, Toma K, Sakai K. Task-specific signal transmissionfrom prefrontal cortex in visual selective attention. Nat Neurosci. 2009; 12:85–91. [PubMed:19098905]
Murase N, Duque J, Mazzocchio R, Cohen LG. Influence of interhemispheric interactions on motorfunction in chronic stroke. Ann Neurol. 2004; 55:400–409. [PubMed: 14991818]
Nardone R, Tezzon F. Inhibitory and excitatory circuits of cerebral cortex after ischaemic stroke:prognostic value of the transcranial magnetic stimulation. Electromyogr Clin Neurophysiol.2002; 42:131–136. [PubMed: 11977426]
Nitsche MA, Paulus W. Excitability changes induced in the human motor cortex by weak transcranialdirect current stimulation. J Physiol (Lond). 2000; 527(Pt 3):633–639. [PubMed: 10990547]
Nitsche MA, Paulus W. Sustained excitability elevations induced by transcranial DC motor cortexstimulation in humans. Neurology. 2001; 57:1899–1901. [PubMed: 11723286]
Nitsche MA, Grundey J, Liebetanz D, Lang N, Tergau F, Paulus W. Catecholaminergic consolidationof motor cortical neuroplasticity in humans. Cereb Cortex. 2004a; 14:1240–1245. [PubMed:15142961]
Nitsche MA, Jaussi W, Liebetanz D, Lang N, Tergau F, Paulus W. Consolidation of human motorcortical neuroplasticity by D-cycloserine. Neuropsychopharmacology. 2004b; 29:1573–1578.[PubMed: 15199378]
Nitsche MA, Nitsche MS, Klein CC, Tergau F, Rothwell JC, Paulus W. Level of action of cathodalDC polarisation induced inhibition of the human motor cortex. Clin Neurophysiol. 2003;114:600–604. [PubMed: 12686268]
Nitsche MA, Seeber A, Frommann K, Klein CC, Rochford C, Nitsche MS, Fricke K, Liebetanz D,Lang N, Antal A, Paulus W, Tergau F. Modulating parameters of excitability during and aftertranscranial direct current stimulation of the human motor cortex. J Physiol (Lond). 2005;568:291–303. [PubMed: 16002441]
Nowak DA, Grefkes C, Ameli M, Fink GR. Interhemispheric competition after stroke: brainstimulation to enhance recovery of function of the affected hand. Neurorehabil Neural Repair.2009; 23:641–656. [PubMed: 19531606]
O’Reardon JP, Solvason HB, Janicak PG, Sampson S, Isenberg KE, Nahas Z, McDonald WM, AveryD, Fitzgerald PB, Loo C, Demitrack MA, George MS, Sackeim HA. Efficacy and safety oftranscranial magnetic stimulation in the acute treatment of major depression: a multisiterandomized controlled trial. Biol Psychiatry. 2007; 62:1208–1216. [PubMed: 17573044]
O’Shea J, Johansen-Berg H, Trief D, Göbel S, Rushworth MFS. Functionally specific reorganizationin human premotor cortex. Neuron. 2007; 54:479–490. [PubMed: 17481399]
O’Shea J, Taylor PCJ, Rushworth MFS. Imaging causal interactions during sensorimotor processing.Cortex. 2008; 44:598–608. [PubMed: 18387592]
Pascual-Leone A, Walsh V. Fast backprojections from the motion to the primary visual area necessaryfor visual awareness. Science. 2001; 292:510–512. [PubMed: 11313497]
Pascual-Leone A, Catalá MD, Pascual-Leone Pascual A. Lateralized effect of rapid-rate transcranialmagnetic stimulation of the prefrontal cortex on mood. Neurology. 1996a; 46:499–502.[PubMed: 8614521]
Shafi et al. Page 27
Eur J Neurosci. Author manuscript; available in PMC 2013 March 1.
NIH
-PA Author Manuscript
NIH
-PA Author Manuscript
NIH
-PA Author Manuscript

Pascual-Leone A, Rubio B, Pallardó F, Catalá MD. Rapid-rate transcranial magnetic stimulation of leftdorsolateral prefrontal cortex in drug-resistant depression. Lancet. 1996b; 348:233–237.[PubMed: 8684201]
Pascual-Leone A, Valls-Solé J, Wassermann EM, Hallett M. Responses to rapid-rate transcranialmagnetic stimulation of the human motor cortex. Brain. 1994; 117(Pt 4):847–858. [PubMed:7922470]
Pascual-Leone A, Walsh V, Rothwell J. Transcranial magnetic stimulation in cognitive neuroscience--virtual lesion, chronometry, and functional connectivity. Curr Opin Neurobiol. 2000; 10:232–237. [PubMed: 10753803]
Paus T. Inferring causality in brain images: a perturbation approach. Philos Trans R Soc Lond, B, BiolSci. 2005; 360:1109–1114. [PubMed: 16087451]
Paus T, Barrett J. Transcranial magnetic stimulation (TMS) of the human frontal cortex: implicationsfor repetitive TMS treatment of depression. J Psychiatry Neurosci. 2004; 29:268–279. [PubMed:15309043]
Paus T, Castro-Alamancos MA, Petrides M. Cortico-cortical connectivity of the human mid-dorsolateral frontal cortex and its modulation by repetitive transcranial magnetic stimulation. EurJ Neurosci. 2001; 14:1405–1411. [PubMed: 11703468]
Paus T, Jech R, Thompson CJ, Comeau R, Peters T, Evans AC. Transcranial magnetic stimulationduring positron emission tomography: a new method for studying connectivity of the humancerebral cortex. J Neurosci. 1997; 17:3178–3184. [PubMed: 9096152]
Pezawas L, Meyer-Lindenberg A, Drabant EM, Verchinski BA, Munoz KE, Kolachana BS, Egan MF,Mattay VS, Hariri AR, Weinberger DR. 5-HTTLPR polymorphism impacts human cingulate-amygdala interactions: a genetic susceptibility mechanism for depression. Nat Neurosci. 2005;8:828–834. [PubMed: 15880108]
Plewnia C, Rilk AJ, Soekadar SR, Arfeller C, Huber HS, Sauseng P, Hummel F, Gerloff C.Enhancement of long-range EEG coherence by synchronous bifocal transcranial magneticstimulation. Eur J Neurosci. 2008; 27:1577–1583. [PubMed: 18336566]
Pogarell O, Koch W, Pöpperl G, Tatsch K, Jakob F, Zwanzger P, Mulert C, Rupprecht R, Möller H-J,Hegerl U, Padberg F. Striatal dopamine release after prefrontal repetitive transcranial magneticstimulation in major depression: preliminary results of a dynamic [123I] IBZM SPECT study. JPsychiatr Res. 2006; 40:307–314. [PubMed: 16259998]
Polanía R, Nitsche MA, Paulus W. Modulating functional connectivity patterns and topologicalfunctional organization of the human brain with transcranial direct current stimulation. HumBrain Mapp. 2010 DOI: 10.1002/hbm.21104.
Polanía R, Paulus W, Antal A, Nitsche MA. Introducing graph theory to track for neuroplasticalterations in the resting human brain: a transcranial direct current stimulation study.Neuroimage. 2011; 54:2287–2296. [PubMed: 20932916]
Posner MI, Raichle ME. Images of Mind. Scientific American Library. 1994Purpura DP, McMurtry JG. Intracellular activities and evoked potential changes during polarization of
motor cortex. J Neurophysiol. 1965; 28:166–185. [PubMed: 14244793]Ranganath C, Heller A, Cohen MX, Brozinsky CJ, Rissman J. Functional connectivity with the
hippocampus during successful memory formation. Hippocampus. 2005; 15:997–1005.[PubMed: 16281291]
Reijneveld JC, Ponten SC, Berendse HW, Stam CJ. The application of graph theoretical analysis tocomplex networks in the brain. Clinical Neurophysiology. 2007; 118:2317–2331. [PubMed:17900977]
Rogers BP, Morgan VL, Newton AT, Gore JC. Assessing functional connectivity in the human brainby fMRI. Magn Reson Imaging. 2007; 25:1347–1357. [PubMed: 17499467]
Romei V, Brodbeck V, Michel C, Amedi A, Pascual-Leone A, Thut G. Spontaneous fluctuations inposterior alpha-band EEG activity reflect variability in excitability of human visual areas. CerebCortex. 2008; 18:2010–2018. [PubMed: 18093905]
Rubinov M, Knock SA, Stam CJ, Micheloyannis S, Harris AWF, Williams LM, Breakspear M. Small-world properties of nonlinear brain activity in schizophrenia. Hum Brain Mapp. 2009; 30:403–416. [PubMed: 18072237]
Shafi et al. Page 28
Eur J Neurosci. Author manuscript; available in PMC 2013 March 1.
NIH
-PA Author Manuscript
NIH
-PA Author Manuscript
NIH
-PA Author Manuscript

Salvador R, Martínez A, Pomarol-Clotet E, Sarró S, Suckling J, Bullmore E. Frequency based mutualinformation measures between clusters of brain regions in functional magnetic resonanceimaging. Neuroimage. 2007; 35:83–88. [PubMed: 17240167]
Sauseng P, Klimesch W, Gerloff C, Hummel FC. Spontaneous locally restricted EEG alpha activitydetermines cortical excitability in the motor cortex. Neuropsychologia. 2009; 47:284–288.[PubMed: 18722393]
Seeley WW, Crawford RK, Zhou J, Miller BL, Greicius MD. Neurodegenerative diseases target large-scale human brain networks. Neuron. 2009; 62:42–52. [PubMed: 19376066]
Seeley WW, Menon V, Schatzberg AF, Keller J, Glover GH, Kenna H, Reiss AL, Greicius MD.Dissociable intrinsic connectivity networks for salience processing and executive control. JNeurosci. 2007; 27:2349–2356. [PubMed: 17329432]
Seminowicz DA, Mayberg HS, McIntosh AR, Goldapple K, Kennedy S, Segal Z, Rafi-Tari S. Limbic-frontal circuitry in major depression: a path modeling metanalysis. Neuroimage. 2004; 22:409–418. [PubMed: 15110034]
Sheline YI, Barch DM, Price JL, Rundle MM, Vaishnavi SN, Snyder AZ, Mintun MA, Wang S,Coalson RS, Raichle ME. The default mode network and self-referential processes in depression.Proc Natl Acad Sci USA. 2009; 106:1942–1947. [PubMed: 19171889]
Sibon I, Strafella AP, Gravel P, Ko JH, Booij L, Soucy JP, Leyton M, Diksic M, Benkelfat C. Acuteprefrontal cortex TMS in healthy volunteers: effects on brain 11C-alphaMtrp trapping.Neuroimage. 2007; 34:1658–1664. [PubMed: 17188517]
Silvanto J, Pascual-Leone A. State-dependency of transcranial magnetic stimulation. Brain Topogr.2008; 21:1–10. [PubMed: 18791818]
Silvanto J, Cattaneo Z, Battelli L, Pascual-Leone A. Baseline cortical excitability determines whetherTMS disrupts or facilitates behavior. J Neurophysiol. 2008; 99:2725–2730. [PubMed: 18337360]
Silvanto J, Lavie N, Walsh V. Stimulation of the human frontal eye fields modulates sensitivity ofextrastriate visual cortex. J Neurophysiol. 2006; 96:941–945. [PubMed: 16624999]
Slotema CW, Blom JD, Hoek HW, Sommer IEC. Should we expand the toolbox of psychiatrictreatment methods to include Repetitive Transcranial Magnetic Stimulation (rTMS)? a meta-analysis of the efficacy of rTMS in psychiatric disorders. J Clin Psychiatry. 2010 DOI: 10.4088/JCP.08m04872gre.
Speer AM, Benson BE, Kimbrell TK, Wassermann EM, Willis MW, Herscovitch P, Post RM.Opposite effects of high and low frequency rTMS on mood in depressed patients: relationship tobaseline cerebral activity on PET. J Affect Disord. 2009; 115:386–394. [PubMed: 19027962]
Speer AM, Kimbrell TA, Wassermann EM, D Repella J, Willis MW, Herscovitch P, Post RM.Opposite effects of high and low frequency rTMS on regional brain activity in depressedpatients. Biol Psychiatry. 2000; 48:1133–1141. [PubMed: 11137053]
Sporns, O. Networks of the Brain. 1st edn.. The MIT Press; 2010.Sporns O, Tononi G, Edelman GM. Theoretical neuroanatomy: relating anatomical and functional
connectivity in graphs and cortical connection matrices. Cereb Cortex. 2000; 10:127–141.[PubMed: 10667981]
Stam CJ, Dijk BW van. Synchronization likelihood: an unbiased measure of generalizedsynchronization in multivariate data sets. Phys D. 2002; 163:236–251.
Stam CJ, Reijneveld JC. Graph theoretical analysis of complex networks in the brain. NonlinearBiomed Phys. 2007; 1:3. [PubMed: 17908336]
Stam CJ, Jones BF, Nolte G, Breakspear M, Scheltens P. Small-world networks and functionalconnectivity in Alzheimer’s disease. Cereb Cortex. 2007; 17:92–99. [PubMed: 16452642]
Strogatz SH. Exploring complex networks. Nature. 2001; 410:268–276. [PubMed: 11258382]Takeuchi N, Chuma T, Matsuo Y, Watanabe I, Ikoma K. Repetitive transcranial magnetic stimulation
of contralesional primary motor cortex improves hand function after stroke. Stroke. 2005;36:2681–2686. [PubMed: 16254224]
Thut G, Pascual-Leone A. A review of combined TMS-EEG studies to characterize lasting effects ofrepetitive TMS and assess their usefulness in cognitive and clinical neuroscience. Brain Topogr.2010; 22:219–232. [PubMed: 19862614]
Shafi et al. Page 29
Eur J Neurosci. Author manuscript; available in PMC 2013 March 1.
NIH
-PA Author Manuscript
NIH
-PA Author Manuscript
NIH
-PA Author Manuscript

Thut G, Veniero D, Romei V, Miniussi C, Schyns P, Gross J. Rhythmic TMS causes local entrainmentof natural oscillatory signatures. Curr Biol. 2011; 21:1176–1185. [PubMed: 21723129]
Traversa R, Cicinelli P, Bassi A, Rossini PM, Bernardi G. Mapping of motor cortical reorganizationafter stroke. A brain stimulation study with focal magnetic pulses. Stroke. 1997; 28:110–117.[PubMed: 8996498]
Vercammen A, Knegtering H, den Boer JA, Liemburg EJ, Aleman A. Auditory hallucinations inschizophrenia are associated with reduced functional connectivity of the temporo-parietal area.Biol Psychiatry. 2010a; 67:912–918. [PubMed: 20060103]
Vercammen A, Knegtering H, Liemburg EJ, den Boer JA, Aleman A. Functional connectivity of thetemporo-parietal region in schizophrenia: effects of rTMS treatment of auditory hallucinations. JPsychiatr Res. 2010b; 44:725–731. [PubMed: 20189190]
Vincent JL, Snyder AZ, Fox MD, Shannon BJ, Andrews JR, Raichle ME, Buckner RL. Coherentspontaneous activity identifies a hippocampal-parietal memory network. J Neurophysiol. 2006;96:3517–3531. [PubMed: 16899645]
Wagner T, Valero-Cabre A, Pascual-Leone A. Noninvasive human brain stimulation. Annu RevBiomed Eng. 2007; 9:527–565. [PubMed: 17444810]
Wagner TA, Zahn M, Grodzinsky AJ, Pascual-Leone A. Three-dimensional head model simulation oftranscranial magnetic stimulation. IEEE Trans Biomed Eng. 2004; 51:1586–1598. [PubMed:15376507]
Walsh, V.; Pascual-Leone, A. Transcranial Magnetic Stimulation: A Neurochronometrics of Mind.New edition. The MIT Press; 2005.
Watts DJ, Strogatz SH. Collective dynamics of “small-world” networks. Nature. 1998; 393:440–442.[PubMed: 9623998]
Ween JE. Functional imaging of stroke recovery: an ecological review from a neural networkperspective with an emphasis on motor systems. J Neuroimaging. 2008; 18:227–236. [PubMed:18466275]
van der Werf YD, Sanz-Arigita EJ, Menning S, van den Heuvel OA. Modulating spontaneous brainactivity using repetitive transcranial magnetic stimulation. BMC Neurosci. 2010; 11:145.[PubMed: 21067612]
Whitfield-Gabrieli S, Thermenos HW, Milanovic S, Tsuang MT, Faraone SV, McCarley RW, ShentonME, Green AI, Nieto-Castanon A, LaViolette P, Wojcik J, Gabrieli JDE, Seidman LJ.Hyperactivity and hyperconnectivity of the default network in schizophrenia and in first-degreerelatives of persons with schizophrenia. Proc Natl Acad Sci USA. 2009; 106:1279–1284.[PubMed: 19164577]
Wittenberg GF, Chen R, Ishii K, Bushara KO, Eckloff S, Croarkin E, Taub E, Gerber LH, Hallett M,Cohen LG. Constraint-induced therapy in stroke: magnetic-stimulation motor maps and cerebralactivation. Neurorehabil Neural Repair. 2003; 17:48–57. [PubMed: 12645445]
Xia Y, Fan J, Hill D. Cascading failure in Watts–Strogatz small-world networks. Physica A: StatisticalMechanics and its Applications. 2010; 389:1281–1285.
Zhang D, Raichle ME. Disease and the brain’s dark energy. Nat Rev Neurol. 2010; 6:15–28. [PubMed:20057496]
Zhou Y, Liang M, Jiang T, Tian L, Liu Y, Liu Z, Liu H, Kuang F. Functional dysconnectivity of thedorsolateral prefrontal cortex in first-episode schizophrenia using resting-state fMRI. NeurosciLett. 2007; 417:297–302. [PubMed: 17399900]
Zhu, C.; Guo, X.; Wu, W.; Jin, Z.; Qiu, Y.; Zhu, Y.; Tong, S. Influence of subcortical ischemic strokeon cortical neural network; Conf Proc IEEE Eng Med Biol Soc; 2009. p. 6818-6821.
Shafi et al. Page 30
Eur J Neurosci. Author manuscript; available in PMC 2013 March 1.
NIH
-PA Author Manuscript
NIH
-PA Author Manuscript
NIH
-PA Author Manuscript

Figure 1. Network architectures and efficiency statistics(A) Different types of networks. Regular network in which nodes are connected only to theirtwo nearest neighbors on either side (left). Small world network, in which a small number oflocal connections are replaced by long-distance connections at random locations (center).Random network, in which nodes are connected at random, with a resulting loss of localconnectivity (right). (B) Global efficiency (Eglobal, solid line) and local efficiency (Elocal,dashed line) as a function of the probability of random connections.
Shafi et al. Page 31
Eur J Neurosci. Author manuscript; available in PMC 2013 March 1.
NIH
-PA Author Manuscript
NIH
-PA Author Manuscript
NIH
-PA Author Manuscript

Figure 2. Theoretical mechanisms of network pathology(A) The normal network, comprised of three densely connected local clusters, with a fewlong-range connections between clusters. (B) Loss of a node (and thus associatedconnections, dashed lines) in the top cluster. (C) A loss of connections (dashed lines)without a change in the nodes. (D) Increased connectivity (thick lines) within a local cluster(bottom right). (E) Increased local connectivity (thick line, top cluster) along with loss of along-distance connection between clusters (dashed line). These changes would result in asubstantial change in network information processing metrics (increased clusteringcoefficient and local efficiency, but also increased path length and decreased globalefficiency).
Shafi et al. Page 32
Eur J Neurosci. Author manuscript; available in PMC 2013 March 1.
NIH
-PA Author Manuscript
NIH
-PA Author Manuscript
NIH
-PA Author Manuscript

Figure 3. Generation of resting-state correlation maps(A) Seed region in the left somatomotor cortex (LSMC) is shown in yellow. (B) Timecourse of spontaneous BOLD activity recorded during resting fixation and extracted fromthe seed region. (C) Voxels significantly correlated with the extracted time course assessedusing a random effects analysis across a population of ten subjects (Z score values). Inaddition to correlations with the right somatomotor cortex (RSMC) and medial motor areas,correlations are observed with secondary somatosensory association cortex (S2), posteriornuclei of the thalamus (Th), putamen (P), and cerebellum (Cer). Reproduced withpermission from (Fox and Raichle 2007).
Shafi et al. Page 33
Eur J Neurosci. Author manuscript; available in PMC 2013 March 1.
NIH
-PA Author Manuscript
NIH
-PA Author Manuscript
NIH
-PA Author Manuscript
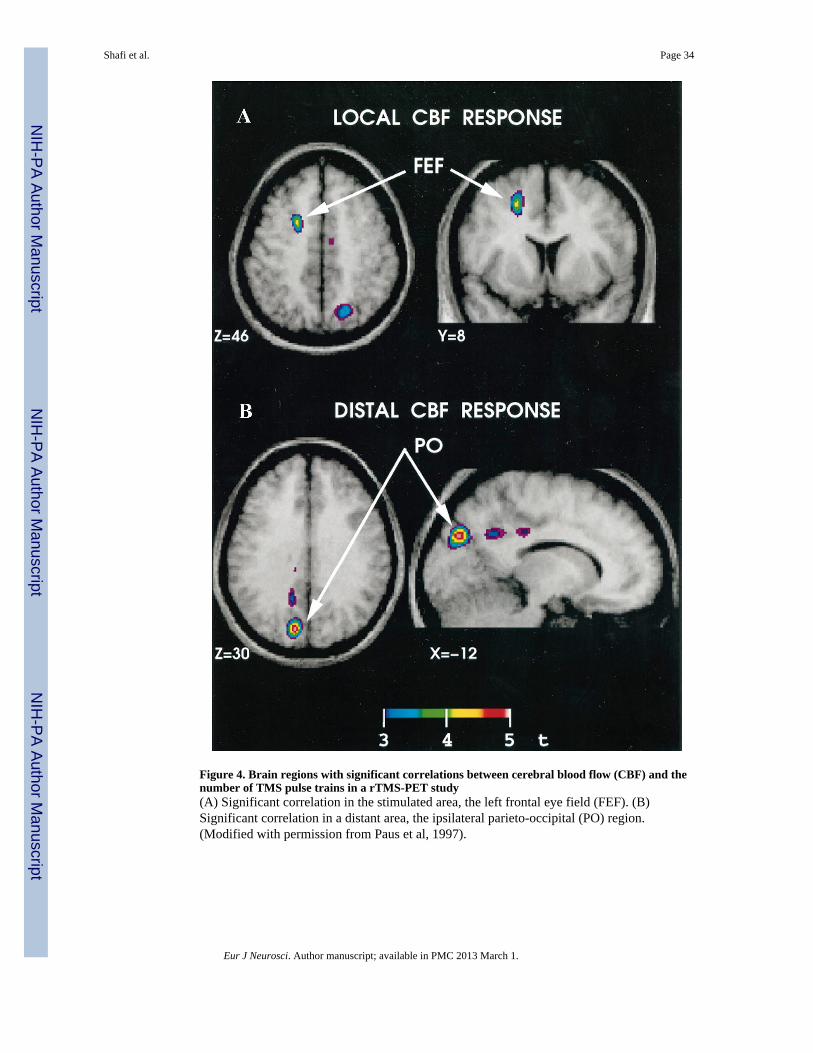
Figure 4. Brain regions with significant correlations between cerebral blood flow (CBF) and thenumber of TMS pulse trains in a rTMS-PET study(A) Significant correlation in the stimulated area, the left frontal eye field (FEF). (B)Significant correlation in a distant area, the ipsilateral parieto-occipital (PO) region.(Modified with permission from Paus et al, 1997).
Shafi et al. Page 34
Eur J Neurosci. Author manuscript; available in PMC 2013 March 1.
NIH
-PA Author Manuscript
NIH
-PA Author Manuscript
NIH
-PA Author Manuscript

Figure 5. BOLD fMRI and EEG responses to TMS(A) Bold fMRI response to rTMS of left dorsal premotor cortex. Six transverse sectionsshowing activity changes in the cingulate gyrus, ventral premotor cortex, auditory cortex,caudate nucleus, left posterior temporal lobe, medial geniculate and cerebellum. (Modifiedwith permission from Bestmann et al, 2005). (B) EEG response to single-pulse stimulationof left sensorimotor cortex. Top panels: Scalp potential with head shown as a twodimensional projection. The contour lines depict constant potentials; positive potentials arered, negative potentials are blue. Bottom panels: Current-density distributions: the calculatedcurrent-density at each time point is depicted as a percentage of the maximum current-density at that time point. For this subject, at 11 ms, the activation had spread from below
Shafi et al. Page 35
Eur J Neurosci. Author manuscript; available in PMC 2013 March 1.
NIH
-PA Author Manuscript
NIH
-PA Author Manuscript
NIH
-PA Author Manuscript

the coil center to involve the surrounding frontal and parietal cortices. Contralateralactivation emerged at 22 ms, and peaked at 24 ms. (Modified with permission from Komssiet al, 2002.)
Shafi et al. Page 36
Eur J Neurosci. Author manuscript; available in PMC 2013 March 1.
NIH
-PA Author Manuscript
NIH
-PA Author Manuscript
NIH
-PA Author Manuscript

Figure 6. Spatiotemporal TMS-evoked current maps during wakefulness and NREM sleep intwo subjectsThe black traces represent the global mean field power at each time point; when the blackline is above the horizontal yellow line, the global power of the evoked field wassignificantly higher (>6 SD) than the mean prestimulus level. For each significant timesample, maximum current sources were plotted on the cortical surface and color-codedaccording to their latency of activation (light blue, 0 ms; red, 300 ms). The yellow crossindicates the location of the TMS target on the cortical surface. (Modified with permissionfrom Massimini et al, 2005.)
Shafi et al. Page 37
Eur J Neurosci. Author manuscript; available in PMC 2013 March 1.
NIH
-PA Author Manuscript
NIH
-PA Author Manuscript
NIH
-PA Author Manuscript

Figure 7. Connectivity of left M1 hand region, based on structural equation modeling of PETdata after TMSTMS is applied to the left primary motor cortex, and blood flow changes examined withPET. The connectivity is determined using structural equation modeling in regions ofinterest based on the timing of activity changes in these different regions. The pinkconnections are the first order paths, where the TMS “signal” propagates immediately aftermotor cortex stimulation. The second-order paths, where the activity changes propagatefrom the first-order regions, are illustrated in green. The third order paths are shown in blue.Regions are as follows: LMI - Left primary sensorimotor cortex; LTHvpl - Left ventralposterolateral nucleus of the thalamus; LTHvl - Left ventral lateral nucleus of the thalamus;
Shafi et al. Page 38
Eur J Neurosci. Author manuscript; available in PMC 2013 March 1.
NIH
-PA Author Manuscript
NIH
-PA Author Manuscript
NIH
-PA Author Manuscript
LPPC = Left posterior parietal cortex; LPMv - Left ventral premotor area; Cing - Cingulategyrus; SMA - Supplementary motor area; RSII - Right secondary somatosensory Cortex;LSII - Left secondary somatosensory cortex; RTHvl - Right ventrolateral thalamus; Rcer -Right cerebellum. (Modified with permission from Laird et al, 2008)
Shafi et al. Page 39
Eur J Neurosci. Author manuscript; available in PMC 2013 March 1.
NIH
-PA Author Manuscript
NIH
-PA Author Manuscript
NIH
-PA Author Manuscript

Figure 8. Compensatory activation increases in the action selection network after left dorsalpremotor cortex rTMS1Hz (inhibitory) rTMS of left dorsal premotor cortex results in increased activation (BOLDsignal) most prominently in right dorsal premotor cortex (rPMd) and right cingulate motorarea (rCMA). Changes were also seen in the left supplementary motor area (lSMA), the leftcingulate motor area (lCMA), and right primary motor cortex (rM1). The figures show themean percent BOLD signal change (% BSC) when subjects performed the action selection(black bars) or the control action execution (white bars) tasks. Note that the TMS-inducedactivation increases occur only with action selection. (Modified with permission fromO’Shea et al, 2007).
Shafi et al. Page 40
Eur J Neurosci. Author manuscript; available in PMC 2013 March 1.
NIH
-PA Author Manuscript
NIH
-PA Author Manuscript
NIH
-PA Author Manuscript

Figure 9. Changes in cerebral blood flow after rTMS for treatment of depressionThe figure shows the significant increases in absolute regional cerebral blood flow (rCBF),relative to the pretreatment baseline, 72 hours after 2 weeks of 20-Hz rTMS at 100% ofmotor threshold over the left prefrontal cortex in a group of 10 depressed patients. Astatistical parametric map shows voxels that occur within significant clusters and is colorcoded according to their raw p value. Increases in rCBF are displayed with a red– orange–yellow color scale. The number in the top right corner of each horizontal section (top tworows) indicates its position in mm with respect to the anterior commissure (AC)–posteriorcommissure plane. Twenty-hertz rTMS resulted in widespread increases in rCBF in thefollowing regions: prefrontal cortex (L > R), cingulate gyrus (L >> R), bilateral insula, basalganglia, uncus, hippocampus, parahippocampus, thalamus, cerebellum, and left amygdale.(Modified with permission from Speer et al, 2000).
Shafi et al. Page 41
Eur J Neurosci. Author manuscript; available in PMC 2013 March 1.
NIH
-PA Author Manuscript
NIH
-PA Author Manuscript
NIH
-PA Author Manuscript

Figure 10. Changes in covariation between brain regions after rTMS treatment for auditoryhallucinations in schizophrenic patientsLow-frequency (0.9 Hz) rTMS was applied to the left temporoparietal region. The figureshows the positive (black) and negative (gray) covariation between mean FDG uptake in theleft superior temporal cortex before (A) and after (B) rTMS treatment. Before rTMS, therewas positive covariation with a large cluster consisting of the bilateral inferior, middle, andsuperior temporal gyri, parahippocampal gyrus, uncus, insula, anterior cingulate and leftfusiform gyrus. Negative covariation was seen with the right inferior parietal lobule,precuneus, postcentral and precentral gyrus, and left precentral gyrus, superior frontal gyrusand precuneus. After rTMS, the regions of both positive and negative covariation werediminished in size. (Modified with permission from Horacek et al, 2007).
Shafi et al. Page 42
Eur J Neurosci. Author manuscript; available in PMC 2013 March 1.
NIH
-PA Author Manuscript
NIH
-PA Author Manuscript
NIH
-PA Author Manuscript
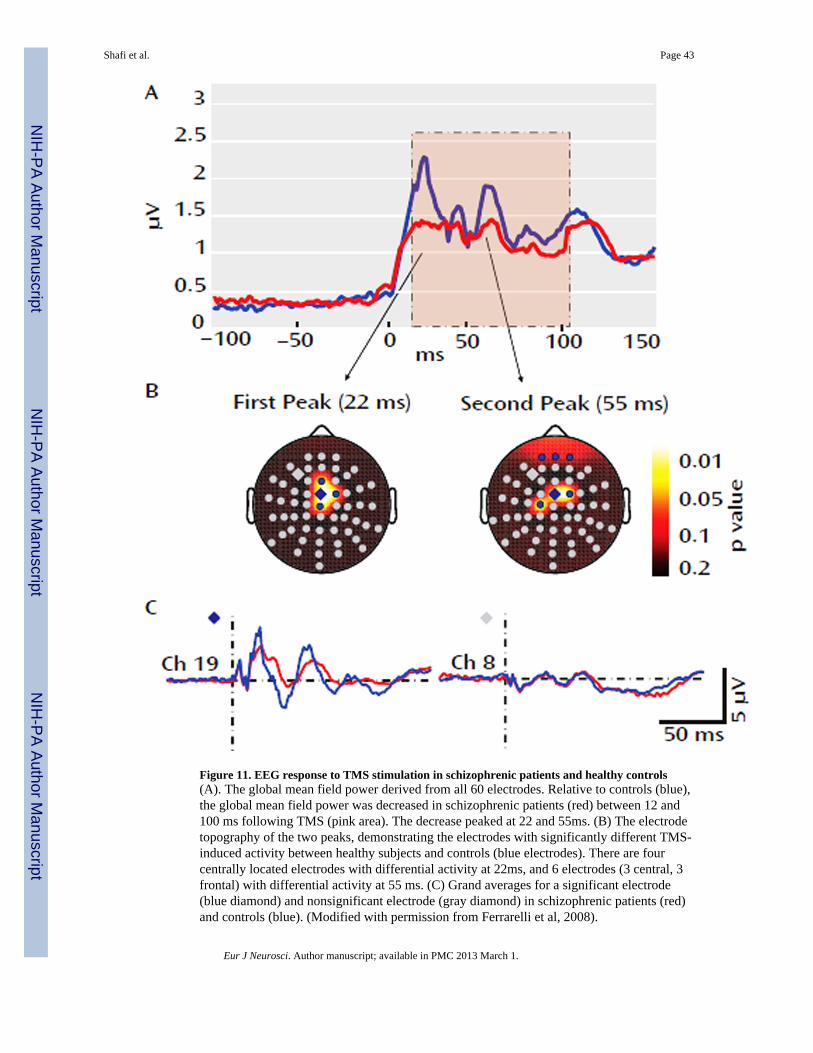
Figure 11. EEG response to TMS stimulation in schizophrenic patients and healthy controls(A). The global mean field power derived from all 60 electrodes. Relative to controls (blue),the global mean field power was decreased in schizophrenic patients (red) between 12 and100 ms following TMS (pink area). The decrease peaked at 22 and 55ms. (B) The electrodetopography of the two peaks, demonstrating the electrodes with significantly different TMS-induced activity between healthy subjects and controls (blue electrodes). There are fourcentrally located electrodes with differential activity at 22ms, and 6 electrodes (3 central, 3frontal) with differential activity at 55 ms. (C) Grand averages for a significant electrode(blue diamond) and nonsignificant electrode (gray diamond) in schizophrenic patients (red)and controls (blue). (Modified with permission from Ferrarelli et al, 2008).
Shafi et al. Page 43
Eur J Neurosci. Author manuscript; available in PMC 2013 March 1.
NIH
-PA Author Manuscript
NIH
-PA Author Manuscript
NIH
-PA Author Manuscript
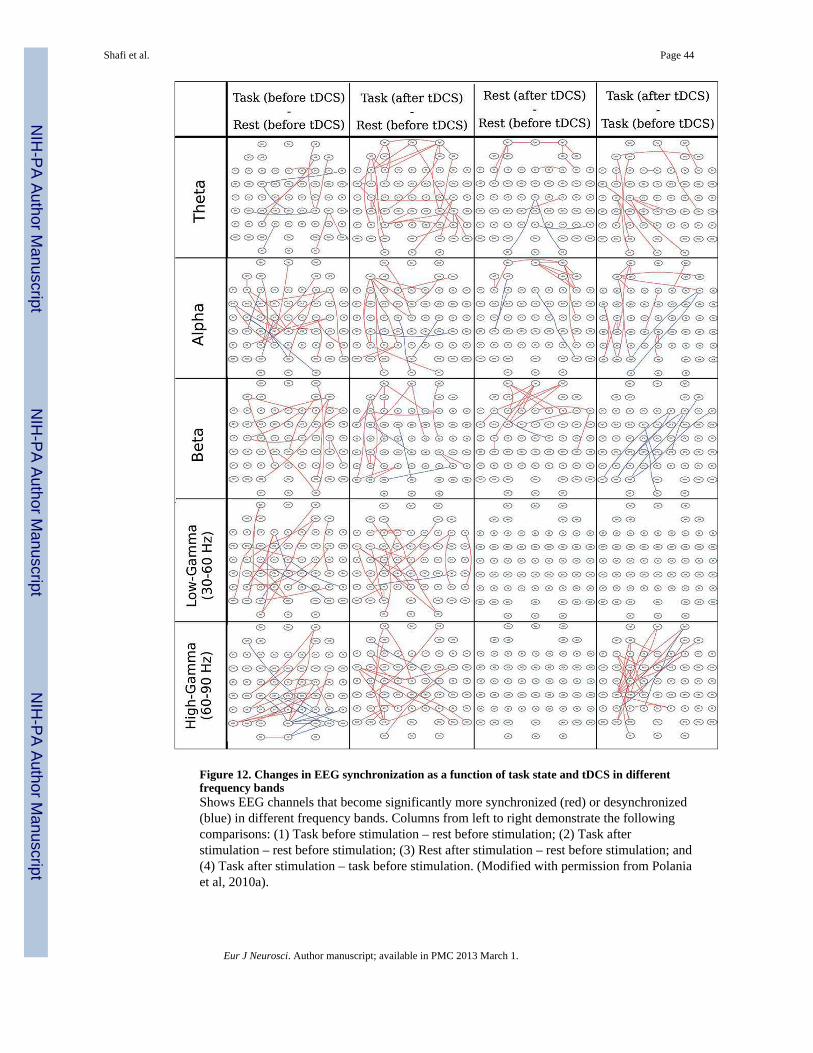
Figure 12. Changes in EEG synchronization as a function of task state and tDCS in differentfrequency bandsShows EEG channels that become significantly more synchronized (red) or desynchronized(blue) in different frequency bands. Columns from left to right demonstrate the followingcomparisons: (1) Task before stimulation – rest before stimulation; (2) Task afterstimulation – rest before stimulation; (3) Rest after stimulation – rest before stimulation; and(4) Task after stimulation – task before stimulation. (Modified with permission from Polaniaet al, 2010a).
Shafi et al. Page 44
Eur J Neurosci. Author manuscript; available in PMC 2013 March 1.
NIH
-PA Author Manuscript
NIH
-PA Author Manuscript
NIH
-PA Author Manuscript