Experiments on the entrainment of sediment into suspension by a dense bottom current
15
JOURNAL OF GEOPHYSICAL RESEARCH, VOL. 98, NO. C3, PAGES 4793-4807, MARCH 15, 1993 Experiments on the Entrainment of Sediment Into Suspension by a Dense Bottom Current MARCELO GARCIA H•ldros•lstems L•bor•tor•l, Dep•rtment of Civil Engineering, Universihl of Illinois, Urb•n• GARY PARK•,R St. Anthon•l F•lls H•ldr•ulic L•bor•tor•l, Dep•rtrnent of Civil •nd Mineral Engineering, Universiht of Minnesota, Minneapolis Experiments on the entrainment of bed sediment into suspensionby density underflows are described. The density underflows were created by allowing saline water to move as a steady, continuous current under a body of essentially stagnantfreshwater. The bed slopewasset at 0.08. Two grades of fine crushed coal, with geometric mean sizes of 100/•m and 180/•m, were placed in a trough in the bed with a length of 2 m, over which the density currents passed. Measurements of profiles of flow velocity and concentration of suspended sediment allowed for a back calculation of boundary shear stress and the rate of sediment entrainment from the equations of momentum and mass balance. Two techniques for removing the effect of form drag from the boundary shear stresswere explored. The resulting data were used to compare sediment entrainment rates due to density underflows with those observed in open channels. It appears possible to make rather modest adjustments in an existing predictive relation for sediment entrainment in open channels, so as to predict the case pertaining to density underflows as well. 1. INTRODUCTION In the narrowest sense, the research reported here is de- voted to an experimental study of sediment entrainment by dense bottom currents. The flow itself is in the form of a saline current which, being heavier than the fresh water above, is impelled down a sloping bottom. The flow exerts a shear stresson a movable bed consisting of loose, nonco- hesive fine-grained particles. This shear stresscan in turn entrain some of the sediment into suspension,thus increas- ing the density difference between the flow and the fresh water above. The relevant geometry is shownin Figure 1. The purpose of the present study is the empirical delineation of a relation for entrainment of sediment into suspension by a densitycurrent, as a function of bottom shearstress, grain size, and other parameters. The research is, however, motivated by a much broader consideration associated with marine geomorphology.The continental shelf is typically dissected by numeroussubma- rine canyons, which provide conduitsfor the delivery of shelf sediment to the deep ocean. The agent of deliveryis the tur- bidity current, which is a close relative of the dense saline bottom current. Turbidity currents thus constitute agents of transport, erosion, and deposition of sediment derived from the shelf. 'The canyons themselves are often the result of erosion due to relatively swift currents[e.g., inrnan et ai., 1976; Hag, 1987]. A mechanism by which such swift currentsmight be generated has been described by Pantin [1979], Parker [19821, Hiranoet al. [19851, Parkeret al. [19861, and Eidsvik and Brors[1989]. As the turbidity current reaches the base of the continen- Copyright 1993 by the American Geophysical Union Paper number 92JC02404. 0148-0227/93/92JC-02404505.00 tal shelf, the slope drops off and the current slows. This creates a depositional environment allowing for the forma- tion of a submarine fan. An example of a canyon-fan sys- tem is shown in Figure 2 [Nelson, 1985]. A comprehensive review of submarine fan morphology is given by Bouma et [985]. It should be clear that any mechanisticdescription of the processes which lead to the formation of such morphologic features as submarine canyons and fans must describe not only the delivery of sediment by turbidity currents, but also the erosion and deposition of sediment. The ability to erode or deposit sediment is what renders turbidity currents dif- ferent from their cousins, saline bottom flows. The latter flows are conservative as regards the agent that drives the flow. That is, the total mass of salt dissolvedin the water is conserved.In the former case,the agent that drives the flow, i.e. the sediment, is nonconservative, varying as sedimentis either entrained from or deposited onto the bed. A number of modelsare presently available which describe entrainment of sediment into and deposition from turbidity currentse.g. [Fukushiraa et al., 1985; Akiyaraa and Ste- fan, 1985; Hirano et al., 1985; and Parker et al., 1986]. The aforementioned models are based on the formulation for nonequilibrium transport of suspendedsediment intro- ducedby, for example,Parker [1978 ! and van Rijn [1984] for the case of open-channel suspensions. In the case of a two-dimensionalturbidity current carrying sedimentof uni- form size, the formulation can be stated in terms of integral balance of suspended sediment: c dz + .cdz = (lS- Here z denotes a coordinate oriented upward normal from the bed and z denotes the streamwise coordinate: u(z) and c(z) denote the streamwise flowvelocity and volume concen- tration of suspended sediment (averaged over turbulence), Cb denotes the value of c at a point z = Zbchosento be very 4793
-
Upload
independent -
Category
Documents
-
view
2 -
download
0
Transcript of Experiments on the entrainment of sediment into suspension by a dense bottom current
JOURNAL OF GEOPHYSICAL RESEARCH, VOL. 98, NO. C3, PAGES 4793-4807, MARCH 15, 1993
Experiments on the Entrainment of Sediment Into Suspension by a Dense Bottom Current
MARCELO GARCIA
H•ldros•lstems L•bor•tor•l, Dep•rtment of Civil Engineering, Universihl of Illinois, Urb•n•
GARY PARK•,R
St. Anthon•l F•lls H•ldr•ulic L•bor•tor•l, Dep•rtrnent of Civil •nd Mineral Engineering, Universiht of Minnesota, Minneapolis
Experiments on the entrainment of bed sediment into suspension by density underflows are described. The density underflows were created by allowing saline water to move as a steady, continuous current under a body of essentially stagnant fresh water. The bed slope was set at 0.08. Two grades of fine crushed coal, with geometric mean sizes of 100/•m and 180/•m, were placed in a trough in the bed with a length of 2 m, over which the density currents passed. Measurements of profiles of flow velocity and concentration of suspended sediment allowed for a back calculation of boundary shear stress and the rate of sediment entrainment from the equations of momentum and mass balance. Two techniques for removing the effect of form drag from the boundary shear stress were explored. The resulting data were used to compare sediment entrainment rates due to density underflows with those observed in open channels. It appears possible to make rather modest adjustments in an existing predictive relation for sediment entrainment in open channels, so as to predict the case pertaining to density underflows as well.
1. INTRODUCTION
In the narrowest sense, the research reported here is de- voted to an experimental study of sediment entrainment by dense bottom currents. The flow itself is in the form of
a saline current which, being heavier than the fresh water above, is impelled down a sloping bottom. The flow exerts a shear stress on a movable bed consisting of loose, nonco- hesive fine-grained particles. This shear stress can in turn entrain some of the sediment into suspension, thus increas- ing the density difference between the flow and the fresh water above. The relevant geometry is shown in Figure 1. The purpose of the present study is the empirical delineation of a relation for entrainment of sediment into suspension by a density current, as a function of bottom shear stress, grain size, and other parameters.
The research is, however, motivated by a much broader consideration associated with marine geomorphology. The continental shelf is typically dissected by numerous subma- rine canyons, which provide conduits for the delivery of shelf sediment to the deep ocean. The agent of delivery is the tur- bidity current, which is a close relative of the dense saline bottom current.
Turbidity currents thus constitute agents of transport, erosion, and deposition of sediment derived from the shelf. 'The canyons themselves are often the result of erosion due to relatively swift currents [e.g., inrnan et ai., 1976; Hag, 1987]. A mechanism by which such swift currents might be generated has been described by Pantin [1979], Parker [19821, Hirano et al. [19851, Parker et al. [19861, and Eidsvik and Brors [1989].
As the turbidity current reaches the base of the continen-
Copyright 1993 by the American Geophysical Union
Paper number 92JC02404. 0148-0227/93/92JC-02404505.00
tal shelf, the slope drops off and the current slows. This creates a depositional environment allowing for the forma- tion of a submarine fan. An example of a canyon-fan sys- tem is shown in Figure 2 [Nelson, 1985]. A comprehensive review of submarine fan morphology is given by Bouma et
[985]. It should be clear that any mechanistic description of the
processes which lead to the formation of such morphologic features as submarine canyons and fans must describe not only the delivery of sediment by turbidity currents, but also the erosion and deposition of sediment. The ability to erode or deposit sediment is what renders turbidity currents dif- ferent from their cousins, saline bottom flows. The latter flows are conservative as regards the agent that drives the flow. That is, the total mass of salt dissolved in the water is conserved. In the former case, the agent that drives the flow, i.e. the sediment, is nonconservative, varying as sediment is either entrained from or deposited onto the bed.
A number of models are presently available which describe entrainment of sediment into and deposition from turbidity currents e.g. [Fukushiraa et al., 1985; Akiyaraa and Ste- fan, 1985; Hirano et al., 1985; and Parker et al., 1986]. The aforementioned models are based on the formulation
for nonequilibrium transport of suspended sediment intro- duced by, for example, Parker [1978 ! and van Rijn [1984] for the case of open-channel suspensions. In the case of a two-dimensional turbidity current carrying sediment of uni- form size, the formulation can be stated in terms of integral balance of suspended sediment:
c dz + .c dz = (lS -
Here z denotes a coordinate oriented upward normal from the bed and z denotes the streamwise coordinate: u(z) and c(z) denote the streamwise flow velocity and volume concen- tration of suspended sediment (averaged over turbulence), Cb denotes the value of c at a point z = Zb chosen to be very
4793

4794 CI,•.½•,• AND PARKER: SEDIMENT ENTRAINMENT BY BOTTOM CURRENT
FRESH WATER
ho
•FLOW •• - Uo /'%0 zß
x'•,,,• \¾//,,• . ..- ,., ß ,, . , , , , , . . , .-.• :',"'",;;,', 'E•J:•'R'A•JE'D •blME•T ' :" '", •.• • ..... .•///--/. •: ,,; "-,,...., ,. .... .... , . , ,., '' F • "•'•--"•':-' ' '' ' •' '' "'" " " ' '* ' •xE• eE / .,•' ' •,•?•.•--" .... ' ,:-_--'- ß ' ',:-. ' • '- ' "' .... ..., /:) /x•, . ..• .•;• •;/%. {•.. ,_.-- ...- . ,. ,
""-'uU/BLE B• Fig. 1. Flow configuration considered in the experiments.
•::'v•". :'W ..... ':'••
'C:-• .NN .•iZ•D .1'URn1' DITY :'.:::..CIJI•R'ENT •
TURBIIM'TY CURREN! • HF, ET FL :'OW
near the bed, v, denotes the fall velocity of sediment, and E, denotes a dimensionless volume rate of entrainment of
sediment from the bed per unit time per unit area. This en- trainment rate is related to the near-bed upward Reynolds flux of suspended sediment as follows [Parker et al., 1986]:
,,,•, = c'w' I-=-• (2)
where c' and w' denote the fluctuating components of vol-
ume concentration and upward normal velocity associated with turbulence, and the overbar denotes averaging.
Further progress in linking the mechanics of the flow with the morphology of the structures created by erosion and de- position requires a functional formulation for the sediment entrainment rate E, . In many previous formulations, the relation for E, has simply been selected from among those available for the case of open-channel suspensions. Several
GARCIA AND PARKER.: SEDIMENT E!•,'TRAINMENT BY BOTTOM CURRENT 4795
such relations are summarized by Garcia and Parker [1991]. The hypothesis that a sediment entrainment relation known to be reasonably accurate for the case of open-channel sus- pensions might also apply to turbidity currents is plausible but unverified.
An appropriate resolution of the problem can be obtained by the direct measurement of sediment entrainment by tur- bidity currents. Such a program was attempted by Parker et al. [1987], who allowed a turbidity current driven by uniform sediment to pass over a bed of similar sediment. The differ- ence in sediment discharge between two sections was used to compute the net erosion or deposition of sediment, in turn allowing for a back-calculation of E,. Although useful re- suits were obtained, the back-calculated values of E, show a considerable degree of scatter, largely because E, was de- termined from a very small difference in sediment discharge between the two sections, and because the determination of sediment discharge itself was subject to considerable exper- imental error.
In the present study, a different technique is used, allow- ing for a much more accurate experimental determination of E,. Rather than passing a turbidity current over an erodible bed and allowing it to pick up more sediment, a conservative saline bottom current is passed over a bed only a portion of which is erodible, as shown in Figure 3. At the upstream end of the erodible zone, the discharge of suspended sediment is known to be precisely zero. A measurement of suspended sediment discharge at the downstream end alone suffices for a relatively accurate back-calculation of the average value of E, over the reach.
This method represents a compromise of sorts, because while on the one hand E, can be determined rather accu- rately, it is on the other hand possible that conservative density currents pick up sediment in a different way than turbidity currents. The leap of faith required in going from conservative dense bottom currents to true turbidity cur- rents is, however, far less than that required to go from open-channel suspensions to turbidity currents. The point is discussed in more detail below.
While the case of depositional turbidity currents has been investigated extensively in the laboratory by such re- searchers as Middleton [1967], Tesaker [1969], Lutai [1981], Siegenthaler and Buhler [1985, 1986], and Middleton and Neal [1989], very few experimental studies have focused on
the ability of turbidity currents to entrain more material from the bed [e.g., Parker et al., 1987]. As regards the case at hand, i.e., the entrainment of sediment by saline bottom currents, the authors are not aware of similar experimental studies.
2. EXPERIMENTAL APPARATUS AND PROCEDURE
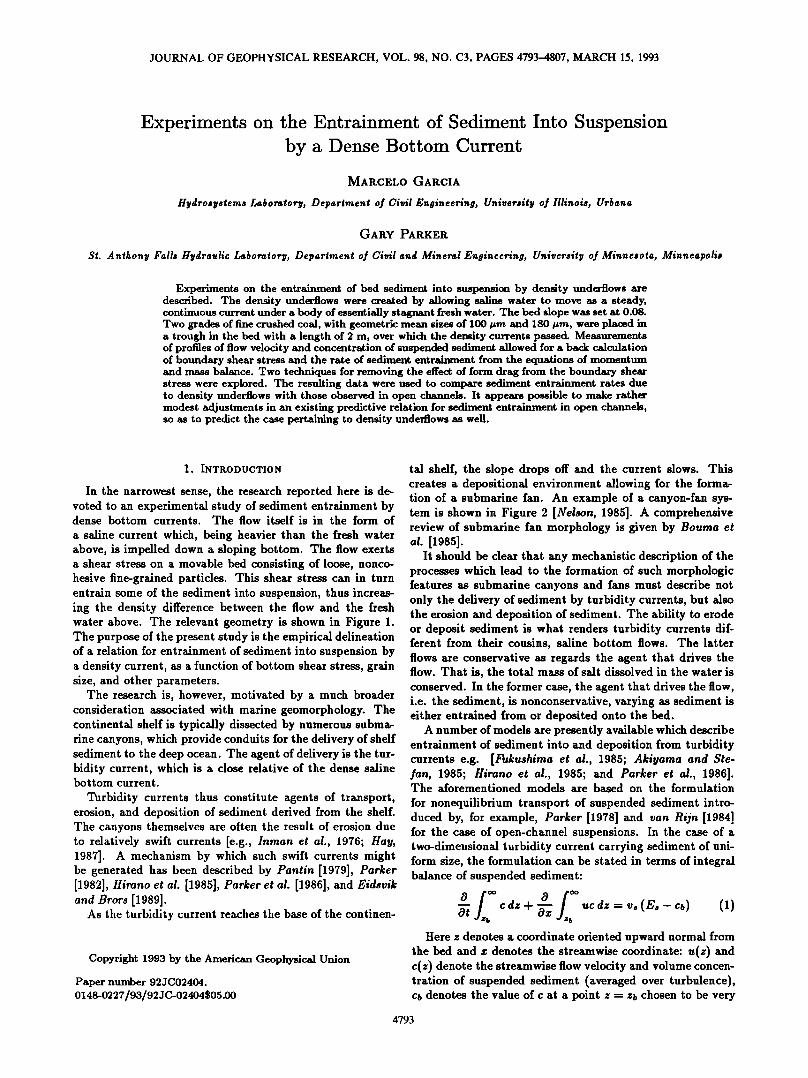
The flow configuration of the experiments is illustrated in Figure 3. The basin used to perform the experiments was 12.80 m long and 0.30 m wide, and had glass wallg which fa- cilitated flow visualization. It was kept filled with fresh wa- ter. A saline underflow was introduced into the basin from a
bottom inlet at the upstream end, where z = 0, and allowed to flow down an inerodible sloping bed with the slope fixed at 0.08 (4.6ø). This inerodible reach extended down to z = 2.00 m, beyond which was a shallow trench extending the width of the channel with a depth of 0.04 m and a length of 2.Ore. For experiments on sediment entrainment, this trench was filled with a loose, noncohesive model sediment so as to create an initial bed slope identical with that of the inerodible bed upstream. As the saline density flow passed over the erodible bed, it would be free to entrain this sed- iment into suspension. Beyond the downstream end of the trench, the 4.6 ø slope extended for 1.00 m downstream and then impinged upon a horizontal bed extending for another 6.60 m. Beyond the horizontal bed was a large tank into which the density current would debouche.
The density currents of the experiments were continuous in nature: saline water was pumped from a holding tank to the bottom inlet, and the flow maintained at a constant inlet discharge for up to an hour. The currents were supercritical on the sloping bed but were transformed into subcritical cur- rents by means of an internal hydraulic jump in the vicinity of the slope change. This hydraulic jump does not affect the flow upstream, so the flow over the erodible bed portion was always supercritical.
The holding tank at the downstream end was designed so that the saline current would fall into it, thus making the transformation from subcritical to supercritical. This artifice prevented any reflection of internal waves from the downstream end. As the saline current entrained fresh wa-
ter from above, its discharge as it entered the holding tank was larger than at the inlet. A drain at the bottom of the
SALINE WATER SUPPLY FRESH WATER SUPPLY
..... .s.-. • 1 O0
...... ,., ,.,,.., ,. -- '-. ]TANK. :']" '.""• . D•AIN
//,/////////x/////////////////////////////////////////////////•'))??///};/?j]Yj
NOT TO SCALE; DIMENSIONS ARE IN CENTIMETERS
Fig. 3. Schematic of the flume showing the erodible bed region.
4796 GARCIA AND PARKER: SEDIMENT ENTRAINMENT BY BOTTOM CURRENT
holding tank was set so as to allow the entire current dis- charge entering the holding tank to exit. Fresh water was then supplied at the top of the holding tank in order to keep the water elevation in the tank constant. It is this arrange- ment which allowed for long run times, in turn M]owing for relatively detailed experimental measurement.
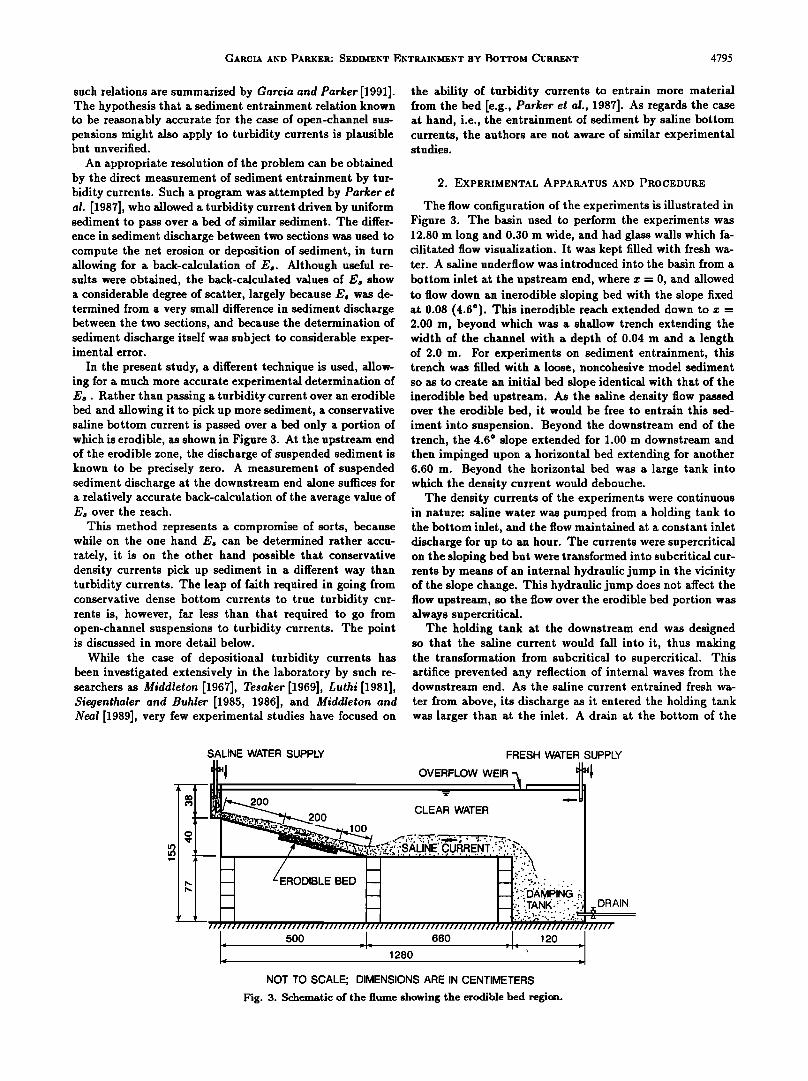
As in the case of river models, the use of lightweight model sediment was necessary to reproduce suspension at the rel- atively small scale of the experiments. Crushed coal witIt a specific gravity of 1.35 was chosen as the model material. Two grades were used: these were called "coal A" and "coal B" for the purposes of the experiments. Coal A had a geo- metric mean size D sa of 100 t•rn and a geometric standard deivation asg of 1.56; the corresponding values for coal B were 180 t•rn and 1.51, respectively. The size distributions are shown in Figure 4.
A number of preliminary experiments were conducted to determine conditions under which sediment entrainment
into suspension could be easily detected by eye. During this process, the need to generate relatively dense currents in or- der to observe sediment resuspension became apparent. The following parameters or parameter ranges refer to the main set of experiments reported here rather than the preliminary experiments.
The inlet current thickness ho was fixed at 3 cm (Figure 1). The inlet flow rate per unit width qo, given by
qo = Uoho (3)
where Uo denotes the streamwise velocity of the dense cur- rent at the inlet, was set at 33 cm2/s, except for two runs, for which it was set at 40 crn2/s. The inlet excess fractional density Ao, defined as
= pa
where p•o and pa are the density of the saline underflow at the inlet and the density of the ambient fresh water, respec- tively, was varied between 0.004 and 0.025. The buoyancy discharge per unit width •o, given by
•o = g Ao qo (5)
lOO
80 --....' ' Coal A // _ 70 -- -
60 -- -
50 -- -
40 -- -
3O -- -
20 -- -
10 -- -
0 •t-•:•.-•-'l"[•l • • • • •, 10-2 10 -• 10 o
Ds (turn) Fig. 4. Sediment size distributions of coal A and coal B.
where g denotes the acceleration of gravity, ranged from 130 crn3/s 3 to 809 crn3/s •. The inlet Richardson number Rio, given by
•o gAoho = =
varied between 0.10 and 0.61; thus all the generated currents were supercritical at the inlet.
For half of the experiments, 100- t•rn material (coal A) was used; 180-t•rn material (coal B) was used for the rest of the experiments. The current generated in each experiment was sustained for a period of time no shorter than 25 min. The experimental conditions for the different runs are tab- ulated in Table 1. The parameters Ti, and Tic in the same table refer to the temperature of the infiowing saline water and of the standing fresh water in the flume, respectively.
It was apparent in all cases that the flow attained steady state conditions within the first minute or so. The bed of the
erodible-bed section underwent erosion, but at such a slow rate that the usual quasi-steady assumption for flow over a movable bed could be invoked. Local scour associated with the transition from inerodible to erodible bed was restricted
to a zone of the order of a few centimeters. Except for this short region, the total depth of erosion realized at the end of a run was of the order of a few millimeters.
Flow velocities were measured with one of several Shi-
nozuka model SV-3 micropropellors, which have a measur- ing range of 2 cm/s to 100 cm/s and a reported accuracy of q- 10%. Profiles of suspended sediment over the erodible bed were measured with one of several Kenek model PM-206
opticM probes. These probes can be calibrated so as to mea- sure mean suspended sediment concentration as a function of an electricM signM that is proportionM to the amount of light blocked by particles in suspension as it passes between a light source and a light receiver, each with a diameter of 2 mm and separated by a gap of 10 mm. The opticM probes were found to perform adequately only when the size distri- bution of the sediment in question was relatively uniform, as was the case for coal A and coMB.
The optical probes were similarly used to measure profiles of excess density due to salt. This was done by introducing a specified amount of blue dye into the saline water of the holding tank. As the saline current entrains water due to turbulent mixing at the density interface, it can be assumed that the sMt is diluted at the same rate as the blue dye. The opticM probes could be calibrated to measure the dye strength, and thus the salinity of the flow at a point.
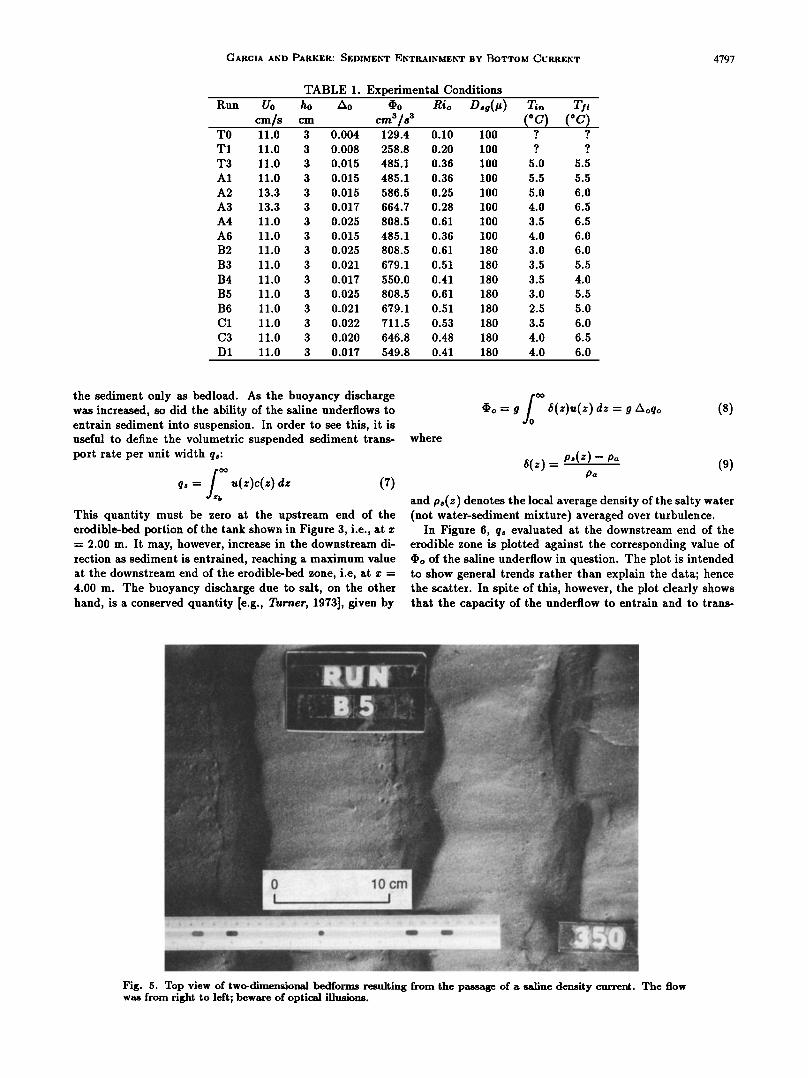
The micropropellors and the optical probes were mounted on a movable carriage to Mlow for measurement at various locations. A point gage could Mso be attached to the car- riage, allowing for the measurement of bed elevation of the erodible section. This proved to be useful in that the pas- sage of a dense underflow over a coal bed typicMly resulted in the formation of prominent current ripples, as shown in Figure 5.
More details concerning the experimentM setup are given by Garcia [1989].
3. OSSERVATIONS Or SEDIMENT ENTR, AINMENT INTO
SUSPENSION
The observations through the glass wall of the channel indicated that for low inlet buoyancy discharge •o (rela- tively light underflows) the current was capable of moving
GAI•½•A Ar,'O PAl•K•g: S•mM•r,'• Er•l•A•r•M•r,'• •Y BOttOM Cvl•g•r,'• 4797
TABLE 1. Experimental Conditions Run Uo ho Ao q)o Rio D,g(l•) Ti,-,
cm/s cm cra3/s 3 (øC) (øC) TO
T1
T3
A1
A2
A3
A4
A6
B2
B3
B4
B5
B6
C1
C3
D1
11.0 3 0.004 129.4 0.10 100 ? ?
11.0 3 0.008 258.8 0.20 100 ? ?
11.0 3 0.015 485.1 0.36 100 5.0 5.5
11.0 3 0.015 485.1 0.36 100 5.5 5.5
13.3 3 0.015 586.5 0.25 100 5.0 6.0
13.3 3 0.017 664.7 0.28 100 4.0 6.5
11.0 3 0.025 808.5 0.61 100 3.5 6.5
11.0 3 0.015 485.1 0.36 100 4.0 6.0
11.0 3 0.025 808.5 0.61 180 3.0 6.0
11.0 3 0.021 679.1 0.51 180 3.5 5.5
11.0 3 0.017 550.0 0.41 180 3.5 4.0
11.0 3 0.025 808.5 0.61 180 3.0 5.5
11.0 3 0.021 679.1 0.51 180 2.5 5.0
11.0 3 0.022 711.5 0.53 180 3.5 6.0
11.0 3 0.020 646.8 0.48 180 4.0 6.5
11.0 3 0.017 549.8 0.41 180 4.0 6.0
the sediment only as bedload. As the buoyancy discharge was increased, so did the ability of the saline underflows to entrain sediment into suspension. In order to see this, it is useful to define the volumetric suspended sediment trans- port rate per unit width q•:
= .(z)4z) dz
This quantity must be zero at the upstream end of the erodible-bed portion of the tank shown in Figure 3, i.e., at x -- 2.00 m. It may, however, increase in the downstream di- rection as sediment is entrained, reaching a maximum value at the downstream end of the erodible-bed zone, i.e, at x ---- 4.00 m. The buoyancy discharge due to salt, on the other hand, is a conserved quantity [e.g., Turner, 1973], given by
where
ß o = g ,(z).(z) dz = g ZXoqo (8)
5(z) = p•(z)- pa (9) pa
and p•(z) denotes the local average density of the salty water (not water-sediment mixture) averaged over turbulence.
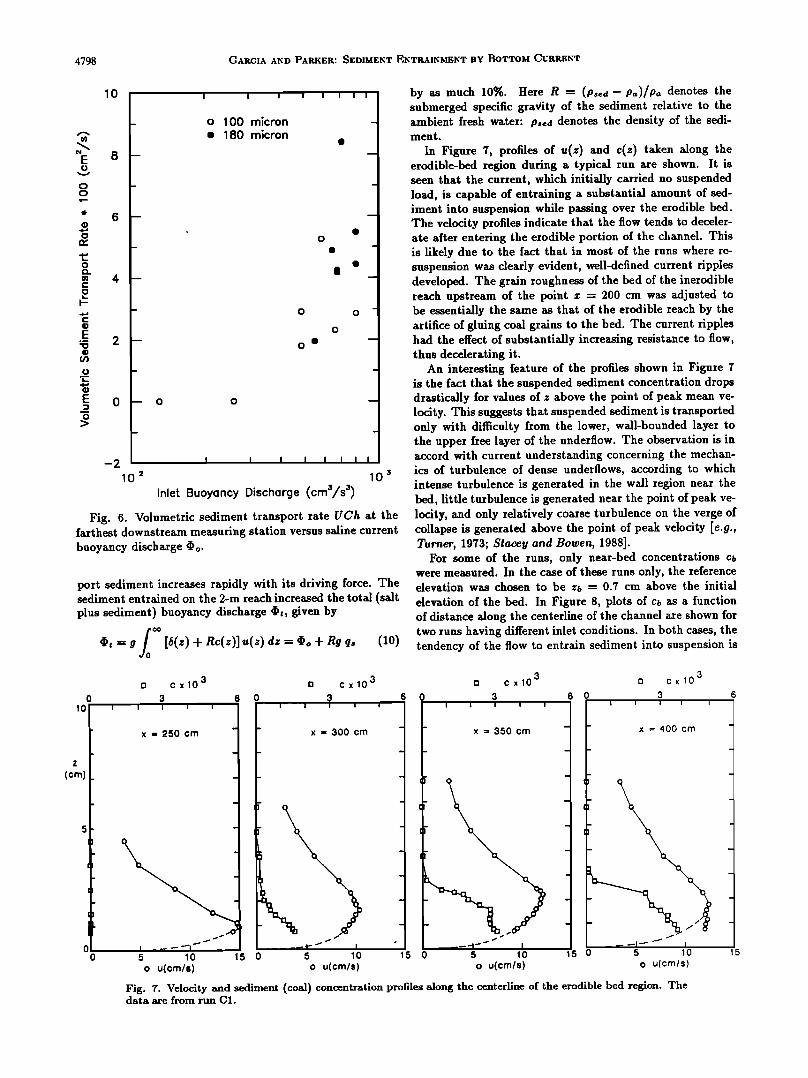
In Figure 6, q• evaluated at the downstream end of the erodible zone is plotted against the corresponding value of (I)o of the saline underflow in question. The plot is intended to show general trends rather than explain the data; hence the scatter. In spite of this, however, the plot clearly shows that the capacity of the underflow to entrain and to trans-
i '• '?:•::•, ............... ; ::i•!" •..•ii:• .
...... ...... ..•:•{.• .• • .::•: . .... ......
•:• ......
... ./.:.::,:::::.•:•.x::...?::::::•:.•'m:.•:•..m:•{•.•::.•:•?•:•...•::::'. '.'. •:•'...::•'::•.,5:•..:.....'. - *:: •-•v•-• • ..• .0 1 •--cm ••: ........... ........ -•"••... ::.::• :• ::'-•.-.• .......... . ....... .. ............. ?.:.:• ....... :.• -?-::•
I .::: :•.•:........• ...... :::• "'"?""•::• .... ..... ' . ..•...." . . . ß .:_f•'""-"•. • --•- ---- • .....
•:?.:• ?:•. ........ :::::::::::::::::::::::::::::::::::: .. .... •..:....:.::-.• .... -:.•: ..... ...-•::•.::• •...•.:.:...:•:.::•{::.-•,•:•.:•:•/• :•.: F-• ...... . ............................. :;: ............ •- - ...................................... .:• ::•::•:--:.'-•: :}:::.•-....•:•:• •.-?: .... ß •. ..................................... :-:.:•:.•.:.::.::.:•::• .................. :..:.•:...::::::..::..::•::..:. ....................................................... •?.•:•:•:.•:•:•.:::•.::::::.•:...•.:•;:•:.:`:•:::.:;:?:•::t:•;v:;::.•:•:•;::•::;.•:•::.•:•:•.::::.•.:•:•.•:.•.•.:•:•.. .-:•.•:•:•:•;•..::• .................... ............:.......•.•...........:..• ........... .•:..• •:;•:• .• ....... -:•::....,•tx•?•:::•%5•;;•?•::•:.:•:. '?•
ß .? •... ::•.• -• •.. ........ . :.•' :....•.:•...• ..... .:% ....• ::"::• • ':•: "•
Fig. 5. Top view of two-dimensional bedforms resulting from the passage of a saline density current. The flow was from right to left; beware of optical illusions.
4798 GARCIA AND PARKER: SEDIMENT F,,NTRAINMENT BY BOTTOM CURRENT
lO I I I I I I I
o o
-2
10 2
o 100 micron ß 180 micron
o
ß
o o
I I I I I I t 1
10 3
Inlet Buoyancy Discharge (cm3/s 3)
Fig. 6. Volumetric sediment transport rate UC'h at the farthest downstream measuring station versus saline current buoyancy discharge (I)o.
port sediment increases rapidly with its driving force. The sediment entrained on the 2-m reach increased the total (salt plus sediment) buoyancy discharge (I)t, given by
= g + = + q,
by as much 10%. Here R = (p,½d- Pa)/Pa denotes the submerged specific gravity of the sediment relative to the ambient fresh water: p,½d denotes the density of the sedi- ment.
In Figure 7, profiles of •(z) and c(z) taken along the erodible-bed region during a typical run are shown. It is seen that the current, which initially carried no suspended 1oaxt, is capable of entra.lning a substantial amount of sed- iment into suspension while passing over the erodible bed. The velocity profiles indicate that the flow tends to deceler- ate after entering the erodible portion of the channel. This is likely due to the fact that in most of the runs where re- suspension was clearly evident, well-defined current ripples developed. The grain roughness of the bed of the inerodible reach upstream of the point x = 200 cm was adjusted to be essentially the same as that of the erodible reach by the artifice of gluing coal grains to the bed. The current ripples had the effect of substantially increasing resistance to flow, thus decelerating it.
An interesting feature of the profiles shown in Figure 7 is the fact that the suspended sediment concentration drops drastically for values of z above the point of peak mean ve- locity. This suggests that suspended sediment is transported only with difficulty from the lower, wall-bounded layer to the upper free layer of the underflow. The observation is in accord with current understanding concerning the mechan- ics of turbulence of dense underflows, according to which intense turbulence is generated in the wall region near the bed, little turbulence is generated near the point of peak ve- locity, and only relatively coarse turbulence on the verge of co]lapse is generated above the point of peak velocity [e.g., Turner, 1973; $tace!/ and Bowen, 1988].
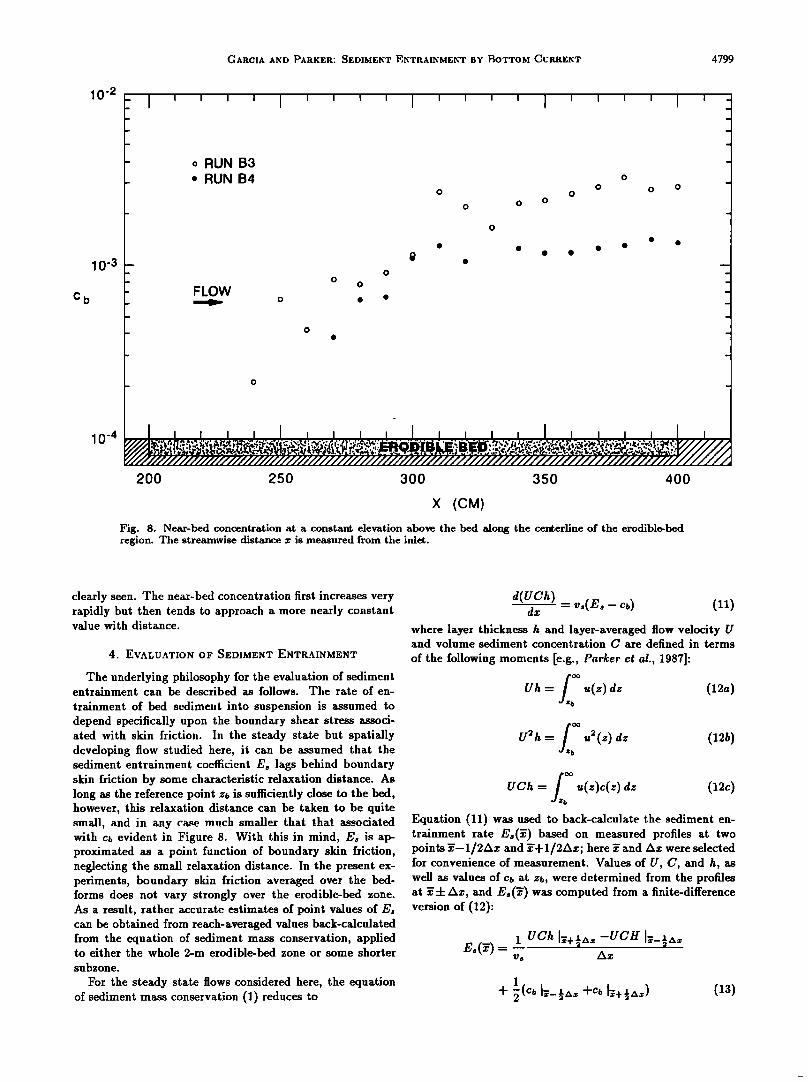
For some of the runs, only near-bed concentrations cb were measured. In the case of these runs only, the reference elevation was chosen to be zb = 0.7 cm above the initial elevation of the bed. In Figure 8, plots of c• as a function of distance along the centerline of the channel are shown for two runs having different inlet conditions. In both cases, the tendency of the flow to entrain sediment into suspension is
o c x10 3 [3 c x 10 3 [3 c x10 3 a c x 10 3 0 3 6 0 3 6 0 3 6 0 3 6
z x = 250 cm (cm) . ..
0 o u(cm/s) o u(cm/s) o u(cm/s) o u(cm/s)
Fig. 7. Velocity and sediment (coal) concentration profiles along the centerline of the erodible bed region. The data axe from run C1.
CIARCIA AND PARKER: SEDIMENT ENTRAINMENT BY BOTTOM CURRENT 4799
c b
10'2
10'3
10'4
o RUN B3 ß RUN B4
o
FLOW o
o o
1 I - I
o o o
•..L, ! ,, I I ///////////////////////4
200 250
//////////////////////////
300 350 400
X (CM)
Fig. 8. Near-bed concentration at a constant elevation above the bed aJon• the centerline of the erodible-bed region. The streamwise distance x is measured from the inlet.
clearly seen. The near-bed concentration first increases very rapidly but then tends to approach a more nearly constant value with distance.
4. EVALUATION OF SEDIMENT ENTP•AINMENT
The underlying philosophy for the evaluation of sediment entrainment can be described as follows. The rate of en-
trainment of bed sediment into suspension is assumed to depend specifically upon the boundary shear stress associ- ated with skin friction. In the steady state but spatially developing flow studied here, it can be assumed that the sediment entrainment coefficient E• lags behind boundary skin friction by some characteristic relaxation distance. As long as the reference point Zb is sufficiently close to the bed, however, this relaxation distance can be taken to be quite small, and in any ca.se much smaller that that •sociated with cb evident in Figure 8. With this in mind, E, is a? proximated as a point function of boundary skin friction, neglecting the small relaxation distance. In the present ex- periments, boundary skin friction averaged over the bed- forms does not vary strongly over the erodible-bed zone. As a result, rather accurate estimates of point values of E, can be obtained from reach-averaged values back-calculated from the equation of sediment mass conservation, applied to either the whole 2-m erodible-bed zone or some shorter
subzone.
For the steady state flows considered here, the equation of sediment mass conservation (1) reduces to
d(UCh) =v,(E --Cb) (11) where layer thickness h and layer-averaged flow velocity U and volume sediment concentration C are defined in terms
of the following moments [e.g., Parker et al., 1987]:
Uh= u(z) dz (12a)
U2h = u2(z) dz (12b)
UCh = u(z)c(z) dz (12c) b
Equation (11) was used to back-calculate the sediment en- trainment rate E•(Y) based on measured profiles at two points Y--1/2Ax and Y+I/2Ax; here Y and Ax were selected for convenience of measurement. Values of U, C, and h, as well as values of Cb at Zb, were determined from the profiles at Y :k Ax, and E•(Y) was computed from a finite-difference version of (12):
1 UCh -ugh = - v, Az
1
+ (13)
4800 GARCIA AND PARKER: SEDIMENT F, NTRAINMENT BY BOTTOM CURRENT
TABLE 2. Parameters in the Erodible Bed Region Run Reach U h Es. 10 a Cz> Cz>s Col Re u, u,s
ß T3 300-360 10.1 5.6 1.1 0.029 0.011 0.018 3757 1.72 1.05
A1 250-300 8.6 4.6 2.0 0.027 0.029 0.000 2635 1.44 1.47
A1 300-390 9.9 5.5 1.0 0.046 0.012 0.034 3663 2.12 1.07
A2 250-300 11.5 6.0 4.3 0.055 0.013 0.042 4584 2.71 1.30
A2 300-400 10.4 6.1 2.7 0.042 0.008 0.034 4250 2.13 0.92
A3 250-300 10.2 5.1 2.8 0.047 0.013 0.034 3512 2.23 1.17
A3 300-350 10.4 5.8 2.1 0.053 0.009 0.044 4014 2.40 0.99
A4 250-400 8.7 5.0 2.4 0.088 0.023 0.065 2871 2.58 1.31
B2 300-350 8.7 5.3 3.0 0.085 0.019 0.066 3068 2.53 1.20
B3 200-400 10.5 5.0 1.3 0.036 0.013 0.023 3531 2.00 1.20
B5 300-400 10.0 5.1 1.8 0.051 0.014 0.036 3400 2.25 1.20
B6 290-390 10.8 5.6 2.0 0.038 0.009 0.029 4013 2.10 1.02
C1 250-300 9.3 4.8 1.8 0.077 0.022 0.056 2942 2.57 1.35
C1 300-350 8.2 5.8 4.2 0.069 0.025 0.044 3149 2.12 1.30
C1 350-400 8.0 6.1 4.3 0.089 0.024 0.065 3274 2.39 1.25
C3 270-300 8.4 5.5 1.8 0.080 0.018 0.061 3108 2.37 1.13
C3 300-340 8.8 5.7 3.2 0.052 0.015 0.038 3351 2.03 1.08
D1 350-400 9.8 6.1 1.2 0.032 0.009 0.023 3978 1.75 0.94
Note: U and h are average values for a given reach. To compute Re = Uh/•, , a value of v = 0.015 cm2/s corresponding to a temperature of 5 ø C, is used.
The range of values of Az varied from 15 cm to 100 cm. The value of zb selected for the implementation of (13) was
0.05 h, i.e. 5% of the flow thickness. This value was chosen because it can be defined consistently and because direct measurements can usually be obtained at this level. The same cannot usually be said about values of zb taken to be much closer to the bed, e.g., 2 grain diameters above the bed or the top of the bedload layer. A conversion to these more physically based reference elevations requires auxiliary as- sumptions concerning, for example, the vertical distribution of suspended sediment concentration very near the bed and the thickness of the bedload layer. Reasonable assumptions are available for open-channel suspensions, as discussed by Garcia and Parker [1991]. They are not yet available for the underflow suspensions considered here.
The values of Es back-calculated from the measurements
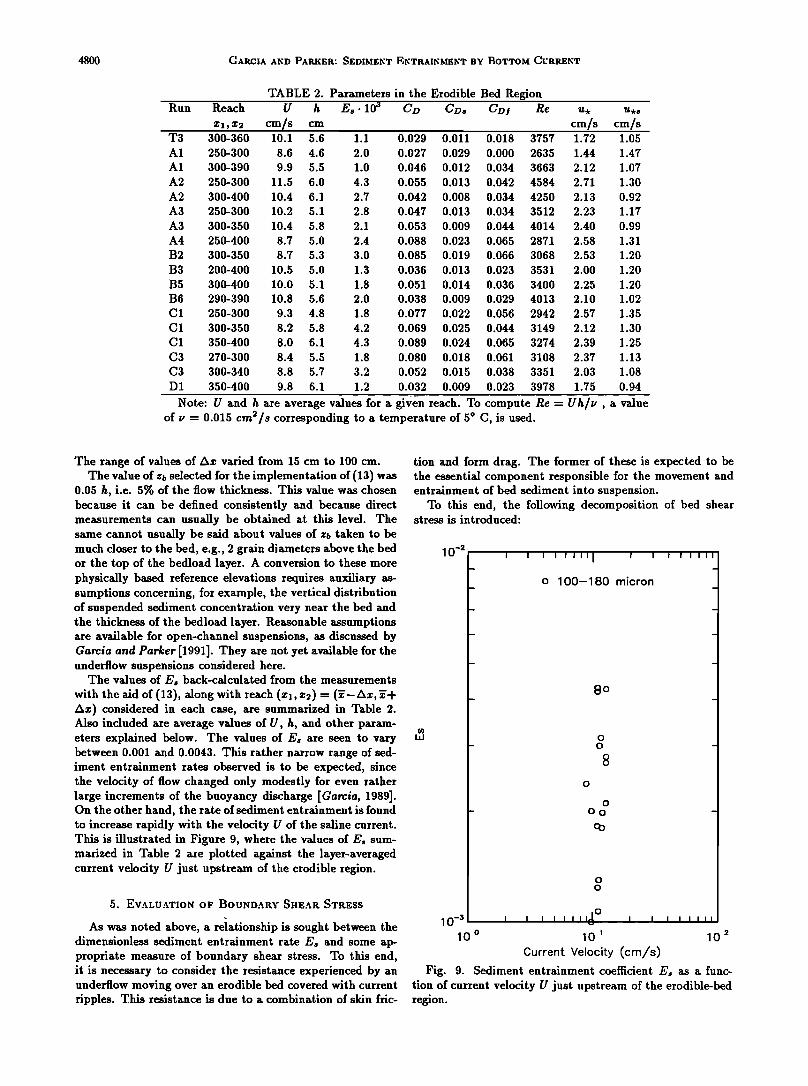
with the aid of (13), along with reach (z•, z2) = (•-Ax,•+ Az) considered in each case, are summarized in Table 2. Also included are average values of U, h, and other param- eters explained below. The values of Es are seen to vary between 0.001 and 0.0043. This rather narrow range of sed- iment entrainment rates observed is to be expected, since the velocity of flow changed only modestly for even rather large increments of the buoyancy discharge [Garcia, 1989]. On the other hand, the rate of sediment entrainment is found to increase rapidly with the velocity U of the saline current. This is illustrated in Figure 9, where the values of Es sum- marized in Table 2 are plotted against the layer-averaged current velocity U just upstream of the erodible region.
5. EVALUATION OF BOUNDAI•Y SHEAI• STI•ESS
As was noted above, a relationship is sought between the dimensionless sediment entrainment rate Es and some ap- propriate measure of boundary shear stress. To this end, it is necessary to consider the resistance experienced by an underflow moving over an erodible bed covered with current ripples. This resistance is due to a combination of skin fric-
tion and form drag. The former of these is expected to be the essential component responsible for the movement and entrainment of bed sediment into suspension.
To this end, the following decomposition of bed shear stress is introduced:
10 -2 I I i i I i II I I I
o 100-180 micron
I I I III
8O
0 0
0
o
Oo
10 -3 ' ' ' ' ' '' 'Aø ,., I I I I I III
10 o 10: 10 2 Current Velocity (cm/s)
Fig. 9. Sediment entrainment coefficient Es as a func- tion of current velocity U just upstream of the erodible-bed region.
GARCIA AND PARKER: SEDIMENT ENTRAINMENT BY BOTTOM CURRENT 4801
Here rb• denotes the portion of the bed shear stress due to skin friction, and rb! denotes the portion due to form drag. All quantires in (14) represent averages over many bedforms. The relation to be determined empirically is one between Es and r•.
The first step in implementing this is the evaluation of r•, or equivalently the shear velocity u. defined by the relation
rb -- Pa U.
A coefficient of bed friction CD can similarly be defined as 2
am = r• = u_•., (16) paU 2 U 2
In analogy to the method used to determine E•, u, and Cm can be determined by means of back-calculation with the aid of the layer-integrated momentum equation, which takes the approximate form
The values of u. and CD estimated with the aid of (18) along the erodible region are shown in Table 2. It may be inferred that the large values of am are mostly due to the presence of bedforms. Sidewall effects can be expected to be small, both because the ratio of current thickness to channel width was always of the order of 0.15 and because the walls were of smooth glass.
6. ESTIMATE OF SKIN FRICTION
The bed friction coefficient CD can be further broken up into components corresponding to skin friction and form drag. Shear velocities u,• and u,! and coefficients of bed friction CD• and CD! associated with skin friction and form drag, respectively, are defined below, in accordance with
(14): 7'bs 2
-- u.• = am, U •' (21a) P
d 2 •--•x (U h) = ghS(A + RC)
1Rgd - 5 •'-•x [(A + Re)h2]- Co U 2 (17a) In analogy to (12c), the layer-averaged fractional excess
density due to salt A in (16a) is defined using the relation
AUh = u(z)li(z)dz (17b)
The derivation of (17a), as well as the degree of approx- imation entering into it, are discussed in some detail by Parker et al. [1987]. Invoking (15) and (16), an appropriate finite-difference form of (17a) can be stated as
Cv - u• - u• U• A•
+ (18)
Here
1 [U(Y + 1 1 Az)] (19a)
and
I 1 l[+,(y+ Ax) ++,(Y- Ax)] (19b) Furthermore, •t is given by (10), which can be rewritten
in the form
½I)t = (I)o + (I)•, (20a)
where
•o = gAVh (20b)
denotes the buoyancy discharge of salt, a conserved quantity in the present experiments, and
ß • = gnCUh (20c)
is the buoyancy discharge due to suspended sediment.
p
Note that by definition
- u.! = C'v! (2lb)
Cv = Cv• + Cv! (22a)
2 2 2 (22b) u. ---- u.s -•-
An estimate of the coefficient of bed resistance due to
skin friction CD• can be obtained from an application of (18) to measurements taken at the inlet (x = 0) and at the point just before the erodible-bed regio n (x = 200 cm). Over the reach bounded by these end points, the channel bed was "painted" with the same materiM as that used for the erodible bed. Since the bed was not erodible, bedforms were absent.
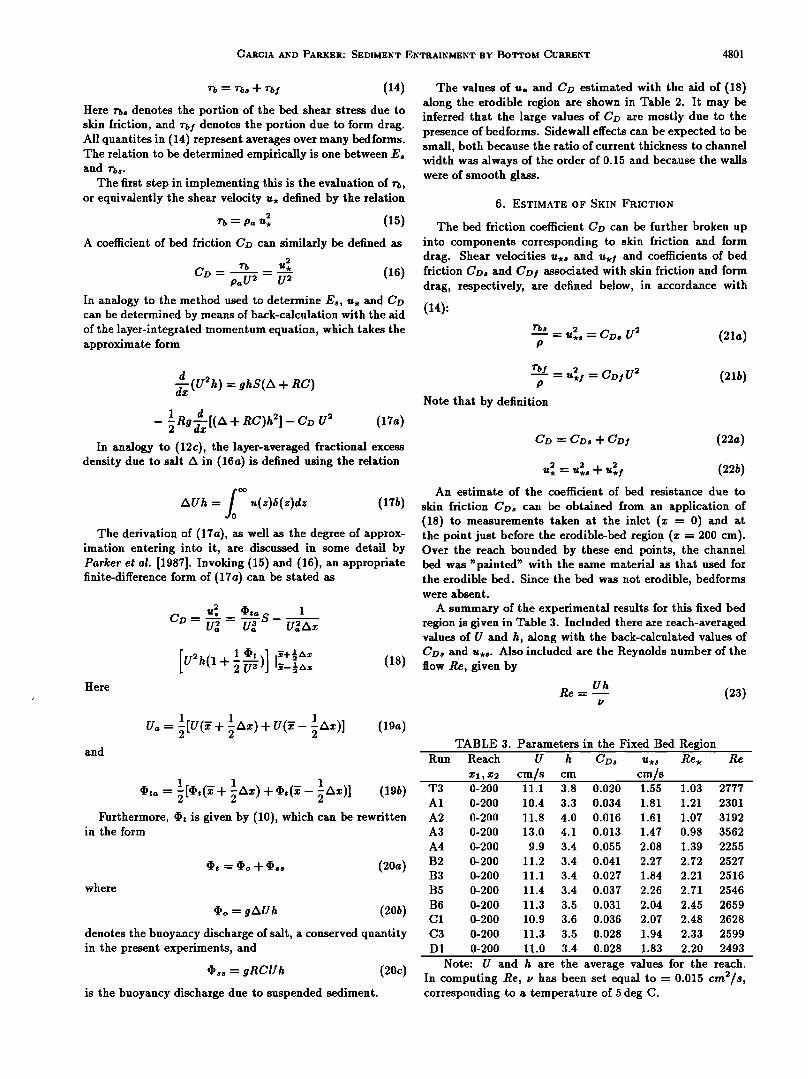
A summary of the experimental results for this fixed bed region is given in Table 3. Included there are reach-averaged values of U and h, along with the back-calculated values of CD• and u,•. Also included are the Reynolds number of the flow Re, given by
Uh Re = (23)
TABLE 3. Parameters in the Fixed Bed Region Run Reach U h CDs U.s Re. Re
x•, x• cm/s cm cm/s T3 0-200 11.1 3.8 0.020 1.55 1.03 2777
A1 0-200 10.4 3.3 0.034 1.81 1.21 2301
A2 0-200 11.8 4.0 0.016 1.61 1.07 3192
A3 0-200 13.0 4.1 0.013 1.47 0.98 .2569.
A4 0-200 9.9 3.4 0.055 2.08 1.39 2255
B2 0-200 11.2 3.4 0.041 2.27 2.72 2527
B3 0-200 11.1 3.4 0.027 1.84 2.21 2516
B5 0-200 11.4 3.4 0.037 2.26 2.71 2546
B6 0-200 11.3 3.5 0.031 2.04 2.45 2659
C1 0-200 10.9 3.6 0.036 2.07 2.48 2628
C3 0-200 11.3 3.5 0.028 1.94 2.33 2599
D1 0-200 11.0 3.4 0.028 1.83 2.20 2493
Note: U and h are the average values for the reach. In computing Re, •, has been set equal to = 0.015 cm2/s, corresponding to a temperature of 5 deg C.
4802 GARCIA AND PARKER: SEDIMENT ENTRAINMENT BY BOTTOM CURRENT
and the shear Reynolds number Re,, where
u.sks Re, -- (24)
In evaluating the shear Reynolds number, the roughness height k, has been set equal to the geometric mean size of the sediment.
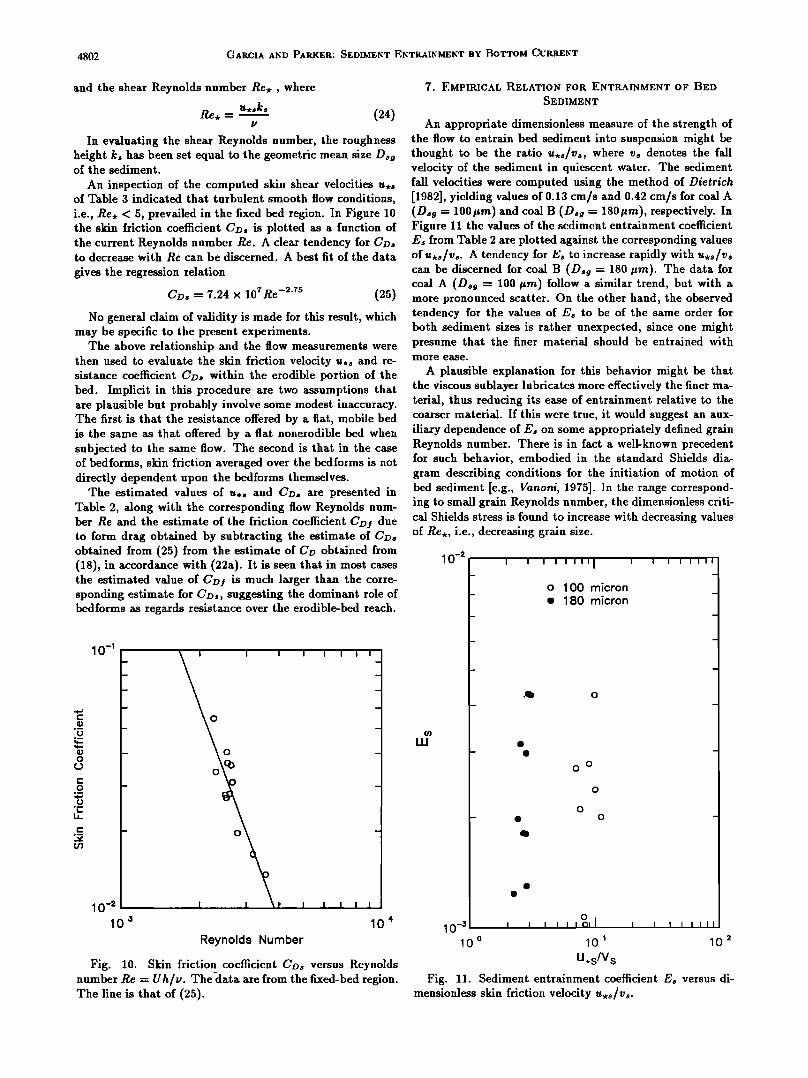
An inspection of the computed skin shear velocities u,• of Table 3 indicated that turbulent smooth flow conditions, i.e., Re, < 5, prevailed in the fixed bed region. In Figure 10 the skin friction coefficient Cv• is plotted as a function of the current Reynolds number Re. A clear tendency for to decrease with Re can be discerned. A best fit of the data
gives the regression relation
Cv• = 7.24 x 10 ?Re -2'75 (25)
No general claim of validity is made for this result, which may be specific to the present experiments.
The above relationship and the flow measurements were then used to evaluate the skin friction velocity u.• and re- sistance coefficient CD• within the erodible portion of the bed. Implicit in this procedure are two assumptions that are plausible but probably involve some modest inaccuracy. The first is that the resistance offered by a fiat, mobile bed is the same as that offered by a fiat nonerodible bed when subjected to the same flow. The second is that in the case of bedforms, skin friction averaged over the bedforms is not directly dependent upon the bedforms themselves.
The estimated values of u.• and CD• are presented in Table 2, along with the corresponding flow Reynolds num- ber Re and the estimate of the friction coefficient CD! due to form drag obtained by subtracting the estimate of CD• obtained from (25) from the estimate of CD obtained from (18), in accordance with (224). It is seen that in most cases the estimated value of CD! is much larger than the corre- sponding estimate for CD•, suggesting the dominant role of bedforms as regards resistance over the erodible-bed reach.
I I I I I I I I
0 0 -
I I •• I I I Reynolds Number
I 1
10 •
Fig. 10. Skin friction coefficient Cv• versus Reynolds number Re = Uh/v. The data are from the fixed-bed region. The line is that of (25).
7. EMPItUCAL RELATION FOt{ ENTttAINMENT OF BED
SEDIMENT
An appropriate dimensionless measure of the strength of the flow to entrain bed sediment into suspension might be thought to be the ratio u,•/v•, where v• denotes the fall velocity of the sediment in quiescent water. The sediment fall velocities were computed using the method of Dietrich [1982], yielding values of 0.13 cm/s and 0.42 cm/s for coal A (D•g = 100#m) and coal B (D• = 180#m), respectively. In Figure 11 the values of the sediment entrainment coefficient E• from Table 2 are plotted against the corresponding values of u,•/v•. A tendency for E• to increase rapidly with u,•/v• can be discerned for coal B (D• = 180 #m). The data for coal A (D• = 100 #m) follow a similar trend, but with a more pronounced scatter. On the other hand, the observed tendency for the values of E• to be of the same order for both sediment sizes is rather unexpected, since one might presume that the finer material should be entrained with more ease.
A plausible explanation for this behavior might be that the viscous sublayer lubricates more effectively the finer ma- terial, thus reducing its ease of entrainment relative to the coatset material. If this were true, it would suggest an aux- iliary dependence of E• on some appropriately defined grain Reynolds number. There is in fact a well-known precedent for such behavior, embodied in the standard Shields dia- gram describing conditions for the initiation of motion of bed sediment [e.g., Vanoni, 1975]. In the range correspond- ing to small grain Reynolds number, the dimensionless criti- cal Shields stress is found to increase with decreasing values of Re,, i.e., decreasing grain size.
10 -2 I I I I I I Ill I I I I III
o 100 micron ß 180 micron
mensionless skin friction velocity u,•/v•.
o
10-a [ I I I I lot[ I t I I i III 10 o 10 • 10 2
U.s/Vs
Fig. 11. Sediment entrainment coefficient E• versus di-

GARCIA AND PARKER: SEDIMENT ENTRAINMENT BY BOTTOM CURRENT 4803
Garcia and Parker [1991] have recently proposed a rela- tion for the entrainment of sediment into suspension for the case of open-channel flow. It is of interest to see if the data obtained here for bottom density flows bear any relation to the open-channel case.
The relation of Garcia and Parker [1991] applies to both uniform material and bed mixtures. In the case of uniform
material, it takes the form
= (26) e, where A is a constant equal to 1.3 x 10 -?,
Z• u,, 0.• (27) = Rp Vs
and
v/RgD•gDsg =
denotes a particle Reynolds number. In Figure 12 the data for the density currents is plotted
against (26), as well as the complete set of open-channel data used to determine (26). There is a partial, but not complete collapse of the density current data into the open-
channel data. It is possible that the reason for this is inher- ent in the different structures of bottom density flows and open-channel flows. Another hypothesis, that the difference is a Reynolds effect, is investigated below. The analysis, although somewhat ad hoc in nature, tends to verify the hypothesis.
In the case of the open-channel data, Rp ranges from 3.62 to 36.82 [Garcia, 1989]. In the case of coal A (Dsg = 100 pro), however, the value of Rp is 1.24; the corresponding value for coal B (D,• = 180pro) is 2.98. In order to evaluate the possibility of a Reynolds effect, the parameter Zu was generalized to the following form:
Z• = •*ø/(•) (2•) Vs
where f(Rp)is taken to equal R• '6 for Rp •_ 3.5 but may take a different form for smaller values of Rp. It was found empirically that if f(Rp) were set equal to ARp, where A is a multiplicative factor, the values A = 0.86 and A = 1.23 allowed for an excellent collapse of the density current data for coal A and coal B, respectively, into the open-channel data and (26). The collapse, shown in Figure 13, shows somewhat less scatter for the density current data than for the open-channel data. The form of f(Rp) that can be de-
10 0
L J" 10 -2
10 -3
- 0
- ß
- ß
I I I•1•'11 I ! I Open Channel Flow Density Current / 100 p. Density Current / 180 p,
o
o o
o o
o
ßß o
ß ß
ß
&
10 0
ß -2
10 -3
- 0
- ß
- ß
10-• • • ,,•,1 , • • ,•l• 10-• 10 o 10 • 10 2 10 o
Fig. 12. Plot of measured values of E, and Z,, for the density currents against (26), as well as the complete set of open-channel data used to derive it.
I I I I III I I I I I I II
Open Chonnel Flow Density Current / 100 p. Density Current / 180 p.
o o
o o
o
o o o
I
10 •
I I I I IIII
10 •
Fig. 13. Collapse of the data for density currents onto the open-channel data shown in Figure 12, using the values of A given in the text.
4804
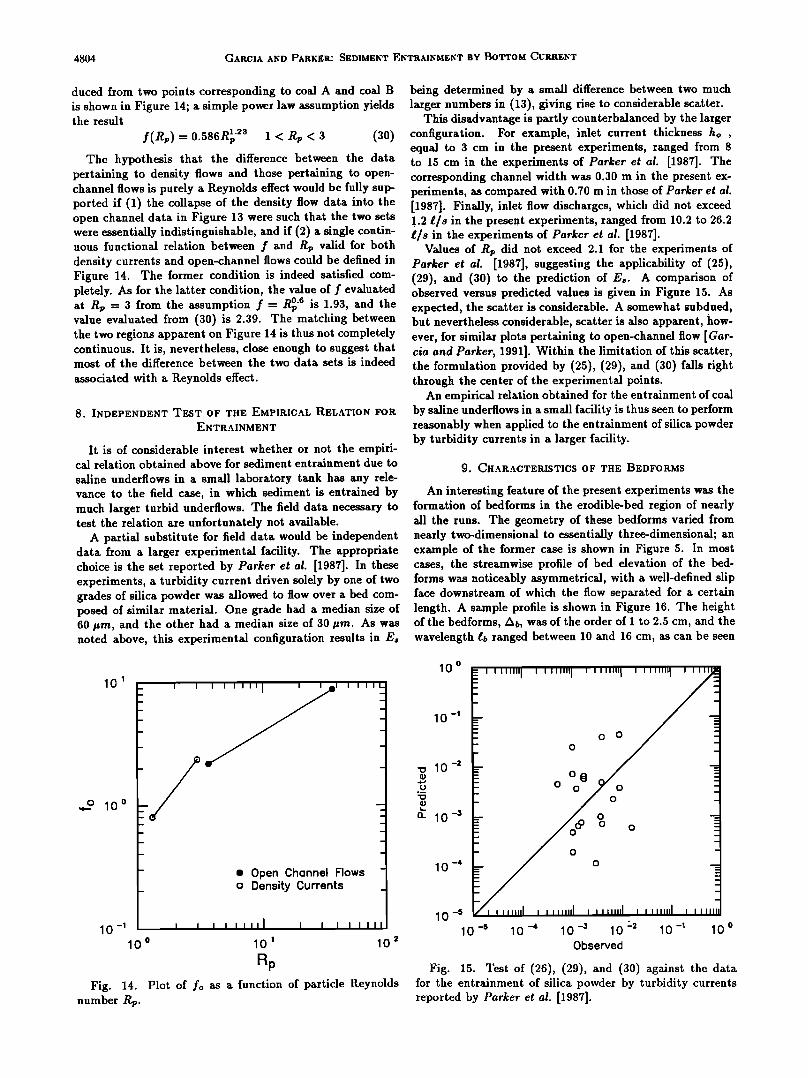
duced from two points corresponding to coal A and coal B is shown in Figure 14; a simple power law assumption yields the result
f(Rp)- 0.586R• '2s 1 < R r < S (S0) The hypothesis that the difference between the data
pertaining to density flows and those pertaining to open- channel flows is purely a Reynolds effect would be fully sup- ported if (1) the collapse of the density flow data into the open channel data in Figure 13 were such that the two sets were essentially indistinguishable, and if (2) a single contin- uous functional relation between f and Rr valid for both density currents and open-channel flows could be defined in Figure 14. The former condition is indeed satisfied com- pletely. As for the latter condition, the value of f evaluated at Rp = 3 from the assumption f = R• '6 is 1.93, and the value evaluated from (30) is 2.39. The matching between the two regions apparent on Figure 14 is thus not completely continuous. It is, nevertheless, close enough to suggest that most of the difference between the two data sets is indeed
associated with a Reynolds effect.
8. INDEPENDENT TEST OF THE EMPIl•ICAL RELATION FOl• ENTt•AINMENT
It is of considerable interest whether or not the empiri- cal relation obtained above for sediment entrainment due to saline underflows in a small laboratory tank has any rele- vance to the field case, in which sediment is entrained by much larger turbid underflows. The field data necessary to test the relation are unfortunately not available.
A partial substitute for field data would be independent data from a larger experimental facility. The appropriate choice is the set reported by Parker et al. [1987]. In these experiments, a turbidity current driven solely by one of two grades of silica powder was allowed to flow over a bed com- posed of similar material. One grade had a median size of 60/•m, and the other had a median size of 30/•m. As was noted above, this experimental configuration results in E,
being determined by a small difference between two much larger numbers in (13), giving rise to considerable scatter.
This disadvantage is partly counterbalanced by the larger configuration. For example, inlet current thickness ho , equal to 3 cm in the present experiments, ranged from 8 to 15 cm in the experiments of Parker et al. [1987]. The corresponding channel width was 0.30 m in the present ex- periments, as compared with 0.70 m in those of Parker et al. [1987]. Finally, inlet flow discharges, which did not exceed 1.2 œ]s in the present experiments, ranged from 10.2 to 26.2 œ/s in the experiments of Parker et al. [1987].
Values of R r did not exceed 2.1 for the experiments of Parker et al. [1987], suggesting the applicability of (25), (29), and (30) to the prediction of E•. A comparison of observed versus predicted values is given in Figure 15. As expected, the scatter is considerable. A somewhat subdued, but nevertheless considerable, scatter is also apparent, how- ever, for similar plots pertaining to open-channel flow [Gar- cia and Parker, 1991]. Within the limitation of this scatter, the formulation provided by (25), (29), and (30) falls right through the center of the experimental points.
An empirical relation obtained for the entrainment of coal by saline underflows in a small facility is thus seen to perform reasonably when applied to the entrainment of silica powder by turbidity currents in a larger facility.
9. CHAt•ACTEt•ISTICS OF THE BEDFOt•MS
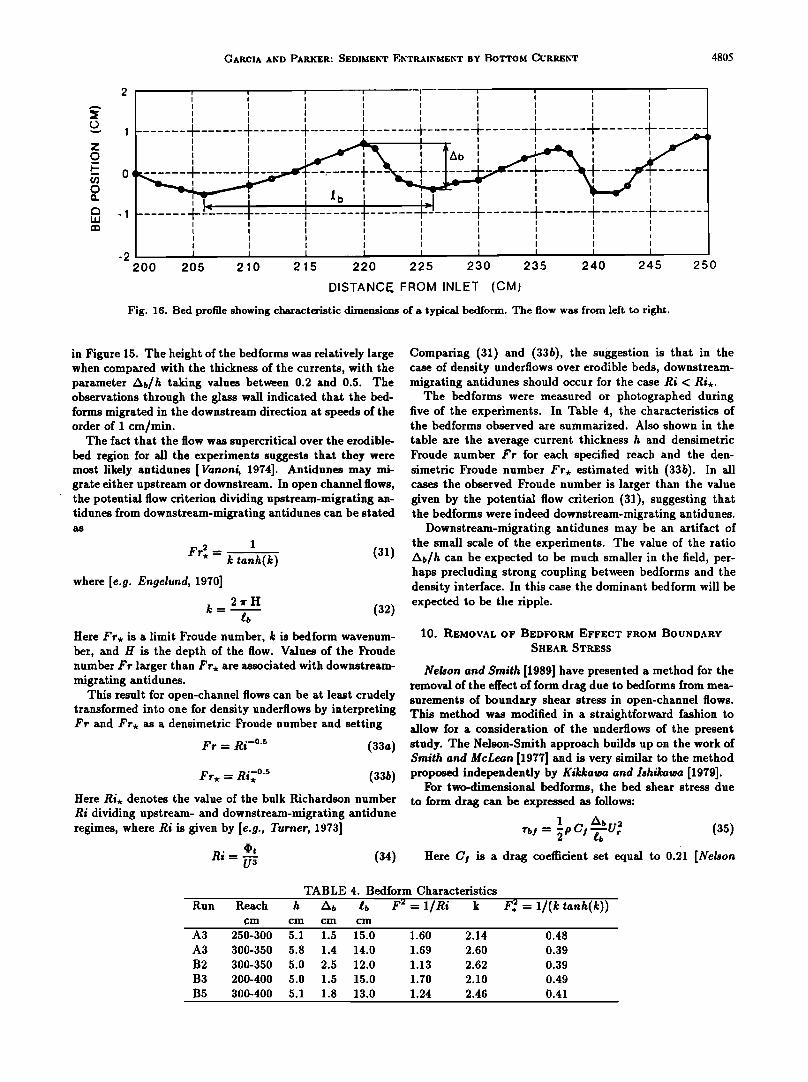
An interesting feature of the present experiments was the formation of bedforms in the erodible-bed region of nearly all the runs. The geometry of these bedforms varied from nearly two-dimensional to essentially three-dimensional; an example of the former case is shown in Figure 5. In most cases, the streamwise profile of bed elevation of the bed- forms was noticeably asymmetrical, with a well-defined slip face downstream of which the flow separated for a certain length. A sample profile is shown in Figure 16. The height of the bedforms, Ab, was of the order of 1 to 2.5 cm, and the wavelength œb ranged between 10 and 16 cm, as can be seen
10 1
o 10 o
Fig. 14. number Rp.
I I I I IlL --
--
ß Open Channel Flows - o Density Currents _
I I I I I I II] I I I I I I II
10 o 10 • 10 2
Rp Plot of fo as a function of particle Reynolds
10 0
"o 10 -2
e_ 10-•
10 4
10 -$ 10 -•
- o -
_--- 0 "=
0 --
10 -4 10 -;• 10 :-2 10-1 10 o Observed
Fig. 15. Test of (26), (29), and (30) against the data for the entrainment of silica powder by turbidity currents reported by Parker et al. [1987].
CARCIA AND PARKER: SEDIMENT ENTRAINMENT BY BOTTOM CURRENT 4805
z
-1
-2
I I
200 205 210 2 15 220 225 230 235 240 245 250
DISTANCE, FROM INLET (CM)
Fig. 16. Bed profile showing characteristic dimensions of a typical bedform. The flow was from left to right.
in Figure 15. The height of the bedforms was relatively large when compared with the thickness of the currents, with the parameter Ab/h taking values between 0.2 and 0.5. The observations through the glass wall indicated that the bed- forms migrated in the downstream direction at speeds of the order of 1 cm/min.
The fact that the flow was supercritical over the erodible- bed region for all the experiments suggests that they were most likely antidunes [Vanoni, 1974]. Antidunes may mi- grate either upstream or downstream. In open channel flows, the potential flow criterion dividing upstream-migrating an- tidunes from downstream-migrating antidunes can be stated
Fr• = 1 (31) k tanh(k)
where [e.g. Engelund, 1970] 2rH
k-- tb (32) Here Ft, is a limit Froude number, k is bedform wavenum- ber, and H is the depth of the flow. Values of the Froude number Fr larger than Ft, are associated with downstream- migrating antidunes.
This result for open-channel flows can be at least crudely transformed into one for density underflows by interpreting Fr and Ft, as a densimetric Froude number and setting
F r = Ri -ø'5 (33a)
Ft, = Ri7 ø'5 (33b) Here Ri, denotes the value of the bulk Richardson number Ri dividing upstream- and downstream-migrating antidune regimes, where Ri is given by [e.g., Turner, i973]
•' (34) Ri = U-- •.
Comparing (31) and (33b), the suggestion is that in the case of density underflows over erodible beds, downstream- migrating antidunes should occur for the case Ri < Ri,.
The bedforms were measured or photographed during five of the experiments. In Table 4, the characteristics of the bedforms observed are summarized. Also shown in the
table are the average current thickness h and densimetric Froude number Fr for each specified reach and the den- simetric Froude number Ft, estimated with (33b). In all cases the observed Froude number is larger than the value given by the potential flow criterion (31), suggesting that the bedforms were indeed downstream-migrating antidunes.
Downstream-migrating antidunes may be an artifact of the small scale of the experiments. The value of the ratio Ab/h can be expected to be much smaller in the field, per- haps precluding strong coupling between bedforms and the density interface. In this case the dominant bedform will be expected to be the ripple.
10. REMOVAL OF BEDFOaM EFFECT FItOM BOUNDAIrY
SHEAI• STI•ESS
Nelson and Smith [1989] have presented a method for the removal of the effect of form drag due to bedforms from mea- surements of boundary shear stress in open-channel flows. This method was modified in a straightforward fashion to allow for a consideration of the underflows of the present study. The Nelson-Smith approach builds up on the work of Smith and McLean [1977] and is very similar to the method proposed independently by Kikkawa and Ishikawa [1979].
For two-dimensional bedforms, the bed shear stress due to form drag can be expressed as follows:
1 Ab 2
Here C I is a drag coefficient set equal to 0.21 [Nelson
Run Reach
cm
A3
A3
B2
B3
B5
TABLE 4. Bedform Characteristics
h Ab tb F 2 = 1/Ri k cm cm cm
F. • = 1](k tanh(k))
250-300
300-350
300-350 200-400
300-400
5.1 1.5 15.0 1.60 2.14
5.8 1.4 14.0 1.69 2.60
5.0 2.5 12.0 1.13 2.62
5.0 1.5 15.0 1.70 2.10
5.1 1.8 13.0 1.24 2.46
0.48
0.39
0.39
0.49
0.41
4806 GARCIA AND PARKER: SEDIMENT ENTI•AINMENT BY BOTTOM CUI•I•ENT
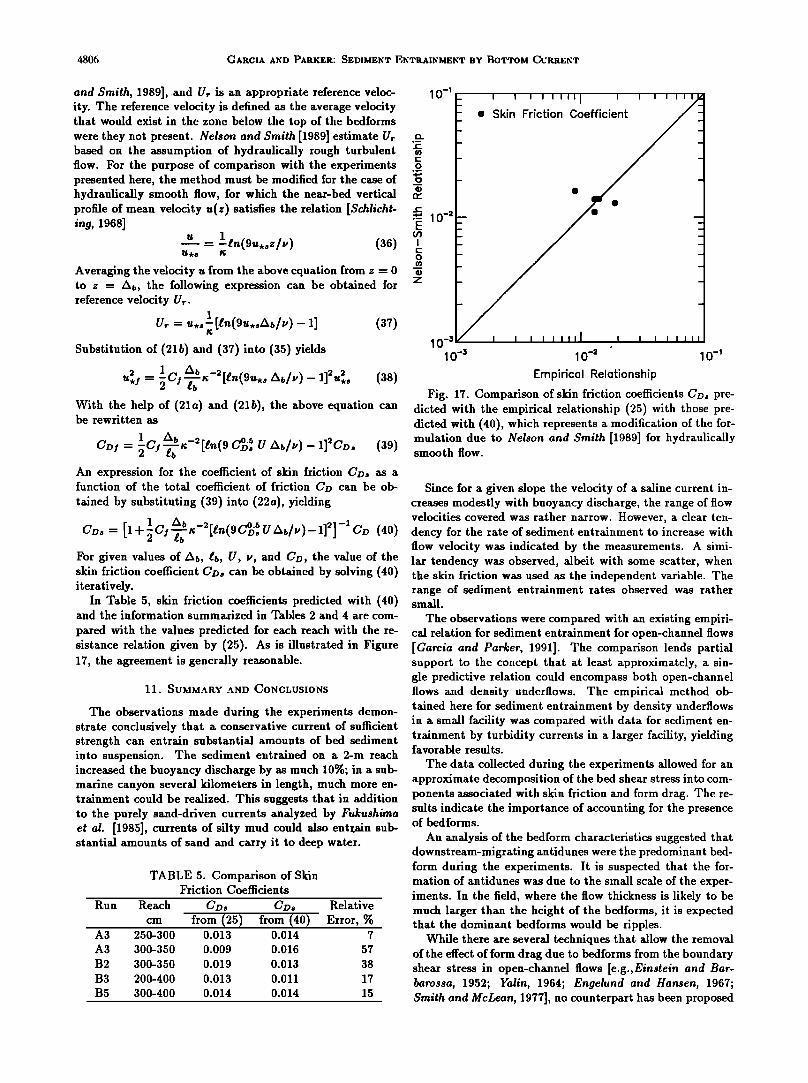
and Smith, 1989], and Ur is an appropriate reference veloc- ity. The reference velocity is defined as the average velocity that would exist in the zone below the top of the bedforms were they not present. Nelson and Smith [1989] estimate Ur based on the assumption of hydraulically rough turbulent flow. For the purpose of comparison with the experiments presented here, the method must be modified for the case of hydraulically smooth flow, for which the near-bed vertical profile of mean velocity u(z) satisfies the relation [Schlicht. ing, 1968]
u = lœn(9u,,z/•,) (36) U.s
Averaging the velocity u from the above equation from z -- 0 to z - Ab, the following expression can be obtained for reference velocity U•.
1 [tn(9u,sAb/y ) _ 1] (37) Substitution of (21b) and (37) into (35) yields
= - ..
•e rewritten •
1 A•½_•[•(9 0.• u = An expression for the coefficient of s•n friction CD• • a function of the totM coefficient of friction CD can be o•
t•ned by substituting (39) into (22a), yielding
1 A•-•[•n(9 0., u = + - For given values of •b, •b, U, •, and CD, the vMue of the s•n friction coefficient CD• can be obt•ned by solving (40) iter•tively.
In Table 5, s•n friction coefficien• predicted with (40) and the information summarized in Tables 2 and 4 are com-
pared with the values predicted for each reach with the re- sisrance relation given by (25). As is illustrated in Figure 17, the agreement is gener•ly re•onable.
11. SUMM.•r•¾ .•ND CONCLUSIONS
The observations made during the experiments demon- strate conclusively that a conservative current of sufficient strength can entrain substantial amounts of bed sediment into suspension. The sediment entrained on a 2-m reach increased the buoyancy discharge by as much 10%; in a sub- marine canyon several kilometers in length, much more trainment could be realized. This suggests that in addition to the purely sand-driven currents analyzed by Fukushima et al. [1985], currents of silty mud could also entrain sub- stantial amounts of sand and carry it to deep water.
TABLE 5. Comparison of Skin Friction Coefficients
Run Reach CDs ads Relative
cm from (25) from (40) Error, % A3 250-300 0.013 0.014 7
A3 300-350 0.009 0.016 57
B2 300-350 0.019 0.013 38
B3 200-400 0.013 0.011 17
B5 300-400 0.014 0.014 15
10 -1
• 10 -2 E
I
o
z
10 -3 10 -•
Empirical Relationship
Fig. 17. Comparison of skin friction coefficients Cvs pre- dicted with the empirical relationship (25) with those pre- dicted with (40), which represents a modification of the for- mulation due to Nelson and Smith [1989] for hydraulically smooth flow.
Since for a given slope the velocity of a saline current in- creases modestly with buoyancy discharge, the range of flow velocities covered was rather narrow. However, a clear ten- dency for the rate of sediment entrainment to increase with flow velocity was indicated by the measurements. A simi- lar tendency was observed, albeit with some scatter, when the skin friction was used as the independent variable. The range of sediment entrainment rates observed was rather small.
The observations were compared with an existing empiri- cal relation for sediment entrainment for open-channel flows [Garcia and Parker, 1991]. The comparison lends partial support to the concept that at least approximately, a sin- gle predictive relation could encompass both open-channel flows and density underflows. The empirical method ob- tained here for sediment entrainment by density underflows in a small facility was compared with data for sediment en- trainment by turbidity currents in a larger facility, yielding favorable results.
The data collected during the experiments allowed for an approximate decomposition of the bed shear stress into com- ponents associated with skin friction and form drag. The re- sults indicate the importance of accounting for the presence of bedforms.
An analysis of the bedform characteristics suggested that downstream-migrating antidunes were the predominant bed- form during the experiments. It is suspected that the for- mation of antidunes was due to the small scale of the exper- iments. In the field, where the flow thickness is likely to be much larger than the height of the bedforms, it is expected that the dominant bedforms would be ripples.
While there are several techniques that allow the removal of the effect of form drag due to bedforms from the boundary shear stress in open-channel flows [e.g.,Einstein and Bar. barossa, 1952; Yalin, 1964; Engelund and Hansen, 1967; Smith and McLean, 1977], no counterpart has been proposed
CARCIA AND PARKER: SEDIMENT ENTRAINMENT BY BOTTOM CURRENT 4807
for the case of density underflows. The Nelson-Smith for- mulation modified for smooth flow conditions provided an effective way for removing the boundary shear stress asso- ciated with bedforms. It is expected that similar results can be obtained at field scale, provided that the requisite characteristic dimensions of the bedforms are known.
Acknowledgments. This research was supported by the National Science Foundation (grants EAR-8517747 and CTS-8901598).
REFERENCES
Akiyama, J., and H. Stefan, Turbidity current with ero- sion and deposition, J. Hydraul. Eng., 111(12), 1473-1496, 1985.
Bouma, A. H., W. R. Normark, and N. E. Barnes (Eds.), Submarine Fans and Related Turbidite Systems, Springer- Verlag, New York, 1985.
Dietrich, W. E., Settling velocity of natural parti- cles, Water Resour. Res., 18(6), 1615-1626, 1982.
Eidsvik, K. J., and B. Brors, Self-accelerated turbidity current prediction based upon (k-e) turbulence, Cont. Shelf Res., 9(7), 617-622, 1989.
Einstein, H. A., and N. Barbarossa, River channel rough- ness, Trans. Am. Soc. Civ. Eng., 117, 1121-1146, 1952.
Engelund, F., Instability of erodible beds, J. Fluid Mech., 4œ, 225-244, 1970.
Engelund, F., and E. Hansen, A monograph on sediment transport in alluvial streams, Teknisk Vorlag, Copenhagen, 1967.
Fukushima, Y., G. Parker, and H. Pantin, Prediction of ignitive turbidity currents in Scripps submarine canyon, Mar. Geol., 67, 55-81, 1985.
Garcia, M. H., Depositing and eroding sediment-driven flows: Turbidity currents, Ph.D. thesis, Univ. of Minn., Minneapolis, 1989.
Garcia, M. H., and G. Parker, Entrainment of bed sed- iment into suspension, J. Hydraul. Eng., I17(4), 414-435, 1991.
Hay, A. E., Turbidity currents and submarine channel formation in Rupert Inlet, British Columbia, 1, Surge ob- servations, J. Geophys. Res., 9œ(C3), 2875-2881, 1987.
Hirano, M., K. Hadano, and T. Matsuo, Motion of the head of a gravity current with pick up and deposition of par- ticles, J. Seclimentol. Soc. Jpn., Special Issue, 8-15, 1985.
Inman, D. L., C. E. Nordstrom, and R. E. Flick, Currents in submarine canyons: An air-sea-land interaction, Annu. Rev. Fluid Mech., 275-310, 1976.
Kikkawa, H., and T. Ishikawa, Resistance of flow over dunes and ripples, Trans. Jpn: S_oc. Civ. Eng., 11, 123- 125, 1979.
Luthi, S., Experiments on non-channelized turbidity cur- rents and their deposits, Mar. Geol., •0, 59-68, 1981.
Middleton, G. V., Experiments on density and turbidity currents, III., Deposition of sediment, Can. J. Earth Sci., 4{, 475-505, 1967.
Middleton, G. V., and W. J. Neal, Experiments on the thickness of beds deposited by turbidity currents. J. Sedi- ment. Petrol., 59(2), 297-307, 1989.
Nelson, C. H., Astoria Fan, Pacific Ocean, in Submarine Fans and Related Turbidite Systems, edited by A. H. Bouma, W.R. Normark, and N. E. Barnes, pp. 45-50, Springer- Verlag, New York, 1985.
Nelson, J. M., and J. D. Smith, Flow in meandering chan- nels with natural topography, in River Meandering, Water Resour. Monogr. Set., Vol. 12, edited by S. Ikeda and G. Parker, pp. 69-102, AGU, Washington, D.C., 1989.
Pantin, H. M., Interaction between velocity and effective density in turbidity flow: Phase-plane analysis, with criteria for autosuspension, Mar. Geol., 31, 59-99, 1979.
Parker, G., Self-formed straight rivers with equilibrium banks and mobile bed, 1, The sand-silt river, J. Fluid Mech., 89, 109-125, 1978.
Parker, G., Conditions for the ignition of catastrophically erosive turbidity currents, Mar. Geol., •6, 307-327, 1982.
Parker, G., Y. Fukushima, and H. Pantin, Self- accelerating turbidity currents, J. Fluid Mech., 171, 145- 181, 1986.
Parker, G., M. Garcia, Y. Fukushima, and W. Yu, Experi- ments on turbidity currents over an erodible bed, J. Hydraul. Res., œ5(1), 123-147, 1987.
Schlichting, H., Boundary Layer Theory, 6th ed., McGraw-Hill, New York, 1968.
Siegenthaler, C., and J. Buhler, The kinematics of tur- bulent suspension currents (turbidity currents) on inclined boundaries, Mar. Geol., 6•, 19-40, 1985.
Siegenthaler, C., and J. Buhler, The reconstruction of the paleo-slope of turbidity currents, based on simple hydrome- chanical parameters of the deposit, Acta Mech., 63, 235-244, 1986.
Smith, J. D., and S. R. McLean, Spatially averaged flow over a wavy surface, J. Geophys. Res., 8œ(12), 1735-1746, 1977.
Stacey, M. W., and A. J. Bowen, The vertical structure of density and turbidity currents: Theory and observations, J. Geophys. Res., 93(C4), 3528-3542, 1988.
Tesaker, E., Uniform turbidity currents, doctoral thesis, Tech. Univ. of Norway, Trondheim, 1969.
Turner, J. S., Boundary Effects in Fluids, Cambridge Uni- versity Press, Cambridge, U.K., 1973.
Van Rijn, L. C., Sediment transport, II, Suspended load transport, J. Hydraul. Eng., II0(11), 1613-1641, 1984.
Vanoni, V. A., Factors determining bed forms of alluvial streams, J. Hydraul. Div., Am. Soc. Civil Eng., 100(3), 363-377, 1974.
Vanoni, V. A., Sedimentation Engineering, Am. Soc. Civil Eng., New York, 1975.
Yalin, S., On the average velocity of flow over a movable bed, Houille Blanche, 6•, 45-51, 1964.
Civil Engineering, University of Illinois, Urbana, IL 61801. G. Parker, St. Anthony Falls Hydraulic Laboratory, De-
partment of Civil and Mineral Engineering, University of Minnesota, Minneapolis, MN 55414.
(Received March 5, 1992; revised September 4, 1992;
accepted September 8, 1992.