Hydrometeorological threshold conditions for debris flow ...
Upload
independentCategory
view
0download
0
Ecology, 95(6), 2014, pp. 1451–1457� 2014 by the Ecological Society of America
Experimenting with ecosystem interaction networks in searchof threshold potentials in real-world marine ecosystems
SIMON F. THRUSH,1,2,9 JUDI E. HEWITT,1 SAMANTHA PARKES,1 ANDREW M. LOHRER,1 CONRAD PILDITCH,3
SARAH A. WOODIN,4 DAVID S. WETHEY,4 MARIACHIARA CHIANTORE,5 VALENTINA ASNAGHI,5 SILVIA DE JUAN,1
CASPER KRAAN,1 IVAN RODIL,1 CANDIDA SAVAGE,6,8 AND CARL VAN COLEN7
1National Institute of Water and Atmospheric Research, P.O. Box 11-115, Hillcrest, Hamilton 3251 New Zealand2Institute of Marine Science, University of Auckland, Private Bag 92019, Auckland 1142 New Zealand
3Department of Biological Sciences, University of Waikato, Hamilton 3216 New Zealand4Department of Biological Sciences, University of South Carolina, 715 Sumter Street, Columbia, South Carolina 29208 USA
5Universita degli Studi di Genova (DiSTAV), Corso Europa 26, Genova 16132 Italy6Department of Marine Science, University of Otago, P.O. Box 56, Dunedin 9054 New Zealand
7Marine Biology Section, Biology Department, Ghent University, Krijgslaan 281-S8, Ghent 9000 Belgium8Marine Research Institute, University of Cape Town, Private Bag, Rondebosch, South Africa
Abstract. Thresholds profoundly affect our understanding and management of ecosystemdynamics, but we have yet to develop practical techniques to assess the risk that thresholds willbe crossed. Combining ecological knowledge of critical system interdependencies with a large-scale experiment, we tested for breaks in the ecosystem interaction network to identifythreshold potential in real-world ecosystem dynamics. Our experiment with the bivalvesMacomona liliana and Austrovenus stutchburyi on marine sandflats in New Zealanddemonstrated that reductions in incident sunlight changed the interaction network betweensediment biogeochemical fluxes, productivity, and macrofauna. By demonstrating loss ofpositive feedbacks and changes in the architecture of the network, we provide mechanisticevidence that stressors lead to break points in dynamics, which theory predicts predispose asystem to a critical transition.
Key words: Austrovenus stutchburyi; bifurcations; bivalves; break points; ecosystem dynamics;Macomona liliana; Manukau Harbour, New Zealand; marine sandflats; thresholds; turbidity.
INTRODUCTION
Many changes in ecological systems are abrupt,
profoundly limiting our understanding of ecosystem
dynamics, and our ability to predict changes and cope
with the consequences (Carpenter et al. 2001, Scheffer et
al. 2001). Concern about crossing regional- and global-
scale thresholds underscores the need to better define the
risk of tipping an ecosystem into ecologically and
socioeconomically unfavorable states (Brook et al.
2013). Theories of how critical transitions lead to
threshold change in ecological systems have progressed
rapidly, but empirical support is patchy and often
focused on specific systems, restricting generality (Kefi
et al. 2013).
A number of techniques have been developed to
identify the statistical properties of time series or spatial
patterns that precede thresholds (Dakos et al. 2012,
Scheffer et al. 2012). These techniques represent a valid
way of ranking different systems in terms of their
predisposition to approaching and crossing thresholds,
but for real-world ecosystems, this requires significant
investment in high-frequency monitoring that is gener-
ally uncommon (Hewitt and Thrush 2010, Lindegren et
al. 2012). Consequently, alternative and complementary
approaches are needed to inform decisions about the
risk of upcoming transitions in ecosystems and change
in ecosystem functionality and value.
The only way to conclusively detect a threshold is to
cross it (Carpenter et al. 2001). Such a shift may result
from excessive environmental forcing, the functional
extinction or invasion of species, but may also occur well
below these limits due to changes in the architecture of
interaction networks that connect the biological, chem-
ical, and physical components in the ecosystem (Scheffer
et al. 2001). The loss of positive feedbacks is particularly
important in shifting the system into a fundamentally
different state (Scheffer et al. 2012). Such shifts in the
architecture of ecosystem interaction networks have
been detected along environmental gradients, suggesting
the potential for critical transitions (Thrush et al. 2012).
Whole-lake experimental manipulations have provided
empirical evidence of the importance of positive
feedbacks and regime shifts (Carpenter 2003). However,
questions remain as to whether we can experimentally
manipulate an open and dynamic marine system to
Manuscript received 9 October 2013; revised 6 January 2014;accepted 27 February 2014. Corresponding Editor: P. T.Raimondi.
9 Present address: Institute of Marine Science, Universityof Auckland, Private Bag 92019, Auckland 1142 NewZealand. E-mail: [email protected]
1451
Rep
orts
demonstrate changes in interaction networks and the
loss of positive feedbacks. We provide a path to addresscritical transitions that facilitate a formal linkagebetween empirical and theoretical study of ecosystem
dynamics. As predicted by theoretical studies, ourexperiment demonstrates that stress-induced changes in
ecosystem interaction networks can occur in real-worldecosystems, and this allows us to determine whether ornot a specific ecosystem is predisposed to undergo
transitions. Such empirical demonstration helps toground theory and provide real-world advice to supportmanagers, policy makers, and society about the limits to
resilience of ecosystems under change.There is a long history of ecological experimentation
in marine systems, with early recognition of the role of
interactions among species and disturbance influencingcommunity dynamics (Dayton 1971, Woodin 1978).
New analytical techniques allow us to assess the strengthof both direct and indirect effects, define the architectureof interaction networks, and assess its validity relative to
empirical data (Grace et al. 2012). Structured equation
models (SEMs) allow us to integrate causal and
exploratory techniques, beginning with the development
of a conceptual model supported by empirical evidence.
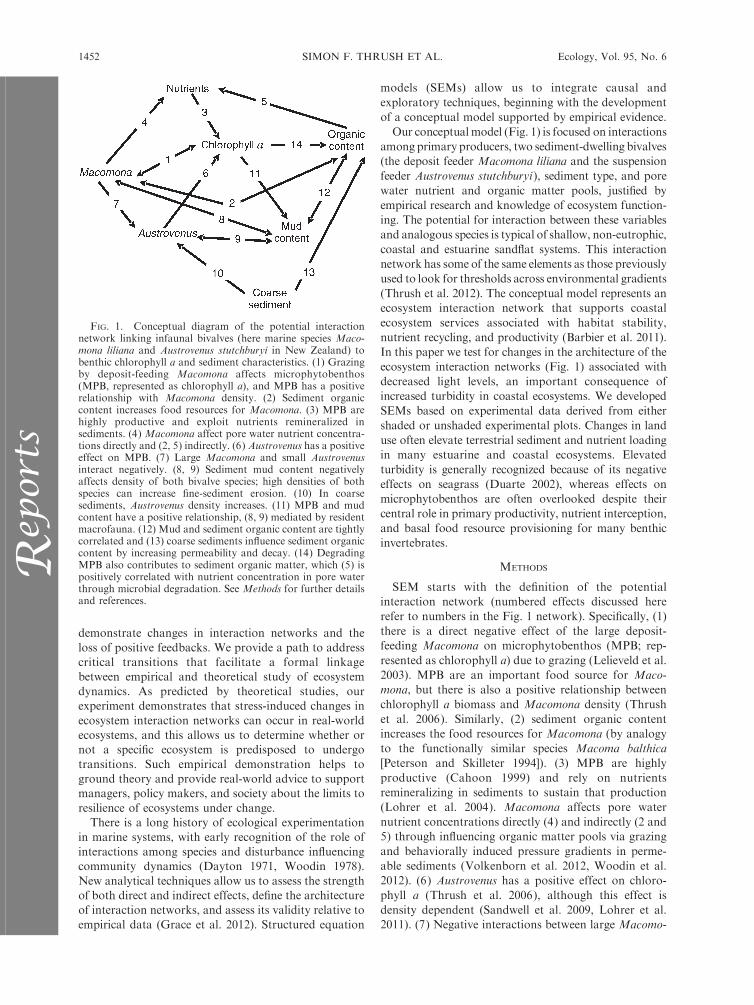
Our conceptual model (Fig. 1) is focused on interactions
among primary producers, two sediment-dwelling bivalves
(the deposit feeder Macomona liliana and the suspension
feeder Austrovenus stutchburyi), sediment type, and pore
water nutrient and organic matter pools, justified by
empirical research and knowledge of ecosystem function-
ing. The potential for interaction between these variables
and analogous species is typical of shallow, non-eutrophic,
coastal and estuarine sandflat systems. This interaction
network has some of the same elements as those previously
used to look for thresholds across environmental gradients
(Thrush et al. 2012). The conceptual model represents an
ecosystem interaction network that supports coastal
ecosystem services associated with habitat stability,
nutrient recycling, and productivity (Barbier et al. 2011).
In this paper we test for changes in the architecture of the
ecosystem interaction networks (Fig. 1) associated with
decreased light levels, an important consequence of
increased turbidity in coastal ecosystems. We developed
SEMs based on experimental data derived from either
shaded or unshaded experimental plots. Changes in land
use often elevate terrestrial sediment and nutrient loading
in many estuarine and coastal ecosystems. Elevated
turbidity is generally recognized because of its negative
effects on seagrass (Duarte 2002), whereas effects on
microphytobenthos are often overlooked despite their
central role in primary productivity, nutrient interception,
and basal food resource provisioning for many benthic
invertebrates.
METHODS
SEM starts with the definition of the potential
interaction network (numbered effects discussed here
refer to numbers in the Fig. 1 network). Specifically, (1)
there is a direct negative effect of the large deposit-
feeding Macomona on microphytobenthos (MPB; rep-
resented as chlorophyll a) due to grazing (Lelieveld et al.
2003). MPB are an important food source for Maco-
mona, but there is also a positive relationship between
chlorophyll a biomass and Macomona density (Thrush
et al. 2006). Similarly, (2) sediment organic content
increases the food resources for Macomona (by analogy
to the functionally similar species Macoma balthica
[Peterson and Skilleter 1994]). (3) MPB are highly
productive (Cahoon 1999) and rely on nutrients
remineralizing in sediments to sustain that production
(Lohrer et al. 2004). Macomona affects pore water
nutrient concentrations directly (4) and indirectly (2 and
5) through influencing organic matter pools via grazing
and behaviorally induced pressure gradients in perme-
able sediments (Volkenborn et al. 2012, Woodin et al.
2012). (6) Austrovenus has a positive effect on chloro-
phyll a (Thrush et al. 2006), although this effect is
density dependent (Sandwell et al. 2009, Lohrer et al.
2011). (7) Negative interactions between large Macomo-
FIG. 1. Conceptual diagram of the potential interactionnetwork linking infaunal bivalves (here marine species Maco-mona liliana and Austrovenus stutchburyi in New Zealand) tobenthic chlorophyll a and sediment characteristics. (1) Grazingby deposit-feeding Macomona affects microphytobenthos(MPB, represented as chlorophyll a), and MPB has a positiverelationship with Macomona density. (2) Sediment organiccontent increases food resources for Macomona. (3) MPB arehighly productive and exploit nutrients remineralized insediments. (4) Macomona affect pore water nutrient concentra-tions directly and (2, 5) indirectly. (6) Austrovenus has a positiveeffect on MPB. (7) Large Macomona and small Austrovenusinteract negatively. (8, 9) Sediment mud content negativelyaffects density of both bivalve species; high densities of bothspecies can increase fine-sediment erosion. (10) In coarsesediments, Austrovenus density increases. (11) MPB and mudcontent have a positive relationship, (8, 9) mediated by residentmacrofauna. (12) Mud and sediment organic content are tightlycorrelated and (13) coarse sediments influence sediment organiccontent by increasing permeability and decay. (14) DegradingMPB also contributes to sediment organic matter, which (5) ispositively correlated with nutrient concentration in pore waterthrough microbial degradation. See Methods for further detailsand references.
SIMON F. THRUSH ET AL.1452 Ecology, Vol. 95, No. 6R
epor
ts
na and small Austrovenus have specifically identified
(Thrush et al. 1996). (8 and 9) Densities of both bivalve
species are negatively impacted by mud (Thrush et al.
2003, 2004), but high densities of both species can
increase the erosion of fine sediments by bioturbation
(Thrush et al. 1996, Jones et al. 2011). (10) In coarse
sediments, Austrovenus density increases (Thrush et al.
2008). (11) A positive relationship between benthic
chlorophyll a and sediment muddiness exists (Van de
Koppel et al. 2001), due to fine-sediment binding by
MBP, a relationship (8 and 9) mediated by resident
macrofauna (Van Colen et al. 2013). (12) Mud and
sediment organic content are tightly correlated (Sloth et
al. 1995) and (13) coarse sediments influence sediment
organic content by increasing permeability and acceler-
ating decay rates (Huettel and Rusch 2000). Degrading
chlorophyll a (14) also contributes to the pool of organic
matter in the sediment (Ehrenhauss et al. 2004), and (5)
the concentration of pore water nutrients is positively
correlated with the sediment organic content through
microbial degradation processes (Sloth et al. 1995,
Grabowski et al. 2011).
The experiment was conducted at Wiroa Island,
Manukau Harbour, New Zealand (37801.30 S, 174849.20
E; see Plate 1). The intertidal sandflat is ;1.8 km wide
and has a shallow gradient of 0.0978 (Thrush et al. 1997).
The macrofaunal community of the Wiroa Island
sandflats is dominated both numerically and in terms of
biomass by the tellinid Macomona liliana (;100/m2 for
individuals with shell length .20 mm), and the venerid
Austrovenus stutchburyi (;32/m2 for individuals with
shell length . 10 mm). To investigate differences in the
architecture of the ecosystem interaction network, we
experimentally manipulated nutrient concentrations, Ma-
comona densities, and light. The experiment was estab-
lished on 25–29 October 2011 in seven blocks that
encompassed about 8003 350 m of sandflat. Experimen-
tal plots (23 2 m) were situated about 3 m apart in three
rows to encompass an area of about 56 m alongshore and
14 m downshore. The experiment consisted of three
density treatments of Macomona (200, 50, and 0
individuals/m2 for individuals with shell length . 20
mm) crossed with three light treatments (shade, shade
control, and open) crossed with three nutrient addition
treatments (high, medium, none) and one ambient
sediment treatment. This resulted in 28 experimental
treatments, replicated once per block.
The central 1 m2 in each 4-m2 plot, excluding one
treatment of ambient sediment, was excavated to 18 cm
depth and the sediment sieved on 10-mm mesh to extract
shell hash and large macrofauna. Sediments were then
returned to the excavated plots and Macomona (.20
mm shell length) were spread evenly across the 1 m2
achieve treatment densities.
Shade cloth designed to cut ;70–80% of the incident
light was supported on a 4-m2 metal grid (mesh size 150
3 150 mm) suspended 15–20 cm above the sediment
surface. Shade controls were the metal grid only
covering the plots. Shading of plots was used to mimic
changes in light levels due to elevated suspended
sediment concentrations, SSC (Billerbeck et al. 2007).
Direct field-based manipulation of SSC is very difficult
in the medium to long term. Although SSC has multiple
effects on the benthos (Thrush et al. 2004), we focused
on effects mediated through the MPB. Benthic chloro-
phyll a is a measure of MPB standing stock, not
productivity. This is important in the interpretation of
our experiment due to the potential for bedload
transport of MPB under shaded plots, potentially
weakening treatment effects.
Nutrient addition consisted of adding four (high), one
(medium), or zero 10 cm long sections of dialysis tubing
filled with 15 g (60.1 g) of a granular slow-release
fertilizer (nutrient ratios: 18.9 N, 2.1 P, 0.0 K, 4.1 S, 3.0
Mg, 7.2 Ca). Our nutrient addition treatments were
expected to have a direct stimulatory effect on MPB,
because New Zealand sandflat studies show that MPB
respond to nutrient released from the sediment as a
result of bioturbation (Rodil et al. 2011).
Before destructive sampling at the end of the
experiment (about þ100 days, 7–10 February 2012),
pore water nutrients samples were collected from each
plot using reservoirs sampling the permeable sediments 5
cm below the sediment–water interface. Pore water was
pressure-filtered through a 2.5-cm Whatman GF/C glass
fiber filter in a Swinnex filter holder (ED Millipore,
Billerica, Massachusetts, USA) and stored on crushed
ice in the dark for transport to the laboratory, where
they were frozen to�208C pending analysis. Analysis for
dissolved inorganic nutrients followed standard methods
for seawater using an Astoria-Pacific 300 series seg-
mented-flow autoanalyzer (Astoria-Pacific, Clackamas,
Oregon, USA) with detection limits of ,0.1 lmol/L for
N and P. Three cores (2.3 cm diameter, 2 cm deep) were
collected from each plot and were pooled for chlorophyll
a, sediment particle size, and organic content analyses.
The remaining sediment within the central 1 m2 was
excavated to a depth of about 15 cm and sieved on 10-
mm mesh to extract large macrofauna, which were then
identified and sized.
Sediment for chlorophyll analysis was freeze-dried
and homogenized. A small quantity of sediment (;0.1 g)
was soaked in 10 mL of MgCO3-buffered acetone (90%)
for ;20 h. Samples were shaken after 12 h and again
prior to centrifugation. Samples were centrifuged for 10
min at 3300 rpm before fluorometric analysis (Turner
10-AU, Turner Designs, Sunnyvale, California, USA).
An acidification step (0.15 mL 0.1N HCL) was used to
separate phaeophytin from photosynthetic pigments
(Arar and Collins 1997). Total organic matter content
(as a percentage) was determined through loss on
ignition from homogenized dried sediments (1058C for
24 h or until stable mass), after combustion for 5.5 h at
5508C (Dean 1974). Sediments for particle size analysis
were digested in 10% hydrogen peroxide to remove
organic matter, until bubbling ceased before using the
June 2014 1453THRESHOLD POTENTIAL IN MARINE ECOSYSTEMSR
eports
standard operating procedure for marine sediments on a
Malvern mastersizer-S (300 FR lens; Malvern Instru-
ments, Malvern, UK) to determine grain size fractions in
the range of 0.05–2000 lm.
SEMs were developed using M-Plus software (Muth-
en and Muthen 2007), based on Fig. 1, to contrast the
networks apparent in the shaded and unshaded exper-
imental treatments. We developed best-fit models for
shaded and unshaded treatments and compared these
with the results from applying the best shaded network
to the unshaded data and vice versa, in order to ensure
that there were real differences in the networks. Data
transformations (loge) to improve the linearity of
responses, or normality of errors, were utilized for
bivalve abundances, coarse sand, and mud. The initial
SEM (Fig. 1) was examined for respecification by
removal of direct pathways based on parameter tests
of significance, while maintaining nonsignificance tests
for goodness of fit (v2) and the root mean square error
of approximation, increasing values of the comparative
fit index (above 0.95) (Vile et al. 2006) and decreasing
Akaike’s information criterion (see Appendix). The
sensitivity of the model to new direct pathways was
also investigated, with the decision on whether or not to
include new links being based on parameter significance
tests and no decreases in goodness of fit (Grace et al.
2012).
RESULTS
Consistent with using SEM as a tool to integrate
causal and exploratory techniques (Grace et al. 2012),
we have not focused on the more traditional analyses of
the experimental data. Preliminary analysis did not
indicate any experimental artefacts associated with
shading (see Appendix). Treatment differences in
Macomona density were maintained in the experiment,
although slightly higher densities in shaded plots were
apparent, while Austrovenus decreased. Lower pore
water NOx concentrations were found in higher Maco-
mona density and zero nutrient addition treatments.
Pore water dissolved reactive phosphorus concentra-
tions were significantly and negatively related to
Macomona density, but not nutrient addition. No
significant differences in benthic chlorophyll a concen-
tration or pore water ammonia concentrations were
detected. Although mean benthic chlorophyll a concen-
trations in the shaded plots were low, high variability
limited the detection of significant differences (see
Appendix).
Shading drastically changed the nature of the
interaction network (Fig. 2). In the unshaded treat-
ments, there were a total of 13 interactions; although
three were weak (P . 0.15 for estimates), they were
required for model stability. A positive feedback loop
was identified between Austrovenus, benthic chlorophyll
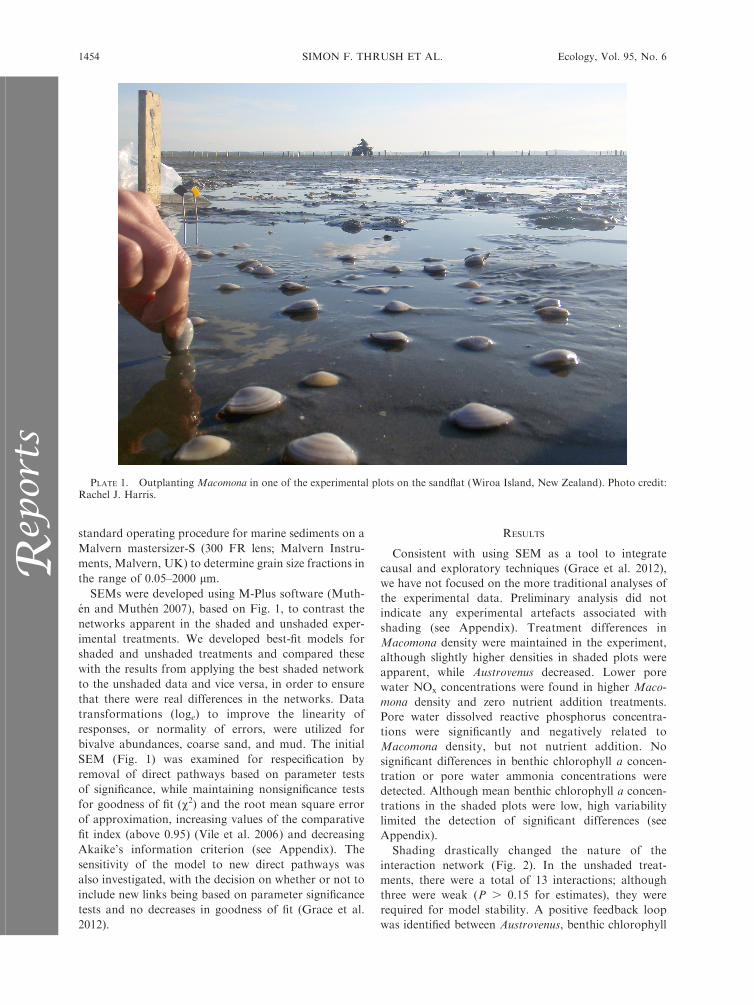
PLATE 1. Outplanting Macomona in one of the experimental plots on the sandflat (Wiroa Island, New Zealand). Photo credit:Rachel J. Harris.
SIMON F. THRUSH ET AL.1454 Ecology, Vol. 95, No. 6R
epor
ts
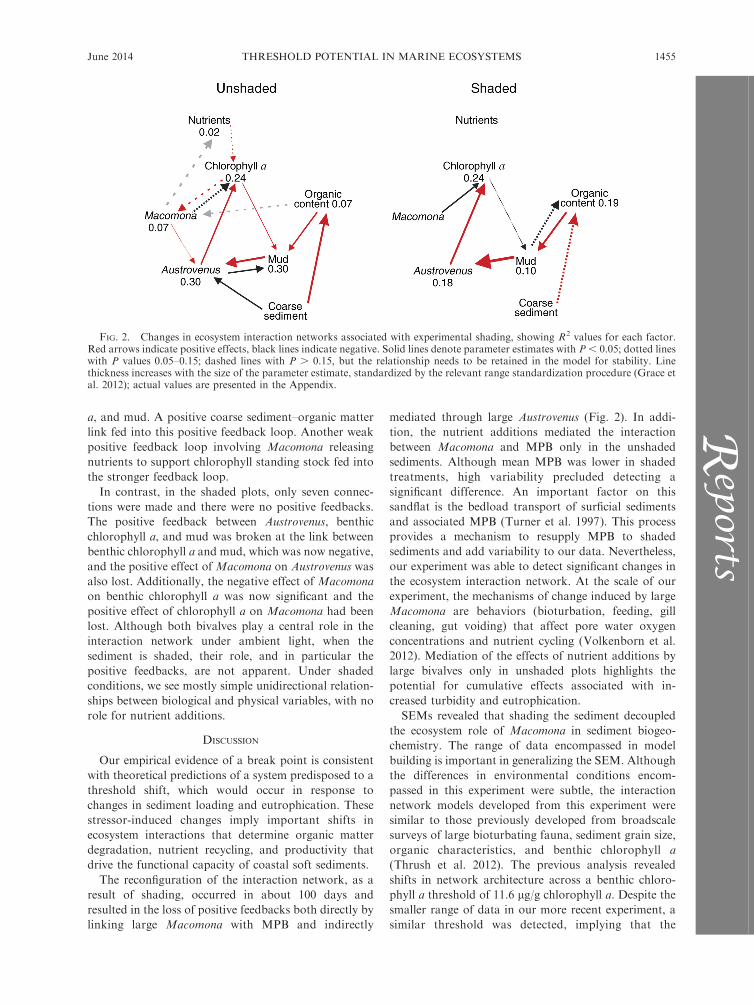
a, and mud. A positive coarse sediment–organic matter
link fed into this positive feedback loop. Another weak
positive feedback loop involving Macomona releasing
nutrients to support chlorophyll standing stock fed into
the stronger feedback loop.
In contrast, in the shaded plots, only seven connec-
tions were made and there were no positive feedbacks.
The positive feedback between Austrovenus, benthic
chlorophyll a, and mud was broken at the link between
benthic chlorophyll a and mud, which was now negative,
and the positive effect of Macomona on Austrovenus was
also lost. Additionally, the negative effect of Macomona
on benthic chlorophyll a was now significant and the
positive effect of chlorophyll a on Macomona had been
lost. Although both bivalves play a central role in the
interaction network under ambient light, when the
sediment is shaded, their role, and in particular the
positive feedbacks, are not apparent. Under shaded
conditions, we see mostly simple unidirectional relation-
ships between biological and physical variables, with no
role for nutrient additions.
DISCUSSION
Our empirical evidence of a break point is consistent
with theoretical predictions of a system predisposed to a
threshold shift, which would occur in response to
changes in sediment loading and eutrophication. These
stressor-induced changes imply important shifts in
ecosystem interactions that determine organic matter
degradation, nutrient recycling, and productivity that
drive the functional capacity of coastal soft sediments.
The reconfiguration of the interaction network, as a
result of shading, occurred in about 100 days and
resulted in the loss of positive feedbacks both directly by
linking large Macomona with MPB and indirectly
mediated through large Austrovenus (Fig. 2). In addi-
tion, the nutrient additions mediated the interaction
between Macomona and MPB only in the unshaded
sediments. Although mean MPB was lower in shaded
treatments, high variability precluded detecting a
significant difference. An important factor on this
sandflat is the bedload transport of surficial sediments
and associated MPB (Turner et al. 1997). This process
provides a mechanism to resupply MPB to shaded
sediments and add variability to our data. Nevertheless,
our experiment was able to detect significant changes in
the ecosystem interaction network. At the scale of our
experiment, the mechanisms of change induced by large
Macomona are behaviors (bioturbation, feeding, gill
cleaning, gut voiding) that affect pore water oxygen
concentrations and nutrient cycling (Volkenborn et al.
2012). Mediation of the effects of nutrient additions by
large bivalves only in unshaded plots highlights the
potential for cumulative effects associated with in-
creased turbidity and eutrophication.
SEMs revealed that shading the sediment decoupled
the ecosystem role of Macomona in sediment biogeo-
chemistry. The range of data encompassed in model
building is important in generalizing the SEM. Although
the differences in environmental conditions encom-
passed in this experiment were subtle, the interaction
network models developed from this experiment were
similar to those previously developed from broadscale
surveys of large bioturbating fauna, sediment grain size,
organic characteristics, and benthic chlorophyll a
(Thrush et al. 2012). The previous analysis revealed
shifts in network architecture across a benthic chloro-
phyll a threshold of 11.6 lg/g chlorophyll a. Despite the
smaller range of data in our more recent experiment, a
similar threshold was detected, implying that the
FIG. 2. Changes in ecosystem interaction networks associated with experimental shading, showing R2 values for each factor.Red arrows indicate positive effects, black lines indicate negative. Solid lines denote parameter estimates with P , 0.05; dotted lineswith P values 0.05–0.15; dashed lines with P . 0.15, but the relationship needs to be retained in the model for stability. Linethickness increases with the size of the parameter estimate, standardized by the relevant range standardization procedure (Grace etal. 2012); actual values are presented in the Appendix.
June 2014 1455THRESHOLD POTENTIAL IN MARINE ECOSYSTEMSR
eports
networks are reasonably stable and consistent. Funda-
mental shifts associated with a loss of positive feedbacks
and restrictions in the importance of indirect effects were
apparent in both this experimental study and the
previous broadscale analysis. Providing empirical infor-
mation to define how a set of ecosystem components are
connected in an interaction network helps to elucidate
ecosystem function. Moreover, if specific types of
connections are present, but can be changed by
particular stressors, this provides a useful means for
predicting the risk of critical transition related to a
specific type and magnitudes of stress. It also allows
insight into ecosystem function after the transition.
Although there is often a gap between theory and
practice, we have been able to experimentally shift the
architecture of an interaction network, providing more
impetus for scientists and managers to use these
indicators of critical transitions. Our results show that
well-designed and scaled manipulative field experiments
can contribute to identifying warnings of increased risk
for upcoming ecosystem transitions by testing for
changes in interaction networks. For example, specific
experiments manipulating the level of shading could be
designed and implemented in different locations to
define key break points for resource management. Shifts
in functional performance associated with shading may
not be gradual if interaction networks fundamentally
shift. In our experiment, we see changes associated with
interactions that affect key attributes of the system
ranging from primary productivity and the stabilization
of fine sediments to the ability of the system to recycle
key nutrients. This indicates that the maintenance of
community function plays critical roles in the resilience
of sandflats to elevated suspended-sediment concentra-
tions and eutrophication.
Change associated with non-point-source land use,
sediments, and nutrients are notoriously difficult to
manage. However policies that generate inertia and are
blind to other surprises are dangerous and ultimately
may be very costly in terms of the loss of ecosystem
services and associated societal values (Horan et al.
2011). This is why the risks of threshold shifts are
important. If not properly accounted for, our futures
may be marked by sudden, unexpected reductions in
ecosystem functionality and value. If there is a credible
risk that a particular system can change in a nonlinear
way associated with subtle but cumulative stress, then
management down to a predetermined limit will be
highly risky. Our approach of investigating the archi-
tecture of ecosystem interaction networks, and how they
are changed by stressors, provides real-world empirical
evidence to support many of the theoretical develop-
ments in regime shifts and resilience. This will allow us
to more tangibly understand the implications of
thresholds in ecosystems that affect our daily lives.
Although we cannot yet predict when break points in
dynamics will occur, our approach does identify
mechanistic links and the key connections between
ecosystem elements that will facilitate interventions.
Such interventions are important in averting regime
shifts, especially where the drivers of change are difficult
to adjust or generate huge legacy effects (Biggs et
al. 2009).
ACKNOWLEDGMENTS
We thank the Auckland Council for permission to conduct theexperiment (CN37056:FN12876) and Peter Robinson (Groundsand Wildlife Hazard Management Planner for AucklandAirport) and Aviation Security for access to the study site. Wethank Katie Cartner, Iain MacDonald, Barry Greenfield, SarahHailes, Michael Townsend, Hazel Needham, Carolyn Lundquist,and others involved with the fieldwork and laboratory analysis.This work was funded by MBIE CO1X1005 and NIWA underthe Coasts and Oceans Research Programme 3 (2012/13 SCI). C.Kraan was supported by the Marsden Fund, Royal Society ofNew Zealand (NIW1102), and a Marie-Curie InternationalOutgoing Fellowship (FP7-PEOPLE-2011-IOF). C. Van Colenacknowledges a postdoctoral fellowship provided by the FlemishFund for Scientific Research (FWO-1.2.380.11.N.00).
LITERATURE CITED
Arar, E., and G. Collins. 1997. Method 445.0 in vitrodetermination of chlorophyll a and pheophytin a. Marineand freshwater algae by fluorescence. Revision 1.2 U.SEnvironmental Protection Agency, Cincinnati, Ohio, USA.
Barbier, E. B., S. D. Hacker, C. Kennedy, E. W. Koch, A. C.Stier, and B. R. Silliman. 2011. The value of estuarine andcoastal ecosystem services. Ecological Monographs 81:169–193.
Biggs, R., S. R. Carpenter, and W. A. Brock. 2009. Turningback from the brink: Detecting an impending regime shift intime to avert it. Proceedings of the National Academy ofSciences USA 106:826–831.
Billerbeck, M. H., H. Røy, K. Bosselmann, and M. Huettel.2007. Benthic photosynthesis in submerged Wadden Seaintertidal flats. Estuarine and Coastal Shelf Science 71:704–716.
Brook, B. W., E. C. Ellis, M. P. Perring, A. W. Mackay, and L.Blomqvist. 2013. Does the terrestrial biosphere have plane-tary tipping points? Trends in Ecology and Evolution 28:396–401.
Cahoon, L. B. 1999. The role of benthic microalgae in neriticecosystems. Oceanography and Marine Biology 37:47–86.
Carpenter, S. R. 2003. Regime shifts in lake ecosystems: patternand variation. Excellence in Ecology Series Number 15.Ecology Institute, Oldendorf/Luhe, Germany.
Carpenter, S., B. Walker, J. M. Anderies, and N. Abel. 2001.From metaphor to measurement: Resilience of what to what?Ecosystems 4:765–781.
Dakos, V., et al. 2012. Methods for detecting early warnings ofcritical transitions in time series illustrated using simulatedecological data. PLoS One 7:e41010.
Dayton, P. K. 1971. Competition, disturbance and communityorganization: The provision and subsequent utilization ofspace in a rocky intertidal community. Ecological Mono-graphs 41:351–389.
Dean, W. 1974. Determination of carbonate and organic matterin calcareous sediments and sedimentary rocks by loss onignition: Comparison with other methods. Journal ofSedimentary Petrology 44:242–248.
Duarte, C. M. 2002. The future of seagrass meadows.Environmental Conservation 29:192–206.
Ehrenhauss, S., U. Witte, F. Janssen, and M. Huettel. 2004.Decomposition of diatoms and nutrient dynamics in perme-able North Sea sediments. Continental Shelf Research 24:721–737.
SIMON F. THRUSH ET AL.1456 Ecology, Vol. 95, No. 6R
epor
ts
Grabowski, R. C., I. G. Droppo, and G. Wharton. 2011.Erodibility of cohesive sediment: the importance of sedimentproperties. Earth Science Reviews 105:101–120.
Grace, J. B., D. R. Schoolmaster, G. R. Guntenspergen, A. M.Little, B. R. Mitchell, K. M. Miller, and E. W. Schweiger.2012. Guidelines for a graph-theoretic implementation ofstructural equation modeling. Ecosphere 3:art73.
Hewitt, J. E., and S. F. Thrush. 2010. Empirical evidence of anapproaching alternate state produced by intrinsic communitydynamics, climatic variability and management actions.Marine Ecology Progress Series 413:267–276.
Horan, R. D., E. P. Fenichel, K. L. S. Drury, and D. M. Lodge.2011. Managing ecological thresholds in coupled environ-mental–human systems. Proceedings of the National Acad-emy of Sciences USA 108:7333–7338.
Huettel, M., and A. Rusch. 2000. Transport and degradation ofphytoplankton in permeable sediment. Limnology andOceanography 45:534–549.
Jones, H. F. E., C. A. Pilditch, D. A. Bruesewitz, and A. M.Lohrer. 2011. Sedimentary environment influences the effectof an infaunal suspension feeding bivalve on estuarineecosystem function. PLoS ONE 6:e27065.
Kefi, S., V. Dakos, M. Scheffer, E. H. Van Nes, and M.Rietkerk. 2013. Early warning signals also precede non-catastrophic transitions. Oikos 122:641–648.
Lelieveld, S. D., C. A. Pilditch, and M. O. Greene. 2003.Variation in sediment stability and relation to indicators ofmicrobial abundance in the Okura Estuary, New Zealand.Estuarine Coastal and Shelf Science 57:123–136.
Lindegren, M., V. Dakos, J. P. Groger, A. Gardmark, G.Kornilovs, S. A. Otto, and C. Mollmann. 2012. Earlydetection of ecosystem regime shifts: a multiple methodevaluation for management application. PLoS ONE 7:e38410.
Lohrer, A. M., J. E. Hewitt, S. F. Hailes, S. F. Thrush, M.Ahrens, and J. Halliday. 2011. Contamination on sandflatsand the decoupling of linked ecological functions. AustralEcology 36:378–388.
Lohrer, A. M., S. F. Thrush, and M. M. Gibbs. 2004.Bioturbators enhance ecosystem function through complexbiogeochemical interactions. Nature 431:1092–1095.
Muthen, L. K., and B. O. Muthen. 2007. Mplus user’s guide.Sixth edition. Mutheın and Mutheın, Los Angeles, Califor-nia, USA.
Peterson, C. H., and G. A. Skilleter. 1994. Control of foragingbehaviour of individuals within an ecosystem context: Theclam Macoma balthica, flow environments and siphon-cropping fishes. Oecologia 100:256–267.
Rodil, I. F., A. M. Lohrer, L. D. Chiaroni, J. E. Hewitt, andS. F. Thrush. 2011. Disturbance of sandflats by thin depositsof terrigenous sediment: consequences for primary produc-tion and nutrient release. Ecological Applications 21:416–426.
Sandwell, D. R., C. A. Pilditch, and A. M. Lohrer. 2009.Density dependent effects of an infaunal suspension-feedingbivalve (Austrovenus stutchburyi) on sandflat nutrient fluxesand microphytobenthic productivity. Journal of Experimen-tal Marine Biology and Ecology 373:16–25.
Scheffer, M., S. Carpenter, J. A. Foley, C. Folke, and B.Walker. 2001. Catastrophic shifts in ecosystems. Nature 413:591–596.
Scheffer, M., et al. 2012. Anticipating critical transitions.Science 338:344–348.
Sloth, N. P., T. H. Blackburn, L. S. Hansen, N. Risgaard-Petersen, and B. A. Lomstein. 1995. Nitrogen cycling insediments with different organic loading. Marine EcologicalProgress Series 116:163–170.
Thrush, S. F., J. E. Hewitt, V. Cummings, J. I. Ellis, C. Hatton,A. Lohrer, and A. Norkko. 2004. Muddy waters: elevatingsediment input to coastal and estuarine habitats. Frontiers inEcology and the Environment 2:299–306.
Thrush, S. F., J. E. Hewitt, M. Gibbs, C. Lundquist, and A.Norkko. 2006. Functional role of large organisms inintertidal communities: Community effects and ecosystemfunction. Ecosystems 9:1029–1040.
Thrush, S. F., J. E. Hewitt, C. W. Hickey, and S. Kelly. 2008.Multiple stressor effects identified from species abundancedistributions: Interactions between urban contaminants andspecies habitat relationships. Journal of Experimental MarineBiology and Ecology 366:160–168.
Thrush, S. F., J. E. Hewitt, and A. M. Lohrer. 2012. Interactionnetworks in coastal soft-sediments highlight the potential forchange in ecological resilience. Ecological Applications 22:1213–1223.
Thrush, S. F., J. E. Hewitt, A. Norkko, P. E. Nicholls, G. A.Funnell, and J. I. Ellis. 2003. Habitat change in estuaries:predicting broad-scale responses of intertidal macrofauna tosediment mud content. Marine Ecology Progress Series 263:101–112.
Thrush, S. F., J. E. Hewitt, R. D. Pridmore, and V. J.Cummings. 1996. Adult/juvenile interactions of infaunalbivalves: contrasting outcomes in different habitats. MarineEcology Progress Series 132:83–92.
Thrush, S. F., et al. 1997. The sandflat habitat: Scaling fromexperiments to conclusions. Journal of Experimental MarineBiology and Ecology 216:1–10.
Turner, S. J., J. Grant, R. D. Pridmore, J. E. Hewitt, M. R.Wilkinson, T. M. Hume, and D. Morrisey. 1997. Bedloadand water-column transport and colonization processes bymobile post-settlement benthic macrofauna: Does infaunaldensity matter? Journal of Experimental Marine Biology andEcology 216:51–76.
Van Colen, C., S. F. Thrush, M. Vincx, and T. Ysebaert. 2013.Conditional responses of benthic communities to interferencefrom an intertidal bivalve. PLoS ONE 8:e65861.
Van de Koppel, J., P. M. J. Herman, P. Thoolen, and C. H. R.Heip. 2001. Do alternate stable states occur in naturalecosystems? Evidence from a tidal flat. Ecology 82:3449–3461.
Vile, D., B. Shipley, and E. Garnier. 2006. A structuralequation model to integrate changes in functional strategiesduring old-field succession. Ecology 87:504–517.
Volkenborn, N., C. Meile, L. Polerecky, C. Pilditch, A.Norkko, J. Norkko, J. E. Hewitt, S. F. Thrush, D. S.Wethey, and S. A. Woodin. 2012. Intermittent bioirrigationand oxygen dynamics in permeable sediments: An experi-mental and modeling study of three tellinid bivalves. Journalof Marine Research 76:794–823.
Woodin, S. A. 1978. Refuges, disturbance and communitystructure: a marine soft-bottom example. Ecology 59:274–284.
Woodin, S. A., D. S. Wethey, J. E. Hewitt, and S. F. Thrush.2012. Small scale terrestrial clay deposits on intertidalsandflats: behavioral changes and productivity reduction.Journal of Experimental Marine Biology and Ecology 413:184–191.
SUPPLEMENTAL MATERIAL
Appendix
Description of experimental effects and potential artifacts and base statistical tables structured equation modeling (EcologicalArchives E095-127-A1).
June 2014 1457THRESHOLD POTENTIAL IN MARINE ECOSYSTEMSR
eports
Copyright © 2022 FDOKUMEN