Experimental verification of a method for estimating energy for domestic hot water production in a...
6
Experimental verification of a method for estimating energy for domestic hot water production in a 2-stage district heating substation Kimmo Yliniemi *, Jerker Delsing, Jan van Deventer Lulea ˚ University of Technology, Department of Computer Science and Electrical Engineering, Division EISLAB, 971 87 Lulea ˚, Sweden 1. Introduction 1.1. Background Decreasing energy consumption in buildings is a priority in Europe. A building’s energy declaration is a means of decreasing energy consumption [1], as it specifies levels of energy use for heating and hot water production. The energy expert that makes the declaration also suggests how to decrease the building’s energy consumption; today, energy consumption is usually not measured separately. Studies show that consumers change their behaviour when energy consumption for hot water production and heating is measured in apartment buildings and detached houses [2–5]. These separate measurements give consumers the information and incentive (cost reduction) needed to decrease energy consump- tion. In some cases, energy consumption decreases by 30–40%, as reported by Gullev and Poulsen [3]. One study done in Japan by Ueno et al. on detached houses with hot water energy measure- ment systems showed that energy consumption for heating domestic homes decreased by 20% on average and that the total power consumption in the buildings decreased by 18% on average when information was made available to the users. The buildings studied had gas and electric heating. Table 1 contains the expected/measured average decrease in energy consumption. Bohm and Danning report a 15–20% decrease in total energy consumption in Denmark [2]. According to Koiv and Toode, Estonian apartment buildings decreased their domestic hot water (DHW) consumption by more than 50% between 1975 and 2004 [5]. Between 1999 and 2004, domestic hot water consump- tion dropped from 2.8 to 2.0 l/m 2 . The main reasons for the decrease were consumption measurements, renovation of domes- tic hot water systems, and installation of low flow taps and showers [5]. In other words, an efficient way to decrease energy consumption is to keep users aware of their usage. This should be done at the lowest possible cost and with high accuracy. We show here that it is possible to provide this information using the existing energy meter in the district heating substation. In this paper, we focus on testing the method developed in [6] and described in [7]. Using this method, we estimate the energy consumption for hot water production and compare these estimates with empirical measurements. The study was carried out at a 2-stage coupled district heating substation with hot water circulation (see Fig. 1). 2. Theory A brief description of the energy separation method (ECOS) is given here; more details can be found in the studies by Yliniemi et al. in [6–8]. ECOS estimates the energy consumption for domestic hot water production and heating based on measurements of total power consumption. ECOS classifies sudden changes in total power consumption, changes related to domestic tap water usage. The method uses a combination of filtering and detection techniques. The time constants for heating a building are long (it takes hours for a Energy and Buildings 41 (2009) 169–174 ARTICLE INFO Article history: Received 29 May 2008 Received in revised form 25 July 2008 Accepted 17 August 2008 Keywords: Estimation of energy usage Domestic hot water Energy usage District heating ABSTRACT In this paper we compare our estimate of energy consumption for domestic hot water production in a building with the measured value. The energy consumption for hot water production is estimated from the measured total power consumption. The estimation method was developed using computer simulations, and it is based on the assumption that hot water production causes rapid and detectable changes in power consumption. A comparison of our estimates with measurements indicates that the uncertainty in estimation of hot water energy consumption is 10%. Thus, the estimate is comparable to class 3 energy meter measurements, which have an uncertainty of 2–10%. ß 2008 Elsevier B.V. All rights reserved. * Corresponding author. Tel.: +46 70 222 4786. E-mail address: [email protected] (K. Yliniemi). Contents lists available at ScienceDirect Energy and Buildings journal homepage: www.elsevier.com/locate/enbuild 0378-7788/$ – see front matter ß 2008 Elsevier B.V. All rights reserved. doi:10.1016/j.enbuild.2008.08.008
-
Upload
independent -
Category
Documents
-
view
0 -
download
0
Transcript of Experimental verification of a method for estimating energy for domestic hot water production in a...
Energy and Buildings 41 (2009) 169–174
Experimental verification of a method for estimating energy for domestichot water production in a 2-stage district heating substation
Kimmo Yliniemi *, Jerker Delsing, Jan van Deventer
Lulea University of Technology, Department of Computer Science and Electrical Engineering, Division EISLAB, 971 87 Lulea, Sweden
A R T I C L E I N F O
Article history:
Received 29 May 2008
Received in revised form 25 July 2008
Accepted 17 August 2008
Keywords:
Estimation of energy usage
Domestic hot water
Energy usage
District heating
A B S T R A C T
In this paper we compare our estimate of energy consumption for domestic hot water production in a
building with the measured value. The energy consumption for hot water production is estimated from
the measured total power consumption. The estimation method was developed using computer
simulations, and it is based on the assumption that hot water production causes rapid and detectable
changes in power consumption. A comparison of our estimates with measurements indicates that the
uncertainty in estimation of hot water energy consumption is �10%. Thus, the estimate is comparable to
class 3 energy meter measurements, which have an uncertainty of �2–10%.
� 2008 Elsevier B.V. All rights reserved.
Contents lists available at ScienceDirect
Energy and Buildings
journal homepage: www.e lsev ier .com/ locate /enbui ld
1. Introduction
1.1. Background
Decreasing energy consumption in buildings is a priority inEurope. A building’s energy declaration is a means of decreasingenergy consumption [1], as it specifies levels of energy use forheating and hot water production. The energy expert that makesthe declaration also suggests how to decrease the building’s energyconsumption; today, energy consumption is usually not measuredseparately. Studies show that consumers change their behaviourwhen energy consumption for hot water production and heating ismeasured in apartment buildings and detached houses [2–5].These separate measurements give consumers the information andincentive (cost reduction) needed to decrease energy consump-tion. In some cases, energy consumption decreases by 30–40%, asreported by Gullev and Poulsen [3]. One study done in Japan byUeno et al. on detached houses with hot water energy measure-ment systems showed that energy consumption for heatingdomestic homes decreased by 20% on average and that the totalpower consumption in the buildings decreased by 18% on averagewhen information was made available to the users. The buildingsstudied had gas and electric heating.
Table 1 contains the expected/measured average decrease inenergy consumption. Bohm and Danning report a 15–20% decrease
* Corresponding author. Tel.: +46 70 222 4786.
E-mail address: [email protected] (K. Yliniemi).
0378-7788/$ – see front matter � 2008 Elsevier B.V. All rights reserved.
doi:10.1016/j.enbuild.2008.08.008
in total energy consumption in Denmark [2]. According to Koiv andToode, Estonian apartment buildings decreased their domestic hotwater (DHW) consumption by more than 50% between 1975 and2004 [5]. Between 1999 and 2004, domestic hot water consump-tion dropped from 2.8 to 2.0 l/m2. The main reasons for thedecrease were consumption measurements, renovation of domes-tic hot water systems, and installation of low flow taps andshowers [5]. In other words, an efficient way to decrease energyconsumption is to keep users aware of their usage. This should bedone at the lowest possible cost and with high accuracy. We showhere that it is possible to provide this information using theexisting energy meter in the district heating substation.
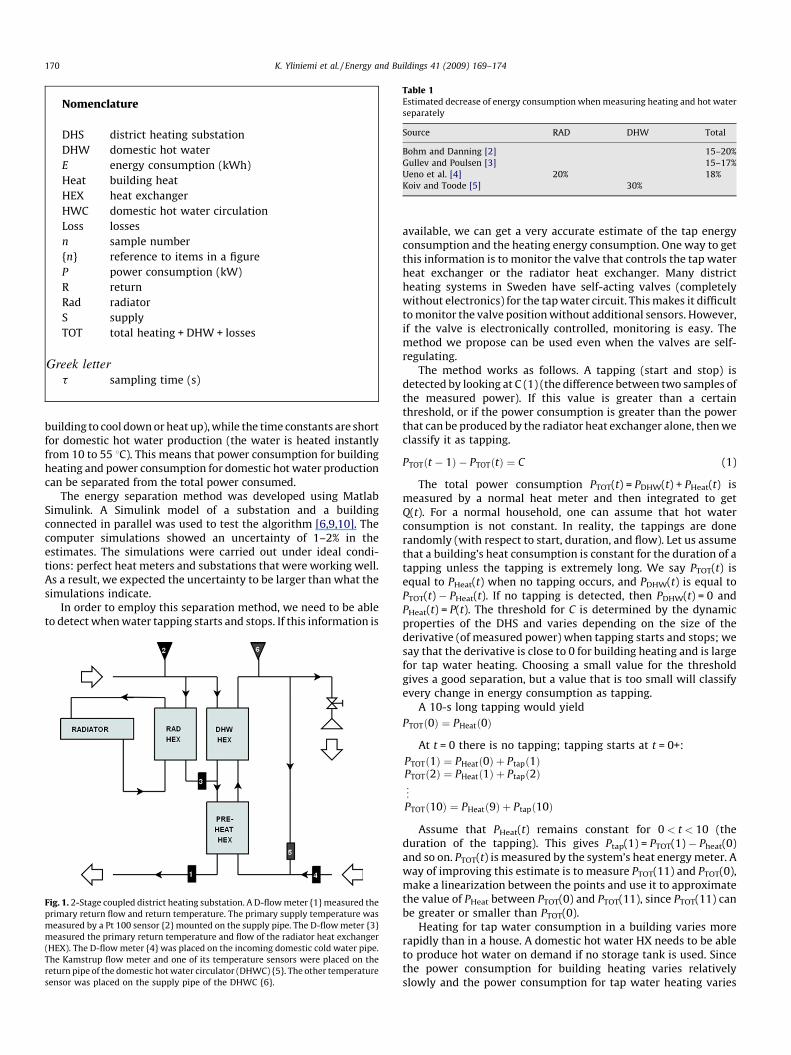
In this paper, we focus on testing the method developed in [6]and described in [7]. Using this method, we estimate the energyconsumption for hot water production and compare theseestimates with empirical measurements. The study was carriedout at a 2-stage coupled district heating substation with hot watercirculation (see Fig. 1).
2. Theory
A brief description of the energy separation method (ECOS) isgiven here; more details can be found in the studies by Yliniemi et al.in [6–8]. ECOS estimates the energy consumption for domestic hotwater production and heating based on measurements of totalpower consumption. ECOS classifies sudden changes in total powerconsumption, changes related to domestic tap water usage. Themethod uses a combination of filtering and detection techniques.The time constants for heating a building are long (it takes hours for a
Nomenclature
DHS district heating substation
DHW domestic hot water
E energy consumption (kWh)
Heat building heat
HEX heat exchanger
HWC domestic hot water circulation
Loss losses
n sample number
{n} reference to items in a figure
P power consumption (kW)
R return
Rad radiator
S supply
TOT total heating + DHW + losses
Greek lettert sampling time (s)
Table 1Estimated decrease of energy consumption when measuring heating and hot water
separately
Source RAD DHW Total
Bohm and Danning [2] 15–20%
Gullev and Poulsen [3] 15–17%
Ueno et al. [4] 20% 18%
Koiv and Toode [5] 30%
K. Yliniemi et al. / Energy and Buildings 41 (2009) 169–174170
building to cool down or heat up), while the time constants are shortfor domestic hot water production (the water is heated instantlyfrom 10 to 55 8C). This means that power consumption for buildingheating and power consumption for domestic hot water productioncan be separated from the total power consumed.
The energy separation method was developed using MatlabSimulink. A Simulink model of a substation and a buildingconnected in parallel was used to test the algorithm [6,9,10]. Thecomputer simulations showed an uncertainty of 1–2% in theestimates. The simulations were carried out under ideal condi-tions: perfect heat meters and substations that were working well.As a result, we expected the uncertainty to be larger than what thesimulations indicate.
In order to employ this separation method, we need to be ableto detect when water tapping starts and stops. If this information is
Fig. 1. 2-Stage coupled district heating substation. A D-flow meter {1} measured the
primary return flow and return temperature. The primary supply temperature was
measured by a Pt 100 sensor {2} mounted on the supply pipe. The D-flow meter {3}
measured the primary return temperature and flow of the radiator heat exchanger
(HEX). The D-flow meter {4} was placed on the incoming domestic cold water pipe.
The Kamstrup flow meter and one of its temperature sensors were placed on the
return pipe of the domestic hot water circulator (DHWC) {5}. The other temperature
sensor was placed on the supply pipe of the DHWC {6}.
available, we can get a very accurate estimate of the tap energyconsumption and the heating energy consumption. One way to getthis information is to monitor the valve that controls the tap waterheat exchanger or the radiator heat exchanger. Many districtheating systems in Sweden have self-acting valves (completelywithout electronics) for the tap water circuit. This makes it difficultto monitor the valve position without additional sensors. However,if the valve is electronically controlled, monitoring is easy. Themethod we propose can be used even when the valves are self-regulating.
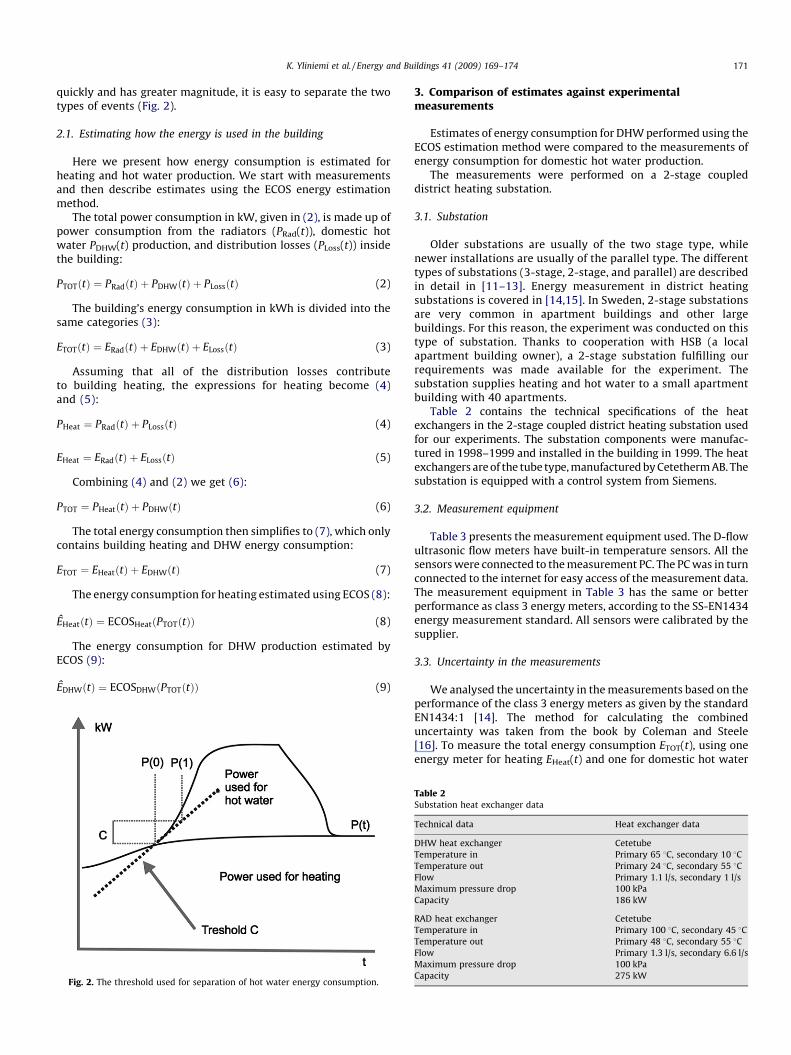
The method works as follows. A tapping (start and stop) isdetected by looking at C (1) (the difference between two samples ofthe measured power). If this value is greater than a certainthreshold, or if the power consumption is greater than the powerthat can be produced by the radiator heat exchanger alone, then weclassify it as tapping.
PTOTðt � 1Þ � PTOTðtÞ ¼ C (1)
The total power consumption PTOT(t) = PDHW(t) + PHeat(t) ismeasured by a normal heat meter and then integrated to getQ(t). For a normal household, one can assume that hot waterconsumption is not constant. In reality, the tappings are donerandomly (with respect to start, duration, and flow). Let us assumethat a building’s heat consumption is constant for the duration of atapping unless the tapping is extremely long. We say PTOT(t) isequal to PHeat(t) when no tapping occurs, and PDHW(t) is equal toPTOT(t) � PHeat(t). If no tapping is detected, then PDHW(t) = 0 andPHeat(t) = P(t). The threshold for C is determined by the dynamicproperties of the DHS and varies depending on the size of thederivative (of measured power) when tapping starts and stops; wesay that the derivative is close to 0 for building heating and is largefor tap water heating. Choosing a small value for the thresholdgives a good separation, but a value that is too small will classifyevery change in energy consumption as tapping.
A 10-s long tapping would yield
PTOTð0Þ ¼ PHeatð0Þ
At t = 0 there is no tapping; tapping starts at t = 0+:
PTOTð1Þ ¼ PHeatð0Þ þ Ptapð1ÞPTOTð2Þ ¼ PHeatð1Þ þ Ptapð2Þ...
PTOTð10Þ ¼ PHeatð9Þ þ Ptapð10Þ
Assume that PHeat(t) remains constant for 0 < t < 10 (theduration of the tapping). This gives Ptap(1) = PTOT(1) � Pheat(0)and so on. PTOT(t) is measured by the system’s heat energy meter. Away of improving this estimate is to measure PTOT(11) and PTOT(0),make a linearization between the points and use it to approximatethe value of PHeat between PTOT(0) and PTOT(11), since PTOT(11) canbe greater or smaller than PTOT(0).
Heating for tap water consumption in a building varies morerapidly than in a house. A domestic hot water HX needs to be ableto produce hot water on demand if no storage tank is used. Sincethe power consumption for building heating varies relativelyslowly and the power consumption for tap water heating varies
K. Yliniemi et al. / Energy and Buildings 41 (2009) 169–174 171
quickly and has greater magnitude, it is easy to separate the twotypes of events (Fig. 2).
2.1. Estimating how the energy is used in the building
Here we present how energy consumption is estimated forheating and hot water production. We start with measurementsand then describe estimates using the ECOS energy estimationmethod.
The total power consumption in kW, given in (2), is made up ofpower consumption from the radiators (PRad(t)), domestic hotwater PDHW(t) production, and distribution losses (PLoss(t)) insidethe building:
PTOTðtÞ ¼ PRadðtÞ þ PDHWðtÞ þ PLossðtÞ (2)
The building’s energy consumption in kWh is divided into thesame categories (3):
ETOTðtÞ ¼ ERadðtÞ þ EDHWðtÞ þ ELossðtÞ (3)
Assuming that all of the distribution losses contributeto building heating, the expressions for heating become (4)and (5):
PHeat ¼ PRadðtÞ þ PLossðtÞ (4)
EHeat ¼ ERadðtÞ þ ELossðtÞ (5)
Combining (4) and (2) we get (6):
PTOT ¼ PHeatðtÞ þ PDHWðtÞ (6)
The total energy consumption then simplifies to (7), which onlycontains building heating and DHW energy consumption:
ETOT ¼ EHeatðtÞ þ EDHWðtÞ (7)
The energy consumption for heating estimated using ECOS (8):
EHeatðtÞ ¼ ECOSHeatðPTOTðtÞÞ (8)
The energy consumption for DHW production estimated byECOS (9):
EDHWðtÞ ¼ ECOSDHWðPTOTðtÞÞ (9)
Fig. 2. The threshold used for separation of hot water energy consumption.
3. Comparison of estimates against experimentalmeasurements
Estimates of energy consumption for DHW performed using theECOS estimation method were compared to the measurements ofenergy consumption for domestic hot water production.
The measurements were performed on a 2-stage coupleddistrict heating substation.
3.1. Substation
Older substations are usually of the two stage type, whilenewer installations are usually of the parallel type. The differenttypes of substations (3-stage, 2-stage, and parallel) are describedin detail in [11–13]. Energy measurement in district heatingsubstations is covered in [14,15]. In Sweden, 2-stage substationsare very common in apartment buildings and other largebuildings. For this reason, the experiment was conducted on thistype of substation. Thanks to cooperation with HSB (a localapartment building owner), a 2-stage substation fulfilling ourrequirements was made available for the experiment. Thesubstation supplies heating and hot water to a small apartmentbuilding with 40 apartments.
Table 2 contains the technical specifications of the heatexchangers in the 2-stage coupled district heating substation usedfor our experiments. The substation components were manufac-tured in 1998–1999 and installed in the building in 1999. The heatexchangers are of the tube type, manufactured by Cetetherm AB. Thesubstation is equipped with a control system from Siemens.
3.2. Measurement equipment
Table 3 presents the measurement equipment used. The D-flowultrasonic flow meters have built-in temperature sensors. All thesensors were connected to the measurement PC. The PC was in turnconnected to the internet for easy access of the measurement data.The measurement equipment in Table 3 has the same or betterperformance as class 3 energy meters, according to the SS-EN1434energy measurement standard. All sensors were calibrated by thesupplier.
3.3. Uncertainty in the measurements
We analysed the uncertainty in the measurements based on theperformance of the class 3 energy meters as given by the standardEN1434:1 [14]. The method for calculating the combineduncertainty was taken from the book by Coleman and Steele[16]. To measure the total energy consumption ETOT(t), using oneenergy meter for heating EHeat(t) and one for domestic hot water
Table 2Substation heat exchanger data
Technical data Heat exchanger data
DHW heat exchanger Cetetube
Temperature in Primary 65 8C, secondary 10 8CTemperature out Primary 24 8C, secondary 55 8CFlow Primary 1.1 l/s, secondary 1 l/s
Maximum pressure drop 100 kPa
Capacity 186 kW
RAD heat exchanger Cetetube
Temperature in Primary 100 8C, secondary 45 8CTemperature out Primary 48 8C, secondary 55 8CFlow Primary 1.3 l/s, secondary 6.6 l/s
Maximum pressure drop 100 kPa
Capacity 275 kW

Table 3Measurement equipment used in the experiment (the equipment has class 3 or
better accuracy)
Type Sampling rate (Hz)
D-flow ultrasonic flow meter 1
Seneca Z-4RTD and PT100 1
Kamstrup Multical Energymeter 0.2
PC104 equipped with Linux
K. Yliniemi et al. / Energy and Buildings 41 (2009) 169–174172
production EDHW(t), we used the following expression:
ETOTðtÞ ¼ EHeatðtÞ þ EDHWðtÞ (10)
The combined uncertainty for the measurement is given by
u2c ¼ u2
Heat þ u2DHW (11)
If we measure ETOT(t) and EDHW(t), we can get the energyconsumption for heating using (12).:
EHeatðtÞ ¼ ETOTðtÞ � EDHWðtÞ (12)
The combined uncertainty for estimating EHeat(t) this waybecomes
u2c ¼ u2
TOT þ u2DHW (13)
The calculated uncertainties are given in Table 4 for both lowand high flows. We can see that the combined uncertainty is morethan �14% in the worst case when both meters experience low flow.The combined uncertainty is �11% if one of the meters measures lowflow rates and the other measures high flow rates. This indicates thatmeasurement is not always the best option.
The effect of sampling time was also studied in order toquantify dependence of uncertainty on sampling time. A period of5.5 h with random tapping was sampled in intervals ranging from1 to 60 s. The uncertainty in measuring energy consumption forheating using a sampling time of 60 s was less than �0.5%. Theuncertainty in measuring domestic hot water energy consumptiongreatly depends on the length of tapping. We consider the case of 15 stapping starting at random times: a 30 s sampling time would onaverage miss half of the tapping; and a 20 s tapping would bedetected 2/3 of the time, meaning the energy consumption wouldbe underestimated by 30%. As the tapping length increases, theuncertainty decreases. This is consistent with the sampling theorem,
Table 4Measurement uncertainty for class 3 energy meters and flow meters according to
EN1434
Value (%) Uncertainty variable Flow and delta T
Class 3 energy meters
�10 uHeat Low
�10 uDHW Low
�10 uTOT Low
�4 uHeat High
�4 uDHW High
�4 uTOT High
�6 uc High/high
�14 uc Low/low
�11 uc Low/high
Value (%) Uncertainty variable Flow
Class 3 flow meters
�5 uflow Low flow
�2 uflow High flow
For the energy meters, the low or high values denote the magnitude of the
temperature difference and flow. uc is the combined uncertainty for the two energy
meters.
which states that the sampling frequency should be twice as high asthe frequency of interest.
During the measurement period, delta T was high and theflow varied between low and high rates. The total flow was highwhen there was tapping. This period in particular has manytapping events. This means that we can consider the total energymeasurement to have an uncertainty close to �4%. The measuredenergy consumption for heating had a low flow and a high delta T,giving it an uncertainty of �7–8%. The combined uncertainty for thetest period is estimated to be �6–11% for both heating and domestichot water production; see Table 4.
3.4. Evaluating the algorithm
The algorithm is tested in three steps:
1. D
TaTh
Va
�1
�8
ata acquisition and logging to computer. The measuredvariables are total power and energy consumption, and powerand energy consumption for hot water production.
2. E
stimation of energy consumption using the algorithm. Theenergy consumption and the corresponding power consumptionwere estimated using measurements. Estimation was done off-line using measurements collected in Step 1. The data werecollected over several months; occasionally, we had data dropouts because of bad communication. For the estimation, datawas checked for communication drop-outs, and we did not usesuch baddata in the evaluation.3. C
omparison of measured and estimated results. The estimatedvalues for the energy consumption and the correspondingpower consumption were compared with the measured values.3.5. Test conditions
We used two different consumption scenarios for our experi-ments. These were
� W
inter timeA very dynamic load consisting of both tapping and adecreasing space-heating demand. A decreasing need for heatingcreates disturbances, since the algorithm is made to act slowly onchanges in heat demand. An 8-h period is studied here.
� S ummer timeNo space-heating demand. The losses in the domestic hotwater circuit heat the building. The estimation method calculatesthe energy losses in the domestic hot water circulation as part ofbuilding heating. The measurements show that the uncertaintyin estimating the energy consumption for hot water productionis similar to that in the winter case.
4. Results
4.1. Uncertainty estimation
The standard deviation for the 8-h test period is given inTable 5. The uncertainties are calculated using methods from [16].Since the ECOS algorithm has start-up behaviour, we discarded astart-up period of 1.5 h in the calculations, thus improving the
ble 5e relative estimation uncertainty in percent
lue (%) Uncertainty variable Type
.6 uHeat 2 � sHeat
.6 uDHW 2 � sDHW

Fig. 4. Uncertainty in the estimation of energy consumption for DHW production
and heating with their corresponding two sigma bounds. The uncertainty in
estimating energy consumption for hot water production is below 10%.
K. Yliniemi et al. / Energy and Buildings 41 (2009) 169–174 173
uncertainty estimation as shown in Figs. 3 and 4. The relativeuncertainty in percent for the estimates using ECOS is givenby (14) and (15):
uDHW ¼EDHWðtÞ � EDHWðtÞ
EDHWðtÞ� 100 (14)
uHeat ¼EHeatðtÞ � EHeatðtÞ
EHeatðtÞ� 100 (15)
The data shown here are considered to be representative of thedata obtained in the field test.
In Fig. 3 the estimated power consumption for DHW is plottedfor an 8-h period. For this period, the total energy consumption forhot water is 100 kWh, and the estimated total energy consumptionfor hot water is 97.5 kWh. Fig. 4 gives the relative uncertainty forboth the estimated hot water consumption and the estimatedspace heating consumption. They are for obvious reasons oppositesof each other.
The ECOS algorithm goes through a start-up behaviour. Thus,the first hour could be considered the start-up time, a notionconfirmed by the relatively large uncertainty shown there. Thiswas caused by a small accumulation of energy, and thus therelative uncertainty was increased.
5. Discussion
The measured total energy consumption did not increase ordecrease with the estimation method. This means that if theinstalled meter did not measure all of the energy consumption (i.e.,if it missed hot water tappings), the estimation method could notestimate this energy.
In Figs. 3 and 4, we see that ECOS overestimated the energyconsumption for DHW production. Between hours 1 and 3, theheating need dropped quickly and resulted in an overestimation ofthe heating requirement. Thus, the energy consumption for hotwater production was underestimated. After 4 h, the heating needincreased (in the evening) and the heat requirement was under-estimated; thus, energy consumption for hot water production wasslightly overestimated. When the heating requirement did notchange during a tapping, the estimation uncertainty for tappingwas lower.
Uncertainty analysis of the measurements showed that theuncertainty can vary between �4–10% when using class 3 energymeters, according to the European measurement standard EN1434, ifone energy meter measures the total energy consumption andanother measures heating. We estimated the energy consumption forhot water production by deducting heating from the total. By doing
Fig. 3. Measured total power consumption, measured and estimated DHW power
consumption. The peaks of estimated power consumption for hot water production
have lower amplitudes and wider bases than the measured.
so, we obtained a combined uncertainty that varies between 6% and14% depending on the flow and temperature difference. Theuncertainty in the DHW estimate for energy consumption for in thistest was below 10%.
It is not always possible to install energy meters. The cost of themeter,installation and space requirement have to be considered.Especially for smaller (compact) substations, such as those used indomestic homes, the space requirement is critical. Installation ofadditional sensors may require extensive re-piping, as they mustbe built as compactly as possible, with the fewest ‘‘straights’’necessary to ensuring proper flow measurements [17,18]. There-fore, we believe that estimation is a very good option in manycases, considering both accuracy and cost effectiveness.
In general, we conclude that
a. T
he study indicates that the estimation uncertainty of ECOS is�10%, which is less than the combined uncertainty for the twoenergy meters.b. T
he estimation approach has the potential to be a useful tool forestimating energy consumption in buildings.c. T
he estimation uncertainty is comparable to that for class 3energy meters.d. Im
plementing ECOS in energy meters lowers the cost comparedto measuring hot water production using an additional energymeter.Future work will include experimental verification of the ECOSalgorithm for parallel coupled substations.
Acknowledgements
We wish to express our gratitude to Svensk Fjarrvarme forfunding this research and to HSB Norr for letting us use theirbuilding and Internet connection for the field test. A special thanksto Hans Engstrom for his help and Lulea Energy for funding theinstallation of the measurement equipment.
References
[1] F.J. Rey, E. Velasco, F. Varela, Building Energy Analysis (BEA): a methodology toasses building energy labelling, Energy and Buildings (July) (2007) 709–716.
[2] B. Bohm, P.O. Danning, Monitoring the energy consumption in a district heatedapartment buliding in Copenhagen, with specific interest in the thermodynamicperformance, Energy and Buildings (36) (2004) 229–236.

K. Yliniemi et al. / Energy and Buildings 41 (2009) 169–174174
[3] L. Gullev, M. Poulsen, The Installation of Meters Lead to Permanent Changes inConsumer Behaviour, News from DBDH, No. 3, 2006.
[4] T. Ueno, R. Inada, O. Saeki, K. Tsuji, Effectiveness of an energy consumptioninformation system for residental buildings, Applied Energy (November)(2006) 868–883.
[5] T.A. Koiv, A. Toode, Trends in domestic hot water consumption in Estonianapartment buildings, in: Proceedings Estonian Acad. Sci. Eng., 2006.
[6] K. Yliniemi, Fault Detection in District Heating Substations, Lic. thesis, LuleaUniversity of Technology, Lulea, Sweden, November 2005.
[7] K. Yliniemi, A Method and a Device for Measurement of Energy for Heating TapWater Separated from the Buildings Heating Energy Consumption, World Intel-lectual Property Organization (WIPO), No. PCT/SE2006/001250, 2007 (PCT patentapplication).
[8] K. Yliniemi, Y. Jomni, J. Delsing, J. van Deventer, Saber energy meter for districtheating substations, in: Annual International District Energy Association Con-ference, Arizona, USA, June 19, 2007.
[9] J. Gustafsson, J. van Deventer, J. Delsing, Thermodynamic simulation of a detachedhouse with district heating subcentral, in: SysCon 2008—IEEE InternationalSystems Conference, IEEE, 2008.
[10] T. Persson, District Heating for Residential Areas with Single-Family Housing, PhDthesis, Lund Institute of Technology, Sweden, 2005.
[11] P. Gummerus, Analys av Konventionella Abonnentcentraler i Fjarrvarmesystem,PhD thesis, Chalmers Tekniska Hogskola, Goteborg, Sweden, October 1989.
[12] J. Wollerstrand, District Heating Substations Performance, Operation and Design,PhD thesis, Lunds Tekniska Hogskola, Sweden, 1997.
[13] Svensk Fjarrvarme, Fjarrvarmecentralen utforande och installation, Tekniskabestammelser F:101, Svensk Fjarrvarme, Sweden, November 2004.
[14] Standard, Heat Meters. Part 1. General Requirements, Technical Report SS-EN1434-1, Svensk Standard, Sweden, 1997.
[15] Svensk Fjarrvarme, F:104 varmematare-tekniska branschkrav och rad om matar-hantering, Tekniska bestammelser F:104, Svensk Fjarrvarme, Sweden, 2004.
[16] H.W. Coleman, W.G. Steele, Experimentation and Uncertainty Analysis forEngineers, 2nd ed., Wiley Interscience, USA, 1999.
[17] C. Carlander, Installation Effects and Self Diagnosis for Ultrasonic Flow Meters,PhD thesis, Lulea University of Technology, Sweden, 2001.
[18] J. Berrebi, Self-Diagnosis Techniques and Their Applications to Error Reduction forUltrasonic Flow Measurement, PhD thesis, Lulea University of Technology, Swe-den, 2004.