experimental evidence from hong kong's anti-authoritarian ...
95
PROTESTS AS STRATEGIC GAMES: EXPERIMENTAL EVIDENCE FROM HONG KONG’S ANTI-AUTHORITARIAN MOVEMENT * DAVIDE CANTONI DAVID Y. YANG NOAM YUCHTMAN Y. JANE ZHANG † October 2018 Abstract Social scientists have long viewed the decision to protest as strategic, with an individual’s par- ticipation a function of her beliefs about others’ turnout. We conduct a framed field experiment that re-calibrates individuals’ beliefs about others’ protest participation, in the context of Hong Kong’s ongoing anti-authoritarian movement. We elicit subjects’ planned participation in an upcoming protest and their prior beliefs about others’ participation, in an incentivized manner. One day before the protest, we randomly provide a subset of subjects with truthful informa- tion about others’ protest plans, and elicit posterior beliefs about protest turnout, again in an incentivized manner. After the protest, we elicit subjects’ actual participation. This allows us to identify the causal effects of positively and negatively updated beliefs about others’ protest par- ticipation on subjects’ own turnout. In contrast with the assumptions of many recent models of protest participation, we consistently find evidence of strategic substitutability. We provide guidance regarding plausible sources of strategic substitutability that can be incorporated into theoretical models of protests. Keywords: Political movements, strategic behavior, collective action, beliefs JEL Classification: D74, D8, P0 * Cantoni: Ludwig-Maximilians-Universit¨ at Munich, CEPR, and CESifo. Email: [email protected]. Yang: Har- vard University and J-PAL. Email: [email protected]. Yuchtman: London School of Economics, NBER, and CESifo. Email: [email protected]. Zhang: Hong Kong University of Science and Technology. Email: [email protected]. Helpful and much appreciated suggestions, critiques and encouragement were provided by Ned Augenblick, Doug Bernheim, Ernesto Dal B ´ o, Matthew Gentzkow, Peter Lorentzen, Muriel Niederle, Torsten Persson, and many seminar and conference participants. Moritz Leitner, Glen Ng and Meggy Wan provided excellent research assistance. We thank Cathrin Mohr for providing data on East German protests. Cantoni acknowledges financial sup- port from the LMUexcellent Junior Researcher Fund and the European Research Council (ERC) under the European Union’s Horizon 2020 resarch and innovation programme (grant agreement n. 716837). The research described in this article was approved by the University of Munich IRB, protocol 2016-11; by the Stanford University Institutional Re- view Board, Protocol 38481; by the University of California-Berkeley Committee for Protection of Human Subjects, Protocol ID 2015-05-7571; and by the Hong Kong University of Science and Technology Human Participants Research Panel, submission 126. The experiment is registered on the AEA RCT registry with ID AEARCTR-0001423. † Corresponding author: Davide Cantoni. Ludwig-Maximilians-Universit¨ at Munich, Geschwister-Scholl-Platz 1, 80539 Munich, Germany. Phone: +49 89 2180 6260. Fax: +49 89 2180 17823. Email: [email protected].
-
Upload
khangminh22 -
Category
Documents
-
view
2 -
download
0
Transcript of experimental evidence from hong kong's anti-authoritarian ...
PROTESTS AS STRATEGIC GAMES:
EXPERIMENTAL EVIDENCE FROM HONG KONG’SANTI-AUTHORITARIAN MOVEMENT*
DAVIDE CANTONIDAVID Y. YANG
NOAM YUCHTMANY. JANE ZHANG†
October 2018
Abstract
Social scientists have long viewed the decision to protest as strategic, with an individual’s par-ticipation a function of her beliefs about others’ turnout. We conduct a framed field experimentthat re-calibrates individuals’ beliefs about others’ protest participation, in the context of HongKong’s ongoing anti-authoritarian movement. We elicit subjects’ planned participation in anupcoming protest and their prior beliefs about others’ participation, in an incentivized manner.One day before the protest, we randomly provide a subset of subjects with truthful informa-tion about others’ protest plans, and elicit posterior beliefs about protest turnout, again in anincentivized manner. After the protest, we elicit subjects’ actual participation. This allows us toidentify the causal effects of positively and negatively updated beliefs about others’ protest par-ticipation on subjects’ own turnout. In contrast with the assumptions of many recent modelsof protest participation, we consistently find evidence of strategic substitutability. We provideguidance regarding plausible sources of strategic substitutability that can be incorporated intotheoretical models of protests.
Keywords: Political movements, strategic behavior, collective action, beliefsJEL Classification: D74, D8, P0
*Cantoni: Ludwig-Maximilians-Universitat Munich, CEPR, and CESifo. Email: [email protected]. Yang: Har-vard University and J-PAL. Email: [email protected]. Yuchtman: London School of Economics, NBER,and CESifo. Email: [email protected]. Zhang: Hong Kong University of Science and Technology. Email:[email protected]. Helpful and much appreciated suggestions, critiques and encouragement were provided by NedAugenblick, Doug Bernheim, Ernesto Dal Bo, Matthew Gentzkow, Peter Lorentzen, Muriel Niederle, Torsten Persson,and many seminar and conference participants. Moritz Leitner, Glen Ng and Meggy Wan provided excellent researchassistance. We thank Cathrin Mohr for providing data on East German protests. Cantoni acknowledges financial sup-port from the LMUexcellent Junior Researcher Fund and the European Research Council (ERC) under the EuropeanUnion’s Horizon 2020 resarch and innovation programme (grant agreement n. 716837). The research described in thisarticle was approved by the University of Munich IRB, protocol 2016-11; by the Stanford University Institutional Re-view Board, Protocol 38481; by the University of California-Berkeley Committee for Protection of Human Subjects,Protocol ID 2015-05-7571; and by the Hong Kong University of Science and Technology Human Participants ResearchPanel, submission 126. The experiment is registered on the AEA RCT registry with ID AEARCTR-0001423.
†Corresponding author: Davide Cantoni. Ludwig-Maximilians-Universitat Munich, Geschwister-Scholl-Platz 1,80539 Munich, Germany. Phone: +49 89 2180 6260. Fax: +49 89 2180 17823. Email: [email protected].

I INTRODUCTION
Mass political movements have long demanded fundamental political rights. Citizens have taken
to the streets from Tiananmen Square to Tahrir Square, from the Women’s Suffrage Movement
to the Civil Rights Movement, from the Velvet Revolution to Hong Kong’s Umbrella Revolution.
What drives individuals’ decisions to participate in political protests such as these?
Strategic considerations have long been seen as crucial, with an individual’s participation
shaped by her beliefs about the participation of others. On the one hand, protests are a classic
example of a political collective action problem: individuals have an incentive to free-ride on the
costly participation of others, and may thus be less willing to turn out when they believe more
others will do so, thus producing a game of strategic substitutes (Olson, 1965; Tullock, 1971; Pal-
frey and Rosenthal, 1984). On the other hand, much recent theoretical work assumes strategic
complementarity: this might arise because the cost of participation is anticipated to be lower when
a protest is larger; because participatory utility is greater in a larger, more successful protest; or,
because one’s utility under a post-revolution regime will be greater if one was a protest participant
(see, for example, Bueno de Mesquita, 2010; Edmond, 2013; Barbera and Jackson, 2017; Passarelli
and Tabellini, 2017). Indeed, in a recent review article, Gehlbach et al. (2016, p. 579) go so far as to
affirm that strategic complementarity “characterizes mass protests.”1
In this paper, we identify the causal effect of beliefs about other individuals’ protest turnout
on one’s own, conducting a framed field experiment with potential participants in an anti-au-
thoritarian protest in Hong Kong. We study participation in a July 1 March, a yearly protest
that represents an important component of Hong Kong’s ongoing anti-authoritarian movement,
epitomized by the recent Umbrella Revolution.2 The July 1 March shares many essential charac-
teristics with anti-authoritarian protests across time and space: participants aim to achieve policy
concessions from an authoritarian regime by turning out in large numbers, facing the threat of
1Emphasis added by the authors. See also Granovetter (1978); Kuran (1989, 1991, 1997); Chwe (2000); Fearon (2011);Kricheli et al. (2011); Egorov and Sonin (2018) for models of protests in which participation is a game of strategiccomplements. Some recent theoretical work allows for the possibility of strategic substitutability in the context of thesame protest game: see Shadmehr and Bernhardt (2011); Shadmehr (2018).
2In Cantoni et al. (2016), we provide a complementary, descriptive study of the characteristics of supporters of HongKong’s anti-authoritarian movement.
1

government crackdown. In this context, we experimentally re-calibrate individuals’ beliefs about
others’ protest participation, and study how these beliefs affect one’s own participation. We find
consistent evidence of strategic substitutability in the decision to protest, challenging many recent
models of protest participation that assume strategic complementarity.
While much theoretical work has been done on the strategic element of the protest decision,
empirical evidence on the causal effect of beliefs regarding others’ protest turnout on one’s own is
extremely limited. Several recent articles have provided causal evidence on a bundle of “social”
influences on protest participation: Enikolopov et al. (2016) present evidence that the diffusion of
an online social network increased protest turnout in Russia; Gonzalez (2016) provides evidence
that peers’ participation in Chilean student protests increased one’s own; and, Manacorda and
Tesei (2016) provide evidence that mobile phones’ diffusion increased protest turnout in Africa.
However, these analyses are unable to separately identify the effects of beliefs about the protest
participation of others on one’s own participation, instead estimating the combined effects of (i)
learning about a protest’s logistics (e.g., time and place); (ii) learning about the state of the world;
and, (iii) learning about others’ protest turnout.3
Credibly testing for a causal effect of beliefs about others’ turnout in the decision to protest
against an authoritarian regime has been hindered by two empirical obstacles. First, anti-authorit-
arian political movements have typically been studied ex post (e.g., Kuran, 1989, 1991, 1997; Opp
and Gern, 1993; Lohmann, 1994). This not only generates selection issues — movements are gener-
ally studied after they have become large and successful — but also makes the prospective study
of beliefs nearly impossible: belief elicitation would necessarily be retrospective and likely dis-
torted by the realization of the political outcomes of interest.
Second, even when measured in real time, it is extremely difficult to exploit variation in beliefs
to identify causal effects. Naturally-occurring variation is very likely to be endogenous with re-
spect to behaviors of interest. Experimental variation, e.g., arising from an information treatment,
runs into challenges from heterogeneous priors, which imply that the same information treatment
can generate positive belief updating among one subset of the sample (i.e., those whose priors are
3Other recent empirical work on the causes and consequences of mass political movements includes Madestam etal. (2013); Yanagizawa-Drott (2014); DellaVigna et al. (2014); Acemoglu et al. (2014).
2

below the information provided) and negative updating among another subset.4 This means, for
example, that even an effective intervention may produce average treatment effects on beliefs or
on behavior that spuriously appear to be null results. The average effects would simply reflect
offsetting heterogeneous treatment effects of opposite signs. Thus, experimental interventions
aimed at manipulating beliefs require carefully measured priors (and ideally posteriors as well)
to determine exactly how the treatment affects particular individuals’ beliefs, and through beliefs,
behavior.
We overcome each of these obstacles, as follows. First, we study participation within an ongo-
ing, high-stakes political movement: Hong Kong’s anti-authoritarian movement.5 Because Hong
Kong’s democrats traditionally protest the rule of the Chinese Communist Party (CCP) each July
1, there exists a known protest about which we can elicit beliefs prospectively, in real time. Sec-
ond, using a three-part online experiment we conducted at the Hong Kong University of Science
and Technology (HKUST), we are able to elicit the prior beliefs of over 1,200 university students
regarding the protest turnout of their classmates in the upcoming July 1 March (in an incentivized
manner); we are then able to provide an information treatment to a random subset and elicit pos-
terior beliefs (again in an incentivized manner); finally, we are able to elicit the students’ own
protest participation.
The goal of our experimental design is to isolate the causal effect of variation in beliefs regard-
ing others’ protest participation on one’s own protest participation. To do so, we provide a random
subset of individuals in our sample truthful information intended to shift beliefs regarding others’
protest participation. A challenge we face is that such information must be provided prior to the
protest itself — before we know the actual protest decisions of others. To solve this problem, one
week before the protest, we collect information on individuals’ own planned protest turnout, on
individuals’ beliefs about others’ planned turnout, as well as individuals’ beliefs about others’ fu-
ture actual turnout at the protest. This allows us to provide truthful information regarding others’
4See Coffman et al. (2015) for a theoretical analysis of the effects of information nudges.5The eventual success or failure of the movement is likely to have repercussions throughout “Greater China” (and
thus around the world) given concerns in Hong Kong, mainland China, as well as in Taiwan, over the increasinglyauthoritarian and nationalistic policies undertaken by the Chinese Communist Party. Our work contributes to a grow-ing empirical literature on the political economy of the region: for example, Lorentzen (2013) highlights the centralgovernment’s tolerance of certain types of protests; King et al. (2013) study information control policies that aim atsuppressing collective actions.
3

planned participation, plausibly affecting beliefs regarding others’ actual protest participation.
A day before the protest, we provide a random subset of individuals in our sample truthful
information about the planned participation of their classmates. We estimate the “first stage”
effect of information regarding others’ planned participation on individuals’ (posterior) beliefs re-
garding others’ actual participation. Next, we estimate the “reduced form” effect of information
regarding others’ planned participation on individuals’ own actual protest participation. Impor-
tantly, we split our analysis into two subsamples: those whose prior beliefs were below the true
level of planned participation (whose beliefs regarding actual turnout, we expect, should be pos-
itively affected) and those whose prior beliefs were above the true level of planned participation
(whose beliefs regarding actual turnout, we expect, should be negatively affected).6
Our findings consistently point to our sample of Hong Kong students viewing the strategic
component of their protest decision as being a game of strategic substitutes. Among subjects
whose prior beliefs regarding others’ planned participation were below the truth, the experimental
provision of information regarding the true level of other subjects’ planned participation has a
significant, positive effect on beliefs about actual participation in the protest, and a significant
negative effect on subjects’ own turnout. Among subjects whose prior beliefs regarding others’
planned participation were above the truth, the experimental provision of information regarding
the true level of other subjects’ planned participation has a significant, negative effect on beliefs
about actual participation in the protest, and a significant positive effect on subjects’ own turnout.
We are able to address several concerns about our analysis. First, using list experiments, we
provide evidence that our experimental subjects are willing to truthfully report on potentially
sensitive political attitudes related to their participation in the July 1 protest; this helps assuage
concerns regarding our reliance on a self-reported measure of protest turnout (see Section III.C).7
Second, we can rule out a major threat to internal validity: the possibility that information about
6Note that in addition to providing evidence on balance between treatment and control groups in the full exper-imental sample, we present evidence of balance within each of these subsamples (see Section III). This sample splitrelies on our elicitation of beliefs about both others’ planned participation and others’ actual participation. The formergives us a measure of where priors stood relative to the experimental information we are able to provide to subjectsprior to the protest itself (i.e., on planned participation). The latter gives us a measure of the priors we care about whenexamining belief updating in the first stage analysis (i.e., changes in beliefs regarding actual participation).
7One might be particularly concerned about misreporting in survey data collected in authoritarian settings (seeReny, 2016 for a discussion of challenges facing social scientists in China). Indeed, analyses of political behavior in realtime are more common in settings that are already politically free (e.g., Gerber et al., 2011, 2017).
4

other subjects’ turnout affected not only beliefs about others’ protest participation, but also be-
liefs about the “quality” of the political movement itself. Such a confounding “social learning”
effect, however, would produce the appearance of strategic complementarity, not the strategic
substitutability that we find. Third, we can address concerns regarding experimenter demand
effects following a similar logic: typically, an experimenter’s implied endorsement of an action
(by indicating its popularity) would produce the appearance of strategic complementarity (see
Section IV.D).
We find suggestive evidence of three sources of strategic substitutability in our context (see
Section V). First, one aim of Hong Kong’s protests is to get a sufficient number of people onto the
street — this is a public good (as in Olson, 1965; Tullock, 1971; Palfrey and Rosenthal, 1984) that
could have tangible consequences and could serve as a signal of the movement’s strength to the
CCP and to other citizens. If subjects view attaining a threshold level of protest participation as
producing a political public good, this will tend to produce strategic substitutability. Consistent
with protest turnout being a public good, we find that more pro-social subjects are more likely to
protest, even conditional on ideology. Second, experimental subjects perceive not only a greater
likelihood of a protest’s success as protest size increases, but also a greater likelihood of govern-
ment crackdown. If the latter dominates, the result can be strategic substitutability. Third, subjects
may have social image concerns, and select into protest participation in part to signal their ideo-
logical “type” (as in Benabou and Tirole, 2011). If participation in a smaller protest sends a strong
enough signal, individuals wanting to signal their anti-authoritarian ideology may differentially
participate when they anticipate a protest will be small, thus producing a game of strategic sub-
stitutes. Consistent with this mechanism, we find that individuals who participate in the protests
after learning that protests will be smaller than expected have ideologically more extreme friends
than other protest participants.
Our results thus indicate that protests are not generically games of strategic complements —
as assumed in much recent work. Models of protest participation must allow for the possibility
of strategic substitutes. Yet it is important to emphasize that not all of the mechanisms we ob-
serve at work in Hong Kong will be present in all protests, and even if they are present, they
will not always outweigh forces generating strategic complementarity emphasized in other work.
5
As we discuss in the Conclusion (Section VI), we believe that our findings reflect the fact that
Hong Kong’s protests are part of a long-running movement, and that the Hong Kong govern-
ment protects basic rights of association and expression. Strategic substitutability thus seems most
likely to appear in protests that are part of larger movements, and protests demanding rights from
partially-democratic regimes, while forces pushing toward strategic complementarity may domi-
nate in one-shot protests that will end in the ousting of a dictator or the crushing of a movement.
We next, in Section II, provide an overview of Hong Kong’s ongoing democratic, anti-authori-
tarian movement and the July 1 March, in particular. Next, in Section III, we describe our experi-
mental design. In Section IV, we present our main findings and discuss threats to internal validity.
In Section V we discuss the theoretical implications of our findings and the characteristics of our
setting that may generate strategic substitutability in the protest game. Finally, in Section VI, we
discuss conditions under which strategic substitutability or complementarity are more likely, and
offer concluding thoughts.
II HONG KONG’S ANTI-AUTHORITARIAN MOVEMENT
II.A Political context
Prior to 1997, Hong Kong was a British colony, with limited democratic political rights, but strong
protections of civil liberties and respect for the rule of law. On July 1, 1997, Hong Kong was
returned to the People’s Republic of China, to be ruled as a Special Administrative Region with its
own quasi-constitution — the “Basic Law” — and a promise from China that its institutions would
be respected and maintained until 2047, under a policy known as “one country, two systems.” The
Basic Law left ambiguous several important details that have been bargained and battled over
between the so-called “pan-democracy” and “pro-Beijing” camps.
The first ambiguity to generate mass political protests was regarding Article 23 of the Basic
Law, which covered the legal regulation of speech and behavior that threatened the government.
Under the encouragement of Beijing, a law implementing provisions of Article 23 — the “National
Security Bill” — was proposed by the Hong Kong Chief Executive (the head of government) in
6

September 2002, and was seen by many Hong Kong citizens as deeply threatening to their human
rights and civil liberties.8 The proposed legislation catalyzed a massive July 1 March (in 2003) in
which an estimated half million people protested. This expression of popular opposition led to
the withdrawal of the bill, and no legislation on Article 23 has passed since.
More recently, political conflict has arisen from a second ambiguity in the Basic Law, regard-
ing the method of selection of Hong Kong’s Chief Executive. Article 45 of the Basic Law of Hong
Kong states the following: “The method for selecting the Chief Executive shall be specified in the
light of the actual situation in the Hong Kong Special Administrative Region . . . The ultimate aim
is the selection of the Chief Executive by universal suffrage upon nomination by a broadly repre-
sentative nominating committee in accordance with democratic procedures.” While indicating an
ultimate aim of universal suffrage, the Basic Law does not state when elections will be introduced,
nor does it clarify the details of nomination. From Hong Kong’s return to China until today, the
Chief Executive has been selected by an Election Committee, rather than by universal suffrage;
currently, the Committee is composed of 1,200 members, and is widely seen as pro-Beijing.
In 2014, the Twelfth National People’s Congress proposed an election mode that would have
allowed the citizens of Hong Kong a choice between two or three candidates, but these candidates
would be selected by the same pro-Beijing committee as before.9 In response to this limited ex-
pansion of democratic rights, a massive July 1 March was mobilized, with hundreds of thousands
of citizens taking to the streets. Further escalation and a police crackdown precipitated the even
larger-scale “Umbrella Revolution,” named for the ubiquitous umbrellas carried by participants.
The Umbrella Revolution persisted for months, being slowly cleared out by police by the end of
December 2014. While the movement did not alter the policy proposed by Beijing, it did send a
clear signal to the Hong Kong legislature (the “LegCo”) that a circumscribed change in institutions
was unacceptable to the people of Hong Kong. In June 2015, the LegCo struck down the Chinese
proposal led by the opposition of the pan-democratic camp.
Since June 2015, the democratic movement in Hong Kong has both fragmented and radical-
ized. Recent encroachments on Hong Kong citizens’ civil liberties, including the arrest of Hong
8For a discussion of these concerns, see the University of Hong Kong’s Human Rights Portal Page, “Research onArticle 23,” online at https://goo.gl/GdNcHY, last accessed February 28, 2018.
9Refer to https://goo.gl/0oyNmt, last accessed February 28, 2018.
7

Kong booksellers by the mainland Chinese government, have deepened some Hong Kong citi-
zens’ fear of the CCP and their sense of a Hong Kong identity very much distinct from — even
opposed to — that of mainland China. The result is that Hong Kong citizens and political parties
are now much more loudly calling for independence or “self determination.” “Localist” violence
has occasionally flared; new political parties, such as the student-led Demosisto, have formed and
won seats in the 2016 LegCo election on platforms explicitly calling for self-determination.10
II.B The July 1 Marches: characteristics and achievements
Marches on the anniversary of Hong Kong’s handover to China, held each July 1, have been de-
scribed as “the spirit of democratic struggle in Hong Kong.”11 The July 1 Marches have played
an important role in Hong Kong citizens’ political engagement with the Chinese government, and
have achieved major policy changes and even constitutional concessions — particularly when
large crowds of protesters were mobilized.12 Each protest March, while part of a broader anti-
authoritarian, democratic movement, is organized around a specific set of issues and policy aims.
The first notable achievement came as a response to the CCP’s September 2002 proposal for an
anti-subversion bill under Article 23, described above. The July 1, 2003, March included around
500,000 people — the largest political gathering in Hong Kong since the Chinese Democracy move-
ment of 1989. Not only was the proposed law withdrawn, but the March eventually forced the
resignation of multiple government officials, including the Chief Executive, Tung Chee-hwa.13
Another success followed the 2012 March, which included up to 400,000 people, and was part
of a mobilization against a CCP proposal for a mandatory “moral and national curriculum” in
Hong Kong schools. This proposal, too, was withdrawn shortly after the March. The 2014 March
again saw hundreds of thousands of people demanding the popular nomination of Chief Exec-
utive candidates in the 2017 election. Although the March did not achieve citizen nomination
10The legislators elected on a self-determination platform were since removed from office on various technicalitiesregarding their oath-taking, foreshadowing future conflict.
11“Sixteen Years of July 1st Marches: A Dynamic History of Hong Kong Citizens’ Fight for Democracy,” InitiumMedia, June 30, 2018. Available online at https://goo.gl/8bZDrf (last accessed July 5, 2018).
12A time series of turnout in July 1 Marches can be seen in Online Appendix Figure A.1.13In an opinion piece tellingly titled “July 1st March turnout size is absolutely important,” former LegCo member
Margaret Ng Ngoi-yee writes,“[T]he turnout at the July 1st Marches is absolutely important. If not for 500,000 peopletaking to the street in 2003, Article 23 would have been legislated already.” The Stand News, June 29, 2018. Availableonline at https://goo.gl/vgP3WP (last accessed July 5, 2018).
8

of Chief Executive candidates, it did produce the massive Umbrella Revolution and led to the
rejection of the CCP’s proposal for partial democratic rights.
Like others before it, the July 1, 2016, March studied here was organized around important
political aims: first, to denounce the perceived corruption of Beijing-backed Chief Executive CY
Leung. Second, to mobilize support for democratic — especially the newly-established localist —
political parties in the run-up to the 2016 LegCo Elections. While the protest was smaller than
some previous Marches (turnout was under 100,000 participants), it is noteworthy that Leung
chose not to run for re-election in 2017, despite being unconstrained by term limits; and, parties
opposed to Beijing won 55% of the LegCo vote share, with localist political parties winning nearly
20% of the vote in the 2016 election.14
Some characteristics of Hong Kong’s July 1 Marches may appear idiosyncratic: they are reg-
ularly scheduled events and they are largely tolerated by an authoritarian government. In fact,
these characteristics appear in other contexts. First, regularly scheduled protests are utilized by
many anti-authoritarian movements, from Russia’s “Strategy 31” movement demanding rights
of assembly to the “Monday demonstrations” in Leipzig that precipitated the fall of the German
Democratic Republic.15 Second, authoritarian regimes are often surprisingly tolerant of protests,
within limits. The “Monday demonstrations” in Leipzig were able to proceed in the late sum-
mer and autumn of 1989 despite the obvious feasibility of crackdown.16 In Russia, protesters
recently organized rallies in support of opposition politician Alexei Navalny on Vladimir Putin’s
65th birthday, in October 2017, and the Financial Times notes that in response to a protest of around
1,000 people in Moscow, “police largely left protesters alone.”17 Even in mainland China, the Com-
munist Party tolerates particular protests (Lorentzen, 2013). In each of these settings, there exists
a threat of crackdown ex ante, and — including in Hong Kong — police do crack down when
14Even using lower-end estimates of the protest size (30,000), as a percentage of the population this would make the2016 July 1 March around one-third of the size of the largest protest in US history, The Women’s March in 2017.
15Strategy 31 is discussed in “The Russian protesters who won’t give up,” by Luke Harding, The Guardian, August30, 2010. Available online at: https://goo.gl/vfwZro (last accessed December 9, 2017). Weeks of modestly-sized,regularly-scheduled protests prior to the massive events that led to the fall of the Berlin Wall can be seen in OnlineAppendix Figure A.2.
16See “A Peaceful Revolution in Leipzig,” by Andrew Curry, Spiegel Online, October 9, 2009. Available online at:https://goo.gl/iUakCp (last accessed December 9, 2017).
17Several dozen protesters were detained then released in St. Petersburg, which saw a protest of over 2,000 people.See “Anti-Putin protests mark Russian president’s birthday,” by Max Seddon and Henry Foy, Financial Times, October7, 2017. Available online at: https://goo.gl/4oWQzA (last accessed December 9, 2017).
9

protests cross the line.
Thus, like other anti-authoritarian protests, Hong Kong’s July 1 Marches demand (and occa-
sionally win) fundamental political rights — civil liberties and democratic institutions — from an
authoritarian regime. Like other anti-authoritarian protests, turnout is important for success. The
importance of protest size can be seen in our survey data: subjects in our experiment believe there
is a higher likelihood of protest success if a protest is larger (see Figure I). It can also be seen in
the differences between July 1 March organizers’ turnout estimates and the turnout estimates of
the Hong Kong police. Organizers consistently exceed independent estimates of July 1 March size
(and police estimates consistently fall below), with differences between the two reaching the tens
or even hundreds of thousands (see Online Appendix Figure A.1).
Finally, like other anti-authoritarian protests, there is the potential for a high personal cost to
be paid for turnout. Chinese authorities are deeply concerned about political instability in Hong
Kong, at least in part because of potential spillovers into mainland China.18 Thus, beyond the
time cost and the experience of heat, humidity, and rain on a Hong Kong summer’s day, the
concern of the Chinese government implies the potential for high participation costs: the possi-
bility of arrest and forceful police crackdowns using batons and tear gas — which have already
occurred — as well as the potential for more violent suppression, particularly by the People’s Lib-
eration Army stationed in Hong Kong. A New York Times article describes the Umbrella Revolution
in frightening terms: “On the first night, and for the next two weeks, rumors rippled through the
[protesters’] camp. Protesters were fearful of a bloody crackdown, like what happened in Tianan-
men Square.” Interestingly, subjects in our experiment believe there is a higher likelihood of a
government crackdown if a protest is larger (see Figure I). Our finding that beliefs about protest
success and government crackdown are both increasing in protest size suggest that (much like
in other anti-authoritarian protests) there are forces both for strategic complementarity and for
strategic substitutability in the July 1 March.19
18The Chinese government blocked Instagram — the last major uncensored social media platform available insidethe Great Firewall — when the Umbrella Revolution broke out at the end of September 2014 (Hobbs and Roberts, 2016).
19We discuss limitations on the generalizability of the Hong Kong context in the Conclusion (Section VI).
10

III EXPERIMENTAL DESIGN
III.A Design overview
Our experiment was conducted online in three parts.20 The goal of our experimental design is to
isolate the causal effect of variation in beliefs regarding others’ protest participation on one’s own
protest participation. To do so, we provide a random subset of individuals in our sample truthful
information intended to shift beliefs regarding others’ protest participation. A challenge we face
is that such information must be provided prior to the protest itself — before we know the actual
protest decisions of others.
We solve this problem by collecting information on individuals’ beliefs about others’ planned
turnout, as well as individuals’ beliefs about others’ future actual turnout at the protest. These
should be closely related and, crucially, we are able to elicit planned protest participation (as
opposed to actual participation) prior to the protest itself. This allows us to provide truthful
information regarding others’ planned participation, plausibly affecting beliefs regarding others’
actual protest participation.
We first estimate the “first stage” effect of information regarding others’ planned participation
on individuals’ (posterior) beliefs regarding others’ actual participation. Next, we estimate the
“reduced form” effect of information treatment regarding others’ planned participation on indi-
viduals’ own actual protest participation. Putting together the first stage and the reduced form,
we can estimate the effect of a change in beliefs about others’ participation on one’s own using
20The experiment described here was preregistered with the AEA along with a second experiment, which variedpersuasive messages regarding a democratic political party and examined the effects of these messages on contributionsto that party as well as on political attitudes and beliefs. The “persuasion” experiment was completed in Part 1 of thestudy, and was cross-randomized with the intervention studied here; importantly, all of the data collection for theother experiment occurred prior to the experimental intervention studied here (which was implemented in Part 2 of thestudy). Reflecting the cross-randomization of the two experiments, in Online Appendix Table A.1, we show that thevariables collected in Part 1 are generally balanced between the treatment and control groups in this study. In Section IV,we examine the impact of the unbalanced “Part 1” variables on our treatment effects, and find that they have almost noeffect on our treatment effect estimates (results are reported in Online Appendix Table A.2). It is important to emphasizethat the outcome variables considered in this paper’s analysis — posterior beliefs about the participation of others andsubjects’ own protest participation (collected in Part 3 of the study) — were the only outcome variables we collectedfollowing the experimental intervention we study here. We provide the full set of survey questions asked in Part 1 ofthe experiment (reformatted for brevity and organized thematically) in Online Appendix A.1. The full text of Parts 2and 3 of the study are reproduced in Online Appendices A.2 and A.3, respectively.
11

two-stage least squares.21
The broad outline of the design is as follows:
own report on participation
(p1) beliefs about planned
Control Treatment
(a1) beliefs about actual
2016/06/24
(a2) beliefs about actual
reminder of (a1)
(p1) beliefs about planned
(a1) beliefs about actual
reminder of (p1), sample avg. of (o)
(a2) beliefs about actual
(o) own report on plan (o) own report on plan
protest participation protest participation
own report on participation
reminder of (a1)
Part 1
2016/06/30Part 2
2016/07/01
2016/07/15Part 3
1. Part 1: On June 24, 2016, we elicited subjects’ own planned participation in the upcoming
July 1 March. We also elicited subjects’ beliefs regarding other subjects’ planned protest par-
ticipation. We refer to these as elicited priors regarding other subjects’ planned participation.
In the same survey, we elicited subjects’ beliefs regarding other subjects’ actual protest par-
ticipation on July 1, 2016. We refer to these as elicited priors regarding other subjects’ actual
participation. Finally, we elicited subjects’ beliefs regarding the total protest participation
among all Hong Kong citizens on July 1, 2016. We refer to these as elicited priors regarding
total actual turnout among all HK citizens.
2. Part 2: On June 30, 2016, we provided a random subset of our experimental sample with a
reminder of their prior beliefs regarding other subjects’ planned participation, as well as in-
formation regarding the true level of planned protest participation in the experimental sam-
ple.22 For both the information treatment group and the control group, we again elicited
21We discuss this two-stage estimate, particularly the implied exclusion restriction, in more detail below.22We provide the reminder of subjects’ priors in order to make the information treatment more salient, thus poten-
tially increasing the power of our intervention. Of course, the reminder might serve as an anchor for subjects’ responses,which could attenuate the treatment’s effects.
12

beliefs regarding other subjects’ actual protest participation on July 1, 2016. We refer to these
as elicited posteriors regarding other subjects’ actual participation. Comparing posteriors be-
tween the treatment and control groups provides an estimate of the “first stage” relationship.
We also elicited subjects’ beliefs regarding the total protest participation among all Hong
Kong citizens on July 1, 2016. We refer to these as posteriors regarding total actual turnout
among HK citizens.
3. Part 3: On July 15, 2016, we elicited subjects’ participation in the July 1 protest. Comparing
participation rates between the treatment and control groups provides an estimate of the
“reduced form” relationship of interest. Self-reported July 1 protest participation is also
the outcome in our two-stage estimates of the effects of beliefs regarding others’ protest
participation on one’s own.
III.B Experimental sample
Our sample of experimental subjects is drawn from the population of students at the Hong Kong
University of Science and Technology (HKUST). Studying a sample of students to understand
protest participation is ideal given students’ importance in Hong Kong’s democratic movement
and in the localist political parties pursuing self-determination. In Part 1 of the study, we re-
cruited participants on June 24, 2016, sending an email to the entire undergraduate population
of HKUST.23 We received 1,741 completed surveys, achieving a response rate of 19.1%. Among
these, we focus on the 1,576 students who were either born in Hong Kong or moved there prior
to high school (Hong Kong “natives”). Part 1 of the experiment elicited students’ political prefer-
ences, beliefs, attitudes, and planned and past political protest behavior. Because protests occur
every year on Handover Day, July 1, we asked a series of questions specifically eliciting planned
participation in the upcoming July 1 protest, as well as (prior) beliefs about turnout at the protest.
We paid students for their participation, and also provided additional payments as a function
23Our recruitment email informed students that we were researchers at HKUST, UC-Berkeley, Stanford, and theUniversity of Munich interested in understanding attitudes and preferences among college students in Hong Kong.The initial email did not explicitly mention our interest in political attitudes. All experimental materials were providedin English, the primary language of instruction at HKUST. Some bilingual support (i.e., materials provided in Chinesecharacters) was provided to clarify key terms.
13

of their choices in incentivized games and in incentivized belief elicitations. On average, respon-
dents received HKD 205, approximately US$ 25, for completing this first survey. Our experimental
intervention was conducted in Part 2 of the study, a very short online survey sent in an email on
June 30, 2016, and completed by 1,303 Hong Kong native students. Along with the experimental
intervention of interest, this second survey elicited (posterior) beliefs about turnout in the follow-
ing day’s protest. Students received a payment of HKD 25 for completing the survey. Finally, in
Part 3 of the study, we elicited students’ participation in the July 1 protest of 2016 in a third online
survey sent via email on July 15, 2016, and completed by 1,234 Hong Kong native students. Stu-
dents who completed Part 3 of the study received an additional payment of HKD 25. We present
summary statistics for the observable characteristics of the experimental sample — those subjects
who completed all three parts of the study — in Table I, columns 1 and 2.24
III.C Elicitation of plans, beliefs, and actual protest participation
Part 1: Subjects’ planned participation and prior beliefs
In Part 1 of the study, on June 24, 2016, we elicited subjects’ own planned participation in the
upcoming July 1, 2016, anti-authoritarian protest, asking:
Are you planning to participate in the July 1st March in 2016?
1 Yes
2 Not sure yet, but more likely than not
3 Not sure yet, but more unlikely than yes
4 No
We next elicited subjects’ beliefs regarding other subjects’ planned protest participation (i.e.,
elicited priors regarding planned participation). This elicitation, like all other belief elicitation in
24In Online Appendix Table A.3 we present summary statistics for the 1,576 Hong Kong native students who com-pleted Part 1 of the experiment, and for the 1,234 students in our experimental sample. One can see that the two groupsare extremely similar. The experimental sample of students is also similar to — though not precisely representative of— the broader HKUST student body on the dimensions of school of enrollment (i.e., students’ broad academic area),gender, and cohort (see Online Appendix Table A.4). Note that all of our findings are robust to re-weighting our exper-imental sample to match the composition of the HKUST student body or to match the composition of the 1,576 HongKong native students who completed Part 1 of the experiment (see Section IV.D, below).
14

this study, was conducted in an incentivized manner.25 Specifically, we asked:
Please guess what percentage of the participants from HKUST of this study plan to participate
in the July 1st March in 2016 (answer either “Yes” or “Not sure yet, but more likely than not”
to the above question on July 1st March in 2016).
If your guess is within 2 percentage points of the percent of students who actually answer either
“Yes” or “Not sure yet, but more likely than not,” you will earn a bonus payment of HKD 10.
In the same survey, we elicited subjects’ beliefs regarding other subjects’ actual protest partic-
ipation on July 1, 2016 (i.e., elicited priors regarding actual participation). We asked:
Please guess what percentage of the participants from HKUST of this study will participate
in the July 1st March in 2016.
If your guess is within 2 percentage points of the percent of students who actually participate,
you will earn a bonus payment of HKD 10.
Responses in Part 1 indicated that 16.9% of all subjects (including non-native Hong Kong stu-
dents) planned to participate in the July 1 protest of 2016 (i.e., answered either “Yes” or “Not
sure yet, but more likely than not” to the question regarding their plans for the upcoming July 1
protest). This is the number we use to provide “true” information regarding planned participa-
tion to experimental subjects (rounding to 17%). The experimental sample’s average prior belief
regarding planned protest participation was quite close to the truth, at 15.8%, but there was a great
deal of variation around the truth (the standard deviation was also 15.8 percentage points).
The sample’s average prior belief regarding others’ actual participation in the July 1 protest
was 13.8%, slightly below the average prior belief about others’ planned participation. Prior be-
liefs about others’ planned and actual participation are strongly associated, as expected (the cor-
25The survey and the incentives are necessarily coarse: we elicit respondents’ beliefs on how many other subjectsanswered “Yes” or “Not sure yet, but more likely than not”, not the entire distribution of beliefs. This corresponds toproviding an incentive for subjects to report their belief regarding the modal outcome, rather than the mean (thoughthese will correspond if subjects’ distributions of beliefs are are symmetric and single-peaked). We find that the distri-bution of prior beliefs regarding other students’ planned participation has a mean and a mode very close to the truelevel of planned participation in the sample. This is consistent with the incentives we provided generating thoughtful,truthful responses.
15

relation is 0.83).26
Finally, we elicited subjects’ prior beliefs regarding the total actual turnout at the July 1 March.
We asked:
How many people in total do you think will participate in the
July 1st March in 2016?
If your guess is within 10% of what will be reported by the HKUPOP
after the July 1st March in 2016, then you will earn a bonus payment of HKD 10.
To give you a sense, according to HKUPOP’s report, among the July 1st March
that took place between 2003 and 2015:
The lowest attendance in a given year is: 17,000 (in 2008);
The highest attendance in a given year is: 462,000 (in 2003).
The experimental sample’s average prior belief regarding total turnout in the July 1 protest
was 155,153.
Part 2: The experimental intervention and posterior beliefs
In Part 2 of the study, on June 30, 2016, we implemented the experimental intervention, randomly
assigning two-thirds of subjects to the treatment group and one-third to the control group.27 In
Table I, columns 1–3, we present data on the background characteristics, economic status, protest
plans, and prior beliefs of the treatment and control groups, and test for balance between them.
One can see that the treatment and control groups are very similar on these margins. As discussed
above, the impact of an information shock on beliefs, and thus behavior, should differ (having
effects of opposite sign) depending on whether the information provided was above or below
individuals’ prior beliefs. We will conduct much of our analysis separately examining individuals
26In Online Appendix Figure A.3, we present the distributions of subjects’ prior beliefs regarding others’ planned par-ticipation and regarding others’ actual participation. One can see in the figure that the distribution of priors regardingactual participation is shifted slightly to the left of the distribution of beliefs regarding planned participation.
27The decision to assign more individuals to the treatment group was made anticipating the possibility that somesubjects may have ignored Part 2 of the study, and thus effectively ended up in the control condition. Under such ascenario, we could have examined protest behavior among individuals who were actually treated and among individ-uals who were assigned to the control condition or who did not complete the survey in Part 2 of the study. In practice,the vast majority of subjects completed all three parts of the study, so the additional individuals in the treatment groupwere not strictly necessary.
16
with priors above and below the information treatment, or pooling all subjects, but coding the
treatment indicator as being equal to −1 for individuals with prior beliefs above the information
treatment in order to make the treatment effect monotonic.28 It is thus important to check for
balance within the two subsamples of interest — subjects with priors above and below the true
value of planned participation of 17%. One can see in Table I, columns 4–9, that treatment and
control groups within each subsample are well balanced.29
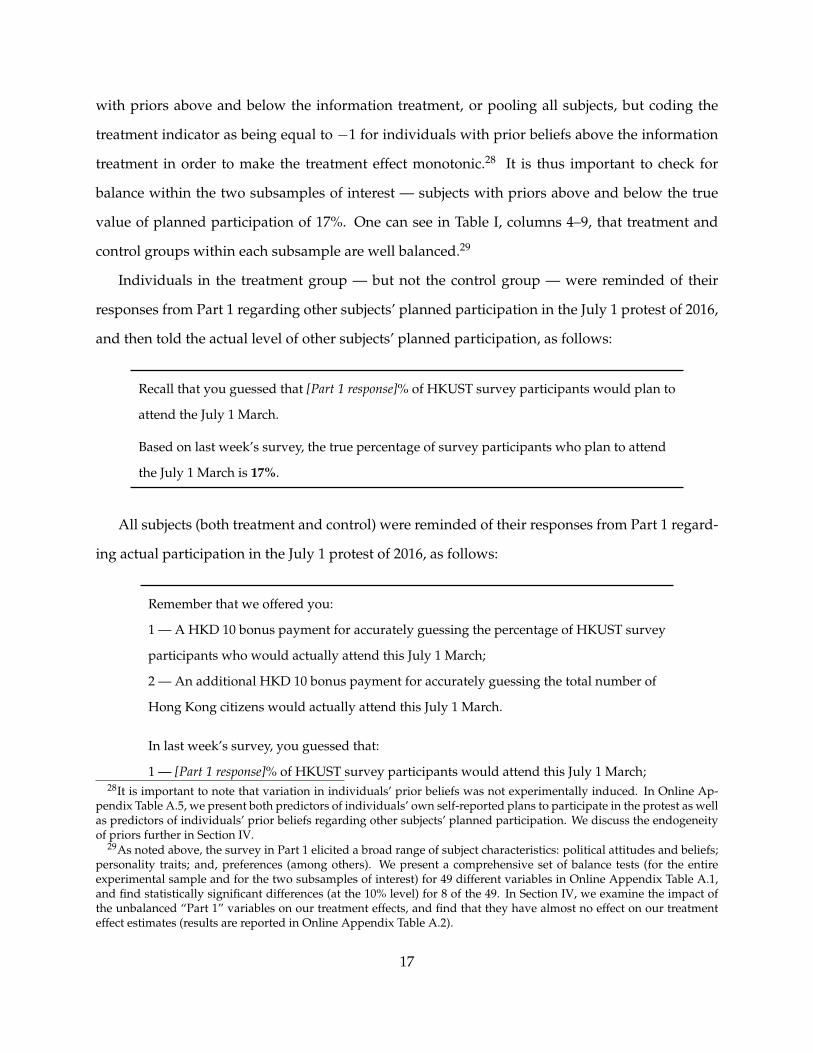
Individuals in the treatment group — but not the control group — were reminded of their
responses from Part 1 regarding other subjects’ planned participation in the July 1 protest of 2016,
and then told the actual level of other subjects’ planned participation, as follows:
Recall that you guessed that [Part 1 response]% of HKUST survey participants would plan to
attend the July 1 March.
Based on last week’s survey, the true percentage of survey participants who plan to attend
the July 1 March is 17%.
All subjects (both treatment and control) were reminded of their responses from Part 1 regard-
ing actual participation in the July 1 protest of 2016, as follows:
Remember that we offered you:
1 — A HKD 10 bonus payment for accurately guessing the percentage of HKUST survey
participants who would actually attend this July 1 March;
2 — An additional HKD 10 bonus payment for accurately guessing the total number of
Hong Kong citizens would actually attend this July 1 March.
In last week’s survey, you guessed that:
1 — [Part 1 response]% of HKUST survey participants would attend this July 1 March;28It is important to note that variation in individuals’ prior beliefs was not experimentally induced. In Online Ap-
pendix Table A.5, we present both predictors of individuals’ own self-reported plans to participate in the protest as wellas predictors of individuals’ prior beliefs regarding other subjects’ planned participation. We discuss the endogeneityof priors further in Section IV.
29As noted above, the survey in Part 1 elicited a broad range of subject characteristics: political attitudes and beliefs;personality traits; and, preferences (among others). We present a comprehensive set of balance tests (for the entireexperimental sample and for the two subsamples of interest) for 49 different variables in Online Appendix Table A.1,and find statistically significant differences (at the 10% level) for 8 of the 49. In Section IV, we examine the impact ofthe unbalanced “Part 1” variables on our treatment effects, and find that they have almost no effect on our treatmenteffect estimates (results are reported in Online Appendix Table A.2).
17

2 — A total of [Part 1 response] Hong Kong citizens would attend this July 1 March.
All subjects were then given an opportunity to update their responses from Part 1:
Perhaps since then your views have changed.
We now ask you again to provide guesses about actual attendance of
the July 1 March.
Instead of your guesses in the previous survey, we will use today’s guesses
to determine your bonus payment.30
1 How many people in total do you think will participate in the
July 1st March in 2016?
If your guess is within 10% of what will be reported by the HKUPOP
after the July 1st March in 2016, then you will earn a bonus payment of HKD 10.
To give you a sense, according to HKUPOP’s report, among the July 1st March
that took place between 2003 and 2015:
The lowest attendance in a given year is: 17,000 (in 2008);
The highest attendance in a given year is: 462,000 (in 2003).
2 Please guess what percentage of the participants from HKUST of this study
will participate in the July 1st March in 2016?
If your guess is within 2 percentage points of the percent of students who
actually participate, you will earn a bonus payment of HKD 10.
The experimental sample’s average posterior belief regarding the percentage of other subjects
who would actually participate in the July 1 protest was 14.5%; the average posterior belief re-
garding total actual turnout among HK citizens was 142,684. In fact, the July 1 protest of 2016 was
smaller than subjects expected: the protest was attended by 3% of experimental subjects, and only
26,000 people overall.31
30We chose to pay subjects based on their responses in Part 2 (rather than using responses in both Part 1 and Part 2)in order to minimize any income effects or strategic incentives (e.g., hedging). By reminding subjects of their responsesin Part 1 and allowing them to hold the same posteriors as priors, subjects were still able to be paid based on their Part1 responses.
31The smaller than expected protest was perhaps the result of an announcement on the morning of July 1 that the
18

Part 3: Measuring protest participation
In Part 3 of the study, on July 15, 2016, we elicited subjects’ participation in the July 1 protest of
2016.32 We asked subjects:
XXXX Did you attend the July 1 2016 March? XXXX
A response of “yes” to this question is our measure of individuals’ protest participation.33
An important concern regarding our measure of protest participation is that experimental sub-
jects may not report on their participation truthfully. This concern is particularly relevant in the
context of an ongoing anti-authoritarian movement. However, there are several reasons to believe
that self-reported protest turnout is a good measure in our context.34 First, the particular protest
that we study remained peaceful. While subjects faced a risk of government crackdown on the
protest ex ante, there was no concern regarding legal sanctions on participants two weeks after the
protest, when subjects’ protest participation was elicited. Second, for fear of government sanction
to produce measurement error, it would need to be the case that subjects were willing to take the
risk of attending a (very public) protest, but unwilling to tell us in a private survey that they did
so. While this is possible (they may misperceive the observability of their protest choice and fear
putting their behavior on the record), it strikes us as unlikely.
As a more direct test of our experimental subjects’ willingness to truthfully respond to politically-
sensitive survey questions, in Part 1 of the study we elicited several key dimensions of political
ideology that may be considered sensitive using “list experiments” (or, the “Item Count Tech-
arrested and returned Hong Kong bookseller, Lam Wing-kee, would not lead the protest, as had been expected, out offear for his safety. The Hong Kong Free Press headlined an article on June 28, “Organisers expect 100,000 to attend July1 democracy rally led by bookseller and ex-prisoners of conscience” (https://goo.gl/kgDYr1, last accessed December19, 2016). The same source headlined an article on July 1, “Returned HK bookseller will not lead July 1 democracymarch after ‘serious threat’ to safety” (https://goo.gl/dHcR9b, last accessed December 19, 2016).
32We waited two weeks before collecting information on March attendance as this gave us time to gauge whethersubjects would be comfortable responding to a direct question about attendance. Because there had been no arrests inthe weeks after the March, we felt comfortable asking subjects directly about their participation.
33We also ask those who attended the March a small number of follow-up questions. First, we asked them to indicatewhich of 28 groups’ crowds they joined at the protest (we also gave them the option of “Others”). Next, we asked forgeneral impressions of the protest in an open-ended manner, subject to a 300 word maximum. Finally, we asked aboutthe number of their friends who attended the protest. Because these questions were only asked of individuals whoattended the March, we do not consider them outcome variables in this analysis.
34This discussion of Hong Kong students’ willingness to report their political attitudes and behavior truthfully closelyfollows Cantoni et al. (2016).
19

nique”; Raghavarao and Federer, 1979). The list experiment provides “cover” for the expression
of possibly stigmatized attitudes at the individual level, but allows the researcher to estimate the
prevalence of these attitudes at the population level. We adopt a modified version of the standard
list experiment (Coffman et al., 2017) in which we also directly elicit the potentially stigmatized
attitudes from the control group. Thus, for each potentially sensitive political attitude, we are able
to compare the study sample’s estimated adherence to that attitude when “cover” is provided
(based on our list experiment) with the expressed adherence to that attitude in response to a direct
question (from the control group). We can then test whether there exists a significant distortion in
the expression of a particular attitude in response to a direct question (e.g., due to stigma or fear).
In Table II, we present the fraction of our sample expressing support for Hong Kong indepen-
dence; who consider themselves Hong Kongese rather than Chinese; who have a favorable view
of the ruling CCP; and, who support the use of violence in pursuit of Hong Kong’s political rights
(these estimates are based on subjects completing Part 1 of the study). In the left-hand column, we
simply present the population estimate of adherence to a political attitude based on direct ques-
tions. In the right-hand column, we show the difference between the estimate based on direct
questions and the estimate based on the list experiment. One can see that for three of the political
attitudes, there is no significant effect of providing respondents with “cover” for expressing their
views: this is true even for self-reported support for Hong Kong’s independence — a much more
extreme political position than simply attending a July 1 March.
Observing that the provision of “cover” by the list experiment does not affect estimated sup-
port for several sensitive attitudes, one might have been concerned that the “cover” provided by
the list experiment was insufficient to elicit truthful reporting. However, Table II does show one
significant difference between direct elicitation and list experiments: many students in our sample
support the use of violence in order to achieve Hong Kong’s political rights, but are afraid to say
so when directly asked. Finding a significant gap between direct questions and the list experi-
ment on this dimension suggests that subjects do value the cover provided by the list experiment
when it is needed — but it is not needed in response to political questions within the range of
non-violent opposition to the CCP. Because participation in the July 1 March falls within this non-
violent range, we are confident that subjects are willing to respond truthfully in response to direct
20

questions about their participation.
IV MAIN RESULTS
IV.A The first stage: effects on posterior beliefs
We begin by presenting the effects of the information treatment on individuals’ beliefs regarding
actual participation in the July 1 March — the “first stage.” Our focus is on posterior beliefs re-
garding the percentage of other experimental subjects who would actually participate in the July 1
March, rather than on beliefs regarding the total number of participants in the Hong Kong popu-
lation. The former beliefs are more directly linked to the information provided regarding subjects’
planned participation. We will also present some evidence on posterior beliefs regarding total
turnout among HK citizens.
The effect of the information treatment — reminding treatment group subjects of their prior
beliefs regarding other subjects’ planned participation and informing them that 17% of experi-
mental subjects planned to attend the protest — can be seen in the distributions of beliefs regard-
ing subjects’ actual participation, presented in Figure II. Given that the information we provided to
subjects was above the prior beliefs of some (regarding planned participation) and below the prior
beliefs of others, if subjects believed that the information provided was truthful, and updated their
priors regarding actual participation in the direction of the new information, one would expect to
see a more compressed distribution of posteriors in the treatment group than in the control group.
Indeed, this is precisely what one observes in Figure II: one can see in the figure that the treatment
group’s posteriors are distributed much more tightly between 10% and 20%.35
We next more closely examine the anticipated heterogeneous effects of the information treat-
ment depending on subjects’ prior beliefs. In Figure III, we present a binned scatter plot of the
change in beliefs (posteriors minus priors) regarding other subjects’ actual participation against
subjects’ priors regarding other subjects’ planned participation. In the left-hand panel, one can see
that, as predicted, subjects in the treatment group with priors regarding planned participation be-
35A Kolmogorov-Smirnov test of equality of posterior distributions between the treatment and control groupsstrongly rejects the null (p < 0.001).
21

low (above) the information provided consistently updated their beliefs regarding other subjects’
actual participation positively (negatively). Subjects in the treatment group with priors more dis-
tant from the information provided updated their beliefs more than those with priors closer to the
information provided. Individuals in the control group with lower priors tended to update their
beliefs positively, and vice versa, but the changes in beliefs are tiny compared to those observed
in the treatment group (see the right-hand panel of Figure III).36
Observing that belief updating in the treatment group systematically differs in sign between
subjects with priors above and below the information provided, we now present, in Figure IV,
the prior and posterior beliefs regarding other subjects’ actual participation for the treatment and
control groups, split by priors regarding planned participation above and below the information
treatment. Recall that treatment and control groups are generally balanced on observable char-
acteristics within each of these subsets (see Table I, columns 4–9). One can see in the figure that
among individuals with priors regarding other subjects’ planned participation below (above) the
true level, there is a significantly greater increase (decrease) in posteriors among the treatment
group than among the control group.
We next estimate regression models predicting posterior beliefs regarding other subjects’ ac-
tual participation as a function of treatment status, controlling for individuals’ prior beliefs re-
garding others’ actual participation.37 To begin, we pool all subjects, but we code the treatment
variable as being equal to −1 for individuals whose prior beliefs regarding the planned participa-
tion of other subjects were above the truth, in order to make the treatment effect monotonic. The
coding of the treatment variable reflects our strong priors, as well as the evidence presented in
Figure III, that individuals in the treatment group update their beliefs about the actual participa-
tion of others in opposite directions depending on whether their prior beliefs about the planned
participation of others were above or below the information provided. One can see in Table III,
Panel A, column 1, that the experimental treatment statistically significantly moved beliefs, by just
36The updating of beliefs among the control group may result from newly acquired information from outside thestudy, or from information spilling over from the treatment group; such information spillovers would tend to biasestimated effects (in both the “first stage” and the “reduced form”) toward zero.
37In Online Appendix Table A.6 we present an alternative specification, in which the outcome variable is a subject’schange in beliefs (posteriors minus priors) regarding other subjects’ actual participation. We focus on belief levels inthe main text as this specification is less restrictive on the coefficient on prior beliefs and because models of protestparticipation typically focus on belief levels, rather than belief changes, as the drivers of protest participation.
22

below 6 percentage points.38
We next split the experimental sample into groups with priors regarding planned participation
above and below the true level of planned participation of 17%. In Table III, Panel A, columns 2
and 3, one can see statistically significant belief updating in each subsample. Among individu-
als with prior beliefs regarding planned participation of other subjects below (above) the truth,
treatment increases (decreases) beliefs regarding other subjects’ actual turnout by around 4.5 (9.5)
percentage points. A test of equality of the coefficients estimated in Table III, Panel A, columns 2
and 3, is rejected with p < 0.001.
We explore the robustness of the first stage estimates along two margins in Table III. First,
we examine whether controlling for subject characteristics affects the estimated treatment effects.
One can see in Table III, Panel B, columns 1–3, that controlling for subjects’ background char-
acteristics and economic status (variables presented in Table I) does not meaningfully affect the
estimated treatment effects in either the pooled regression or the split sample regressions. As a
second robustness exercise, we consider the possibility that our results are strongly influenced
by individuals with extreme priors; we thus drop from our sample the 5% of subjects with the
lowest prior beliefs and the 5% of subjects with the highest prior beliefs regarding the planned
participation of others. One can see in Table III, Panel C, columns 1–3, that dropping individuals
with extreme priors does not greatly affect our results (though the coefficient estimated from the
sample with priors above 17% is somewhat attenuated).
An additional important consideration is whether our statistical inferences based on tradi-
tional standard errors are sound.39 As an alternative, we randomly assign (fictional) treatment
status (in the same 2/3 treatment, 1/3 control ratio used in the actual experiment) and estimate
first stage treatment effects 10,000 times each for the subsample of subjects with prior beliefs re-
garding others’ planned participation below 17% and the subsample with prior beliefs regarding
others’ planned participation above 17%. We can then compare the t-statistics from the estimated
38We explore alternative “switching points” for the treatment variable (i.e., different levels of priors above which wecode treatment equal to −1) in Online Appendix Figure A.4. Specifically, we estimate the specification presented inTable III, Panel A, column 1, and plot the point estimate (and 95% confidence interval) for integer “switching points”from 0 to 100. One can see in the left-hand panel of Online Appendix Figure A.4 that we find the strongest first stageeffects when the coding of the treatment indicator switches at 17%.
39See Deaton and Cartwright (2016) for a discussion of challenges to statistical inference in randomized control trials.
23

treatment effects from the fictional treatment assignments to the t-statistics from the actual treat-
ment assignment (the actual estimates are those in Table III, Panel A, columns 2–3). We find that
our p-values using randomization inference, based on two-sided tests, are very similar to those
using standard inference (see Figure V).
Experimental subjects who updated their beliefs regarding other subjects’ turnout at the protest
also may have updated their beliefs regarding the turnout of Hong Kong citizens more generally.
We thus next examine the effect of the treatment on subjects’ beliefs regarding protest turnout
among the entire Hong Kong population. We replicate the specifications in Table III, columns 1–3,
but using as our outcome the posterior beliefs regarding the total turnout in the July 1 protest
of 2016 (and controlling for prior beliefs regarding the total turnout at the protest). In Table III,
columns 4–6, one can see suggestive evidence that the treatment affected beliefs regarding total
protest size in the same direction as it affected beliefs regarding other subjects’ turnout.
IV.B The reduced form: effects on protest turnout
We now turn to examining the effects of the information treatment on individuals’ own protest
participation. As we did in the analysis of the first stage, we split the experimental sample into two
groups: first, subjects whose prior beliefs regarding other subjects’ planned turnout were below
the truth; and, second, subjects whose prior beliefs regarding other subjects’ planned turnout were
above the truth. In the previous section we saw that in the former group, the treatment increased
beliefs regarding other subjects’ turnout, while in the latter group, the treatment reduced beliefs
regarding other subjects’ turnout.
In Figure VI, we present turnout levels among subjects in the treatment and control groups
in the two subsamples split according to priors. One can see in the figure that in the subsample
whose priors were below the truth, the information treatment caused a statistically significant fall
in turnout; in the subsample whose priors were above the truth, the information treatment caused
a statistically significant increase in turnout. In other words, we find evidence that the protest de-
cision is a negative function of beliefs regarding the turnout of others. It is worth emphasizing that
this relationship is found in independent tests on two distinct subsamples: both the subsample
with prior beliefs below the information provided, and the subsample with prior beliefs above.
24

The protest game in this setting is one of strategic substitutes.
We next turn to regression analysis of the reduced form relationship between treatment and
protest participation. As in the first stage analysis, we begin by pooling all subjects, coding the
treatment variable as being equal to −1 for individuals whose prior beliefs regarding the planned
participation of other subjects were above the truth, in order to make the treatment effect mono-
tonic. In Table IV, Panel A, column 1, one can see that the treatment causes a statistically significant
2.7 percentage point change in turnout in the opposite direction of the change in beliefs.40 We then,
in Table IV, Panel A, columns 2–3, split the experimental sample into groups with priors regarding
planned participation above and below the true level of planned participation of 17%, and find
significant effects in each subsample, matching the results shown in Figure VI (a test of equality
of the coefficients estimated in Table IV, Panel A, columns 2 and 3, is rejected with p < 0.001).
As in the first stage analysis, we address concerns about statistical inferences based on tradi-
tional standard errors in our study of the reduced form effects. We again use randomization in-
ference as an alternative, randomly assigning (fictional) treatment status and estimating reduced
form treatment effects 10,000 times each for the subsample of subjects with prior beliefs regarding
others’ planned participation below 17% and the subsample with prior beliefs regarding others’
planned participation above 17%. We then compare the t-statistics from the estimated treatment
effects from the fictional treatment assignments to the t-statistics from the actual treatment assign-
ment (the actual estimates are those in Table IV, Panel A, columns 2–3). We again find that our
p-values using randomization inference, based on two-sided tests, are very similar to those using
standard inference (see Figure VII).
The estimated reduced form treatment effects in Table IV, Panel A, are not only statistically
significant, but also indicate a substantively significant effect of the information treatment on po-
litical behavior. One can see this by comparing the variation in protest participation explained by
the treatment to the variation explained by the rich set of additional individual covariates we col-
lected in Part 1 of the experiment. In Online Appendix Table A.7, one can see that the treatment
40As was done in the first stage analysis, we explore alternative “switching points” for the treatment variable (i.e.,different levels of priors above which we code treatment equal to −1) in Online Appendix Figure A.4. Specifically, weestimate the specification presented in Table IV, Panel A, column 1, and plot the point estimate (and 95% confidenceinterval) for integer “switching points” from 0 to 100. One can see in the right-hand panel of the figure that we find thestrongest reduced form effects when the coding of treatment switches in the range between 15% and 30%.
25

actually has greater explanatory power than economic preferences, personality traits, cognitive
ability, background characteristics, or economic status.
The magnitude of the treatment effect can also be benchmarked against estimated political mo-
bilization effects in the existing literature in economics and political science. We follow DellaVigna
and Gentzkow (2010) in calculating the persuasion rate implied by our treatment: the fraction of
individuals who participate in the protest when treated, but who would not have turned out to
protest in the absence of the treatment. Among the subsample of individuals with priors above
the information we provided — whom the treatment moved in the direction of greater participa-
tion — we find a persuasion rate of 6.43%. DellaVigna and Gentzkow (2010) calculate persuasion
rates for 7 interventions that stimulate turnout, from get out the vote campaigns to media content;
our treatment, though it did not directly encourage protest turnout, has effects that exceed most
of the impersonal persuasive messages, for example, TV content or mass mailings encouraging
voter turnout.41
In Table IV, Panels B and C, we conduct robustness exercises analogous to those considered in
the first stage analysis. One can see that neither including controls for subjects’ prior beliefs re-
garding other subjects’ planned participation, subjects’ background characteristics, and economic
status (Panel B), nor trimming the 5% of subjects with the lowest and the 5% of subjects with
the highest prior beliefs regarding planned participation (Panel C), greatly affects the estimated
reduced form treatment effects.
We explore two additional dimensions of robustness in Online Appendix Table A.8. First, we
consider sample restrictions depending on subjects’ own plans to participate in the July 1 March.
One might believe that individuals who reported, without any uncertainty, a plan not to attend
the March (in Part 1 of the experiment) would be unlikely to have had their protest decision af-
fected on the margin by the experimental treatment. Consistent with this expectation, dropping
this group from our analysis results in larger estimated treatment effects than in the baseline spec-
ification. In contrast, one might expect individuals who reported, without any uncertainty, a plan
41The information treatment is not as effective as more personal interventions (e.g., door-to-door canvassing). Forcomparison, the findings in Gerber and Green (2000) imply persuasion rates of 1% for impersonal get out the votemailings and 15.6% for door-to-door visits. The magnitude of the treatment effect is sensible given the nature of ourinteractions with the students in our sample: our repeated interactions were more personal than a mass mailing ormass media campaign, but were less personal than a face-to-face interaction.
26

to attend the March would most likely to be closer to the margin — either confirmed in their plans
or deterred from them by the information treatment. Consistent with this logic, when we drop
subjects who planned to attend the March, we find attenuated (though still statistically signifi-
cant) treatment effects. A second exercise considers an alternative construction of the outcome
variable: an indicator of a change from plans in Part 1 of the experiment (no certain plan to at-
tend) to behavior in Part 3 (actual attendance at the March). We find qualitatively similar results
when we consider “changed plans” as the outcome variable.
We next examine heterogeneity in the reduced form treatment effect associated with subjects’
priors regarding the planned participation of others. In Figure III one could see that the largest
first stage effects were produced among individuals with prior beliefs far from the information
provided by the experimental treatment. We assess whether the largest reduced form effects are
also seen among those subjects whose prior beliefs were far from the true level of 17%. To do so,
we regress protest participation on the interaction between a treatment group dummy variable
and 5-percentage-point bins of priors regarding other subjects’ planned participation (as well as
lower-order terms). In Figure VIII, one can see the estimated coefficients on the interaction terms
as well as their 95% confidence intervals. The effect of the treatment on protest turnout was,
indeed, greatest among individuals whose priors were furthest from the information provided.
These findings provide reassuring evidence of consistency between the first stage effects and the
reduced form.42
Of course, the variation across subjects in their prior beliefs regarding others’ planned par-
ticipation is not experimentally induced, and is correlated with other variables that also shape
the decision to protest (recall that predictors of prior beliefs can be seen in Online Appendix Ta-
ble A.5). We next explore the extent to which variation in individual characteristics — rather than
variation in prior beliefs — is likely to be behind the heterogeneous treatment effects observed
in Figures III and VIII. We begin, in Table V, Panel A, column 1, by estimating a linear model of
heterogeneous first stage treatment effects associated with subjects’ prior beliefs regarding other
subjects’ planned participation (roughly, fitting a line through Figure III). As expected, we esti-
42A less parametric analysis of heterogeneity in the treatment effect associated with subjects’ priors — locally-weighted regression estimates of the treatment effect across subjects’ priors — can be seen in Online Appendix Fig-ure A.5. The patterns are broadly similar to those in Figure VIII.
27

mate a significant, positive y-intercept, and a significant, negative coefficient on the interaction
between the treatment dummy and prior beliefs. In Table V, Panel B, column 1, we estimate a
linear model of heterogeneous reduced form treatment effects associated with subjects’ prior beliefs
regarding other subjects’ planned participation (roughly, fitting a line through Figure VIII). As
expected, we estimate a significant, negative y-intercept, and a significant, positive coefficient on
the interaction between the treatment dummy and prior beliefs.
We next exploit our rich information about subjects to predict their priors using a linear model
including all 47 factors listed in Online Appendix Table A.5. These predicted priors represent “prob-
lematic” variation in beliefs: heterogeneity in treatment effects associated with predicted priors
may be driven by subjects’ observable characteristics rather than by beliefs. Having calculated for
each individual their predicted priors, we also are left with their residual priors — the component
of prior beliefs unexplained by the large set of observable characteristics.43 In Table V, Panels A
and B, column 2, we estimate linear models of heterogeneous first stage and reduced form treat-
ment effects associated with subjects’ predicted prior beliefs; these estimates are of the same sign
as, but are somewhat less precise than, estimates using actual priors. In Table V, Panels A and B,
column 3, we estimate linear models of heterogeneous first stage and reduced form treatment ef-
fects associated with both subjects’ predicted prior beliefs and residual priors. One can see that
while there exists statistically significant heterogeneity in the treatment effect associated with the
“problematic” variation in predicted priors, there also exists statistically significant heterogeneity
in the treatment effect associated with just the residual priors. This provides reassurance that the
heterogeneous treatment effects we observe are indeed driven by variation in beliefs.
IV.C Two-stage estimates: the effects of beliefs on turnout
Thus far we have shown that providing information regarding the true level of planned protest
turnout among our experimental sample caused: (i) beliefs regarding actual turnout to change;
and, (ii) subjects’ own turnout to change, with beliefs and turnout moving in opposite directions.
43Note that it is not the case that heterogeneity in treatment effects associated with predicted priors is necessarilydriven by observables, rather than by beliefs, but simply that this cannot be ruled out. Note, too, that heterogeneityin treatment effects associated with residual priors is not necessarily driven by beliefs alone, as it might be driven byunobserved characteristics. Our rich data collection makes the latter less of a concern, but does not eliminate it.
28

We next combine the two effects — first stage and reduced form — in a two-stage analysis that
allows us to estimate the effect of beliefs regarding others’ turnout on one’s own turnout. It is
worth emphasizing that one should not interpret the two-stage estimates too literally: we have
already shown that the information treatment affected beliefs regarding the turnout of both other
experimental subjects and Hong Kong citizens more generally, so we cannot estimate the “pure”
casual effect of a one percentage point change in beliefs regarding other subjects’ turnout.44 With
this caveat in mind, we still believe this exercise is instructive. Specifically, we predict individu-
als’ protest turnout using their posterior beliefs regarding other experimental subjects’ actual par-
ticipation, instrumenting for the latter with the treatment dummy (when examining the pooled
sample, we instrument for posteriors setting the treatment equal to -1 for individuals with prior
beliefs regarding the planned participation of others greater than 17%).
We begin by estimating the two-stage model using the pooled sample, controlling only for
subjects’ prior beliefs regarding other subjects’ actual turnout. In Table VI, Panel A, column 1, one
can see that we estimate just over a one-half percentage point decrease in one’s own turnout for
every percentage point increase in one’s posterior beliefs regarding the turnout of others. Table VI,
Panel A, columns 2–3, we split the experimental sample into groups with priors regarding planned
participation above and below the true level of planned participation of 17%, and find significant
effects in each subsample. It is worth noting that while we had found larger first stage and reduced
form treatment effects in the subsample with priors above 17% (see Tables III and IV), in Table VI,
Panel A, columns 2–3, we find very similar estimated effects of beliefs about others’ turnout on
one’s own turnout in the two subsamples — around half a percentage point effect (a test of equality
of the coefficients estimated in Table VI, Panel A, columns 2 and 3, fails to reject the null, with
p = 0.585).
44Another important “reference population” whose turnout might affect subjects’ own is subjects’ close friends.While we do not observe prior and posterior beliefs regarding close friends’ turnout, it is worth noting that we donot expect these beliefs to have been affected by our experimental intervention: students likely knew well whethertheir close friends would attend the July 1 March regardless of their treatment status. We explore heterogeneity inthe first stage and reduced form treatment effects depending on whether subjects reported in Part 1 of the study theexpectation that a close friend would participate. We find that first stage treatment effects are not significantly differ-ent depending on close friends’ attendance, but the reduced form treatment effects are larger among individuals’ whoexpected a close friend to attend (see Online Appendix Table A.9). This reflects the fact that individuals on the marginof attendance (and so more responsive to the treatment) were differentially those who expected their friends to attendthe July 1 March as well.
29

In Table VI, Panels B and C, we conduct robustness exercises analogous to those considered
in the first stage and reduced form analyses above. One can see that neither including controls
for subjects’ background characteristics and economic status (Panel B), nor trimming the 5% of
subjects with the lowest and the 5% of subjects with the highest prior beliefs regarding planned
participation (Panel C), greatly affects the estimated effects of beliefs on protest turnout. Finally, in
Online Appendix Table A.10, we replicate Table VI, but consider belief changes, rather than levels,
as the endogenous regressor of interest (for which we use treatment dummy as an instrument).
We find similar results using this alternative specification.
IV.D Internal validity
We next address several concerns regarding the internal validity of our estimates. First, as noted
above, we found that our treatment and control groups were unbalanced at the 5% level on 6 of
47 subject characteristics elicited in Part 1 of the study (summary statistics for these variables and
t-tests of equality of means between treatment and control groups are presented in Online Ap-
pendix Table A.1). To determine whether observable differences between treatment and control
groups might drive our results, we estimate our baseline first stage and reduced form specifi-
cations (shown in Table III, Panel A, column 1 and Table IV, Panel A, column 1, respectively;
replicated in Online Appendix Table A.2, column 1), but controlling for the interaction between
each unbalanced characteristic and the treatment dummy. One can see in Online Appendix Ta-
ble A.2, columns 2–9, that controlling for these interactions leaves our treatment effect estimates
practically unaffected.
A second concern is that selective attrition between Part 1 of our experiment and Part 3 might
affect our estimates (though our finding of insignificant differences between the Part 1 sample’s
characteristics and the Part 3 sample’s, in Online Appendix Table A.3 is reassuring). To address
concerns about selective attrition, we re-weight the sample of individuals who completed Part 3
of the study to match the sample of individuals who completed Part 1 (but not necessarily the rest)
of the study. We match the Part 1 sample on subjects’ gender, birth year, childhood environment,
religiosity, household income, and economic status. In Online Appendix Table A.11, one can see
that our estimated first stage and reduced form treatment effects are largely unaffected by this
30

re-weighting exercise.45
Another possibility is that information regarding other subjects’ protest plans not only affected
beliefs about others’ participation, but also affected beliefs about the political movement itself —
as if the protest were a consumption good with uncertain quality. However, in this case, the stan-
dard social learning logic would suggest that positive updating of beliefs regarding the number of
other subjects joining a protest should lead students to update positively about protest “quality.”
This would produce the appearance of strategic complementarity, not the strategic substitutability
that we observe.
Standard experimenter demand effects, too, would likely produce the appearance of strategic
complementarity — when the experimenter tells a subject that a behavior is more prevalent than
the subject expected, the subject seems likely to assume that the experimenter is trying to induce
that behavior, and so be more likely to report it. Further arguing against experimenter demand
effects (or other unintended consequences of the experimental treatment) driving our findings,
we also find evidence consistent with strategic substitutability in the protest decision even in the
absence of any experimental treatment. Simply examining naturally-occurring variation in beliefs
among our control group subjects one sees a negative relationship between posterior beliefs re-
garding the actual participation of others and subjects’ own participation in the July 1 March (see
Online Appendix Figure A.6).46
45In Online Appendix Table A.11 we also replicate our main results, but weighting observations to match the HKUSTstudent population. We again find that our results are essentially unchanged. It is important to note that our re-weighting exercises can only provide evidence of similar observable characteristics between our experimental sampleand the reference samples: the HKUST student population or the sample of individuals who completed Part 1 ofthe study. We cannot rule out unobservable differences between these groups, though the similarity of observablecharacteristics is reassuring.
46We also observe a negative relationship between subjects’ self-reported past protest participation and their beliefsabout other subjects’ support for the anti-authoritarian movement, in responses recorded in Part 1 of the study (seeOnline Appendix Figure A.7). It is important to emphasize that, while suggestive, the correlations observed in OnlineAppendix Figures A.6 and A.7 must be interpreted with caution. Among other concerns, the levels of posterior beliefsin the control group are quite strongly correlated with their accuracy, and subjects with more accurate beliefs mayturnout more than others for reasons other than strategic considerations. Past protest participation may shape beliefsabout others’ ideology, in addition to being shaped by them.
31

V DISCUSSION
Our experiment estimates the causal effect of beliefs about others’ protest participation on one’s
own, exploiting variation in beliefs driven by a specific level of planned turnout, from a single
protest, in a particular setting. One naturally wonders how to generalize from such an esti-
mate. In Section II.B, we discussed several important dimensions along which Hong Kong’s July
1 Marches share similarities with other anti-authoritarian protests: as in other protests, the Hong
Kong Marches aim to achieve concrete political changes by mobilizing large numbers of individ-
uals, with these individuals facing a potential government crackdown. Thus, on its face, there
is reason to expect that protest behavior in the July 1 March will have some degree of external
validity to other anti-authoritarian protests.
Yet, it must be acknowledged that even in the same context we study, even in the specific
protest we study, it is possible that at a different level of protest participation the causal effect of
beliefs about others’ turnout on one’s own could differ — indeed, it may even flip signs. Given
the possible heterogeneity in the treatment effect we estimate, an important question is to what
extent does our single empirical parameter estimate bound the set of theoretical models of protest
participation?
Although our estimate does not pin down a single model of protest participation, we argue
that it does provide important bounds on the set of models consistent with our estimate: much
recent theoretical work on protest participation assumes only the possibility of strategic comple-
mentarity in the protest decision. This assumption has become so widespread that we treat it as
a “benchmark” model in what follows. Our findings reject this benchmark model. Although we
cannot claim that a specific alternative model produces our findings of strategic substitutability,
we provide evidence consistent with three plausible mechanisms that could generate strategic
substitutability in our setting, and that could easily be incorporated into the benchmark model to
allow for the strategic substitutability that we find.
32

V.A The benchmark model
The recent political economy literature has typically modeled protest participation as a global
game (or similar), with the stage game featuring strategic complementarity, and by assumption
ruling out the possibility of strategic substitutes. Here we present a simple, but general, version
of the “benchmark” model of the stage game, and relate it to several recent papers that emphasize
different underlying sources of strategic complementarity.
In the benchmark model, individual i’s’ utility from protest participation can be written as
follows:
Ui = 11Pi=1
(Vi
(P−i, S(P−i)
)− Ci
(P−i, S(P−i)
)),
where 11Pi=1 is an indicator that individual i participated in the protest and the utility from par-
ticipating (Ui) is a function of the benefits from participation (Vi) and the costs (Ci). Costs and
benefits, in turn, are assumed to depend directly on the participation of other individuals (the
level of which is denoted P−i), as well as on the success of a protest (an indicator denoted S),
which itself may depend on the participation of others.
The benchmark model first follows the recent literature in assuming that protests are more
likely to succeed when they are larger, and that individuals derive differential utility from par-
ticipating in protests that succeed (or that are more likely to succeed). Bueno de Mesquita (2010,
p. 449), for example, assumes that “there is some portion . . . of the payoffs from regime change
that can only be accessed by those who participate . . . Substantively, this could be because those
who actively participate in revolution gain privileged status after regime change occurs or be-
cause there are expressive benefits to having participated in a victorious uprising.” Edmond (2013,
p. 1425) writes simply that “the more citizens participate in [a protest], the more likely it is that the
regime is overthrown and so the more likely it is that any individual also participates.” Passarelli
and Tabellini (2017, p. 910) write that individuals may derive greater utility from the “feeling of
contributing to a more meaningful event with a greater chance of success.” Barbera and Jackson
(2017, pp. 7–8) assume that individuals attain utility “from knowing or being able to say that they
33

participated in a revolution that was successful: from having been one of those who stormed the
Bastille, participated in the Salt March, or protests in Tunisia, etc.”
Formally, the benchmark model assumes:
∂S∂P−i
> 0 and∂V∂S
> 0.
It is worth noting that the crucial assumption that a protest is perceived to be more likely
to succeed when more people turn out (i.e., ∂S∂P−i
> 0) receives empirical support in our exper-
imental context. We elicit experimental subjects’ beliefs about the likelihood that a Hong Kong
pro-democracy protest would succeed as a function of protest turnout, and find that these are
strongly increasing (see Figure I).
The benchmark model also assumes that the benefits from participating in a protest are larger
when it is attended by more people — even if the increased participation does not affect the
protest’s success. This may be, for example, because participation in a larger protest increases
the expressive utility a participant attains. In a model of citizen unrest in response to perceived
unfair government policy, Passarelli and Tabellini (2017, p. 910) write that “the psychological ben-
efit of a public display of anger is stronger if the emotion is more widely shared.”
Thus, whether because of direct effects, or because of indirect effects working through protest
success, the benchmark model assumes that the benefits of protest attendance increase with the
attendance of others — thus generating strategic complementarity. Formally:
d Vd P−i
> 0.
The benchmark model assumes similar effects of others’ turnout arising from the costs side.
The cost of protest attendance may be lower when protests are successful — perhaps because in
a successful protest the regime concedes, rather than cracks down. If, as assumed above, protest
success is an increasing function of turnout, then greater turnout will lower protest costs, along-
side increasing benefits. The cost of attendance may also be falling in protest size independent of
success if costs per person are lower in a larger crowd. For example, Passarelli and Tabellini (2017,
p. 910) write that “[strategic] complementarity could also be on the cost side: the probability of
34

being arrested is smaller in a larger crowd.”
Thus, the benchmark model assumes:
∂C∂S
< 0.
This assumption, along with the above assumption that ∂S∂P−i
> 0, as well as direct reductions
of costs arising from larger turnout imply another force generating strategic complementarity:
d Cd P−i
< 0.
In sum, the benchmark model — synthesizing several recent papers — allows for different
underlying sources of strategic complementarity.47 All of these generate a common prediction: if
an individual believes that the turnout of others will be greater, she is unambiguously more likely
to turn out to a protest herself.
V.B Sources of strategic substitutability in the protest decision
Our findings reject the benchmark model of protest turnout that assumes only the possibility of
strategic complementarity in the decision to protest. It is important to emphasize that we do not
claim that protests are always games of strategic substitutes, but rather that models of protest
turnout must allow for the possibility of strategic substitutability. We propose adding to the
benchmark model’s stage game utility function a term that allows for strategic substitutability:
specifically, a term whose first derivative with respect to protest size is negative, at least over
some range.
While we cannot conclusively identify specific mechanisms that produce the pattern of strate-
gic substitutability we observe, we are able to provide suggestive evidence of three plausible
drivers: first, that protests produce a public good from attaining a threshold level of participa-
tion; second, that an individual’s expected costs of protest turnout increase with protest size; and,
third, that an individual’s benefits from signaling her anti-authoritarian type decrease with protest
47This literature (Bueno de Mesquita, 2010; Edmond, 2013; Barbera and Jackson, 2017; Passarelli and Tabellini, 2017)is discussed in more detail in Online Appendix B.
35

size.
Threshold public goods as a function of turnout
As described above, the benchmark model assumed d Vd P−i
> 0, arising from several sources of
differential utility experienced when participating in larger, more successful protests. However,
there may be benefits from one’s own protest turnout that over some range are decreasing in the
turnout of others. A classic argument in the political economy literature (Olson, 1965; Tullock,
1971; Palfrey and Rosenthal, 1984) is that protest participation produces a political public good.
This good might be tangible: attaining a sufficient turnout level might send the regime a signal that
directly affects policy (for example, in the 2017 March, significant turnout might have persuaded
CY Leung not to run for a second term as Chief Executive). The public good produced by a
protest might also be symbolic: sufficient turnout might signal the existence of a “critical mass” of
protesters, which sustains the political movement; note that this signal is not inconsequential, as
it shapes subsequent protest turnout in the political movement.48
We find evidence consistent with protest turnout being a public good in our setting. We con-
struct an index of subjects’ pro-sociality (altruism and reciprocity) using their responses in Part 1
of the study. We find that this pro-sociality index is significantly correlated with protest turnout
unconditionally, as well as conditional on treatment status, posterior beliefs about others’ turnout,
and on subjects’ own anti-authoritarian ideology (see Online Appendix Table A.12). This is consis-
tent with a theoretical and empirical literature linking pro-sociality to public goods contributions
(see, e.g., Croson, 2007).
We can incorporate the production of a public good — either an intermediate, tangible public
good (something meaningful but short of democratization) or a symbolic public good — from
sufficient protest turnout into our model by adding a term, φ(P−i), to the benefits function:
Vi = Vi
(S(P−i), φ(P−i)
)In this case, the benefits from turnout are a function of: (i) the success of the protest (i.e., achiev-
48Barbera and Jackson (2017) present a model in which protest turnout in one period affects beliefs about eventualmovement success, and thus turnout, in subsequent periods.
36

ing democratization) S(P−i), which is monotonically increasing in P−i and will tend to produce
strategic complementarity; and, (ii) the production of an intermediate tangible public good or a
symbolic public good φ(P−i), which could be increasing in P−i over some range (i.e., below the
level at which the public good is completely produced), but decreasing in P−i around the point at
which individuals believe their turnout is no longer needed to produce the public good.
Over some range, particularly in a protest in which the production of the public good (e.g.,
signaling the movement’s strength) is more relevant than the achievement of the ultimate success
of the movement (e.g., achieving democratization), the production of a public good from protest
participation may generate strategic substitutability.49 Thus, in this case, dVd P−i
may be positive or
negative, thus allowing for strategic complementarity or substitutability.
Increasing costs as turnout rises
The benchmark model assumed that an individual’s expected cost of protest attendance was
falling with the expected turnout of others. The logic was that the costs of government crack-
down would be diffused across more people, thus reducing an individual’s own cost. However,
this logic ignores the possibility that the likelihood of a government crackdown is increasing in
protest size, at least over some range. Consistent with this proposed mechanism behind strategic
substitutability in our setting, one can see in Figure I that our experimental subjects believe that
government crackdown is an increasing function of protest size.
This source of strategic substitutability can easily be incorporated into the benchmark model.
Suppose the cost of turnout is a function of: (i) the cost borne by a protester conditional on crack-
down, ci(P−i); (ii) the success of the protest, S(P−i); and (iii) the probability of crackdown, π(P−i).
Then, the cost function would be:
Ci = Ci
(π(P−i)× ci(P−i), S(P−i)
)with ∂ci
∂P−i< 0 (following the logic of the benchmark model), ∂S
∂P−i> 0 (again, following the bench-
mark model), and ∂π∂P−i
> 0. In this case, dCd P−i
may be positive or negative, allowing for strategic
49Note that a public goods game may not be a game of strategic substitutes in all settings: subjects may play a strategyof conditional cooperation, which generates strategic complementarity (see, e.g., Fischbacher et al., 2001).
37

complementarity or substitutability.
Decreasing signaling value of participation as turnout rises
We finally propose an additional element of the benefits of protest participation, which may be
greater when participating in smaller protests: if one cares about signaling one’s anti-authoritarian
type, the value of that signal, θi(P−i), may be decreasing in protest size, at least over some range.50
We find several pieces of suggestive evidence consistent with individuals’ protest participa-
tion being shaped by their political identities (i.e., “types”), and the signaling of those identities.
First, we find that students’ anti-authoritarian identities (both self-reported and revealed in incen-
tivized lab experiments) are strongly associated with their protest participation plans (see Online
Appendix Table A.5). In a subsequent survey of participants in the July 1, 2017, March in which we
directly asked protest participants why they attended the March, 45% of participants responded,
“Being politically active is an important component of my identity.”51
If subjects selected into smaller protests in response to the perceived signaling value, one
would expect individuals with very anti-authoritarian friends — to whom signaling one’s type
would be especially valuable — to have differentially attended the July 1 March after updating
their beliefs about total protest size downward. Analogously, one would expect that individuals
who attend a protest specifically to signal their type to their anti-authoritarian friends to select
out of attendance after updating their beliefs about total protest size upward. Consistent with
this prediction, we find that treatment group protest participants with high priors regarding other
50We follow the logic of Benabou and Tirole (2011), who present a model in which an individual trades off honorfrom taking a costly, meritorious action against stigma from not taking that action. When fewer individuals undertakethe costly action, it increases the honor associated with taking the action (because the signal of one’s type conditionalon taking the action becomes more positive), but also reduces the stigma associated with not taking the action (becausethe signal of one’s type conditional on not taking the action becomes less negative). Under a small set of assumptions,the honor associated with taking a less common action increases more than the stigma from not taking the action fallswhen the base rate of taking the action is rare. The logic is as follows: when a meritorious action is taken by a smallminority in the tail of a distribution, the conditional mean moving further into the tail changes more in the minority tailof the distribution than in the majority. This model produces strategic substitutes in taking the meritorious action whenstarting from a low base, but strategic complements when starting from a high base. Enikolopov et al. (2018) present adynamic model in which social image considerations motivate persistent protest participation over time.
51The participants in the 2017 survey included some individuals surveyed as part of our experiment conducted in2016 as well as additional respondents. Among the 2017 survey sample, we directly elicited all 59 protest participants’reasons for attending the 2017 March. Individuals’ identity was the second most frequent response, with 27 individualsreporting it. The most frequent response was, “I believed the March would produce political change,” reported by 28individuals.
38

subjects’ planned participation — a group who turned out to protest after updating their beliefs
regarding protest turnout downward — have more anti-authoritarian friends than protest partic-
ipants in the control group (see Online Appendix Figure A.8). We find analogous results among
individuals selecting out of protests when updating their beliefs about turnout upward. This sug-
gests that subjects who had the strongest social image reasons to signal their anti-authoritarian
identities differentially selected into protests they believed would be smaller, and selected out of
protests they believed would be larger.
We can incorporate the signaling value of protest attendance into a benefits function alongside
a threshold public good. Suppose the benefits from turnout are a function of: (i) the success of
the protest, S(P−i), discussed above; (ii) the production of a public good, φ(P−i), also discussed
above; and, (iii) the value of the signal of one’s type, θi(P−i). Then, the benefits function would be:
Vi = Vi
(S(P−i), φ(P−i), θi(P−i)
)with ∂V
∂S > 0 (as in the benchmark model), ∂φ∂P−i
< 0 (over some range), and ∂θ∂P−i
< 0 (when
P−i is small enough). In this case, dVd P−i
may be positive or negative, again allowing for strategic
complementarity or substitutability.
Thus, while only suggestive, the patterns in our data are consistent with plausible mechanisms
underlying strategic substitutability in our setting. Importantly, these mechanisms can easily be
incorporated into the benchmark model to allow for either strategic complementarity or substi-
tutability in the protest decision, making it consistent with our main findings.52
52There exist other potential mechanisms that could generate strategic substitutability for which we do not findevidence in our setting (though they may be present in other protests). Shadmehr and Bernhardt (2011) propose amodel in which moderates update their beliefs about the gains from protest negatively if they believe other agents’thresholds for turnout are too low. This makes moderates select out of protesting when they update their beliefspositively — the opposite of what we find in Online Appendix Figure A.8. Myatt (2017) proposes a model in whichprotest voters may moderate their expression if they believe that extremists are too popular. Again, this model wouldsuggest that moderates select out of protests when they update their beliefs positively, in contrast to our findings.Finally, Shadmehr (2018) proposes protester perceptions of pivotality as potential drivers of strategic substitutability;we did not ask subjects about these perceptions.
39

VI CONCLUSION
According to the human rights NGO Freedom House, as of 2016, 26% of the world’s population
— nearly two billion people — live in states classified as “not free”. Recent protests from the Arab
Spring to Russia or Venezuela provide reminders that citizens of unfree states today, as in the past,
continually rise up and demand political rights.53 Given the prevalence of authoritarian regimes,
it is important to understand individuals’ decisions to participate in such protest movements.54
We conduct an experiment to study one dimension of individuals’ protest decision: how one’s
turnout is affected by beliefs about the turnout of others. We find consistent evidence indicat-
ing that Hong Kong students considering participation in the July 1 protest of 2016 viewed the
strategic element of their decision as a game of strategic substitutes. Individuals in our sample
who were induced by the experiment to positively update their beliefs about others’ turnout be-
came less likely to participate themselves; and, individuals who were induced by the experiment
to negatively update their beliefs about others’ turnout became more likely to participate them-
selves. Although our finding of strategic substitutability in the protest decision is estimated from a
particular context, the result provides guidance regarding models of protest turnout: specifically,
our findings reject many recent models that assume only the possibility of strategic complemen-
tarity in the protest decision.
While shedding light on individuals’ decisions to participate in an anti-authoritarian protest,
our experiment raises the question, how general is our finding of strategic substitutability likely
to be? It is important to emphasize that the mechanisms we observe at work in Hong Kong will
not all be present in all protests, and even if they are present, they will not always outweigh forces
generating strategic complementarity emphasized in other work.
53Data come from Freedom House’s (2016) “Freedom in the World” report, available online at https://
freedomhouse.org/sites/default/files/FH_FITW_Report_2016.pdf, last accessed August 5, 2016.54Research on authoritarian regimes, movements opposed to them, and the consequences of constraints on rulers,
typically considers aggregate behavior, rather than individual behavior, as we do. A large literature has studied theconsequences of political constraints for economic growth (e.g., DeLong and Shleifer, 1993; Przeworski and Limongi,1993; Przeworski et al., 2000; Gerring et al., 2005; Rodrik and Wacziarg, 2005; Persson and Tabellini, 2006, 2008; Pa-paioannou and Siourounis, 2008; Acemoglu and Robinson, 2012; Bates et al., 2012; Meyersson, 2016; Acemoglu et al.,2015). Relatedly, a growing theoretical and empirical literature studies the extension of the franchise (e.g., Acemogluand Robinson, 2000; Lizzeri and Persico, 2004; Llavador and Oxoby, 2005; Acemoglu and Robinson, 2006; Aidt andFranck, 2012, 2015).
40

Among the mechanisms we highlight, we believe that the existence of a political public good
produced from attaining a threshold level of participation is likely to be particularly important in
long-lasting political movements, for example, the Women’s Suffrage Movements in the early 20th
century United States and Britain; the Civil Rights Movement in the 1960s United States; and, po-
litical movements in unconsolidated democracies, like Russia’s ongoing anti-corruption protests,
protests in Venezuela, etc. In all of these settings, getting people on the street may in itself be an
aim of the protest: achieving target protest sizes could directly achieve policy concessions, and
also signal the strength of a movement to potential future participants. Strategic substitutability is
most likely during stages of a political movement when the public goods component of a protest
looms large relative to a movement’s ultimate success. This does not make the protest inconse-
quential: tangible achievements are possible even in the absence of complete success; movement
survival and growth in the future may depend on turnout in the present. It is important to empha-
size, however, that the dynamic signaling element of this mechanism will likely not be relevant
in one-shot mass events, like the Arab Spring protests, which will either topple a regime or be
crushed. One-shot protests are thus more likely to exhibit strategic complementarity.
The second force for strategic substitutability in our setting is subjects’ perception of an in-
crease in the probability of government crackdown for larger protests. This force seems most
likely to exist in protests demanding political rights from regimes that are not totalitarian (again,
the Women’s Suffrage Movements, the Civil Rights Movement, and protests in partial democra-
cies). Many regimes, even authoritarian ones, allow some freedom of expression and association;
thus, small protests are likely to be tolerated. However, these regimes may not tolerate destabiliz-
ing large events, and so may be perceived as being more likely to crack down on larger protests.
This mechanism producing strategic substitutability is unlikely to be present in settings where
protests are patently illegal, such as the Soviet Union and much of Eastern Europe prior to 1989,
North Korea, or in much of the Arab World. In these cases, government crackdown is essentially
guaranteed, so the probability of bearing a private cost conditional on crackdown becomes the
only consideration. In such settings, larger protests are likely to be perceived as lower cost, thus
pushing toward strategic complementarity.
Finally, the Benabou and Tirole (2011) logic of greater individual signaling value of attending
41

a smaller protest seems likely to be quite general: political radicals will be able to more strongly
signal their type when a protest is small. It is important to note, however, that the magnitude of
this effect may differ substantially across types of protesters and across protests. Again, this force
toward substitutability may be especially pronounced in ongoing movements, in which participa-
tion becomes part of one’s identity, and may be less relevant in one-shot events aimed at toppling
a dictator.
Future work thus should shed more light on the mechanisms that underlie the strategic inter-
actions in the protest game, ideally exploring their heterogeneity across varying political settings.
It should also engage in the empirical analysis of protests that are linked dynamically as part of
larger political movements. In our setting, a large July 1 March not only affects policy immedi-
ately, but also shapes the beliefs and behavior of citizens in the anti-authoritarian movement more
broadly. This means there are dynamic considerations among protesters, learning among protest
participants and non-participants, and potentially important cross-protest spillovers. Given that
many protests are not solitary events, understanding these dynamic processes is an important area
for future research.
LUDWIG-MAXIMILIANS-UNIVERSITAT MUNICH, CEPR, AND CESIFO
HARVARD UNIVERSITY AND J-PAL
LONDON SCHOOL OF ECONOMICS, NBER, AND CESIFO
HONG KONG UNIVERSITY OF SCIENCE AND TECHNOLOGY
42
REFERENCES
Acemoglu, Daron and James A. Robinson, “Why Did the West Extend the Franchise? Democracy,
Inequality, and Growth in Historical Perspective,” Quarterly Journal of Economics, November
2000, 115 (4), 1167–1199.
and , Economic Origins of Dictatorship and Democracy, Cambridge University Press, 2006.
and , Why Nations Fail: the Origins of Power, Prosperity, and Poverty, New York: Crown Busi-
ness, August 2012.
, Suresh Naidu, Pascual Restrepo, and James A. Robinson, “Democracy Does Cause Growth,”
December 2015. MIT working paper: http://economics.mit.edu/files/11227.
, Tarek A. Hassan, and Ahmed Tahoun, “The Power of the Street: Evidence From Egypt’s Arab
Spring,” NBER Working Paper, October 2014, 20665.
Aidt, Toke S. and Raphael Franck, “How to get the snowball rolling and extend the franchise:
voting on the Great Reform Act of 1832,” Public Choice, January 2012, 155 (3-4), 229–250.
and , “Democratization Under the Threat of Revolution: Evidence From the Great Reform
Act of 1832,” Econometrica, March 2015, 83 (2), 505–547.
Anderson, Michael L., “Multiple Inference and Gender Differences in the Effects of Early Inter-
vention: A Reevaluation of the Abecedarian, Perry Preschool, and Early Training Projects,”
Journal of the American Statistical Association, December 2008, 103 (484), 1481–1495.
Barbera, Salvador and Matthew O. Jackson, “A Model of Protests, Revolution, and Information,”
August 2017. Unpublished, Stanford University: https://ssrn.com/abstract=2732864.
Bates, Robert H., Ghada Fayad, and Anke Hoeffler, “The State of Democracy in Sub-Saharan
Africa,” International Area Studies Review, December 2012, 15 (4), 323–338.
Benabou, Roland and Jean Tirole, “Laws and Norms,” NBER Working Paper, November 2011,
17579.
43
Bueno de Mesquita, Ethan, “Regime Change and Revolutionary Entrepreneurs,” American Politi-
cal Science Review, August 2010, 104 (3), 446–466.
Cantoni, Davide, David Y. Yang, Noam Yuchtman, and Jane Zhang, “The Funda-
mental Determinants of Anti-Authoritarianism,” November 2016. Unpublished,
UC Berkeley: http://faculty.haas.berkeley.edu/yuchtman/Noam_Yuchtman_files/
antiauthoritarian_draft.pdf.
Chwe, Michael Suk-Young, “Communication and Coordination in Social Networks,” Review of
Economic Studies, January 2000, 67 (1), 1–16.
Coffman, Katherine B., Lucas C. Coffman, and Keith M. Marzilli Ericson, “The Size of the LGBT
Population and the Magnitude of Anti-Gay Sentiment are Substantially Underestimated,” Man-
agement Science, 2017.
Coffman, Lucas C., Clayton R. Featherstone, and Judd B. Kessler, “A Model of Information
Nudges,” November 2015. Unpublished, Ohio State University: https://site.stanford.edu/
sites/default/files/a_model_of_information_nudges_20151124.pdf.
Croson, Rachel, “Theories of Commitment, Altruism and Reciprocity: Evidence From Linear Pub-
lic Goods Games,” Economic Inquiry, 2007, 45 (2), 199–216.
Deaton, Angus and Nancy Cartwright, “Understanding and Misunderstanding Randomized
Controlled Trials,” NBER Working Paper, September 2016, 22595.
DellaVigna, Stefano and Matthew Gentzkow, “Persuasion: Empirical Evidence,” Annual Review
of Economics, September 2010, 2 (1), 643–669.
, Ruben Enikolopov, Vera Mironova, Maria Petrova, and Ekaterina Zhuravskaya, “Cross-
Border Media and Nationalism: Evidence from Serbian Radio in Croatia,” American Economic
Journal: Applied Economics, July 2014, 6 (3), 103–132.
DeLong, J Bradford and Andrei Shleifer, “Princes and Merchants: European City Growth before
the Industrial Revolution,” Journal of Law and Economics, October 1993, 36 (2), 671–702.
44

Edmond, Chris, “Information Manipulation, Coordination, and Regime Change,” Review of Eco-
nomic Studies, October 2013, 80 (4), 1422–1458.
Egorov, Georgy and Konstantin Sonin, “Elections in Non-Democracies,” April 2018. Unpub-
lished, University of Chicago.
Enikolopov, Ruben, Alexey Makarin, and Maria Petrova, “Social Media and Protest Participa-
tion: Evidence from Russia,” April 2016. Unpublished, Universitat Pompeu Fabra: https:
//ssrn.com/abstract=2696236.
, , , and Leonid Polishchuk, “Social Image, Networks, and Protest Participation,” May
2018. Unpublished, Universitat Pompeu Fabra.
Fearon, James D., “Self-Enforcing Democracy,” Quarterly Journal of Economics, November 2011,
126 (4), 1661–1708.
Fischbacher, Urs, Simon Gachter, and Ernst Fehr, “Are people conditionally cooperative? Evi-
dence from a public goods experiment,” Economics Letters, 2001.
Gehlbach, Scott, Konstantin Sonin, and Milan W. Svolik, “Formal Models of Nondemocratic
Politics,” Annual Review of Political Science, May 2016, 19, 565–584.
Gerber, Alan, Mitchell Hoffman, John Morgan, and Collin Raymond, “One in a Million: Field
Experiments on Perceived Closeness of the Election and Voter Turnout;,” January 2017. Unpub-
lished, University of Toronto.
Gerber, Alan S and Donald P Green, “The effects of canvassing, telephone calls, and direct mail
on voter turnout: a field experiment,” American Political Science Review, 2000, 94 (3), 653–63.
Gerber, Alan S., Gregory A. Huber, David Doherty, Conor M. Dowling, Connor Raso, and
Shang E. Ha, “Personality Traits and Participation in Political Processes,” Journal of Politics, July
2011, 73 (3), 692–706.
Gerring, John, Philip Bond, William Barndt, and Carola Moreno, “Democracy and Growth: A
Historical Perspective,” World Politics, April 2005, 57 (3), 323–364.
45

Gonzalez, Felipe, “Collective Action in Networks: Evidence from the Chilean Student Move-
ment,” October 2016. Unpublished, UC-Berkeley.
Granovetter, Mark, “Threshold Models of Collective Behavior,” American Journal of Sociology, May
1978, 83, 489–515.
Hobbs, William and Margaret E. Roberts, “How Sudden Censorship Can Increase Access to In-
formation,” 2016. Unpublished, UC-San Diego.
King, Gary, Jennifer Pan, and Margaret E. Roberts, “How Censorship in China Allows Govern-
ment Criticism but Silences Collective Expression,” American Political Science Review, May 2013,
107 (2), 326–343.
Kricheli, Ruth, Yair Livne, and Beatriz Magaloni, “Taking to the Streets: Theory and Evidence
on Protests under Authoritarianism,” APSA Annual Meeting Paper, April 2011.
Kuran, Timur, “Sparks and Prairie Fires: A Theory of Unanticipated Political Revolution,” Public
choice, April 1989, 61 (1), 41–74.
, “The East European Revolution of 1989: Is it Surprising that We Were Surprised?,” American
Economic Review, May 1991, 81 (2), 121–125.
, Private Truths, Public Lies: The Social Consequences of Preference Falsification, Cambridge, Mass.:
Harvard University Press, 1997.
Lizzeri, Alessandro and Nicola Persico, “Why did the Elites Extend the Suffrage? Democracy and
the Scope of Government, with an Application to Britain’s ”Age of Reform”,” Quarterly Journal
of Economics, May 2004, 119 (2), 707–765.
Llavador, Humberto and Robert J. Oxoby, “Partisan Competition, Growth, and the Franchise,”
Quarterly Journal of Economics, August 2005, 120 (3), 1155–1189.
Lohmann, Susanne, “The Dynamics of Informational Cascades: The Monday Demonstrations in
Leipzig, East Germany, 1989-91,” World Politics, October 1994, 47 (1), 42–101.
46
Lorentzen, Peter, “Regularizing Rioting: Permitting Public Protest in an Authoritarian Regime,”
Quarterly Journal of Political Science, April 2013, 8 (2), 127–158.
Madestam, Andreas, Daniel Shoag, Stan Veuger, and David Yanagizawa-Drott, “Do Political
Protests Matter? Evidence from the Tea Party Movement,” Quarterly Journal of Economics, Octo-
ber 2013, 128 (4), 1633–1685.
Manacorda, Marco and Andrea Tesei, “Liberation Technology: Mobile Phones and Political Mo-
bilization in Africa,” May 2016. Unpublished, Queen Mary University of London.
Meyersson, Erik, “Political Man on Horseback: Military Coups and Development,” April
2016. Unpublished, SITE, Stockholm School of Economics: https://erikmeyersson.files.
wordpress.com/2015/04/coups_meyersson_1504.pdf.
Myatt, David P., “A Theory of Protest Voting,” The Economic Journal, August 2017, 127 (603), 1527–
1567.
Olson, Mancur, The Logic of Collective Action: Public Goods and the Theory of Groups, New York, NY:
Schocken Books, 1965.
Opp, Karl-Dieter and Christiane Gern, “Dissident Groups, Personal Networks, and Spontaneous
Cooperation: The East German Revolution of 1989,” American Sociological Review, October 1993,
58 (5), 659–680.
Palfrey, Thomas and Howard Rosenthal, “Participation and the provision of discrete public
goods: A strategic analysis,” Journal of Public Economics, 1984, 24 (2), 171–193.
Papaioannou, Elias and Gregorios Siourounis, “Democratisation and Growth,” Economic Journal,
October 2008, 118 (532), 1520–1551.
Passarelli, Francesco and Guido Tabellini, “Emotions and Political Unrest,” Journal of Political
Economy, 2017, 125 (3), 903–946.
Persson, Torsten and Guido Tabellini, “Democracy and Development: The Devil in the Details,”
American Economic Review, May 2006, 96 (2), 319–324.
47

and , “The Growth Effect of Democracy: Is it Heterogenous and How Can It Be Estimated?,”
in Elhanan Helpman, ed., Institutions and Economic Performance, Cambridge, Mass.: Harvard
University Press, 2008.
Przeworski, Adam and Fernando Limongi, “Political Regimes and Economic Growth,” Journal of
Economic Perspectives, Summer 1993, 7 (3), 51–69.
, Michael E. Alvarez, Jose Antonio Cheibub, and Fernando Limongi, Democracy and Devel-
opment: Political Institutions and Well-Being in the World, 1950–1990, Cambridge and New York:
Cambridge University Press, 2000.
Raghavarao, Damaraju and Walter T. Federer, “Block Total Response as an Alternative to the
Randomized Response Method in Surveys,” Journal of the Royal Statistical Society, Series B, 1979,
41 (1), 40–45.
Reny, Marie-Eve, “Authoritarianism as a Research Constraint: Political Scientists in China,” Social
Science Quarterly, December 2016, 97 (4), 909–922.
Rodrik, Dani and Romain Wacziarg, “Do Democratic Transitions Produce Bad Economic Out-
comes?,” American Economic Review, May 2005, 95 (2), 50–55.
Shadmehr, Mehdi, “Tullock’s Paradox, Pivotal Revolutionaries and the Strength of Weak States,”
May 2018. Unpublished, University of Calgary.
and Dan Bernhardt, “Collective Action with Uncertain Payoffs: Coordination, Public Signals
and Punishment Dilemmas ,” American Political Science Review, 2011, 105 (4), 829–51.
Tullock, Gordon, “The Paradox of Revolution,” Public Choice, 1971, 11, 89–99.
Yanagizawa-Drott, David, “Propaganda and Conflict: Evidence from the Rwandan Genocide,”
Quarterly Journal of Economics, December 2014, 129 (4), 1947–1994.
48

FIGURES AND TABLES
1020
3040
5060
Belie
f on
prob
abilit
y of
... i
f # tu
rnou
t to
prot
est
10000 50000 250000 1250000Hypothetical protest turnout
Govt crackdown Democracy achieved in HK
Figure I: Students’ beliefs regarding the benefits (the chance of achieving democratic institutionsin Hong Kong) and costs (the chance of a violent government crackdown) for hypothetical protestswith different turnout levels, ranging from 10,000 to 1,250,000 participants.
49

0.0
2.0
4.0
6.0
8D
ensi
ty
0 20 40 60 80 100Beliefs re: actual participation (among HKUST)
Prior to follow-upPosterior to follow-up (control group)Posterior to follow-up (treatment group)
Figure II: Distribution of prior beliefs and posterior beliefs regarding the actual protest participa-tion of HKUST survey participants.
50

-30
-20
-10
010
Cha
nge
in b
elie
fs a
fter t
reat
men
t
0 20 40 60 80Prior belief re: % students who plan to participate
Treatment group
-30
-20
-10
010
Cha
nge
in b
elie
fs a
fter t
reat
men
t
0 20 40 60 80Prior belief re: % students who plan to participate
Control group
Figure III: Changes in beliefs (posteriors minus priors) regarding the actual protest participationof HKUST survey participants, presented separately by subjects’ treatment status.
Prior belief re: plannedparticipation > 17 (truth)
Prior belief re: plannedparticipation < 17 (truth)
010
2030
40Be
lief r
e: %
stu
dent
s w
ho a
ctua
lly p
artic
ipat
e
2016/06/24 2016/06/30
Control Treatment
Figure IV: Treatment effect on beliefs (“first stage”). Graph shows prior (measured 6/24/2016) andposterior (measured 6/30/2016) beliefs regarding the actual protest participation of HKUST sur-vey participants, split according to subjects’ treatment status and according to prior beliefs aboutother subjects’ planned participation. Subsamples of subjects are divided according to whetherbeliefs regarding the planned protest participation of HKUST survey participants were above orbelow the true level of 17%.
51
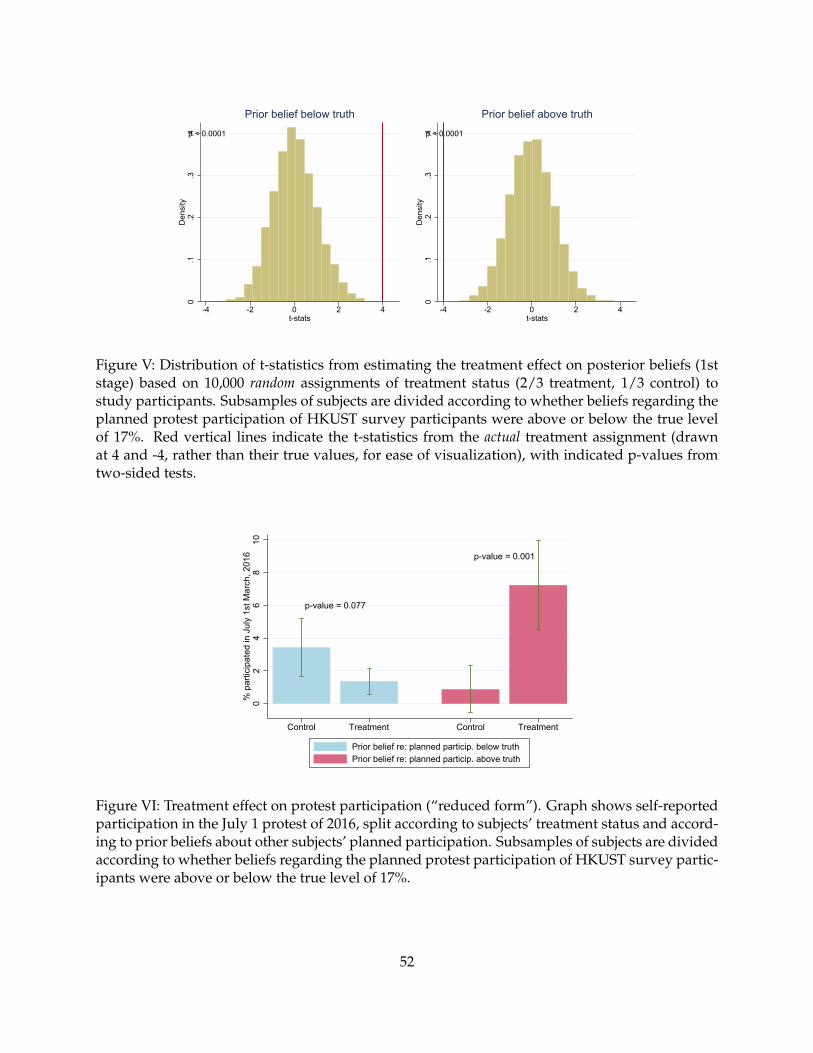
p < 0.0001
0.1
.2.3
.4D
ensi
ty
-4 -2 0 2 4t-stats
Prior belief below truthp < 0.0001
0.1
.2.3
.4D
ensi
ty
-4 -2 0 2 4t-stats
Prior belief above truth
Figure V: Distribution of t-statistics from estimating the treatment effect on posterior beliefs (1ststage) based on 10,000 random assignments of treatment status (2/3 treatment, 1/3 control) tostudy participants. Subsamples of subjects are divided according to whether beliefs regarding theplanned protest participation of HKUST survey participants were above or below the true levelof 17%. Red vertical lines indicate the t-statistics from the actual treatment assignment (drawnat 4 and -4, rather than their true values, for ease of visualization), with indicated p-values fromtwo-sided tests.
p-value = 0.077
p-value = 0.001
02
46
810
% p
artic
ipat
ed in
Jul
y 1s
t Mar
ch, 2
016
Control Treatment Control Treatment
Prior belief re: planned particip. below truthPrior belief re: planned particip. above truth
Figure VI: Treatment effect on protest participation (“reduced form”). Graph shows self-reportedparticipation in the July 1 protest of 2016, split according to subjects’ treatment status and accord-ing to prior beliefs about other subjects’ planned participation. Subsamples of subjects are dividedaccording to whether beliefs regarding the planned protest participation of HKUST survey partic-ipants were above or below the true level of 17%.
52

p = .05
0.1
.2.3
.4D
ensi
ty
-4 -2 0 2 4t-stats
Prior belief below truth
p = .0046
0.1
.2.3
.4D
ensi
ty
-4 -2 0 2 4t-stats
Prior belief above truth
Figure VII: Distribution of t-statistics from estimating the reduced form effect of treatment onprotest participation based on 10,000 random assignments of treatment status (2/3 treatment, 1/3control) to study participants. Subsamples of subjects are divided according to whether beliefs re-garding the planned protest participation of HKUST survey participants were above or below thetrue level of 17%. Red vertical lines indicate the t-statistics from the actual treatment assignment,with indicated p-values from two-sided tests.
Truth(treatment)
-10
-50
510
15Tr
eatm
ent e
ffect
on
% p
artic
ipat
ed
0 5 10 15 20 25 30Prior belief re: planned participation
Figure VIII: Treatment effect on protest participation (“reduced form”), disaggregated by priorbeliefs regarding the planned participation of HKUST survey participants (bins are 5 percentagepoints wide).
53

Tabl
eI:
Sum
mar
yst
atis
tics
and
bala
nce
chec
k
Expe
rim
enta
lPr
ior
belie
fon
plan
ned
part
icip
.Pr
ior
belie
fon
plan
ned
part
icip
.sa
mpl
ebe
low
trut
hab
ove
trut
h
Con
trol
Trea
tmen
tC
ontr
olTr
eatm
ent
Con
trol
Trea
tmen
tm
ean
mea
np-
valu
em
ean
mea
np-
valu
em
ean
mea
np-
valu
e
Var
iabl
es:
(1)
(2)
(3)
(4)
(5)
(6)
(7)
(8)
(9)
Mal
e0.
554
0.53
50.
548
0.56
60.
523
0.23
30.
522
0.56
50.
454
Birt
hye
ar19
95.2
1995
.20.
801
1995
.419
95.2
0.25
919
95.0
1995
.20.
178
HK
-ori
ente
dch
ildho
oden
v.0.
088
0.10
00.
827
0.06
90.
089
0.77
30.
137
0.12
80.
932
Non
-rel
igio
us0.
783
0.77
00.
595
0.80
90.
771
0.19
90.
717
0.76
60.
317
HH
econ
omic
&so
cial
stat
us0.
029
-0.0
310.
324
0.01
9-0
.017
0.62
30.
055
-0.0
650.
279
Ow
npr
ojec
ted
econ
omic
stat
us0.
001
-0.0
560.
348
0.03
7-0
.025
0.40
0-0
.090
-0.1
300.
714
Plan
ned
topa
rtic
ipat
ein
prot
est
17.0
17.9
0.68
813
.914
.20.
905
24.8
26.6
0.71
4
Prio
rbe
liefr
e:%
othe
rs’p
lann
edpa
rtic
ip.
15.7
15.8
0.90
27.
87.
60.
501
36.0
35.4
0.74
3Pr
ior
belie
fre:
%ot
hers
’act
ualp
arti
cip.
(HK
UST
)13
.414
.00.
470
6.0
5.9
0.77
232
.133
.20.
546
Prio
rbe
liefr
e:ot
hers
’act
ualp
arti
cip.
(all
HK
)15
8243
1536
650.
628
1459
9614
0858
0.63
518
9458
1838
750.
763
#of
obs.
401
833
288
585
113
248
Not
e:Ta
ble
test
sfo
rba
lanc
eon
obse
rvab
lech
arac
teri
stic
s(t
reat
men
tve
rsus
cont
rol)
for:
the
full
sam
ple
(col
umns
1–3)
;th
esu
bsam
ple
ofsu
bjec
tsw
hose
prio
rbe
liefs
rega
rdin
got
hers
’pla
nned
part
icip
atio
nw
ere
belo
wth
etr
ueva
lue
of17
%(c
olum
ns4–
6);
and,
the
subs
ampl
eof
subj
ects
who
sepr
ior
belie
fsre
gard
ing
othe
rs’p
lann
edpa
rtic
ipat
ion
wer
eab
ove
the
true
valu
eof
17%
(col
umns
7–9)
.“H
K-o
rien
ted
child
hood
env.
”is
az-
scor
ein
dex
cons
truc
ted
from
anin
dica
tor
ofw
heth
erth
esu
bjec
tco
mpl
eted
high
scho
olw
ith
Engl
ish
asth
efo
rmal
lang
uage
ofin
stru
ctio
n(a
sop
pose
dto
Chi
nese
),an
dth
enu
mbe
rof
gene
rati
ons
asu
bjec
t’sfa
mily
has
lived
inH
ong
Kon
g.“H
Hec
onom
ic&
soci
alst
atus
”is
az-
scor
ein
dex
cons
truc
ted
from
self
-rep
orte
dto
tali
ncom
eea
rned
bybo
thpa
rent
s(i
nclu
ding
sour
ces
ofin
com
esu
chas
divi
dend
san
dre
nts)
,the
num
ber
ofre
ales
tate
prop
erti
esow
ned
bya
subj
ect’s
pare
nts/
hous
ehol
din
Hon
gK
ong
atth
eti
me
ofth
esu
rvey
,and
whe
ther
asu
bjec
t’sfa
ther
’san
dm
othe
r’s
high
est
educ
atio
nala
ttai
nmen
tar
eab
ove
high
scho
ol,r
espe
ctiv
ely.
“Ow
npr
ojec
ted
econ
omic
stat
us”
isa
z-sc
ore
inde
xco
nstr
ucte
dfr
omth
epr
ojec
ted
med
ian
inco
me
ofH
KU
STgr
adua
tes
ina
subj
ect’s
maj
or/p
rogr
am,a
ndse
lf-r
epor
ted
expe
ctat
ions
ofre
lati
vein
com
eco
mpa
red
tocl
assm
ates
atH
KU
STat
age
40.
All
z-sc
ore
indi
ces
are
wei
ghte
dby
the
inve
rse
cova
rian
ceof
the
stan
dard
ized
outc
omes
,com
pute
dfo
llow
ing
And
erso
n(2
008)
.
54

Table II: Item count experiments and willingness to respond to direct questions
“Yes” in ∆ whenAttitudes: direct question cover is provided
Unfavorable view of CCP 0.923 0.020[0.059]
Consider self as Hong Kongese 0.878 -0.063[0.051]
Support for HK independence 0.465 0.057[0.057]
Support violence in pursuit of HK’s political rights 0.216 0.173***[0.050]
Note: The left hand column presents the fraction of 790 Hong Kong local students who ex-pressed the corresponding attitude in response to a direct question. The right hand columnpresents the difference between that fraction and the fraction estimated to support the atti-tude using the item count technique (“list experiment”). The 790 students asked the directquestions also represent the control group for the list experiment; the remaining 786 HongKong local students represent the treatment group. Assignment to “direct question” and “listexperiment” conditions was random among individuals who completed Part 1 of the study.*: Significant at 10%; **: 5%; ***: 1%. This table also appears in Cantoni et al. (2016).
55

Table III: Treatment effect on posterior beliefs
Posterior belief on participation Posterior belief on total participationamong HKUST students (%) among HK population (#)
Prior below Prior above Prior below Prior aboveSample: All subjects truth truth All subjects truth truth
(1) (2) (3) (4) (5) (6)
Panel A: baseline
Treatment 5.891*** 11423.9*(direction adj.) [0.567] [5988.6]Treatment 4.457*** -9.459*** 13198.0** -7013.5
[0.545] [1.413] [6541.3] [13108.6]
Panel B: with controls
Treatment 6.119*** 14133.0**(direction adj.) [0.572] [6150.0]Treatment 4.638*** -10.120*** 15086.2** -10936.5
[0.532] [1.452] [6686.1] [13747.8]
Panel C: trimmed
Treatment 5.144*** 13051.2**(direction adj.) [0.555] [6226.9]Treatment 4.279*** -7.568*** 15911.0** -5050.6
[0.568] [1.371] [6540.9] [14994.8]
Observations 1234 873 361 1234 873 361
DV mean (control grp.) 14.04 8.44 28.30 139878 128084 169940DV std. dev. (control grp.) 14.10 8.46 15.54 155482 147528 171162DV mean (all) 14.50 11.40 22.02 142684 134454 162586DV std. dev. (all) 10.83 7.99 12.92 142685 139385 148689
Note: Table shows “first stage” effects: the effects of the experimental treatment on subjects’ posterior beliefsregarding others’ actual protest participation, conditional on subjects’ prior beliefs regarding others’ actual par-ticipation. Columns 1–3 show effects on posterior beliefs regarding other experimental subjects’ actual participa-tion, while columns 4–6 show effects on posterior beliefs regarding the total turnout at the protest by all HongKong citizens. In columns 1 and 4, all subjects are pooled and treatment is coded as “−1” for subjects whosepriors regarding others’ planned participation were above the true value of 17%; pooled regressions also controlfor an indicator of whether subjects’ priors regarding others’ planned participation were above true value andits interaction with subjects’ prior beliefs regarding others’ actual participation. Columns 2 and 5 (3 and 6) showeffects on posterior beliefs for the subsample of subjects whose priors regarding others’ planned participationwere below (above) the true value of 17%. Panel A is estimated without any additional controls beyond thecorresponding levels of prior beliefs; Panel B replicates the analysis in Panel A, but adds controls for subjects’background characteristics and economic status (gender, year of birth, a z-score index measuring whether sub-jects were raised in a Hong Kong-oriented environment, whether subjects were raised in a religious household,the economic status of the household, and own projected economic status); Panel C estimates the baseline spec-ification of Panel A, but excluding those individuals in the experimental sample with the 5% lowest and the 5%highest prior beliefs regarding other subjects’ planned participation. Number of observations refers to that in thebaseline specification. *: Significant at 10%; **: 5%; ***: 1%.
56

Table IV: Treatment effect on protest participation
Participated in 2016 July 1st March
Prior below Prior aboveSample: All subjects truth truth
(1) (2) (3)
Panel A: baseline
Treatment -2.713***(direction adj.) [0.765]Treatment -2.105* 6.373***
[1.182] [1.873]
Panel B: with controls
Treatment -2.151**(direction adj.) [0.913]Treatment -2.066* 7.106***
[1.222] [2.066]
Panel C: trimmed
Treatment -2.467***(direction adj.) [0.797]Treatment -2.230* 5.711***
[1.250] [2.042]
Observations 1234 873 361
DV mean (control grp.) 2.743 3.472 0.885DV std. dev. (control grp.) 16.35 18.34 9.41DV mean (all) 2.998 2.062 5.263DV std. dev. (all) 17.06 14.22 22.36
Note: Table shows “reduced form” estimates, reporting the effects ofthe experimental treatment on subjects’ own protest participation. Incolumns 1 and 4, all subjects are pooled and treatment is coded as “−1”for subjects whose priors regarding others’ planned participation wasabove the true value of 17%. Column 2 (3) shows effects on poste-rior beliefs for the subsample of subjects whose priors regarding oth-ers’ planned participation were below (above) the true value of 17%.Panel A is estimated without any controls. Panel B replicates the analy-sis in Panel A, but adds controls for subjects’ background characteristicsand economic status (gender, year of birth, a z-score index measuringwhether subjects were raised in a Hong Kong-oriented environment,whether subjects were raised in a religious household, the economicstatus of the household, and own projected economic status), and forsubjects’ prior beliefs regarding HKUST students’ planned participa-tion in the July 1st March. Panel C estimates the baseline specificationof Panel A, but excluding those individuals in the experimental sam-ple with the 5% lowest and the 5% highest prior beliefs regarding othersubjects’ planned participation. Number of observations refers to thatin the baseline specification. *: Significant at 10%; **: 5%; ***: 1%.
57

Table V: Heterogeneous treatment effects by prior beliefs
(1) (2) (3)
Panel A: treatment effect on posterior beliefs (1st stage)
Treatment 7.417*** 3.635 7.206***[0.827] [3.314] [2.311]
Treatment × prior beliefs -0.430***[0.059]
Treatment × predicted prior beliefs -0.204 -0.419***[0.211] [0.153]
Treatment × residual prior beliefs -0.441***[0.062]
Panel B: treatment effect on protest participation (reduced form)
Treatment -4.112*** -10.970** -11.140**[1.444] [4.822] [4.679]
Treatment × prior beliefs 0.284***[0.068]
Treatment × predicted prior beliefs 0.691** 0.701**[0.341] [0.331]
Treatment × residual prior beliefs 0.246***[0.068]
Observations 1234 1176 1176
1st stage DV mean (control grp.) 14.04 14.10 14.101st stage DV std. dev. (control grp.) 14.10 14.24 14.241st stage DV mean (all) 14.50 14.50 14.501st stage DV std. dev. (all) 10.83 10.85 10.85
2nd stage DV mean (control grp.) 2.743 2.880 2.8802nd stage DV std. dev. (control grp.) 16.35 16.75 16.752nd stage DV mean (all) 2.998 2.976 2.9762nd stage DV std. dev. (all) 17.06 17.00 17.00
Note: Table shows “first stage” (Panel A) and “reduced form” (Panel B)estimates, reporting the effects of the experimental treatment on subjects’posterior beliefs about others’ participation and on subjects’ own protestparticipation. In column 1, the model allows treatment effects to varywith subjects’ prior beliefs regarding the planned protest participation ofother experimental subjects. In column 2, the model allows treatment ef-fects to vary with subjects’ predicted prior beliefs based on observables (thepredicted levels of priors regarding others’ planned participation are es-timated using a linear model including all 47 factors listed in Online Ap-pendix Table A.5). In column 3, the model allows treatment effects to varywith subjects’ residual prior beliefs, the component of beliefs not predictedby observables, as well as with subjects’ predicted priors. All regressions in-clude the relevant lower-order term for prior beliefs. *: Significant at 10%;**: 5%; ***: 1%.
58

Table VI: Two stage estimates of protest participation
Participated in 2016 July 1st March
Prior below Prior aboveSample: All subjects truth truth
(1) (2) (3)
Panel A: baseline
Posterior belief -0.553*** -0.468** -0.654**[0.177] [0.236] [0.264]
Panel B: with controls
Posterior belief -0.554*** -0.447* -0.660***[0.175] [0.231] [0.254]
Panel C: trimmed
Posterior belief -0.607*** -0.514** -0.754**[0.212] [0.261] [0.354]
Observations 1234 873 361
1st stage DV mean (control grp.) 14.04 8.44 28.301st stage DV std. dev. (control grp.) 14.10 8.46 15.541st stage DV mean (all) 14.50 11.40 22.021st stage DV std. dev. (all) 10.83 7.99 12.92
2nd stage DV mean (control grp.) 2.743 3.472 0.8852nd stage DV std. dev. (control grp.) 16.35 18.34 9.412nd stage DV mean (all) 2.998 2.062 5.2632nd stage DV std. dev. (all) 17.06 14.22 22.36
Note: Table shows two-stage estimates of the effects of beliefs about other sub-jects’ turnout in the protest on one’s own turnout. The first stage estimates theeffects of the experimental treatment on subjects’ posterior beliefs regarding othersubjects’ actual protest participation, conditional on the corresponding prior be-liefs. The second stage exploits variation in beliefs regarding other subjects’ par-ticipation induced by the experimental treatment to estimate the effect of beliefsabout others’ protest turnout on one’s own turnout. In column 1, all subjects arepooled and treatment is coded as “−1” for subjects whose priors regarding others’planned participation were above the true value of 17%; pooled regression alsocontrols for an indicator of whether subjects’ priors regarding others’ plannedparticipation were above true value and its interaction with subjects’ prior be-liefs regarding others’ actual participation. Column 2 (3) shows estimates forthe subsample of subjects whose priors regarding others’ planned participationwere below (above) the true value of 17%. Panel A is estimated without any con-trols beyond the corresponding prior beliefs. Panel B replicates the analysis inPanel A, but adds controls for subjects’ background characteristics and economicstatus (gender, year of birth, a z-score index measuring whether subjects wereraised in a Hong Kong-oriented environment, whether subjects were raised in areligious household, the economic status of the household, and own projectedeconomic status). Panel C estimates the baseline specification of Panel A, but ex-cluding those individuals in the experimental sample with the 5% lowest and the5% highest prior beliefs regarding other subjects’ planned participation. Numberof observations refers to that in the baseline specification. *: Significant at 10%; **:5%; ***: 1%. 59
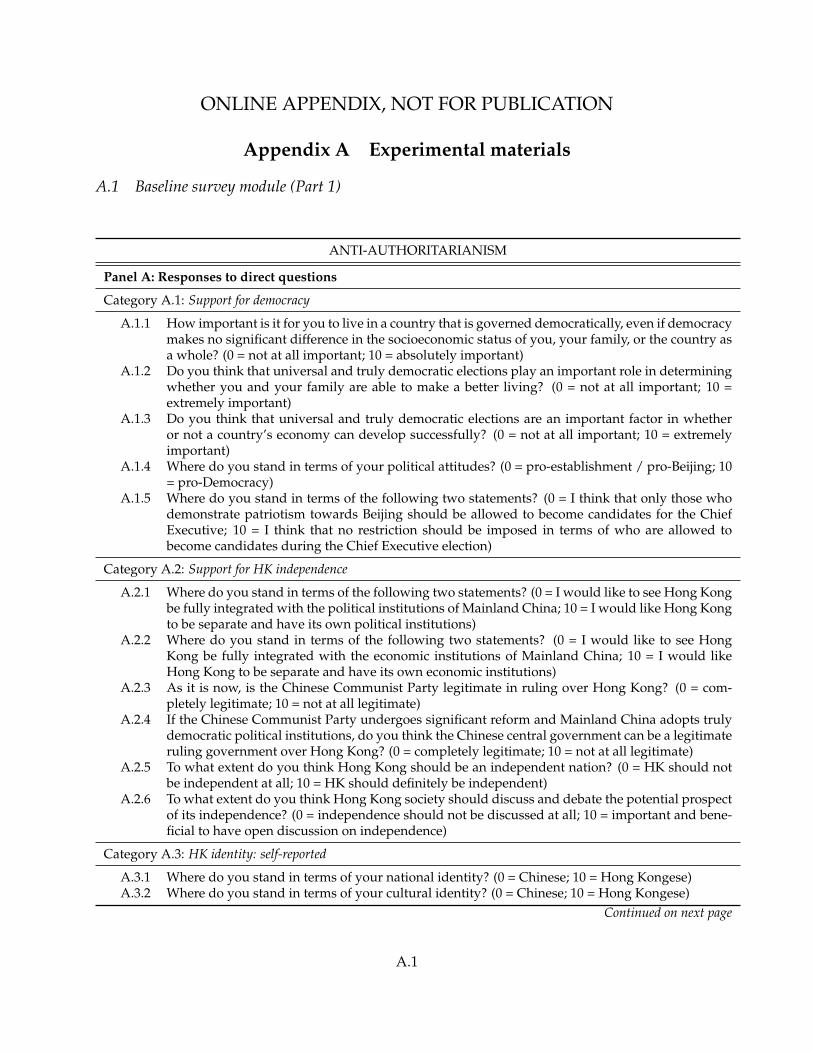
ONLINE APPENDIX, NOT FOR PUBLICATION
Appendix A Experimental materials
A.1 Baseline survey module (Part 1)
ANTI-AUTHORITARIANISM
Panel A: Responses to direct questions
Category A.1: Support for democracy
A.1.1 How important is it for you to live in a country that is governed democratically, even if democracymakes no significant difference in the socioeconomic status of you, your family, or the country asa whole? (0 = not at all important; 10 = absolutely important)
A.1.2 Do you think that universal and truly democratic elections play an important role in determiningwhether you and your family are able to make a better living? (0 = not at all important; 10 =extremely important)
A.1.3 Do you think that universal and truly democratic elections are an important factor in whetheror not a country’s economy can develop successfully? (0 = not at all important; 10 = extremelyimportant)
A.1.4 Where do you stand in terms of your political attitudes? (0 = pro-establishment / pro-Beijing; 10= pro-Democracy)
A.1.5 Where do you stand in terms of the following two statements? (0 = I think that only those whodemonstrate patriotism towards Beijing should be allowed to become candidates for the ChiefExecutive; 10 = I think that no restriction should be imposed in terms of who are allowed tobecome candidates during the Chief Executive election)
Category A.2: Support for HK independence
A.2.1 Where do you stand in terms of the following two statements? (0 = I would like to see Hong Kongbe fully integrated with the political institutions of Mainland China; 10 = I would like Hong Kongto be separate and have its own political institutions)
A.2.2 Where do you stand in terms of the following two statements? (0 = I would like to see HongKong be fully integrated with the economic institutions of Mainland China; 10 = I would likeHong Kong to be separate and have its own economic institutions)
A.2.3 As it is now, is the Chinese Communist Party legitimate in ruling over Hong Kong? (0 = com-pletely legitimate; 10 = not at all legitimate)
A.2.4 If the Chinese Communist Party undergoes significant reform and Mainland China adopts trulydemocratic political institutions, do you think the Chinese central government can be a legitimateruling government over Hong Kong? (0 = completely legitimate; 10 = not at all legitimate)
A.2.5 To what extent do you think Hong Kong should be an independent nation? (0 = HK should notbe independent at all; 10 = HK should definitely be independent)
A.2.6 To what extent do you think Hong Kong society should discuss and debate the potential prospectof its independence? (0 = independence should not be discussed at all; 10 = important and bene-ficial to have open discussion on independence)
Category A.3: HK identity: self-reported
A.3.1 Where do you stand in terms of your national identity? (0 = Chinese; 10 = Hong Kongese)A.3.2 Where do you stand in terms of your cultural identity? (0 = Chinese; 10 = Hong Kongese)
Continued on next page
A.1

A.3.3 How important is being a Hong Kongese citizen to you? (0 = not at all important; 10 = extremelyimportant)
A.3.4 How important is being a Chinese citizen to you? (0 = extremely important; 10 = not at all impor-tant)
Category A.4: Unhappiness with political status quo
A.4.1 How democratically is Hong Kong being governed today? (0 = completely democratic; 10 = notat all democratic)
A.4.2 How would you rate the political system in Hong Kong between 1997 and 2012, relative to thatprior to 1997? (0 = extremely good; 10 = extremely bad)
A.4.3 How would you rate the political system in Hong Kong today, relative to that prior to 1997? (0 =extremely good; 10 = extremely bad)
A.4.4 All things considered, how satisfied are you with your life as a whole these days? (0 = completelysatisfied; 10 = completely dissatisfied)
Category A.5: Anti-CCP views on current events
A.5.1 To what degree do believe that the electoral reform package proposed by Mainland China isdemocratic? (0 = completely democratic; 10 = completely undemocratic)
A.5.2 Do you support the Legislative Council’s veto decision? (0 = completely against Legco’s decision;10 = completely support Legco’s decision)
A.5.3 Between October and December 2015, multiple booksellers from Causeway Bay Books have gonemissing. Many suspect that the mainland Chinese government was involved. If this is true, whatdo you think of mainland Chinese government’s action? (0 = completely legitimate, in accordancewith Basic Law; 10 = completely illegitimate, violation against Basic Law)
Panel B: Self-reported behavior and real-stakes decisions
B.1 Have you participated in the Occupy Central / Umbrella Revolution during September - Decem-ber 2014?
B.2 Which party are you are you planning to vote for, during the 2016 Hong Kong Legislative CouncilElection? (0 = pro-Beijing parties; 1 = pro-democracy parties)
B.3 Are you planning to participate in the July 1st March in 2016? (0 = no, or not sure yet but moreunlikely than yes; 1 = yes, or not sure yet but more likely than not)
B.4.1-4 Average amount allocated to HK local partner in national identity games, relative to the amountallocated to Mainland Chinese
B.5 How much money from your participation fee do you want to contribute to Demosisto? (0 =none; 1 = positive amount)
FUNDAMENTAL FACTORS
Panel C: Economic preferences
Category C.1: Risk tolerance
C.1.1 Please tell me, in general, how willing or unwilling you are to take risks? (0 = completely unwill-ing to take risks; 10 = very willing to take risks)
C.1.2 Certainty equivalent from step-wise lottery choices (what would you prefer: a draw with 50 per-cent chance of receiving 300 HKD, and the same 50 percent chance of receiving nothing, or theamount of xxx HKD as a sure payment?)
C.1.3 Eckel and Grossman (2002) lottery decisions: for the following lottery options, please choose onethat you like the most? [incentivized]
Continued on next page
A.2

Category C.2: Patience
C.2.1 How willing are you to give up something that is beneficial for you today in order to benefit morefrom that in the future? (0 = completely unwilling; 10 = very willing)
C.2.2 I tend to postpone tasks even if I know it would be better to do them right away (0 = describesme perfectly; 10 = does not describe me at all)
C.2.3 Patience index from a step-wise intertemporal choices (would you rather receive 100 HKD todayor xxx HKD in 12 months?)
Category C.3: Altruism
C.3.1 How willing are you to give to good causes without expecting anything in return? (0 = completelyunwilling; 10 = very willing)
C.3.2 Today you unexpectedly received 10,000 HKD. How much of this amount would you donate to agood cause? (value between 0 and 10,000)
Category C.4: Reciprocity
C.4.1 When someone does me a favor I am willing to return it (0 = describes me perfectly; 10 = does notdescribe me at all)
C.4.2 I assume that people have only the best intentions (0 = does not describe me at all; 10 = describesme perfectly)
C.4.3 When a stranger helps you, would you be willing to give one of the following presents to thestranger as a thank-you gift?
C.4.4 How willing are you to punish someone who treats you unfairly, even if there may be costs foryou? (0 = completely unwilling; 10 = very willing)
C.4.5 How willing are you to punish someone who treats others unfairly, even if there may be costs foryou? (0 = completely unwilling; 10 = very willing)
C.4.6 If I am treated very unjustly, I will take revenge at the first occasion, even if there is a cost to doso (0 = describes me perfectly; 10 = does not describe me at all)
Category C.5: Preference for redistribution
C.5.1-11 Average amount of money allocated to a fellow HK local partner in a series of dictator games[incentivized]
Panel D: Personality traits
Category D.1: Big 5 - openness
D.1.1-5 On each numerical scale that follows, indicate which point is generally more descriptive of you:D.1.1 1 = no-nonsense; 5 = a dreamerD.1.2 1 = practical; 5 = theoreticalD.1.3 1 = following authority; 5 = following imaginationD.1.4 1 = seek routine; 5 = seek noveltyD.1.5 1 = prefer things clear-cut; 5 = comfortable with ambiguity
Category D.2: Big 5 - agreeableness
D.2.1-5 On each numerical scale that follows, indicate which point is generally more descriptive of you:D.2.1 1 = abrupt; 5 = courteousD.2.2 1 = selfish; 5 = generousD.2.3 1 = cold; 5 = warmD.2.4 1 = independent; 5 = team playerD.2.5 1 = skeptical; 5 = trusting
Category D.3: Big 5 - conscientiousness
Continued on next page
A.3
D.3.1-5 On each numerical scale that follows, indicate which point is generally more descriptive of you:D.3.1 1 = messy; 5 = neatD.3.2 1 = open-minded; 5 = decisiveD.3.3 1 = easily distracted; 5 = stay focusedD.3.4 1 = comfortable with chaos; 5 = a preference for orderD.3.5 1 = procrastinate; 5 = on time
Category D.4: Big 5 - neuroticism
D.4.1-5 On each numerical scale that follows, indicate which point is generally more descriptive of you:D.4.1 1 = calm; 5 = eagerD.4.2 1 = confident; 5 = cautiousD.4.3 1 = upbeat; 5 = discouragedD.4.4 1 = don’t give a darn; 5 = easily embarrassedD.4.5 1 = unflappable; 5 = distractible
Category D.5: Big 5 - extraversion
D.5.1-5 On each numerical scale that follows, indicate which point is generally more descriptive of you:D.5.1 1 = prefer being alone; 5 = prefer being with othersD.5.2 1 = pessimistic; 5 = optimisticD.5.3 1 = private; 5 = exhibitionistD.5.4 1 = cool; 5 = outgoingD.5.5 1 = thoughtful; 5 = conversational
Panel E: Cognitive ability
Category E.1: Cognitive reflection test
E.1.1 A bat and a ball cost $1.10 in total. The bat costs $1.00 more than the ball. How much does theball cost?
E.1.2 If it takes 5 machines 5 minutes to make 5 widgets, how long would it take 100 machines to make100 widgets?
E.1.3 In a lake, there is a patch of lily pads. Every day, the patch doubles in size. If it takes 48 days forthe patch to cover the entire lake, how long would it take for the patch to cover half of the lake?
Category E.2: University GPA
E.2.1 GPA at HKUST, demeaned by major/program
Panel F: Economic status
Category F.1: Household economic & social status
F.1.1 During the past 12 months, what’s the average monthly income of your family?F.1.2 How many properties in HK do your parents currently own in total?F.1.3 Father’s highest educational attainment is above high schoolF.1.4 Mother’s highest educational attainment is above high school
Category F.2: Student’s projected economic status
F.2.1 Median income of HKUST graduates in same major/program (as of 2014)F.2.2 At age 40, where do you see yourself financially, relative to your classmates at HKUST? (1 = at
the very bottom; 7 = at the very top)
Panel G: Background characteristics
G.1 Gender (0 = female; 1 = male)Continued on next page
A.4

G.2 Birth year
Category G.3: HK-oriented childhood environment
G.3.1 Generations since family migrated to HK (1 = self-migrated; 4 = great grandparents migrated)G.3.2 Attended HK high school using English as language of instruction
Category G.4: Religiosity
G.4.1 Religiosity (0 = atheist; 1 = religious)
SIMULTANEOUSLY DETERMINED VARIABLES
Panel H: Beliefs about politics
Category H.1: Beliefs about future institutions
H.1.1 Optimistic about HK’s political institutions in 2025 (believe that Hong Kong will have separateand completely different political institutions from those of Mainland China by 2025, with highcertainty)
H.1.2 Optimistic about HK’s political institutions in 2050 (believe that Hong Kong will have separateand completely different political institutions from those of Mainland China by 2050, with highcertainty)
Category H.2: Beliefs about protest efficacy
H.2.1 Probability of achieving democratic institutions in HK if protests occur, relative to the probabilityif no protest occurs (based on separate elicitation of probability of various protest scenarios andconditional probabilities of democratic institutions under these scenarios)
Panel I: Beliefs about HKUST students
Category I.1: Beliefs about HKUST students: support for democracy
I.1.1-2 What is the average answer that other participants from HKUST in this study have chosen?I.1.1 Corresponding question: A.1.4I.1.2 Corresponding question: A.1.5
Category I.2: Beliefs about HKUST students: support for HK independence
I.2.1-3 What is the average answer that other participants from HKUST in this study have chosen?I.2.1 Corresponding question: A.2.1I.2.2 Corresponding question: A.2.2I.2.3 Corresponding question: A.2.5
Category I.3: Beliefs about HKUST students: HK identity
I.3.1-2 What is the average answer that other participants from HKUST in this study have chosen?I.3.1 Corresponding question: A.3.1I.3.2 Corresponding question: A.3.2
Category I.4: Beliefs about HKUST students: unhappiness with political status quo
I.4.1-2 What is the average answer that other participants from HKUST in this study have chosen?I.4.1 Corresponding question: A.4.1I.4.2 Corresponding question: A.4.4
Category I.5: Beliefs about HKUST students: aggressive pursuit of political rights
Continued on next page
A.5

I.5.1 What is the average answer that other participants from HKUST in this study have chosen? Cor-responding question: N.1.2
Panel J: Social life
Category J.1: Political social network
J.1.1 When you get together with your friends, would you say you discuss political matters frequently,occasionally, or never? (0 = never; 10 = frequently)
J.1.2 When you, yourself, hold a strong opinion, do you ever find yourself persuading your friends,relatives or fellow schoolmates to share your views or not? If so, does this happen often, fromtime to time, or rarely? (0 = never; 10 = always)
J.1.3 Do you know any direct relative who has participated in the Occupy Central movement in 2014?J.1.4 Do you know any schoolmate who has participated in the Occupy Central movement in 2014?J.1.5 Do you know any friend outside of school who has participated in the Occupy Central movement
in 2014?J.1.6 Has any of your direct relatives, schoolmates, or friends outside of school persuaded you to sup-
port Occupy Central (or anti-Occupy Central)?J.1.7 How much do you know, on average, about your direct relatives’ political orientation? (0 = do
not know at all; 10 = very familiar and certain)J.1.8 How much do you know, on average, about your schoolmates’ political orientation? (0 = do not
know at all; 10 = very familiar and certain)J.1.9 How much do you know, on average, about your friends’ political orientation? (0 = do not know
at all; 10 = very familiar and certain)
Category J.2: Sociability
J.2.1 Total number of friends at HKUST elicited (Please list the names of your friends at HKUST, in theorder from those whom you interact with most frequently, to those whom you interact with lessfrequently. Please list as many names as you want – there is no space limit)
J.2.2 Current relationship status is non-single
Panel K: Beliefs about close friends
Category K.1: Beliefs about close friends: support for democracy
K.1.1-2 What is the average answer that 5 of your closest friends at HKUST would have chosen?K.1.1 Corresponding question: A.1.4K.1.2 Corresponding question: A.1.5
Category K.2: Beliefs about close friends: support for HK independence
K.2.1-3 What is the average answer that 5 of your closest friends at HKUST would have chosen?K.2.1 Corresponding question: A.2.1K.2.2 Corresponding question: A.2.2K.2.3 Corresponding question: A.2.5
Category K.3: Beliefs about close friends: HK identity
K.3.1-2 What is the average answer that 5 of your closest friends at HKUST would have chosen?K.3.1 Corresponding question: A.3.1K.3.2 Corresponding question: A.3.2
Category K.4: Beliefs about close friends: unhappiness with political status quo
K.4.1-2 What is the average answer that 5 of your closest friends at HKUST would have chosen?K.4.1 Corresponding question: A.4.1
Continued on next page
A.6

K.4.2 Corresponding question: A.4.4
Category K.5: Beliefs about close friends: aggressive pursuit of political rights
K.5.1 What is the average answer that 5 of your closest friends at HKUST would have chosen? Corre-sponding question: N.1.2
Panel L: Media consumption
Category L.1: Frequency of news consumption
L.1.1 How often do you browse the internet to read about news and current events? (1 = never; 6 =multiple times a day)
Category L.2: Pro-democratic source of media
L.2.1 What are the top 3 internet websites that you regularly browse to consume information? (SelectHK local websites among the top 2 choices)
L.2.2 What are the top 3 news outlets that you regularly read for news (including the website, hard-copies of the newspaper, etc.)? (Select pro-democracy news outlets in HK among the top 2 choices)
Panel M: Political interest and knowledge
Category M.1: Political interest
M.1.1 How interested would you say you are in politics? (0 = not at all interested; 10 = extremelyinterested)
Category M.2: Political knowledge
M.2.1-4 Able to answer the following questions correctly:M.2.1 Which of the following is a Democratic Party Legco member?M.2.2 Which of the following is a pro-Beijing Legco member?M.2.3 Which of the following is a leader of a newly founded party in HK that focuses on self-
determination?M.2.4 Which of the following is a leader of a newly founded party in HK that focuses on independence?
ADDITIONAL OUTCOME VARIABLES
Panel N: Intensity of political support
Category N.1: Aggressive pursuit of political rights
N.1.1 What do you think is the consequence of this veto decision, in terms of Hong Kong adoptingfully democratic political institutions in the future? (0 = the veto decision is extremely harmfulin leading Hong Kong to fully democratic institutions in the future; 10 = the veto decision isextremely beneficial in leading Hong Kong to fully democratic institutions in the future)
N.1.2 Some people support the use of violence to fight for Hong Kong citizens’ political rights, whileothers oppose the use of violence. Where do you stand on this question? (0 = violence can neverbe justified; 10 = violence is currently justified)
A.7

A.2 Pre-protest module (Part 2)
Version A: Control Group [Screen 1] Welcome screen: thank you for participating in this follow-up survey. [Screen 2] Remember that we offered you:
1. A HKD 10 bonus payment for accurately guessing the percentage of HKUST survey participants who would actually attend this July 1 March (��UL);
2. An additional HKD 10 bonus payment for accurately guessing the total number of Hong Kong citizens would actually attend this July 1 March (��UL).
In last week’s survey, you guessed that:
1. [embedded individual value] % of HKUST survey participants would attend this July 1 March; 2. A total of [embedded individual value] Hong Kong citizens would attend this July 1 March.
------------------------------- Perhaps since then your views have changed. We now ask you again to provide guesses about actual attendance of the July 1 March. Instead of your guesses in the previous survey, we will use today’s guesses to determine your bonus payment.
1. How many people in total do you think will participate in the July 1st March (���UL) in 2016? • If your guess is within 10% of what will be reported by the HKUPOP (b8��5(?BP�) after
the July 1st March in 2016, then you will earn a bonus payment of HKD 10. • To give you a sense, according to HKUPOP’s report, among the July 1st March that took place
between 2003 and 2015: o The lowest attendance in a given year is: 17,000 (in 2008); o The highest attendance in a given year is: 462,000 (in 2003).
[Slider bar, ranging from 0 to 1,000,000]
2. Please guess what percentage of the participants from HKUST of this study will participate in the July 1st March (���UL) in 2016?
• If your guess is within 2 percentage points of the percent of students who actually participate, you will earn a bonus payment of HKD 10.
______ %
[Fill in the number: between 0-100]
A.8

[Screen 3] You have now finished the follow-up survey module. Thank you very much for your participation. We will inform you about the total payment you have earned from last week and today’s surveys – the payment will be deposited to your bank account via the HKUST Student Information System (SIS). We will also inform you about future study opportunities, and we look forward to seeing you again soon! Feel free to contact us at [email protected] if you have questions and/or concerns regarding this study. Version B: Treatment Group [Screen 1] Welcome screen: thank you for participating in this follow-up survey. [Screen 2] In this follow-up survey, we wish to update you on your fellow HKUST survey participants’ planned participation in this year’s July 1 March (��UL). Recall that you guessed that [embedded individual value] % of HKUST survey participants would plan to attend the July 1 March. Based on last week’s survey, the true percentage of survey participants who plan to attend the July 1 March is 17%. -------------------------------- Remember that we offered you:
1. A HKD 10 bonus payment for accurately guessing the percentage of HKUST survey participants who would actually attend this July 1 March (��UL);
2. An additional HKD 10 bonus payment for accurately guessing the total number of Hong Kong citizens would actually attend this July 1 March (��UL).
In last week’s survey, you guessed that:
1. [embedded individual value] % of HKUST survey participants would attend this July 1 March; 2. A total of [embedded individual value] Hong Kong citizens would attend this July 1 March.
------------------------------- Perhaps since then your views have changed. We now ask you again to provide guesses about actual attendance of the July 1 March. Instead of your guesses in the previous survey, we will use today’s guesses to determine your bonus payment.
A.9

1. How many people in total do you think will participate in the July 1st March (���UL) in 2016?
• If your guess is within 10% of what will be reported by the HKUPOP (b8��5(?BP�) after the July 1st March in 2016, then you will earn a bonus payment of HKD 10.
• To give you a sense, according to HKUPOP’s report, among the July 1st March that took place between 2003 and 2015:
o The lowest attendance in a given year is: 17,000 (in 2008); o The highest attendance in a given year is: 462,000 (in 2003).
[Slider bar, ranging from 0 to 1,000,000]
2. Please guess what percentage of the participants from HKUST of this study will participate in the July 1st March (���UL) in 2016?
• If your guess is within 2 percentage points of the percent of students who actually participate, you will earn a bonus payment of HKD 10.
______ %
[Fill in the number: between 0-100] [Screen 3] You have now finished the follow-up survey module. Thank you very much for your participation. We will inform you about the total payment you have earned from last week and today’s surveys – the payment will be deposited to your bank account via the HKUST Student Information System (SIS). We will also inform you about future study opportunities, and we look forward to seeing you again soon! Feel free to contact us at [email protected] if you have questions and/or concerns regarding this study.
A.10

A.3 Post-protest module (Part 3)
[Screen 1] Welcome screen: thank you for participating in this follow-up survey. [Screen 2]
1. Did you attend the July 1 2016 March?
{IF “NO”, skip to Screen 3.}
2. Which political group’s crowd did you join during the March? (please choose all that apply)
�5e Civic Party 5�e Democratic Party �5�W People Power "e Labour Party @5T League of Social Democrats M" Neighbourhood and Worker Service Centre -5��= Neo Democrats _$-+ Youngspiration b8>' Demosisto 9K�5 Civic Passion 1�5��C Hong Kong Indigenous A��<0 HKUST Student Union A�L� ProgressUST �F HKFS /D+6�Y Proletariat Political Institute b8I< HKpeanut D1005X^� D100 Radio G"= Hong Kong Confederation of Trade Unions ]�P� ThunderGo d5�,� Siu Lai Democracy Groundwork ��4EF= Land Justice League 7R� Falun Gong �Z2 Chu Siu-hung :��5S�[F# Alliance for Universal Pension )Q+%VO!�`a;\3�F= Give Dogs a Home .Nc�� Mong Kok Shopping Revolution
A.11

H&�� Friends of Conscience *J� Umbrella Blossom � Others
3. What was your general impression of the March (300 words or less)?
{Open-ended}
4. Recall that in the previous survey rounds, we asked about your friends at HKUST. To the best of your knowledge, how many of the friends you named (listed below) attended?
{Multiple round}
[Screen 3] So far, you have earned: HKD {inserted individual payment value} in total from participating in our study. The payment will be deposited directly to your bank account via the HKUST Student Information System (SIS), in approximately 5-8 weeks. Feel free to contact us at [email protected] if you have questions and/or concerns regarding this study.
A.12
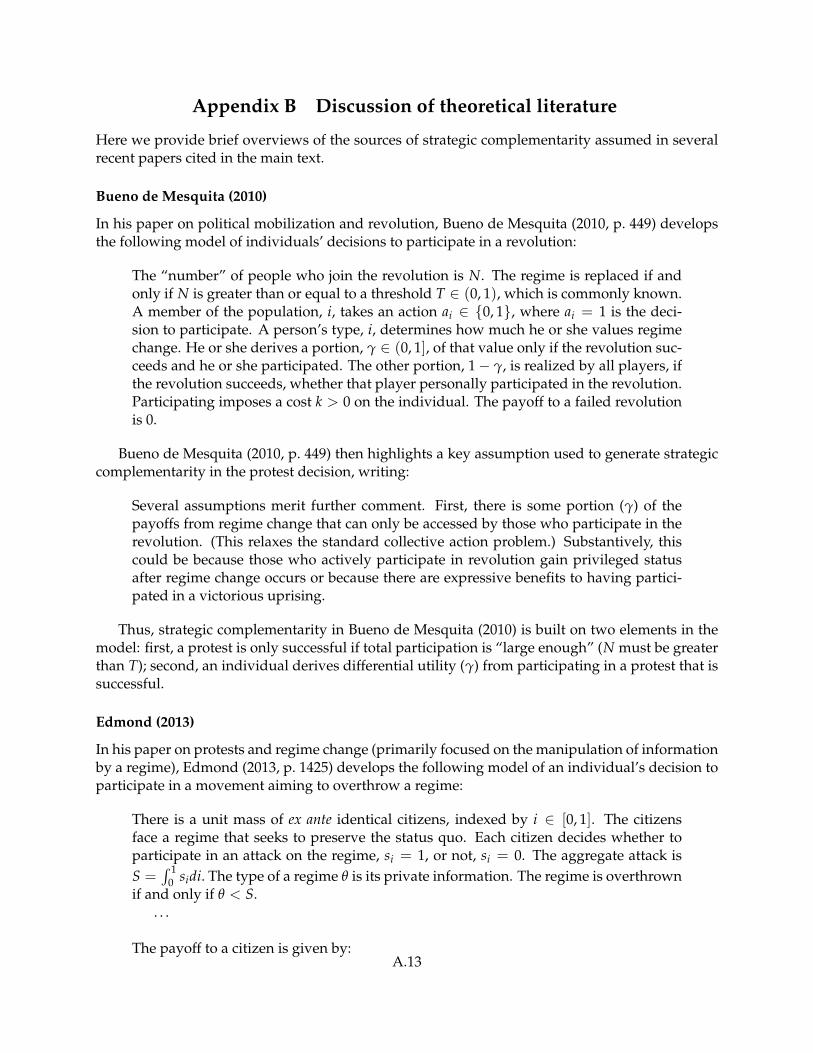
Appendix B Discussion of theoretical literature
Here we provide brief overviews of the sources of strategic complementarity assumed in severalrecent papers cited in the main text.
Bueno de Mesquita (2010)
In his paper on political mobilization and revolution, Bueno de Mesquita (2010, p. 449) developsthe following model of individuals’ decisions to participate in a revolution:
The “number” of people who join the revolution is N. The regime is replaced if andonly if N is greater than or equal to a threshold T ∈ (0, 1), which is commonly known.A member of the population, i, takes an action ai ∈ {0, 1}, where ai = 1 is the deci-sion to participate. A person’s type, i, determines how much he or she values regimechange. He or she derives a portion, γ ∈ (0, 1], of that value only if the revolution suc-ceeds and he or she participated. The other portion, 1− γ, is realized by all players, ifthe revolution succeeds, whether that player personally participated in the revolution.Participating imposes a cost k > 0 on the individual. The payoff to a failed revolutionis 0.
Bueno de Mesquita (2010, p. 449) then highlights a key assumption used to generate strategiccomplementarity in the protest decision, writing:
Several assumptions merit further comment. First, there is some portion (γ) of thepayoffs from regime change that can only be accessed by those who participate in therevolution. (This relaxes the standard collective action problem.) Substantively, thiscould be because those who actively participate in revolution gain privileged statusafter regime change occurs or because there are expressive benefits to having partici-pated in a victorious uprising.
Thus, strategic complementarity in Bueno de Mesquita (2010) is built on two elements in themodel: first, a protest is only successful if total participation is “large enough” (N must be greaterthan T); second, an individual derives differential utility (γ) from participating in a protest that issuccessful.
Edmond (2013)
In his paper on protests and regime change (primarily focused on the manipulation of informationby a regime), Edmond (2013, p. 1425) develops the following model of an individual’s decision toparticipate in a movement aiming to overthrow a regime:
There is a unit mass of ex ante identical citizens, indexed by i ∈ [0, 1]. The citizensface a regime that seeks to preserve the status quo. Each citizen decides whether toparticipate in an attack on the regime, si = 1, or not, si = 0. The aggregate attack isS =
∫ 10 sidi. The type of a regime θ is its private information. The regime is overthrown
if and only if θ < S.. . .
The payoff to a citizen is given by:A.13

u(si, S, θ) = (1{θ < S} − p)× si
where 1{} denotes the indicator function and where p > 0 is the opportunity costof participating in an attack. A citizen will participate, si = 1, whenever they expectregime change to occur with more than probability p. To focus on scenarios whereindividual decisions are not trivial, I also assume that p < 1. Otherwise, if p ≥ 1, itis optimal for an individual to not participate independent of θ and S. With p < 1 theindividual si and aggregate S are strategic complements: the more citizens participatein an attack, the more likely it is that the regime is overthrown and so the more likelyit is that any individual also participates.
The Edmond (2013) model thus builds the assumption of strategic complementarity on twoelements: first, the assumption that a protest is more likely to be successful when it is larger; and,second, that an individual will derive greater utility from participating in a successful protest.
Passarelli and Tabellini (2017)
In a model of citizen unrest in response to perceived unfair government policy, Passarelli andTabellini (2017, pp. 909–910) model participation in an anti-government riot as follows:
Individuals unilaterally decide whether to participate in a riot, trading off the costsand benefits. The benefit is purely emotional: it is the psychological reward of joiningother group members in a public display of the frustration caused by the policy or ofcontributing to take revenge on an unfair government. We refer to the psychologicalbenefit of rioting, denoted ai, as the aggrievement caused by the policy to membersof group i, because we assume that this benefit is related to the emotion of being thevictim of unfair treatment.
. . .Joining a riot also entails costs, in terms of time or risk of being arrested or injured.We model these costs as the sum of two components: µ + εij. The parameter µ > 0 isknown and common to all and reflects external conditions such as the risk of violentrepression. The term εij is a random variable that captures idiosyncratic componentsof the cost or benefit of participation (the superscript ij refers to individual j in groupi).
. . .Finally, we assume that there is a complementarity: the benefit of participation growsproportionately with the number of other group members also participating in the riot,piλi. As explained below, aggrievement is an individual emotion, but it is related to thefeeling that the group is treated unfairly. Hence, the psychological benefit of a publicdisplay of anger is stronger if the emotion is more widely shared. Participation couldalso proxy for the probability of reaching a critical threshold that triggers a politicalcrisis; in this interpretation, the complementarity reflects the feeling of contributing toa more meaningful event with a greater chance of success. Equivalently, the comple-mentarity could also be on the cost side: the probability of being arrested is smaller ina larger crowd.
A.14

Passarelli and Tabellini (2017) thus offer multiple interpretations of their assumption of strate-gic complementarity: it may arise from greater expressive utility when participating in a largerprotest; from greater utility when participating in a protest more likely to succeed; or from loweranticipated costs of participation when a protest is larger.
Barbera and Jackson (2017)
In their paper studying revolution under uncertainty, Barbera and Jackson (2017, pp. 6–8) sketcha simple, baseline model of individuals’ protest decision:
A continuum of citizens of mass 1 are indexed by i ∈ [0, 1]. They have a choice toparticipate in a revolution. Again, we use the term ‘revolt’ but the model obviouslyhas many applications. The revolution is successful if at least a fraction q ∈ (0, 1] ofthe population participates. If fewer than q participate, then the revolution fails.
. . .An agent gets a value from the the revolution as a function of whether it is successfulor not and whether the agent participates or not. All of these payoffs . . . are given bythe following table.1
Success FailureParticipate ai + Vi bi − Ci
Not Participate ai bi
Here, ai is the value that an agent gets if the revolution is successful, regardless ofwhether the agent participates or not, and this can depend on the agent’s type and thestate. Similarly, bi is the value that an agent gets if the revolution fails, regardless ofwhether the agent participates or not, and this can depend on the agent’s type and thestate. The values, Vi and Ci then are the additional value and cost that an agent getsfrom participating in the revolution as a function of whether it is successful or fails.
. . .[W]e follow the usual approach that has been followed in the voting literature andhave Vi be the marginal utility for having participated, conditional upon success. Sothis is not the payoff that an agent gets in terms of expecting to be pivotal, but insteadthe utility they get from knowing or being able to say that they participated in a rev-olution that was successful: from having been one of those who stormed the Bastille,participated in the Salt March, or protests in Tunisia, etc. It will almost never be thecase that one more or one fewer revolutionary would make the difference. People re-act to some more basic utility from the action itself, which can be motivated in manydifferent ways.
Thus, much like Bueno de Mesquita (2010) and Edmond (2013), the Barbera and Jackson (2017)model builds the assumption of strategic complementarity on two elements: first, a protest isonly successful if total participation is “large enough” (the participation level must exceed thethreshold q); second, an individual derives differential utility (Vi) from participating in a protestthat is successful.
1Note that the table’s notation is slightly simplified for purposes of exposition.
A.15

Appendix C Appendix figures and tables
Figure A.1: Turnout at July 1st Marches from 2003 to 2017, as counted by the organizers, as re-ported in government announcements, and as estimated by the Public Opinion Programme at theUniversity of Hong Kong (all in thousands). Reproduced from the Public Opinion Programme,the University of Hong Kong. Source: https://www.hkupop.hku.hk/english/features/july1/index.html, last accessed on December 26, 2017.
A.16

100
200
300
400
500
Parti
cipa
nts
(Tho
usan
ds)
13aug1989 03sep1989 24sep1989 15oct1989 05nov1989Date
020
4060
Freq
uenc
y
0 100 200 300 400 500Participants (Thousands)
Figure A.2: Protest events in 13 East German district capitals in summer and fall 1989, throughNovember 9, 1989 (when the Berlin Wall fell). Left panel plots individual protests’ sizes by date;right panel shows a histogram of protest sizes during the entire time period. When a protest’s sizeis estimated, we take the average of the minimum and maximum estimates. Data come from theArchiv Burgerbewegung Leipzig.
0.0
2.0
4.0
6D
ensi
ty
0 20 40 60 80 100Prior beliefs
Re: planned participationRe: actual participation (among HKUST)
Figure A.3: Distribution of prior beliefs regarding the planned protest participation and actualprotest participation of HKUST survey participants.
A.17

-20
24
Estim
ated
trea
tmen
t effe
ct
0 20 40 60 80 100Cutoff in prior beliefs on HKUST planned participation rate
1st stage
-6-4
-20
2Es
timat
ed tr
eatm
ent e
ffect
0 20 40 60 80 100Cutoff in prior beliefs on HKUST planned participation rate
Reduced form
Figure A.4: Estimated treatment effects on posterior beliefs regarding actual participation (firststage, left panel), and on subjects’ own protest participation (reduced form, right panel), imposingalternative “switching points” for the treatment variable (i.e., different levels of priors regardingother subjects’ planned participation above which we code treatment equal to −1). Figures plotthe point estimate (and 95% confidence interval) for integer “switching points” from 0 to 100,with red vertical lines indicating the switching point corresponding to the true mean of HKUSTstudents’ planned participation (17%), which is provided to the treated subjects.
Truth(treatment)
-10
-50
510
15Tr
eatm
ent e
ffect
on
% p
artic
ipat
ed
0 5 10 15 20 25 30Prior belief re: planned participation
bandwidth = .8
Figure A.5: Non-parametric treatment effect on protest participation (“reduced form”), acrossprior beliefs regarding the planned participation of HKUST survey participants, smoothed usinga lowess kernel at bandwidth = 0.8.
A.18
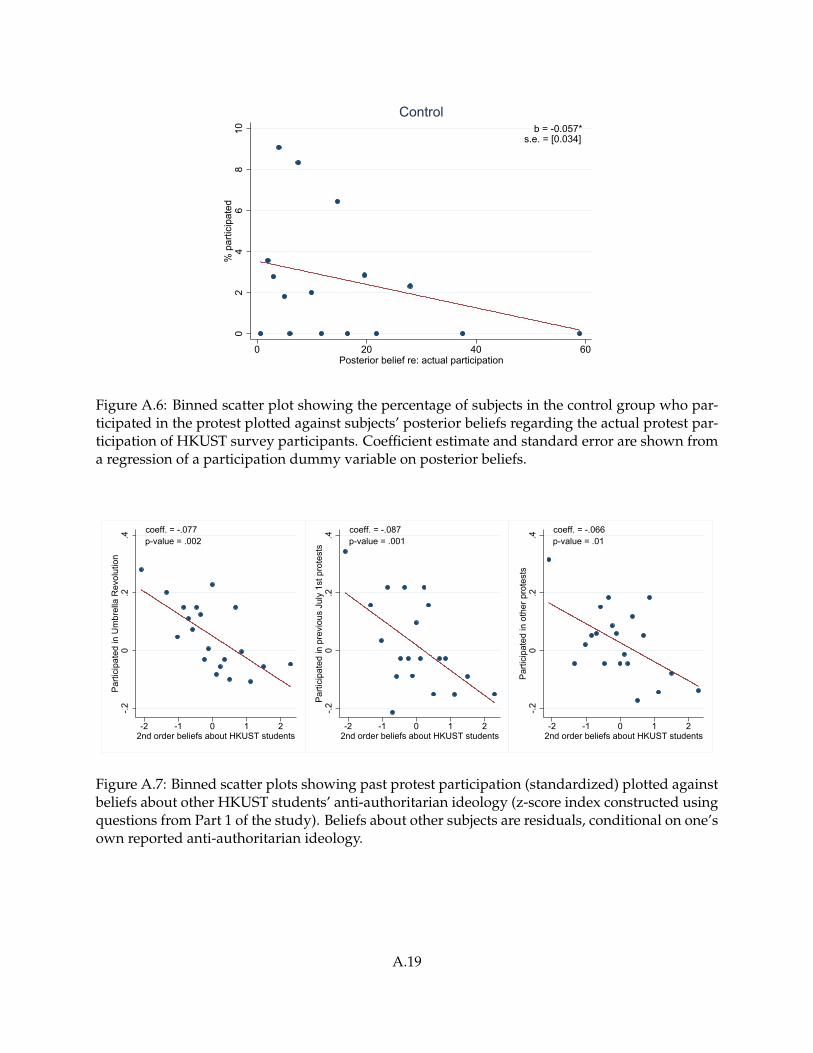
b = -0.057*s.e. = [0.034]
02
46
810
% p
artic
ipat
ed
0 20 40 60Posterior belief re: actual participation
Control
Figure A.6: Binned scatter plot showing the percentage of subjects in the control group who par-ticipated in the protest plotted against subjects’ posterior beliefs regarding the actual protest par-ticipation of HKUST survey participants. Coefficient estimate and standard error are shown froma regression of a participation dummy variable on posterior beliefs.
coeff. = -.077p-value = .002
-.20
.2.4
Parti
cipa
ted
in U
mbr
ella
Rev
olut
ion
-2 -1 0 1 22nd order beliefs about HKUST students
coeff. = -.087p-value = .001
-.20
.2.4
Parti
cipa
ted
in p
revi
ous
July
1st
pro
test
s
-2 -1 0 1 22nd order beliefs about HKUST students
coeff. = -.066p-value = .01
-.20
.2.4
Parti
cipa
ted
in o
ther
pro
test
s
-2 -1 0 1 22nd order beliefs about HKUST students
Figure A.7: Binned scatter plots showing past protest participation (standardized) plotted againstbeliefs about other HKUST students’ anti-authoritarian ideology (z-score index constructed usingquestions from Part 1 of the study). Beliefs about other subjects are residuals, conditional on one’sown reported anti-authoritarian ideology.
A.19
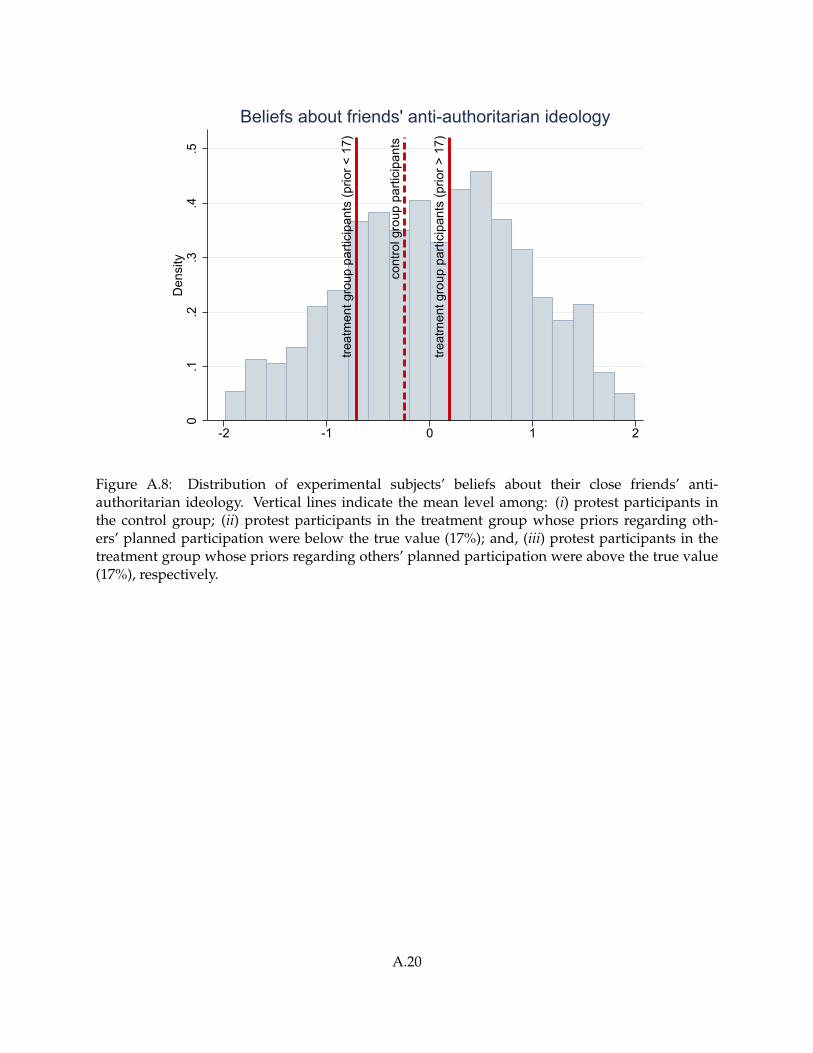
cont
rol g
roup
par
ticip
ants
treat
men
t gro
up p
artic
ipan
ts (p
rior <
17)
treat
men
t gro
up p
artic
ipan
ts (p
rior >
17)
0.1
.2.3
.4.5
Den
sity
-2 -1 0 1 2
Beliefs about friends' anti-authoritarian ideology
Figure A.8: Distribution of experimental subjects’ beliefs about their close friends’ anti-authoritarian ideology. Vertical lines indicate the mean level among: (i) protest participants inthe control group; (ii) protest participants in the treatment group whose priors regarding oth-ers’ planned participation were below the true value (17%); and, (iii) protest participants in thetreatment group whose priors regarding others’ planned participation were above the true value(17%), respectively.
A.20

Tabl
eA
.1:B
alan
cew
ith
resp
ectt
oPa
rt1
surv
eyit
ems
Expe
rim
enta
lPr
ior
belie
fon
plan
ned
part
icip
.Pr
ior
belie
fon
plan
ned
part
icip
.sa
mpl
ebe
low
trut
hab
ove
trut
h
Con
trol
Trea
tmen
tC
ontr
olTr
eatm
ent
Con
trol
Trea
tmen
tm
ean
mea
np-
valu
em
ean
mea
np-
valu
em
ean
mea
np-
valu
e
Var
iabl
es:
(1)
(2)
(3)
(4)
(5)
(6)
(7)
(8)
(9)
A:A
nti-
auth
orit
aria
nat
titu
des
A.1
:Sup
port
for
dem
ocra
cy0.
100
0.05
90.
482
0.09
40.
045
0.48
50.
114
0.09
00.
820
A.2
:Sup
port
for
HK
inde
pend
ence
0.10
70.
081
0.64
20.
107
0.07
10.
595
0.10
80.
103
0.96
8A
.3:H
Kid
enti
ty(s
elf-
repo
rted
)0.
172
0.14
30.
572
0.16
10.
132
0.63
40.
202
0.17
10.
746
A.4
:Unh
appi
ness
wit
hpo
litic
alst
atus
quo
0.06
80.
061
0.89
70.
039
0.05
90.
769
0.14
30.
065
0.47
4A
.5:A
nti-
CC
Pvi
ews
oncu
rren
teve
nts
0.12
40.
053
0.23
40.
150
0.05
60.
189
0.05
90.
045
0.89
8A
.6:A
ggre
ssiv
epu
rsui
tofp
olit
ical
righ
ts-0
.008
0.03
40.
482
0.02
60.
033
0.92
8-0
.097
0.03
70.
232
B:A
nti-
auth
orit
aria
nbe
havi
ors
B.1:
Part
icip
ated
inU
mbr
ella
Rev
olut
ion
0.40
10.
419
0.55
30.
402
0.39
20.
785
0.40
00.
482
0.14
5B.
2:Vo
tefo
rpr
o-de
moc
racy
part
y0.
796
0.80
80.
594
0.80
10.
805
0.86
70.
783
0.81
50.
466
B.3:
Plan
topa
rtic
ipat
ein
July
1stp
rote
st0.
172
0.17
80.
794
0.13
70.
142
0.86
70.
261
0.26
50.
933
B.4:
HK
iden
tity
(rev
eale
din
iden
tity
gam
e)-0
.060
0.01
50.
205
-0.0
79-0
.032
0.48
1-0
.012
0.12
80.
265
B.5:
Don
atio
nto
Dem
osis
to0.
101
0.13
70.
076
0.09
60.
121
0.27
20.
113
0.17
30.
143
C:E
cono
mic
pref
eren
ces
C.1
:Ris
kto
lera
nce
-0.0
25-0
.051
0.66
3-0
.005
-0.0
820.
280
-0.0
760.
024
0.34
6C
.2:P
atie
nce
-0.0
050.
021
0.65
60.
007
0.00
80.
995
-0.0
360.
053
0.41
1C
.3:A
ltru
ism
0.05
9-0
.074
0.02
60.
084
-0.1
080.
008
-0.0
030.
004
0.94
9C
.4:R
ecip
roci
ty0.
045
-0.0
940.
019
0.08
8-0
.117
0.00
3-0
.066
-0.0
380.
807
C.5
:Pre
fere
nce
for
redi
stri
buti
on0.
002
-0.0
630.
279
-0.0
30-0
.102
0.31
60.
085
0.02
90.
617
D:P
erso
nali
tytr
aits
D.1
:Big
5-o
penn
ess
-0.0
16-0
.065
0.41
50.
010
-0.0
940.
139
-0.0
820.
004
0.45
6D
.2:B
ig5
-agr
eeab
lene
ss0.
047
-0.0
710.
045
0.08
2-0
.112
0.00
6-0
.042
0.02
60.
521
D.3
:Big
5-c
onsc
ient
ious
ness
-0.0
150.
003
0.76
3-0
.028
0.03
30.
386
0.01
5-0
.069
0.46
5D
.4:B
ig5
-neu
roti
cism
-0.0
040.
025
0.62
20.
016
0.01
50.
983
-0.0
560.
049
0.32
4D
.5:B
ig5
-ext
rave
rsio
n0.
063
-0.0
710.
026
0.11
8-0
.135
0.00
0-0
.076
0.08
00.
148
E:C
ogni
tive
abil
ity
E.1:
Cog
niti
vere
flect
ion
test
0.05
2-0
.086
0.02
30.
058
-0.0
890.
044
0.03
7-0
.079
0.29
4C
ontin
ued
onne
xtpa
ge
A.21

Expe
rim
enta
lPr
ior
belie
fon
plan
ned
part
icip
.Pr
ior
belie
fon
plan
ned
part
icip
.sa
mpl
ebe
low
trut
hab
ove
trut
h
Con
trol
Trea
tmen
tC
ontr
olTr
eatm
ent
Con
trol
Trea
tmen
tm
ean
mea
np-
valu
em
ean
mea
np-
valu
em
ean
mea
np-
valu
e
Var
iabl
es:
(1)
(2)
(3)
(4)
(5)
(6)
(7)
(8)
(9)
E.2:
Uni
vers
ity
GPA
-0.0
80-0
.047
0.56
5-0
.083
-0.0
030.
249
-0.0
72-0
.149
0.45
8
F:Ec
onom
icst
atus
F.1:
HH
econ
omic
&so
cial
stat
us0.
022
-0.0
330.
367
0.01
8-0
.018
0.62
20.
033
-0.0
670.
362
F.2:
Ow
npr
ojec
ted
econ
omic
stat
us0.
001
-0.0
580.
336
0.03
6-0
.027
0.38
6-0
.088
-0.1
290.
706
G:B
ackg
roun
dch
arac
teri
stic
sG
.1:G
ende
r0.
557
0.53
50.
480
0.56
70.
522
0.21
00.
530
0.56
60.
524
G.2
:Bir
thye
ar19
95.2
1995
.20.
834
1995
.419
95.2
0.27
819
95.0
1995
.20.
177
G.3
:HK
-ori
ente
dch
ildho
oden
v.0.
079
0.10
10.
698
0.06
30.
090
0.69
90.
118
0.12
70.
932
G.4
:Non
-rel
igio
us0.
778
0.77
00.
745
0.80
40.
771
0.26
80.
713
0.76
70.
270
H:B
elie
fsab
outp
olit
ics
H.1
:Bel
iefs
abou
tfut
ure
inst
itut
ions
-0.0
39-0
.014
0.67
90.
010
-0.0
550.
357
-0.1
620.
083
0.03
2H
.2:B
elie
fsab
outp
rote
stef
ficac
y-0
.068
0.03
70.
076
-0.0
68-0
.003
0.36
5-0
.068
0.13
30.
053
I:B
elie
fsab
outH
KU
STst
uden
tsI.1
:Sup
port
for
dem
ocra
cy-0
.062
0.00
40.
282
-0.0
570.
000
0.41
3-0
.072
0.01
40.
482
I.2:S
uppo
rtfo
rH
Kin
depe
nden
ce0.
043
0.00
20.
499
0.01
9-0
.010
0.68
20.
102
0.03
10.
515
I.3:H
Kid
enti
ty-0
.001
-0.0
060.
923
0.03
5-0
.007
0.54
3-0
.092
-0.0
050.
427
I.4:U
nhap
pine
ssw
ith
polit
ical
stat
usqu
o-0
.035
-0.0
050.
603
-0.0
640.
006
0.31
40.
039
-0.0
300.
519
I.5:A
ggre
ssiv
epu
rsui
tofp
olit
ical
righ
ts0.
066
0.03
40.
587
0.06
5-0
.005
0.32
30.
068
0.12
40.
600
J:So
cial
life
J.1:P
olit
ical
soci
alne
twor
k0.
081
0.06
40.
784
0.07
50.
018
0.42
60.
095
0.17
30.
476
J.2:S
ocia
bilit
y-0
.044
0.00
80.
386
0.00
7-0
.021
0.69
0-0
.172
0.07
70.
028
K:B
elie
fsab
outc
lose
frie
nds
K.1
:Sup
port
for
dem
ocra
cy-0
.028
0.04
40.
239
-0.0
730.
047
0.08
70.
084
0.03
80.
714
K.2
:Sup
port
for
HK
inde
pend
ence
0.12
10.
042
0.16
70.
104
0.04
80.
413
0.16
60.
027
0.19
7K
.3:H
Kid
enti
ty0.
054
0.06
70.
816
0.06
10.
053
0.90
10.
036
0.10
10.
561
K.4
:Unh
appi
ness
wit
hpo
litic
alst
atus
quo
-0.0
380.
028
0.24
9-0
.077
0.02
10.
151
0.06
00.
045
0.88
4K
.5:A
ggre
ssiv
epu
rsui
tofp
olit
ical
righ
ts0.
098
0.02
80.
230
0.07
8-0
.014
0.18
60.
150
0.12
80.
835
L:M
edia
cons
umpt
ion
Con
tinue
don
next
page
A.22

Expe
rim
enta
lPr
ior
belie
fon
plan
ned
part
icip
.Pr
ior
belie
fon
plan
ned
part
icip
.sa
mpl
ebe
low
trut
hab
ove
trut
h
Con
trol
Trea
tmen
tC
ontr
olTr
eatm
ent
Con
trol
Trea
tmen
tm
ean
mea
np-
valu
em
ean
mea
np-
valu
em
ean
mea
np-
valu
e
Var
iabl
es:
(1)
(2)
(3)
(4)
(5)
(6)
(7)
(8)
(9)
L.1:
Freq
uenc
yof
new
sco
nsum
ptio
n0.
097
-0.0
330.
031
0.11
5-0
.003
0.10
10.
052
-0.1
030.
160
L.2:
Pro-
dem
ocra
tic
sour
ceof
med
ia0.
121
0.11
10.
857
0.12
70.
126
0.99
00.
107
0.07
60.
776
M:P
olit
ical
inte
rest
and
know
ledg
eM
.1:P
olit
ical
inte
rest
0.09
40.
017
0.20
50.
132
0.00
80.
084
-0.0
010.
039
0.72
1M
.2:P
olit
ical
know
ledg
e0.
070
0.05
80.
847
0.09
70.
105
0.91
40.
001
-0.0
530.
638
#of
obs.
406
835
291
586
115
249
Not
e:Ta
ble
test
sfo
rba
lanc
eon
outc
omes
elic
ited
inPa
rt1
ofth
est
udy
(tre
atm
ent
vers
usco
ntro
l)fo
r:th
efu
llsa
mpl
e(c
olum
ns1–
3);t
hesu
bsam
ple
ofsu
bjec
tsw
hose
prio
rsre
gard
ing
othe
rs’p
lann
edpa
rtic
ipat
ion
wer
ebe
low
the
true
valu
eof
17%
(col
umns
4–6)
;an
d,th
esu
bsam
ple
ofsu
bjec
tsw
hose
prio
rsre
gard
ing
othe
rs’p
lann
edpa
rtic
ipat
ion
wer
eab
ove
the
true
valu
eof
17%
(col
umns
7–9)
.
A.23

Tabl
eA
.2:R
obus
tnes
sto
trea
tmen
tint
erac
ting
wit
hun
bala
nced
char
acte
rist
ics
Unb
alan
ced
char
acte
rist
ics:
Baseline
DonationtoDemosisto
Altruism
Reciprocity
Big5-agreeableness
Big5-extraversion
Cognitivereflectiontest
Beliefsaboutprotestefficacy
Frequencyofnewsconsumption
(1)
(2)
(3)
(4)
(5)
(6)
(7)
(8)
(9)
Pane
lA:t
reat
men
teffe
cton
post
erio
rbe
liefs
(1st
stag
e)
Trea
tmen
t5.
891*
**6.
108*
**5.
951*
**5.
884*
**5.
912*
**5.
943*
**5.
872*
**5.
826*
**5.
935*
**(d
irec
tion
adj.)
[0.5
67]
[0.5
92]
[0.5
74]
[0.5
75]
[0.5
74]
[0.5
71]
[0.5
67]
[0.5
75]
[0.5
77]
Pane
lB:t
reat
men
teffe
cton
prot
estp
artic
ipat
ion
(red
uced
form
)
Trea
tmen
t-2
.713
***
-2.7
26**
*-2
.657
***
-2.6
66**
*-2
.712
***
-2.7
80**
*-2
.710
***
-2.7
28**
*-2
.742
***
(dir
ectio
nad
j.)[0
.765
][0
.771
][0
.763
][0
.765
][0
.763
][0
.782
][0
.760
][0
.766
][0
.769
]
Obs
erva
tion
s12
3412
3412
3412
3412
3412
3412
3412
1812
34
Not
e:Ta
ble
show
s“fi
rst
stag
e”(P
anel
A)
and
“red
uced
form
”(P
anel
B)es
tim
ates
,rep
orti
ngth
eef
fect
sof
the
expe
rim
enta
ltre
at-
men
ton
subj
ects
’pos
teri
orbe
liefs
abou
toth
ers’
part
icip
atio
nan
don
subj
ects
’ow
npr
otes
tpar
tici
pati
on.
Inbo
thpa
nels
,the
mod
elal
low
str
eatm
ente
ffec
tsto
vary
depe
ndin
gon
the
8ch
arac
teri
stic
sel
icit
edin
Part
1of
the
expe
rim
entt
hata
reno
tbal
ance
dbe
twee
ntr
eatm
enta
ndco
ntro
lsub
ject
s,as
seen
inO
nlin
eA
ppen
dix
Tabl
eA
.1.C
olum
n1
repl
icat
esth
eba
selin
ere
sult
spr
esen
ted
inTa
bles
III
and
IV.C
olum
ns2–
9sh
owre
sult
sal
low
ing
for
hete
roge
neou
str
eatm
ente
ffec
ts,o
neun
bala
nced
char
acte
rist
icat
ati
me.
All
subj
ects
are
pool
edan
dtr
eatm
ent
isco
ded
as“−
1”fo
rsu
bjec
tsw
hose
prio
rsre
gard
ing
othe
rs’p
lann
edpa
rtic
ipat
ion
wer
eab
ove
the
true
valu
eof
17%
.A
llre
gres
sion
sin
clud
eth
ere
leva
ntlo
wer
-ord
erte
rmfo
rth
eun
bala
nced
char
acte
rist
ic.
“Fir
stst
age”
pool
edre
gres
-si
ons
inPa
nel
Aal
soco
ntro
lfo
ran
indi
cato
rof
whe
ther
subj
ects
’pri
ors
rega
rdin
got
hers
’pla
nned
part
icip
atio
nw
ere
abov
etr
ueva
lue
and
its
inte
ract
ion
wit
hsu
bjec
ts’p
rior
belie
fsre
gard
ing
othe
rs’a
ctua
lpar
tici
pati
on.*
:Sig
nific
anta
t10%
;**:
5%;*
**:1
%.
A.24

Table A.3: Attrition across survey parts
Completed CompletedPart 1 Parts 1,2,3 Comparison
Mean Std.Dev. Mean Std.Dev. t-stat p-value
Variables: (1) (2) (3) (4) (5) (6)
Male 0.554 0.497 0.541 0.498 0.704 0.481Birth year 1995.2 1.361 1995.2 1.356 0.265 0.791HK-oriented childhood env. 0.085 0.942 0.096 0.932 -0.384 0.701Non-religious 0.772 0.420 0.774 0.418 -0.202 0.840
HH economic & social status -0.016 1.001 -0.012 1.002 -0.171 0.864Own projected economic status -0.039 0.982 -0.038 1.002 -0.055 0.956
Planned to participate in protest 17.6 38.1 17.6 38.1 0.071 0.943
Prior belief re: % others’ planned particip. 16.5 16.6 15.8 15.8 1.203 0.229Prior belief re: % others’ actual particip. (HKUST) 13.8 15.4 13.8 15.2 0.102 0.919Prior belief re: others’ actual particip. (all HK) 160954 168466 155153 155344 0.983 0.326
Treatment – – 0.675 0.469 – –
# of obs. 1576 1234Note: Columns 1–2 show descriptive statistics for all subjects who completed at least Part 1 of the study.Columns 3–4 show descriptive statistics for all subjects who completed all three parts of the study. Columns 5–6show t-statistics and p-values from two-sided t-tests of equality of mean levels of characteristics between subjectswho completed at least Part 1 of the study and those who completed all three parts of the study.
A.25

Table A.4: Sample representativeness
Population ratio Sample ratio T-test p-value
(1) (2) (3)
Male 0.615 0.543 0.000
Entering cohort of 2012 0.240 0.315 0.000Entering cohort of 2013 0.254 0.229 0.028Entering cohort of 2014 0.245 0.243 0.854Entering cohort of 2015 0.261 0.214 0.000
School of Engineering 0.377 0.328 0.000School of Sciences 0.237 0.237 0.999School of Business and Management 0.355 0.364 0.475School of Humanities and Social Sciences 0.024 0.027 0.485Interdisciplinary Programs 0.007 0.036 0.000
Note: The source for the population ratio is a HKUST undergraduate student profile compiledby the HKUST Student Affairs Office. The sample ratio is calculated for students who completedParts 1, 2, and 3 of the study. Column 3 presents p-values from tests of whether the populationproportion equals the sample proportion.
A.26

Table A.5: Predictors of planned participation & prior beliefs
Plan to participate Belief on % studentsin protest planned to participate
beta s.e. beta s.e.
(1) (2) (3) (4)
A: Anti-authoritarian attitudesA.1: Support for democracy 0.060*** [0.009] -0.414 [0.453]A.2: Support for HK independence 0.049*** [0.010] 0.240 [0.458]A.3: HK identity (self-reported) 0.045*** [0.011] 0.557 [0.490]A.4: Unhappiness with political status quo 0.043*** [0.010] 0.399 [0.470]A.5: Anti-CCP views on current events 0.044*** [0.009] -0.889** [0.440]A.6: Aggressive pursuit of political rights 0.057*** [0.010] -0.271 [0.422]
B: Anti-authoritarian behaviorsB.1: Participated in Umbrella Revolution 0.157*** [0.020] 1.282 [0.861]B.2: Vote for pro-democracy party 0.018 [0.024] -0.053 [1.051]B.3: Plan to participate in July 1st protest – – 7.216*** [1.327]B.4: HK identity (revealed in identity game) 0.023** [0.010] 0.478 [0.438]B.5: Donation to Demosisto 0.123*** [0.033] 2.720** [1.351]
C: Economic preferencesC.1: Risk tolerance 0.033*** [0.009] 0.408 [0.409]C.2: Patience -0.002 [0.009] -0.777* [0.460]C.3: Altruism 0.034*** [0.009] 0.405 [0.440]C.4: Reciprocity 0.029*** [0.011] 0.200 [0.421]C.5: Preference for redistribution 0.006 [0.010] 0.319 [0.395]
D: Personality traitsD.1: Big 5 - openness 0.013 [0.010] 0.711 [0.424]D.2: Big 5 - agreeableness 0.011 [0.009] 0.578 [0.403]D.3: Big 5 - conscientiousness 0.002 [0.010] -0.374 [0.419]D.4: Big 5 - neuroticism -0.023** [0.010] 0.139 [0.411]D.5: Big 5 - extraversion 0.013 [0.009] 0.611 [0.391]
E: Cognitive abilityE.1: Cognitive reflection test -0.014 [0.009] -0.171 [0.431]E.2: University GPA -0.035*** [0.010] -0.677 [0.423]
F: Economic statusF.1: HH economic & social status -0.009 [0.010] 0.005 [0.411]F.2: Own projected economic status -0.003 [0.010] -0.509 [0.404]
G: Background characteristicsG.1: Gender 0.033* [0.019] 0.761 [0.834]G.2: Birth year 0.002 [0.008] -0.849** [0.337]G.3: HK-oriented childhood env. 0.016 [0.010] 0.117 [0.440]G.4: Non-religious 0.041* [0.022] -0.147 [1.001]
H: Beliefs about politicsH.1: Beliefs about future institutions 0.006 [0.010] -0.098 [0.419]H.2: Beliefs about protest efficacy 0.017* [0.010] 0.694* [0.420]
Continued on next page
A.27

Plan to participate Belief on % studentsin protest planned to participate
beta s.e. beta s.e.
(1) (2) (3) (4)
I: Beliefs about HKUST studentsI.1: Support for democracy -0.027*** [0.010] 0.174 [0.448]I.2: Support for HK independence -0.019** [0.010] 0.432 [0.417]I.3: HK identity -0.019* [0.010] 0.061 [0.437]I.4: Unhappiness with political status quo -0.019* [0.010] 0.082 [0.441]I.5: Aggressive pursuit of political rights -0.014 [0.010] 0.993** [0.406]
J: Social lifeJ.1: Political social network 0.059*** [0.010] 0.674 [0.430]J.2: Sociability -0.010 [0.010] -0.593 [0.436]
K: Beliefs about close friendsK.1: Support for democracy -0.016 [0.010] 0.246 [0.456]K.2: Support for HK independence -0.006 [0.010] 0.132 [0.447]K.3: HK identity -0.017* [0.010] 0.275 [0.471]K.4: Unhappiness with political status quo 0.008 [0.010] 0.099 [0.466]K.5: Aggressive pursuit of political rights 0.001 [0.010] 1.052** [0.462]
L: Media consumptionL.1: Frequency of news consumption 0.013 [0.009] -0.046 [0.395]L.2: Pro-democratic source of media 0.021** [0.010] -0.040 [0.476]
M: Political interest and knowledgeM.1: Political interest 0.065*** [0.009] -0.200 [0.415]M.2: Political knowledge 0.007 [0.010] -1.158*** [0.426]
Note: Table shows the predictors of planned participation and of prior beliefs regarding other survey par-ticipants’ planned participation. Subjects’ own plans, their priors, and the individual characteristics con-sidered as explanatory variables were all elicited in Part 1 of the study. *: Significant at 10%; **: 5%; ***: 1%.
A.28

Table A.6: Treatment effect on changes in beliefs
Change in beliefs on % participation Change in belief on total # participationamong HKUST students among HK population
Prior below Prior above Prior below Prior aboveSample: All subjects truth truth All subjects truth truth
(1) (2) (3) (4) (5) (6)
Panel A: baseline
Treatment 9.831*** 11337.7***(direction adj.) [0.491] [3656.6]Treatment 4.496*** -10.187*** 14644.7** -5120.5
[0.552] [1.611] [7195.7] [15009.1]
Panel B: with controls
Treatment 6.884*** 9351.6*(direction adj.) [0.538] [4772.2]Treatment 4.663*** -11.530*** 16603.1** -8389.0
[0.537] [1.644] [7303.1] [15939.8]
Panel C: trimmed
Treatment 9.012*** 9722.4**(direction adj.) [0.466] [3834.5]Treatment 4.351*** -7.598*** 18549.6** -5320.2
[0.579] [1.580] [7234.0] [16828.5]
Observations 1234 873 361 1234 873 361
DV mean (control grp.) 0.664 2.417 -3.805 -18364.9 -17912.3 -19518.5DV std. dev. (control grp.) 9.914 7.744 13.01 115441 102207 144307DV mean (all) 0.681 5.430 -10.80 -12468.7 -8098.8 -23036.2DV std. dev. (all) 13.23 7.874 16.19 103798 97847 116412
Note: Table shows “first stage” effects: the effects of the experimental treatment on subjects’ changes in beliefsregarding others’ actual protest participation (posteriors minus priors). Columns 1–3 show effects on changes inbeliefs regarding other experimental subjects’ actual participation, while columns 4–6 show effects on changes inbeliefs regarding the total turnout at the protest by all Hong Kong citizens. In columns 1 and 4, all subjects arepooled and treatment is coded as “−1” for subjects whose priors regarding others’ planned participation wereabove the true value of 17%. Columns 2 and 5 (3 and 6) show effects on changes in beliefs for the subsample ofsubjects whose priors regarding others’ planned participation were below (above) the true value of 17%. Panel Ais estimated without any controls. Panel B replicates the analysis in Panel A, but adds controls for subjects’ back-ground characteristics and economic status (gender, year of birth, a z-score index measuring whether subjectswere raised in a Hong Kong-oriented environment, whether subjects were raised in a religious household, theeconomic status of the household, and own projected economic status), and for subjects’ prior beliefs regardingHKUST students’ planned participation in the July 1st March. Panel C replicates the analysis in Panel A, butexcluding those individuals in the experimental sample with the 5% lowest and the 5% highest prior beliefs re-garding other subjects’ planned participation. Number of observations refers to that in the baseline specification.*: Significant at 10%; **: 5%; ***: 1%.
A.29

Table A.7: Variance decomposition of July 1st March participation
Categories Univariate R2 Marginal R2
Treatment 0.015 0.014
C: Economic preferences 0.011 0.008C.1: Risk tolerance 0.006 0.004C.2: Patience 0.000 0.000C.3: Altruism 0.001 0.000C.4: Reciprocity 0.006 0.003C.5: Preference for redistribution 0.000 0.000
D: Personality traits 0.004 0.003D.1: Big 5 - openness 0.000 0.000D.2: Big 5 - agreeableness 0.001 0.002D.3: Big 5 - conscientiousness 0.000 0.000D.4: Big 5 - neuroticism 0.000 0.000D.5: Big 5 - extraversion 0.000 0.002
E: Cognitive ability 0.008 0.005E.1: Cognitive reflection test 0.000 0.000E.2: University GPA 0.007 0.005
F: Economic status 0.005 0.004F.1: HH economic & social status 0.003 0.003F.2: Own projected economic status 0.001 0.000
G: Background characteristics 0.006 0.005G.1: Gender 0.001 0.000G.2: Birth year 0.001 0.001G.3: HK-oriented childhood env. 0.003 0.003G.4: Religiosity 0.001 0.001
Note: Variance decomposition exercise uses 1,234 Hong Kong locals sub-jects who completed all 3 parts of the study. All subjects are pooled andtreatment is coded as “−1” for subjects whose priors regarding others’planned participation were above the true value of 17%. Univariate R2
is the R-squared from a regression predicting the July 1st March partici-pation using only the factor (or the z-score index) indicated in each row.Marginal R2 is the incremental R-squared adding the single factor (or z-score index) indicated in a given row to a regression model that alreadyincluded all of the other factors listed.
A.30

Table A.8: Plans to participate and subsequent treatment effect
Participated in Plan changed:2016 July 1st March participated
Excl. participants Excl. participantsSample: All subjects w/ plan not to attend w/ plan to attend All subjects
(1) (2) (3) (4)
Panel A: baseline
Treatment -2.713*** -4.493*** -1.142** -1.031**(direction adj.) [0.765] [1.475] [0.455] [0.422]
Panel B: with controls
Treatment -2.151** -3.975** -1.370** -1.292**(direction adj.) [0.913] [1.957] [0.552] [0.528]
Panel C: trimmed
Treatment -2.467*** -4.238*** -1.149** -1.057**(direction adj.) [0.797] [1.565] [0.479] [0.449]
Observations 1234 525 1188 1234
DV mean (control grp.) 2.743 6.832 2.545 2.494DV std. dev. (control grp.) 16.35 25.31 15.77 15.61DV mean (all) 2.998 7.048 1.431 1.378DV std. dev. (all) 17.06 25.62 11.88 11.66
Note: Table shows “reduced form” estimates, reporting the effects of the experimental treatment on sub-jects’ own protest participation. All subjects are pooled and treatment is coded as “−1” for subjects whosepriors regarding others’ planned participation were above the true value of 17%. In columns 1 and 4, thesample is all subjects. Column 2 excludes subjects who indicated with certainty that they planned not toparticipate in the 2016 July 1st March; column 3 excludes subjects who indicated with certainty that theyplanned to participate in the 2016 July 1st March. “Plan changed: participated” is an indicator equal to1 if a subject did not indicate with certainty that s/he planned to participate in the 2016 July 1st Marchand actually did participate. Panel A is estimated without any controls. Panel B replicates the analysisin Panel A, but adds controls for subjects’ background characteristics and economic status (gender, yearof birth, a z-score index measuring whether subjects were raised in a Hong Kong-oriented environment,whether subjects were raised in a religious household, the economic status of the household, and own pro-jected economic status), and for subjects’ prior beliefs regarding HKUST students’ planned participationin the July 1st March. Panel C estimates the baseline specification, but excluding those individuals in theexperimental sample with the 5% lowest and the 5% highest prior beliefs regarding other subjects’ plannedparticipation. Number of observations refers to that in the baseline specification. *: Significant at 10%; **:5%; ***: 1%.
A.31

Table A.9: Heterogeneous treatment effects by friends’ expected participation
Sample: Prior below truth Prior above truth
(1) (2)
Panel A: treatment effect on posterior beliefs (1st stage)
Treatment 4.817*** -7.980***[0.606] [1.970]
Friend participating 2.908* 4.670[1.488] [3.040]
Treatment × -2.061 -3.549friend participating [1.669] [3.336]
Panel B: treatment effect on protest participation (reduced form)
Treatment -0.648 0.676[0.849] [1.783]
Friend participating 10.350** -1.351[4.222] [1.350]
Treatment × -7.343 14.32***friend participating [4.538] [4.009]
Observations 873 361
1st stage DV mean (control grp.) 8.44 28.301st stage DV std. dev. (control grp.) 8.46 15.541st stage DV mean (all) 11.40 22.021st stage DV std. dev. (all) 7.99 12.92
2nd stage DV mean (control grp.) 3.472 0.8852nd stage DV std. dev. (control grp.) 18.34 9.412nd stage DV mean (all) 2.062 5.2632nd stage DV std. dev. (all) 14.22 22.36
Note: Table shows “first stage” (Panel A) and “reduced form” (Panel B) esti-mates, reporting the effects of the experimental treatment on subjects’ poste-rior beliefs about others’ participation and on subjects’ own protest participa-tion. In both panels, the model allows treatment effects to vary depending onsubjects’ beliefs that at least one of their five best friends would participate inthe protest. Regressions include the treatment indicator, an indicator that sub-jects believe that at least one of their five best friends would participate in theprotest, and their interaction. Column 1 is estimated for the subsample of sub-jects whose priors regarding others’ planned participation were below the truevalue of 17%. Column 2 is estimated for the subsample of subjects whose pri-ors regarding others’ planned participation were above the true value of 17%.Subjects’ beliefs regarding their friends’ participation in the protest are elicitedbefore treatment assignment and are balanced between treatment and controlgroup students. 27.2% of the experimental subjects expected that at least one oftheir five best friends would participate in the upcoming 2016 July 1st March.*: Significant at 10%; **: 5%; ***: 1%.
A.32

Table A.10: Two stage estimates on protest participation (changes in beliefs)
Participated in 2016 July 1st March
Prior below Prior aboveSample: All subjects truth truth
(1) (2) (3)
Panel A: baseline
Change in belief -0.276*** -0.468** -0.626***[0.063] [0.234] [0.248]
Panel B: with controls
Change in belief -0.312** -0.443* -0.616***[0.120] [0.230] [0.224]
Panel C: trimmed
Change in belief -0.274*** -0.512** -0.752**[0.073] [0.257] [0.363]
Observations 1234 873 361
1st stage DV mean (control grp.) 0.664 2.417 -3.8051st stage DV std. dev. (control grp.) 9.914 7.744 13.011st stage DV mean (all) 0.681 5.430 -10.801st stage DV std. dev. (all) 13.23 7.874 16.19
2nd stage DV mean (control grp.) 2.743 3.472 0.8852nd stage DV std. dev. (control grp.) 16.35 18.34 9.412nd stage DV mean (all) 2.998 2.062 5.2632nd stage DV std. dev. (all) 17.06 14.22 22.36
Note: Table shows two-stage estimates of the effects of beliefs about other sub-jects’ turnout in the protest on one’s own turnout. The first stage estimates theeffects of the experimental treatment on subjects’ changes in beliefs regardingother subjects’ actual protest participation (posteriors minus priors). The secondstage exploits variation in beliefs regarding other subjects’ participation inducedby the experimental treatment to estimate the effect of beliefs about others’ protestturnout on one’s own turnout. In column 1, all subjects are pooled and treatmentis coded as “−1” for subjects whose priors regarding others’ planned participa-tion were above the true value of 17%. Column 2 (3) shows estimates for thesubsample of subjects whose priors regarding others’ planned participation werebelow (above) the true value of 17%. Panel A is estimated without any controls.Panel B replicates the analysis in Panel A, but adds controls for subjects’ back-ground characteristics and economic status (gender, year of birth, a z-score indexmeasuring whether subjects were raised in a Hong Kong-oriented environment,whether subjects were raised in a religious household, the economic status of thehousehold, and own projected economic status), and for subjects’ prior beliefs re-garding HKUST students’ planned participation in the July 1st March. Panel Cestimates the baseline specification of Panel A, but excluding those individualsin the experimental sample with the 5% lowest and the 5% highest prior beliefsregarding other subjects’ planned participation. Number of observations refers tothat in the baseline specification. *: Significant at 10%; **: 5%; ***: 1%.
A.33

Table A.11: Robustness – re-weighting the sample
Reweighting: Baseline Part 1 subjects All HKUST
(1) (2) (3)
Panel A: treatment effect on posterior beliefs (1st stage)
Treatment 5.891*** 5.988*** 5.755***(direction adj.) [0.567] [0.535] [0.531]
Panel B: treatment effect on protest participation (reduced form)
Treatment -2.713*** -2.683*** -3.120***(direction adj.) [0.765] [0.762] [0.824]
Observations 1234 1234 1234
1st stage DV mean (control grp.) 14.04 14.03 14.271st stage DV std. dev. (control grp.) 14.10 14.16 14.191st stage DV mean (all) 14.50 14.49 14.521st stage DV std. dev. (all) 10.83 10.89 10.85
2nd stage DV mean (control grp.) 2.743 2.686 2.6402nd stage DV std. dev. (control grp.) 16.35 16.19 16.052nd stage DV mean (all) 2.998 2.969 3.0132nd stage DV std. dev. (all) 17.06 16.98 17.10
Note: Table shows “first stage” (Panel A) and “reduced form” (Panel B) estimates,reporting the effects of the experimental treatment on subjects’ posterior beliefsabout others’ participation and on subjects’ own protest participation. Column 1replicates the baseline results presented in Tables III and IV. Column 2 re-weightsthe observations in the experimental sample to match the study participants whocompleted at least Part 1 of the study (but not necessarily Parts 2 and 3) on gender,birth year, Hong Kong-oriented childhood environment, religiosity, household in-come & social status, and own projected economic status. Column 3 re-weights theobservations in the experimental sample to match the HKUST student populationon gender, cohort, and the school of study within the university. *: Significant at10%; **: 5%; ***: 1%.
A.34

Table A.12: Protest participation and pro-sociality
Participated in 2016 July 1st March
(1) (2) (3) (4) (5)
Pro-sociality (z-score index) 1.309** 1.192** 1.310** 1.027** 0.907*[0.527] [0.523] [0.527] [0.504] [0.503]
Observations 1234 1234 1234 1234 1234
Control for treatment status No Yes No No YesControl for posterior beliefs No No Yes No YesControl for anti-authoritarian ideology No No No Yes Yes
DV mean (control grp.) 2.743 2.743 2.743 2.743 2.743DV std. dev. (control grp.) 16.35 16.35 16.35 16.35 16.35DV mean (all) 2.998 2.998 2.998 2.998 2.998DV std. dev. (all) 17.06 17.06 17.06 17.06 17.06
Note: Table shows regressions predicting participation in 2016 July 1st March using in-dividuals’ pro-sociality: a z-score index constructed using data collected in Part 1 ofthe study on altruism and reciprocity. Column 1 presents the simple regression withoutadded controls. Column 2 controls for treatment status (direction adjusted). Column 3controls for posterior beliefs about others’ participation. Column 4 controls for an anti-authoritarian ideology index using data collected in Part 1 of the study. Finally, Column 5controls for treatment status, posterior beliefs and individuals’ ideology. *: Significant at10%; **: 5%; ***: 1%.
A.35