Determination of stress fields in the elastic lithosphere by methods based on stress orientations
Upload
khangminh22Category
view
1download
0
1
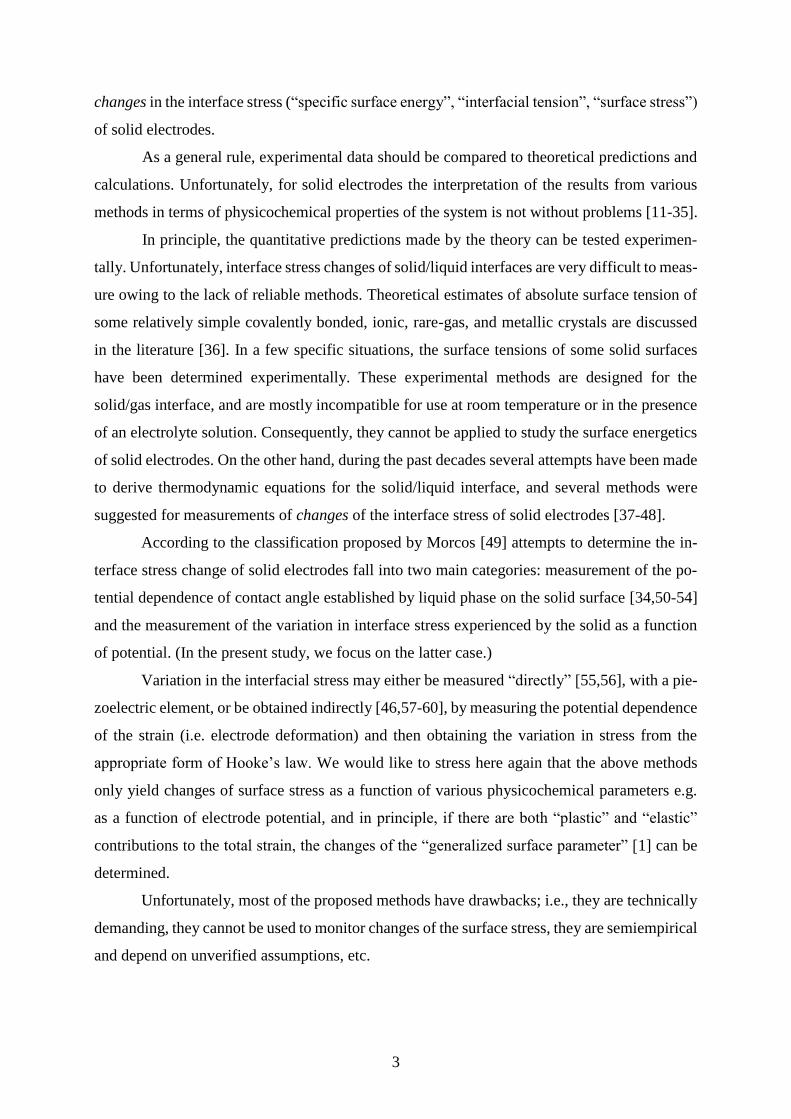
Experimental methods for the determination of stress changes at electrified solidliquid
interfaces
Gyözö G. Láng*, Noémi Kovács, Soma Vesztergom, Mária Ujvári, Dóra Zalka, Krisztina Sze-
keres
Eötvös Loránd University, Institute of Chemistry, Department of Physical Chemistry
H-1117 Budapest, Pázmány P. s. 1/A
Abstract: In the present study some of the methods developed for the experimental determina-
tion of (interfacial or film) stress changes in electrochemical systems containing solid-liquid
interfaces are briefly reviewed, as well as the kind and quality of information that can be ob-
tained using these methods are discussed. The “bending beam” (“bending cantilever”, “laser
beam deflection”, ”wafer curvature”) method and related techniques, the piezoelectric method,
the extensometer method, and the method based on the measurement of contact angle are dis-
cussed in detail. Special attention has been paid to problems related to the use of optical meth-
ods for position sensing.
Keywords: solid-liquid interface, solid electrode, electrocapillarity, interface stress
1 Introduction
The intensive parameter conjugate to surface area [1] (often called the “surface tension”,
“interfacial tension”, “surface stress”, “interface stress” or “specific surface energy”) is an im-
portant parameter in the thermodynamic theory of electrodes, since most electrochemical sys-
tems are, in fact, capillary systems, because any interaction between the bulk solid and the
remainder of the system takes place via the interface region. The thermodynamic properties of
this region (i.e. the electronic conductor | ionic conductor interface, for instance the interface
between a metal and an electrolyte solution) directly influence the electrochemical processes,
an understanding of the thermodynamics of interfaces is of importance to all surface scientists
and electrochemists. Since the early days of electrochemistry, one of the main goals of research
has been to find correlations between the structures formed by surface atoms and adsorbates
and the macroscopic kinetic rates of electrochemical reactions.
* Corresponding author. Tel.: +36 1 209 0555/1107; fax: +36 1 372 2592.
E-mail address: [email protected]

2
It is not surprising, therefore, that the interest in the structure and properties of charged
solid | liquid interfaces has increased steadily throughout the past decades and stimulated inter-
esting discussions and debates in the electrochemical community. Nevertheless, the understand-
ing of fundamental aspects of interfacial electrochemistry is also important for other fields, such
as materials science, nano-science, biology, medical science, sensor and battery research, as
well as for technologies based on electrochemical techniques.
It is known that the formation of an interface between an electronic conductor and an
ionic conductor is accompanied by a spatial separation of charge, such that electric potential
differences may appear between the adjacent phases. The whole array of charged species, neu-
tral molecules or oriented dipoles existing at a metal | solution interface is called the electro-
chemical (or electrical) double layer.
Electrocapillarity is the study of the interfacial tension (stress) as a function of the elec-
trode potential (the term "electrode" is used here to denote heterogeneous electrochemical sys-
tems, in which at least two phases are connected and one of them is an electronic conductor or
a semiconductor, the other is an ionic conductor, usually an electrolyte solution). Precise quan-
titative measurements of interfacial tensions have been obtained for liquid | liquid interfaces as
reported, for example, refs. [2-7]. The interpretation of electrocapillary data obtained with liq-
uid metals in contact with electrolyte solutions is greatly facilitated by the concept of ideal
polarizability. For perfectly (ideally) polarizable electrodes the relationship between the inter-
facial tension, the electrode potential and the surface charge density can be described by the
Lippmann equation [8].
On the other hand, a study of the interface stress of a “solid electrode” (i.e. an electrode
that contains an electronically conducting solid phase in contact with an ionically conducting
liquid phase) is complicated by many factors, and with the exception of a few special situations
the absolute interfacial tension at the solid | liquid interface is inaccessible by experimental
methods. In addition, a solid does not generally exhibit an “equilibrium” surface. According to
[9]: “their surface will be largely a frozen-in record of an arbitrary past history”. Although a
change in a thermodynamic parameter may not result in full equilibrium, the system can escape
from the constraint by optimization of, for example, “the distribution of imperfections, surface
waves and humps” [10] in the rational time scale, or more generally, it will approach relative
minima of the Gibbs energy of the interface. Nevertheless, during the past decades several at-
tempts have been made to derive thermodynamic equations for the solid | liquid interface, and
several methods were suggested (and were supposed to be suitable) for the determination of
3
changes in the interface stress (“specific surface energy”, “interfacial tension”, “surface stress”)
of solid electrodes.
As a general rule, experimental data should be compared to theoretical predictions and
calculations. Unfortunately, for solid electrodes the interpretation of the results from various
methods in terms of physicochemical properties of the system is not without problems [11-35].
In principle, the quantitative predictions made by the theory can be tested experimen-
tally. Unfortunately, interface stress changes of solid/liquid interfaces are very difficult to meas-
ure owing to the lack of reliable methods. Theoretical estimates of absolute surface tension of
some relatively simple covalently bonded, ionic, rare-gas, and metallic crystals are discussed
in the literature [36]. In a few specific situations, the surface tensions of some solid surfaces
have been determined experimentally. These experimental methods are designed for the
solid/gas interface, and are mostly incompatible for use at room temperature or in the presence
of an electrolyte solution. Consequently, they cannot be applied to study the surface energetics
of solid electrodes. On the other hand, during the past decades several attempts have been made
to derive thermodynamic equations for the solid/liquid interface, and several methods were
suggested for measurements of changes of the interface stress of solid electrodes [37-48].
According to the classification proposed by Morcos [49] attempts to determine the in-
terface stress change of solid electrodes fall into two main categories: measurement of the po-
tential dependence of contact angle established by liquid phase on the solid surface [34,50-54]
and the measurement of the variation in interface stress experienced by the solid as a function
of potential. (In the present study, we focus on the latter case.)
Variation in the interfacial stress may either be measured “directly” [55,56], with a pie-
zoelectric element, or be obtained indirectly [46,57-60], by measuring the potential dependence
of the strain (i.e. electrode deformation) and then obtaining the variation in stress from the
appropriate form of Hooke’s law. We would like to stress here again that the above methods
only yield changes of surface stress as a function of various physicochemical parameters e.g.
as a function of electrode potential, and in principle, if there are both “plastic” and “elastic”
contributions to the total strain, the changes of the “generalized surface parameter” [1] can be
determined.
Unfortunately, most of the proposed methods have drawbacks; i.e., they are technically
demanding, they cannot be used to monitor changes of the surface stress, they are semiempirical
and depend on unverified assumptions, etc.
4
In the present work, a brief review is given of some techniques proposed for the deter-
mination of changes of interface stress of “solid electrodes” (“bending beam”, “bending canti-
lever”, “laser beam deflection”, ”wafer curvature” or “bending plate/disc” methods [e.g. 34,37,
40,61], laser interferometry [e.g. 34,37,57,60,62-64], piezoelectric method [e.g. 65-67], exten-
someter method and its variants [e.g. 68,69]) as well as the kind and quality of information that
can be achieved using these methods are discussed.
It should be noted that in most of the literature reviewed here the intensive parameter
conjugate to the surface area is usually called “surface tension” or “surface stress” and is de-
noted generally by s or s, respectively. In order to be consistent with the original literature,
wherever and whenever possible, we will keep the “original” notation throughout the paper.
2 Experimental methods
2.1 The extensometer method and related techniques
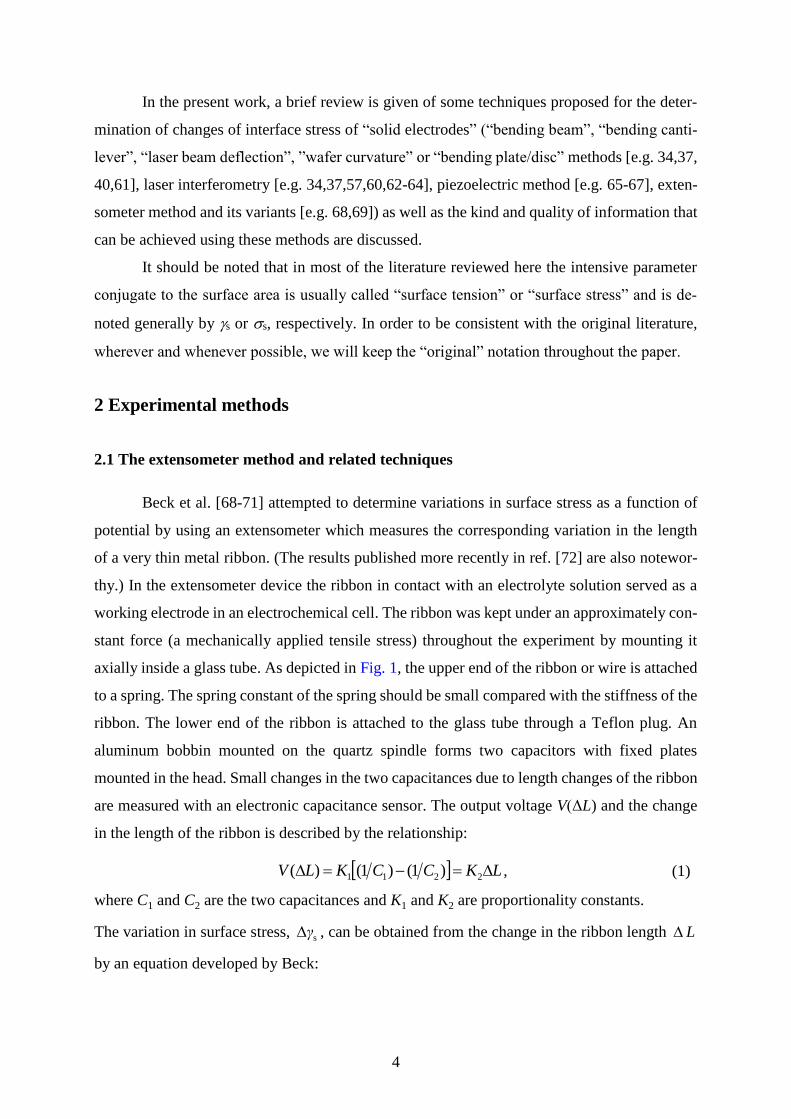
Beck et al. [68-71] attempted to determine variations in surface stress as a function of
potential by using an extensometer which measures the corresponding variation in the length
of a very thin metal ribbon. (The results published more recently in ref. [72] are also notewor-
thy.) In the extensometer device the ribbon in contact with an electrolyte solution served as a
working electrode in an electrochemical cell. The ribbon was kept under an approximately con-
stant force (a mechanically applied tensile stress) throughout the experiment by mounting it
axially inside a glass tube. As depicted in Fig. 1, the upper end of the ribbon or wire is attached
to a spring. The spring constant of the spring should be small compared with the stiffness of the
ribbon. The lower end of the ribbon is attached to the glass tube through a Teflon plug. An
aluminum bobbin mounted on the quartz spindle forms two capacitors with fixed plates
mounted in the head. Small changes in the two capacitances due to length changes of the ribbon
are measured with an electronic capacitance sensor. The output voltage V(ΔL) and the change
in the length of the ribbon is described by the relationship:
LKCCKLV 2211 )1()1()( , (1)
where C1 and C2 are the two capacitances and K1 and K2 are proportionality constants.
The variation in surface stress, sγ , can be obtained from the change in the ribbon length L
by an equation developed by Beck:
5
LPL
AEγ s
(2)
where A and P are the cross-sectional area and periphery of the ribbon and E is Young’s mod-
ulus (Fig. 1). We refer the reader to [34] and references therein for more details on the deriva-
tion of Eqs. 1 and 2.
Unfortunately, thermal expansion constitutes a serious problem in the extensometer method.
The error due to thermal expansion can be reduced, but unless the effect on thermal expansion
can be quantitatively accounted for, the results of the extensometer method cannot be conclu-
sively interpreted.
In [73] the effect of mechanical stress on electrode potential E was studied under zero current
conditions. The experimental setup was very similar to the extensometer described above. A
tensile stress machine was used for mechanical characterization of the samples. A two-electrode
geometry was used for the potential measurements, the potential of a thin Ag wire made taut
vertically in an electrolyte solution (AgNO3) was measured against a reference electrode with
a high input impedance voltmeter. The total length of the wire was 50 mm, the portion in contact
with the electrolyte solution was 30 mm. One end of the wire was fixed to one arm of a balance
the other arm of which was loaded with standard weights. The applied force was low enough
to maintain proportionality between stress and strain (elastic deformation conditions).
The numerically large response reported in [73] has been questioned in [74]. It has been pointed
out, that the dE/d values (where is a measure for tangential stress, which scales with the
elastic strain ) reported in the literature [75,76] differ by several orders of magnitude and even
by sign. In [74] the measurement of the response of the electrode potential (E ) of a polarizable
electrode (gold|10 mmol·dm-3 aqueous perchloric acid solution) to elastic strain under open
circuit has been described. A lock-in technique was used to measure the potential variation
during cyclic elastic deformation of a thin film electrode supported on a polymer substrate. The
method allowed the potential–strain response to be accurately resolved for elastic strain ampli-
tudes as small as 10-4. It has been shown that the approach similar to that originally suggested
by Gokhshtein (see the piezoelectric method discussed below) can provide quantitative data for
dE/d. Cyclic voltammetric experiments combined with dilatometric detection of the length
change have been reported in [77,78].
In refs. [79,80] a laser technique, based on optical fiber interferometry, is described for in situ
measurements of electrode strain during electrode reactions. The basic concept utilizes a metal
6
coated optical fiber in contact with an electrolyte solution as the working electrode in an elec-
trochemical cell, while simultaneously using the fiber as one arm of a Mach-Zehnder interfer-
ometer [34].
Figure 1: Schematic design of the extensometer
2.2 Piezoelectric method
According to our knowledge, Gokhshtein [55,81,82] was the first to measure changes
Eγ s of the interface stress (“surface tension”, “interfacial tension”) s with the electrode
potential E at platinum electrodes in sulfuric acid using the “piezoelectric” method. The method
further improved by various authors [56,65,83,84], especially by Seo et. al. [56,66,67] is “di-
rect” in the sense that it is the variation in the electrode deformation that is “registered” directly
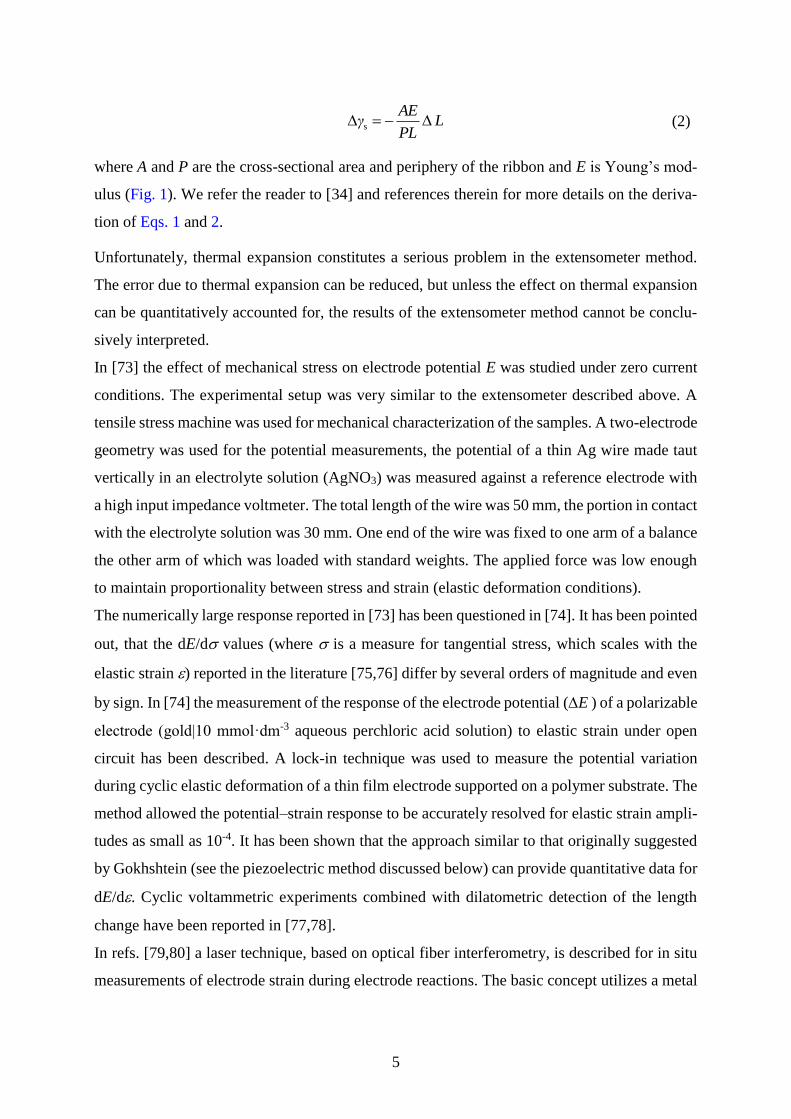
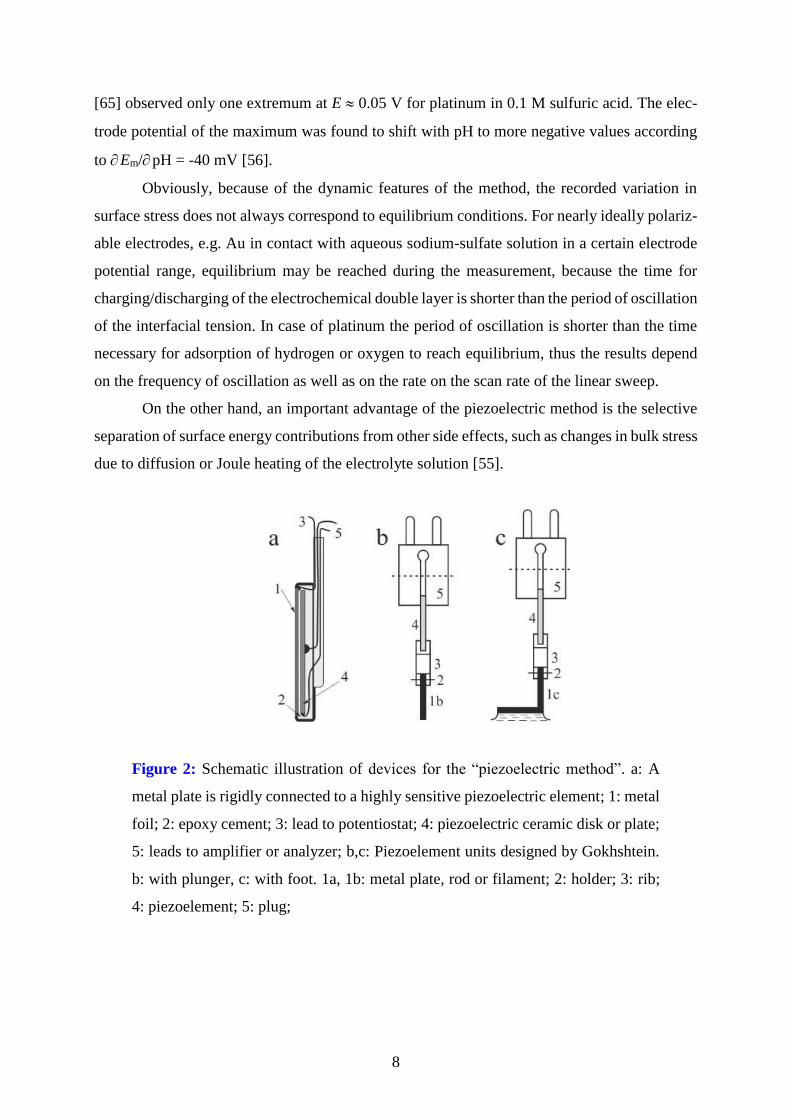
by a piezoelectric element. A metal plate is rigidly connected, in a special manner, to a highly
sensitive piezoelectric element (Fig. 2).
The applied potential consists of a mean (DC) component upon which is superimposed a
high-frequency (AC) component (usually a sinusoidal signal is superimposed on a linear po-
tential sweep). Electrode potential oscillation with the amplitude E result in oscillation with
an amplitude s in the interface stress, which in turn set up forces of inertia that excite vibra-
tions in the entire electrode-piezoelement unit.
7
The piezoelectric element converts the mechanical oscillations to alternating electric sig-
nals, which can be detected by using a lock-in amplifier, an oscilloscope or a frequency response
analyzer. In fact, this is some kind of electromechanical immittance measurement. The geom-
etry of the electrode and its oscillation is of no fundamental importance. The metal in contact
with the electrolyte solution may be made in the form of a tight filament which can make length-
wise oscillations, a straight rectangular rod which can make bending oscillations, etc. The al-
ternating surface stress sets in motion not only the electrode, but the whole electrode and pie-
zoelement system, since the inertia forces are essential.
The oscillations of surface stress can also be excited by the application of high-frequency
current. In this case the amplitude of the surface charge density (q) is kept constant by specify-
ing the amplitude of the alternating current. According to [55] under such conditions s will
be proportional to the derivative s/E, which is called the “q-stance”. If the electric variable
is the potential, and the measurement is carried out with a constant amplitude E, the amplitude
of the piezoelectric voltage |A| is proportional to the derivative of the surface stress with respect
to the electrode potential s/E, and the phase angle () contains information about the change
in the sign of s/E. The s/q value is related to s/E (designated by Gokhshtein as -stance
and -stance, respectively [55]) by
ECq
E
Eq
sss 1 , (3)
where C is the electrode capacitance.
By applying the piezoelectric method s/E is measured at high frequencies and the
quantitative determination of interface stress changes requires a sophisticated calibration pro-
cedure (the transfer function of the mechanical coupling is rather complicated). However, the
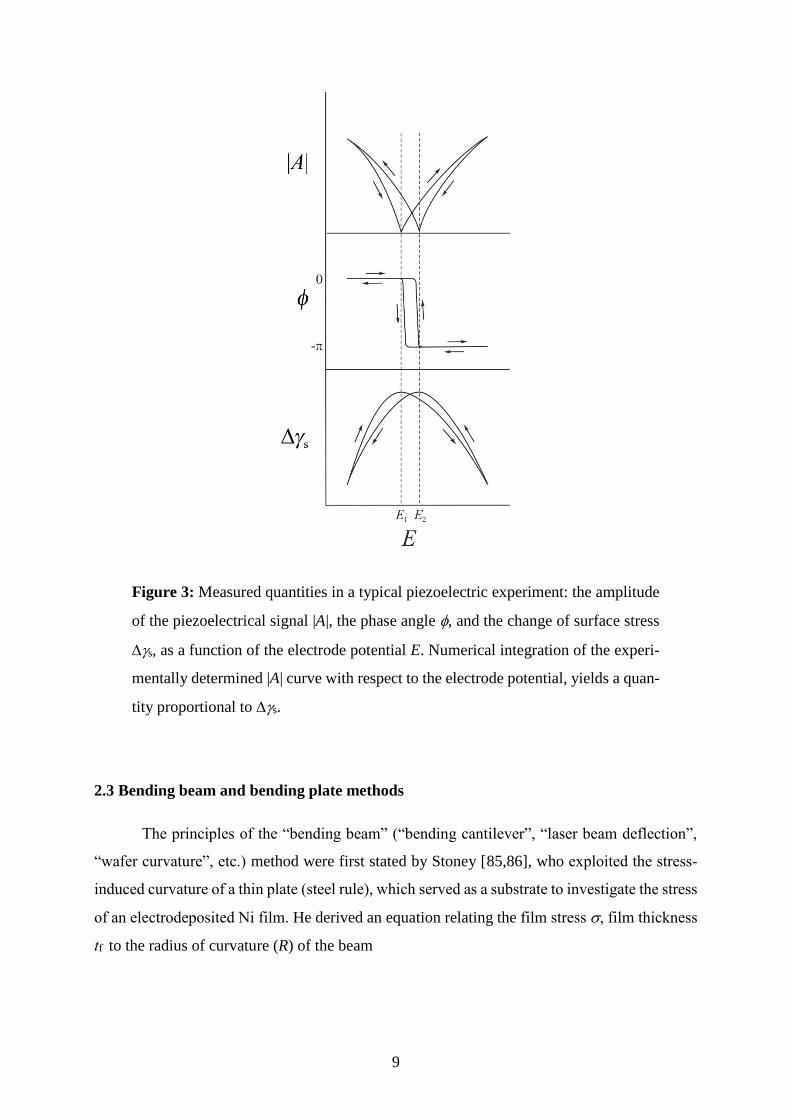
potentials of extrema of the function interface stress vs. potential can be obtained directly. The
relation between the piezoelectric signals (|A| and ) and the s vs. E curve is shown schemat-
ically in Fig. 3.
A series of measurements has been performed to date in order to understand electrode
processes such as electrosorption and initial oxidation. This technique was capable of detecting
sensitively the shift in potential of zero charge (pzc) due to the adsorption of ions and the sign
reversal of surface charge due to the formation and reduction of surface oxide phases. E.g. in
case of platinum is sulfuric acid solutions Gokhshtein observed two extrema in the hydrogen
adsorption region [46]. Similar results were obtained by Seo et al. [56] applying the same ex-
perimental method to platinum in 0.5 M acid sulfate solutions. On the other hand, Malpas et al.
8
[65] observed only one extremum at E 0.05 V for platinum in 0.1 M sulfuric acid. The elec-
trode potential of the maximum was found to shift with pH to more negative values according
to Em/ pH = -40 mV [56].
Obviously, because of the dynamic features of the method, the recorded variation in
surface stress does not always correspond to equilibrium conditions. For nearly ideally polariz-
able electrodes, e.g. Au in contact with aqueous sodium-sulfate solution in a certain electrode
potential range, equilibrium may be reached during the measurement, because the time for
charging/discharging of the electrochemical double layer is shorter than the period of oscillation
of the interfacial tension. In case of platinum the period of oscillation is shorter than the time
necessary for adsorption of hydrogen or oxygen to reach equilibrium, thus the results depend
on the frequency of oscillation as well as on the rate on the scan rate of the linear sweep.
On the other hand, an important advantage of the piezoelectric method is the selective
separation of surface energy contributions from other side effects, such as changes in bulk stress
due to diffusion or Joule heating of the electrolyte solution [55].
Figure 2: Schematic illustration of devices for the “piezoelectric method”. a: A
metal plate is rigidly connected to a highly sensitive piezoelectric element; 1: metal
foil; 2: epoxy cement; 3: lead to potentiostat; 4: piezoelectric ceramic disk or plate;
5: leads to amplifier or analyzer; b,c: Piezoelement units designed by Gokhshtein.
b: with plunger, c: with foot. 1a, 1b: metal plate, rod or filament; 2: holder; 3: rib;
4: piezoelement; 5: plug;
9
Figure 3: Measured quantities in a typical piezoelectric experiment: the amplitude
of the piezoelectrical signal |A|, the phase angle , and the change of surface stress
s, as a function of the electrode potential E. Numerical integration of the experi-
mentally determined |A| curve with respect to the electrode potential, yields a quan-
tity proportional to s.
2.3 Bending beam and bending plate methods
The principles of the “bending beam” (“bending cantilever”, “laser beam deflection”,
“wafer curvature”, etc.) method were first stated by Stoney [85,86], who exploited the stress-
induced curvature of a thin plate (steel rule), which served as a substrate to investigate the stress
of an electrodeposited Ni film. He derived an equation relating the film stress , film thickness
tf to the radius of curvature (R) of the beam
10
R
ttσ
6
2
SSf
, (4)
where tS is the substrate thickness, and ES is the modulus of elasticity (Young’s modulus) of
the substrate. This equation is sometimes rewritten by introducing the “isotropic surface stress”
(s) as
R
tγ
6
2
SSs
, (5)
Since the publication of the classical paper of Stoney [85] both equations (4) and (5)
have been referred to as Stoney’s formula or Stoney’s equation.
It should be noted here, that original Stoney equation given above is not valid in general,
as it describes a one-dimensional stress-curvature scenario. This is not fulfilled in most appli-
cations. In order to account for the biaxial nature of the stress we have to replace ES by
ES /(1S), where S is the substrate Poisson’s ratio [34,87,88], and the film stress can be given
by
Rνt
tσ
)-(16 Sf
2
SS , (6)
and
Rν
tγ
)-6(1 S
2
SSs
. (7)
The above equations can be valid under the following conditions: (a) The substrate is
homogeneous, linearly elastic, and uniformly thick. (b) The stress is uniform throughout the
film thickness. (c) The substrate thickness is much greater than the film thickness. (According
to [89]) the tf /tS ratio should be 10-3.) (d) the radius of curvature of the substrate is much
greater than the thickness of the composite structure, i.e. the bending displacement is small
compared to the thickness of the substrate. We refer the reader to [34] and references therein
for more details on the derivation of Eqs. 6 and 7.
Measuring the bending of a plate or strip to determine interface stress change or the
stress in thin films is a frequently used technique in electrochemistry [37-48]. The electrochem-
ical application of the “bending beam” technique is based on the fact that the changes of the
surface stress (s) for a thin metal film on one side of an insulator strip (or a metal plate, one
side of which is coated with an insulator layer) in contact with an electrolyte solution can be
estimated from the changes of the radius of curvature of the strip. Usually, in such experiments
11
a thin metal strip, or a thin strip of glass or other substrate (on which the metal film is deposited)
is rigidly clamped at one end in a fixed mount to form a cantilever. The deflection of the free
end, as the strip becomes bent, is then measured by some means. The method has been applied
for instance for the investigation of the origin of electrochemical oscillations at silicon elec-
trodes [90] or in the course of galvanostatic oxidation of organic compounds on platinum
[60,61], for the study of volume changes in polymers during redox processes [91], for the in-
vestigation of the response kinetics of the bending of polyelectrolyte membrane platinum com-
posites by electric stimuli [92], and for the experimental verification of the adequacy of the
“brush model” of polymer modified electrodes [93], for in situ monitoring of the electrochem-
ical degradation of polymer films on metals [94-97]. In refs. [98] and [99] the reduction of
perchlorate ions at ruthenium electrodes was investigated by voltammetry, chronoamperome-
try, impedance spectroscopy, and by measuring changes of interfacial stress changes using the
cantilever bending method as functions of electrode potential, and concentrations of perchloric
acid and HCl. The results are consistent with the earlier observation that perchlorate ions can
be electrochemically reduced to Cl− on ruthenium.
As it has already been mentioned above, the “bending beam” method can be effectively
used in electrochemical experiments. If the potential of the electrode changes, electrochemical
processes resulting in the change of s can take place exclusively on the metal side of the sample.
The change in the surface stress induces a bending moment and the strip bends. In case of a thin
metal film on a substrate if the thickness of the film tf is sufficiently smaller than the thickness
at of the plate, tS >> tf , the change of s can be obtained by an expression based on a generalized
form of Stoney’s equation
Rkγ 1is (8)
where ki depends on the design of the electrode. In the simplest case it can be given as (see
Eq.7):
s
2
ssi
16 ν
tEk
(9)
where ES, S, and R are Young’s modulus, Poisson’s ratio and radius of curvature of the
plate, respectively. The derivation of Eq. 8 implies the assumption that s = tfΔ, where Δ is
the change of the film stress. It should be noted that a number of authors have tried to modify
Stoney's approach over the years, and several modified equations have been derived, however,
these equations can usually be written in a form equivalent to Eq. 8 [100-104], according to

12
which the change of the reciprocal radius (1/R) of curvature of the plate (i.e. the change in the
curvature) has to be known for the determination of s .
The values of (1/R) = s/ki can be calculated,
(a) if the changes of the deflection angle of a laser beam mirrored by the cantilever are measured
using an appropriate experimental setup (Fig. 4), or
(b) the deflection of the plate is determined directly, e.g. with a nanointender, an atomic force
microscope (AFM), or a scanning tunneling microscope, etc.
Figure 4: Schematic representation of a typical electrochemical (optical) bending
beam setup (normal incidence of the light beam). Δy is the displacement of the light
spot on the position sensitive detector (PSD) if the radius of curvature changes from
R to R’, l1 is the distance between the clamped end of the probe (cantilever, elec-
trode) and the optical window, l2 is the distance between the optical window and
the photodetector (PSD), h is the distance between the solution level and the reflec-
tion point, ow is the thickness of the optical window, respectively.
2.3.1 Optical detection
2.3.1.1 Direct position sensing
Fig. 5 shows a possible arrangement for electrochemical bending beam experiments
with optical detection [34,105]. Such a setup can be used mainly for the investigation of small
13
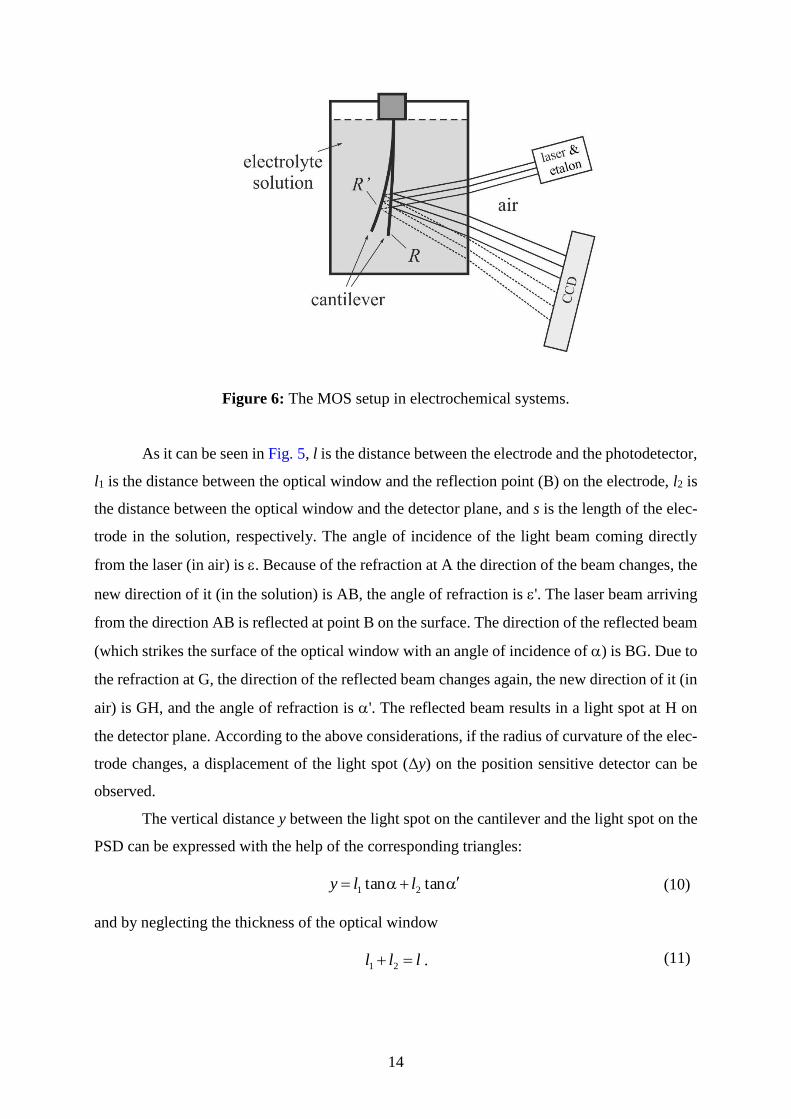
deflections, and several details may be different in special cases. E.g. a multi-beam optical sen-
sor (MOS) technique was used by Proost et. al. in [106,107]. With this technique, the spacings
between a one-dimensional array of multiple laser reflections of the cantilevered substrate can
be continuously monitored with a charge coupled device (CCD) camera (Fig. 6). The
multibeam technique has been successfully used for in situ monitoring of the stresses generated
in metal or ceramic thin films deposited in vacuum by chemical vapor deposition, physical
vapor deposition or molecular beam epitaxy [108-115].
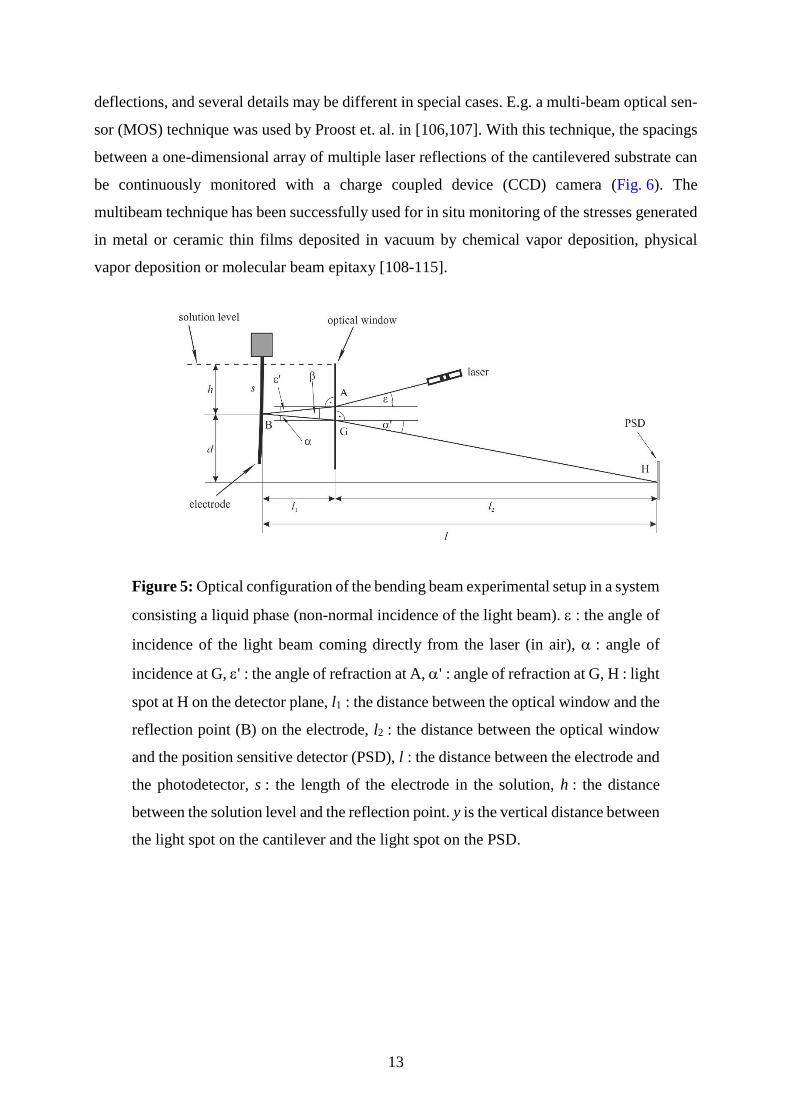
Figure 5: Optical configuration of the bending beam experimental setup in a system
consisting a liquid phase (non-normal incidence of the light beam). : the angle of
incidence of the light beam coming directly from the laser (in air), : angle of
incidence at G, ' : the angle of refraction at A, ' : angle of refraction at G, H : light
spot at H on the detector plane, l1 : the distance between the optical window and the
reflection point (B) on the electrode, l2 : the distance between the optical window
and the position sensitive detector (PSD), l : the distance between the electrode and
the photodetector, s : the length of the electrode in the solution, h : the distance
between the solution level and the reflection point. y is the vertical distance between
the light spot on the cantilever and the light spot on the PSD.
14
Figure 6: The MOS setup in electrochemical systems.
As it can be seen in Fig. 5, l is the distance between the electrode and the photodetector,
l1 is the distance between the optical window and the reflection point (B) on the electrode, l2 is
the distance between the optical window and the detector plane, and s is the length of the elec-
trode in the solution, respectively. The angle of incidence of the light beam coming directly
from the laser (in air) is . Because of the refraction at A the direction of the beam changes, the
new direction of it (in the solution) is AB, the angle of refraction is '. The laser beam arriving
from the direction AB is reflected at point B on the surface. The direction of the reflected beam
(which strikes the surface of the optical window with an angle of incidence of ) is BG. Due to
the refraction at G, the direction of the reflected beam changes again, the new direction of it (in
air) is GH, and the angle of refraction is '. The reflected beam results in a light spot at H on
the detector plane. According to the above considerations, if the radius of curvature of the elec-
trode changes, a displacement of the light spot (Δy) on the position sensitive detector can be
observed.
The vertical distance y between the light spot on the cantilever and the light spot on the
PSD can be expressed with the help of the corresponding triangles:
tantan 21 lly (10)
and by neglecting the thickness of the optical window
lll 21 . (11)
15
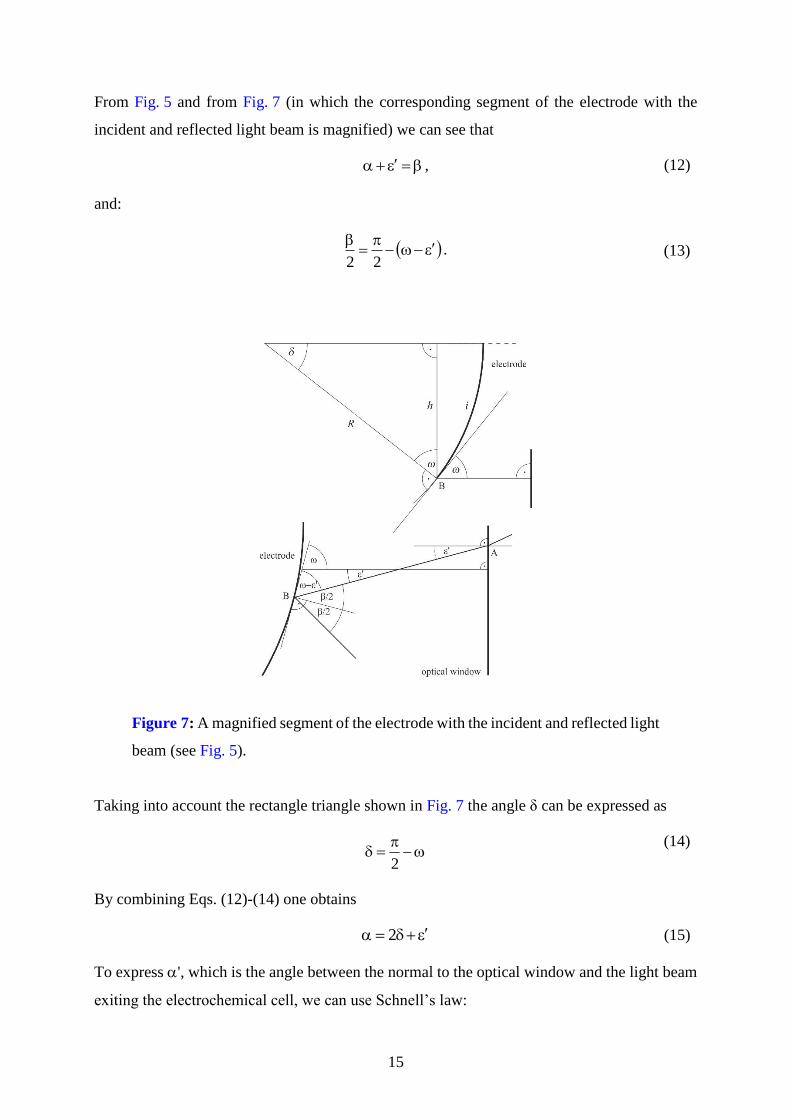
From Fig. 5 and from Fig. 7 (in which the corresponding segment of the electrode with the
incident and reflected light beam is magnified) we can see that
, (12)
and:
22. (13)
Figure 7: A magnified segment of the electrode with the incident and reflected light
beam (see Fig. 5).
Taking into account the rectangle triangle shown in Fig. 7 the angle δ can be expressed as
2
(14)
By combining Eqs. (12)-(14) one obtains
2 (15)
To express ', which is the angle between the normal to the optical window and the light beam
exiting the electrochemical cell, we can use Schnell’s law:
16
ssin
sinn
(16)
From Eq.(10) we have:
221
sin1
sintan lly (17)
and, with Eqs. (15) and (16)
2sin1
2sin2tan
22
s
s21
nnlly (18)
Eq.(18) is suitable (at least in principle) for calculating y using experimentally measurable pa-
rameters: the values of δ and ' can be determined knowing the incident angle of the light beam,
the refractive index and the radius of curvature of the cantilever.
Using Eq. (15) we can derive simpler equations for the change of y. Differentiating the
function y(δ) with respect to δ we have:
23
2sin1
2cos2
2cos
12
d
d
22
s
s221
nnll
y (19)
By taking into account Eqs.(15) and (16):
3s221cos
cos2
cos
12
d
dnll
y (20)
It is clear that , since the solution is optically denser than air, consequently
1coscoscos3 , and therefore
1cos
cos3
α
α. (21)
Since Ri 1dd , by using Eq. (19) the following equation can be obtained:
23
2sin1
2cos
22
cos
12
/1d
d
22
s
s22
1
R
in
R
i
nil
R
iil
R
y (22)
Now we can express Δy (that is the change of the position of the light spot on the PSD)
by using Schnell’s law ( ssin
sinn
) and the following assumption: R/1 is small enough to
use first-order approximation for the changes, hi , and 2/2 Ri .
17
According to the above considerations:
Rn
nlhn
lhRR
yy 1
sin1
sin12
sin1
121
1d
d
23
21
2
22-
ss222-
s
1
(23)
In addition, if 21 ll .
Rn
lhny 1sin1
sin12
23
21
2
22-
ss
(24)
or
s
s22-
s
2
s
,2sin1
sin1
21
21
23
nξlhn
y
nlhn
yR
(25)
The factor s,nξ in square brackets in Eq.(25), expressing the effect of the incident
angle, is a monotonously decreasing function . For ns (20 ºC) 1.333 (pure water) and for
= 20 it has the value of 333.1,30ξ = 0.859, for = 20 and ns (20 ºC) 1.420 (this is the
refractive index e.g. of propylene carbonate) 420.1,20ξ = 0.855, respectively. Note that if the
deflection of the electrode is small and tends to zero (“normal incidence”) we get back the
formula derived earlier for perpendicular incident light [116]:
Rlhny 12 s (26)
or
s2
1lhn
yR
(27)
As it can be seen from Eqs. (8), (9), and (27), for the calculation of s only the experi-
mental determination of Δy is necessary, if the actual values of ki (or ts, Es, sν ), l, h, and sn are
known.
Unfortunately, in many papers reporting results on electrochemical bending beam ex-
periments with optical detection, schemes of experimental arrangements can be found in which
the direction of the reflected beam before and after passing the optical window or the air/solu-
tion boundary is indicated incorrectly, since the effect of refraction is ignored [see e.g. in
105,116,117,118]. It is even more regrettable that the effect of refraction is often neglected also
in the calculations. In addition no reference is made to the refractive index of the solution, or
18
the value of the refractive index of the solution is not indicated. However, refractive indices of
aqueous solutions are about 1.33 1.48. It is evident from the above equations that the complete
neglect of the bending of the laser beam due to refraction at the optical window may cause an
error of about 25-32 % in the determination of s in aqueous solutions (because of ns only!),
and the error is more pronounced in the case of liquids of higher refractive index. The error is
even greater if the incident angle is different from zero. Other possible sources of errors are
discussed in [34].
2.3.1.2 Interferometric detection
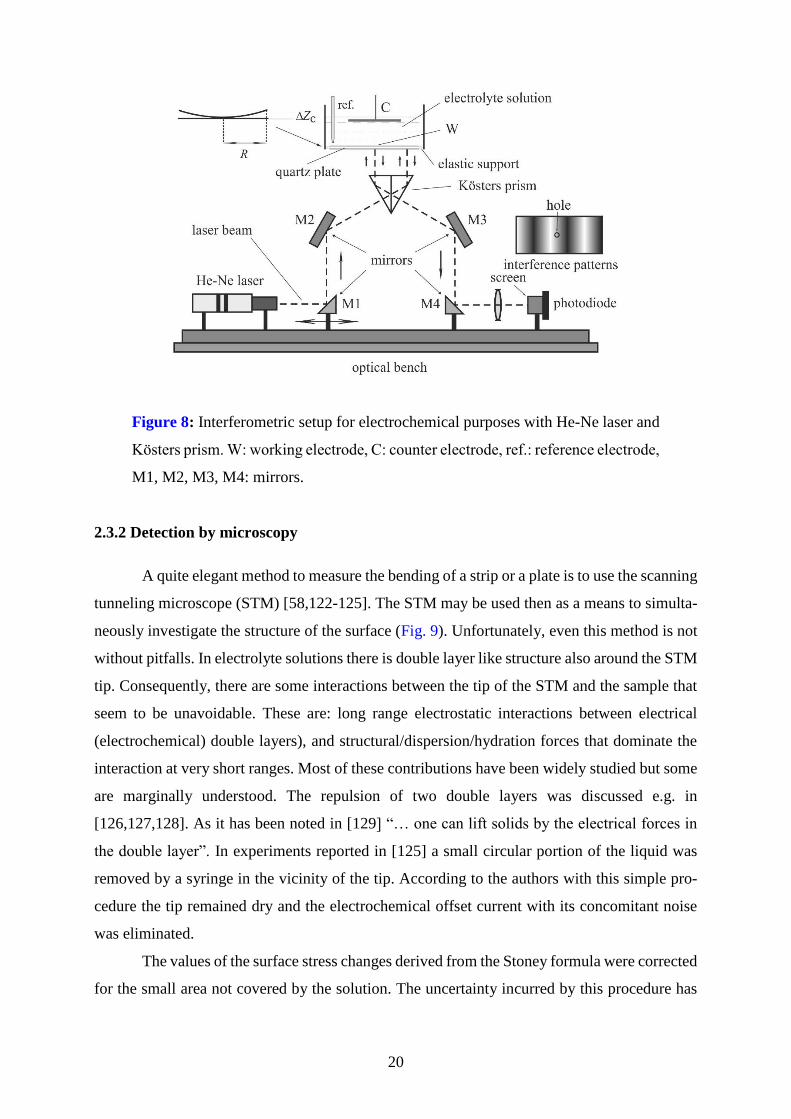
The deflection of a strip or a plate can also be measured interferometrically [119]. Fig. 8
shows the principle of the electrochemical Kösters laser interferometer, which can be used for
the determination of changes of surface stress by the resulting deformation of an elastic plate.
(Not shown in the Figure are the adjustment devices for rotating and turning the optical com-
ponents in three dimensions, and tilting the electrochemical cell with the quartz plate at its
bottom with respect to the prism, and the damping elements.) The Kösters laser interferometer
(Kösters-prism [120] interferometer) is a laser-illuminated double-beam interferometer. The
main advantage of this type of interferometer is its high immunity to environmental noise due
to the close vicinity of the two interfering beams. This immunity makes it an ideal tool for high-
precision measurements. The central constituent of the interferometer is the Kösters-prism
beam splitter, which produces two parallel coherent beams. The two reflected beams recombine
in the prism, and an interference pattern can be observed. Usually, the Kösters prisms are con-
structed of two halves of fused silica joined together along a coated surface, which acts as a
beam splitter. The angles of the prism halves are 30°-60°-90°, with high angular accuracy, and
one long cathetus side is semi-transparent (the reflection and transmission coefficients are
equal). The semi-transparent layer performs an equal intensity division of the beam, reflecting
half and transmitting half, imparting a 90 degree phase lag in the transmitted beam. This divi-
sion and phase shift gives the Kösters prism its interferometric properties: the beam reflected
from one side of the prism interferes constructively or destructively with the beam transmitted
from the other side.
As it can be seen in Fig. 8, the light from the laser is reflected by mirrors M1 and M2 in
the direction perpendicular to the entrance side of the prism. The point of entrance determines
the distance of the two beams emerging from the base of the prism. They are reflected at a
nearly zero angle of incidence from the plate. The interfering light leaves the Kösters prism
19
through the exit side, and it is projected (using the mirrors M3 and M4) onto a screen with a
hole of a given diameter and a photodiode behind it. The deformation of the plate causes sinus-
oidal changes of the light intensity at the point of measurement in the interference pattern.
The difference between the optical path lengths (2ΔZC) can be determined from the
change in light intensity detected by the photodiode. The height ΔZC of the center of the plate
with respect to a plane at a given radius yields s from the appropriate form of Hooke's law
CS Zkγ (28)
The sensitivity is of the order 0.1 nm with respect to CZ and 1 mN/m with respect to s. The
constant k in Eq.(28) is determined by the mechanical properties of the quartz plate (radius R)
and by the type and quality of the support at the edge of the plate.
Choosing a circular AT-cut quartz plate with a thin metal layer on it in contact with the
solution being the working electrode in an electrochemical cell provides the advantage to meas-
ure simultaneously surface energy, mass and charge [57,60,62-64,121]. (If the metal layers on
both sides of the quartz disc are connected to an appropriate oscillator circuit, the device can be
used as an electrochemical quartz crystal nanobalance.) In addition, since the light beams do
not pass the air/solution interface, the effects of light refraction at the surface are excluded.
Even though there are great advantages of the interferometric detection, there are several
problems connected with this method. For instance, the shape and the magnitude of the defor-
mation Z(r,) as a function of the radial distance r and the angle depends on the type of
support at the edge of the circular plate. The largest deformation and thus the highest sensitivity
for measurements of the surface stress change is expected for the “unsupported” plate. A plate
is also unsupported if a mounting is present but exerts no forces on the edge. Evidently, the
design and realization of such a device is very difficult [57]. In the case of evaporated/sputtered
metal layers the high surface stress changes may cause problems with the adhesion of the films.
In addition, no absolutely satisfactory solution has been found for the problem of making reli-
able electrical connections to the metal layers on the quartz crystal.
20
Figure 8: Interferometric setup for electrochemical purposes with He-Ne laser and
Kösters prism. W: working electrode, C: counter electrode, ref.: reference electrode,
M1, M2, M3, M4: mirrors.
2.3.2 Detection by microscopy
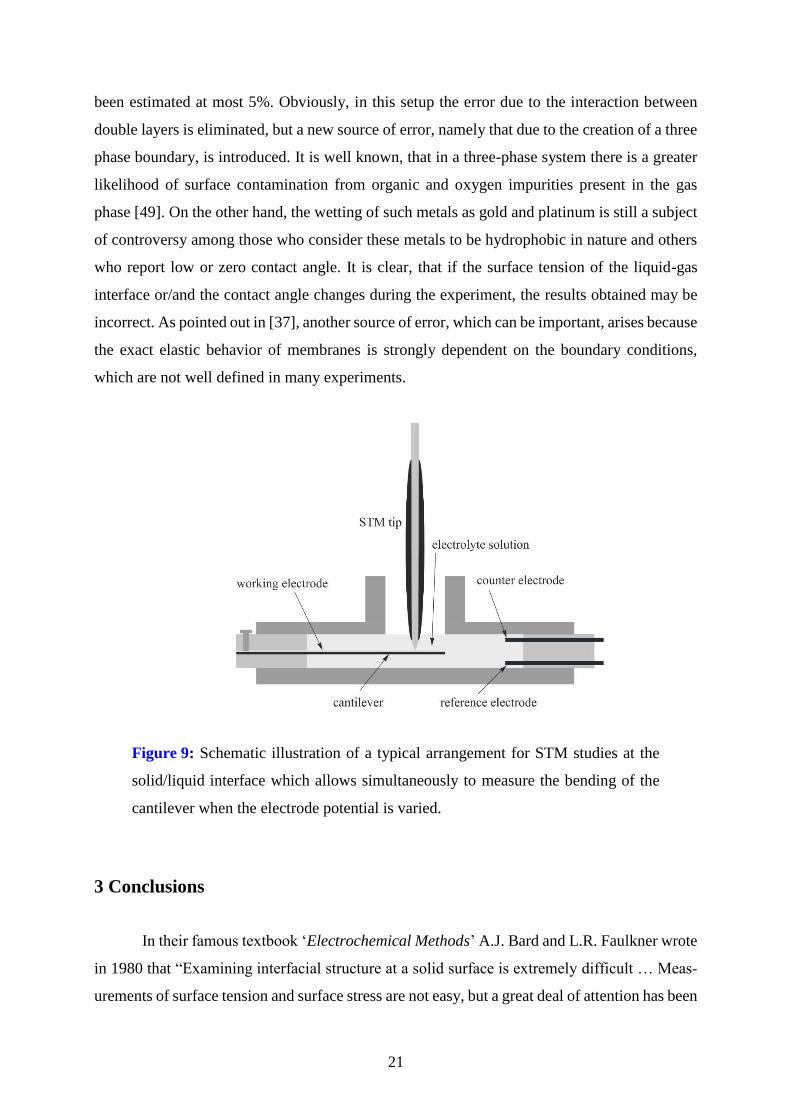
A quite elegant method to measure the bending of a strip or a plate is to use the scanning
tunneling microscope (STM) [58,122-125]. The STM may be used then as a means to simulta-
neously investigate the structure of the surface (Fig. 9). Unfortunately, even this method is not
without pitfalls. In electrolyte solutions there is double layer like structure also around the STM
tip. Consequently, there are some interactions between the tip of the STM and the sample that
seem to be unavoidable. These are: long range electrostatic interactions between electrical
(electrochemical) double layers), and structural/dispersion/hydration forces that dominate the
interaction at very short ranges. Most of these contributions have been widely studied but some
are marginally understood. The repulsion of two double layers was discussed e.g. in
[126,127,128]. As it has been noted in [129] “… one can lift solids by the electrical forces in
the double layer”. In experiments reported in [125] a small circular portion of the liquid was
removed by a syringe in the vicinity of the tip. According to the authors with this simple pro-
cedure the tip remained dry and the electrochemical offset current with its concomitant noise
was eliminated.
The values of the surface stress changes derived from the Stoney formula were corrected
for the small area not covered by the solution. The uncertainty incurred by this procedure has
21
been estimated at most 5%. Obviously, in this setup the error due to the interaction between
double layers is eliminated, but a new source of error, namely that due to the creation of a three
phase boundary, is introduced. It is well known, that in a three-phase system there is a greater
likelihood of surface contamination from organic and oxygen impurities present in the gas
phase [49]. On the other hand, the wetting of such metals as gold and platinum is still a subject
of controversy among those who consider these metals to be hydrophobic in nature and others
who report low or zero contact angle. It is clear, that if the surface tension of the liquid-gas
interface or/and the contact angle changes during the experiment, the results obtained may be
incorrect. As pointed out in [37], another source of error, which can be important, arises because
the exact elastic behavior of membranes is strongly dependent on the boundary conditions,
which are not well defined in many experiments.
Figure 9: Schematic illustration of a typical arrangement for STM studies at the
solid/liquid interface which allows simultaneously to measure the bending of the
cantilever when the electrode potential is varied.
3 Conclusions
In their famous textbook ‘Electrochemical Methods’ A.J. Bard and L.R. Faulkner wrote
in 1980 that “Examining interfacial structure at a solid surface is extremely difficult … Meas-
urements of surface tension and surface stress are not easy, but a great deal of attention has been
22
paid to them recently; and there is reason for optimism about the future in this area” [130]. In
retrospect, this prediction did not come true completely, but over the years very interesting
results have been obtained in this field. Especially, the “bending beam” or “bending plate”
(“bending cantilever”, “laser beam deflection”, “wafer curvature”, etc.) methods with optical
detection (PSD or interferometer) seem to be promising. However, even these methods are not
without potential problems. It is necessary to be flexible and to choose the most appropriate
method for each particular case. We hope that this short review will help the interested reader
to have a glance at the huge progress in this new and developing field.
Funding and acknowledgement: This research has received funding from the Hungarian Scientific Research
Fund (OTKA) under Grant Agreement number K 109036.
23
References
1. S. Trasatti, R. Parsons, “Interphases in systems of conducting phases”, Pure&Appl Chem 58 (3) 437-454
(1986).
2. R. Parsons, “Equilibrium properties of electrified interfaces”, In: J. O’M. Bockris, B. E. Conway (eds) Mod-
ern aspects of electrochemistry, Vol. 1. Academic Press, New York (1954).
3. D.C. Grahame, “The electrical double layer and the theory of electrocapillarity”, Chem. Rev. 41 (3) 441-501
(1947).
4. P. Delahay “Double layer and electrode kinetics”, Interscience, New York (1965).
5. R. Aveyard, D. Haydon, “An introduction to the principles of surface chemistry”, Cambridge University
Press, Cambridge, (1973).
6. J.O’M. Bockris, B.E. Conway, E. Yeager (eds) “Comprehensive treatise of electrochemistry”, Vol. 1. Plenum
Press, New York (1980).
7. H. Girault, D. Schiffrin, “Electrochemistry of liquid-liquid interfaces”, In: A.J. Bard (ed), Electroanalyti-
cal chemistry, Vol. 15. Marcel Dekker, New York (1989).
8. G. Lippmann, “Relations entre les phénomènes électriques et capillaries” Ann. Chim. Phys. (5) 494-549
(1875).
9. A.W. Adamson, I. Ling, “The status of contact angle as a thermodynamic property”, Adv. Chem. Ser. (43)
57-73 (1964).
10. C. Herring, “Some Theorems on the Free Energies of Crystal Surfaces”, Phys. Rev. 82 (1) 87–93 (1951).
11. R.G. Linford, “The derivation of thermodynamic equations for solid surfaces”, Chem. Rev. 78 (2) 81-95
(1978).
12. G Horányi; G G Láng, Double-layer phenomena in electrochemistry: Controversial views on some funda-
mental notions related to electrified interfacesJ Colloid Interf Sci 296: (1) pp. 1-8. (2006).
13. G. Láng, K.E. Heusler, “Problems related to the specific surface energy of solid electrodes”, Journal of
Electroanalytical Chemistry 377 (1) 1-7 (1994).
14. K.E. Heusler, G. Láng, “Surface energies of solid electrodes”, Electrochimica Acta 42 (5) 747-756 (1997).
15. R. Guidelli, “Superficial work and surface stress at solid electrodes: a thermodynamic assessment”, J. Elec-
troanal. Chem. (453) 69-77 (1998).
16. G. Láng, K.E. Heusler, “Can the internal energy function of solid interfaces be of a non-homogeneous na-
ture?”, J. Electroanal. Chem. 472 (2) 168-173 (1999).
17. R. Guidelli, “A reply to the question of whether the internal energy of solid interfaces can be of a non-ho-
mogeneous nature”, J. Electroanal. Chem. 472 (2) 174-177 (1999).
18. G. Valincius, “Electrocapillary equations of solid electrodes”, J. Electroanal. Chem. 478 (1-2) 40-49
(1999).
19. J. Lipkowski, W. Smickler, D.M. Kolb, R. Parsons, “Comments on the thermodynamics of solid elec-
trodes”, J Electroanal. Chem. 452 (2) 193-197 (1998).
20. P.R. Couchman, W.A. Jesser , D. Kuhlmann-Wilsdorf, “On the concepts of surface stress and surface strain”,
Surf. Sci. 33 (3) 429-436 (1972).
21. P.R. Couchman, W.A. Jesser, “On the thermodynamics of surfaces”, Surf. Sci. 34 (2) 212-224 (1973).

24
22. P.R. Couchman, D.W. Everett, W.A. Jesser, “Remarks on the derivation of the Gibbs—Duhem relation for
a surface”, J. Coll. Interf. Sci. 52 (2) 410-411 (1975).
23. A.I. Rusanov, “On the thermodynamics of deformable solid surfaces”, J. Coll. Interf. Sci. 63 (2) 330-345
(1978).
24. A.I. Rusanov, “Advances in thermodynamics of solid surfaces”, Pure and Appl. Chem. 61, 1945-1948
(1989).
25. A.I. Rusanov, “Thermodynamics of solid surfaces”, Surf. Sci. Rep. 23 (6-8) 173-247 (1996).
26. P.R. Couchman and D.W. Everett, “A comment on certain parameters and equations in surface thermody-
namics”, J. Electroanal. Chem. 67 (3) 382-386 (1976).
27. B.M. Grafov, G. Paasch, W. Plieth, A. Bund, “Connection of the generalized Shuttleworth equation for the
elastic spherical electrode with the Laplace formula and the Gibbs adsorption equation”, Electrochim. Acta
48 (5) 581-587 (2003).
28. V.A. Marichev, “Structure-mechanical approach to surface tension of solids”, Surf. Sci. 600 (19) 4527-
4536 (2006).
29. V.A. Marichev, “Plastic deformation and surface tension of solids”, Chem. Phys. Lett. 434 (4-6) 218-221
(2007).
30. V.A. Marichev, “Surface tension of solids. Structure-mechanical approach”, Prot. Met. 44 (2) 105-119
(2008).
31. E.M. Gutman, On the thermodynamic definition of surface stress, J. Phys.: Condens. Matter 7 L663-L667
(1995).
32. S. Fletcher, “Surface thermodynamics reconsidered. Derivation of the Gokhshtein relations from the Gibbs
potential and a new approach to surface stress”, J. Solid State Electrochem. 18, 1231-1238, (2014).
33. E.M. Gutman, “Theoretical problems in solid electrocapillarity” J. Solid State Electrochem. 18 (12) 3217–
3237 (2014).
34. G.G. Láng, C. Barbero. Laser Techniques for the Study of Electrode Processes, Monographs in Electro-
chemistry, F. Scholz (Ed.), Springer, Heidelberg, New York, 2012.
35. E.M. Gutman. Thermodynamic aspects of capillarity and electrocapillarity of solid interfaces. J. Solid State
Electrochem. 20 (11):2929-2950 (2016).
36. J.J. Bikerman in Topics in Current Chemistry ;77, Springer-Verlag, Berlin, 1978.
37. G.G. Láng, N.S. Sas, S. Vesztergom, “Experimental Determination of Surface Stress Changes in Electro-
chemical Systems – Possibilities and Pitfalls”, Chem. Biochem. Eng. Q. 23 (1) 1–9 (2009).
38. H. Ibach, “The role of surface stress in reconstruction, epitaxial growth and stabilization of mesoscopic
structures”, Surf. Sci. Reports 29 (5-6) 195-263 (1997).
39. K. Ueno, M. Seo, “Study of adsorption of iodide ions on gold electrode by a laser‐ beam deflection method
compared with a piezoelectric technique”, J. Electrochem. Soc. 146 (4) 1496-1499 (1999).
40. R.A. Fredlein, A. Damjanovic, J.O’M. Bockris, “Differential surface tension measurements at thin solid
metal electrodes”, Surf. Sci. 25 (2) 261-264 (1971).
41. R.A. Fredlein, J.O’M. Bockris, “An “electrocapillary” study of the gold-perchloric acid solution interface”,
Surf. Sci. 46 (2) 641-652 (1974).
25
42. S.N. Sahu, J. Scarminio, F. Decker, “A laser beam deflection system for measuring stress variations in thin
film electrodes”, J. Electrochem. Soc. 137 (4) 1150-1154 (1990).
43. F. Tian, J.H. Pei, D.L. Hedden, G.M. Brown, T. Thundat, “Observation of the surface stress induced in mi-
crocantilevers by electrochemical redox processes”, Ultramicroscopy 100 (3-4) 217-223 (2004).
44. S. Cattarin, E. Pantano, F. Decker, “Investigation by electrochemical and deflectometric techniques of sili-
con dissolution and passivation in alkali”, Electrochem. Commun. 1 (10) 483-487 (1999).
45. S. Cattarin, F. Decker, D. Dini, B. Margesin, “In-situ detection of stress in oxide films during Si electrodis-
solution in acidic fluoride electrolytes”, J. Electroanal. Chem. 474(2) 182-187 (1999).
46. R. Raiteri, H.-J. Butt, M. Grattarola, “Changes in surface stress measured with an atomic force micro-
scope”, Scanning Microscopy 12, 243-253 (1998).
47. O.E. Kongstein, U. Bertocci, G.R. Stafford, “In situ stress measurements during copper electrodeposition
on (111)-textured Au”, J. Electrochem. Soc., 152 (3) C116-C123 (2005).
48. G.R. Stafford, U. Bertocci, “In situ stress and nanogravimetric measurements during underpotential deposi-
tion of bismuth on (111)-textured Au”, J. Phys. Chem. B 110 (31) 15493–15498 (2006).
49. I. Morcos, in ‘‘Specialist Periodical Reports Electrochemistry’’, Vol 6. In: Thirsk HR (ed) The Chemical
Society, Burlington House, London, 65-97 (1978).
50. I. Morcos, H. Fischer, “Determination of the potential of zero charge from capillary liquid rise on metal
plates” J Electroanal Chem 17 (1-2) 7-11 (1968).
51. I. Morcos, “Electrocapillary phenomena at the stress-annealed pyrolytic graphite electrode” J Phys Chem. 76
(19) 2750-2753 (1972).
52. I. Morcos, “Determination of Surface Tensions of Liquids from Liquid Meniscus Rise on Partially Immersed
Plates” J. Chem. Phys. 55 4125-4126 (1971).
53. I. Morcos, “Surface Tension of Stress‐ Annealed Pyrolytic Graphite” The Journal of Chemical Physics 57
(4),1801-1802,(1972).
54. I. Morcos , “Electrocapillary Studies on Partially Immersed Mercury‐ Plated Electrode in DMF‐ Water So-
lutions” J. Chem. Phys. 56 (8) 3996-4000 (1972).
55. A. Ya. Gokhshtein, in “Surface Tension of Solids and Adsorption”, Nauka, Moscow (1976)
56. M. Seo, T. Makino, N. Sato, “Piezoelectric response to surface stress change of platinum electrode”, J.
Electrochem. Soc. 133 (6) 1138-1142 (1986).
57. L. Jaeckel, G.G. Láng, K.E. Heusler, “A new interferometric method to investigate surface energies at solid
electrodes“, Electrochim. Acta 39 (8-9) 1031-1038 (1994).
58. H. Ibach, C.E. Bach, M. Giesen, A. Grossmann, “Potential-induced stress in the solid-liquid interface:
Au(111) and Au(100) in an HClO4 electrolyte“, Surf. Sci. 375 (1) 107-119 (1997).
59. W. Haiss, “Surface stress of clean and adsorbate-covered solids”, Rep. Prog. Phys. 64 (5) 591-648 (2001).
60. G.G. Láng, M. Seo, K.E. Heusler, “Simultaneous oscillations of surface energy, superficial mass and elec-
trode potential in the course of galvanostatic oxidation of formic acid”, J. Solid State Electrochem. 9 (5)
347–353 (2005).
61. G.G. Láng, K. Ueno, M. Ujvári, M. Seo, “Simultaneous Oscillations of Surface Stress and Potential in the
Course of Galvanostatic Oxidation of Formic Acid”, J. Phys. Chem. B 104 (13) 2785–2789 (2000).
26
62. G. Láng, K.E. Heusler, “Surface energies of an electrode in equilibrated partially miscible electrolytes”,
J. Chem. Soc., Farad. Trans. 93 (4) 583-589 (1997).
63. G.G. Láng, K.E. Heusler, “Changes of the specific surface energy of gold due to the chemisorption of sul-
phate”, J. Electroanal. Chem. 391 (1-2) 169-179 (1995).
64. G. Láng, K.E. Heusler, “On the interpretation of specific surface energies measured at solid electrodes –
changes of specific surface-energy of gold in chloride solution”, Russ. J. Electrochem. 31 (8) 759-767
(1995).
65. R.E. Malpas, R.A. Fredlein, A.J. Bard, “The Piezoelectric Detection of Electrode Surfaces Processes”,
J. Electroanal. Chem. 98 171-180 (1979).
66. M. Seo, K. Ueno, “Piezoelectric detection of changes in surface energy of gold electrode in perchlorate so-
lutions containing iodide ions”, J. Electrochem Soc. 143 (3) 899-904 (1996).
67. K. Ueno, M. Seo, “Study of adsorption of iodide ions on gold electrode by a laser‐ beam deflection method
compared with a piezoelectric technique”, J. Electrochem. Soc. 146 (4) 1496-1499 (1999).
68. T.R. Beck, “"Electrocapillary curves" of solid metals measured by extensometer instrument”, J. Phys.
Chem. 73 (2) 466-468 (1969).
69. K.F. Lin, T.R. Beck, ”Surface stress curves for gold”, J. Electrochem. Soc. 123 (8) 1145 (1976).
70. T.R. Beck, K.F. Lin, “Surface Stress Curves for Platinum”, J. Electrochem. Soc. 126 (2) 252-256 (1979).
71. T.R. Beck, K.W. Beach, in ‘Proceedings of the Symposium on electrocatalysis’, ed. M.W. Breiter, The
Electrochemical Society, Soft-bound Symposium Series, Princeton, N.J., 1974, pp. 357-364.
72. K.F. Lin, “Some Electrocapillary‐ Type Behaviors of Gold Electrode”, J. Electrochem. Soc. 125 (7) 1077-
1078 (1978).
73. Á. Horváth, R. Schiller, “The effect of mechanical stress on the potential of the Ag/Ag+ electrode”, Phys.
Chem. Chem. Phys. 3, 2662-2667 (2001).
74. M. Smetanin, D. Kramer, S. Mohanan, U. Herr, J. Weissmüller “Response of the potential of a gold elec-
trode to elastic strain”, Phys. Chem. Chem. Phys. 11, 9008-9012 (2009).
75. P.P. Craig, “Direct Observation of Stress-Induced Shifts in Contact Potentials” Phys. Rev. Lett. 22 (14)
700-703 (1969).
76. K. Unal, H.K. Wickramasinghe, “Nanoscale quantitative stress mapping with atomic force microscopy”
Appl. Phys. Lett. 90 113111 (2007).
77. J. Weissmüller, R.N. Viswanath, D. Kramer, P. Zimmer, R. Würschum, H. Gleiter, “Charge–induced reversi-
ble strain” Science 300 312-315 (2003).
78. D. Kramer, R.N. Viswanath, J. Weissmüller, “Surface-Stress Induced Macroscopic Bending of Nanoporous
Gold Cantilevers” Nano Lett. 4 793-796 (2004).
79. M.A. Butler, D.S. Ginley, “In-site measurement of strain during electrodeposition” J Electrochem Soc 134
510-511 (1987).
80. M.A. Butler, D.S. Ginley, “New Technique for Measurement of Electrode Strain during Electrochemical
Reactions” J Electrochem Soc 135 (1) 45-51 (1988).
81. A.Ya. Gokhshtein, “The estance method”, Elektrokhimiya 6, 979-985 (1970).
82. A.Ya. Gokhshtein, Electrolysis and surface phenomena. “To the bicentenary of Volta’s publication on the
first direct-current source”, Physics-Uspekhi 43 (7) 725-750 (2000).
27
83. K.M. Dickinson, K.E. Hanson, R.A. Fredlein, “Potentials of zero charge and capacitance minima of poly-
crystalline gold in sodium fluoride solutions”, Electrochim. Acta 37 (1) 139-141 (1992).
84. M. Seo, X.C. Jiang, and N. Sato, “Piezoelectric response to surface stress change of gold electrode in sul-
fate aqueous solutions”, J. Electrochem. Soc. 134 (12) 3094-3098 (1987).
85. G.G. Stoney, “The tension of metallic films deposited by electrolysis”, Proc Roy. Soc. London A32 (82)
172-175 (1909).
86. G.G. Láng, in “Electrochemical Dictionary”, Eds. A.J. Bard, G. Inzelt, F. Scholz, Springer, Berlin, 2008.
87. D. Sander, “The correlation between mechanical stress and magnetic anisotropy in ultrathin films” Rep.
Prog. Phys. 62 (5) 809–858 (1999).
88. D. Sander, Z. Tian, J. Kirschner “Cantilever measurements of surface stress, surface reconstruction, film
stress and magnetoelastic stress of monolayers“, Sensors 8 (7), 4466-4486 (2008).
89. Brenner A, Senderoff S “Calculation of stress in electrodeposits from the curvature of a plated strip” J. Res.
Nat. Bur. Stand. 42 105-123 (1949).
90. V. Lehmann, “On the origin of electrochemical oscillations at silicon electrodes”, J. Electrochem. Soc. 143
(4) 1313-1318 (1996).
91. Q. Pei, O. Inganas, “Electrochemical applications of the bending beam method. 1. Mass transport and vol-
ume changes in polypyrrole during redox”, J. Phys. Chem. 96 (25) 10507-10514 (1992).
92. K. Asaka, K. Oguro, “Bending of polyelectrolyte membrane platinum composites by electric stimuli: Part
II. Response kinetics”, J. Electroanal. Chem. 480 (1-2) 186-198 (2000).
93. G.G. Láng, M. Ujvári, T.A. Rokob, G. Inzelt, “The brush model of the polymer films–analysis of the im-
pedance spectra of Au,Pt|poly(o-phenylenediamine) electrodes”, Electrochim. Acta 51 (8-9) 1680-1694
(2006).
94. M Ujvári, M. Takács, S. Vesztergom, F. Bazsó, F. Ujhelyi, G.G. Láng, “Monitoring of the electrochemical
degradation of PEDOT films on gold using the bending beam method”, Solid State Electrochem 15(11)
2341–2349 (2011).
95. G.G. Láng, M. Ujvári, F. Bazsó, S. Vesztergom, F. Ujhelyi, “In situ monitoring of the electrochemical deg-
radation of polymer films on metals using the bending beam method and impedance spectroscopy”, Elec-
trochim. Acta 73 59-69 (2012).
96. M Ujvári, G.G. Láng, S. Vesztergom, K.J. Szekeres, N. Kovács, J. Gubicza, “Structural changes during the
overoxidation of electro-chemically deposited poly(3,4-ethylenedioxythiophene) films” J. Electrochem.
Sci. Eng. 6(1) 77-89 (2015).
97. G.G. Láng, M. Ujvári, S. Vesztergom, V. Kondratiev, J. Gubicza, K.J. Szekeres “The Electrochemical Deg-
radation of Poly(3,4-ethylenedioxythiophene) Films Electrodeposited from Aqueous Solutions” Z. Phys.
Chem. 230 (9) 1281–1302 (2016).
98. M. Ujvári, S. Vesztergom, Cs.B. Pénzes, G.G. Láng “Changes of the interfacial stress with electrode poten-
tial in the Ru|0.1 M perchloric acid system” Electrochem. Comm. 28 111-113 (2013).
99. G.G. Láng, M. Ujvári, S. Vesztergom “Electrochemical Reduction of Perchlorate Ions on Ruthenium” Acta
Chim. Slov. 61 (2) 233–240 (2014).
100. C. Klein, R. P. Miller, “Strains and stresses in multilayered elastic structures: The case of chemically vapor-
deposited ZnS/ZnSe laminates”, J. Appl. Phys. 87 (5) 2265-2272 (2000).
28
101. C. Klein, “How accurate are Stoney’s equation and recent modifications” J. Appl. Phys. 88 (9) 5487-5489
(2000).
102. J.M. Pureza, M.M. Lacerda, A.L. De Oliveira, J.F. Fragalli, R.A. S. Zanon, “Enhancing accuracy to Stoney
Equation” Appl. Surf. Sci. 255 6426-6428 (2009).
103. J.M. Pureza, F. Neri, M.M. Lacerda, “Stoney equation limits for samples deformed as a cylindrical surface”
Appl. Surf. Sci. 256 4408-4410 (2010).
104. G.C.A.M. Janssen, M.M. Abdalla, F. van Keulen, B R. Pujada, B. van Venrooy “Celebrating the 100th anni-
versary of the Stoney equation for film stress: Developments from polycrystalline steel strips to single crystal
silicon wafers” Thin Solid Films 517 1858-1867 (2009).
105. T.A. Rokob, G.G. Láng, “Remarks on the electrochemical application of optical methods for the determina-
tion of stress in electrodes”, Electrochim. Acta 51 (1) 93-97 (2005).
106. J.-F. Vanhumbeeck, J. Proost, “Electrochemical processing of ultrathin metallic oxides featuring in-situ
monitoring of growth stress transitions”, ECS Trans. 2 (6) 281-294 (2007).
107. J.-F. Vanhumbeeck, J. Proost, “On the contribution of electrostriction to charge-induced stresses in anodic
oxide films” Electrochim. Acta 53 (21) 6165-6172 (2008).
108. J.A. Floro, E. Chason, “Measuring Ge segregation by real‐ time stress monitoring during Si1−xGex molecu-
lar beam epitaxy” Appl. Phys. Lett. 69 (25) 3830-3832 (1996).
109. S. Hearne, E. Chason, J. Han, J. A. Floro, J. Figiel , J. Hunter, H. Amano, I. S. T. Tsong “Stress evolution
during metalorganic chemical vapor deposition of GaN” Appl. Phys. Lett. 74 356-358 (1999).
110. J. Proost, F. E. Spaepen, “Evolution of the growth stress, stiffness, and microstructure of alumina thin films
during vapor deposition”, J. Appl. Phys. 91 (1) 204-216 (2002).
111. Q. Van Overmeere, J.-F. Vanhumbeeck , J. Proost “On the use of a multiple beam optical sensor for in situ
curvature monitoring in liquids” Rev. Sci. Instrum. 81 045106 (2010).
112. J.-F. Vanhumbeeck, J. Proost “In-situ monitoring of the growth stress evolution during galvanostatic ano-
dizing of aluminum thin films”. In:Moffat TP, Stickney J, Deligianni H, Dukovic J (eds) ECS Transactions.
Electrochemical Society, Pennington NJ (2007).
113. J.-F. Vanhumbeeck, J. Proost J “On the contribution of electrostriction to charge-induced stresses in anodic
oxide films” Electrochim. Acta 53 6165-6172 (2008).
114 Q. Van Overmeere, B. Nysten, J. Proost “In situ detection of porosity initiation during aluminum thin film
anodizing” Appl. Phys. Lett. 94 074103 (2009)
115. Q. Van Overmeere, F. Blaffart, J. Proost “What controls the pore spacing in porous anodic oxides?” Elec-
trochem. Comm. 12 1174-1176 (2010).
116. G.G. Láng, M. Seo, “On the electrochemical applications of the bending beam method” J. Electroanal.
Chem. 490 (1-2) 98-101 (2000).
117. G.G. Láng, T.A. Rokob, G. Horányi, “Comments on “Observation of the surface stress induced in
microcantilevers by electrochemical redox processes” Ultramicroscopy 104 (3-4) 330-332 (2005).
118. G.G. Láng, Comment on “In Situ Measurements of Stress-Potential Coupling in Lithiated Silicon” [J. Elec-
trochem. Soc., 157, A1253 (2010)], “On Plastic Deformation and Fracture in Si Films during Electrochemi-
cal Lithiation/Delithiation Cycling” [J. Electrochem. Soc., 160, A1885 (2013)], and “Real-Time Stress
29
Measurements in Germanium Thin Film Electrodes during Electrochemical Lithiation/Delithiation Cy-
cling” [J. Electrochem. Soc., 162, A2840 (2015)], J. Electrochem. Soc. 163 (7) Y15-Y16. (2016)
119. G.G. Láng, Application of the Koesters Interferometer in Electrochemistry In: D. Halsey, W. Raynor (eds.)
Handbook of Interferometers: Research, Technology and Applications. Hauppauge: Nova Science Publish-
ers, 591-604 (2009).
120. W. Kösters, Interferenzdoppelprisma für Messzwecke, German patent: 595211, 1934
121. K.E. Heusler, G. Láng, „On the Interpretation of Specific Surface Energies at Solid Electrodes. Changes of
the Surface Energy of Gold in Chloride Solution”, Elektrokhimiya 31 826-835 (1995).
122. W. Haiss, J.K. Sass, “Adsorbate-induced surface stress at the solid electrolyte interface measured with an
STM”, J. Electroanal. Chem. 386 (1-2) 267-270 (1995).
123. W. Haiss, J.K. Sass, “Apparent thermodynamic inconsistencies in surface stress measurements of copper
underpotential deposition on Au( 111) electrodes”, J. Electroanal. Chem. 410 (1) 119-124 (1996).
124. W. Haiss, J.K. Sass, “Quantitative surface stress measurements on Au(111) electrodes by scanning tunnel-
ing microscopy”, Langmuir 12 (18) 4311-4313 (1996).
125. W. Haiss, R.J. Nichols, J.K. Sass, K.P. Charle, “Linear correlation between surface stress and surface charge
in anion adsorption on Au(111)”, J. Electroanal. Chem. 452 (2) (1998) 199-202.
126. J. O’M. Bockris, R. Parry-Jones, “Determination of the Relative Electrode Potential of an Uncharged Metal
in Solution”, Nature 171, 930-931 (1953).
127. J. O’M. Bockris, S.D. Argade, “Dependence of friction at wet contacts upon interfacial potential”,
J. Chem. Phys. 50 (10) 1622-1623 (1969).
128. J. O’M. Bockris, R.K. Sen, “Variation of the coefficient of friction with potential for a solid-solution con-
tact: A revised calculation”, Surf. Sci. 30 (1) (1972) 237-241.
129. J. O’M. Bockris in ‘Electrochemistry in Transition’, Eds. O.J. Murphy, S. Srinivasan, B.E. Conway, Ple-
num Press, New York, 1992, p. 288.
130. A.J. Bard, L.R. Faulkner, Electrochemical Methods, John Wiley&Sons, New York, 1980, pp. 499-500.
Copyright © 2022 FDOKUMEN