Experience-dependent modifications of hippocampal place cell firing
19
HIPPOCAMPUS, VOL. 1, NO. 2, PAGES 193-206, APRIL 1991 Experience-dependent Modifications of Hippocampal Place Cell Firing Elizabeth Bostock,* Robert U. Muller,” and John L. Kubie-i- Departments of *Physiology and ?Anatomy and Cell Biology, SUNY Health Sciences Center at Brooklyn, 450 Clarkson Avenue, Brooklyn, NY 11203 U.S.A. ABSTRACT Understanding the empirical rules that regulate alterations of hippocampal firing fields will enhance our understanding of hippocampal function. The current study sought to extend previous research in this area by examining the effect of substituting a new stimulus for a familiar stimulus in a familiar environment. Hippocampal place cells were recorded while rats chased food pellets scattered onto the floor of a cylindrical apparatus with a white cue card affixed to the apparatus wall. Once a place cell had been recorded in the presence of the white card, the white card was replaced by a black card of the same size and shape. The place cell was then recorded in the presence of the black card. Thirty-six cells were recorded using this procedure. All cells had stable firing fields in the presence of the white card. Both the white and black cards had stimulus control over place cell firing; generally, rotation of either card caused an equal rotation of the firing fields present. When the black card was substituted for the white card, place cells showed time-variant changes in their spatial firing patterns. The change was such that the spatial firing patterns of the majority of place cells were similar in the presence of the white and black cards during initial black card exposures. During subsequent presentations of the black card, the spatial firing patterns associated with the 2 cards became distinct from each other. Once the differ- entiation of firing patterns had occurred in a given rat, all place cells subsequently recorded from that rat had different firing patterns in the presence of the white and black cards. The findings are discussed relative to sensory-, motor-, attentional-, and learning-related interpretations of hippocampal function. It is argued that the time-variant alteration of place cell firing fields ob- served following exposure to a novel stimulus in this study reflects an experience-dependent modification of place cell firing patterns. Key words: hippocampal place cells, cognitive maps, spatial representation, hippocampal plasticity Place cells are hippocampal pyramidal cells that can be recorded from freely moving rats (O’Keefe and Dostrovsky , 1971; O’Keefe, 1976). They are characterized by their prop- erty of location-specific firing. Place cells are intensely active only when the rat’s head is in a single portion of a familiar recording chamber; the region of rapid discharge will be re- ferred to as the cell’s “firing field.” As the head moves from the field center to the edge, the time-averaged firing rate de- creases rapidly and is virtually zero outside the field. Lo- cation-specific firing is currently interpreted in terms of the spatial theory of hippocampal function proposed by O’Keefe and Nadel (1978). In this view, the hippocampus is part of a representation of the environment and the place cell popu- Correspondence and reprint requests to Elizabeth Bostock, Depart- ment of Psychology, Queens College-City University of New York, 65-30 Kissena Boulevard, Flushing, NY 11367 U.S.A. lation can signal the rat’s position because firing fields are dispersed over the surface of the chamber. In a fixed envi- ronment, firing fields are stable over intervals of a week (Mul- ler et al., 1987) or months (Best and Thompson, 1984). The individual spatial firing patterns of place cells vary strongly with changes of the environment. A cell with a firing field in one chamber may be virtually silent in a second (Mul- ler and Kubie, 1987). It is also possible for a cell to have fields in 2 chambers, such that the locations and other prop- erties of the fields are apparently unrelated. In the extreme case, if 2 chambers are “sufficiently” different, knowing a cell’s spatial firing pattern in one is of no value in predicting its pattern in the second. For example, in a cylinder and a rectangular box of similar appearance, about half of the cells have fields in only one and are silent in the other. If a cell has a field in both chambers, the field position in the cylinder does not predict where the field is in the rectangle (Muller 193
Transcript of Experience-dependent modifications of hippocampal place cell firing

HIPPOCAMPUS, VOL. 1, NO. 2, PAGES 193-206, APRIL 1991
Experience-dependent Modifications of Hippocampal Place Cell Firing
Elizabeth Bostock,* Robert U. Muller,” and John L. Kubie-i-
Departments of *Physiology and ?Anatomy and Cell Biology, SUNY Health Sciences Center at Brooklyn, 450 Clarkson Avenue, Brooklyn,
NY 11203 U.S.A.
ABSTRACT
Understanding the empirical rules that regulate alterations of hippocampal firing fields will enhance our understanding of hippocampal function. The current study sought to extend previous research in this area by examining the effect of substituting a new stimulus for a familiar stimulus in a familiar environment. Hippocampal place cells were recorded while rats chased food pellets scattered onto the floor of a cylindrical apparatus with a white cue card affixed to the apparatus wall. Once a place cell had been recorded in the presence of the white card, the white card was replaced by a black card of the same size and shape. The place cell was then recorded in the presence of the black card. Thirty-six cells were recorded using this procedure. All cells had stable firing fields in the presence of the white card. Both the white and black cards had stimulus control over place cell firing; generally, rotation of either card caused an equal rotation of the firing fields present. When the black card was substituted for the white card, place cells showed time-variant changes in their spatial firing patterns. The change was such that the spatial firing patterns of the majority of place cells were similar in the presence of the white and black cards during initial black card exposures. During subsequent presentations of the black card, the spatial firing patterns associated with the 2 cards became distinct from each other. Once the differ- entiation of firing patterns had occurred in a given rat, all place cells subsequently recorded from that rat had different firing patterns in the presence of the white and black cards. The findings are discussed relative to sensory-, motor-, attentional-, and learning-related interpretations of hippocampal function. It is argued that the time-variant alteration of place cell firing fields ob- served following exposure to a novel stimulus in this study reflects an experience-dependent modification of place cell firing patterns.
Key words: hippocampal place cells, cognitive maps, spatial representation, hippocampal plasticity
Place cells are hippocampal pyramidal cells that can be recorded from freely moving rats (O’Keefe and Dostrovsky , 1971; O’Keefe, 1976). They are characterized by their prop- erty of location-specific firing. Place cells are intensely active only when the rat’s head is in a single portion of a familiar recording chamber; the region of rapid discharge will be re- ferred to as the cell’s “firing field.” As the head moves from the field center to the edge, the time-averaged firing rate de- creases rapidly and is virtually zero outside the field. Lo- cation-specific firing is currently interpreted in terms of the spatial theory of hippocampal function proposed by O’Keefe and Nadel (1978). In this view, the hippocampus is part of a representation of the environment and the place cell popu-
Correspondence and reprint requests to Elizabeth Bostock, Depart- ment of Psychology, Queens College-City University of New York, 65-30 Kissena Boulevard, Flushing, NY 11367 U.S.A.
lation can signal the rat’s position because firing fields are dispersed over the surface of the chamber. In a fixed envi- ronment, firing fields are stable over intervals of a week (Mul- ler et al., 1987) or months (Best and Thompson, 1984).
The individual spatial firing patterns of place cells vary strongly with changes of the environment. A cell with a firing field in one chamber may be virtually silent in a second (Mul- ler and Kubie, 1987). It is also possible for a cell to have fields in 2 chambers, such that the locations and other prop- erties of the fields are apparently unrelated. In the extreme case, if 2 chambers are “sufficiently” different, knowing a cell’s spatial firing pattern in one is of no value in predicting its pattern in the second. For example, in a cylinder and a rectangular box of similar appearance, about half of the cells have fields in only one and are silent in the other. If a cell has a field in both chambers, the field position in the cylinder does not predict where the field is in the rectangle (Muller
193

194 HIPPOCAMPUS VOL. 1, NO. 2, APRIL 1991
and Kubie, 1987). Recently, Thompson and Best (1989) recorded place cells in 3 different enclosures. They showed that the statistics of field occurrence for individual place cells imply that independent subsets of the population are active (have fields) in each enclosure.
The independent spatial firing of individual cells in suffi- ciently different environments strongly implies that the hip- pocampus can maintain independent representations of sev- eral environments (see McNaughton and Morris, 1987). The stability of spatial firing patterns in each environment further implies that the representation that is active at a given time is determined by the current surroundings; a given represen- tation is reliably reactivated by returning the rat to the ap- propriate environment. Each representation is therefore sta- tionary, or in a “steady state.”
Following O’Keefe and Nadel (1978), the representation in each environment will be called a “map.” Here, the term is extended to mean that an environment-specific subset of place cells is active, and that each active cell has an envi- ronment-specific firing field. It is also convenient to use the term “remapping” to describe the effects of changes in the surroundings on the place cell population. Remapping is the transformation from the hippocampal representation of a “standard” chamber to the representation of a different chamber. Remapping emphasizes chunges in the active sub- set and in the characteristics of individual cells. We will say that a remapping is “complex” when the spatial firing pat- terns of all cells are unpredictable from one environment to the other, or in other words, when the 2 maps are indepen- dent, as is true when the shape of the apparatus was changed.
Not all pairs of environments are associated with indepen- dent maps. For example, corotations of selected cues within a circular curtain produce equal rotations of all firing fields, with no change in the subset of active cells (O’Keefe and Conway, 1978; Muller and Kubie, 1987). Cue rotation does not disturb the internal consistency of the original map since the relative positions of firing fields are unchanged. For these reasons, we will say that the same map is used in the initial and rotated conditions or that the remapping is “rotational.”
Intermediate possibilities exist between rotational and complex maps for environment pairs. For example, Muller and Kubie (1987) found that putting a barrier into previously open space usually suppressed fields near the barrier but left distant fields unaffected. This suggests that the barrier caused only local changes of the map. In the presence or absence of the barrier, the maps have highly overlapping, active cell sub- sets, and the fields of most active cells are unaltered. The barrier may be said to cause a partial remapping.
The idea that map pairs may differ to one extent or another leads to 2 general areas of inquiry. First, it is possible to ask how maps are related when the rat is familiar with both sit- uations, so that the maps are in the steady-state. Such work leads to empirical rules about the degree of remapping as- sociated with various environmental manipulations. For ex- ample, O’Keefe and Speakman (1987) showed that moving the goal position in a 4-arm maze relative to a set of fixed cues had no effect on the location of firing fields relative to the cues; the steady-state remapping was null. In contrast, Breese et al. (1989) observed that spatial firing often occurred mainly near 1 of 5 water cups when water was available at
all 5. When water availability was restricted to a single cup, firing occurred only in its vicinity.
It is of interest to know if the steady-state map in the new environment is reached instantaneously or if there is a delay between the situation change and the time that it takes for the new map to become stable. This issue has received much less attention and is the main focus of this paper. If there is a delay, it can be asked if the steady state in the new sur- roundings was reached smoothly or abruptly. The answer to this question has important theoretical implications. If the remapping is smooth, such that the fraction of cells with in- variant firing fields gradually decreases, the new map would be connected to the original via partial remappings in a way reminiscent of the incremental acquisition of a conditioned response. On the other hand, the idea that hippocampal place cells act together as a meaningful unit would be reinforced if the delayed transition is either synchronous and abrupt for all cells or if all cells changed their place fields together but the rate of change was smooth and gradual. The latter findings would be consistent with the notion that the hippocampal map is “holistic,” in the manner proposed by O’Keefe and Speak- man (1987).
These 2 lines of inquiry were addressed in this paper by examining place cell firing following modification of a familiar environment.
MATERIALS AND METHODS
The methods used in this study were similar to those de- scribed in detail in Muller et al. (1987), which provides de- scriptions of electrode construction, surgery, single-unit re- cording, and rat-tracking procedures.
Rats
The sample of place cells was recorded from 13 female Long-Evans rats. Rats were housed in the animal colony of the Physiology Department, SUNY-Brooklyn. The colony was on a 12/12 hour light/dark cycle with lights on at 6:OO A . M . Water was available ud libitum in the home cage at all times. Prior to training, rats were reduced to approximately 80% of their free feeding weight and maintained at that weight throughout the experiment by feeding them a premeasured amount of rat chow at the end of each day.
Apparatus and training
Rats were trained in a 76 cm diameter, 5 1 cm high cylinder. The gray, bottomless cylinder was placed on a piece of gray, photographic backdrop paper that served as a renewable floor. The cylinder was surrounded by a circular curtain (213 cm diameter) to minimize extraapparatus information avail- able to the rat. Throughout training, a white card (the full height of the cylinder and 100” of internal arc wide) was present in its “standard” position, centered at 3 o’clock as viewed from an overhead TV camera. Rats were trained to chase 20 mg Bioserve pellets (Frenchtown, NJ) scattered onto the cylinder floor at approximately 3 per minute. Train- ing lasted for 10 minutes a day, 5 days a week until rats chased food pellets at least 80% of the time. Training took between 5 and 30 days.

MODIFICATION OF PLACE CELL FIRING / Bostock et al. 195
Surgery and recording
Following training, a bundle of 10 Formvar-coated, ni- chrome wires 25 pm thick (Kubie, 1984) was implanted above the CA1 layer of the dorsal hippocampus. Electrodes were implanted at an 8" angle, relative to the midline. The coor- dinates used for implantation varied from 3.0 to 4.5 mm pos- terior to bregma, and 2.7-4.0 mm lateral to bregma. The tra- jectory of the electrode track was such that the electrode usually traversed areas CAlb and CA3c.
Three to seven days of recovery were allowed before re- cording. Recordings were done between 7:OO A . M . and 9:OO P . M . The 10 electrodes of each rat were checked several times a day for well-isolated complex-spike cells. Screening was carried out as the rat ran in the cylinder with the white card affixed to the wall in the standard location. Recordings were made with a cable that contained FET source followers at the end attached to the electrodes. The output of the FETs was amplified ( x 2000) and band-pass filtered (30-10,000 Hz).
A unit was a candidate for inclusion in the sample if it was a complex-spike cell and if it had a clear firing field in the cylinder. The unit was considered a complex-spike cell if it generated bursts of spikes with a decrementing amplitude, and if the duration of the negative phase of the waveform was between 300 and 600 ps (Fox and Ranck, 1981). The unit was considered a place cell if it showed elevated firing (> 10 action potentials/s) in 1 or 2 restricted regions of the cylinder and was virtually silent in other regions. Unitary waveforms were isolated with an analog delay line and a series of 3 timeiamplitude window discriminators (Bak DIS-I, Rock- ville, MD). Acceptance pulses from the third discriminator were counted as spikes. Once a unit fulfilled these criteria, the rat was returned to its home cage for at least 30 minutes. If the unitary waveform had not changed when the recording cable was reattached, formal recording sessions were run. If the waveform no longer passed through the discriminator windows, the discriminator settings were readjusted and the sequence was repeated. These precautions were based on our previous experience that a cell would remain stable for long times, so long as its waveform did not change between 2 suc- cessive attachments of the recording cable.
Recording sessions were run at a maximum rate of 2 per hour. The rat was returned to its home cage between re- cording sessions. All stimulus manipulations were done while the rat was in its home cage. The rat was wrapped in a lab coat when it was brought into the recording environment, and placed into the apparatus at 1 of the 4 cardinal points of the cylinder (3:00, 6:00, 9:00, or 12:OO). The entry point for each session was chosen randomly. Most recording sessions were 16 minutes in duration, although 8-minute sessions were sometimes run during long sequences. During the session, the rat chased food pellets thrown into the apparatus over the curtains at a rate of approximately 3 per minute.
For tracking, a pair of small incandescent bulbs was at- tached to the rear of the rat's headstage, approximately be- tween the ears. The output of an overhead video camera was fed to a spot detector that digitized the X and Y positions of the headlights with 64 x 64 resolution. Each small rectan- gular region (pixel) in the 64 x 64 grid was initially 2.8 cm x 3.4 cm. In later work, each pixel was a square 2.9 crn on
a side. Sixty times per second, the X and Y positions of the light bulbs and the number of spikes fired since the last sample were sent to the computer. Data were stored on floppy discs and analyzed off-line.
The general protocol was to record a cell in the presence of the white card, followed by sessions during which the cell was recorded in the presence of the black card. A typical sequence of sessions was:
White card in standard position: Documents original firing pattern White card in rotated position: Checks for stimulus control by white card Black card in standard position: Documents black card fir- ing pattern Black card in rotated position: Checks for stimulus control by black card White card in standard position: Checks stability of original field
All cells for which at least 1 white card and 1 black card session were recorded were included in the data set. Although the opportunities for recording from the same cell for many days were rare, the first cell or cell pair recorded from each animal was followed until a firing pattern change was seen in the presence of the black card. Once the first cell was lost, other cells were recorded from the same rat. Of the 36 cells recorded, 19 were from CAI and the remainder from CA3/hilus. No differences were seen between cells from the 2 pyramidal layers, and no further mention will be made of anatomical locus.
When a single electrode pass was complete for a rat, an anodal current (18 pA for 15 seconds) was passed through the tip of one of the recording electrodes. Forty-micron fro- zen sections were cut and stained with cresyl violet. The depth from the bottom of the electrode track to the CAI and CA3 layers of the hippocampus was estimated and compared to the estimated depth at which each cell was recorded. There were never any ambiguities about the assignment of complex- spike cells to the CA1 or CA3 layers.
Analysis of spatial firing patterns
The location and spike strings were sorted into two 64 X
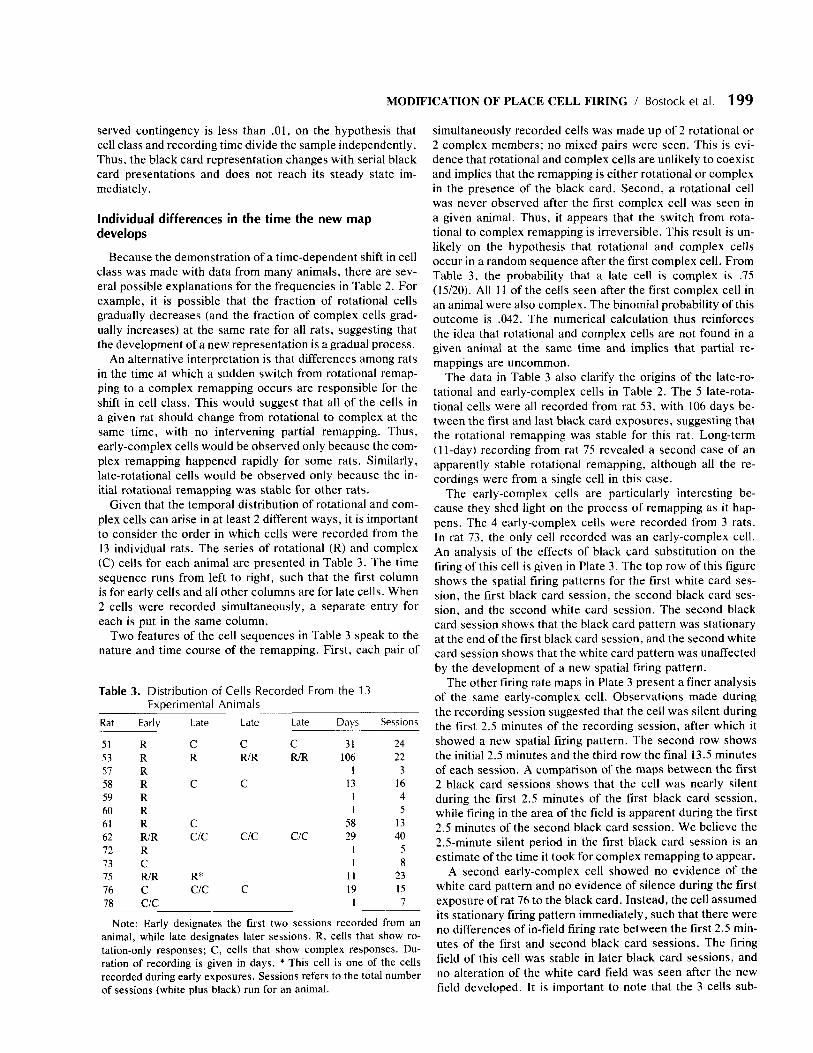
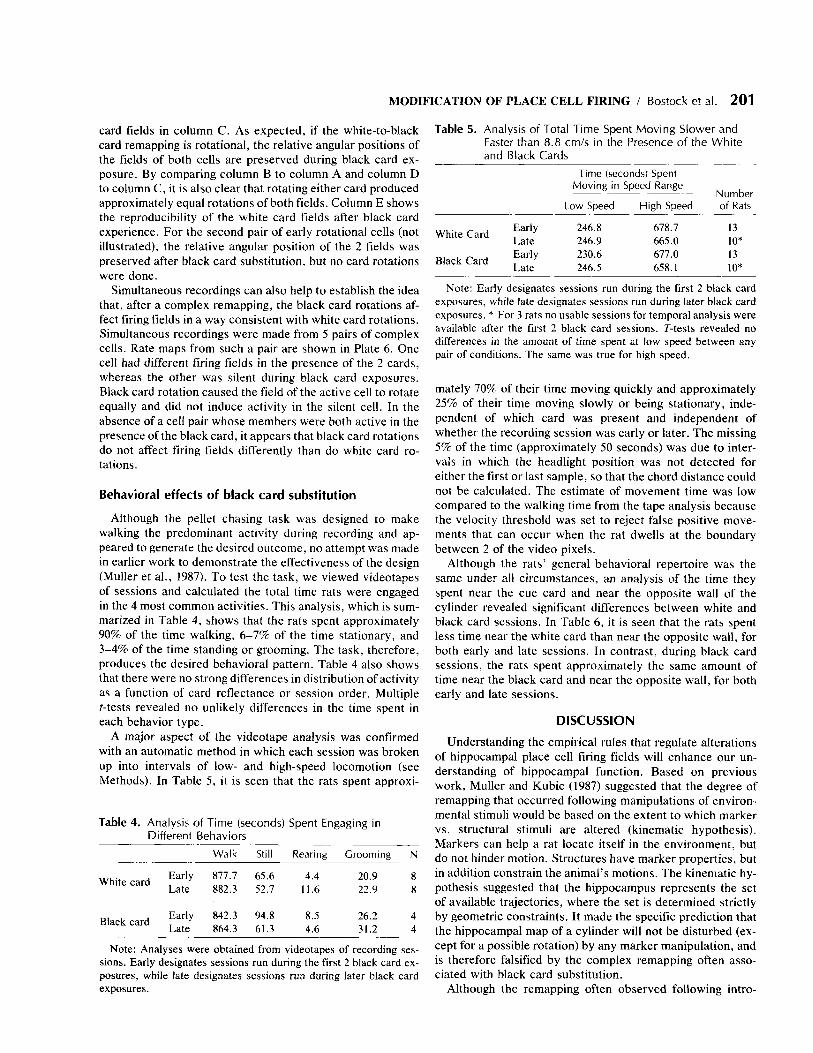
64 arrays. The first (time) array counted the number of sam- ples for which the rat was detected in each pixel. The second (spike) array counted the number of spikes that were fired while the rat was in each pixel. A rate array was formed by dividing each element of the spike array by the corresponding element in the time array. A color-coding scheme was used to visualize rate arrays such that white represented pixels that were never visited and yellow represented visited pixels in which the cell never fired. The color sequence orange, red, green, blue, purple represented increasing firing rates. The number of pixels in each color category was scaled against the number of pixels in the next lower category so that the ratio was 0.8. Examples of place cell firing patterns visualized with this scheme are shown in Plates 1 and 2 .
After the sample was collected, the experimenters devel- oped a method for classifying the effects of the black card on the spatial firing patterns of individual place cells. The

196 HZPPOCAMPUS VOL. 1, NO. 2, APRIL 1991
binary sorting method was based on the effects of several manipulations of the environment reported by Muller and Kubie (1987). Briefly, Muller and Kubie (1987) showed that certain manipulations (e.g., cue card rotation) invariably re- sulted in approximately equal rotations of the spatial firing pattern. In contrast, other manipulations (e.g., changing the apparatus shape) caused the spatial firing pattern to change shape, radial position, and size or resulted in a cell being virtually silent in the changed environment. In this paper, color-coded rate maps for pairs of white and black card ses- sions for the same cell were compared to determine if the 2 patterns were rotated versions of each other or if the pattern in the presence of the black card differed by a change in field shape, radial position, and size (including disappearance of firing fields). Cells with white and black card session pairs whose firing patterns could be superimposed by a rotation will be said to show a “rotational” remapping. In contrast, cells whose spatial firing patterns could not be superimposed by rotation will be said to show a “complex” remapping in the presence of the black card. Both rotational and complex categories could be further subdivided, that is, silent vs. ac- tive. Because no obvious correlates of these subclasses were observed, these subdivisions are not analyzed in this paper.
The initial judgments were made by the experimenters. Subsequently, 4 naive people were trained to compare spatial firing patterns from pairs of maps, and the judgments made by these raters were used for the primary classification. For training, 10 pairs of maps were composed to serve as ex- amples of rotational and complex effects. Five pairs were taken from standard and rotated white card sessions for in- dividual cells recorded in earlier work. Each member of the other pairs was taken from a different place cell, where the firing patterns of the 2 cells were judged to exemplify the complex response change. The raters were told to decide if the 2 maps of a pair could or could not be superimposed by rotation. They were then shown the map pairs one at a time. After a single exposure to the 10 training pairs, the raters were shown white and black card firing rate maps from pairs of sessions for the 36 cells in the study. For each cell, the black card map used for comparison was the map from the last black card session run for a cell on a given day. In cases where a cell was recorded for multiple days, these classifi- cations were done for the first and last day of recording. For the purpose of formal analysis, each cell could be considered only once. Therefore, classifications from the first day of re- cording were used for analysis. The rotational/complex de- cisions were analyzed for reliability with the method of Max- well and Pilliner (1968).
To check the validity of the raters’ judgments, a numerical method was developed to measure how well a pair of spatial firing patterns could be superimposed by a rotation. “Ro- tational similarity” (for brevity, similarity) was estimated by calculating the pixel-by-pixel correlation between the 2 spa- tial patterns 360 times, as the pattern for the second session was rotated in I ” steps against the pattern for the first session. Similarity was taken as the standard (z) score of the maximum correlation (MacNemar, 1969). The number of firing rate pairs for calculating similarity was approximately 500, the number of pixels in the apparatus area. Similarities more ex- treme than 0.09 are significantly different from zero at the
0.05 level, according to the t-distribution with 500 degrees of freedom.
The angle at which the maximum correlation occurred was taken as the rotation of the firing field in the second session relative to the first. The “angular deviation” for second ses- sions was taken as the angular distance between the expected field position (on the basis of the cue card position) and the actual field position. The mean angular deviation for repli- cations of a manipulation was calculated as:
arctan(x sin d i / x cos di),
where di is the angular deviation for each cell. The length of the mean angular deviation vector (maximum of 1 .O) was cal- culated as:
l / n [ ( z sin di)’/(X cos dJ2],
where n is the number of cells. The length of the mean vector was used to test for clustering of individual angular deviations according to the Rayleigh test (Batschelet, 1981).
Analysis of behavioral data
Three measurements were made of the rat’s behavior in the presence of the white and black cards. First, data from the automatic tracking system were used to determine the amount of time the rat was stationary or moving less than 8.8 cm/s and moving greater than 8.8 cmis. The cutoff speed of 8.8 cm/s arose from the use of an integration interval of 0.5 seconds, during which the rat had to move at least 4.4 cm. the diagonal size of a pixel. This ensured that small head movements near pixel boundaries were not classified as high- speed movements.
The second method of analysis determined the amount of time the rat spent in front of the cue card and in front of the diametrically opposite wall. The total dwell time was calcu- lated in an annular sector 60” wide, centered on the cue card and the opposite wall. The radial dimension of the sector was 7 cm.
Finally, videotapes of the rat’s behavior during formal re- cording sessions were rated by a naive viewer to determine the amount of time the rat spent in each of 4 behavioral states. The 4 behavioral categories were grooming, standing, sta- tionary while horizontal, and walking. The fraction of time spent standing and grooming was very small in all cases (max- imum, 1.0% of total time). While other discrete behavioral categories could not be distinguished on the videotapes (e.g.. myotactic sniffing), direct observation during recording ses- sions revealed these also to be very infrequent,
These behavioral analyses were applied to the first black card session for a rat and to the immediately preceding white card session. Where possible, these measures were also ap- plied to a later (at least the third) black card session and its immediately preceding white card session. These procedures allowed a partial characterization of the behavioral effects of serial exposures to the black card.

MODIFICATION OF PLACE CELL FIRING / Bostock et al. 197
RESULTS
Effects of black card substitution on individual place cells
The sample of 36 place cells was separated into 2 classes that correspond to effects seen in earlier work (Muller and Kubie, 1987). For cells in the “rotational” class, the firing field in the presence of the black card can be superimposed on the field in the presence of the white card just by a rotation. The precedent for this class is the observation that other white card manipulations caused only firing field rotations (Muller and Kubie, 1987). For cells in the “complex” class, spatial firing either ceased in the presence of the black card or changed such that the white and black card fields could not be superimposed by rotation. The precedent for this class is the observation that changes in the shape of the chamber produced complex changes in spatial firing patterns.
To demonstrate that the entire sample could be reliably separated into rotational and complex cells, rate map pairs for each cell were shown to 4 naive raters who were asked to judge if the 2 spatial firing patterns could or could not be superimposed with a rotation. All 4 raters classified 33 of the 36 cells in the same way. For the remaining 3 cells, 3 of the 4 raters made the same classification, which was also the classification made by the experimenters. The “agreement correlation” for the ratings was r = 0.98. On the hypothesis that the true value of r is zero, t = 49.0 (P < .001).
The raters classified 17 of the 36 cells as rotational and the remaining 19 cells as complex. Of the 19 complex cells, 10 became virtually silent in the presence of the black card, and the other 9 were considered to show unrelated firing fields. The mean similarity of white card/black card session pairs for rotational cells was 0.56 (range, 0.22-0.75) and for com- plex cells was 0.16 (range, -0.05-0.48). The results of a t- test between these means (t = 8.22; df = 34; P < .001) strongly support the idea that sorting of cells by visual in- spection produces a meaningful dichotomy.
Examples of cells that fall unambiguously into 1 of the 2 classes are shown in Plates 1 and 2 . Plate 1 shows a pair of rate maps for each of 3 rotational cells from 3 different rats. The left map of each pair was recorded in the presence of the white card, whereas the right map was recorded in the pres- ence of the black card. In each case, the white and black card firing fields are similar in shape, size, and distance from the apparatus center and differed at most in angular position. For the examples in rows 1 and 3, the white and black card fields are at the same angular position, whereas the example in row 2 shows a clear rotation of an otherwise unchanged field. Plate 2 shows rate map pairs for 3 complex cells. The cell illustrated in row 2 became nearly silent in the presence of the black card, whereas the other 2 cells developed firing fields whose shape, size, radial position, and angular position were different than the corresponding white card fields.
A numerical sorting method provides additional evidence that place cells respond in 2 ways to black card substitution. For 34 cells, a “normalized similarity” score was calculated. Normalized similarity is the ratio of 2 similarity values, such that the similarity for a white/black session pair is divided by the similarity for a white/white session pair. Normalization is useful because cells differ according to the reliability of
NORMALIZED SIM I LARlTY
Fig. 1 . Normalized similarity histogram for 34 place cells recorded in the presence of the white and black cards. The distribution is multimodal, but further analysis (see text and Fig. 2) reveals that a normalized similarity cut-off of 0.45 divides the sample in virtually the same way as did visual inspection by naive raters. Cells with normalized similarity less than the cut-off correspond almost exactly to complex cells, whereas cells with normalized similarity higher than the cut-off correspond almost exactly to rotational cells.
their spatial firing patterns under constant (white/white) con- ditions. This calculation was not made for 2 cells because no second white card session was done.
When the normalized similarity scores are presented as a histogram (Fig. l ) , the distribution has 4 modes but suggests that a class boundary exists between the minima near 0.35 and 0.65. If there are really 2 classes for normalized similarity, most rotational cells should have high values and most com- plex cells low values. Additional analysis shows that the class boundary for normalized similarity can be selected so as to produce nearly exact correspondence with the classes made from visual inspection. The relationship between the number of cells for which there is agreement and the class boundary is shown in Figure 2. The function reaches a maximum when the boundary is at 0.45, where there is disagreement for only 1 of 34 cells. The probability of this outcome approaches zero on the hypothesis that the classifications by normalized simi- larity and visual inspection are independent (Table I) .
The nature of the 2 cell classes is shown in a different way in Figure 3, where the similarity of spatial firing patterns is plotted against the angular deviation of spatial firing patterns in the presence of the black card (black symbols). Rotational cells are shown as filled triangles, and complex cells (with fields in the presence of both cards) are shown as filled squares. The open squares are similarity/angular-deviation points for pairs of identical white card sessions and show the high reproducibility of place cell firing under constant con- ditions.
The higher mean similarity for rotational cells compared to complex cells is apparent in Figure 3. In addition, the angular deviations for rotational cells appear to be clustered nearer to o”, the angle at which the 2 cards are lined up. To test this impression, the length of the Rayleigh vector (see Materials and Methods) calculated for 1 1 rotational cells was 0.54 (P = .039), and its direction was 18”. Thus, the angular position of the field in the presence of the white card predicts the

198 HIPPOCAMPUS VOL. 1, NO. 2, APRIL 1991
I . . , - . , - - , . -
t 0.2 0.4 0.6 0.8
NORMALIZED SIMILARITY CUTOFF Fig. 2. Correspondence between sorting by normalized simi- larity and by visual inspection of firing rate maps. The 2 clas- sification methods are in agreement for 33/34 cells when the cut-off for normalized similarity is set to 0.45.
angular position of the field in the presence of the black card, consonant with the idea that the same map is used in both cases. Six rotational cells are not shown in Figure 3 because their spatial firing patterns were known to not rotate along with rotations of the black card (see below). If they are in- cluded, the probability of the outcome is not changed by much (Rayleigh vector = 0.41; P = .053). In contrast to ro- tational cells, the 9 complex cells that had fields in the pres- ence of both cards have angular deviations that are more broadly dispersed. The length of the Rayleigh vector for this case was 0.24 (P = .65), which indicates a random circular distribution. Thus, there is no correspondence between the angular position of field pairs for complex cells, suggesting that 2 different maps are used.
Time variation of the effects of black card substitution
Having established that cells recorded in the presence of the black card fall into 2 classes, it is important to determine if there is any distinct tendency of either rotational or com-
Table 1. CorresDondence Between Visual Assignment of Firing Pattern Similarity and Normaliged Similarities _ _ ~ - __ ________ ~
Visual Assignment of Response
Rotation-only Complex - - _ _ _ ~ _ _ _ ~
- ~ ~ ~ - . _ _ _ _ ___ ____
>0.45 C0.45 Normalized Similarity
15 0
1 18
The unit frequencies in this table show that the normalired simi- larity of whiteiblack session pairs is an extremely good predictor of visual classification of place cell responses as rotation-only o r global. A Fisher’s Exact test of probability showed that the clustering of similarityiresponse pairs in the upper left and lower right cells was extremely unlikely to have occurred by chance ( P < ,001 ). Calcu- lation of the normalized similarity required 2 standard white card sessions for each unit. This requirement was met for 34/36 cells in the sample.
A
A
-.- , - 1 80 - 9 0 d 90 1 8 0
AN G U LAR D EVI AT I0 N Fig. 3 . Similarity of white and black card spatial firing pat- terns plotted as a function of angular deviation. Angular de- viation is the number of degrees by which the black card pattern must be rotated in order to produce the highest pixel- by-pixel correlation between the white and black card firing patterns. Similarity is the correlation between 2 superim- posed rate maps. Rotational cells are shown as filled triangles and complex cells are shown as filled squares.
plex cells to occur at a particular time in the sequence of black card exposures. To this end, the rotational and complex cell samples were independently sorted, according to whether they were recorded during early or late black card sessions for each rat. A cell was put into the “early” group if it was recorded during the first day the black card was presented to a rat. Generally, 2 black card sessions were done on the first day; often, one of these was a black card rotation session. Fifteen of the 16 cells recorded during early black card ses- sions had the same place field for both sessions. For the re- maining cell, as mentioned previously, classification of cells as rotationalicomplex was done on the last black card session recorded on a given day. The cell was put into the “late” group if it was recorded during black card sessions on the second and subsequent recording days for the rat.
The contingency between cell class and recording time is shown in Table 2 . A Fisher’s Exact probability calculation reveals a strong temporal effect of black card exposure on the cell type, such that early cells are generally rotational and late cells are generally complex. The probability of the ob-
Table 2. Effect of Experience on Place Cell Responses to Black Card Substitution
Visual Assignment of Response
Rotation-on1 y Complex
Early” Black Card Session Later+
11 5
4 15
* Early means first 2 exposures to the black card. t Later means third and additional exposures to the black card. A Fisher’s Exact test of probability showed that the clustering of session-orderhe- sponse pairs into the upper left and lower right cell of the table is unlikely to have occurred by chance (P < .01).
MODIFICATION OF PLACE CELL FIRING / Bostock et al. 199
served contingency is less than .01, on the hypothesis that cell class and recording time divide the sample independently. Thus, the black card representation changes with serial black card presentations and does not reach its steady state im- mediately.
individual differences in the time the new map develops
Because the demonstration of a time-dependent shift in cell class was made with data from many animals, there are sev- eral possible explanations for the frequencies in Table 2 . For example, it is possible that the fraction of rotational cells gradually decreases (and the fraction of complex cells grad- ually increases) at the same rate for all rats, suggesting that the development of a new representation is a gradual process.
An alternative interpretation is that differences among rats in the time at which a sudden switch from rotational remap- ping to a complex remapping occurs are responsible for the shift in cell class. This would suggest that all of the cells in a given rat should change from rotational to complex at the same time, with no intervening partial remapping. Thus, early-complex cells would be observed only because the com- plex remapping happened rapidly for some rats. Similarly, late-rotational cells would be observed only because the in- itial rotational remapping was stable for other rats.
Given that the temporal distribution of rotational and com- plex cells can arise in at least 2 different ways, it is important to consider the order in which cells were recorded from the 13 individual rats. The series of rotational (R) and complex (C) cells for each animal are presented in Table 3. The time sequence runs from left to right, such that the first column is for early cells and all other columns are for late cells. When 2 cells were recorded simultaneously, a separate entry for each is put in the same column.
Two features of the cell sequences in Table 3 speak to the nature and time course of the remapping. First, each pair of
Table 3. Distribution of Cells Recorded From the 13 Experimental Animals
Rat Early Late Late Late Days Sessions
51 R C C C 31 24 53 R R RIR R/R 106 22 51 R 1 3 58 R C C 13 16 59 R 1 4 60 R 1 5 61 R C 58 13 62 R/R CIC CIC CIC 29 40 12 R 1 5 13 C 1 8 75 RIR R* 11 23 76 C CIC C 19 15 18 CIC 1 7
Note: Early designates the first two sessions recorded from an animal, while late designates later sessions. R, cells that show ro- tation-only responses; c , cells that show complex responses. Du- ration of recording is given in days. * This cell is one of the cells recorded during early exposures. Sessions refers to the total number of sessions (white plus black) run for an animal.
simultaneously recorded cells was made up of 2 rotational or 2 complex members; no mixed pairs were seen. This is evi- dence that rotational and complex cells are unlikely to coexist and implies that the remapping is either rotational or complex in the presence of the black card. Second, a rotational cell was never observed after the first complex cell was seen in a given animal. Thus, it appears that the switch from rota- tional to complex remapping is irreversible. This result is un- likely on the hypothesis that rotational and complex cells occur in a random sequence after the first complex cell. From Table 3, the probability that a late cell is complex is .75 (15120). All 11 of the cells seen after the first complex cell in an animal were also complex. The binomial probability of this outcome is .042. The numerical calculation thus reinforces the idea that rotational and complex cells are not found in a given animal at the same time and implies that partial re- mappings are uncommon.
The data in Table 3 also clarify the origins of the late-ro- tational and early-complex cells in Table 2 . The 5 late-rota- tional cells were all recorded from rat 53, with 106 days be- tween the first and last black card exposures, suggesting that the rotational remapping was stable for this rat. Long-term (1 1-day) recording from rat 75 revealed a second case of an apparently stable rotational remapping, although all the re- cordings were from a single cell in this case.
The early-complex cells are particularly interesting be- cause they shed light on the process of remapping as it hap- pens. The 4 early-complex cells were recorded from 3 rats. In rat 73, the only cell recorded was an early-complex cell. An analysis of the effects of black card substitution on the firing of this cell is given in Plate 3. The top row of this figure shows the spatial firing patterns for the first white card ses- sion, the first black card session, the second black card ses- sion, and the second white card session. The second black card session shows that the black card pattern was stationary at the end of the first black card session, and the second white card session shows that the white card pattern was unaffected by the development of a new spatial firing pattern.
The other firing rate maps in Plate 3 present a finer analysis of the same early-complex cell. Observations made during the recording session suggested that the cell was silent during the first 2.5 minutes of the recording session, after which it showed a new spatial firing pattern. The second row shows the initial 2.5 minutes and the third row the final 13.5 minutes of each session. A comparison of the maps between the first 2 black card sessions shows that the cell was nearly silent during the first 2.5 minutes of the first black card session, while firing in the area of the field is apparent during the first 2.5 minutes of the second black card session. We believe the 2.5-minute silent period in the first black card session is an estimate of the time it took for complex remapping to appear.
A second early-complex cell showed no evidence of the white card pattern and no evidence of silence during the first exposure of rat 76 to the black card. Instead, the cell assumed its stationary firing pattern immediately, such that there were no differences of in-field firing rate between the first 2.5 min- utes of the first and second black card sessions. The firing field of this cell was stable in later black card sessions, and no alteration of the white card field was seen after the new field developed. It is important to note that the 3 cells sub-

200 HIPPOCAMPUS VOL. 1, NO. 2, APRIL 1991
sequently isolated from rat 76 were all complex, indicating that a stable complex remapping occurred on first presen- tation of the black card.
The last 2 early-complex cells were simultaneously recorded from rat 78. This cell pair is the only departure we saw from the generalization that partial remappings do not occur after black card substitution. The firing patterns of this cell pair for 4 sessions are illustrated in Plate 4. The 2 white card sessions run for each cell show that the white card pat- terns of both cells were stable. The first black card exposure was associated with a strong reduction of firing for the cell in row 2, but the remaining activity occurred in the position of the white card field. The black card firing field of the cell in row 1 was a rotational remapping of the white card field, but it is incorrect to call the combined results a rotational remapping since the angle between the firing fields was not preserved from the white card session. The only interpreta- tion of the first black card session that is consistent with the notion that partial remappings do not occur after black card substitution is to imagine that the cell in row 1 is complex, where the remapped field happens to be similar except for angular position to the white card field. In this case, the cell of row 2 must be considered complex, such that its sporadic firing shows a tendency towards the near-silence character- istic of both cells in the second black card session.
It is worth noting that the white card patterns of all 4 early- complex cells were stable, even though new patterns devel- oped in the presence of the black card. In conjunction with the 11 early-rotational cells, this means that black card sub- stitution produced no change in the white cell pattern of any of the 15 cells first recorded from a rat. (In two rats, pairs of cells were simultaneously recorded during initial sessions.) Thus, there is no evidence that the generation of a new rep- resentation affects an already established representation.
Card rotation experiments
Previous work showed that rotations of the white card caused equal rotations of the angular position of firing fields relative to laboratory frame, suggesting that the white card is salient for place cell firing (Muller and Kubie, 1987).
The effects of card rotation are summarized in the simi- larityiangular-deviation plot of Figure 4. In the plot, angular deviations are calculated relative to the field position ex- pected, if the cue cards control the angular position of firing fields. White card rotations are shown as open squares. Black card rotations are shown as filled symbols. The filled triangles are for the cells recorded from rat 53, the animal that showed a stable rotational remapping (Table 3 ) . Note that during white card rotation sessions, the cells recorded from rat 53 showed equal rotation with rotation of the white card. The filled squares are for black card rotations from all other an- imals.
As seen in Figure 4, the angular position of firing fields is accurately controlled by the angular position of the white card, in agreement with MuIler and Kubie (1987). Similar re- sults are found for the black card rotations represented by filled squares. Although the dispersion is greater than for the white card, the black card controls the angular position of firing fields for cells in most animals. The reason for this in- crease in dispersion is unknown. No distinction is made be-
" O l
8
-0.2 4 I I I I
-180 -90 0 90 180
ANGULAR DEVIATION
Fig. 4. The effects of card rotations shown in a simi- larity/angular-deviation plot. Similarity and angular deviation are as described in Figure 5. The black triangles show the effects of black card rotations for cells recorded from rat 53. The black squares show the effects of black card rotations for cells in other rats. The open squares show the effects of white card rotations.
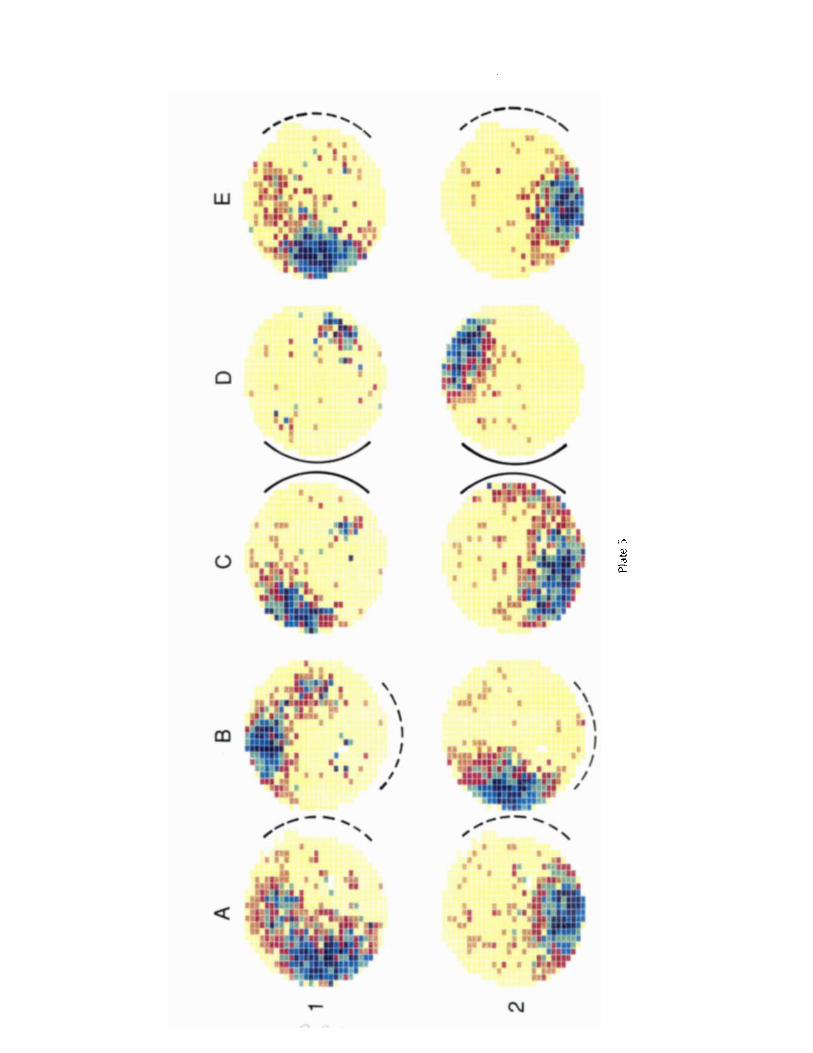
tween early and late or rotational and complex cells in Figure 4. This suggests that, except for the cells recorded from rat 53, the black card was salient at all times and for both cell classes. Examples of the effects of white and black card ro- tations are shown in Plates 5 and 6, which are for a pair of simultaneously recorded early rotational cells and a pair of simultaneously recorded late complex cells, respectively. Five cells recorded from rat 53 were the exceptions to black card control over the angular position of firing fields. For each of these cells, the angular deviation was approximately equal to the arc through which the card was rotated. Thus, the rotational remapping exhibited by rat 53 did not use the black card to anchor the angular coordinate, that is, it is as if the black card did not exist for this rat.
Simultaneous recordings from cell pairs
After a cue card manipulation, the new map is said to be a rotational remapping of the original if all individual cells are rotational and if the firing field rotation is equal for all cells, such that the spatial relationships among the fields of all cells are preserved. Serial recordings from single cells were enough to demonstrate that white card rotations pro- duce rotational remappings because the rotation of each firing field was equal to the card rotation for all cells recorded from a sample of rats (Muller and Kubie, 1987). In contrast, black card substitution can cause different amounts of field rotation relative to white card fields in different rats, even for rota- tional cells (Plate 1 ) . It is therefore valuable to record si- multaneously from 2 (or more) cells to test if the firing field rotation is equal after black card substitution.
Plate 5 shows the effects of white and black card rotations for 1 of the 2 pairs of early rotational cells that were recorded. The white card fields are shown in column A and the black
MODIFICATION OF PLACE CELL FIRING / Bostock et al. 201
card fields in column C. As expected, if the white-to-black card remapping is rotational, the relative angular positions of the fields of both cells are preserved during black card ex- posure. By comparing column B to column A and column D to column C, it is also clear that rotating either card produced approximately equal rotations of both fields. Column E shows the reproducibility of the white card fields after black card experience. For the second pair of early rotational cells (not illustrated), the relative angular position of the 2 fields was preserved after black card substitution, but no card rotations were done.
Simultaneous recordings can also help to establish the idea that, after a complex remapping, the black card rotations af- fect firing fields in a way consistent with white card rotations. Simultaneous recordings were made from 5 pairs of complex cells. Rate maps from such a pair are shown in Plate 6. One cell had different firing fields in the presence of the 2 cards, whereas the other was silent during black card exposures. Black card rotation caused the field of the active cell to rotate equally and did not induce activity in the silent cell. In the absence of a cell pair whose members were both active in the presence of the black card, it appears that black card rotations do not affect firing fields differently than do white card ro- tations.
Behavioral effects of black card substitution
Although the pellet chasing task was designed to make walking the predominant activity during recording and ap- peared to generate the desired outcome, no attempt was made in earlier work to demonstrate the effectiveness of the design (Muller et al., 1987). To test the task, we viewed videotapes of sessions and calculated the total time rats were engaged in the 4 most common activities. This analysis, which is sum- marized in Table 4, shows that the rats spent approximately 90% of the time walking, 6-7% of the time stationary, and 3-4% of the time standing or grooming. The task, therefore, produces the desired behavioral pattern. Table 4 also shows that there were no strong differences in distribution of activity as a function of card reflectance or session order. Multiple t-tests revealed no unlikely differences in the time spent in each behavior type.
A major aspect of the videotape analysis was confirmed with an automatic method in which each session was broken up into intervals of low- and high-speed locomotion (see Methods). In Table 5 , it is seen that the rats spent approxi-
Table 4. Analysis of Time (seconds) Spent Engaging in Different Behaviors
~
Walk Still Rearing Grooming N
Early 877.7 65.6 4.4 20.9 8 8 Late 882.3 52.7 11.6 22.9
White card
Early 842.3 94.8 8.5 26.2 4 Late 864.3 61.3 4.6 31.2 4
Note: Analyses were obtained from videotapes of recording ses- sions. Early designates sessions run during the first 2 black card ex- posures, while late designates sessions run during later black card exposures.
Black card
Table 5. Analysis of Total Time Spent Moving Slower and Faster than 8.8 cm/s in the Presence of the White and Black Cards
Time (seconds) Spent Moving in Speed Range
Number Low SDeed High Soeed of Rats
Early 246.8 246.9 White Card Late
678.7 13 665.0 10*
Early 230.6 677.0 13 246.5 658.1 10*
Black Card Late
Note: Early designates sessions run during the first 2 black card exposures, while late designates sessions run during later black card exposures. * For 3 rats no usable sessions for temporal analysis were available after the first 2 black card sessions. T-tests revealed no differences in the amount of time spent at low speed between any pair of conditions. The same was true for high speed.
mately 70% of their time moving quickly and approximately 25% of their time moving slowly or being stationary, inde- pendent of which card was present and independent of whether the recording session was early or later. The missing 5% of the time (approximately 50 seconds) was due to inter- vals in which the headlight position was not detected for either the first or last sample, so that the chord distance could not be calculated. The estimate of movement time was low compared to the walking time from the tape analysis because the velocity threshold was set to reject false positive move- ments that can occur when the rat dwells at the boundary between 2 of the video pixels.
Although the rats’ general behavioral repertoire was the same under all circumstances, an analysis of the time they spent near the cue card and near the opposite wall of the cylinder revealed significant differences between white and black card sessions. In Table 6, it is seen that the rats spent less time near the white card than near the opposite wall, for both early and late sessions. In contrast, during black card sessions, the rats spent approximately the same amount of time near the black card and near the opposite wall, for both early and late sessions.
DISC U SSlO N Understanding the empirical rules that regulate alterations
of hippocampal place cell firing fields will enhance our un- derstanding of hippocampal function. Based on previous work, Muller and Kubie (1987) suggested that the degree of remapping that occurred following manipulations of environ- mental stimuli would be based on the extent to which marker vs. structural stimuli are altered (kinematic hypothesis). Markers can help a rat locate itself in the environment, but do not hinder motion. Structures have marker properties, but in addition constrain the animal’s motions. The kinematic hy- pothesis suggested that the hippocampus represents the set of available trajectories, where the set is determined strictly by geometric constraints. It made the specific prediction that the hippocampal map of a cylinder will not be disturbed (ex- cept for a possible rotation) by any marker manipulation, and is therefore falsified by the complex remapping often asso- ciated with black card substitution.
Although the remapping often observed following intro-

202
Table 6. Analysis of the Amount of Time Spent Near and
HIPPOCAMPUS VOL. 1, NO. 2, APRIL 1991
Opposite the Cue Card ~ _ _ _ _ _ _ _ _ _ _ _ _ _ _ Time (seconds)
Spent In Specified Location
Near Opposite Number of Rats - ~~ ~~ ~ ~~ .~
Early 60.8 101.s 62.7 97.4
White Card Late
Early 98.2 95.8 94.1 85.1
Black Card Late
13 10* 13 10*
Two-tailed t-tests: Early vs. Late Sessions
Condition t df P(f)** Near white card -0.180 21 0.726 Opposite white card 0.312 21 0.758 Near black card 0.286 21 0.860 Opposite black card 0.958 21 0.348
Near vs. Opposite Card
Condition 1 df P(i)*” Early white card -3.230 I2 0.007 Late white card - 4.070 9 0.003 Early black card 0.363 12 0.726
0.564 Late black card 0.601 9
Note: * For 3 rats, no sessions were available for temporal analysis after the first 2 black card sessions. * * The tabulated value is the probability of the t-statistic being greater than the given number of chance. Early designates sessions run during the first 2 black card exposures, while late designates sessions run during later black card exposures.
~ . ~~ ___. . _ _ ~ ~ ..
duction of the black card suggests that what is being repre- sented is different in the case of the white and black card maps, it may be that how the environment is being repre- sented is equivalent in the 2 cases. For example, it would be expected that the representation of a vertical line and a hor- izontal line in the primary visual cortex are different in that different cells are responding to the 2 stimuli. Yet these rep- resentations are equivalent in the sense that, on the average, as many cells would fire to a vertical line as to a horizontal line. Both representations are a solution to the problem of how to neurally encode visual lines, and have led to the for- mation of general principles, such as convergence and sur- round inhibition, that govern the processing of visual infor- mation. Thus, the representation of the vertical and horizontal lines are equivalent because the way the infor- mation is processed is the same for both.
If this argument is applied to the current research, it may be the case that the average firing properties of cells in the presence of the white and black cards are not different from each other, but both are different from maps obtained in en- closures of other shapes. Such knowledge may allow the con- struction of a set of rules regarding the way that hippocampal representations are structured. The equivalence of white and black card maps in the statistical sense has not been formally tested. Nevertheless, inspection of rate maps reveals no ob- vious difference in the average properties of active cells. Fur- ther research will be required to explore this notion.
Given that maps of 2 different familiar environments may
be independent and that each familiar environment was at some time novel, it is reasonable to infer that the hippocampal map for any new environment reaches a steady state after the rat experiences the new environment enough times. The only previous work on the origins of place cell firing fields was done by Hill (1978), who studied place cells as rats learned a T-maze. All of the cells he recorded, except 1 , dis- charged rapidly upon the rat’s first entry into the region of the steady-state firing field. The remaining cell had no firing field for many minutes of experience in the maze, after which it developed a stationary field. Thus, Hill observed a nearly instantaneous remapping from the familiar environment, a shuttle box of construction similar to the T-maze, to the new environment. These findings suggested that place cell firing fields either develop so quickly that this process is not ob- servable, or that place cell firing is “sensory like” in that the cells are simply responding to stimuli in the surrounding en- vironment. In the present study, it was observed that place cell firing fields from the majority of rats were similar in the presence of the white and black cards during initial exposures to the black card. During later exposures to the black card, place cell firing fields were usually different in the presence of the white and black cards. The time-dependent alteration of place cell firing fields is consistent with the notion that firing fields must develop as a consequence of an animal’s experience in an environment. These findings are also con- sistent with those of Breese et al. (1989), who observed a modification of place cell firing in a familiar environment fol- lowing an alteration of reward contingencies.
The time required for the development of a new steady- state map can be analyzed by examining the time it took for the place cell firing fields in a given rat to change from ro- tational to complex. The classification of cells recorded from an individual rat could change immediately, during early black card sessions, or between early and late black card sessions. No evidence of later change was seen (Table 3) . We conclude that between 0 and 32 minutes (the length of 2 black card sessions) were required for the new map to get to the steady-state. In addition, at least 3 sessions in the presence of the black card are necessary to determine the steady-state nature of the new map. For this reason, many of our consid- erations apply only to the 7 rats for which 3 or more black card sessions were done; for the other 6 rats, cells were recorded only during the first 2 (early) black card exposures, so that the nature of the steady-state could not be determined.
In the steady-state, the remapping was rotational for 2 of 7 rats. For rat 53, the angular position of the fields of all S late cells was the same in the presence of the 2 cards, so that the case for a rotational remapping is strong. For rat 75, only a single late-rotational cell was recorded, so that the claim that the remapping is rotational rather than partial is weaker. For the other S rats, the steady-state remapping was complex. Because multiple late-complex cells were recorded from 4 of the S rats, the evidence that these remappings were complex rather than partial is fairly good.
The lack of partial remapping suggests that black card sub- stitution induces the hippocampal spatial system to make a binary decision between maintaining a rotational version of the white card map or generating a new map. The observation that both rotational and complex steady-state remapping

MODIFICATION OF PLACE CELL FIRING / Bostock et al. 203
The legends below refer to Plates 1-6, which appear on the following six pages.
Plate 1. Color-coded firing rate maps for 3 place cells classified as “rotational.” For each cell, the firing pattern in the presence of the white card is shown in the left column, and the firing pattern in the presence of the black card is shown in the right column. Firing rate values for the color categories are given in Table 7.
Plate 2. Color-coded firing rate maps for 3 place cells classified as “complex.” For each cell, the firing pattern in the presence of the white card is shown in the left column, and the firing pattern in the presence of the black card is shown in the right column. Firing rate values for the color categories are given in Table 7 .
Plate 3. Development of the steady-state black card firing pattern for an early-complex cell. Column headings indicate the cue card that was present during the recording session. The top row shows the firing pattern for this cell during the entire 16 minutes of each session. The middle row shows the firing pattern during the initial 2.5 minutes of each session. The bottom row shows the firing pattern during the final 13.5 minutes of each session. Firing rate values for the color categories are given in Table 7 .
Plate 4. Simultaneous recordings from a pair of early-complex cells that underwent several changes in spatial firing pattern before reaching a steady state. Rows are the rate maps for the firing of each cell. Column headings indicate the card that was present during each session. Firing rate values for color categories are given in Table 7.
Plate 5. Simultaneous recordings from a pair of rotational cells. Each row represents the firing of a single cell. Broken arcs represent the presence and location of the white cue card during the session. Solid arcs represent the presence and location of the black cue card during the recording session. Firing rate values for color categories are given in Table 7.
Plate 6. Simultaneous recordings from a pair of complex cells. Each row represents the firing patterns of a single cell. Broken arcs represent the presence and location of the white cue card during the session. Solid arcs represent the presence and location of the black cue card during the session. Firing rate values for color categories are given in Table 7 .
Note: Table 7 appears on page 204.
WHITE
1
2
3
BLACK
Plate 1
WHITE
1
2
3
BLACK
Plate 2

WH
ITE
B
LAC
K
BLA
CK
W
HIT
E
EN
TIR
E
SE
SS
ION
FIR
ST
2.5
min
.
LAS
T
13.5
min
.

WH
ITE
1
BLA
CK
B
LAC
K
WH
ITE
2
m
a

n
0
m
a

204
Table 7. Median Action Potentials Per Second for Different Rate Pixels In Color-coded Rate Maps
HZPPOCAMPCJS VOL. 1, NO. 2, APRIL 1991
Pixel Color
Orange Red Green Blue Purple
Plate 1
Cell 1 , white Cell 1, black Cell 2, white Cell 2, black Cell 3, white Cell 3, black Plate 2
MAP Cell 1, white Cell 1 , black Cell 2, white Cell 2, black Cell 3, white Cell 3, black Plate 3
MAP Entire, white I Entire, black 1 Entire, black 2 Entire, white 2 First, white 1 First, black 1 First, black 2 First, white 2 Last, white 1 Last, black 1 Last, black 2 Last white 2 Plate 4
MAP Cell I , white 1 Cell 1 , black 1 Cell I , black 2 Cell I , white 2 Cell 2. white 1 Cell 2, black 1 Cell 2, black 2 Cell 2, white 2 Plate 5
MAP Cell I , A Cell I , B Cell 1, C Cell I , D Cell I , E Cell 2, A Cell 2, B Cell 2, C Cell 2, D Cell 2, E Plate 6
MAP Cell I , A Cell I , B Cell I , C Cell 1 , D Cell I , E Cell 2, A Cell 2, B Cell 2, C Cell 2, D Cell 2, E
MAP 0.37 0.57 0.51 0.43 0.59 0.54
1.37 1.67 0.60 0.22 0.72 1.01
0.76 0.50 0.59 0.58 2.72 2.30 2.00 4.28 0.99 0.57 0.73 0.66
0.34 0.53 0.51 0.82 0.84 0.31 0.20 1.17
0.80 0.70 0.47 0.43 0.63 1.05 0.81 0.90 0.77 I .05
0.53 0.54 0.49 0.52 0.48 0.87 0.62 0.36 0.77 0.60
0.87 1.07 1.44 1.64 2.37 1.62
3.75 5.80 1.66 0.40 1.96 3.28
1.81 1.07 1.86 1.17 6.00 3.00 4.00 8.00 2.30 I .30 2.06 1.29
0.09 1.25 0.76 1.90 3. I6 0.58 0.53 3.21
2.40 1.62 1.25 0.75 1.66 3.95 3.39 2.84 3.39 5.00
1.48 1.26 0.82 0.87 0.82 1.81 1.40 0.45 0.92 1.39
1.67 2.16 2.71 3.23 4.80 3.15
10.21 13.20 4.00 0.81 4.14 6.31
4.15 2.37 4.04 2.25
10.00 10.00 6.00
15.00 5.00 2.68 4.33 2.30
2.30 2.44 1.97 4.61 6.38 0.88 0.80 7.50
4.00 3.40 2.81 I .30 3.42 9.60 8.57 5.71 7.71
12.20
2.60 2.11 1.25 1.25 1.44 3.52 2.58 0.74 I .22 2.79
2.83 3.64 5.22 4.99 8.12 5.11
18.36 24.49 6.31 2.85 6.74
12.66
8.57 4.28 6.03 4.56
13.84 15.00 9.23
21.60 9.43 5.00 6.88 4.61
5.17 3.87 3.00 8.57
13.33 1.46 1.60
15.42
6.00 5.02 5.21 2.13 7.41
19.24 16.01 10.90 13.33 19.20
4.67 3 S O 1.89 1.93 2.55 6.00 3.63 1.36 1.90 4.00
7.32 8.07 8.57 9.60
12.35 9.90
33.33 40.64 12.50 6.66
10.68 19.35
12.44 7.11
12.15 9.75
25.71 15.00 18.00 30.00 14.11 7.89
12.85 10.00
10.18 10.58 3.75
20.00 22.12
3.21 2.06
26.18
9.00 7.09 8.69 5.93
15.00 29.55 24.61 16.80 18.49 25.16
8.13 5.91 4.33 3.33 4.44 9.54 6.10 1.36 1.90 8.27
were seen implies that the magnitude of the stimulus change is near the threshold for the binary decision. The balance between rotational and complex remapping might be shifted in a variety of ways. For example, if the pretraining with the white card were extended, complex remapping might always be seen. In contrast, if the cards were alternately presented at the outset of training in the cylinder, it is possible that rotational remapping would become more common. We spec- ulate that studies that vary the sequence of black card ex- posures can provide evidence that the changes in place cell firing bear a marked resemblance to learning.
The sequential effects of black card exposure can be sum- marized by saying that the trend was always from rotational to complex remapping. The transition is immediate, delayed, or postponed indefinitely in different rats. Once a complex ce11 was recorded from a given rat, all subsequently recorded cells were also complex. This result is unlikely on the hy- pothesis that remapping sequences in each direction occur with equal frequency ( P = .008), and is implausible on the hypothesis that the remapping usually proceeds from com- plex to rotational. It is also important to note that the white card firing patterns of individual cells are unaffected by the development of a different firing pattern in the presence of the black card, indicating that the white and black maps are independent.
In addition to revealing the trend from rotational to com- plex remapping, our results indicate that the transition is ab- rupt; we saw little evidence of a gradual shift through partial remapping. First, both members of all 9 simultaneously recorded cell pairs fell into the same class; there was no case in which 1 cell was rotational while the other was complex. If partial remapping were common, we should have seen some mixed pairs. Second, when it was possible to see the development of a new black card firing pattern in a single cell, the transition was fast. There was no mixing of the orig- inal and new patterns.
Overall, the properties of place cell responses to black card substitution suggest that the remapping of the environment happens in a “unitary” fashion. It is as if the hippocampal representation of the environment in the presence of the black card undergoes a state change in a very short time, even while the map in the presence of the white card is stable. This view converges with the description of the hippocampal represen- tation as “holistic” by O’Keefe and Speakman (1987). The notion of a state change is also in agreement with the state- ment by O’Keefe and Nadel (1978) that the spatial learning function subserved by the hippocampus (the ‘‘locale’’ sys- tem) is expected to be all-or-none in nature.
Because the behavioral task used during place cell record- ing was not designed to assess spatial learning or memory, the interpretation of the meaning of the development of a new representation in the presence of the black card is necessarily limited. However, it is possible to draw initial conclusions from the available data. Four possible explanations of the steady-state remapping following black card exposure are ev- ident: sensory, motor, attentional, and learning-related. The “sensory” hypothesis postulates that the steady-state com- plex remapping is a direct consequence of the different stim- ulus properties of the 2 cards and predicts that all changes in place cell firing should happen instantaneously when the

MODIFICATION OF PLACE CELL FIRING / Bostock et al. 205
black card is first introduced. The long delay often observed between initial presentation of the black card and the ap- pearance of complex cells therefore falsifies the sensory model.
The “motor” hypothesis suggests that the steady-state re- sult is due to differences in movements emitted in the pres- ence of the 2 cards. This hypothesis is too nonspecific to eliminate completely, since arbitrarily complex relationships between the firing of a neuron and the concurrent activity of the animal may be crucial. Nevertheless, no change in the rats’ behavior that had the same time course as the rotational- to-complex switch was observed. Several aspects of behavior were unaffected by either early o r late black card substitu- tions. For example, grooming and standing were always in- frequent, and the amount of time spent moving slower or faster than a selected speed was remarkably constant (Table 4). In contrast, each animal spent less time near the white card than near the black one. This result was seen during all, and not just late black card exposures. Thus, the steady-state complex remapping is not likely a direct result of the different dwell-time patterns, since the behavioral and neural phenom- ena have different time courses.
Neither the sensory nor motor hypotheses require the an- imal’s brain state to be permanently altered by serial expo- sures to the black card. These hypotheses are rejected be- cause the firing of place cells is modified in a time course that has no obvious sensory or motor parallel. A third hypothesis that also requires no permanent change in brain state may be referred to as “attentional.” In this scheme, the existence of early rotational cells is taken to mean that the rat ignored the black card, that is, the presence of the black card was rec- ognized only during the third and later presentations. This form of the attentional hypothesis is falsified by the control the black card exerted over the angular position of otherwise unaltered spatial firing patterns during the first 2 black card exposures, indicating that the black card was salient or at- tended to during early black card exposures. A more so- phisticated version postulates that the black card is always recognized but that it is treated identically to the white card during early exposures. This version is ruled out by the dif- ference in dwell-time distribution near and opposite the 2 cards; the white and black cards are demonstrably treated differently by the animal during all black card exposures.
Thus the results are consistent with the hypothesis that the rotational-to-complex remapping sequence is “experience- dependent” and that it likely reflects a modification of the nervous system. If a rotational remapping is considered to be a generalization between 2 environments, while a complex remapping is a discrimination between 2 environments, then the hippocampal spatial representation of the new environ- ment proceeds from generalization towards discrimination. Based on this description, it may be possible to show that the remapping sequence and its timing depend on the exper- imental protocol, including the rats’ history of exposure to the original and altered environments. We stress that we are not trying to explain why a particular protocol should lead to a switch in spatial firing patterns, nor to predict when the switch should occur. Our current concept of experience-de- pendence requires only that the switch and its timing be sen- sitive to the rat’s history in the environment. Further, the
current experiments shed no light on the location or nature of the possible plasticity process. Nevertheless, the long-term potentiation exhibited by several of the synaptic types in the hippocampal network suggests that the plasticity may be local. In this regard, it would be valuable t o test if remapping is blocked by NMDA receptor antagonists, which have been shown to block hippocampal long-term potentiation as well as spatial learning (Morris et al., 1986).
ACKNOWLEDGMENTS
This work was supported by NIH grant RO1-NS20686.
References
Batschelet, E. (1981) Circular Stutistics in Biology. pp. 54-57, Aca- demic, London, UK.
Best, P. J. and L. T. Thompson (1984) Hippocampal place cells show long-term stability of place field activity. Second Conference on Learning and Memory. Irvine, CA.
Breese, C. R., R. E. Hampson and S. A. Deadwyler (1989) Hippo- campal place cells: Stereotypy and plasticity. J . Neurosci., 9: 1097- 1111.
Fox, S . E. and J . B. Ranck Jr. (1981) Electrophysiological charac- teristics of hippocampal complex-spike and theta cells. Exp. Brain Res. 41:399-410.
Hill, A. J. (1978) First occurrance of hippocampal spatial firing in a new environment. Exp. Neurol. 62:282-297.
Kubie, J . L. (1984) A driveable bundle of microwires for collecting single-unit data from freely moving rats. Physiol. Behav. 32:115- 118.
MacNemar, Q. (1969) Psychologicul Starisrics. John Wiley and Sons, NY.
Maxwell, A. E. and A. E. G. Pilliner (1968) Deriving coefficients of reliability and agreement for ratings. The Br J Math Stat Psychol, 21:105-116.
McNaughton, B. L. and R. G. M. Morris (1987) Hippocampal syn- aptic enhancement and information storage in a distributed memory system. Trends Neurosci. 10:408-415.
Morris, R. G. M., E. Anderson, G. S. Lynch, and M. Baudry (1986) Selective impairment of learning and blockade of long-term poten- tiation by an N-methyl-D-aspartate receptor antagonist, APS. Na- ture 319:774-776.
Muller, R. U. and J. L. Kubie (1987) The effects of changes in the environment on the spatial firing of hippocampal complex-spike cells. J . Neurosci. 7:1951-1968.
Muller, R. U. , J. L. Kubie, and J. B. Ranck Jr. (1987) Spatial firing patterns of hippocampal complex-spike cells in a fixed environ- ment. J . Neurosci. 7: 193S-19SO.
O’Keefe, J. (1976) Place units in the hippocampus of the freely moving rat. Exp. Neurol. 51:419-439.
O’Keefe, J. and D. H. Conway (1978) Hippocampal place units in the freely moving rat: Why they fire where they fire. Exp. Brain Res. 31:573-590.
O’Keefe, J . and J. Dostrovsky (1971) The hippocampus as a spatial map. Preliminary evidence from unit activity in the freely-moving rat. Brain Res. 34:171-175.
O’Keefe, J . and L. Nadel (1978) The Hippocumpus as a Cognitive Map . Clarendon, Oxford, UK.
O’Keefe, J. and A. Speakman (1987) Single unit activity in the rat hippocampus during a spatial memory task. Exp. Brain Res. 68: 1- 27.
Thompson, L. T. and P. J. Best (1989) Place cells and silent cells in the hippocampus of freely-behaving rats. J. Neurosci., 9:2382- 2390.