EXISTING NUTRIENT SOURCES AND CONTRIBUTIONS TO THE BOSQUE RIVER WATERSHED
59
TIAER PR 9911 EXISTING NUTRIENT SOURCES AND CONTRIBUTIONS TO THE BOSQUE RIVER WATERSHED Anne McFarland and Larry Hauck September 1999 Texas Institute for Applied Environmental Research Tarleton State University Box T0410, Tarleton Station Stephenville, Texas 76402 (254) 968-9567 Fax (254) 968-9568
-
Upload
independent -
Category
Documents
-
view
0 -
download
0
Transcript of EXISTING NUTRIENT SOURCES AND CONTRIBUTIONS TO THE BOSQUE RIVER WATERSHED
TIAERPR 9911
EXISTING NUTRIENT SOURCES ANDCONTRIBUTIONS TO THE BOSQUE RIVER
WATERSHED
Anne McFarland and Larry Hauck
September 1999
Texas Institute for Applied Environmental Research � Tarleton State UniversityBox T0410, Tarleton Station � Stephenville, Texas 76402 � (254) 968-9567 � Fax (254) 968-9568


Existing Nutrient Sources and Contributions to the Bosque River Watershed i
EXECUTIVE SUMMARY
Over about a two and a half-year period (November 1, 1995 �March 30, 1998), flow and nutrients were monitored consistently at17 sites in the Bosque River watershed. Drainage areas abovesampling sites differed in the percent of dairy waste applicationfields, row crop (corn, grain sorghum, soybeans and cotton), non-row crop (forage sorghum and winter wheat), improved pasture(primarily coastal bermudagrass fields), wood/range, and urbanland area. A statistical approach was used to develop nutrientexport coefficients of orthophosphate-phosphorus (PO4-P), totalphosphorus (TP), and total nitrogen (TN) for the major land uses inthese mixed land-use drainage areas. Nutrient export coefficientsrepresent the amount of nonpoint source loading associated with agiven land use per unit area for a specified length of time, such aspounds TP per acre per year. Of the major land uses in the BosqueRiver watershed, the largest export coefficients for PO4-P and TPwere associated with dairy waste application fields (3.08 lbs PO4-P/acre/yr and 5.81 lbs TP/arce/yr) followed by urban (0.98 lbs PO4-P/acre/yr and 2.73 lbs TP/acre/yr), pasture/cropland (0.14 lbs PO4-P/acre/yr and 0.70 lbs TP/acre/yr), then wood/range (0.07 lbs PO4-P/acre/yr and 0.31 lbs TP/acre/yr). The largest TN exportcoefficients were associated with row-crop areas (19.0 lbsTN/acre/yr) followed by dairy waste application fields (12.3 lbsTN/acre/yr), urban (11.5 lbs TN/acre/yr), pasture/non-row cropfields (7.2 lbs TN/acre/yr) then wood/range (2.2 lbs TN/acre/yr).
An empirical model was developed to assess nutrient contributionby source using the developed export coefficients for nonpointsources and information from the eight permitted municipalwastewater treatment plants within the watershed for point sourceloadings. This model was verified by comparing estimatedloadings to measured loadings at four stream sites located along theNorth Bosque River. These four sites were not included in thedevelopment of the land-use nutrient export coefficients to allowan independent verification of the model. Monte Carlo samplingtechniques were applied to the variance associated with the derivednutrient export coefficients to provide an uncertainty analysis fornutrient loads by source for the Bosque River watershed and forselected points within the watershed.
The largest loadings of PO4-P and TP contributing to the BosqueRiver watershed were from dairy waste application fields andwood/rangeland, while the largest loadings of TN were associated

Existing Nutrient Sources and Contributions to the Bosque River Watershedii
with row-crop fields. Dairy waste application fields compriseabout 2 percent of the total watershed area and were associatedwith 35 + 4 percent PO4-P, 21 + 3 percent TP and 5 + 2 percent TNloadings to the watershed. Wood/range comprise 63 percent of thewatershed area and were associated with 22 + 5 percent PO4-P, 31+ 6 percent TP and 22 + 12 percent TN loadings to the watershed.Row-crop agriculture is associated with 15 percent of thewatershed drainage area and was associated with 11 + 1 percentPO4-P, 17 + 2 percent TP and 49 + 10 percent TN loadings. Mostdairy waste application fields in the watershed are found in theupper portion of the North Bosque River subwatershed, while mostrow-crop fields are found in the southern portion of the BosqueRiver watershed within the Hog Creek, Middle Bosque and SouthBosque River subwatersheds. The derived nutrient exportcoefficients and, thus, the source-contribution model results arespecific to the time period November 1, 1995 through March 30,1998 and care should be taken in extrapolating these results toother timeframes or watersheds.

Existing Nutrient Sources and Contributions to the Bosque River Watershed iii
ACKNOWLEDGMENTS
Funding sources for this study include the United StatesDepartment of Agriculture - Natural Resources ConservationService, the Clean Rivers Program of the Texas Natural ResourceConservation Commission, the United States EnvironmentalProtection Agency and the State of Texas. The authorsacknowledge the support of landowners that allowed access to theirproperty for in-stream monitoring. Without the willingcooperation of these individuals, this study would not have beenpossible. The authors would also like to acknowledge thededicated work of the many field personnel and laboratorychemists involved with the monitoring program, particularly sincerain often falls on weekends requiring staff to be on call seven daysa week.
Mention of trade names or equipment manufacturers does notrepresent endorsement of these products or manufacturers byTIAER.

Existing Nutrient Sources and Contributions to the Bosque River Watershediv
Existing Nutrient Sources and Contributions to the Bosque River Watershed v
TABLE OF CONTENTS
EXECUTIVE SUMMARY.................................................................................................. iACKNOWLEDGMENTS................................................................................................. iiiINTRODUCTION.............................................................................................................1METHODS.....................................................................................................................11
Step 1. Determine Land Uses Above Stream Sampling Sites...................................... 12Step 2. Calculate Cumulative Nutrient Loadings for Each Site..................................... 16Step 3. Determine Nutrient Export Coefficients for Urban Land Areas......................... 19Step 4. Determine Nutrient Export Coefficients for Agricultural Land Uses.................. 19Step 5. Compare Calculated Export Coefficients to Literature Values ......................... 26Step 6. Calculate Municipal WWTP Discharge Loadings............................................. 26Step 7. Develop an Empirical Source-Contribution Model............................................ 27Step 8. Compare Estimated Nutrient Loadings with Monitored Loadings................... 299Step 9. Calculate Loadings and Percent Contribution by Subwatershed and Land-UseSector ........................................................................................................................... 32
DISCUSSION AND CONCLUSIONS ............................................................................37LITERATURE CITED ....................................................................................................41APPENDIX A: NUTRIENT CONTRIBUTION BY SOURCE FOR MAJORSUBWATERSHEDS WITHIN THE BOSQUE RIVER WATERSHED ...........................43APPENDIX B: NUTRIENT CONTRIBUTION BY SOURCE FOR SELECTED SITESALONG THE NORTH BOSQUE RIVER .......................................................................47LIST OF TABLES
Table 1. Point sources in the Bosque River Watershed as represented by the eight permitted wastewater treatmentplants (WWTPs) with the watershed............................................................................................................ 3
Table 2. Land uses above sampling sites and drainage area sizes for TIAER sampling sites in the Bosque Riverwatershed used in nutrient export coefficient analyses .............................................................................. 16
Table 3. Land use and drainage area size for major tributary drainages and total land area within the Bosque Riverwatershed ................................................................................................................................................... 16
Table 4. Volume and nutrient loadings measured at TIAER sampling sites for November 1, 1995 through March 30,1998 prorated to an annual basis................................................................................................................ 18
Table 5. Nutrient contribution to Lake Waco via precipitation for November 1, 1995 through March 30, 1998assuming a reservoir surface area of 7, 270 acres and 87.39 inches of rainfall prorated to an annual basis19
Table 6. Phosphorus export coefficient parameter estimates on an annual basis for land-use variable versus nutrientloadings based on data from November 1, 1995 through March 30, 1998 ............................................... 22
Table 7. Nitrogen export coefficient parameter estimates on an annual basis for land-use variable versus nutrientloadings based on data from November 1, 1995 through March 30, 1998 ............................................... 25
Table 8. Literature values for TP and TN export coefficients compared to calculated values for land uses in theBosque River watershed............................................................................................................................. 26

Existing Nutrient Sources and Contributions to the Bosque River Watershedvi
Table 9. Calculated wastewater treatment plant nutrient loadings for November 1, 1995 through March 30, 1998prorated to an annual basis......................................................................................................................... 27
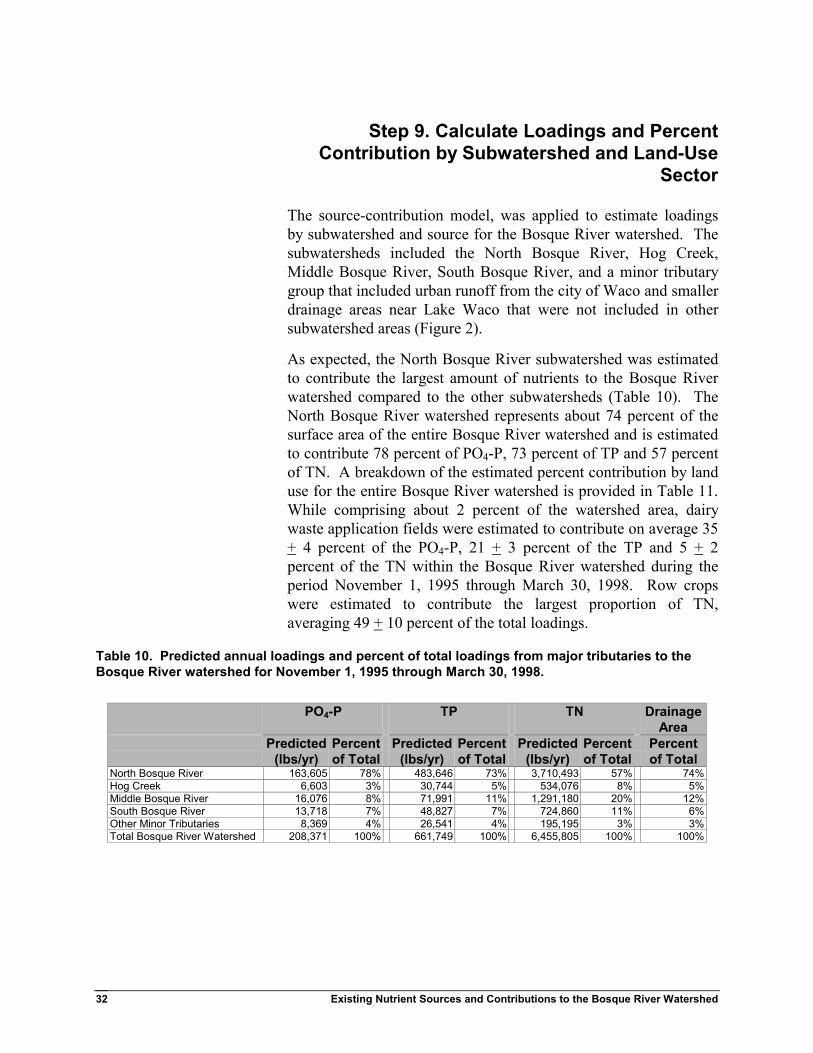
Table 10. Predicted annual loadings and percent of total loadings from major tributaries to the Bosque Riverwatershed for November 1, 1995 through March 30, 1998 ....................................................................... 32
Table 11. Estimated percent contribution of nutrients by source to the Bosque watershed for November 1, 1995through March 30, 1998............................................................................................................................. 33
Table 12. Estimated percent contribution of nutrients by source to the North Bosque River watershed for November1, 1995 through March 30, 1998................................................................................................................ 33
Table 13. Land uses within the drainage areas above TIAER sampling sites along the North Bosque River............ 34
Table A-1. Estimated percent contribution of nutrients by source within the North Bosque River drainage area forNovember 1, 1995 though March 30, 1998 ............................................................................................... 45
Table A-2. Estimated percent contribution of nutrients by source within the Hog Creek drainage area for November1, 1995 though March 30, 1998 ................................................................................................................. 45
Table A-3. Estimated percent contribution of nutrients by source within the Middle Bosque River drainage area forNovember 1, 1995 though March 30, 1998 ............................................................................................... 45
Table A-4. Estimated percent contribution of nutrients by source within the South Bosque River drainage area forNovember 1, 1995 though March 30, 1998 ............................................................................................... 46
Table A-5. Estimated percent contribution of nutrients by source within the minor tributaries within the BosqueRiver Watershed near Lake Waco area for November 1, 1995 though March 30, 1998 ........................... 46
Table B-1. Estimated percent contribution of nutrients by source for the drainage area above site BO100 on theNorth Bosque River for November 1, 1995 though March 30, 1998......................................................... 49
Table B-2. Estimated percent contribution of nutrients by source for the drainage area above site BO090 on theNorth Bosque River for November 1, 1995 though March 30, 1998......................................................... 49
Table B-3. Estimated percent contribution of nutrients by source for the drainage area above site BO085 on theNorth Bosque River for November 1, 1995 though March 30, 1998......................................................... 49
Table B-4. Estimated percent contribution of nutrients by source for the drainage area above site BO080 on theNorth Bosque River for November 1, 1995 though March 30, 1998......................................................... 50
Table B-5. Estimated percent contribution of nutrients by source for the drainage area above site BO070 on theNorth Bosque River for November 1, 1995 though March 30, 1998......................................................... 50
Table B-6. Estimated percent contribution of nutrients by source for the drainage area above site BO060 on theNorth Bosque River for November 1, 1995 though March 30, 1998......................................................... 50
Table B-7. Estimated percent contribution of nutrients by source for the drainage area above site BO040 on theNorth Bosque River for November 1, 1995 though March 30, 1998......................................................... 51
Table B-8. Estimated percent contribution of nutrients by source for the drainage area above site BO020 on theNorth Bosque River for November 1, 1995 though March 30, 1998......................................................... 51
LIST OF FIGURES
Figure 1. Bosque River watershed. .............................................................................................................................. 2Figure 2. Major subwatershed of the Bosque River watershed. ................................................................................... 4Figure 3. Designated segments and water uses within the Bosque River watershed. ................................................... 5Figure 4. Location of sampling sites used in nutrient export coefficient analysis for the Bosque River watershed. .... 9Figure 5. General land use within the Bosque River watershed. ................................................................................ 13Figure 6. Location of dairy waste application fields within the Bosque River watershed based on dairy permit
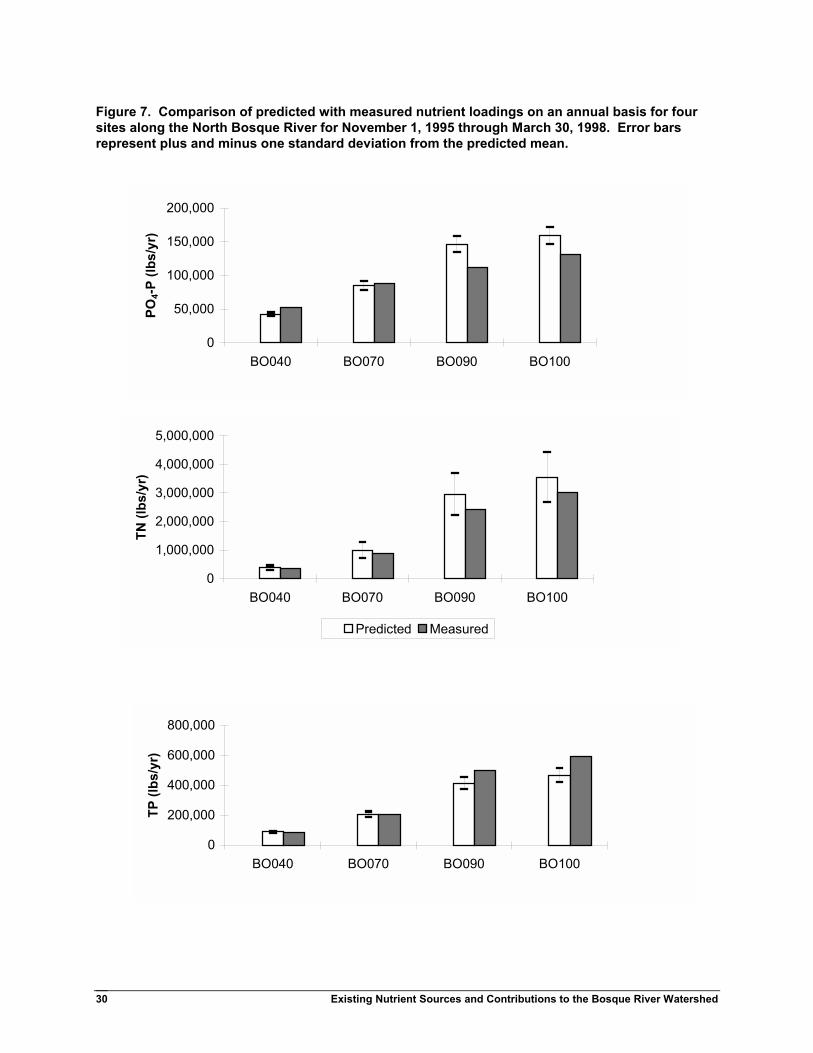
information as of January 1995.................................................................................................................. 15Figure 7. Comparison of predicted with measured nutrient loadings on an annual basis for four sites along the North
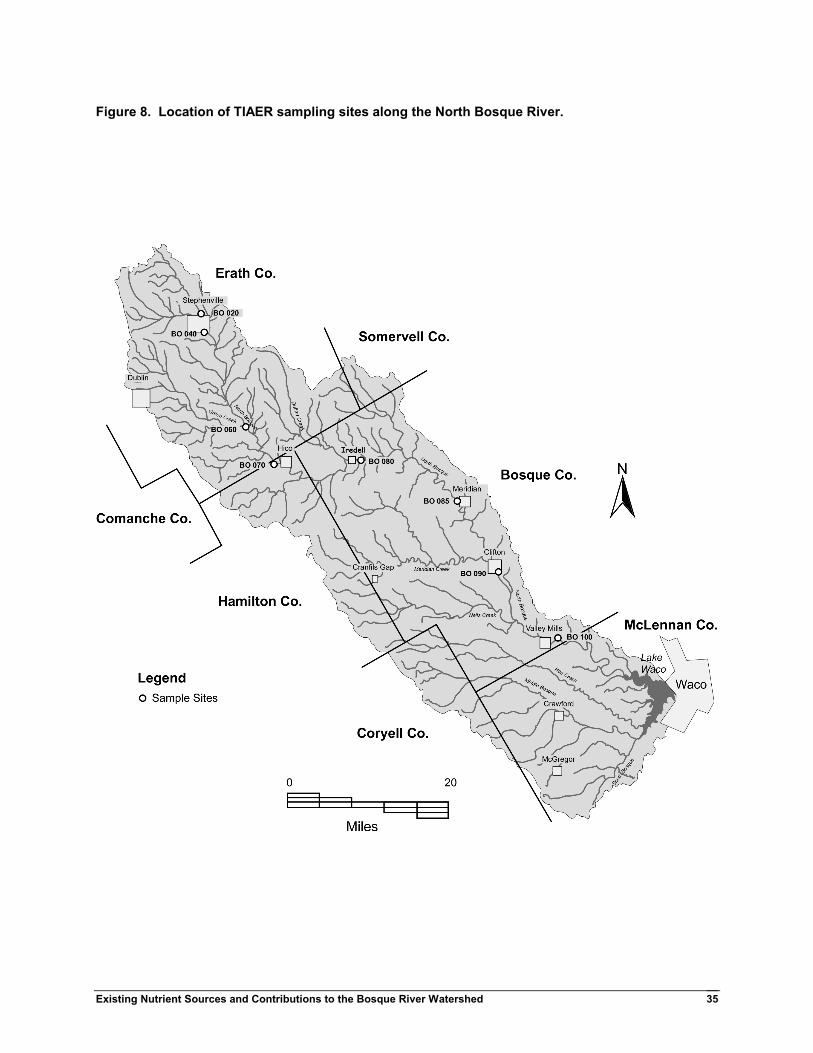
Bosque River for November 1, 1995 through March 30, 1998.................................................................. 30Figure 8. Location of TIAER sampling sites along the North Bosque River. ............................................................ 35Figure 9. Percent of predicted nutrient loadings compared with percent of total drainage area represented for
selected sites along the North Bosque River. ............................................................................................. 36Figure 10. Average daily flow at site BO100 on the North Bosque River near Valley Mills for November 1, 1995
through March 30, 1998............................................................................................................................. 39

Existing Nutrient Sources and Contributions to the Bosque River Watershed 1
INTRODUCTION
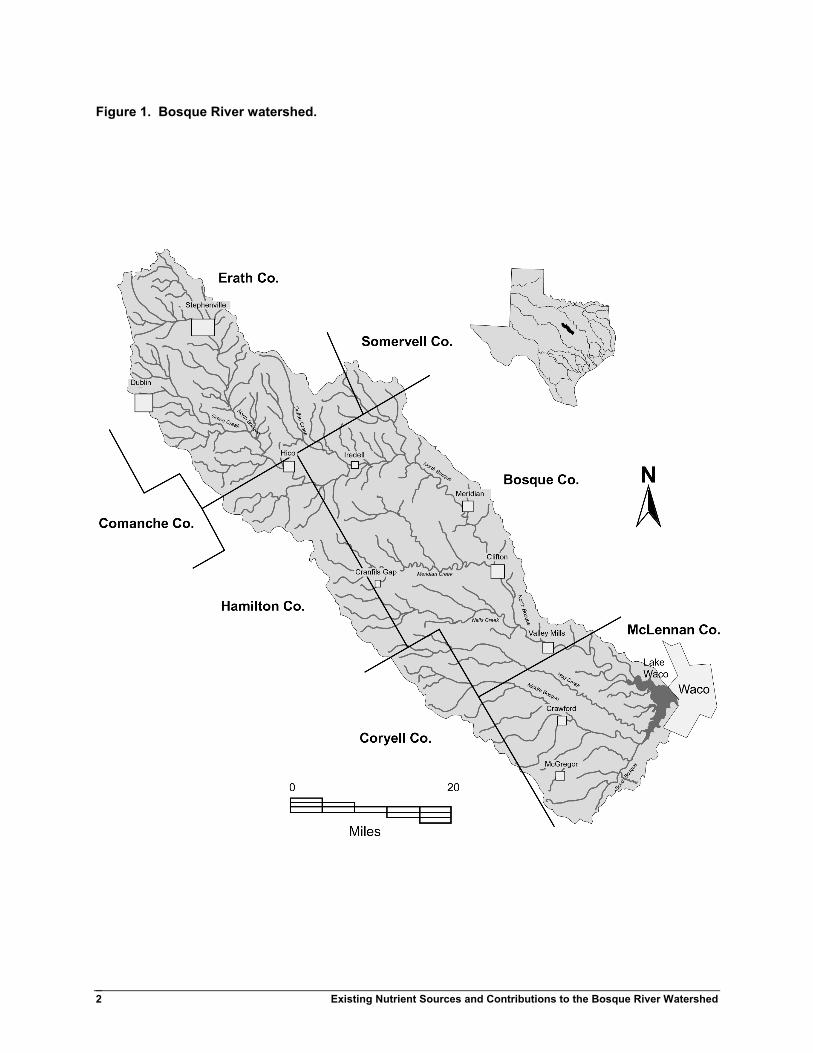
The Bosque River watershed of north-central Texas is defined bythe drainage area to Lake Waco (Figure 1). This drainage areaincludes the North Bosque River, Hog Creek, Middle BosqueRiver, and South Bosque River as major tributaries to Lake Wacoas well as a few minor tributaries representing small drainage areasnear the reservoir.
The City of Waco constructed Lake Waco in 1929 as a municipalwater supply. The reservoir was enlarged to its present size in1964 by the U.S. Army Corps of Engineers for flood control,conservation storage, and recreation. Lake Waco is formed by arolled earthfill dam and provides the public water supply for Wacoand surrounding communities with a service population ofapproximately 140,000. The Brazos River Authority and the Cityof Waco jointly hold the rights to water in the conservation storageof the reservoir, which was built to contain about 152,00 acre-feetof water at the spillway elevation (Wyrick, 1978). Lake Waco hasa surface area of about 7,270 acres and a normal pool elevation ofabout 455 feet (TNRCC, 1996). The designated uses for LakeWaco (segment 1225) are contact recreation, high aquatic life andpublic water supply with agricultural operations thought to be themajor contributors of nonpoint source pollution in the reservoirwatershed (TNRCC, 1996).
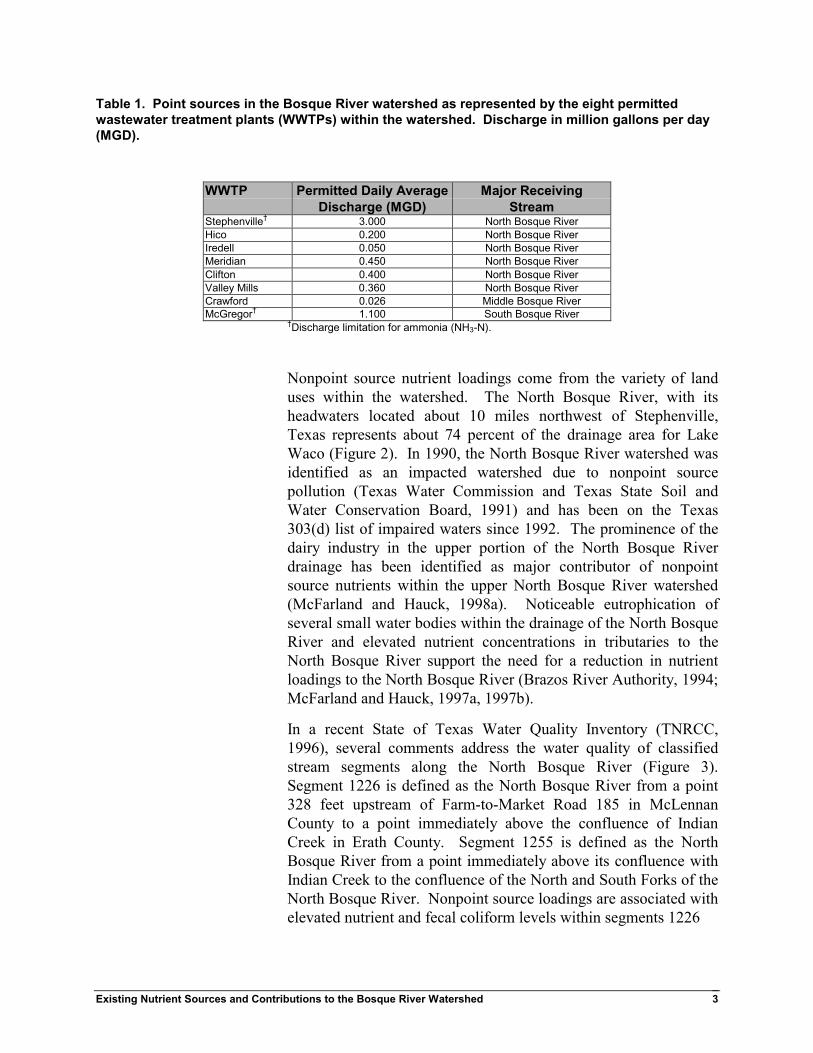
Point and nonpoint sources contribute nutrient loadings to theBosque River watershed. In general terms, point sources representnutrients that can be traced to a single point of discharge, such as apipe or culvert, while nonpoint sources represent nutrients thatcannot be traced to a specific point. There are eight permittedwastewater treatment plants (WWTPs) representing permittedpoint source discharges within the Bosque River watershed (Table1). Of the eight WWTPs in the Bosque River watershed, onlyStephenville and McGregor require advanced wastewater treatmentfor the attainment of stream standards (TNRCC, 1996). TheBrazos River Authority and Texas Institute for AppliedEnvironmental Research (TIAER) have collected grab samples ofthe effluent from all eight WWTP since January 1996 on a monthlyor bi-weekly basis. Combined with the monthly dischargeinformation reported to the TNRCC by each WWTP this nutrientdata can be used to estimate nutrient loadings from the pointsources within the Bosque River watershed.
Existing Nutrient Sources and Contributions to the Bosque River Watershed2
Figure 1. Bosque River watershed.
Existing Nutrient Sources and Contributions to the Bosque River Watershed 3
Table 1. Point sources in the Bosque River watershed as represented by the eight permittedwastewater treatment plants (WWTPs) within the watershed. Discharge in million gallons per day(MGD).
WWTP Permitted Daily Average Major ReceivingDischarge (MGD) Stream
Stephenville� 3.000 North Bosque RiverHico 0.200 North Bosque RiverIredell 0.050 North Bosque RiverMeridian 0.450 North Bosque RiverClifton 0.400 North Bosque RiverValley Mills 0.360 North Bosque RiverCrawford 0.026 Middle Bosque RiverMcGregor� 1.100 South Bosque River
�Discharge limitation for ammonia (NH3-N).
Nonpoint source nutrient loadings come from the variety of landuses within the watershed. The North Bosque River, with itsheadwaters located about 10 miles northwest of Stephenville,Texas represents about 74 percent of the drainage area for LakeWaco (Figure 2). In 1990, the North Bosque River watershed wasidentified as an impacted watershed due to nonpoint sourcepollution (Texas Water Commission and Texas State Soil andWater Conservation Board, 1991) and has been on the Texas303(d) list of impaired waters since 1992. The prominence of thedairy industry in the upper portion of the North Bosque Riverdrainage has been identified as major contributor of nonpointsource nutrients within the upper North Bosque River watershed(McFarland and Hauck, 1998a). Noticeable eutrophication ofseveral small water bodies within the drainage of the North BosqueRiver and elevated nutrient concentrations in tributaries to theNorth Bosque River support the need for a reduction in nutrientloadings to the North Bosque River (Brazos River Authority, 1994;McFarland and Hauck, 1997a, 1997b).
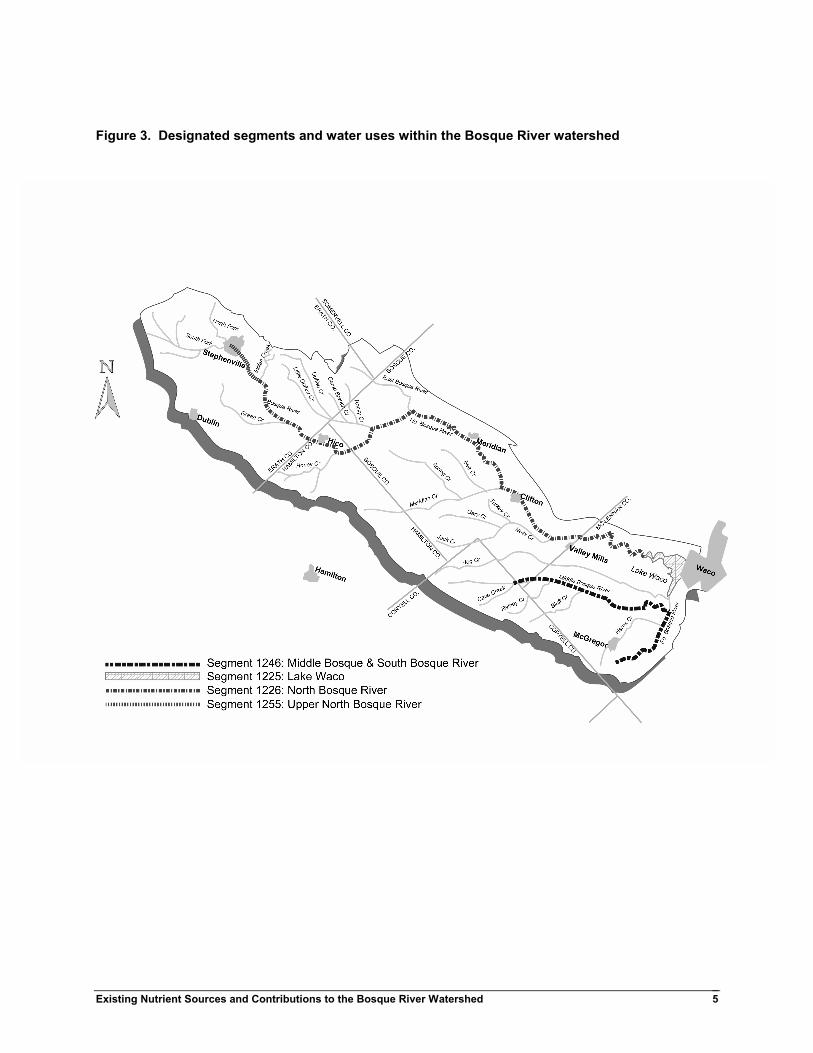
In a recent State of Texas Water Quality Inventory (TNRCC,1996), several comments address the water quality of classifiedstream segments along the North Bosque River (Figure 3).Segment 1226 is defined as the North Bosque River from a point328 feet upstream of Farm-to-Market Road 185 in McLennanCounty to a point immediately above the confluence of IndianCreek in Erath County. Segment 1255 is defined as the NorthBosque River from a point immediately above its confluence withIndian Creek to the confluence of the North and South Forks of theNorth Bosque River. Nonpoint source loadings are associated withelevated nutrient and fecal coliform levels within segments 1226
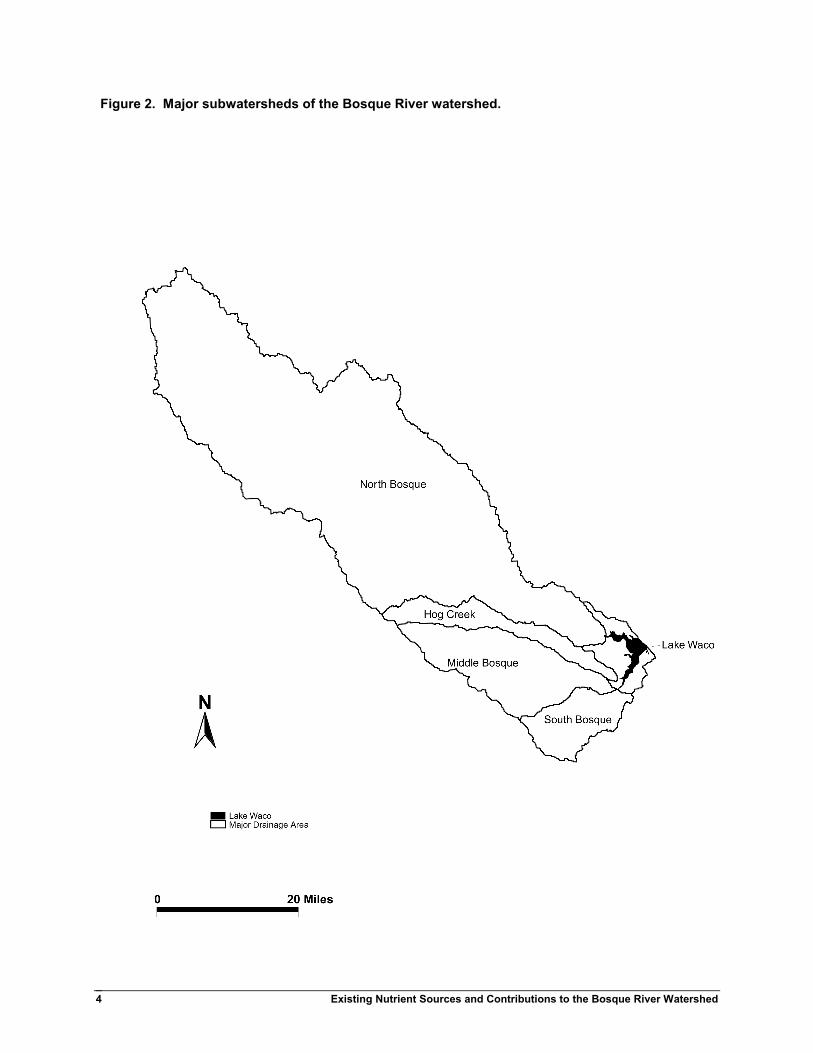
Existing Nutrient Sources and Contributions to the Bosque River Watershed4
Figure 2. Major subwatersheds of the Bosque River watershed.
Existing Nutrient Sources and Contributions to the Bosque River Watershed 5
Figure 3. Designated segments and water uses within the Bosque River watershed
Existing Nutrient Sources and Contributions to the Bosque River Watershed6
and 1225 and are described as the most serious threat to meetingthe designated of these segments. The State of Texas 1999 303(d)list contains the two North Bosque River segments, 1226 and 1255,and a draft schedule of total maximum daily load (TMDL)development for these segments (TNRCC, 1999). Nutrients are thefocus of this TMDL effort due to the role of nutrients in promotingexcessive algae growth as indicated by elevated chlorophyll-αlevels throughout segments 1226 and 1255 (TNRCC, 1999).
Of the other designated segments within the Bosque Riverwatershed, nonpoint source pollution loadings from agriculturaloperations are noted as concerns for segment 1246, the MiddleBosque/South Bosque River, and for segment 1225, Lake Waco.Elevated nitrogen levels are also noted for segment 1246. Segment1246 includes those portions of the Middle and South BosqueRivers located in McLennan County as well as a small portion ofthe Middle Bosque River in Coryell County up to the confluencewith Cave Creek (Figure 3).
Estimating nutrient loading from nonpoint sources is confoundedby the fact that they originate from widespread areas that arediffuse by nature and often only contribute following rainfall.Land-use export coefficients are one tool often used to estimatenutrient loadings from nonpoint sources (Loehr et al., 1989). Anutrient export coefficient represents the amount of a nutrienttransported from a given land use per unit area per unit time.Export coefficients are generally expressed in units, such aslbs/acre/yr, or on a per capita basis as a function of populationdensity (lbs/person/yr). Often generalized land-use exportcoefficients are used in watershed management planning ratherthan direct monitoring of land-use loadings due to the high costand labor involved in direct monitoring. Recently releasedwatershed loading models, such as WATERSHEDSS (WATER,Soil, and Hydro-Environmental Decision Support System)developed by the North Carolina State University Water QualityGroup (Osmond et al., 1997) and BASINS (Better AssessmentScience Integrating Point and Nonpoint Sources) developed by theU.S. Environmental Protection Agency (1998), present generalizedexport coefficients for many land uses, but allow the user to inputregionally specific coefficient values when available. Regionallyspecific export coefficients are recommended, becauseprecipitation, soils, and management practices associated withspecific land uses often vary between regions leading to verydifferent coefficient values for the same land use at differentlocations (Clesceri, et al., 1986).
Existing Nutrient Sources and Contributions to the Bosque River Watershed 7
In early 1991, TIAER began monitoring stream water quality in thedrainage area of the North Bosque River above Hico, Texas.While most early monitoring consisted of grab samples, a numberof automatic samplers were installed from late 1992 through 1993in the upper North Bosque River watershed (McFarland andHauck, 1995). In the fall of 1995, TIAER�s monitoring networkwas expanded to include sampling sites throughout the BosqueRiver watershed (McFarland and Hauck, 1998a). While themonitoring network has changed over the years with regards to thenumber of sites and specific site locations, a largely consistentrecord from November 1995 through March 1998 was available at17 automatic sampling sites representing locations throughout theBosque River watershed (Figure 4). These 17 stream samplingsites represent the best available watershed specific monitoringdata for estimating nutrient export coefficients for the various landuses within the Bosque River watershed.
The automatic samplers at these sites are programmed to collectstormwater samples and continuously measure water level. Sitespecific stage-discharge relationships are developed from manualmeasurements of flow and used to derive streamflow from thewater level data. Routine grab sampling at monthly or bi-weeklyintervals complements the stormwater monitoring to providecharacterization of base flow water quality conditions. Stormwaterand routine grab samples are analyzed for orthophosphate-phosphorus (PO4-P), total phosphorus (TP), total Kjeldahl nitrogen(TKN), ammonia-nitrogen (NH3-N), nitrite-nitrogen (NO2-N),nitrate-nitrogen (NO3-N), and total suspended solids (TSS). NO2-N, NO3-N and TKN are summed to provide a measurement of totalnitrogen (TN) in the water. Specific information on the locationand water quality associated with these sampling sites can be foundin TIAER�s semi-annual water quality reports, such as Easterling etal. (1998) and Pearson and McFarland (1999).
There are two objectives to this report. The first is to use astatistical approach to develop nutrient export coefficients specificto the land uses within the Bosque River watershed using in-streammonitoring data for the period November 1, 1995 through March30, 1998 for PO4-P, TP and TN. This specific time period waschosen to maximize the number of sites available for use in loadingcalculations, while maintaining as long a data period as possible toaccount for temporal fluctuations in weather. Prior to November1995, very little flow and water quality data were available forlocations in the lower portion of the watershed (McFarland andHauck, 1998a). After March 1998, several of the sampling sites inthe upper portion of the watershed were removed due to a re-
Existing Nutrient Sources and Contributions to the Bosque River Watershed8
prioritization of sampling needs (Pearson and McFarland, 1999).Two additional sites (NF020 on a tributary to the North Fork of theNorth Bosque River and NC060 on Neils Creek) were consideredfor this analysis but were removed from the analysis data set due tobackwater impacts on level recordings during large storm events.
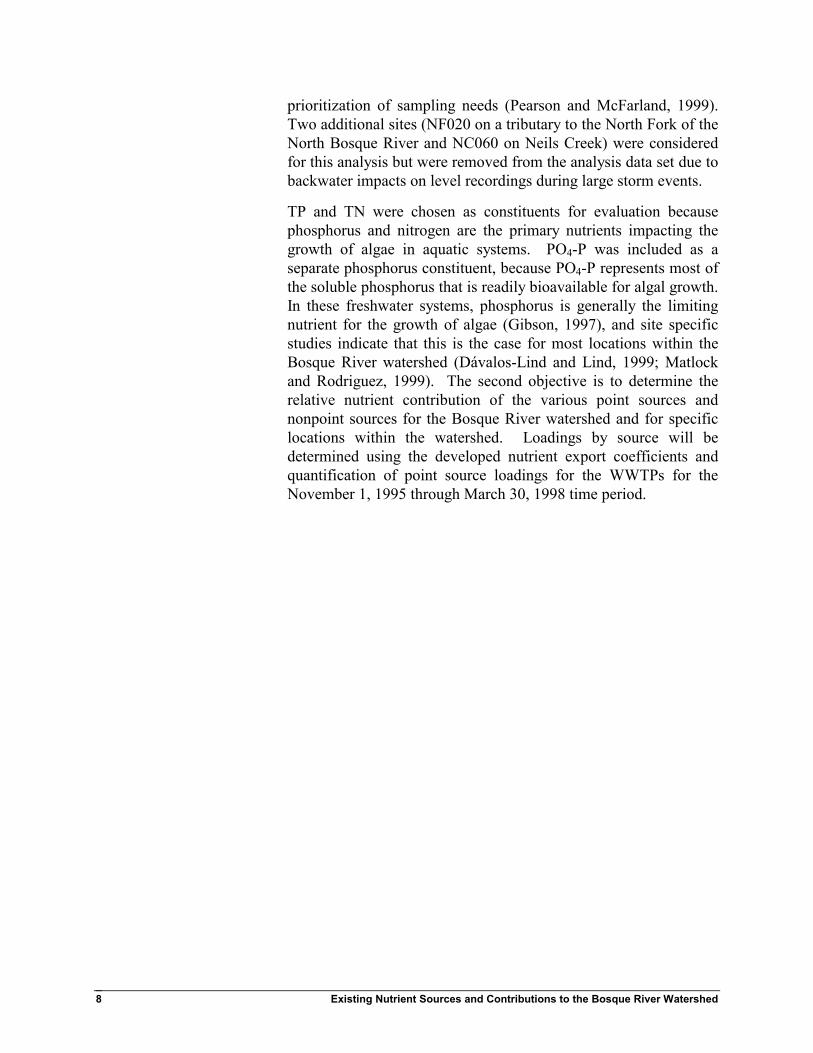
TP and TN were chosen as constituents for evaluation becausephosphorus and nitrogen are the primary nutrients impacting thegrowth of algae in aquatic systems. PO4-P was included as aseparate phosphorus constituent, because PO4-P represents most ofthe soluble phosphorus that is readily bioavailable for algal growth.In these freshwater systems, phosphorus is generally the limitingnutrient for the growth of algae (Gibson, 1997), and site specificstudies indicate that this is the case for most locations within theBosque River watershed (Dávalos-Lind and Lind, 1999; Matlockand Rodriguez, 1999). The second objective is to determine therelative nutrient contribution of the various point sources andnonpoint sources for the Bosque River watershed and for specificlocations within the watershed. Loadings by source will bedetermined using the developed nutrient export coefficients andquantification of point source loadings for the WWTPs for theNovember 1, 1995 through March 30, 1998 time period.

Existing Nutrient Sources and Contributions to the Bosque River Watershed 9
Figure 4. Location of sampling sites used in nutrient export coefficient analysis for the BosqueRiver watershed.

Existing Nutrient Sources and Contributions to the Bosque River Watershed10

Existing Nutrient Sources and Contributions to the Bosque River Watershed 11
METHODS
Land use information in conjunction with monitoring data wereused to estimate nutrient export coefficients for nonpoint sourcesof PO4-P, TP and TN by land-use category and to estimate therelative nutrient loadings by sector for point and nonpoint sourceswithin the watershed using the following steps:
1. Determine the dominant land uses within the watershed andthe percent of the drainage area above each monitoring siteassociated with these land uses.
2. Combine flow information with discrete measurements ofnutrient concentrations taken during storm events and baseflow to provide mass loadings for each sampling site.
3. Determine the nutrient export coefficients for urban landareas using mass loading information from the sole long-term, urban monitoring site (MB040).
4. Apply statistical models to determine optimal estimates ofthe nutrient export coefficients for the major agriculturalland use categories within the watershed.
5. Compare estimated nutrient export coefficients for urbanand agricultural land uses within the Bosque Riverwatershed to values from other studies to evaluate thereasonableness of the developed export coefficients.
6. Determine mass loadings for the eight-permitted pointsource discharges (municipal WWTPs effluents) in thewatershed using monitoring data and self-reporting effluentdischarge information.
7. Develop an empirical source-contribution model using thenutrient export coefficients, land-use, and point sourceinformation to estimate loadings by source.
8. Validate the empirical source-contribution model bycomparing measured nutrient loadings to predicted loadingsfor four sites along the North Bosque River (BO040,BO070, BO090 and BO100) not used in the developmentof the nutrient export coefficients (Step 4).

Existing Nutrient Sources and Contributions to the Bosque River Watershed12
9. Determine the nutrient contribution by source for the entirewatershed and various points within the watershed, and theuncertainty associated with these loading estimates.
Step 1. Determine Land Uses Above StreamSampling Sites
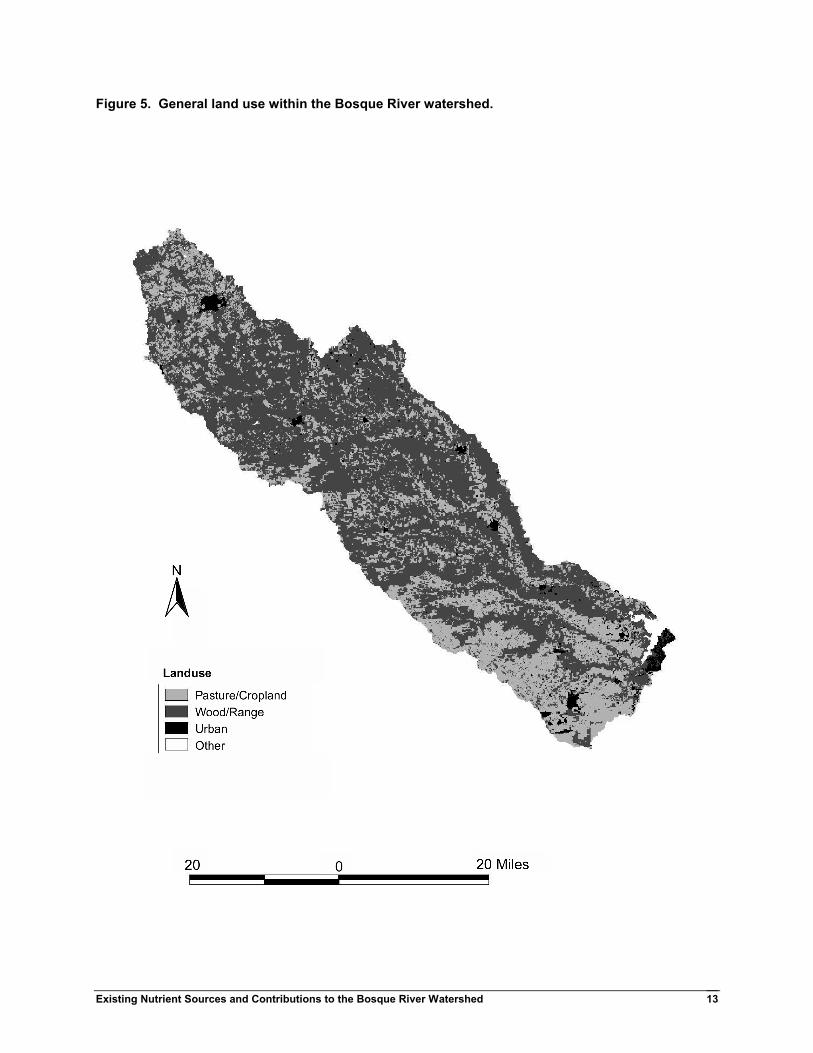
General land use descriptions were based on Landsat ThematicMapper imagery classification provided by the USDA-NRCSTemple State Office as a Geographic Information System (GIS)data layer. The land use data were developed from an August 1992overflight for Erath County and a June 1996 overflight for Bosque,Coryell, Erath, Hamilton, and McLennan counties. The June 1996image was taken during a drought period, which caused difficultiesin clearly distinguishing signatures between the differentvegetation types. Cloud cover in the June 1996 image also causedproblems in classifying the different land uses within the image. A1992 land use classification was available from a previous TIAERproject for the upper portion of the North Bosque River drainagefrom Hico, Texas and above. Extensive ground truthingimplemented in January through April 1998 indicated very littlechange in land use from 1992 to 1998 for the area of the watershedwithin Erath County. The 1992 land use classification was updatedto reflect the minor landuse changes from 1992 to 1998 andelectronically inserted into the 1996 scene to represent the upperportion of the watershed within Erath County. For the lowerportion of the Bosque watershed, digital orthophoto quadranglesfrom 1995 through 1996 and extensive ground truthing were usedto verify and update the land use classification. The dominantland-use categories classified from the Landsat images werewood/range, pasture, cropland, urban and other (Figure 5).
The wood/range areas of the Bosque River watershed are part ofthe Cross Timbers vegetation region of Texas and are comprisedprimarily of scrub live oak (Quercus virginiana) and juniper(Juniperus spp.) in the woodland areas with tallgrass species suchas little bluestem (Schizachyruim scoparium), indiangrass(Sorghastrum nutans) and switchgrass (Panicum virgatum) in thenative rangeland areas (Schuster and Hatch, 1990). Pasture fieldsare predominately Coastal bermudagrass (Cynodon spp.).
A refinement was made to the cropland land use category based onthe location of cropland areas within the watershed. Distinctdifferences in soil types and, thus, crops and management practices
Existing Nutrient Sources and Contributions to the Bosque River Watershed 13
Figure 5. General land use within the Bosque River watershed.

Existing Nutrient Sources and Contributions to the Bosque River Watershed14
occur in different portions of the watershed. Most cropland areasin the upper portion of the watershed (Hico and above) are used togrow forage sorghum (Sorghum spp.) and winter wheat (Triticumspp.) as a double-crop system. In the lower portion of thewatershed, particularly in the Hog Creek, Middle Bosque andSouth Bosque drainage areas, most cropland is used to grow rowcrops such as corn (Zea mays L.), grain sorghum (Sorghum spp.),soybeans (Glycine spp.) and cotton (Gossypium hirsutum L.). Forevaluating nutrient export, cropland fields located in the BosqueRiver watershed above Hico were categorized as non-row crop andcropland fields located in the watershed below Hico werecategorized as row crop.
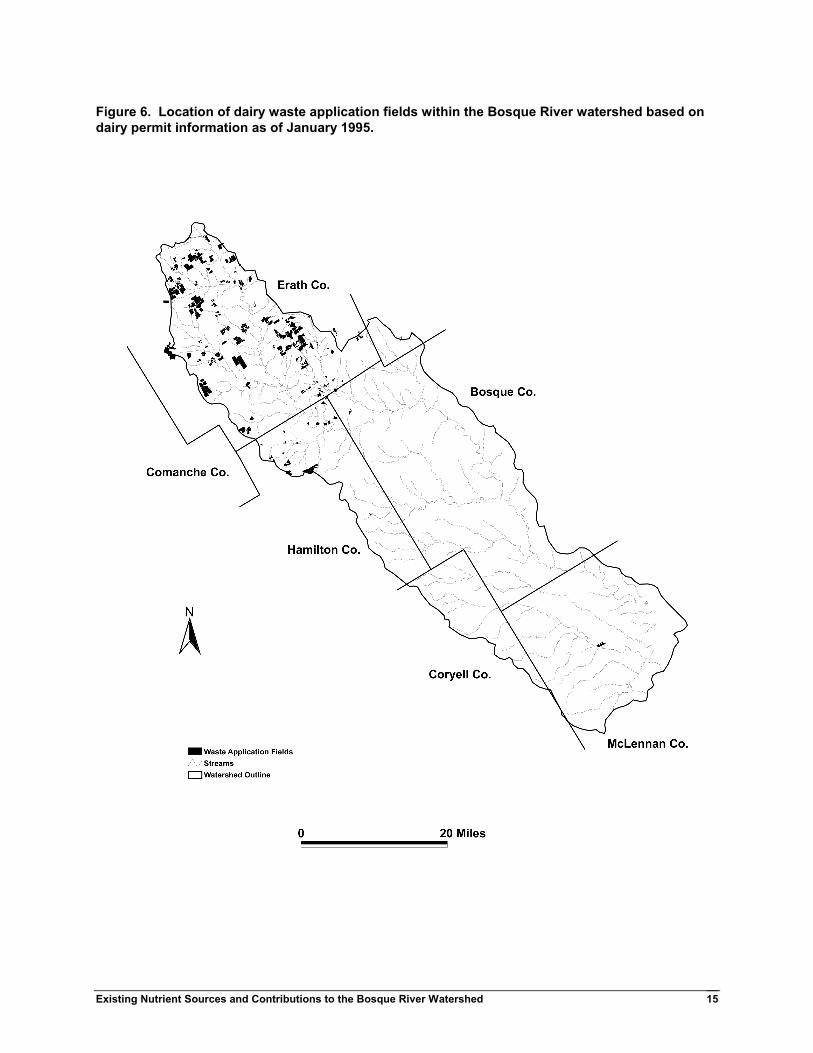
Dairy locations and waste application fields could not bedetermined from the Landsat imagery. This information wasobtained from dairy permits and dairy waste management plans onfile with the State�s environmental regulatory agency (the TexasNatural Resource Conservation Commission) and overlaid on thegeneral land use data layer to represent a separate land use category(Figure 6). Waste application fields represent areas permitted forliquid and/or solid manure application and are primarily coastalbermudagrass fields. Solid manure is generally surface appliedwithout incorporation on coastal bermudagrass fields, while avariety of irrigation systems are used to apply the liquid effluent.In the watershed, over 74 percent of the permitted dairy wasteapplication fields are described as coastal bermudagrass fields(McFarland and Hauck, 1995), although crop rotations of sorghumand winter wheat are not uncommon. Operating dairies and thelocation of dairy waste application fields represent information asof January 1995.
The drainage areas above sampling sites (Table 2) were delineatedfrom U.S. Geological Survey (USGS) 1:24,000 digital elevationmodels (DEMs) and USGS 7 ½-minute quadrangle maps digitizedby the USDA-NRCS. The size of drainage areas for specific sitesmay vary somewhat from previous TIAER reports (less than 0.1percent), particularly in the lower portion of the watershed, due tore-calculation of these drainage areas using an ARC/INFO ratherthan a GRASS (Geographic Resources Analysis Support System)based GIS platform. Land use composition within the drainagearea above each sampling site was calculated by overlaying thedrainage area and land use data layers within the GIS system. Thiswas done for the individual sampling sites (Table 2) and for theentire Bosque River watershed and its major subwatersheds (Table3).
Existing Nutrient Sources and Contributions to the Bosque River Watershed 15
Figure 6. Location of dairy waste application fields within the Bosque River watershed based ondairy permit information as of January 1995.
Existing Nutrient Sources and Contributions to the Bosque River Watershed16
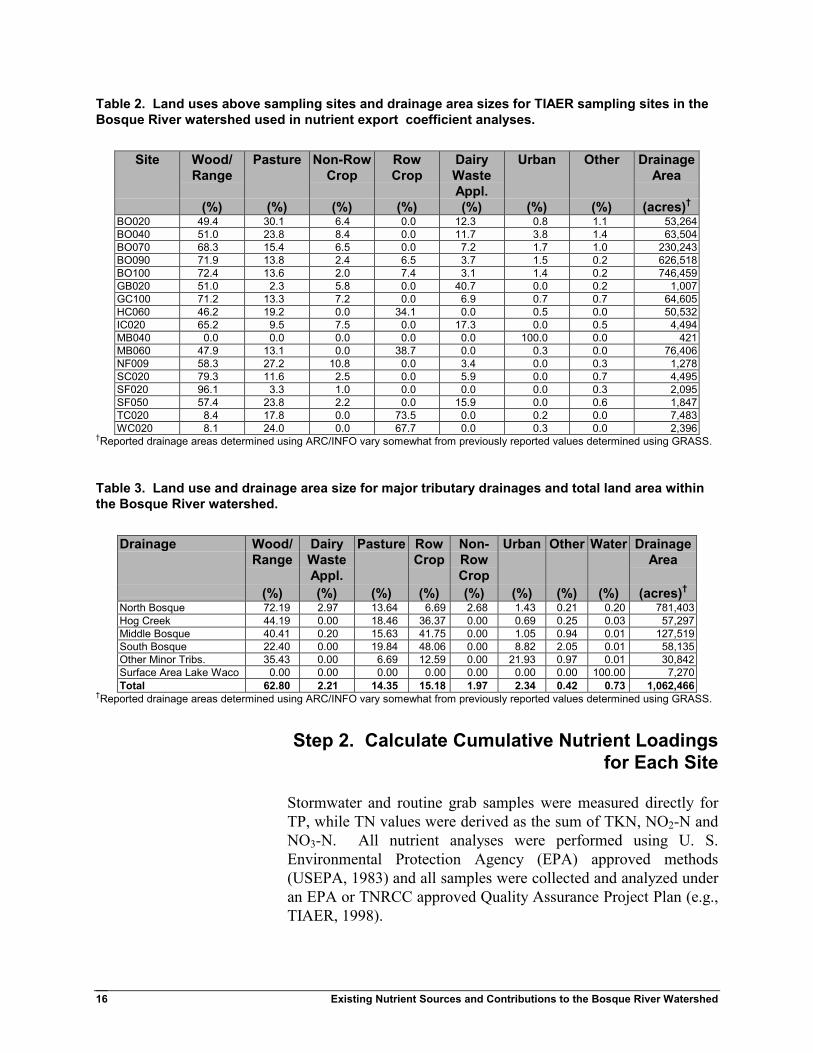
Table 2. Land uses above sampling sites and drainage area sizes for TIAER sampling sites in theBosque River watershed used in nutrient export coefficient analyses.
Site Wood/Range
Pasture Non-RowCrop
RowCrop
DairyWasteAppl.
Urban Other DrainageArea
(%) (%) (%) (%) (%) (%) (%) (acres)�
BO020 49.4 30.1 6.4 0.0 12.3 0.8 1.1 53,264BO040 51.0 23.8 8.4 0.0 11.7 3.8 1.4 63,504BO070 68.3 15.4 6.5 0.0 7.2 1.7 1.0 230,243BO090 71.9 13.8 2.4 6.5 3.7 1.5 0.2 626,518BO100 72.4 13.6 2.0 7.4 3.1 1.4 0.2 746,459GB020 51.0 2.3 5.8 0.0 40.7 0.0 0.2 1,007GC100 71.2 13.3 7.2 0.0 6.9 0.7 0.7 64,605HC060 46.2 19.2 0.0 34.1 0.0 0.5 0.0 50,532IC020 65.2 9.5 7.5 0.0 17.3 0.0 0.5 4,494MB040 0.0 0.0 0.0 0.0 0.0 100.0 0.0 421MB060 47.9 13.1 0.0 38.7 0.0 0.3 0.0 76,406NF009 58.3 27.2 10.8 0.0 3.4 0.0 0.3 1,278SC020 79.3 11.6 2.5 0.0 5.9 0.0 0.7 4,495SF020 96.1 3.3 1.0 0.0 0.0 0.0 0.3 2,095SF050 57.4 23.8 2.2 0.0 15.9 0.0 0.6 1,847TC020 8.4 17.8 0.0 73.5 0.0 0.2 0.0 7,483WC020 8.1 24.0 0.0 67.7 0.0 0.3 0.0 2,396
�Reported drainage areas determined using ARC/INFO vary somewhat from previously reported values determined using GRASS.
Table 3. Land use and drainage area size for major tributary drainages and total land area withinthe Bosque River watershed.
Drainage Wood/Range
DairyWasteAppl.
Pasture RowCrop
Non-RowCrop
Urban Other Water DrainageArea
(%) (%) (%) (%) (%) (%) (%) (%) (acres)�
North Bosque 72.19 2.97 13.64 6.69 2.68 1.43 0.21 0.20 781,403Hog Creek 44.19 0.00 18.46 36.37 0.00 0.69 0.25 0.03 57,297Middle Bosque 40.41 0.20 15.63 41.75 0.00 1.05 0.94 0.01 127,519South Bosque 22.40 0.00 19.84 48.06 0.00 8.82 2.05 0.01 58,135Other Minor Tribs. 35.43 0.00 6.69 12.59 0.00 21.93 0.97 0.01 30,842Surface Area Lake Waco 0.00 0.00 0.00 0.00 0.00 0.00 0.00 100.00 7,270Total 62.80 2.21 14.35 15.18 1.97 2.34 0.42 0.73 1,062,466
�Reported drainage areas determined using ARC/INFO vary somewhat from previously reported values determined using GRASS.
Step 2. Calculate Cumulative Nutrient Loadingsfor Each Site
Stormwater and routine grab samples were measured directly forTP, while TN values were derived as the sum of TKN, NO2-N andNO3-N. All nutrient analyses were performed using U. S.Environmental Protection Agency (EPA) approved methods(USEPA, 1983) and all samples were collected and analyzed underan EPA or TNRCC approved Quality Assurance Project Plan (e.g.,TIAER, 1998).

Existing Nutrient Sources and Contributions to the Bosque River Watershed 17
Water level was monitored at each sampling site at five-minuteintervals throughout the evaluation period. A stage-dischargerelationship for most sites was determined from individualmeasurements of flow taken at a variety of water levels or streamstages. Manual flow measurements were made on an opportunisticbasis representing a variety of streamflow conditions. Pairs ofwater level and flow data were then related to the cross-sectionalarea of the stream at each site and stream stage to develop sitespecific stage-discharge relationships. These relationships areupdated if meaningful changes occur to a site�s cross-sectionalarea. A semi-log relationship of average stream velocity to waterlevel (log) was used to extrapolate flow for stream levels abovewhich manual measurements could not be safely made. Becausestream sites TC020 and WC020 are located at road culverts,hydraulic equations were applied to determine the stage-dischargerelationship for these sites. At sites BO090 and BO100 flow datafrom corresponding USGS sites, 08095000 and 08095200respectively, were obtained for use in this report. Flow at BO070was calculated using the USGS stage-discharge relationship forstation 08094800 in conjunction with level data measured byTIAER.
Flow data were then combined with the nutrient concentration datato calculate cumulative nutrient loadings at each site. This wasdone using a midpoint rectangular integration method to calculateloadings by dividing the flow hydrograph into intervals based onthe collection date and time of each water quality sample (Stein,1977). Stormwater samples were generally collected using a setsampling frequency depending on the size of the drainage areaabove the sampling site with more frequent sampling on thetypically fast rising portion of the hydrograph and less frequentsampling on the typically slow receding portion of the hydrograph.A typical storm sampling sequence involved 1) an initial sample,2) three samples at one-hour intervals, 3) four samples at two-hourintervals, and 4) all remaining samples for a storm event at six-hour intervals. Grab samples were collected bi-weekly during thestudy period and used to characterize base flow conditions. Thehistory of nutrient loading at each site was summed for theevaluation period to obtain cumulative loadings over the studyperiod. Cumulative loadings were prorated on an annual basis andarea weighted for use in deriving nutrient export coefficients(Table 4).
In addition to the land use and WWTP loadings, the loadings ofsoluble phosphorus and nitrogen in precipitation to the surface areaof Lake Waco were estimated based on analysis of precipitation
Existing Nutrient Sources and Contributions to the Bosque River Watershed18
data collected in the wet-dry atmospheric samplers located nearStephenville and Lake Waco. The Stephenville site was installedOctober 1996, while the Lake Waco site was installed in August1997. No statistical differences were indicated in the constituentconcentrations measured at these two sites, so data were combinedto estimate precipitation loadings of nutrients to Lake Waco.
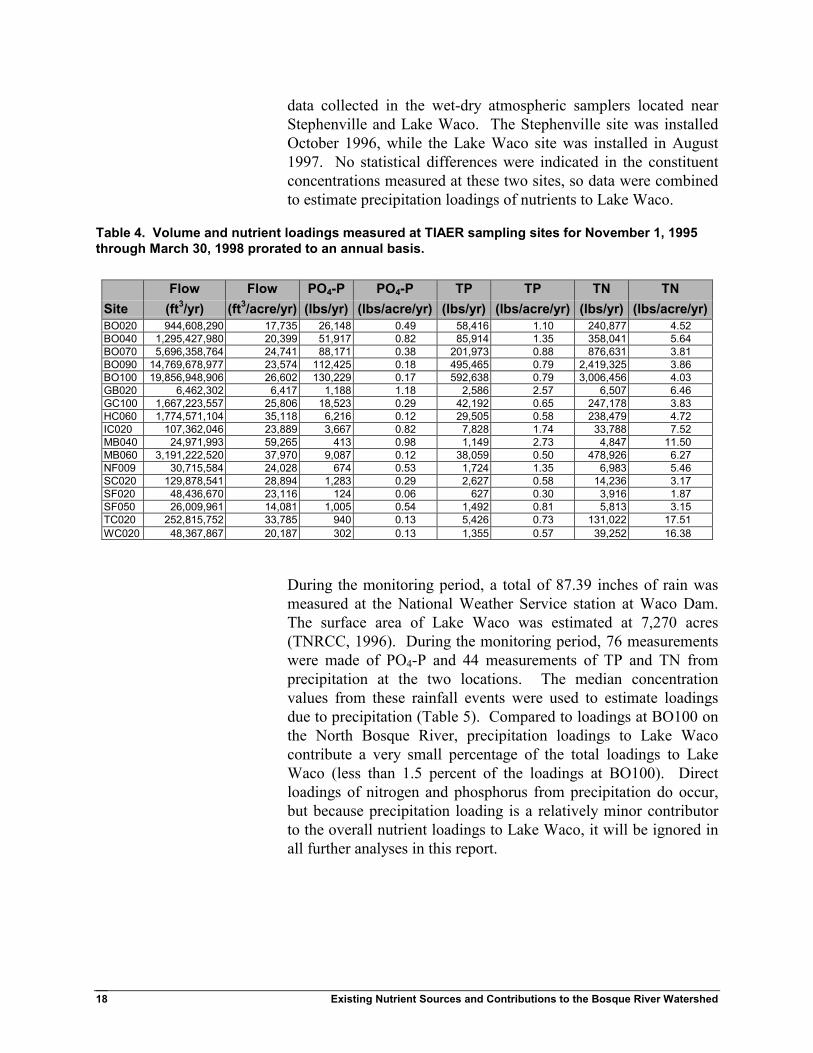
Table 4. Volume and nutrient loadings measured at TIAER sampling sites for November 1, 1995through March 30, 1998 prorated to an annual basis.
Flow Flow PO4-P PO4-P TP TP TN TNSite (ft3/yr) (ft3/acre/yr) (lbs/yr) (lbs/acre/yr) (lbs/yr) (lbs/acre/yr) (lbs/yr) (lbs/acre/yr)BO020 944,608,290 17,735 26,148 0.49 58,416 1.10 240,877 4.52BO040 1,295,427,980 20,399 51,917 0.82 85,914 1.35 358,041 5.64BO070 5,696,358,764 24,741 88,171 0.38 201,973 0.88 876,631 3.81BO090 14,769,678,977 23,574 112,425 0.18 495,465 0.79 2,419,325 3.86BO100 19,856,948,906 26,602 130,229 0.17 592,638 0.79 3,006,456 4.03GB020 6,462,302 6,417 1,188 1.18 2,586 2.57 6,507 6.46GC100 1,667,223,557 25,806 18,523 0.29 42,192 0.65 247,178 3.83HC060 1,774,571,104 35,118 6,216 0.12 29,505 0.58 238,479 4.72IC020 107,362,046 23,889 3,667 0.82 7,828 1.74 33,788 7.52MB040 24,971,993 59,265 413 0.98 1,149 2.73 4,847 11.50MB060 3,191,222,520 37,970 9,087 0.12 38,059 0.50 478,926 6.27NF009 30,715,584 24,028 674 0.53 1,724 1.35 6,983 5.46SC020 129,878,541 28,894 1,283 0.29 2,627 0.58 14,236 3.17SF020 48,436,670 23,116 124 0.06 627 0.30 3,916 1.87SF050 26,009,961 14,081 1,005 0.54 1,492 0.81 5,813 3.15TC020 252,815,752 33,785 940 0.13 5,426 0.73 131,022 17.51WC020 48,367,867 20,187 302 0.13 1,355 0.57 39,252 16.38
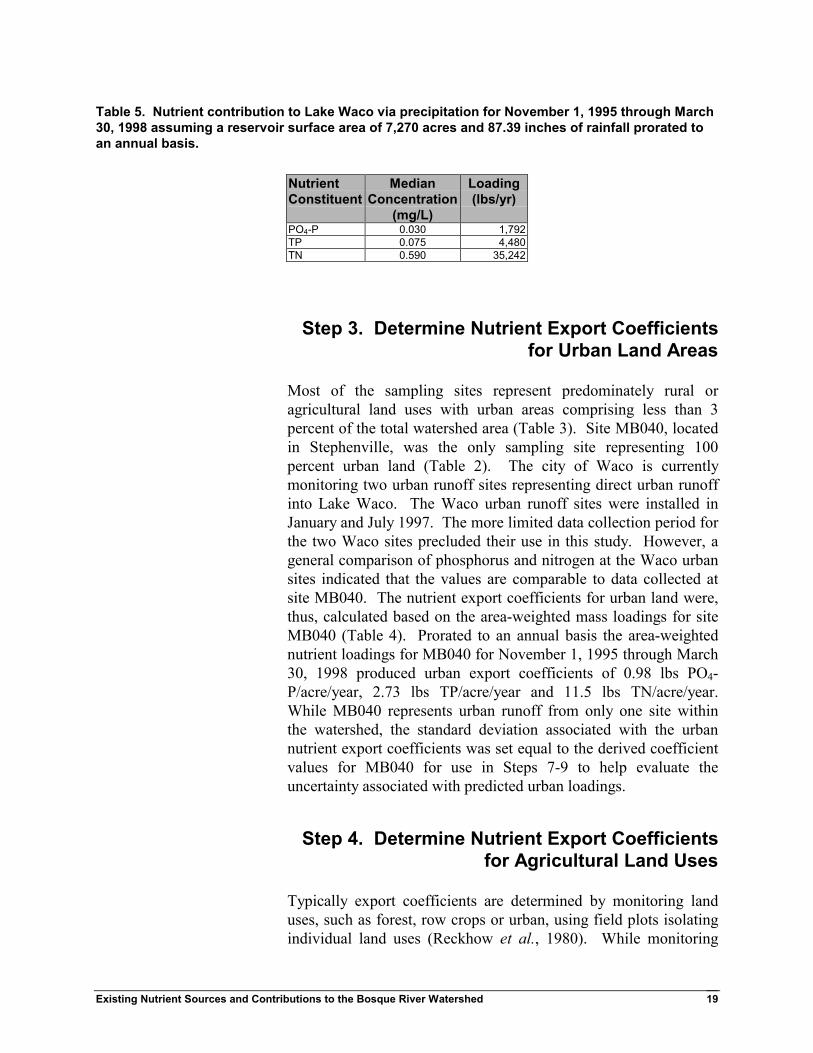
During the monitoring period, a total of 87.39 inches of rain wasmeasured at the National Weather Service station at Waco Dam.The surface area of Lake Waco was estimated at 7,270 acres(TNRCC, 1996). During the monitoring period, 76 measurementswere made of PO4-P and 44 measurements of TP and TN fromprecipitation at the two locations. The median concentrationvalues from these rainfall events were used to estimate loadingsdue to precipitation (Table 5). Compared to loadings at BO100 onthe North Bosque River, precipitation loadings to Lake Wacocontribute a very small percentage of the total loadings to LakeWaco (less than 1.5 percent of the loadings at BO100). Directloadings of nitrogen and phosphorus from precipitation do occur,but because precipitation loading is a relatively minor contributorto the overall nutrient loadings to Lake Waco, it will be ignored inall further analyses in this report.
Existing Nutrient Sources and Contributions to the Bosque River Watershed 19
Table 5. Nutrient contribution to Lake Waco via precipitation for November 1, 1995 through March30, 1998 assuming a reservoir surface area of 7,270 acres and 87.39 inches of rainfall prorated toan annual basis.
NutrientConstituent
MedianConcentration
(mg/L)
Loading(lbs/yr)
PO4-P 0.030 1,792TP 0.075 4,480TN 0.590 35,242
Step 3. Determine Nutrient Export Coefficientsfor Urban Land Areas
Most of the sampling sites represent predominately rural oragricultural land uses with urban areas comprising less than 3percent of the total watershed area (Table 3). Site MB040, locatedin Stephenville, was the only sampling site representing 100percent urban land (Table 2). The city of Waco is currentlymonitoring two urban runoff sites representing direct urban runoffinto Lake Waco. The Waco urban runoff sites were installed inJanuary and July 1997. The more limited data collection period forthe two Waco sites precluded their use in this study. However, ageneral comparison of phosphorus and nitrogen at the Waco urbansites indicated that the values are comparable to data collected atsite MB040. The nutrient export coefficients for urban land were,thus, calculated based on the area-weighted mass loadings for siteMB040 (Table 4). Prorated to an annual basis the area-weightednutrient loadings for MB040 for November 1, 1995 through March30, 1998 produced urban export coefficients of 0.98 lbs PO4-P/acre/year, 2.73 lbs TP/acre/year and 11.5 lbs TN/acre/year.While MB040 represents urban runoff from only one site withinthe watershed, the standard deviation associated with the urbannutrient export coefficients was set equal to the derived coefficientvalues for MB040 for use in Steps 7-9 to help evaluate theuncertainty associated with predicted urban loadings.
Step 4. Determine Nutrient Export Coefficientsfor Agricultural Land Uses
Typically export coefficients are determined by monitoring landuses, such as forest, row crops or urban, using field plots isolatingindividual land uses (Reckhow et al., 1980). While monitoring
Existing Nutrient Sources and Contributions to the Bosque River Watershed20
single land-use watersheds may be ideal, most watersheds arecomprised of a variety of land uses. The sampling network in theBosque River watershed was designed to monitor nutrients andflow at stream sites with upstream drainage areas comprised ofmixtures of land uses (McFarland and Hauck, 1998a).
To isolate the loading contribution from these mixed land-usedrainage areas, multiple regression techniques were used todevelop the nutrient export coefficients for the major agriculturalland uses in the watershed based on procedures described byHodge and Armstrong (1993). The dependent variable was thenutrient loading at each site (Table 4), and the independentvariables were the fraction of the drainage area above each siterepresented by each land-use category (Table 2). The coefficientsfrom the resulting multiple regression models define optimizedexport coefficients across all sites for each land use category forthe time period evaluated. All multiple regression models weredeveloped using a forced zero intercept, thus, giving a loading ofzero if all land-use categories represented a zero fraction of thewatershed. The procedures used follow closely those outlined inMcFarland and Hauck (1998a) in their development of preliminarynutrient export coefficients for this watershed.
Of the 17 sites considered, 12 sites were used in estimating nutrientexport coefficients for agricultural land uses. Sites BO040,BO070, BO090 and BO100 were reserved to validate the derivednutrient export coefficients, while site MB040 was used tocalculate the urban nutrient export coefficients. Only the majorland use categories of dairy waste application fields, pasture, non-row crop fields, row-crop fields and wood/range were consideredas independent variables in the multiple regression models. Allminor land uses represented as �other� in the land use classificationrepresented relatively small percentages of the land cover and wereassumed to be minor contributors (Table 2). Contributions for the�other� land-use category were considered part of the error term inthe coefficient calculations.
Land uses were judiciously categorized to minimizemulticolinearity effects in the multiple regression modelprocedures to obtain reasonable export coefficient estimates.Different groupings of sites were used to evaluate phosphorus andnitrogen export coefficients for the various land use categories dueto observed loading differences at predominately cropland sitesthroughout the watershed. Specific methods used for estimatingthe phosphorus and nitrogen export coefficients are describedbelow.

Existing Nutrient Sources and Contributions to the Bosque River Watershed 21
Phosphorus Export Coefficients: Three land-use categorygroupings were used to develop the phosphorus export coefficientsfor the rural land uses in the watershed: dairy waste applicationfields, pasture/cropland and range/wood. To minimize the impactsof multicolinearity, the pasture and cropland categories were joinedinto the combined land use category of pasture/cropland. Croplandfor the phosphorus constituents included both non-row and row-crop fields as there appeared to be little difference in thephosphorus runoff at sites associated with these two land uses(Table 4).
In comparing the information in Tables 2 and 4, much largerphosphorus loadings are generally associated with sites containingsubstantial percentages of dairy waste application fields than withother sites. To avoid confounding phosphorus loadings from dairywaste application fields with other land uses, rural sampling siteswithout (or with minimal) dairy waste application fields in theirdrainage areas were grouped to estimate phosphorus exportcoefficients for the less impacted land uses of wood/range andpasture/cropland. The sites with no or minimal dairy wasteapplication fields included HC060, MB060, SF020, TC020 andWC020. A multiple regression model using the fraction ofpasture/cropland and wood/range as the independent variables andthe phosphorus loading at these sites as the dependent variable wasdeveloped to estimate the phosphorus export coefficients forpasture/cropland and wood/range as follows:
Pi = βP1Xi,1 + βP2Xi,2 + εi (1)
Where
i = the individual sites used in the regression model (forthis specific model only data from sites HC060,MB060, SF020, TC020 and WC020 was used),
Pi = the annualized phosphorus loading at site i on a peracre basis of either PO4-P or TP for the time period(lbs/acre/yr),
βP1 = the phosphorus export coefficient forpasture/cropland (lbs/acre/yr),
Xi,1 = the fraction of the land area above site i representedby pasture/cropland,
βP2 = the phosphorus export coefficient for wood/range(lbs/acre/yr),
Existing Nutrient Sources and Contributions to the Bosque River Watershed22
Xi,2 = the fraction of the land area above site i representedby wood/range,
εi = the random error associated with the differencebetween the measured and predicted loadings that isnot explained by the model for site i.
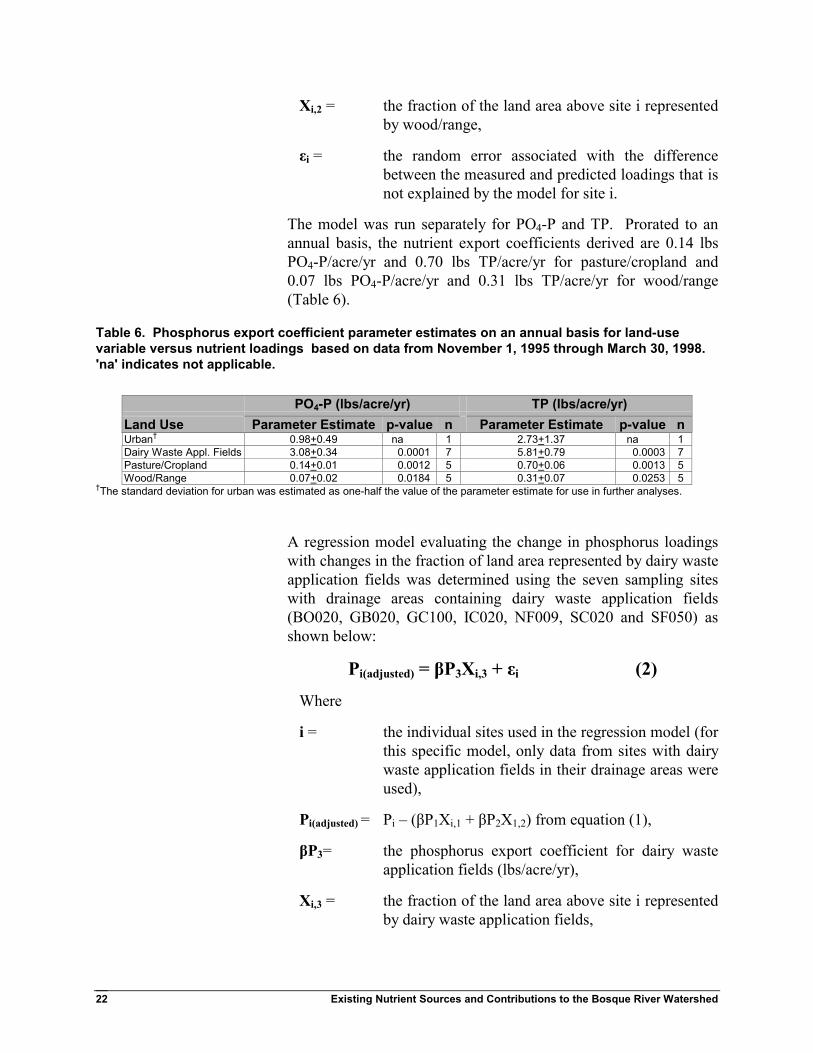
The model was run separately for PO4-P and TP. Prorated to anannual basis, the nutrient export coefficients derived are 0.14 lbsPO4-P/acre/yr and 0.70 lbs TP/acre/yr for pasture/cropland and0.07 lbs PO4-P/acre/yr and 0.31 lbs TP/acre/yr for wood/range(Table 6).
Table 6. Phosphorus export coefficient parameter estimates on an annual basis for land-usevariable versus nutrient loadings based on data from November 1, 1995 through March 30, 1998.'na' indicates not applicable.
PO4-P (lbs/acre/yr) TP (lbs/acre/yr)Land Use Parameter Estimate p-value n Parameter Estimate p-value nUrban� 0.98+0.49 na 1 2.73+1.37 na 1Dairy Waste Appl. Fields 3.08+0.34 0.0001 7 5.81+0.79 0.0003 7Pasture/Cropland 0.14+0.01 0.0012 5 0.70+0.06 0.0013 5Wood/Range 0.07+0.02 0.0184 5 0.31+0.07 0.0253 5
�The standard deviation for urban was estimated as one-half the value of the parameter estimate for use in further analyses.
A regression model evaluating the change in phosphorus loadingswith changes in the fraction of land area represented by dairy wasteapplication fields was determined using the seven sampling siteswith drainage areas containing dairy waste application fields(BO020, GB020, GC100, IC020, NF009, SC020 and SF050) asshown below:
Pi(adjusted) = βP3Xi,3 + εi (2)
Where
i = the individual sites used in the regression model (forthis specific model, only data from sites with dairywaste application fields in their drainage areas wereused),
Pi(adjusted) = Pi � (βP1Xi,1 + βP2X1,2) from equation (1),
βP3= the phosphorus export coefficient for dairy wasteapplication fields (lbs/acre/yr),
Xi,3 = the fraction of the land area above site i representedby dairy waste application fields,

Existing Nutrient Sources and Contributions to the Bosque River Watershed 23
εi = the random error associated with the differencebetween the measured and predicted loadings that isnot explained by the model for site i.
As indicated, equation (2) adjusts the loading Pi for the loading dueto pasture/cropland and wood/range as calculated from equation(1). Prorated to an annual basis the export coefficients derived fordairy waste application fields are 3.08 lbs PO4-P/acre/yr and 5.81lbs TP/acre/yr (Table 6).
Nitrogen Export Coefficients: The land-use category groupingsused to estimate the rural total-N export coefficients are the sameas those for the phosphorus export coefficients (i.e., wood/range,pasture/cropland, and dairy waste application fields) except arefinement was made to the pasture/cropland grouping. Previouslydeveloped export coefficients for the upper North Bosque Riverwatershed indicated the validity of grouping pasture and croplandtogether for all nutrients for that subwatershed of the Bosque Riverwatershed (McFarland and Hauck, 1998b). The nutrient loadingdata (Table 4) and known differences in farming practices and soiltypes in the Bosque River watershed south of Hico, however,indicated the need to redefine the pasture/cropland grouping for thenitrogen export coefficients.
Much of the cropland in the upper portion of the watershedinvolves a double-cropping pattern of forage sorghum in thesummer followed by a winter small grain, such as wheat or rye, asdescribed in Step 1. Conditions, particularly soils, in the lowerportion of the watershed are favorable for row crops such as cornand soybeans, which are typically not associated with a wintercrop. Soil differences throughout the watershed contribute greatlyto this change in cropping patterns as noted in USDA-NRCS soilsurveys for Bosque, Coryell, Erath, Hamilton and McLennancounties. The nutrient loading data for sites in the lower portion ofthe watershed associated with row crop agriculture (TC020 andWC020, and to a lesser extent HC060 and MB060) showed highnitrogen loadings but fairly low phosphorus loadings incomparison to the other sites in the watershed (Table 4). Thesesame high nitrogen loadings did not appear to be associated withthe non-row crop agriculture associated with sites in the upperportion of the watershed. To account for this observed differencein nitrogen loadings between the row crop and non-row cropcategories, row crop was evaluated as a separate land use category,although pasture and non-row crop areas were still combined fordetermining the export coefficients for TN.
Existing Nutrient Sources and Contributions to the Bosque River Watershed24
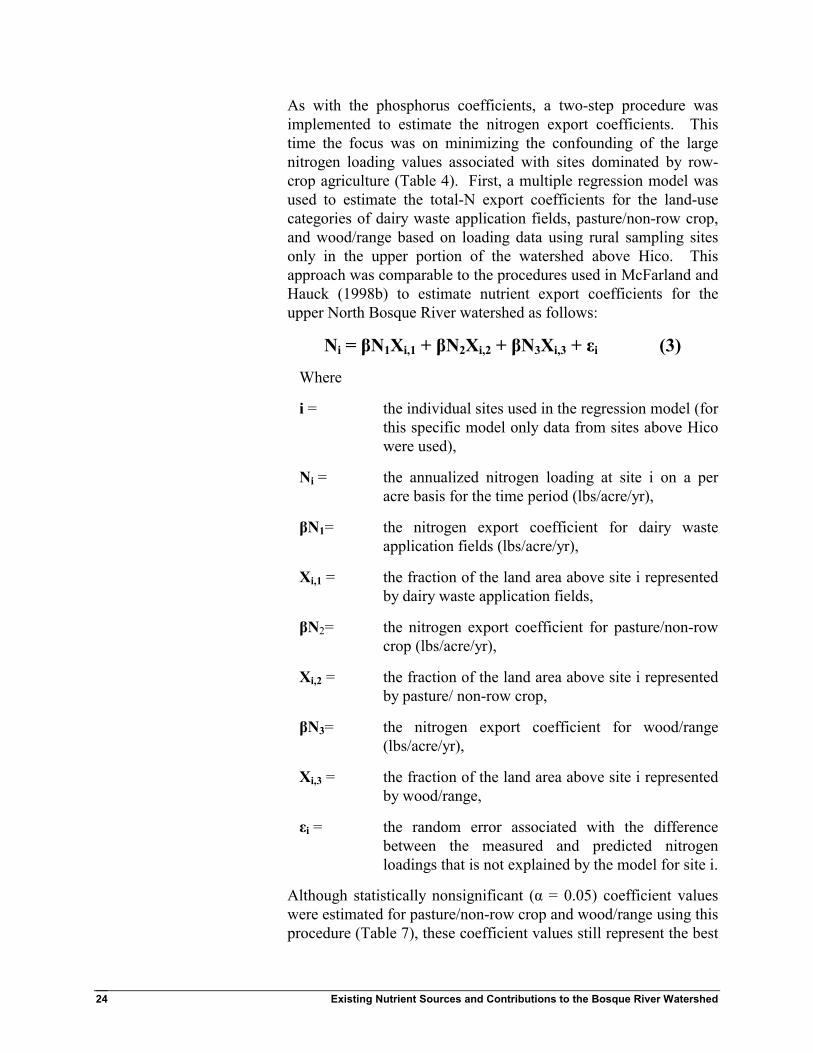
As with the phosphorus coefficients, a two-step procedure wasimplemented to estimate the nitrogen export coefficients. Thistime the focus was on minimizing the confounding of the largenitrogen loading values associated with sites dominated by row-crop agriculture (Table 4). First, a multiple regression model wasused to estimate the total-N export coefficients for the land-usecategories of dairy waste application fields, pasture/non-row crop,and wood/range based on loading data using rural sampling sitesonly in the upper portion of the watershed above Hico. Thisapproach was comparable to the procedures used in McFarland andHauck (1998b) to estimate nutrient export coefficients for theupper North Bosque River watershed as follows:
Ni = βN1Xi,1 + βN2Xi,2 + βN3Xi,3 + εi (3)
Where
i = the individual sites used in the regression model (forthis specific model only data from sites above Hicowere used),
Ni = the annualized nitrogen loading at site i on a peracre basis for the time period (lbs/acre/yr),
βN1= the nitrogen export coefficient for dairy wasteapplication fields (lbs/acre/yr),
Xi,1 = the fraction of the land area above site i representedby dairy waste application fields,
βN2= the nitrogen export coefficient for pasture/non-rowcrop (lbs/acre/yr),
Xi,2 = the fraction of the land area above site i representedby pasture/ non-row crop,
βN3= the nitrogen export coefficient for wood/range(lbs/acre/yr),
Xi,3 = the fraction of the land area above site i representedby wood/range,
εi = the random error associated with the differencebetween the measured and predicted nitrogenloadings that is not explained by the model for site i.
Although statistically nonsignificant (α = 0.05) coefficient valueswere estimated for pasture/non-row crop and wood/range using thisprocedure (Table 7), these coefficient values still represent the best
Existing Nutrient Sources and Contributions to the Bosque River Watershed 25
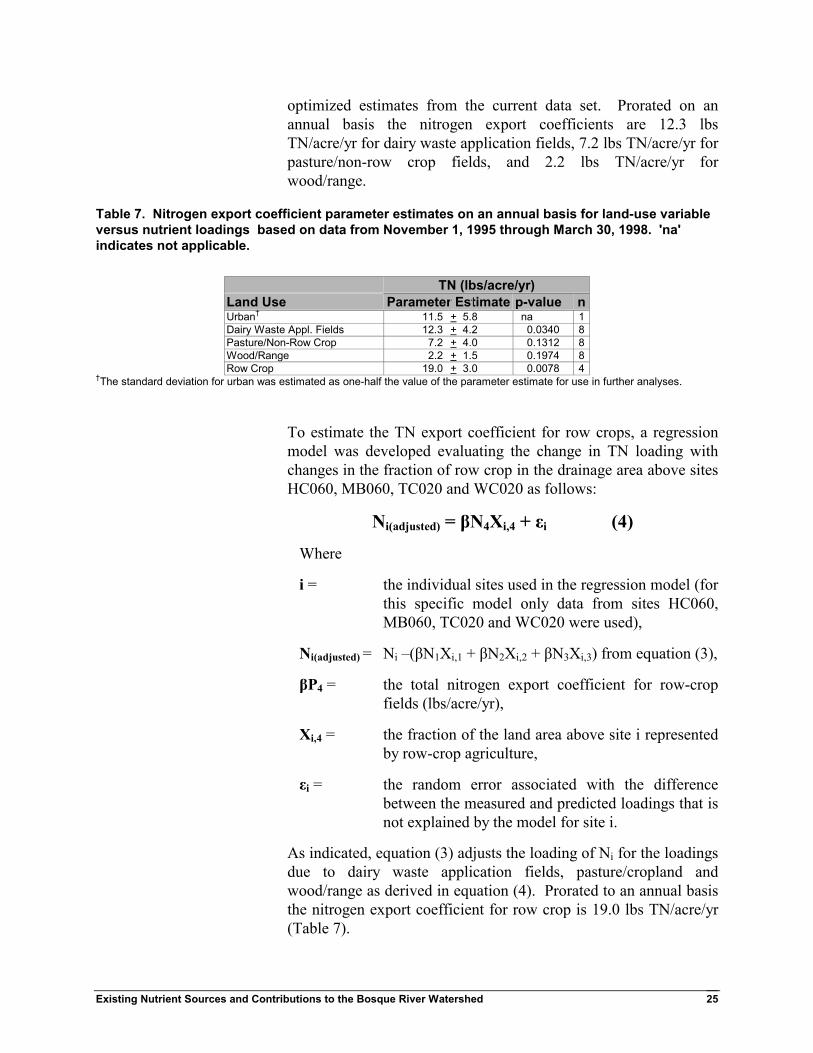
optimized estimates from the current data set. Prorated on anannual basis the nitrogen export coefficients are 12.3 lbsTN/acre/yr for dairy waste application fields, 7.2 lbs TN/acre/yr forpasture/non-row crop fields, and 2.2 lbs TN/acre/yr forwood/range.
Table 7. Nitrogen export coefficient parameter estimates on an annual basis for land-use variableversus nutrient loadings based on data from November 1, 1995 through March 30, 1998. 'na'indicates not applicable.
TN (lbs/acre/yr)Land Use Parameter Estimate p-value nUrban� 11.5 + 5.8 na 1Dairy Waste Appl. Fields 12.3 + 4.2 0.0340 8Pasture/Non-Row Crop 7.2 + 4.0 0.1312 8Wood/Range 2.2 + 1.5 0.1974 8Row Crop 19.0 + 3.0 0.0078 4
�The standard deviation for urban was estimated as one-half the value of the parameter estimate for use in further analyses.
To estimate the TN export coefficient for row crops, a regressionmodel was developed evaluating the change in TN loading withchanges in the fraction of row crop in the drainage area above sitesHC060, MB060, TC020 and WC020 as follows:
Ni(adjusted) = βN4Xi,4 + εi (4)
Where
i = the individual sites used in the regression model (forthis specific model only data from sites HC060,MB060, TC020 and WC020 were used),
Ni(adjusted) = Ni �(βN1Xi,1 + βN2Xi,2 + βN3Xi,3) from equation (3),
βP4 = the total nitrogen export coefficient for row-cropfields (lbs/acre/yr),
Xi,4 = the fraction of the land area above site i representedby row-crop agriculture,
εi = the random error associated with the differencebetween the measured and predicted loadings that isnot explained by the model for site i.
As indicated, equation (3) adjusts the loading of Ni for the loadingsdue to dairy waste application fields, pasture/cropland andwood/range as derived in equation (4). Prorated to an annual basisthe nitrogen export coefficient for row crop is 19.0 lbs TN/acre/yr(Table 7).
Existing Nutrient Sources and Contributions to the Bosque River Watershed26
Step 5. Compare Calculated Export Coefficientsto Literature Values
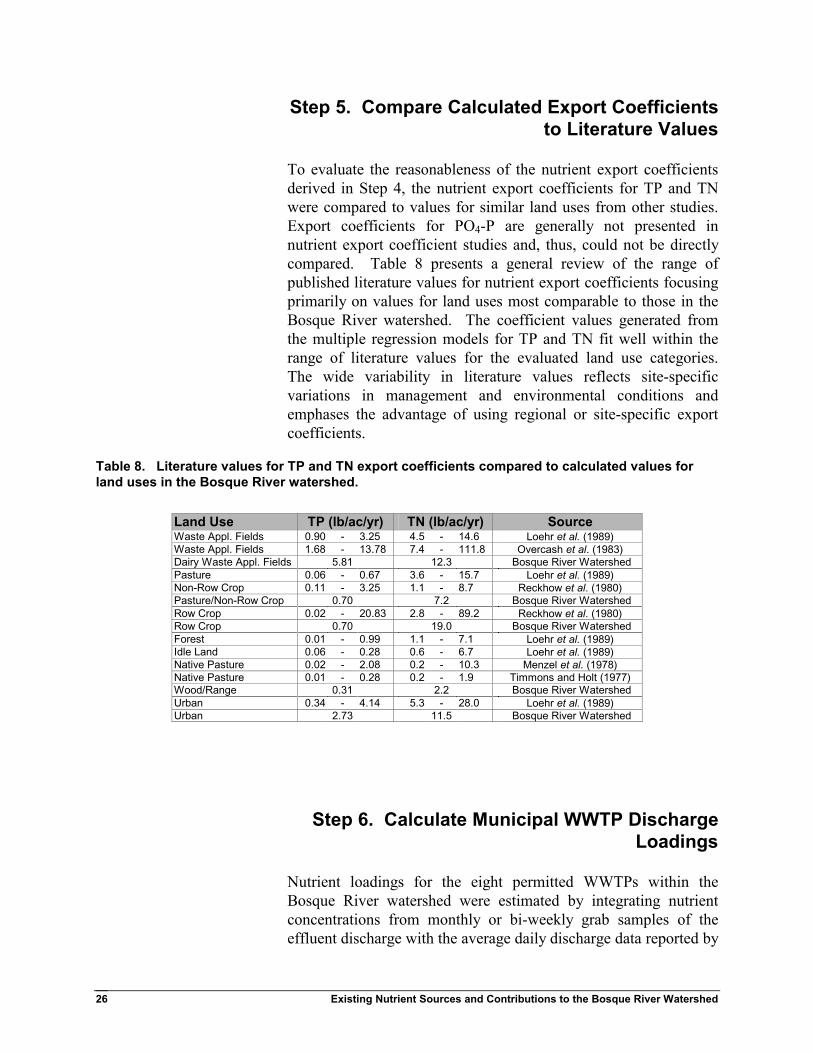
To evaluate the reasonableness of the nutrient export coefficientsderived in Step 4, the nutrient export coefficients for TP and TNwere compared to values for similar land uses from other studies.Export coefficients for PO4-P are generally not presented innutrient export coefficient studies and, thus, could not be directlycompared. Table 8 presents a general review of the range ofpublished literature values for nutrient export coefficients focusingprimarily on values for land uses most comparable to those in theBosque River watershed. The coefficient values generated fromthe multiple regression models for TP and TN fit well within therange of literature values for the evaluated land use categories.The wide variability in literature values reflects site-specificvariations in management and environmental conditions andemphases the advantage of using regional or site-specific exportcoefficients.
Table 8. Literature values for TP and TN export coefficients compared to calculated values forland uses in the Bosque River watershed.
Land Use TP (lb/ac/yr) TN (lb/ac/yr) SourceWaste Appl. Fields 0.90 - 3.25 4.5 - 14.6 Loehr et al. (1989)Waste Appl. Fields 1.68 - 13.78 7.4 - 111.8 Overcash et al. (1983)Dairy Waste Appl. Fields 5.81 12.3 Bosque River WatershedPasture 0.06 - 0.67 3.6 - 15.7 Loehr et al. (1989)Non-Row Crop 0.11 - 3.25 1.1 - 8.7 Reckhow et al. (1980)Pasture/Non-Row Crop 0.70 7.2 Bosque River WatershedRow Crop 0.02 - 20.83 2.8 - 89.2 Reckhow et al. (1980)Row Crop 0.70 19.0 Bosque River WatershedForest 0.01 - 0.99 1.1 - 7.1 Loehr et al. (1989)Idle Land 0.06 - 0.28 0.6 - 6.7 Loehr et al. (1989)Native Pasture 0.02 - 2.08 0.2 - 10.3 Menzel et al. (1978)Native Pasture 0.01 - 0.28 0.2 - 1.9 Timmons and Holt (1977)Wood/Range 0.31 2.2 Bosque River WatershedUrban 0.34 - 4.14 5.3 - 28.0 Loehr et al. (1989)Urban 2.73 11.5 Bosque River Watershed
Step 6. Calculate Municipal WWTP DischargeLoadings
Nutrient loadings for the eight permitted WWTPs within theBosque River watershed were estimated by integrating nutrientconcentrations from monthly or bi-weekly grab samples of theeffluent discharge with the average daily discharge data reported by

Existing Nutrient Sources and Contributions to the Bosque River Watershed 27
each plant to the TNRCC. Since sampling at many of the WWTPsdid not begin until January 1996, median values were used torepresent the nutrient constituent concentrations for months duringwhich samples were not collected. Cumulative loadings forNovember 1, 1995 through March 30, 1998 are presented in Table9 prorated to an annual basis.
Table 9. Calculated wastewater treatment plant nutrient loadings for November 1, 1995 throughMarch 30, 1998 prorated to an annual basis.
Site Flow PO4-P TP TN(ft3/yr) (lbs/yr) (lbs/yr) (lbs/yr)
Stephenville 86,356,413 11,523 14,381 37,542Hico 3,929,640 658 751 2,872Iredell 1,224,213 209 1,318 365Meridian 9,252,524 1,468 1,763 10,214Clifton 14,936,658 1,621 2,191 7,735Valley Mills 4,569,215 710 793 4,820McGregor 245,960 24 34 147Crawford 34,785,358 2,210 3,330 21,693
Step 7. Develop an Empirical Source-Contribution Model
The export coefficient values, land-use classification, and pointsource data for the Bosque River were combined into an empiricalsource-contribution model. This model allows an estimation of theloading of nitrogen and phosphorus by source to the Bosque Riverwatershed and other selected points for the time period ofNovember 1, 1995 through March 30, 1998 as prorated on anannual basis. This simple empirical model can be expressedalgebraically as follows:
Li,m = ∑ (ECj,m x SAi,j) + ∑ PSi,k,m (5)
Where
m = the nutrient: m=1 for PO4-P, m=2 for TP, and m=3for TN,
i = a location with the Bosque River watershed, such assite BO040, for which land use information withinthe drainage of the site is defined,
Li,m = annualized loading for nutrient m on a per acre basisto location i (lbs/acre/yr),
j=∑
1
7
k =∑
1
8
Existing Nutrient Sources and Contributions to the Bosque River Watershed28
j = nonpoint sources: j = 1 for dairy waste applicationfields, j = 2 for pasture fields, j = 3 for non-row cropfields, j = 5 for row crop fields, j = 6 forwood/range, and j = 7 for urban,
ECj,m= land-use export coefficient (lbs/acre/yr) for source jand nutrient m,
SAi,j= land-use surface area within the drainage abovelocation i associated with source j (acres),
k = the WWTPs: k = 1 for Stephenville, k = 2 for Hico,k = 3 for Iredell, k = 4 for Meridian, k = 5 forClifton, k = 6 for Valley Mills, k = 7 for Crawfordand k = 8 for McGregor, and
PSi,k,m= the annualized contribution at location i of nutrientm from the k municipal WWTP discharges abovelocation i (lbs/yr).
Values for the variables in equation (5) can be obtained fromTables 2, 3, 6, 7 and 9. Percent contribution by source iscalculated by dividing the total loading (L) to a given location bythe calculated loading for each source.
Because relatively large standard deviations were associated withthe nutrient export coefficients for the agricultural land-use sectorsusing the regression methods (Tables 6 and 7), a Monte Carlosampling technique (Law and Kelton, 1982) was integrated into thesource-contribution model to take into account this variability.Monte Carlo simulation methods were used to predict loadingsassuming a normal probability distribution as defined by the exportcoefficient and its standard deviation. As noted in Step 3, thestandard deviation for each urban export coefficient was set equalto the derived coefficient value for this analysis. A total of 10,000Monte Carol simulations were made. The results from thesimulations were statistically analyzed to provide the averagepredicted loadings as well as a measure of the variance associatedwith the predicted loadings. The variability in WWTP loadingswas not explored because these loadings were directly monitored,i.e., loadings from the WWTP were input as a constant value.

Existing Nutrient Sources and Contributions to the Bosque River Watershed 29
Step 8. Compare Estimated Nutrient Loadingswith Monitored Loadings
Of the 17 automatic sampling sites in the watershed used for thisanalysis, four sites located along the North Bosque River (BO040,BO070, BO090 and BO100) were excluded from the exportcoefficient analysis, so they could be used to validate thecoefficients developed. These four sites were selected asvalidation sites, because they represent the variety of point andnonpoint source nutrient loadings within the watershed. BO040,located on the North Bosque River below Stephenville, containsonly a relatively small portion of urban land in its drainage basin(less than 4 percent) but is impacted by urban influences,particularly at base flow, due to its location about a quarter milebelow the discharge of the Stephenville WWTP. Site BO070 islocated on the North Bosque River at Hico, Texas, site BO090 islocated near Clifton on the North Bosque River, and BO100 islocated outside of Valley Mills along the North Bosque River(Figure 4). Site BO100 is also near the mouth of the North BosqueRiver drainage, thus, integrating the nutrient contributions for mostof the North Bosque River subwatershed.
As validation of the estimated export coefficients, predictedloadings from the source-contribution model, as outlined in Step 7,were compared to measured loadings for North Bosque River sitesBO040, BO070, BO090 and BO100, as presented in Table 4. Afairly good fit of predicted with measured data occurred withincreasing differences generally occurring from upstream todownstream sites with values more closely predicted at sitesBO040 and BO070 than at BO090 and BO100 (Figure 7). Thelarger errors at downstream sites were expected to some degree asdrainage area and travel times increase. The source-contributionmodel reflects overall loadings into a watershed stream system anddoes not take into account in-stream losses and transformationsbeyond those accounted for by the use of in-stream data in derivingthe nutrient export coefficients. In-stream transformations orlosses may occur through such pathways as uptake of nitrogen andphosphorus by aquatic life, volatilization of NH3-N to theatmosphere, sedimentation, and binding of PO4-P to sedimentparticles.
Existing Nutrient Sources and Contributions to the Bosque River Watershed30
Figure 7. Comparison of predicted with measured nutrient loadings on an annual basis for foursites along the North Bosque River for November 1, 1995 through March 30, 1998. Error barsrepresent plus and minus one standard deviation from the predicted mean.
0
50,000
100,000
150,000
200,000
BO040 BO070 BO090 BO100
PO4-P
(lbs
/yr)
0
200,000
400,000
600,000
800,000
BO040 BO070 BO090 BO100
TP (l
bs/y
r)
0
1,000,000
2,000,000
3,000,000
4,000,000
5,000,000
BO040 BO070 BO090 BO100
TN (l
bs/y
r)
Predicted Measured
Existing Nutrient Sources and Contributions to the Bosque River Watershed 31
While transformations and losses most likely explain theoverestimation of PO4-P and TN at sites BO090 and BO100 in thepredicted values, the opposite is seen for TP. The predicted valuesfor TP are notably underestimated at sites BO090 and BO100.This is an indication that the source-contribution model may not beaccounting for all of the sources of TP contributing to the NorthBosque River at sites BO090 and BO100 or that there may be somediscrepancies in the measured data. A large amount of stream bankerosion was noted at sites BO090 and BO100 in association withlarge storm events that occurred in February 1997 and March 1998.This stream bank erosion may be an additional source of TP asincreased in-stream TP concentrations were indicated for stormsamples during these events in association with very high TSSconcentrations. A fact confounding this explanation is that higherTN concentrations were also noted with these same samples,although predicted TN values on average overestimate rather thanunderestimate measured values at BO090 and BO100.
Another possible explanation for the poorer fit of the predictedversus measured data at BO090 and BO100 is the fact that thesampling program during the large February 1997 and March 1998storm events had to be modified for safety reasons due to streambank erosion at both sites. For at least part of each of these multi-day storm events, twice a day grab sampling from bridges nearBO090 and BO100 was used rather than automatic sampling at setintervals.
Despite the discrepancies between predicted and measuredphosphorus and nitrogen loadings apparent at sites BO090 andBO100, the overall agreement of predicted and measured nutrientloadings at the four North Bosque sites was very encouraging. Theerrors in predictions were within reasonable expectations from theapplication of an export coefficient approach. Even for directmeasurements of in-stream loadings, an error of +25 percent innutrient loadings is not uncommon (Loehr et al., 1989). Thedifferences between estimated and measured nutrient loadings arewell within the range of what should reasonably be expected froman approach using export coefficients to estimate loadings. Thisverification exercise corroborates the validity of the nutrient exportcoefficients for the intended use of providing estimates of nutrientloadings by contributing sector for Bosque River watershed.
Existing Nutrient Sources and Contributions to the Bosque River Watershed32
Step 9. Calculate Loadings and PercentContribution by Subwatershed and Land-Use
Sector
The source-contribution model, was applied to estimate loadingsby subwatershed and source for the Bosque River watershed. Thesubwatersheds included the North Bosque River, Hog Creek,Middle Bosque River, South Bosque River, and a minor tributarygroup that included urban runoff from the city of Waco and smallerdrainage areas near Lake Waco that were not included in othersubwatershed areas (Figure 2).
As expected, the North Bosque River subwatershed was estimatedto contribute the largest amount of nutrients to the Bosque Riverwatershed compared to the other subwatersheds (Table 10). TheNorth Bosque River watershed represents about 74 percent of thesurface area of the entire Bosque River watershed and is estimatedto contribute 78 percent of PO4-P, 73 percent of TP and 57 percentof TN. A breakdown of the estimated percent contribution by landuse for the entire Bosque River watershed is provided in Table 11.While comprising about 2 percent of the watershed area, dairywaste application fields were estimated to contribute on average 35+ 4 percent of the PO4-P, 21 + 3 percent of the TP and 5 + 2percent of the TN within the Bosque River watershed during theperiod November 1, 1995 through March 30, 1998. Row cropswere estimated to contribute the largest proportion of TN,averaging 49 + 10 percent of the total loadings.
Table 10. Predicted annual loadings and percent of total loadings from major tributaries to theBosque River watershed for November 1, 1995 through March 30, 1998.
PO4-P TP TN DrainageArea
Predicted(lbs/yr)
Percentof Total
Predicted(lbs/yr)
Percentof Total
Predicted(lbs/yr)
Percentof Total
Percentof Total
North Bosque River 163,605 78% 483,646 73% 3,710,493 57% 74%Hog Creek 6,603 3% 30,744 5% 534,076 8% 5%Middle Bosque River 16,076 8% 71,991 11% 1,291,180 20% 12%South Bosque River 13,718 7% 48,827 7% 724,860 11% 6%Other Minor Tributaries 8,369 4% 26,541 4% 195,195 3% 3%Total Bosque River Watershed 208,371 100% 661,749 100% 6,455,805 100% 100%

Existing Nutrient Sources and Contributions to the Bosque River Watershed 33
Table 11. Estimated percent contribution of nutrients by source to the Bosque watershed forNovember 1, 1995 through March 30, 1998. 'na' indicates not applicable.
Land UsePO4-P(%)
TP(%)
TN(%) (%)
Source Mean Std Mean Std Mean StdDairy Waste Appl. 34.65 3.71 20.60 2.94 4.60 1.81 2.21Row Crop 10.96 1.30 17.04 2.04 48.67 9.55 15.18Non-Row Crop 1.42 0.18 2.21 0.28 2.42 1.37 1.97Pasture 10.34 1.23 16.07 1.93 16.71 8.21 14.35Wood/Range 22.35 4.44 30.45 5.61 21.68 11.68 62.80WWTP 8.87 0.80 3.56 0.35 1.39 0.28 naUrban 11.42 5.12 10.06 4.59 4.55 2.34 2.34
For the North Bosque River drainage area, the largest PO4-Ploadings were associated with dairy waste application withwood/range representing the next largest loading source (Table 12).For TP, these two land uses were reversed with wood/range beingthe largest contributing source followed by dairy waste applicationfields. Row-crop agriculture and wood/range were the largestcontributing sources of TN to the North Bosque River drainage,both contributing about 31 percent of the total estimated loading.Pasture was the next largest contributor of TN representing almost21 percent of the total estimated. A breakdown of the estimatedloadings by source for the major subwatersheds within the BosqueRiver watershed is provided in Appendix A.
Table 12. Estimated percent contribution of nutrients by source to the North Bosque Riverwatershed for November 1, 1995 through March 30, 1998. 'na' indicates not applicable.
Land UsePO4-P(%)
TP(%)
TN(%) (%)
Source Mean Std Mean Std Mean StdDairy Waste Appl. 43.71 3.99 28.02 3.81 8.12 3.47 2.97Row Crop 4.99 0.59 8.37 1.09 31.23 8.99 7.35Non-Row Crop 1.37 0.17 2.30 0.31 3.27 1.96 2.02Pasture 9.23 1.07 15.48 1.94 20.63 10.31 13.64Wood/Range 24.12 4.62 35.35 6.03 31.22 15.65 72.19WWTP 9.95 0.84 4.20 0.44 1.86 0.52 naUrban 6.64 3.11 6.29 2.98 3.68 2.05 1.43
Because the TMDL effort is specifically directed at segments 1226and 1255 on the North Bosque River, the percent contribution byland-use sector was estimated for the drainage areas above eightpoints along the North Bosque River. These eight pointscorrespond to sampling sites BO020, BO040, BO060, BO070,BO080, BO085, BO090, and BO100 (Figure 8). Sites BO040,BO070, BO090 and BO100 were used in Step 8 for model

Existing Nutrient Sources and Contributions to the Bosque River Watershed34
validation. Site BO020, located above Stephenville, was used inderiving the nutrient export coefficients in Step 7. Sites BO060,located between Stephenville and Hico, BO080, located nearIredell, and BO085, located near Meridian, do not have automaticsamplers and are used only as grab sampling sites for water qualityanalysis in the monitoring program (Pearson and McFarland,1999).
Of interest is the spatial distribution of loadings in the NorthBosque River drainage (Figure 9). A disproportionately highpercentage of the phosphorus loadings, particularly PO4-P, occur inthe upper portion of the North Bosque River drainage, whilenitrogen loadings appear to be more evenly distributed throughoutthe drainage. The land use for these sites indicates that most of thedairy waste application fields, which are associated with relativelyhigh phosphorus and nitrogen loadings, are found in the upperportion of the watershed, while row-crop areas, which areassociated with relatively high nitrogen loadings, are located in thelower portion of the watershed (Table 13). Detailed results ofestimated loadings by source presented in Appendix B confirm thisdistribution of loadings.
Table 13. Land uses within the drainage areas above TIAER sampling sites along the NorthBosque River.
Site Wood/Range
Pasture Non-RowCropland
RowCrop
DairyWasteAppl.Fields
Urban Other DrainageArea
(%) (%) (%) (%) (%) (%) (%) (Acres)�
BO020 49.4 30.1 6.4 0.0 12.3 0.8 1.0 53,264BO040 51.1 23.8 8.4 0.0 11.7 3.8 1.2 63,504BO060 60.5 19.1 7.3 0.0 9.2 2.8 1.1 120,936BO070 68.2 15.4 6.5 0.0 7.2 1.7 1.0 230,243BO080 69.0 16.0 4.1 2.5 6.4 1.7 0.3 361,014BO085 71.3 14.5 3.2 4.1 5.0 1.6 0.3 468,115BO090 71.9 13.8 2.4 6.5 3.7 1.5 0.2 626,518BO100 72.4 13.6 2.0 7.4 3.1 1.4 0.1 746,469
�Reported drainage areas determined using ARC/INFO vary somewhat from previously reported values determined using GRASS.
Existing Nutrient Sources and Contributions to the Bosque River Watershed 35
Figure 8. Location of TIAER sampling sites along the North Bosque River.

Existing Nutrient Sources and Contributions to the Bosque River Watershed36
Figure 9. Percent of predicted nutrient loadings compared with percent of total drainage arearepresented for selected sites along the North Bosque River.
0%
20%
40%
60%
80%
100%
BO020(above
Stephenville)
BO040(below
Stephenville)
BO060(between
Stephenville& Hico)
BO070(Hico)
BO080(Iredell)
BO085(Meridian)
BO090(Clifton)
BO100(Valley Mills)
Total NorthBosque River
Drainage
PO4-P TP TN Drainage Area

Existing Nutrient Sources and Contributions to the Bosque River Watershed 37
DISCUSSION AND CONCLUSIONS
The agricultural export coefficients, while based on an extremelylarge database from a monitoring perspective, represent a relativelysmall database (12 sites) from a statistical perspective. Ideally, 30or more sites would be used in such an analysis to give adequatepower to the regression analysis approach of estimating nutrientexport coefficients. The relatively large standard deviationsassociated with the nutrient export coefficients partially reflect thesize of the data set from which these coefficients were derived aswell as the inherent variability in environmental characteristics.This variability arises from the spatial distribution in slope, soils,and management practices associated with each land use.Additional sites, representing a broader range of each land usecategory, both urban and agricultural, might help refine thesenutrient export coefficients. The Monte Carlo analysis used in thisstudy helps take into account a large portion of the variabilityassociated with the individual export coefficients for the variousland uses without the expense and time of collecting additionaldata.
The multiple regression approach for determining nutrient exportcoefficients maximizes the use of streamflow and water qualitydata from steam sites with mixed land-use drainage areas within amonitoring network without the need for isolating individual landuses. Further, the multiple regression method provides exportcoefficients representing the average of conditions and practices(e.g., soils, planting and harvest dates, fertilization timing andamounts, slopes, tillage practices, and proximity to streams) ofeach land use across the Bosque River watershed, as opposed toexport coefficients determined for the more limited practices andconditions of small, single land-use drainage areas. Whetherdetermined by regression techniques from in-stream monitoringsites, as in this study, or from monitoring of individual land uses,the export coefficients are indicative of the climatic conditionsunder which the monitoring data were collected. The longer theduration of the monitoring data set, the more likely the exportcoefficients include a range of weather conditions (e.g., high andlow rainfall periods), typifying average nutrient contributions, anddo not include potentially undesirable biases from overrepresentation of meteorological extremes.

Existing Nutrient Sources and Contributions to the Bosque River Watershed38
Export coefficients are highly dependent on the environmentalconditions from which they are based and extrapolation to othertime periods or regions can be problematic. It should beemphasized that large storm events carry the majority of thenutrient loadings within the Bosque River watershed. For themonitoring period November 1, 1995 and March 30, 1998 about 50percent of the flow at BO100, North Bosque River near ValleyMills, occurred in the months of February 1997 and March 1998(Figure 10). In comparison to long-term monthly flow data for theUSGS gauging station near BO100, February 1997 represents thehighest month of flow on record and March 1998 represents thethird highest month of flow on record. During the study period, theflow at BO100 averaged 630 cfs more than double the long-termaverage of 283 cfs for 1960 through 1995. These above averagehydrologic conditions should be considered in using the calculatedexport coefficient values beyond the time period evaluated and inevaluating the relative nutrient contribution by sector. Areasonable expectation is that point source loadings associated withWWTPs will increase in relative important as contributors ofnutrients with decreasing rainfall and stream flow. Thisunderscores the importance of understanding the climatic andhydrologic conditions under which export coefficients aredetermined before using them in watershed planning efforts. Thederived nutrient export coefficients and, thus, the source-contribution model results presented in this study are specific to thetime period November 1, 1995 through March 30, 1998 and careshould be taken in extrapolating these results to other timeframesor watersheds.
The calculated agricultural and urban nutrient export coefficientsdo provide a good indication of the nutrient contribution from landuses within the upper North Bosque River watershed for PO4-P, TPand TN for November 1, 1995 through March 30, 1998. Exportcoefficient values from this study were within the range of valuesfor similar land uses reported in the literature for other studies.Predicted loadings of PO4-P, TP and TN using export coefficientvalues in the source-contribution model also compared favorablywith measured loadings at North Bosque River sites BO040,BO070, BO090 and BO100 used for model validation.
The largest relative contributions of PO4-P, TP and TN within theBosque River watershed were associated with the North BosqueRiver subwatershed, which is expected as the North Bosque Riverdrainage represents about 74 percent of the total Bosque Riverwatershed. For the study period, over 70 percent of the PO4-P andTP and over 50 percent of the TN loadings were associated with
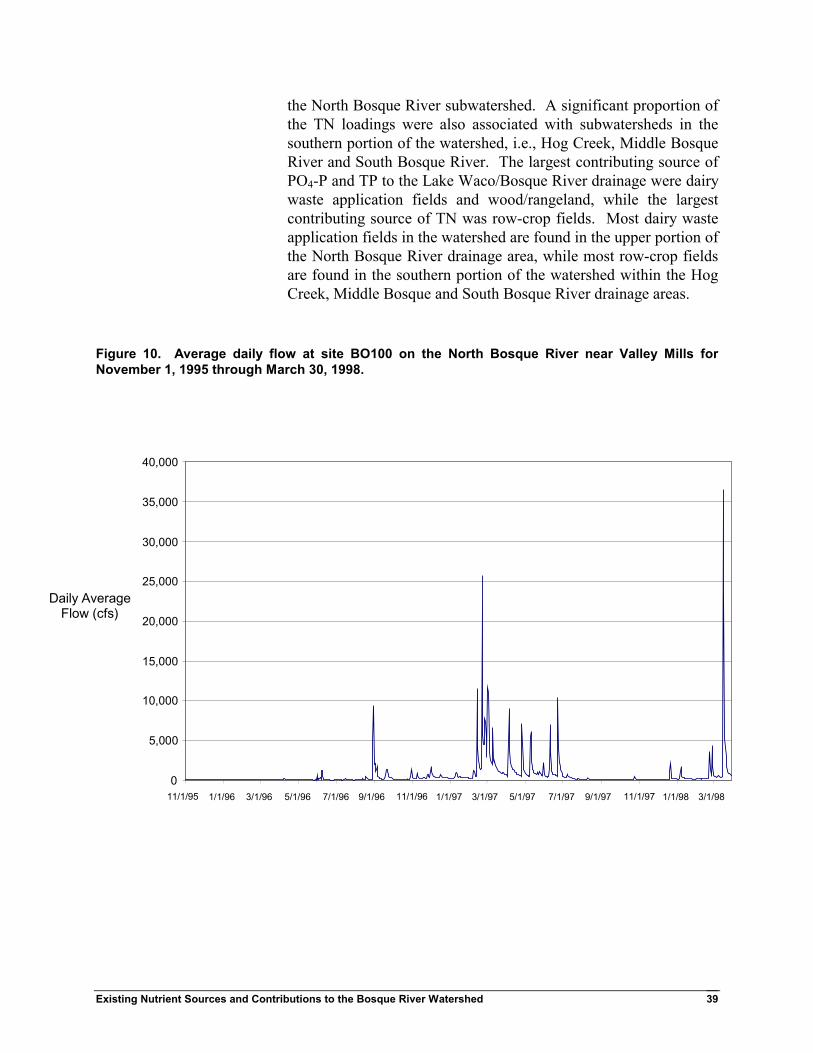
Existing Nutrient Sources and Contributions to the Bosque River Watershed 39
the North Bosque River subwatershed. A significant proportion ofthe TN loadings were also associated with subwatersheds in thesouthern portion of the watershed, i.e., Hog Creek, Middle BosqueRiver and South Bosque River. The largest contributing source ofPO4-P and TP to the Lake Waco/Bosque River drainage were dairywaste application fields and wood/rangeland, while the largestcontributing source of TN was row-crop fields. Most dairy wasteapplication fields in the watershed are found in the upper portion ofthe North Bosque River drainage area, while most row-crop fieldsare found in the southern portion of the watershed within the HogCreek, Middle Bosque and South Bosque River drainage areas.
Figure 10. Average daily flow at site BO100 on the North Bosque River near Valley Mills forNovember 1, 1995 through March 30, 1998.
0
5,000
10,000
15,000
20,000
25,000
30,000
35,000
40,000
11/1/95 1/1/96 3/1/96 5/1/96 7/1/96 9/1/96 11/1/96 1/1/97 3/1/97 5/1/97 7/1/97 9/1/97 11/1/97 1/1/98 3/1/98
Daily AverageFlow (cfs)

Existing Nutrient Sources and Contributions to the Bosque River Watershed40

Existing Nutrient Sources and Contributions to the Bosque River Watershed 41
LITERATURE CITEDBrazos River Authority, 1994. Intensive Survey of the North Bosque River (Segment 1226). Brazos River Authority,Waco, Texas, April 1994, 53 pp.
Clesceri, N.L., S.J. Curran, and R. I. Sedlak, 1986. Nutrient Loads to Wisconsin Lakes: Part I. Nitrogen andPhosphorus Export Coefficients. Water Resources Bulletin 22:983-990.
Dávalos-Lind, L. and O.T. Lind. 1999. The Algal Growth Potential of and Growth Limiting Nutrients in Lake Wacoand Its Tributary Waters, Part I (Narrative): A Report to the Texas Institute of Applied Environmental Research.Limnology Laboratory, Dept. Biology, Baylor University, Waco, TX. (Feb. 1999).
Easterling, N., A. McFarland, and L.Hauck. 1998. Semi-Annual Water Quality Report for the Bosque RiverWatershed (Monitoring Period: January 1, 1997 � December 31, 1997). Texas Institute for Applied EnvironmentalResearch, Tarleton State University, Stephenville, TX (WP 98-04).
Gibson, C.E. 1997. The Dynamics of Phosphorus in Freshwater and Marine Environments, pp. 119-136. In:Phosphorus Loss from Soil to Water (H. Tunney, O.T. Carton, P.C. Brookes and A.E. Johnston, eds). Centre forAgriculture and Bioscience International, New York.
Hodge, T.A. and L.J. Armstrong, 1993. Use of a Multiple Linear Regression Model to Estimate StormwaterPollutant Loading. In: New Techniques for Modelling the Management of Stormwater Quality Impacts, W. James(Editor). Lewis Publishers, Boca Raton, Florida, pp. 201-214.
Law, A.M., and W.D. Kelton. 1982. Simulation Modeling and Analysis. McGraw-Hill Book Company, New York,NY.
Loehr, R.C., S.O. Ryding, and W.C. Sonzogni, 1989. Estimating the Nutrient Load to a Waterbody. In: The Controlof Eutrophication of Lakes and Reservoirs, Volume I, Man and the Biosphere Series, S.O. Ryding and W. Rast(Editors). United Nations Educational Scientific and Cultural Organization, Paris, France and The ParthenonPublishing Group, Park Ridge, New Jersey, pp. 115-146.
Matlock, M.D. and A.D. Rodriguez. 1999. Preliminary Report of Findings: Periphytometer Study on Streams in theLake Waco/Bosque River Watershed. Prepared for the Texas Institute for Applied Environmental Research,Stephenville, Texas. Dept. Agricultural Engineering, Texas A&M University, College Station, TX. (Feb. 1999).
McFarland, A., and L. Hauck. 1998a. Stream Water Quality in the Bosque River Watershed: October 1, 1995through March 15, 1997. Texas Institute for Applied Environmental Research, Tarleton State University,Stephenville, Texas, PR 97-05 (June 1998).
McFarland, A., and L. Hauck. 1998b. Lake Waco/Bosque River Watershed Initiative Report: Determining NutrientContribution by Land Use for the Upper North Bosque River Watershed. Texas Institute for Applied EnvironmentalResearch, Tarleton State University, Stephenville, Texas, PR 99-01 (Jan. 1998).
McFarland, A. and L. Hauck, 1997a. A National Pilot Project Report on the Water Quality of Eight PL-566Reservoirs in the Upper North Bosque River Watershed. Texas Institute for Applied Environmental Research,Livestock and the Environment: PR97-03, September 1997, Tarleton State University, Stephenville, Texas, 103 pp.
McFarland, A. and L. Hauck, 1997b. A National Pilot Project Report on the Stream Water Quality in the UpperNorth Bosque River Watershed. Texas Institute for Applied Environmental Research, Livestock and theEnvironment: PR97-02, September 1997, Tarleton State University, Stephenville, Texas, 104 pp.
McFarland, A. and L. Hauck, 1995. Scientific Underpinnings for Policy Analysis: Analysis of Agricultural NonpointPollution Sources and Land Characteristics. Texas Institute for Applied Environmental Research, Livestock and theEnvironment: Report No. 1, September 1995, Tarleton State University, Stephenville, Texas, 140 pp.

Existing Nutrient Sources and Contributions to the Bosque River Watershed42
Menzel, R.G., E.D. Rhoades, A.E. Olness and S.J. Smith, 1978. Variability of Annual Nutrient and SedimentDischarges in Runoff from Oklahoma Cropland and Rangeland. Journal of Environmental Quality, 7:401-406.
Osmond, D.L., R.W. Gannon, J.A. Gale, D.E. Line, C.B. Knott, K.A. Phillips, M.H. Turner, M.A. Foster, D.E.Lehning, S.W. Coffey, and J. Spooner, 1997. WATERSHEDDS: A Decision Support System for Watershed-ScaleNonpoint Source Water Quality Problems. Journal of the American Water Resources Association 33:327-341.
Overcash, M.R., F.J. Humenik, and J.R. Miner, 1983. Livestock Waste Management, Vol. II. CRC Press, Inc., BocaRaton, Florida, pp. 201-202.
Pearson, C. and A. McFarland. 1999. Semi-Annual Water Quality Report for the Bosque River Watershed(Monitoring Period: January 1, 1997 � December 31, 1998). Texas Institute for Applied Environmental Research,Tarleton State University, Stephenville, TX (WP 99-06).
Reckhow, K.H., M.N. Beaulac, and J.T. Simpson, 1980. Modeling Phosphorus Loading and Lake Response underUncertainty: A Manual and Compilation of Export Coefficients. U.S. Environmental Protection Agency, Clean LakeSection, Washington, D.C., EPA 440/5-80-011, June 1980, 214 pp.
Schuster, J.L., and S.L. Hatch, 1990. Texas Plants - An Ecological Summary. In: Checklist of the Vascular Plants ofTexas, S.L. Hatch, K.N. Gandhi, and L.E. Brown (Editors). Texas Agricultural Experiment Station, College Station,Texas, MP-1655, July 1990, pp. 6-16.
Stein, S.K., 1977. Calculus and Analytic Geometry, second edition. McGraw-Hill Book Company, New York, NewYork, pp. 421-427.
TIAER, 1998. Quality Assurance Project Plan for the United States Department of Agriculture Bosque RiverInitiative. Texas Institute for Applied Environmental Research, Tarleton State University, Stephenville, Texas.
TNRCC, 1999. State of Texas 1999 Clean Water Act Section 303(d) List and Schedule for Development of TotalMaximum Daily Loads, Austin, Texas. SFR-58/99.
TNRCC, Texas Natural Resource Conservation Commission. 1996. The State of Texas Water Quality Inventory,13th Edition, 1996. TNRCC, Austin, Texas. SFR-50,12/96.
Texas Water Commission, and Texas State Soil and Water Conservation Board, 1991. 1990 update to the NonpointSource Water Pollution Assessment Report for the State of Texas. Texas Water Commission, Austin, Texas, March1991, 61 pp.
Timmons, D.R. and R.F. Holt, 1977. Nutrient Losses in Surface Runoff from a Native Pasture. Journal ofEnvironmental Quality 6:369-373.
U.S. Environmental Protection Agency, 1998. Better Assessment Science Integrating Point and Nonpoint Sources -Users Manual, Version 2.0. Environmental Protection Agency, Office of Science and Technology, EPA-823-B-98-006, Nov. 1998.
U.S. Environmental Protection Agency, 1983. Methods for Chemical Analysis of Water and Wastes. EnvironmentalProtection Agency, Environmental Monitoring and Support Laboratory, Office of Research and Development, EPA-600/4-79-020, Revised March 1983.
Wyrick, D.E., 1978. Intensive Surface Water Monitoring Survey for Segement 1225: Lake Waco. Texas Departmentof Water Resources, Austin Texas. IMS-77.

Existing Nutrient Sources and Contributions to the Bosque River Watershed 43
APPENDIX A: NUTRIENT CONTRIBUTION BY SOURCE FORMAJOR SUBWATERSHEDS WITHIN THE BOSQUE RIVERWATERSHED

Existing Nutrient Sources and Contributions to the Bosque River Watershed44
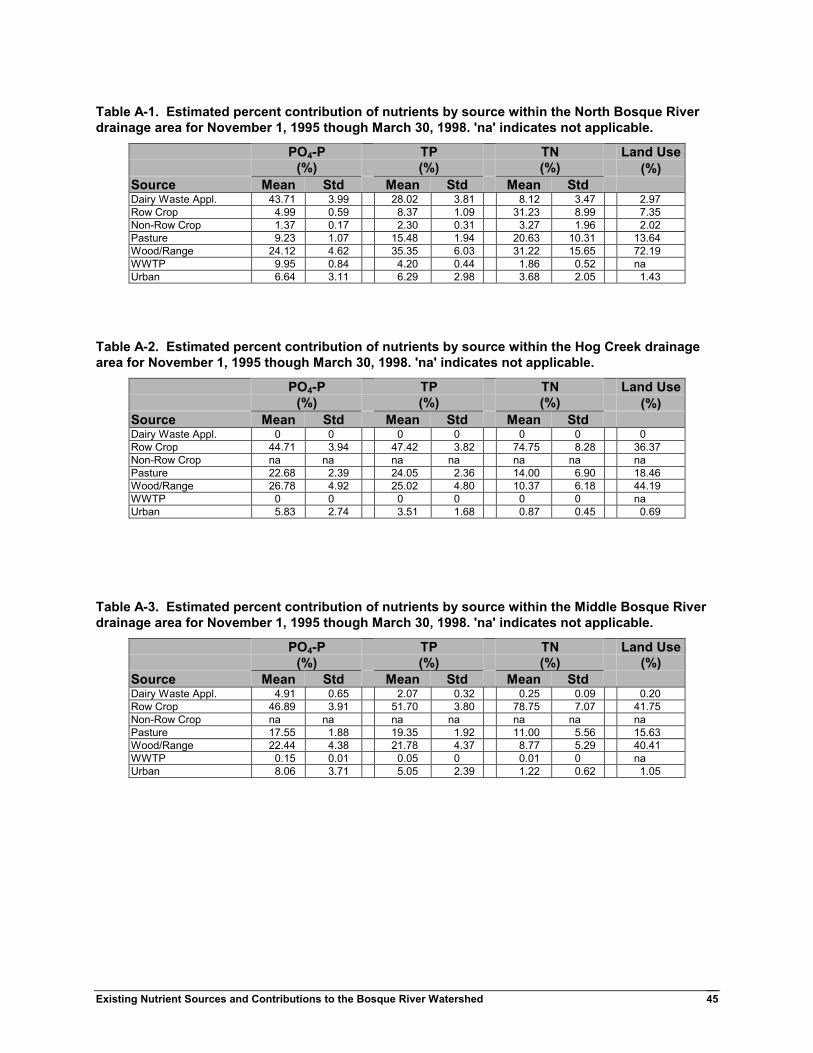
Existing Nutrient Sources and Contributions to the Bosque River Watershed 45
Table A-1. Estimated percent contribution of nutrients by source within the North Bosque Riverdrainage area for November 1, 1995 though March 30, 1998. 'na' indicates not applicable.
Land UsePO4-P(%)
TP(%)
TN(%) (%)
Source Mean Std Mean Std Mean StdDairy Waste Appl. 43.71 3.99 28.02 3.81 8.12 3.47 2.97Row Crop 4.99 0.59 8.37 1.09 31.23 8.99 7.35Non-Row Crop 1.37 0.17 2.30 0.31 3.27 1.96 2.02Pasture 9.23 1.07 15.48 1.94 20.63 10.31 13.64Wood/Range 24.12 4.62 35.35 6.03 31.22 15.65 72.19WWTP 9.95 0.84 4.20 0.44 1.86 0.52 naUrban 6.64 3.11 6.29 2.98 3.68 2.05 1.43
Table A-2. Estimated percent contribution of nutrients by source within the Hog Creek drainagearea for November 1, 1995 though March 30, 1998. 'na' indicates not applicable.
Land UsePO4-P(%)
TP(%)
TN(%) (%)
Source Mean Std Mean Std Mean StdDairy Waste Appl. 0 0 0 0 0 0 0Row Crop 44.71 3.94 47.42 3.82 74.75 8.28 36.37Non-Row Crop na na na na na na naPasture 22.68 2.39 24.05 2.36 14.00 6.90 18.46Wood/Range 26.78 4.92 25.02 4.80 10.37 6.18 44.19WWTP 0 0 0 0 0 0 naUrban 5.83 2.74 3.51 1.68 0.87 0.45 0.69
Table A-3. Estimated percent contribution of nutrients by source within the Middle Bosque Riverdrainage area for November 1, 1995 though March 30, 1998. 'na' indicates not applicable.
Land UsePO4-P(%)
TP(%)
TN(%) (%)
Source Mean Std Mean Std Mean StdDairy Waste Appl. 4.91 0.65 2.07 0.32 0.25 0.09 0.20Row Crop 46.89 3.91 51.70 3.80 78.75 7.07 41.75Non-Row Crop na na na na na na naPasture 17.55 1.88 19.35 1.92 11.00 5.56 15.63Wood/Range 22.44 4.38 21.78 4.37 8.77 5.29 40.41WWTP 0.15 0.01 0.05 0 0.01 0 naUrban 8.06 3.71 5.05 2.39 1.22 0.62 1.05

Existing Nutrient Sources and Contributions to the Bosque River Watershed46
Table A-4. Estimated percent contribution of nutrients by source within the South Bosque Riverdrainage area for November 1, 1995 though March 30, 1998. 'na' indicates not applicable.
Land UsePO4-P(%)
TP(%)
TN(%) (%)
Source Mean Std Mean Std Mean StdDairy Waste Appl. 0 0 0 0 0 0 0Row Crop 29.70 5.93 40.69 6.27 73.51 6.50 48.06Non-Row Crop na na na na na na naPasture 12.25 2.55 16.79 2.79 11.30 5.66 19.84Wood/Range 6.83 2.02 8.24 2.24 3.98 2.50 22.20WWTP 16.68 3.23 6.97 1.06 3.05 0.45 naUrban 34.54 12.46 27.31 10.57 8.15 3.88 8.82
Table A-5. Estimated percent contribution of nutrients by source within the minor tributarieswithin the Bosque River Watershed near Lake Waco area for November 1, 1995 though March 30,1998. 'na' indicates not applicable.
Land UsePO4-P(%)
TP(%)
TN(%) (%)
Source Mean Std Mean Std Mean StdDairy Waste Appl. 0 0 0 0 0 0 0Row Crop 8.21 5.43 11.90 5.83 39.70 10.37 12.59Non-Row Crop na na na na na na naPasture 4.36 2.90 6.31 3.12 7.87 4.44 6.69Wood/Range 13.31 9.00 16.95 8.74 14.44 8.73 41.27WWTP 0 0 0 0 0 0 naUrban 74.13 16.85 64.84 16.89 37.99 13.88 21.93

Existing Nutrient Sources and Contributions to the Bosque River Watershed 47
APPENDIX B: NUTRIENT CONTIBUTION BY SOURCE FORSELECTED SITES ALONG THE NORTH BOSQUE RIVER

Existing Nutrient Sources and Contributions to the Bosque River Watershed48

Existing Nutrient Sources and Contributions to the Bosque River Watershed 49
Table B-1. Estimated percent contribution of nutrients by source for the drainage area above siteBO100 on the North Bosque River for November 1, 1995 though March 30, 1998. 'na' indicates notapplicable.
Land UsePO4-P(%)
TP(%)
TN(%) (%)
Source Mean Std Mean Std Mean StdDairy Waste Appl. 44.88 4.01 28.97 3.89 8.48 3.60 3.1Row Crop 4.89 0.58 8.27 1.07 31.15 8.96 7.4Non-Row Crop 1.35 0.16 2.27 0.30 3.26 1.96 2.0Pasture 9.02 1.04 15.23 1.90 20.50 10.27 13.6Wood/Range 23.72 4.57 35.01 6.00 31.22 15.65 72.4WWTP 9.77 0.82 4.17 0.44 1.79 0.50 naUrban 6.39 3.00 6.10 2.90 3.60 2.01 1.4
Table B-2. Estimated percent contribution of nutrients by source for the drainage area above siteBO090 on the North Bosque River for November 1, 1995 though March 30, 1998. 'na' indicates notapplicable.
PO4-P Land Use(%)
TP(%)
TN(%) (%)
Source Mean Std Mean Std Mean StdDairy Waste Appl. 48.95 4.04 32.68 4.16 10.20 4.30 3.7Row Crop 3.95 0.47 6.89 0.89 27.77 8.20 6.5Non-Row Crop 1.47 0.18 2.56 0.33 3.92 2.35 2.4Pasture 8.42 0.97 14.70 1.81 21.10 10.53 13.8Wood/Range 21.61 4.28 32.99 5.84 31.35 15.74 71.9WWTP 9.54 0.79 4.17 0.43 1.88 0.53 naUrban 6.08 2.86 6.00 2.85 3.78 2.12 1.5
Table B-3. Estimated percent contribution of nutrients by source for the drainage area above siteBO085 on the North Bosque River for November 1, 1995 though March 30, 1998. 'na' indicates notapplicable.
Land UsePO4-P(%)
TP(%)
TN(%) (%)
Source Mean Std Mean Std Mean StdDairy Waste Appl. 55.34 3.96 39.25 4.51 14.22 5.98 5.0Row Crop 2.12 0.25 3.93 0.50 18.51 6.02 4.1Non-Row Crop 1.65 0.20 3.07 0.39 5.44 3.29 3.2Pasture 7.47 0.86 13.87 1.68 23.02 11.44 14.5Wood/Range 18.19 3.77 29.54 5.52 32.41 16.26 71.3WWTP 9.66 0.79 4.51 0.45 2.12 0.65 naUrban 5.57 2.63 5.84 2.77 4.28 2.45 1.6
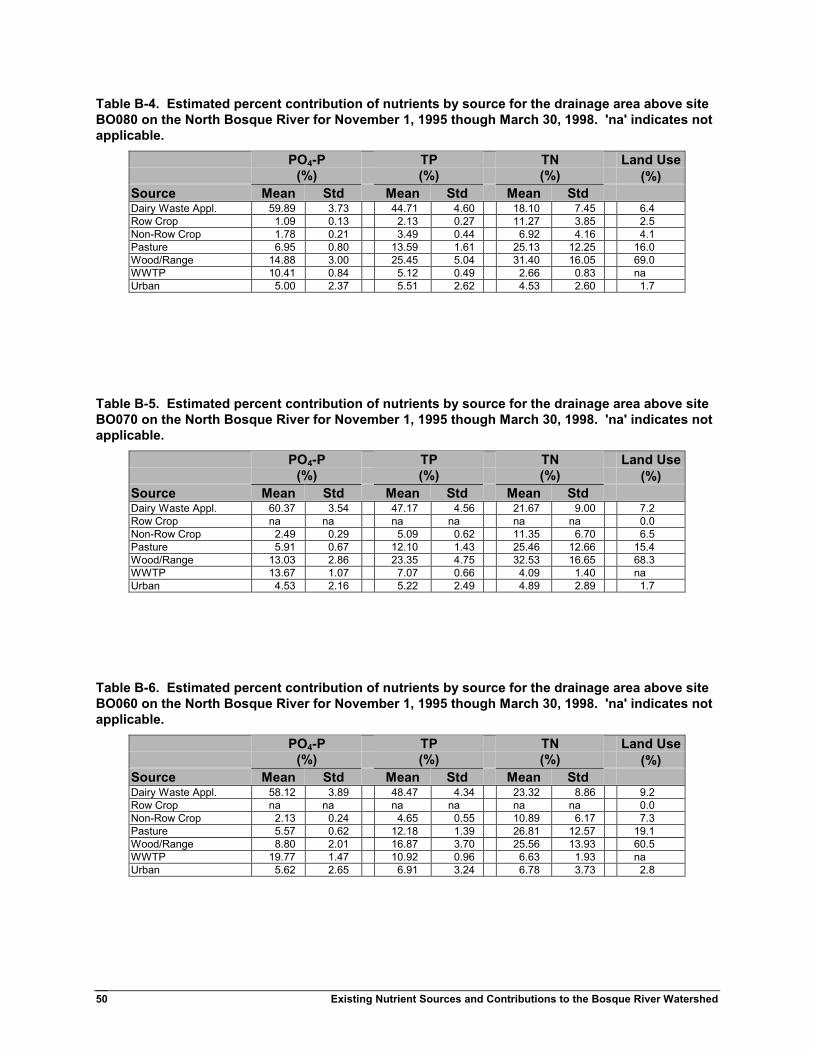
Existing Nutrient Sources and Contributions to the Bosque River Watershed50
Table B-4. Estimated percent contribution of nutrients by source for the drainage area above siteBO080 on the North Bosque River for November 1, 1995 though March 30, 1998. 'na' indicates notapplicable.
Land UsePO4-P(%)
TP(%)
TN(%) (%)
Source Mean Std Mean Std Mean StdDairy Waste Appl. 59.89 3.73 44.71 4.60 18.10 7.45 6.4Row Crop 1.09 0.13 2.13 0.27 11.27 3.85 2.5Non-Row Crop 1.78 0.21 3.49 0.44 6.92 4.16 4.1Pasture 6.95 0.80 13.59 1.61 25.13 12.25 16.0Wood/Range 14.88 3.00 25.45 5.04 31.40 16.05 69.0WWTP 10.41 0.84 5.12 0.49 2.66 0.83 naUrban 5.00 2.37 5.51 2.62 4.53 2.60 1.7
Table B-5. Estimated percent contribution of nutrients by source for the drainage area above siteBO070 on the North Bosque River for November 1, 1995 though March 30, 1998. 'na' indicates notapplicable.
Land UsePO4-P(%)
TP(%)
TN(%) (%)
Source Mean Std Mean Std Mean StdDairy Waste Appl. 60.37 3.54 47.17 4.56 21.67 9.00 7.2Row Crop na na na na na na 0.0Non-Row Crop 2.49 0.29 5.09 0.62 11.35 6.70 6.5Pasture 5.91 0.67 12.10 1.43 25.46 12.66 15.4Wood/Range 13.03 2.86 23.35 4.75 32.53 16.65 68.3WWTP 13.67 1.07 7.07 0.66 4.09 1.40 naUrban 4.53 2.16 5.22 2.49 4.89 2.89 1.7
Table B-6. Estimated percent contribution of nutrients by source for the drainage area above siteBO060 on the North Bosque River for November 1, 1995 though March 30, 1998. 'na' indicates notapplicable.
Land UsePO4-P(%)
TP(%)
TN(%) (%)
Source Mean Std Mean Std Mean StdDairy Waste Appl. 58.12 3.89 48.47 4.34 23.32 8.86 9.2Row Crop na na na na na na 0.0Non-Row Crop 2.13 0.24 4.65 0.55 10.89 6.17 7.3Pasture 5.57 0.62 12.18 1.39 26.81 12.57 19.1Wood/Range 8.80 2.01 16.87 3.70 25.56 13.93 60.5WWTP 19.77 1.47 10.92 0.96 6.63 1.93 naUrban 5.62 2.65 6.91 3.24 6.78 3.73 2.8
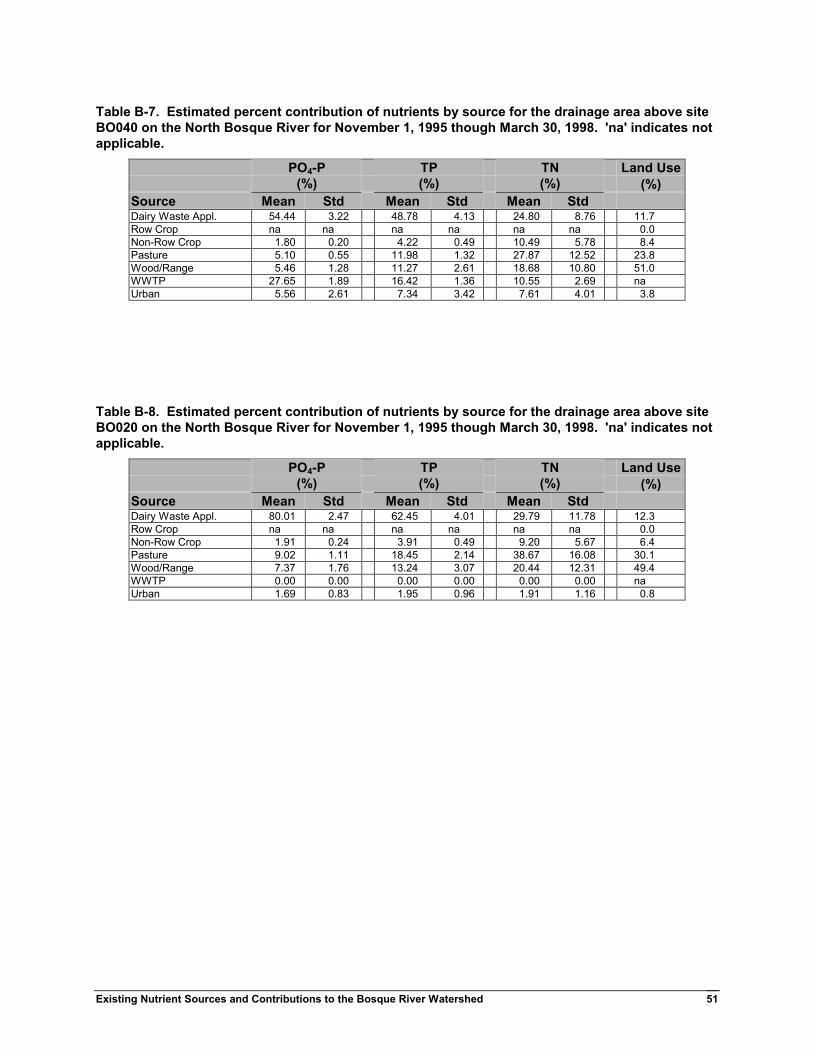
Existing Nutrient Sources and Contributions to the Bosque River Watershed 51
Table B-7. Estimated percent contribution of nutrients by source for the drainage area above siteBO040 on the North Bosque River for November 1, 1995 though March 30, 1998. 'na' indicates notapplicable.
Land UsePO4-P(%)
TP(%)
TN(%) (%)
Source Mean Std Mean Std Mean StdDairy Waste Appl. 54.44 3.22 48.78 4.13 24.80 8.76 11.7Row Crop na na na na na na 0.0Non-Row Crop 1.80 0.20 4.22 0.49 10.49 5.78 8.4Pasture 5.10 0.55 11.98 1.32 27.87 12.52 23.8Wood/Range 5.46 1.28 11.27 2.61 18.68 10.80 51.0WWTP 27.65 1.89 16.42 1.36 10.55 2.69 naUrban 5.56 2.61 7.34 3.42 7.61 4.01 3.8
Table B-8. Estimated percent contribution of nutrients by source for the drainage area above siteBO020 on the North Bosque River for November 1, 1995 though March 30, 1998. 'na' indicates notapplicable.
Land UsePO4-P(%)
TP(%)
TN(%) (%)
Source Mean Std Mean Std Mean StdDairy Waste Appl. 80.01 2.47 62.45 4.01 29.79 11.78 12.3Row Crop na na na na na na 0.0Non-Row Crop 1.91 0.24 3.91 0.49 9.20 5.67 6.4Pasture 9.02 1.11 18.45 2.14 38.67 16.08 30.1Wood/Range 7.37 1.76 13.24 3.07 20.44 12.31 49.4WWTP 0.00 0.00 0.00 0.00 0.00 0.00 naUrban 1.69 0.83 1.95 0.96 1.91 1.16 0.8