Exfoliative cytology of oral epithelial cells from patients with type 2 diabetes: cytomorphometric...
10
Int J Clin Exp Med 2013;6(8):667-676 www.ijcem.com /ISSN:1940-5901/IJCEM1307020 Original Article Exfoliative cytology of oral epithelial cells from patients with type 2 diabetes: cytomorphometric analysis César Rivera 1,2 , Camila Núñez-de-Mendoza 1 1 Unit of Histology and Embryology, Department of Basic Biomedical Sciences, Faculty of Health Sciences, Uni- versity of Talca, Talca, Chile; 2 Biomedical Sciences Master Program, Oral Pathology mention, University of Talca, Talca, Chile Received July 26, 2013; Accepted August 15, 2013; Epub September 1, 2013; Published September 15, 2013 Abstract: This research objective is to identify cytomorphometrical changes using exfoliative cytology (EC) and later Papanicolaou (Pap) staining, for oral epithelial cells of patients with type 2 diabetes (DM2) (n = 30), while being compared to patients without the disease (n = 30). Additionally, we investigated an association between cellular changes and salivary flow levels; relationship that until now has not been reported. Results show that the cell diam- eter and the nuclear-cytoplasmic ratio was significantly higher compared to those patients without the disease (p ≤ 0.001 Student and Welch test). Decreased salivary flow was significantly associated with increased cell diameter and nuclear-cytoplasmic ratio (p ≤ 0.001 ANOVA with Tukey test). Evidence and clinical observations show that DM2 and decreased salivary flow are related to detectable cytomorphometrical changes in exfoliated cells, which may extend the horizon of this cytological technique. Keywords: Diabetes mellitus type 2, cytological techniques, mouth mucosa, salivary flow, xerostomia Introduction Inside the most important pathologies that affect world population, diabetes is found. In the year 2000, it was estimated that 2.8% of the world population had diabetes, but actually there are more than 346 million of persons that have this disease, showing that the prevalence of this disease has been increasing according to the pass of the years, in spite of investigation findings and medicine practice [1]. Diagnosis of diabetes is made according to the American Diabetes Association values settled. Among them are the classic symptoms of dia- betes, blood glucose levels taken at any time of day, greater than or equal to 200 mg/dl, unre- lated to the time since the last meal [2]. Another criteria, also linked to blood sugar, but break- fast abstaining (with no caloric intake for at least 8 hours) is associated with a value which should be greater than or equal to 126 mg/dl, status that should be confirmed with a second blood glucose on another day [3]. Measurement of glycosylated hemoglobin (HbA1c) is another test that is done for people with diabetes. It is based on measuring the percentage of glucose bounded to hemoglobin in a specific manner, whereby high levels of glucose in blood contrib- ute to an increased binding and thus, higher levels of HbA1c [4]. Every 3 months this test is done and expects to maintain HbA1c levels less than or equal to 7%, which is one of the main goals in diabetes care [5]. Among the most common oral abnormalities that can be observed in a dental clinical exami- nation of patients with diabetes, there are gingi- vitis, periodontitis, abscesses, candidiasis and other opportunistic infections; so it is relatively easy to get to diabetes suspicion through a good anamnesis and a simple clinical examina- tion of the patient [6]. While diabetes diagnostic confirmation by blood test is the most accepted and validated, this means a stressful situation for the patient and requires more time and resources, so it would be useful to find a new tool that could replace, complement or compare the results obtained by this, but giving greater patient comfort and tranquility.
Transcript of Exfoliative cytology of oral epithelial cells from patients with type 2 diabetes: cytomorphometric...

Int J Clin Exp Med 2013;6(8):667-676www.ijcem.com /ISSN:1940-5901/IJCEM1307020
Original ArticleExfoliative cytology of oral epithelial cells from patients with type 2 diabetes: cytomorphometric analysis
César Rivera1,2, Camila Núñez-de-Mendoza1
1Unit of Histology and Embryology, Department of Basic Biomedical Sciences, Faculty of Health Sciences, Uni-versity of Talca, Talca, Chile; 2Biomedical Sciences Master Program, Oral Pathology mention, University of Talca, Talca, Chile
Received July 26, 2013; Accepted August 15, 2013; Epub September 1, 2013; Published September 15, 2013
Abstract: This research objective is to identify cytomorphometrical changes using exfoliative cytology (EC) and later Papanicolaou (Pap) staining, for oral epithelial cells of patients with type 2 diabetes (DM2) (n = 30), while being compared to patients without the disease (n = 30). Additionally, we investigated an association between cellular changes and salivary flow levels; relationship that until now has not been reported. Results show that the cell diam-eter and the nuclear-cytoplasmic ratio was significantly higher compared to those patients without the disease (p ≤ 0.001 Student and Welch test). Decreased salivary flow was significantly associated with increased cell diameter and nuclear-cytoplasmic ratio (p ≤ 0.001 ANOVA with Tukey test). Evidence and clinical observations show that DM2 and decreased salivary flow are related to detectable cytomorphometrical changes in exfoliated cells, which may extend the horizon of this cytological technique.
Keywords: Diabetes mellitus type 2, cytological techniques, mouth mucosa, salivary flow, xerostomia
Introduction
Inside the most important pathologies that affect world population, diabetes is found. In the year 2000, it was estimated that 2.8% of the world population had diabetes, but actually there are more than 346 million of persons that have this disease, showing that the prevalence of this disease has been increasing according to the pass of the years, in spite of investigation findings and medicine practice [1].
Diagnosis of diabetes is made according to the American Diabetes Association values settled. Among them are the classic symptoms of dia-betes, blood glucose levels taken at any time of day, greater than or equal to 200 mg/dl, unre-lated to the time since the last meal [2]. Another criteria, also linked to blood sugar, but break-fast abstaining (with no caloric intake for at least 8 hours) is associated with a value which should be greater than or equal to 126 mg/dl, status that should be confirmed with a second blood glucose on another day [3]. Measurement of glycosylated hemoglobin (HbA1c) is another test that is done for people with diabetes. It is
based on measuring the percentage of glucose bounded to hemoglobin in a specific manner, whereby high levels of glucose in blood contrib-ute to an increased binding and thus, higher levels of HbA1c [4]. Every 3 months this test is done and expects to maintain HbA1c levels less than or equal to 7%, which is one of the main goals in diabetes care [5].
Among the most common oral abnormalities that can be observed in a dental clinical exami-nation of patients with diabetes, there are gingi-vitis, periodontitis, abscesses, candidiasis and other opportunistic infections; so it is relatively easy to get to diabetes suspicion through a good anamnesis and a simple clinical examina-tion of the patient [6].
While diabetes diagnostic confirmation by blood test is the most accepted and validated, this means a stressful situation for the patient and requires more time and resources, so it would be useful to find a new tool that could replace, complement or compare the results obtained by this, but giving greater patient comfort and tranquility.

Oral epithelial cells, type 2 diabetes and salivary flow
668 Int J Clin Exp Med 2013;6(8):667-676
Exfoliative cytology is the study of cells which have been extracted or removed from the epi-thelial surface of several organs [7]. Oral sam-ples are obtained by a wooden paddle or a spe-cial brush called cytobrush, whose objective is to obtain the largest possible amount of cell samples [8], which are taken for Pap staining test. This technique has opened several ways for working in health area, with favorable results and has been enhanced with some of the currently available technology programs, also allowing tabulating and analyzing informa-tion quickly and easily [9].
Using exfoliative cytology it has been previously studied; morphological changes suffered by oral epithelial cells in diabetics, results which are higher and significant when are compared to healthy patients. These changes are repre-sented by variations in the nucleus, nuclear area (the biggest change) and the nuclear cyto-plasmic ratio [10-14]. The detection of qualita-tive and quantitative cellular changes by exfoli-
ative cytology, may assist in the diagnosis of diabetes mellitus, however it is needed to understand the causes or processes that lead to the manifestation of them.
Among the main reasons that have been dis-cussed to explain the cytomorphometrical alterations are aging and cell atrophy. Cellular aging in diabetic patients is associated with a decrease in the rate of cell changing, finding alterations on their nucleus and cytoplasm [15]. It is also known that diabetic patients mostly suffer from a decrease in salivary flow that leads to mucosal atrophy, which makes oral mucosa more susceptible to trauma [12]. Dehydration caused by decreased salivary flow, has been studied as a cause of alterations in cell morphometry in patients with alcoholism [16].
In this study we determined the suffered cyto-morphometrical changes using exfoliative cytology in oral epithelial cells from patients
Figure 1. Swabs from the cheek mucosa (bucca) of clinically normal (A). Samples fixed with a spray citofixer (B). Cytomorphometric analysis using Ax-iovision® (C).

Oral epithelial cells, type 2 diabetes and salivary flow
669 Int J Clin Exp Med 2013;6(8):667-676
with diagnosis of type 2 diabetes, compared to patients without the disease. Additionally, we seek to find an association between cellular changes and salivary flow levels, a relationship to our knowledge, not been reported until now.
Materials and methods
For this research, we made an observational prospective study. Explicative variable was type 2 diabetes and response variable were cyto-morphometrical changes in oral mucosa cells from patients with the disease. All protocols were approved by the Bioethics Committee of University of Talca (http://www.cesarrivera.cl/research/ethics000169.pdf), which follows the Declaration of Helsinki.
Sample size measurement
The sample simple size for two independent media was estimated with the GRANMO calcu-lator from the Institut Municipal d’Investigació Mèdica, Barcelona, España (http://www.imim.es/ofertadeserveis/software-public/granmo/). It was considered for the estimation an unilat-eral contrast, alpha error of 5% and 20% for beta, a reason between the subjects from both groups of 1 (equilibrated), a common standard deviation of 17; a biological statistically differ-ence for cytomorphometrical changes of 12 µm and a following loss of the 16% of the study subjects. 30 subjects were used for group 1 and 30 for the second, in order to detect any difference equal or higher of 12 units.
Subjects
Subjects were randomly selected from adults of the Preventive Medicine Review for Adults (Examen de Medicina Preventiva para Adultos, EMPA) and Cardiovascular Program (Programa Cardiovascular, PCV) of CESFAM Violeta Parra de Chillán, Chile (Public Health). Patients were
temic condition. There were also excluded those patients on drug treatment for non-dia-betic control, because previous studies have demonstrated that cellular and nuclear sizes are influenced by these factors. We obtained the informed consent of each individual (http://www.cesarrivera.cl/research/consent000169.pdf), name, age, gender, medical history, etc.
Procedures
Pilot: Pilot was conducted in the Morphology Laboratory, University of Talca, Chile, in order to determine whether the use of interproximal toothbrush was effective for sampling. A sub-ject was selected, which was rinsed with sodi-um chloride 0.9%. Then, his cheek was gently dried with gauze and the sample was taken. It was fixed with alcohol set to 95°, and once the plate was dry, we performed hematoxylin-eosin staining (H&E). The sample was analyzed under the microscope and it was possible to observe a delimitated nuclear and cell forms, whereup-on it was concluded that brush might be used later for definitive sample takes.
Patient preparation
The day of the citation to their respective health programs (patients did not have to assist to their consults, especially for this investigation actions); it was made a dental clinical exam to the subjects, previously to the take of samples, in order to check the status of oral mucosa from the donor site. Patients rinsed with a sodi-um chloride 0.9% solution. Then it was gently dried the mucosal surface with sterile gauze to remove surface debris and excess of saliva.
Sample preparation
Were taken swabs from the cheek mucosa of clinically normal, using the Colgate Interprox (Figure 1A). Samples were transferred to a dry
Table 1. Cytomorphometrical analysis of exfoliative cytology for CONTROL patients and DM2
Parameter Group Mean ± DE p ValueNuclear size (µm) CONTROL 8.1236 ± 0.79113 < 0.001*,w
DM2 9.6893 ± 0.47274Cytoplasm size (µm) CONTROL 45.4321 ± 4.8932 0.078w
DM2 43.8121 ± 3.1164Nuclear: Cytoplasm ratio CONTROL 0.1805 ± 0.02009 < 0.001*,t
DM2 0.222 ± 0.01616*p Value statically significant; WWelch’s test; tStudent’s test.
divided into two groups: Group DM2: 30 patients with a known history of diabetes mellitus type 2 in the last year and HbA1c test made at least two months before the test. Subjects were sub-divid-ed according to the classification made by Prasad, et al. [14]. Control Group: 30 patients without diabe-tes. We excluded smokers, alcohol consumers, diagnosed patients with anemia, history of liver trans-plant, kidney failure or other sys-

Oral epithelial cells, type 2 diabetes and salivary flow
670 Int J Clin Exp Med 2013;6(8):667-676
and clean plate, previously marked with a refer-ence number for each patient, and then, they were evenly spread with a circular one way movement. Samples were immediately fixed with a spray citofixer (Figure 1B) and were sent to Laboratorio Cordillera of Chillán, Chile, in a special box for plates, for their posterior stain with the Papanicolaou method.
Cytological evaluation
Cytomorphometric analysis was performed for two persons from the Histology and Embryology Unit, University of Talca (CR, CN), who did not know to which group correspond each sample (simple blind). For cytological reading of the samples, it was used an optical microscope Carl Zeiss 0.25. Images were obtained with a digital camera Canon Eos Rebel Xsi, attached to the microscope a laptop-connected, and using Axiovision® Rel 4.8 for measurements (Figure 1C). 50 cells were clearly defined in each case, using Axiovision software, to obtain core and cytoplasm diameter, calculating at the same time the nuclear/cytoplasm ratio (NCR), using a simple mathematical division.
Salivary flow measurement
Salivary flow was objectified, using the protocol of the Cariology Department from the Malmö University, Sweden, both for stimulated (SSF) and non-stimulated salivary flow (NSSF) [17]. The patient should have eaten one hour before the test. Water intake was not restricted during this period. At the time of examination, the patient sat in an upright position with the head slightly tilted forward and should accumulate his saliva into the floor of the mouth. For unstimulated salivary flow, the produced patient’s saliva in a 15 min time was deposited in a millimeter plastic tube. For stimulated sali-vary flow, the patient should have to bite a par-affin piece until it got soften, to swallow the produced saliva in this period and thereafter for 3 minutes, it was measured the deposited
saliva by the patient within a second tube graph. We recorded the amount of saliva pro-duced (excluding foam) in milliliters per minute.
Evaluation of xerostomy
Each patient was consulted by xerostomy (sub-jective): do you notice your mouth usually dry?, looking for a dichotomous response [18]. The answers were finally ordered according to three parameters: “no”, for patients who responded that they never felt their mouth dry; “yes” for patients who had a constant feeling of dry mouth; also was added in the present study the valuation “sometimes”, for those patients who felt their mouth dry at certain times during the day, either morning, afternoon, evening or relat-ed with the intake of certain foods.
Statistical analysis
The results are presented as mean ± standard deviation. Normality test (Kolmogorov-Smirnov) and homogeneity of variance test (Levene’s test) were performed. Qualitative data was compared using Fisher exact test and Chi-Square. Quantitative data was compared in pairs, using the Student t test-Welch. It was also used the one-way ANOVA test with an adjustment for multiple comparisons (Tukey) and the Pearson correlation test. For statistical analysis we used a 95% confidence level. To perform the statistical analysis it was used SPSS® Statistics 17.
Results
The size of the study groups was balanced (CONTROL n = 30, DM2 n = 30). The average age was 45 for CONTROL and 42.8 years in DM2. The average CONTROL glycemia was 88.73 mg/dl and 133.07 mg/dl in DM2. The mean HbA1c in DM2 group was 7.33%. In DM2 group, 36.67% of patients presented other pathological conditions associated with diabe-
Table 2. Relationship between Hb1Ac, salivary flow, nuclear size, cytoplasm size and NCRParameter Nuclear Size Cytoplasm Size NCR SSF NSSF
CP p CP p CP p CP p CP pGlycemia (mg/dl) 0.547 < 0.001* -0.176 0.089 0.585 < 0.001* -0.209 0.050* -0.351 0.003*
Hb1Ac (%) -0.126 0.254 -0.253 0.089 0.169 0.186 -0.164 0.194 -0.125 0.255CP: Pearson’s correlation coefficient; p: p Value; *p Value is statically significant; NCR: Nuclear cytoplasm ratio; SSF: Stimulated salivary flow; NSSF: Non stimulated salivary flow.

Oral epithelial cells, type 2 diabetes and salivary flow
671 Int J Clin Exp Med 2013;6(8):667-676
tes, being the two most prevalent dyslipidemia (54.5%) and obesity (45.5%). The intraclass correlation coefficient (ICC) for quantitative records between observers was 0.82.
Patients with type 2 diabetes have an in-creased nuclear size and increased nuclear/cytoplasmic ratio
Table 1 shows the cytomorphometrical analy-sis of exfoliative cytology for CONTROL and DM2 groups. The nuclear diameter and the NCR were significantly higher in DM2 patients compared to CONTROL patients (p ≤ 0.001, Welch test and Student’s test). Cytoplasm size showed no statistically significant differences (p = 0.078, Welch test).
Patients with higher blood sugar levels have in-creased nuclear size and NCR, and decreased salivary flow
Table 2 shows in its upper column the relation-ship between variables such as glycemia, nuclear size, cytoplasmic size, NCR, stimulated salivary flow (SSF) and non-stimulated salivary flow (NSSF) in all patients included in the study. For a higher value of blood glucose, there is a nuclear enlargement and greater NCR (p < 0.001 in both cases, Pearson correlation coef-ficient). SSF and NSSF were decreased when there were higher glucose levels (p ≤ 0.05, Pearson correlation coefficient).
No correlation between HbA1c and nuclear size, cytoplasm, NCR and salivary flow
Table 2 shows the relationship between the variables Hb1Ac, nuclear size, cytoplasm size, NCR, stimulated salivary flow (SSF) and unstim-ulated salivary flow (NSSF) in DM2 patients. There is not a direct relationship between these variables (p ≥ 0.05, Pearson correlation coeffi- cient).
CONTROL groups. Salivary flow, both stimulat-ed and non-stimulated, are significantly lower in DM2 patients compared with CONTROL patients (p ≤ 0.001, Welch test).
It was also determined the association between variables diabetes, SSF (decreased < 1 to 0.7 ml/min, greatly decreased < 0.7 ml/min) and NSSF (decreased < 0.1 to 0.25 ml/min, greatly decreased < 0.1 ml/min). Patients with diabe-tes had worse NSSF assessment (p = 0.026, Fisher test) and SSF (p = 0.002, Chi Square).
Cells from patients with decreased unstimu-lated salivary flow have an increased nuclear size and greater NCR
We divided all patients according to test results for unstimulated salivary flow, which were obtained in normal and decreased unstimulat-ed salivary flow (NSSF). These values were associated with the nuclear/core diameter, cytoplasm and NCR. An 86.7% of the examined patients had a normal valuation for NSSF, while 13.3% had a decreased score for the exam. Table 4 shows the cytomorphometrical analy-sis of exfoliative cytology from normal and decreased/decreased NSSF groups. NSSF decreased in patients with a significant there was an increase in the core size (p = 0.001, Welch test) and greater NCR when it was com-pared to patients who had a regular NSSF (p < 0.001, Welch test). Cytoplasm size showed no statistically significant differences (p = 0.185, Student’s t test).
The decrease in the stimulated salivary flow produces a larger nuclear size and NCR
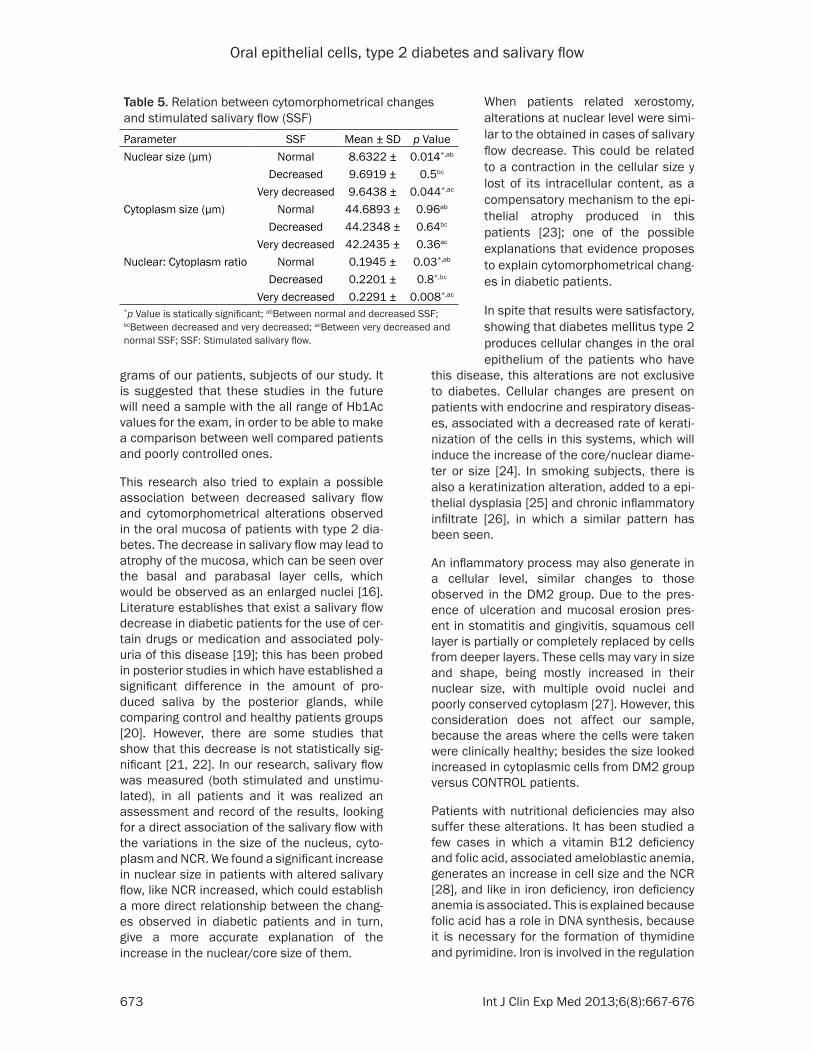
Related to the stimulated salivary flow (SSF), 76.7% of patients had a normal valuation, and a 13.3% a decreased SSF and 10% a very decreased value. Table 5 shows the cytomor-phometrical analysis of exfoliative cytology on normal, decreased and very decreased SSF groups. In patients with decreased and highly
Table 3. Quantitative analysis of salivary flow from CONTROL and DM2 patients
Parameter Group Mean ± DE P ValueStimulated salivary flow (SSF) (ml/3min) CONTROL 1.456 ± 0.3156 0.001*
DM2 1.054 ± 0.6078Non-stimulated salivary flow (NSSF) (ml/15min) CONTROL 0.607 ± 0.1258 < 0.001*
DM2 0.431 ± 0.2042*p Value is statically significant.
Patients with type 2 diabetes have decreased stimu-lated and unstimu-lated salivary flow
Table 3 shows the quantitative analy-sis of salivary flow test in DM2 and

Oral epithelial cells, type 2 diabetes and salivary flow
672 Int J Clin Exp Med 2013;6(8):667-676
decreased SSF there was a significant increase in the core size (p = 0.014 and p = 0.044 respectively, ANOVA with Tukey test) and great-er NCR in both cases (p < 0.03 and 0.008 respectively, ANOVA with Tukey test). Cytoplasm size showed no statistically significant differ- ences.
Xerostomy patients have an increased nuclear size and greater NCR
According to the given answers, a 60% of the patients said NO to have xerostomy, while a 10% presented IT and a 30% reported dry mouth feeling just sometimes. Table 6 shows cytomorphometrical analysis of exfoliative cytology for the assessment of xerostomy relat-ed at the time of the exam. In those patients who related to have xerostomy, there was a sig-nificant increase in nuclear/core size (p < 0.05, ANOVA with Tukey test). In reports in patients suffering from xerostomy, the calculated NCR was significant increased (p < 0.031, ANOVA with Tukey test). The size of the nucleus/core showed no significant differences between YES and sometimes groups (p = 0.585, ANOVA with Tukey test). Cytoplasm showed no statistically significant differences for any of the cases.
Discussion
In this research it was made an exfoliative citol-ogy with interproximal brush, for the cheek (bucca), clinically healthy, in 30 patients DM2 y 30 patients CONTROL (non diabetics). After that, from each patient, records of nuclear size, cytoplasm and mathematical proportions between them were taken, using a software of analysis comparison with cytomorphometrical analysis options.
Analysis found a significant increase in the core/nuclear size on DM2 patients, compared
It was tried to find a relationship between glyce-mia levels, salivary flow and nuclear/core size. An increase was described using the correla-tion of Pearson’s coefficient for both parame-ters, finding a rise in those two values, when glycemia levels were increased, and also NCR values. This is mainly because of the increased levels of blood glucose, which is related to a failure in the cellular and/or hormonal mecha-nisms, implied in the diabetes process. In spite of this, it is not possible to certainly say if glyce-mia can be a predictor factor for these param-eters, because even when it was observed an increase in the mean of both groups, glycemia levels may vary significantly according to momentary factors which are patient depen-dent. Consequently, glycated hemoglobin is a more reliable parameter at the moment of relating these variables.
Besides, a relationship between Hb1Ac levels and cellular size, cytoplasm and NCR was tried to find, but there was no statistically significant differences observed, and so, it was not possi-ble to determine the influence of Hb1Ac on this. These results were not coincident with the study realized by Prasad, et al. [14], where he found that diabetes severity, measured with Hb1Ac, had a relation with the increase of the nuclear/core size and NCR. This could be because they used a bigger sample size (n = 50); besides, the subjects of this investigation had worse levels of Hb1Ac, including values higher than 12%, compared to our study, in which the higher value was 9.8%, so, according to the informed values by them, the control degree of our patients based on the Hb1Ac vary between well controlled and moderately con-trolled, moving away from the extremes that would be interesting to study, which is explained by the active therapeutic and following pro-
Table 4. Relation between cytomorphometrical changes and non-stimulated salivary flow (NSSF)Parameter NSSF Mean ± SD p ValueNuclear size (µm) Normal 8.7953 ± 1.03688 0.001*,w
Decreased 9.6284 ± 0.50152Cytoplasm size (µm) Normal 44.7677 ± 4.28659 0.185t
Decreased 43.3386 ± 3.13872Nuclear: Cytoplasm ratio Normal 0.1979 ± 0.02783 < 0.001*,w
Decreased 0.2228 ± 0.01405*p Value is statically significant; wWelch’s test; tStudent’s test; NSSF: Non-stimulat-ed salivary flow.
to the CONTROL group, and also a higher NCR value. This results are comparable to the reported previously by several studies [10-13]. Cytoplasm size was bigger in DM2 group in contrast to those patients from CONTROL, but without any significant difference. This is comparable with the results of Alberti, et al. [10], but con-trary to the register by Jajarm, et al. [15].
Oral epithelial cells, type 2 diabetes and salivary flow
673 Int J Clin Exp Med 2013;6(8):667-676
grams of our patients, subjects of our study. It is suggested that these studies in the future will need a sample with the all range of Hb1Ac values for the exam, in order to be able to make a comparison between well compared patients and poorly controlled ones.
This research also tried to explain a possible association between decreased salivary flow and cytomorphometrical alterations observed in the oral mucosa of patients with type 2 dia-betes. The decrease in salivary flow may lead to atrophy of the mucosa, which can be seen over the basal and parabasal layer cells, which would be observed as an enlarged nuclei [16]. Literature establishes that exist a salivary flow decrease in diabetic patients for the use of cer-tain drugs or medication and associated poly-uria of this disease [19]; this has been probed in posterior studies in which have established a significant difference in the amount of pro-duced saliva by the posterior glands, while comparing control and healthy patients groups [20]. However, there are some studies that show that this decrease is not statistically sig-nificant [21, 22]. In our research, salivary flow was measured (both stimulated and unstimu-lated), in all patients and it was realized an assessment and record of the results, looking for a direct association of the salivary flow with the variations in the size of the nucleus, cyto-plasm and NCR. We found a significant increase in nuclear size in patients with altered salivary flow, like NCR increased, which could establish a more direct relationship between the chang-es observed in diabetic patients and in turn, give a more accurate explanation of the increase in the nuclear/core size of them.
this disease, this alterations are not exclusive to diabetes. Cellular changes are present on patients with endocrine and respiratory diseas-es, associated with a decreased rate of kerati-nization of the cells in this systems, which will induce the increase of the core/nuclear diame-ter or size [24]. In smoking subjects, there is also a keratinization alteration, added to a epi-thelial dysplasia [25] and chronic inflammatory infiltrate [26], in which a similar pattern has been seen.
An inflammatory process may also generate in a cellular level, similar changes to those observed in the DM2 group. Due to the pres-ence of ulceration and mucosal erosion pres-ent in stomatitis and gingivitis, squamous cell layer is partially or completely replaced by cells from deeper layers. These cells may vary in size and shape, being mostly increased in their nuclear size, with multiple ovoid nuclei and poorly conserved cytoplasm [27]. However, this consideration does not affect our sample, because the areas where the cells were taken were clinically healthy; besides the size looked increased in cytoplasmic cells from DM2 group versus CONTROL patients.
Patients with nutritional deficiencies may also suffer these alterations. It has been studied a few cases in which a vitamin B12 deficiency and folic acid, associated ameloblastic anemia, generates an increase in cell size and the NCR [28], and like in iron deficiency, iron deficiency anemia is associated. This is explained because folic acid has a role in DNA synthesis, because it is necessary for the formation of thymidine and pyrimidine. Iron is involved in the regulation
Table 5. Relation between cytomorphometrical changes and stimulated salivary flow (SSF)Parameter SSF Mean ± SD p ValueNuclear size (µm) Normal 8.6322 ± 0.014*,ab
Decreased 9.6919 ± 0.5bc
Very decreased 9.6438 ± 0.044*,ac
Cytoplasm size (µm) Normal 44.6893 ± 0.96ab
Decreased 44.2348 ± 0.64bc
Very decreased 42.2435 ± 0.36ac
Nuclear: Cytoplasm ratio Normal 0.1945 ± 0.03*,ab
Decreased 0.2201 ± 0.8*,bc
Very decreased 0.2291 ± 0.008*,ac
*p Value is statically significant; abBetween normal and decreased SSF; bcBetween decreased and very decreased; acBetween very decreased and normal SSF; SSF: Stimulated salivary flow.
When patients related xerostomy, alterations at nuclear level were simi-lar to the obtained in cases of salivary flow decrease. This could be related to a contraction in the cellular size y lost of its intracellular content, as a compensatory mechanism to the epi-thelial atrophy produced in this patients [23]; one of the possible explanations that evidence proposes to explain cytomorphometrical chang-es in diabetic patients.
In spite that results were satisfactory, showing that diabetes mellitus type 2 produces cellular changes in the oral epithelium of the patients who have

Oral epithelial cells, type 2 diabetes and salivary flow
674 Int J Clin Exp Med 2013;6(8):667-676
of many enzymatic processes involved in DNA synthesis, which is responsible for an increase in nuclear size [29].
In dysplastic and malignant type lesions, it is known that there is also an alteration of cell morphometry [30], but they may differ from that observed in diabetic patients in this inves-tigation due to the increase in the NCR and the nucleus uniformly [12]. Cellular findings were similar to those reported by research studies in patients undergoing on liver transplantation, where is able to be seen a uniformly increased NCR and nucleus [31]. It can also be seen in patients with chronic renal failure [32]. Other studies mention that there is a decrease in sali-vary flow and saliva can contain urea, factors that can influence cellular morphometric changes [31, 33]. In our research, all the above conditions on the anamnesis of patients found these marks as exclusionary factor, to avoid that the sample results could be altered by pathological conditions, has the previously described. Note that the last two conditions mentioned above, liver transplantation and renal failure had not been mentioned as an exclusion criterion in previous studies, linking cytomorphometrical oral cell changes in diabetes.
On a fundamental level, the nuclear volume is determined by the size and shape of the enve-lope [34], in a karyoplasm constant. The nucle-ar volume progressively increases while G1/M phase is pending, where no nuclear size depends on the amount of DNA and those nuclei surrounded by larger volume of growing
To try to justify the increasing the size of the nucleus in patients with diabetes, evidence of atrophy also wields epithelial cell aging. Aging is linked to the age of patients, because the type 2 diabetes is a disease also associated with more advanced decades of life. In previous researches, but analyzing patients with type I diabetes (mean age 32.7 years), there was an increase in nuclear size, compared with the control group, where the average age was 36.4 years [38]. If only cellular alterations caused aging, this explains why no major changes are observed in diabetic patients compared to younger healthier, hence the key is diabetes.
Another pattern that is directly related to aging, is the rate of cell turnover, which undergoes a decrease related adverse effect of ischemia due to atherosclerosis patients suffering from diabetes [39]. There is also an accumulation of the end products of advanced glycation, which involved not only in the pathogenesis of diabe-tes, but also in cellular aging [40, 41]. Previous studies have described the altering cell turn-over as one possible explanation for the observed changes in diabetic patients, being necessary to measure the rates of proliferation and cell turnover from biopsy, which is an inva-sive procedure. By exfoliative cytology is not possible to measure this, as cells obtained belong to the upper strata where it occurs grad-ually epithelial keratinization, with the prolifera-tion, switches off.
Finally, it is possible to say that cellular altera-tions occurred in patients with DM2, are relat-ed to blood glucose levels. It was also observed
Table 6. Cytomorphometrical analysis of the exfoliative cytology related to xerostomyParameter Xerostomy Mean ± SD p ValueNuclear size (µm) No 8.6147 ± 1.08943 0.039*,ab
Yes 9.6818 ± 0.61208 0.585bc Sometimes 9.2314 ± 0.74428 0.077*,ac
Cytoplasm size (µm) No 44.3637 ± 4.25291 0.765ab
Yes 43.079 ± 3.36715 0.438bc Sometimes 45.5034 ± 4.20045 0.613ac
Nuclear: Cytoplasm ratio
No 0.1952 ± 0.0257 0.031*,ab
Yes 0.2256 ± 0.01894 0.241bc Sometimes 0.2052 ± 0.02982 0.398ac
*p Value is statically significant; abBetween patients that not related xerostomy and those who did; bcBetween patients who related xerostomy and those who have it sometimes; acBetween patients who related xerostomy sometimes and those who do not.
faster cytoplasm [35]. The size of the nucleus of a cell is generally proportional to the size of the cell itself. How is that? The answer is a lie, at least in part, and by consequence one or more cytoplasmic loads into the nucle-us are observed in embryonic development models [36, 37]. There is a constant relationship between nuclear and cell vol-umes (NCR), and deviations thereof are associated with the disease, however these changes mechanisms in both health and disease stage are not yet eluci-dated [36].

Oral epithelial cells, type 2 diabetes and salivary flow
675 Int J Clin Exp Med 2013;6(8):667-676
that the decrease in salivary flow affects nucle-ar size and the NCR, in both tests, stimulated and unstimulated. Now, taking both factors, glucose and salivary flow, both have very simi-lar levels of significance, but based on the last factor, salivary flow (quantitative and qualita-tive), we can find a more accurate answer regarding cellular changes observed in diabetic patients, due to the epithelial atrophy associ-ated as possible main factor.
It has been previously demonstrated by cyto-morphometrical analysis, cellular alterations existing in diabetic patients, seeking possible explanations for the events recorded. Our research took into account also the salivary alterations, which were shown to be effectively related to an increase in nuclear size and NCR, something that has not been reported previ-ously. The hyposalivation and xerostomy can be important elements for dental exam, and the relationship of these factors with the use of exfoliative cytology may be an alternative avail-able tool to the dental surgeon in the diagnosis and management of systemic diseases.
Further studies are required to identify if it is to possible to use clinical information from sali-vary function and cytomorphometrical analysis, to see which patients have type II diabetes, being necessary to automatize cell measure-ments, which currently, is much easier to iden-tify and control from the glycemia and HbA1c standards. An interesting line of research to fol-low is to identify whether cytomorphometrical changes vary throughout medical history of patients with diabetes, which would support the potential clinical relevance of cytology diag-nosis made from dental exam.
Acknowledgements
The authors declare that there are no conflicts of interest. We would like to thank to the Dirección de Investigación (DI) of the Universidad de Talca for its cooperation.
Disclosure of conflict of interest
None.
Address correspondence to: Dr. César Rivera, Universidad de Talca Campus Norte, Departamento de Ciencias Básicas Biomédicas, Laboratorio de Morfología, Avenida Lircay S/N, Talca 3460000,
Región del Maule, Chile. ORCID 0000-0002-5491-4233. E-mail: [email protected]
References
[1] W.H.O. World Health Organization: Diabetes. Nota descriptiva N° 312. Available: http://www.who.int/mediacentre/factsheets/fs312/es/. 2012.
[2] A.D.A. American Diabetes Association: Stan-dards of Medical Care in Diabetes. Diabetes Care 2013; 36: S11-S66.
[3] W.H.O. World Health Organization: Definition and diagnosis of diabetes mellitus and inter-mediate hyperglycemia: report of a WHO/IDF consultation. Geneva: World Health Organiza-tion 2006; 1-50.
[4] Gomero A, McDade T, Williams S and Lindau S. Dried Blood Spot Measurement of Glycosylat-ed Hemoglobin (HbA1c) in Wave I of the Na-tional Social Life Health & Aging Project. 2008.
[5] Isley WMM, Vigersky RA. Type II Diabetes and A1C. The Journal of Clinical Endocrinology and Metabolism 2004; 89.
[6] Manfredi M, McCullough M, Vescovi P, Al-Kaarawi Z and Porter S. Update on diabetes mellitus and related oral diseases. Oral dis-eases 2004; 10: 187-200.
[7] Mehrotra R. Oral Cytology: A Concise Guide. Springer 2012.
[8] Ogden GR, Cowpe JG, Green M. Cytobrush and wooden spatula for oral exfoliative cytology. A comparison. Acta Cytol 1992; 36: 706-710.
[9] Mehrotra R. The role of cytology in oral lesions: a review of recent improvements. Diagn Cyto-pathol 2012; 40: 73-83.
[10] Alberti S, Spadella C, Francischone T, Assis G, Cestari T and Taveira L. Exfoliative cytology of the oral mucosa in type II diabetic patients: morphology and cytomorphometry. J Oral Pathol Med 2003; 32: 538-543.
[11] Hallikerimath S, Sapra G, Kale A and Malur P. Cytomorphometric analysis and assessment of Periodic Acid Schiff positivity of Exfoliated cells from apparently normal buccal mucosa of type 2 diabetic patients. Acta cytologica 2011; 55: 197-202.
[12] Suvarna M, Anuradha C, Kumar K and Sekhar P. Cytomorphometric analysis of exfoliative buccal cells in type II diabetic patients. J Dr NTR Univ Health Sci 2012; 1: 33.
[13] Shareef BT, Ang KT and Naik VR. Qualitative and quantitative exfoliative cytology of normal oral mucosa in type 2 diabetic patients. Med Oral Pathol Oral Cir Bucal 2008; 13: E693-6.
[14] Prasad H, Ramesh V and Balamurali P. Mor-phologic and cytomorphometric analysis of ex-foliated buccal mucosal cells in diabetes pa-tients. J Cytol 2010; 27: 113.

Oral epithelial cells, type 2 diabetes and salivary flow
676 Int J Clin Exp Med 2013;6(8):667-676
[15] Jajarm HH, Mohtasham N and Rangiani A. Evaluation of oral mucosa epithelium in type II diabetic patients by an exfoliative cytology method. J Oral Sci 2008; 50: 335-340.
[16] Ogden GR, Cowpe JG and Green M. Cytobrush and wooden spatula for oral exfoliative cytolo-gy. A comparison. Acta Cytol 1992; 36: 706-710.
[17] Heintze U, Frostell G, Lindgarde F and Trell E. Secretion rate and buffer effect of resting and stimulated whole saliva in relation to general health. Swed Dent J 1986; 10: 213-219.
[18] Bergdahl M and Bergdahl J. Low unstimulated salivary flow and subjective oral dryness: as-sociation with medication, anxiety, depression, and stress. J Dent Res 2000; 79: 1652-1658.
[19] Conner S, Iranpour B and Mills J. Alteration in parotid salivary flow in diabetes mellitus. Oral Surg Oral Med Oral Pathol 1970; 30: 55-59.
[20] Bakianian Vaziri P, Vahedi M, Mortazavi H, Ab-dollahzadeh S and Hajilooi M. Evaluation of salivary glucose, IgA and flow rate in diabetic patients: a case-control study. J Dent (Tehran) 2010; 7: 13-18.
[21] Lamey PJ, Fisher BM and Frier BM. The effects of diabetes and autonomic neuropathy on pa-rotid salivary flow in man. Diabet Med 1986; 3: 537-540.
[22] Panchbhai AS, Degwekar SS and Bhowte RR. Estimation of salivary glucose, salivary amy-lase, salivary total protein and salivary flow rate in diabetics in India. J Oral Sci 2010; 52: 359-368.
[23] Wandeur T, de Moura SA, de Medeiros AM, Machado MA, Alanis LR, Gregio AM, Trevilatto PC and de Lima AA. Exfoliative cytology of the oral mucosa in burning mouth syndrome: a cy-tomorphological and cytomorphometric analy-sis. Gerodontology 2011; 28: 44-48.
[24] Zimmermann ER and Zimmermann AL. Effects of race, age, smoking habits, oral and systemic disease on oral exfoliative cytology. J Dent Res 1965; 44: 627-631.
[25] Göregen M, Akgül HM and Gündoğdu C. The cytomorphological analysis of buccal mucosa cells in smokers. Turk J Med Sci 2011; 41: 205-210.
[26] Ramaesh T, Mendis B, Ratnatunga N and That-til R. The effect of tobacco smoking and of be-tel chewing with tobacco on the buccal muco-sa: a cytomorphometric analysis. J Oral Pathol Me 1999; 28: 385-388.
[27] Koss LG and Melamed MR. Koss’ diagnostic cytology and its histopathologic bases. Lippin-cott Williams & Wilkins 2006.
[28] Macleod RI, Hamilton PJ, Soames JV. Quantita-tive exfoliative oral cytology in iron-deficiency and megaloblastic anemia. Anal Quant Cytol Histol 1988; 10: 176-80.
[29] Sumanthi J, Reddy GS, Anuradha C, Sekhar PC, Prasad LK and Reddy BR. A study on cyto-morphometric analysis of exfoliative buccal cells in iron deficiency anemic patients. Con-temp Clin Dent 2012; 3: S156.
[30] Cowpe J, Longmore R and Green M. Quantita-tive exfoliative cytology of normal oral squames: an age, site and sex-related survey. J R Soc Med 1985; 78: 995.
[31] Keles M, Tozoglu U, Uyanik A, Eltas A, Bayindir YZ, Cetinkaya R and Bilge OM. Does peritoneal dialysis affect halitosis in patients with end-stage renal disease? Perit Dial Int 2011; 31: 168-172.
[32] Tozoğlu Ü, Keles M, Ünal D and Uyanik A. Cyto-logical analysis of the oral cells of chronic re-nal failure patients: a cytomorphometric study. Turkish Journal of Medical Sciences 2012; 42: 1443-1448.
[33] Bots C, Brand H, Poorterman J, Van Ameron-gen B, Valentijn-Benz M, Veerman E, Ter Wee P and Amerongen AN. Oral and salivary changes in patients with end stage renal disease (ESRD): a two year follow-up study. Br Dent J 2007; 202: E7-E7.
[34] Huber MD and Gerace L. The size-wise nucle-us: nuclear volume control in eukaryotes. J Cell Biol 2007; 179: 583-584.
[35] Neumann FR and Nurse P. Nuclear size control in fission yeast. J Cell Biol 2007; 179: 593-600.
[36] Cohen-Fix O. Import and nuclear size. Nature 2010; 468: 513-6.
[37] Levy DL and Heald R. Nuclear Size Is Regulat-ed by Importin α and Ntf2 in Xenopus. Cell 2010; 143: 288-298.
[38] Tozoğlu Ü and Bilge OM. Exfoliative Cytology of Type 1 Diabetic Patients. Eur J Gen Med 2010; 7: 264-268.
[39] Morris HF, Ochi S and Winkler S. Implant sur-vival in patients with type 2 diabetes: place-ment to 36 months. Ann Periodontol 2000; 5: 157-165.
[40] Méndez JD. Productos finales de glicación avanzada y complicaciones crónicas de la dia-betes mellitus. Gac Med Mex 2003; 139: 49-56.
[41] Kumar V, Abbas AK and Aster J. Robbins basic pathology. WB saunders company 2012.