Exercise Effects on Bone Mineral Density in Men - MDPI
16
nutrients Systematic Review Exercise Effects on Bone Mineral Density in Men Michelle Mages 1 , Mahdieh Shojaa 1,2 , Matthias Kohl 3,† , Simon von Stengel 1,† , Clemens Becker 4,† , Markus Gosch 5,† , Franz Jakob 6,† , Katharina Kerschan-Schindl 7,† , Bernd Kladny 8,† , Nicole Klöckner 9,† , Uwe Lange 10,† , Stefan Middeldorf 11,† , Stefan Peters 12,† , Daniel Schoene 1,† , Cornel C. Sieber 13,† , Reina Tholen 14,† , Friederike E. Thomasius 15,† , Michael Uder 16 and Wolfgang Kemmler 1,16, * ,† Citation: Mages, M.; Shojaa, M.; Kohl, M.; von Stengel, S.; Becker, C.; Gosch, M.; Jakob, F.; Kerschan-Schindl, K.; Kladny, B.; Klöckner, N.; et al. Exercise Effects on Bone Mineral Density in Men. Nutrients 2021, 13, 4244. https://doi.org/10.3390/nu13124244 Academic Editors: Connie Weaver and Maria Luz Fernandez Received: 28 September 2021 Accepted: 19 November 2021 Published: 26 November 2021 Publisher’s Note: MDPI stays neutral with regard to jurisdictional claims in published maps and institutional affil- iations. Copyright: © 2021 by the authors. Licensee MDPI, Basel, Switzerland. This article is an open access article distributed under the terms and conditions of the Creative Commons Attribution (CC BY) license (https:// creativecommons.org/licenses/by/ 4.0/). 1 Institute of Medical Physics, Friedrich-Alexander University Erlangen-Nürnberg, 91052 Erlangen, Germany; [email protected] (M.M.); [email protected] (M.S.); [email protected] (S.v.S.); [email protected] (D.S.) 2 Department Population-Based Medicine, Institute of Health Science, University Hospital Tübingen, 72076 Tübingen, Germany 3 Department of Medical and Life Sciences, University of Furtwangen, 78056 Villingen-Schwenningen, Germany; [email protected] 4 Robert-Bosch-Krankenhaus, Geriatrie und Geriatrische Rehabilitation, 70376 Stuttgart, Germany; [email protected] 5 Klinikum Nurnberg, Paracelsus Medizinische Privatuniversität, 90419 Nürnberg, Germany; [email protected] 6 Bernhard Heine Zentrum für Bewegungsforschung, University of Würzburg, 97074 Würzburg, Germany; [email protected] 7 Austrian Society for Bone and Mineral Research (ÖGKM), A-1090 Wien, Austria; [email protected] 8 German Society for Orthopaedics and Trauma (DGOU), 10623 Berlin, Germany; [email protected] 9 Deutsche Rheuma-Liga Bundesverband e.V., 53111 Bonn, Germany; [email protected] 10 German Society for Physical and Rehabilitative Medicine (DGMPR), 01067 Dresden, Germany; [email protected] 11 International Musculoskeletal Pain Society (IGOST), 88212 Ravensburg, Germany; [email protected] 12 Deutscher Verband für Gesundheitssport und Sporttherapie e.V. (DVGS), 50354 Hürth, Germany; [email protected] 13 European Geriatric Medicine Society (EuGMS), Institute for Biomedicine of Aging, FAU Erlangen-Nürnberg, 90419 Nürnberg, Germany; [email protected] 14 Deutscher Verband für Physiotherapie (ZVK) e.V., 50679 Cologne, Germany; [email protected] 15 Osteology Umbrella Association Germany (DVO), 67659 Kaiserslautern, Germany; [email protected] 16 Institute of Radiology, FAU-Erlangen-Nürnberg and University Hospital Erlangen, 91054 Erlangen, Germany; [email protected] * Correspondence: [email protected] † Research Group on German Guideline “Exercise and Fracture Prevention”. Abstract: In contrast to postmenopausal women, evidence for a favorable effect of exercise on Bone Mineral Density (BMD) is still limited for men. This might be due to the paucity of studies, but also to the great variety of participants and study characteristics that may dilute study results. The aim of the present systematic review and meta-analysis was to evaluate the effect of exercise on BMD changes with rational eligibility criteria. A comprehensive search of six electronic databases up to 15 March 2021 was conducted. Briefly, controlled trials ≥6 months that determined changes in areal BMD in men >18 years old, with no apparent diseases or pharmacological therapy that relevantly affect bone metabolism, were included. BMD changes (standardized mean differences: SMD) of the lumbar spine (LS) and femoral neck (FN) were considered as outcomes. Twelve studies with 16 exercise and 12 control groups were identified. The pooled estimate of random-effect analysis was SMD = 0.38, 95%-CI: 0.14–0.61 and SMD = 0.25, 95%-CI: 0.00–0.49, for LS and FN, respectively. Heterogeneity between the trials was low–moderate. Funnel plots and rank and regression correlation tests indicate evidence for small study publication bias for LS but not FN-BMD. Subgroup analyses that focus on study length, type of exercise and methodologic quality revealed no significant difference between each of the three categories. In summary, we provided further Nutrients 2021, 13, 4244. https://doi.org/10.3390/nu13124244 https://www.mdpi.com/journal/nutrients
-
Upload
khangminh22 -
Category
Documents
-
view
0 -
download
0
Transcript of Exercise Effects on Bone Mineral Density in Men - MDPI
nutrients
Systematic Review
Exercise Effects on Bone Mineral Density in Men
Michelle Mages 1, Mahdieh Shojaa 1,2, Matthias Kohl 3,† , Simon von Stengel 1,†, Clemens Becker 4,†,Markus Gosch 5,† , Franz Jakob 6,†, Katharina Kerschan-Schindl 7,†, Bernd Kladny 8,†, Nicole Klöckner 9,†,Uwe Lange 10,†, Stefan Middeldorf 11,†, Stefan Peters 12,†, Daniel Schoene 1,†, Cornel C. Sieber 13,†,Reina Tholen 14,†, Friederike E. Thomasius 15,†, Michael Uder 16 and Wolfgang Kemmler 1,16,*,†
�����������������
Citation: Mages, M.; Shojaa, M.;
Kohl, M.; von Stengel, S.; Becker, C.;
Gosch, M.; Jakob, F.;
Kerschan-Schindl, K.; Kladny, B.;
Klöckner, N.; et al. Exercise Effects on
Bone Mineral Density in Men.
Nutrients 2021, 13, 4244.
https://doi.org/10.3390/nu13124244
Academic Editors: Connie Weaver
and Maria Luz Fernandez
Received: 28 September 2021
Accepted: 19 November 2021
Published: 26 November 2021
Publisher’s Note: MDPI stays neutral
with regard to jurisdictional claims in
published maps and institutional affil-
iations.
Copyright: © 2021 by the authors.
Licensee MDPI, Basel, Switzerland.
This article is an open access article
distributed under the terms and
conditions of the Creative Commons
Attribution (CC BY) license (https://
creativecommons.org/licenses/by/
4.0/).
1 Institute of Medical Physics, Friedrich-Alexander University Erlangen-Nürnberg, 91052 Erlangen, Germany;[email protected] (M.M.); [email protected] (M.S.);[email protected] (S.v.S.); [email protected] (D.S.)
2 Department Population-Based Medicine, Institute of Health Science, University Hospital Tübingen,72076 Tübingen, Germany
3 Department of Medical and Life Sciences, University of Furtwangen,78056 Villingen-Schwenningen, Germany; [email protected]
4 Robert-Bosch-Krankenhaus, Geriatrie und Geriatrische Rehabilitation, 70376 Stuttgart, Germany;[email protected]
5 Klinikum Nurnberg, Paracelsus Medizinische Privatuniversität, 90419 Nürnberg, Germany;[email protected]
6 Bernhard Heine Zentrum für Bewegungsforschung, University of Würzburg, 97074 Würzburg, Germany;[email protected]
7 Austrian Society for Bone and Mineral Research (ÖGKM), A-1090 Wien, Austria;[email protected]
8 German Society for Orthopaedics and Trauma (DGOU), 10623 Berlin, Germany;[email protected]
9 Deutsche Rheuma-Liga Bundesverband e.V., 53111 Bonn, Germany; [email protected] German Society for Physical and Rehabilitative Medicine (DGMPR), 01067 Dresden, Germany;
[email protected] International Musculoskeletal Pain Society (IGOST), 88212 Ravensburg, Germany;
[email protected] Deutscher Verband für Gesundheitssport und Sporttherapie e.V. (DVGS), 50354 Hürth, Germany;
[email protected] European Geriatric Medicine Society (EuGMS), Institute for Biomedicine of Aging, FAU Erlangen-Nürnberg,
90419 Nürnberg, Germany; [email protected] Deutscher Verband für Physiotherapie (ZVK) e.V., 50679 Cologne, Germany; [email protected] Osteology Umbrella Association Germany (DVO), 67659 Kaiserslautern, Germany; [email protected] Institute of Radiology, FAU-Erlangen-Nürnberg and University Hospital Erlangen, 91054 Erlangen, Germany;
[email protected]* Correspondence: [email protected]† Research Group on German Guideline “Exercise and Fracture Prevention”.
Abstract: In contrast to postmenopausal women, evidence for a favorable effect of exercise on BoneMineral Density (BMD) is still limited for men. This might be due to the paucity of studies, butalso to the great variety of participants and study characteristics that may dilute study results. Theaim of the present systematic review and meta-analysis was to evaluate the effect of exercise onBMD changes with rational eligibility criteria. A comprehensive search of six electronic databasesup to 15 March 2021 was conducted. Briefly, controlled trials ≥6 months that determined changesin areal BMD in men >18 years old, with no apparent diseases or pharmacological therapy thatrelevantly affect bone metabolism, were included. BMD changes (standardized mean differences:SMD) of the lumbar spine (LS) and femoral neck (FN) were considered as outcomes. Twelve studieswith 16 exercise and 12 control groups were identified. The pooled estimate of random-effectanalysis was SMD = 0.38, 95%-CI: 0.14–0.61 and SMD = 0.25, 95%-CI: 0.00–0.49, for LS and FN,respectively. Heterogeneity between the trials was low–moderate. Funnel plots and rank andregression correlation tests indicate evidence for small study publication bias for LS but not FN-BMD.Subgroup analyses that focus on study length, type of exercise and methodologic quality revealedno significant difference between each of the three categories. In summary, we provided further
Nutrients 2021, 13, 4244. https://doi.org/10.3390/nu13124244 https://www.mdpi.com/journal/nutrients
Nutrients 2021, 13, 4244 2 of 16
evidence for a low but significant effect of exercise on BMD in men. However, we are currentlyunable to give even rough exercise recommendations for male cohorts.
Keywords: Bone Mineral Density; exercise; men; overview
1. Introduction
Many guidelines on osteoporosis and fracture prevention consider physical exercise asthe most effective non-pharmacologic agent for increasing bone strength and reducing falls(e.g., [1–3]). However, in contrast to female cohorts [4,5], evidence for a favorable effect ofexercise on Bone Mineral Density (BMD) in men is still limited (review in [6–9]). Recently,two systematic reviews and meta-analyses of randomized controlled trials reported dataon physical activity/exercise effects on BMD in men 18 years and older [6,8]. Ashe et al. [6]reported significant exercise effects on BMD at the total hip but little or no effect of exerciseon the adjacent femoral neck (FN)-BMD. In contrast, the meta-analysis of Hamilton et al. [8]indicates significant evidence for an exercise effect on FN-BMD. Of importance, bothstudies do not observe any relevant beneficial effect of exercise on BMD at the lumbarspine (LS). Considering this brand-new meta-analytic data, one justifiably wonders aboutthe rationale for another meta-analysis in the area of exercise, BMD and men. However,trivially, the results of meta-analyses predominately depend on the studies included.Apart from new study results, our eligibility criteria substantially differ from both studies.This particularly relates to pre-study exercise status, prevalent diseases/conditions andpharmacologic therapy with potential impact on exercise effects (i.e., differences in BMD-changes between exercise and control) on BMD. However, applying too critical a set ofcriteria aggravates the paucity of exercise studies with men performed in the gynocentricfield of osteoporosis. Thus, we aimed to apply a balanced compromise between eligibilityand number of studies included. This embraces the approach to exclude studies thatfocus on cohorts with diseases (e.g., inflammatory diseases) and pharmaceutic therapy(e.g., androgen deprivation therapy) with proven negative impact on exercise effects onbone. In summary then, the aim of the present systematic review and meta-analysis was toevaluate the effect of exercise on BMD at the lumbar spine and proximal femur ROIs inmen applying reasonable eligibility criteria. Additionally, we intended to identify studyand exercise characteristics with impact on BMD.
2. Materials and Methods2.1. Literature Search
The current systematic review and meta-analysis follows the Preferred ReportingItems for Systematic Reviews and Meta-Analyses (PRISMA) Statement [10] and was reg-istered in the international prospective register of systematic reviews. (PROSPERO; ID:CRD42021233194).
Although our 2018 systematic review on exercise effects in men [9] identified eligi-ble articles before 2018, an new extensive search of electronic databases was performedthrough PubMed, Science direct, Scopus, Web of Science, Cochrane and ERIC for all articlespublished in German or English language up to 15 March 2021. A standard search protocolwas developed and controlled vocabulary (Mesh term for MEDLINE) was applied. Inorder to include all the relevant studies, the following key words and their synonyms wereused: “Exercise” or “Physical activity” or “Exercise training” or “Resistance training” or“Training”) AND (“men” or “male”) AND (“Bone” or “Bone mass” or “Bone density” or“Bone mineral content” or “Bone mineral density” or “BMD”). Additionally, the referencelists of the identified studies were reviewed to identify further relevant articles. Duplicatepublications were identified by comparing author names, type of intervention, interventionduration and date of publication. If further information was needed, the authors werecontacted via e-mail. In summary, four authors were contacted, three of them finally
Nutrients 2021, 13, 4244 3 of 16
responded. One author submitted data for their male cohort [11], two authors were unableto provide further study information.
2.2. Inclusion and Exclusion Criteria
We included studies/study arms with (1) randomized and non-randomized controlledtrials with at least one exercise group as an intervention versus one control group withsedentary/habitual active lifestyle without exercise or with sham exercise. (2) ≥6 monthsintervention duration, (3) Areal BMD of the LS, femoral neck (FN) and/or total hip (tH) regionat baseline and study end as determined by (4) dual-energy X-ray absorptiometry (DXA)or dual-photon absorptiometry (DPA). We excluded studies with (1) diseases/conditionswith relevant impact on bone metabolism (e.g., inflammatory diseases), (2) pharmaceutictherapy that relevantly affects bone metabolism (e.g., androgen deprivation therapy),(3) mixed-gender cohorts without separate BMD analysis for men, (4) double/multiplepublications from one study and preliminary data from subsequently published trials;(5) Review articles, case reports, editorials, conference abstracts, and letters were notconsidered. (6) We also excluded studies with participants with pre-training exercise habitsclose to the volume and intensity applied by the intervention protocol.
2.3. Data Extraction
Titles and abstracts were screened by an independent reviewer (MM) carefully su-pervised by a second rater (WK). Full-text articles of relevant studies were evaluatedby two reviewers (MM and WK) independently and they extracted data from includedstudies. In the case of disagreement, the third reviewer was consulted until a consensuswas reached. An extraction form was utilized to consider the relevant data includingpublication information (i.e., name of the first author and year of publication), study details(i.e., study duration, initial sample size of the participants, dropout rate), participants’characteristics (i.e., age, BMI, health-, BMD- and exercise status, medication with impact onbone, nutrition, dietary supplementation) (Table 1), methodologic quality aspects (Table 2),exercise characteristics (i.e., type of exercise, progression of intensity, frequency, settingand supervision, duration, sets and repetition, site specificity), and adherence to exercise(including number of withdrawals) (Table 3).
Nutrients 2021, 13, 4244 4 of 16
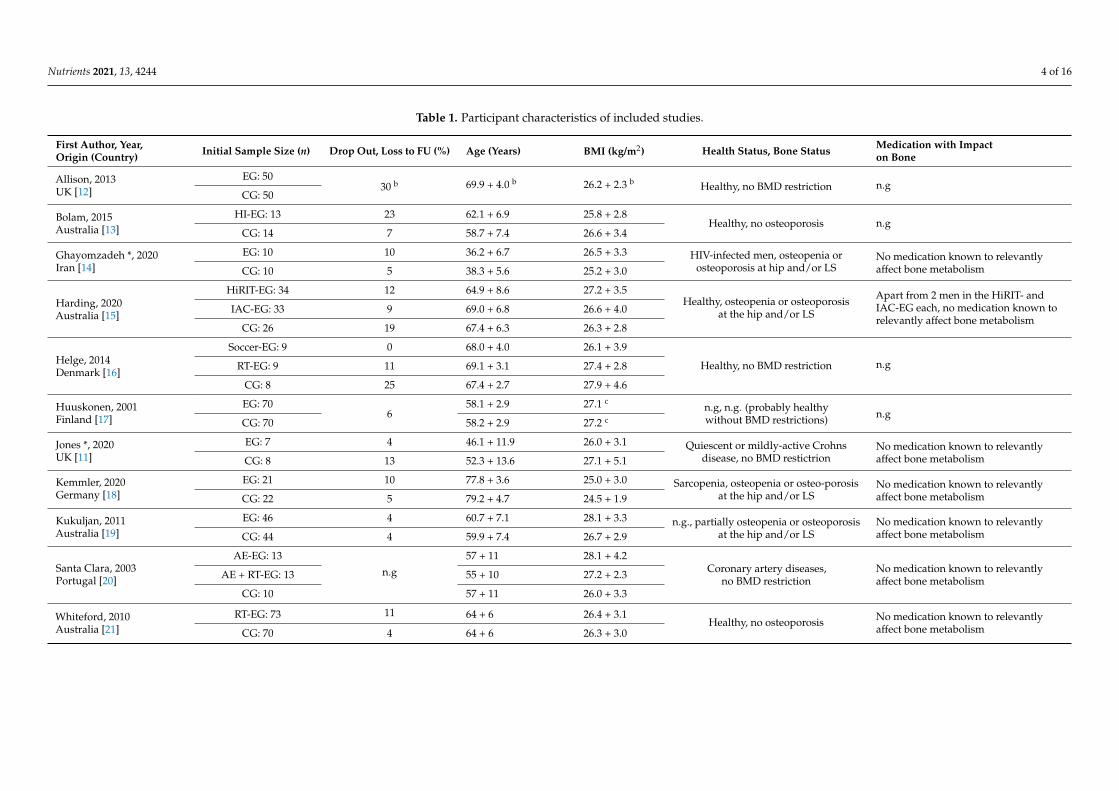
Table 1. Participant characteristics of included studies.
First Author, Year,Origin (Country) Initial Sample Size (n) Drop Out, Loss to FU (%) Age (Years) BMI (kg/m2) Health Status, Bone Status Medication with Impact
on Bone
Allison, 2013UK [12]
EG: 5030 b 69.9 + 4.0 b 26.2 + 2.3 b Healthy, no BMD restriction n.g
CG: 50
Bolam, 2015Australia [13]
HI-EG: 13 23 62.1 + 6.9 25.8 + 2.8Healthy, no osteoporosis n.g
CG: 14 7 58.7 + 7.4 26.6 + 3.4
Ghayomzadeh *, 2020Iran [14]
EG: 10 10 36.2 + 6.7 26.5 + 3.3 HIV-infected men, osteopenia orosteoporosis at hip and/or LS
No medication known to relevantlyaffect bone metabolismCG: 10 5 38.3 + 5.6 25.2 + 3.0
Harding, 2020Australia [15]
HiRIT-EG: 34 12 64.9 + 8.6 27.2 + 3.5Healthy, osteopenia or osteoporosis
at the hip and/or LS
Apart from 2 men in the HiRIT- andIAC-EG each, no medication known torelevantly affect bone metabolism
IAC-EG: 33 9 69.0 + 6.8 26.6 + 4.0
CG: 26 19 67.4 + 6.3 26.3 + 2.8
Helge, 2014Denmark [16]
Soccer-EG: 9 0 68.0 + 4.0 26.1 + 3.9
Healthy, no BMD restriction n.gRT-EG: 9 11 69.1 + 3.1 27.4 + 2.8
CG: 8 25 67.4 + 2.7 27.9 + 4.6
Huuskonen, 2001Finland [17]
EG: 706
58.1 + 2.9 27.1 cn.g, n.g. (probably healthywithout BMD restrictions) n.g
CG: 70 58.2 + 2.9 27.2 c
Jones *, 2020UK [11]
EG: 7 4 46.1 + 11.9 26.0 + 3.1 Quiescent or mildly-active Crohnsdisease, no BMD restictrion
No medication known to relevantlyaffect bone metabolismCG: 8 13 52.3 + 13.6 27.1 + 5.1
Kemmler, 2020Germany [18]
EG: 21 10 77.8 + 3.6 25.0 + 3.0 Sarcopenia, osteopenia or osteo-porosisat the hip and/or LS
No medication known to relevantlyaffect bone metabolismCG: 22 5 79.2 + 4.7 24.5 + 1.9
Kukuljan, 2011Australia [19]
EG: 46 4 60.7 + 7.1 28.1 + 3.3 n.g., partially osteopenia or osteoporosisat the hip and/or LS
No medication known to relevantlyaffect bone metabolismCG: 44 4 59.9 + 7.4 26.7 + 2.9
Santa Clara, 2003Portugal [20]
AE-EG: 13
n.g
57 + 11 28.1 + 4.2Coronary artery diseases,
no BMD restrictionNo medication known to relevantlyaffect bone metabolismAE + RT-EG: 13 55 + 10 27.2 + 2.3
CG: 10 57 + 11 26.0 + 3.3
Whiteford, 2010Australia [21]
RT-EG: 73 11 64 + 6 26.4 + 3.1Healthy, no osteoporosis No medication known to relevantly
affect bone metabolismCG: 70 4 64 + 6 26.3 + 3.0
Nutrients 2021, 13, 4244 5 of 16
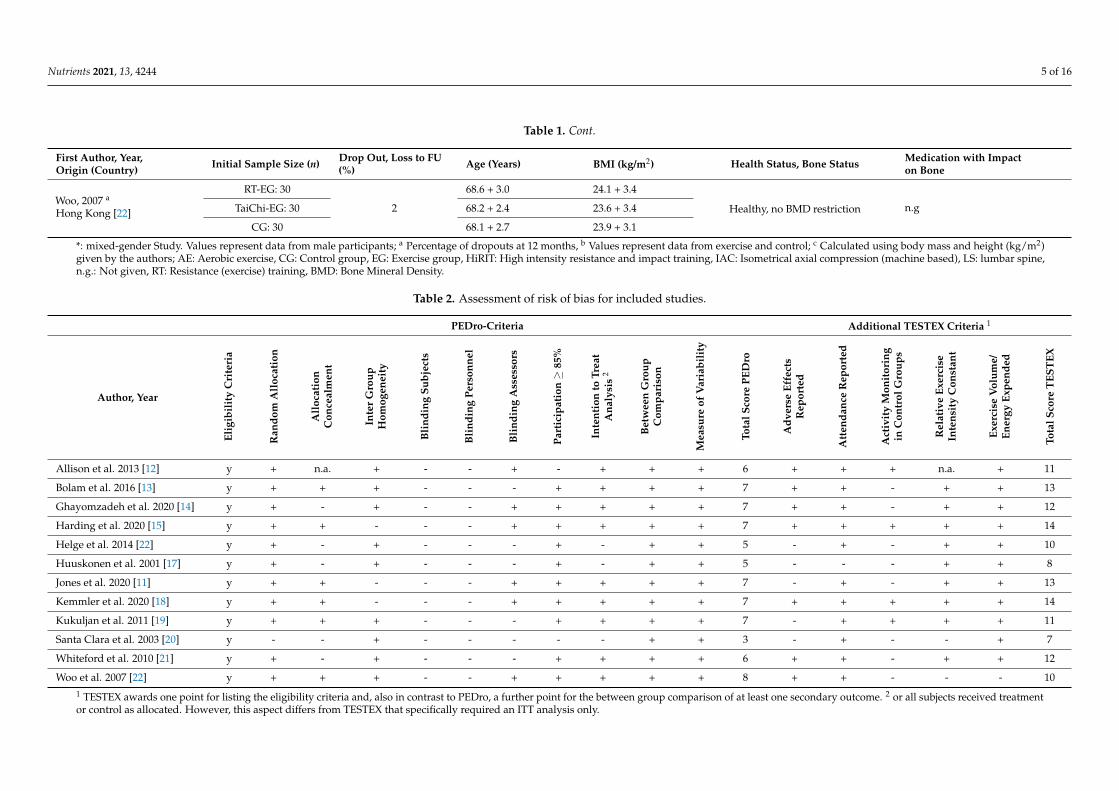
Table 1. Cont.
First Author, Year,Origin (Country) Initial Sample Size (n) Drop Out, Loss to FU
(%) Age (Years) BMI (kg/m2) Health Status, Bone Status Medication with Impacton Bone
Woo, 2007 a
Hong Kong [22]
RT-EG: 30
2
68.6 + 3.0 24.1 + 3.4
Healthy, no BMD restriction n.gTaiChi-EG: 30 68.2 + 2.4 23.6 + 3.4
CG: 30 68.1 + 2.7 23.9 + 3.1
*: mixed-gender Study. Values represent data from male participants; a Percentage of dropouts at 12 months, b Values represent data from exercise and control; c Calculated using body mass and height (kg/m2)given by the authors; AE: Aerobic exercise, CG: Control group, EG: Exercise group, HiRIT: High intensity resistance and impact training, IAC: Isometrical axial compression (machine based), LS: lumbar spine,n.g.: Not given, RT: Resistance (exercise) training, BMD: Bone Mineral Density.
Table 2. Assessment of risk of bias for included studies.
PEDro-Criteria Additional TESTEX Criteria 1
Author, Year
Elig
ibil
ity
Cri
teri
a
Ran
dom
All
ocat
ion
All
ocat
ion
Con
ceal
men
t
Inte
rG
roup
Hom
ogen
eity
Bli
ndin
gSu
bjec
ts
Bli
ndin
gPe
rson
nel
Bli
ndin
gA
sses
sors
Part
icip
atio
n≥
85%
Inte
ntio
nto
Trea
tA
naly
sis
2
Bet
wee
nG
roup
Com
pari
son
Mea
sure
ofV
aria
bili
ty
Tota
lSco
rePE
Dro
Adv
erse
Effe
cts
Rep
orte
d
Att
enda
nce
Rep
orte
d
Act
ivit
yM
onit
orin
gin
Con
trol
Gro
ups
Rel
ativ
eEx
erci
seIn
tens
ity
Con
stan
t
Exer
cise
Vol
ume/
Ener
gyEx
pend
ed
Tota
lSco
reT
EST
EX
Allison et al. 2013 [12] y + n.a. + - - + - + + + 6 + + + n.a. + 11
Bolam et al. 2016 [13] y + + + - - - + + + + 7 + + - + + 13
Ghayomzadeh et al. 2020 [14] y + - + - - + + + + + 7 + + - + + 12
Harding et al. 2020 [15] y + + - - - + + + + + 7 + + + + + 14
Helge et al. 2014 [22] y + - + - - - + - + + 5 - + - + + 10
Huuskonen et al. 2001 [17] y + - + - - - + - + + 5 - - - + + 8
Jones et al. 2020 [11] y + + - - - + + + + + 7 - + - + + 13
Kemmler et al. 2020 [18] y + + - - - + + + + + 7 + + + + + 14
Kukuljan et al. 2011 [19] y + + + - - - + + + + 7 - + + + + 11
Santa Clara et al. 2003 [20] y - - + - - - - - + + 3 - + - - + 7
Whiteford et al. 2010 [21] y + - + - - - + + + + 6 + + - + + 12
Woo et al. 2007 [22] y + + + - - + + + + + 8 + + - - - 101 TESTEX awards one point for listing the eligibility criteria and, also in contrast to PEDro, a further point for the between group comparison of at least one secondary outcome. 2 or all subjects received treatmentor control as allocated. However, this aspect differs from TESTEX that specifically required an ITT analysis only.

Nutrients 2021, 13, 4244 6 of 16
Table 3. Exercise characteristics of included studies.
Aut
hor,
Year
[Ref
]
Exer
cise
Stat
us
Stud
yLe
ngth
(Mon
ths)
Prog
ress
ion
ofIn
tens
ity?
Type
ofEx
erci
se,
Met
hods
Sett
ing/
Supe
rvis
ion
Inte
rven
tion
,Ex
erci
seC
ompo
siti
on
Att
enda
nce
Site
Spec
ifici
ty
Allison,2013 [12] Untrained 12 Yes Unilateral “hops”
Unloaded leg: CG IE/NS Seven session/week, five sets of ten multi-directional, unilateralhops with peak GRF of ≈3x body weight; 15 s rest between sets 91% LS: Yes
TH: Yes
Bolam,2016 1 [13] Untrained 9 Yes
DRT (upper body) onmachines and with free
weights;multi-directional
jumps with high GRF
JE/SIE/NS
Four sessions/week: 2 × 60 min/week: jumping (see below) andupper body DRT with four exercises. Two sets of 12 reps at 60% 1RM;two jumping sessions/week with three exercises, two–four sets, 5–18
reps and GRF: 4.6–5.8x body weight; 1 min rest between setsHigh volume jumping group (HV): 80 jumps/sessionLow volume jumping group (LV): 40 jumps/session
HVJ:53% LVJ: 65% LS: YesTH: Yes
Ghayomzadeh,2020 [14] Untrained 6 Yes
DRT (all main musclegroups) on machines
and with free weights;WBE:
treadmillwalking/running
JE/S
Three sessions/week, eight exercises; four–twenty reps at 60–85%1RM (i.e., first session 80–85%; second session 60–80%; third session
50–65% 1RM); each session ≈23 min of walking/running at up to≈70%HRmax
85% LS: YesTH: Yes
Harding,2020 [15] No RT 8
Yes
DRT (deadlift, squat,and overhead press)
and “jumpingchin-ups”
JE/STwo sessions/week; three exercises (deadlift, squat, and overhead
press), five sets of five repetitions with 80–85% 1RM (RPE ≥ 16), fivesets of five repetitions jumping chin-ups with “flat footed landing”
78% LS: YesTH: Yes
YesIsometric-Axial-Comp-
ression (IAC) atmachines
JE/STwo sessions/week, four exercises (chest press, leg press, core pull,
vertical lift; bioDensity device), near-maximal 5-s isometriccontraction (RPE ≥ 16)
79% LS: YesTH: Yes
Helge,2014 [16] Not given 12
Yes Soccer (on naturalgrass) JE/S Two–three sessions/week, four set ×15 min FB at 65–90% HRmax, 2
min rest between sets. 66% LS: YesTH: Yes
YesDRT (all main musclegroups) on machinesand with free weights
JE/S
Two–three sessions/week; five–seven exercises (leg press, legextension, leg curl, pull-down, and lateral raises, lunges, seated row)four sets at 8RM (i.e., eight reps at ≈75% 1RM), explosive concentric
movement
73% LS: YesTH: Yes
Huuskonen,2001 [17] Not given 48 Yes Brisk walking IE/NS Five sessions/week 60 min of brisk walking at 40–60% of VO2max
(aerobic threshold pace) Not given LS: YesTH: Yes

Nutrients 2021, 13, 4244 7 of 16
Table 3. Cont.
Aut
hor,
Year
[Ref
]
Exer
cise
Stat
us
Stud
yLe
ngth
(Mon
ths)
Prog
ress
ion
ofIn
tens
ity?
Type
ofEx
erci
se,
Met
hods
Sett
ing/
Supe
rvis
ion
Inte
rven
tion
,Ex
erci
seC
ompo
siti
on
Att
enda
nce
Site
Spec
ifici
ty
Jones,2020 [11] RT < 2 s/w. 6 Yes
DRT (all main musclegroups) with own body
weight and elastic bands;rope skipping,
multi-directional jumps
IE/mainly
NS
Three sessions/week, 5 min rope skipping, two–three sets of 10–15 reps offive different jumps (e.g., squat, broad, scissor jump); eight–ten RT
exercises, two–three sets of 10–15 repetitions with “moderate-hard effort”(i.e., ≈65–75% 1RM)
62% LS: YesTH: yes
Kemmler,2020 [18] RT ≤ 45 min /w. 18 Yes DRT (all main muscle
groups) on machines JE/S
Two sessions/week, periodized single set RT with periods of high intensity(up to 85% 1RM), high
effort (by RM, supersets, drop sets) and high velocity (explosive concentricmovement)
95% LS: YesTH: Yes
Kukuljan,2011 [19] Untrained 18 Yes
DRT (all main musclegroups) on machines and
with free weights andjumps (IE)
JE/SIE/S
Three sessions/week, periodized RT with up to 85% 1RM and explosivevelocity during the concentric phase (last 6 month), and two–three sets of
different jumps with 20 reps with peak GRF of 1.5–9.7x body weight63% LS: Yes
TH: Yes
Santa Clara,2003 [20] Not given 12
Yes WBE: walking/ runningon treadmill JE/n.g. Three sessions/week 50 min treadmill walking/running at 60–70% HRR 85% LS: Yes
TH: Yes
Yes
DRT (all main musclegroups) on machines and
treadmillwalking/running
JE/n.g.
Three sessions/week 30 min treadmill walking/running at 60–70% HRRand DRT: eight exercises, two sets of eight–twelve reps at 40–50% 1RM; 2 ×
20 reps of abdominal exercises; 2 × 10 repsof back exercises (intensity n.g.)
82% LS: YesTH:Yes
Whiteford,2010 2 [21]
≤2 s/w.≤moderate
intensity12 Yes
DRT (all main musclegroups) on machines and
with free weightsJE/S Three sessions/week, 10 exercises, three sets at 8RM (i.e., eight reps at
≈75% 1RM) 71% LS: YesTH: Yes
Woo,2007 [22] Untrained 12
No Tai Chi (Yang Style) n.g. Three session/week, 24 Forms of Yang Style, intensity n.g. 81% LS: ?TH: yes
No DRT with elastic bands n.g.Three sessions/week, six exercises (arm lifting, hip abduction, heel raise,hip flexion, extension, ankle dorsiflexion), 30 reps with an elastic band of
low–moderate strength; intensity n.g. (presumably low)76% LS: Yes
TH: Yes
DRT: Dynamic Resistance Training; GRF: ground reaction forces; HRmax: maximum heart rate; HRR: heart rate reserve; IE: individual exercise; JE: joint (group) exercise, LS: lumbar spine; NS: non supervised;S: supervised; s/w: session/week; FN: femoral neck; WB:E weight bearing exercise; 1-RM 1-repetition maximum; 1 we only included results from the high volume exercise group in this analysis; 2 active controlgroup (3 × 30 min of walking/week recommended).
Nutrients 2021, 13, 4244 8 of 16
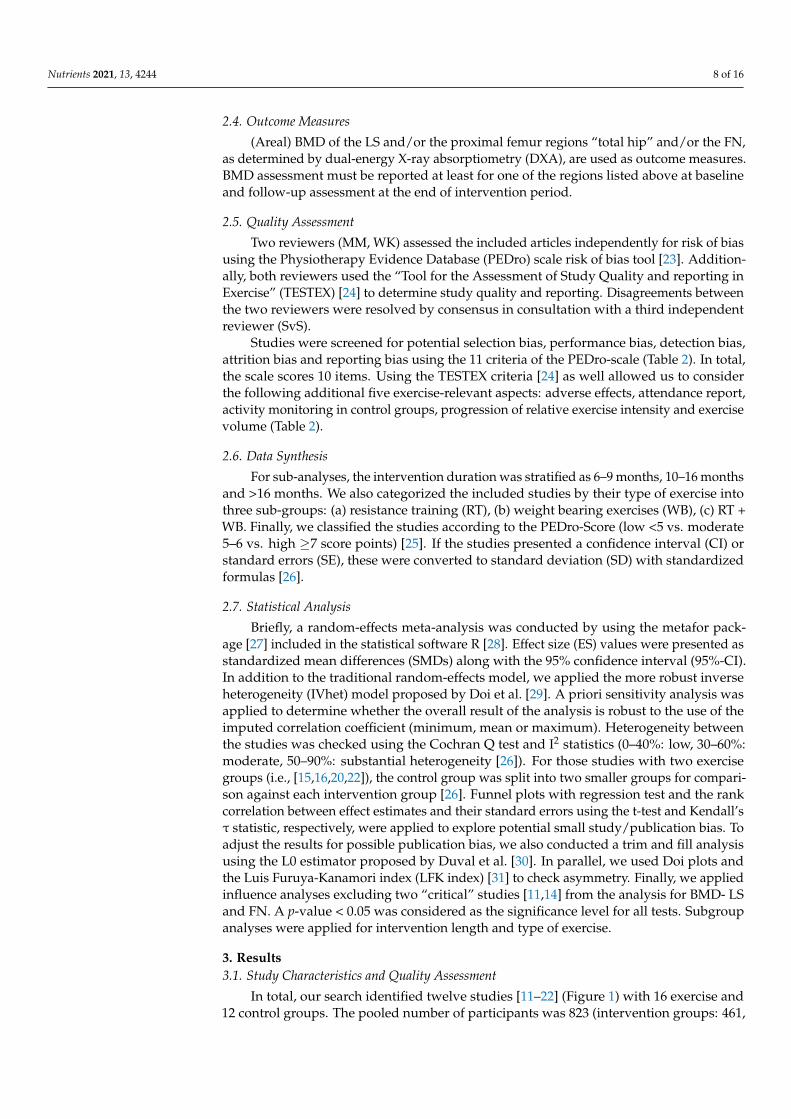
2.4. Outcome Measures
(Areal) BMD of the LS and/or the proximal femur regions “total hip” and/or the FN,as determined by dual-energy X-ray absorptiometry (DXA), are used as outcome measures.BMD assessment must be reported at least for one of the regions listed above at baselineand follow-up assessment at the end of intervention period.
2.5. Quality Assessment
Two reviewers (MM, WK) assessed the included articles independently for risk of biasusing the Physiotherapy Evidence Database (PEDro) scale risk of bias tool [23]. Addition-ally, both reviewers used the “Tool for the Assessment of Study Quality and reporting inExercise” (TESTEX) [24] to determine study quality and reporting. Disagreements betweenthe two reviewers were resolved by consensus in consultation with a third independentreviewer (SvS).
Studies were screened for potential selection bias, performance bias, detection bias,attrition bias and reporting bias using the 11 criteria of the PEDro-scale (Table 2). In total,the scale scores 10 items. Using the TESTEX criteria [24] as well allowed us to considerthe following additional five exercise-relevant aspects: adverse effects, attendance report,activity monitoring in control groups, progression of relative exercise intensity and exercisevolume (Table 2).
2.6. Data Synthesis
For sub-analyses, the intervention duration was stratified as 6–9 months, 10–16 monthsand >16 months. We also categorized the included studies by their type of exercise intothree sub-groups: (a) resistance training (RT), (b) weight bearing exercises (WB), (c) RT +WB. Finally, we classified the studies according to the PEDro-Score (low <5 vs. moderate5–6 vs. high ≥7 score points) [25]. If the studies presented a confidence interval (CI) orstandard errors (SE), these were converted to standard deviation (SD) with standardizedformulas [26].
2.7. Statistical Analysis
Briefly, a random-effects meta-analysis was conducted by using the metafor pack-age [27] included in the statistical software R [28]. Effect size (ES) values were presented asstandardized mean differences (SMDs) along with the 95% confidence interval (95%-CI).In addition to the traditional random-effects model, we applied the more robust inverseheterogeneity (IVhet) model proposed by Doi et al. [29]. A priori sensitivity analysis wasapplied to determine whether the overall result of the analysis is robust to the use of theimputed correlation coefficient (minimum, mean or maximum). Heterogeneity betweenthe studies was checked using the Cochran Q test and I2 statistics (0–40%: low, 30–60%:moderate, 50–90%: substantial heterogeneity [26]). For those studies with two exercisegroups (i.e., [15,16,20,22]), the control group was split into two smaller groups for compari-son against each intervention group [26]. Funnel plots with regression test and the rankcorrelation between effect estimates and their standard errors using the t-test and Kendall’sτ statistic, respectively, were applied to explore potential small study/publication bias. Toadjust the results for possible publication bias, we also conducted a trim and fill analysisusing the L0 estimator proposed by Duval et al. [30]. In parallel, we used Doi plots andthe Luis Furuya-Kanamori index (LFK index) [31] to check asymmetry. Finally, we appliedinfluence analyses excluding two “critical” studies [11,14] from the analysis for BMD- LSand FN. A p-value < 0.05 was considered as the significance level for all tests. Subgroupanalyses were applied for intervention length and type of exercise.
3. Results3.1. Study Characteristics and Quality Assessment
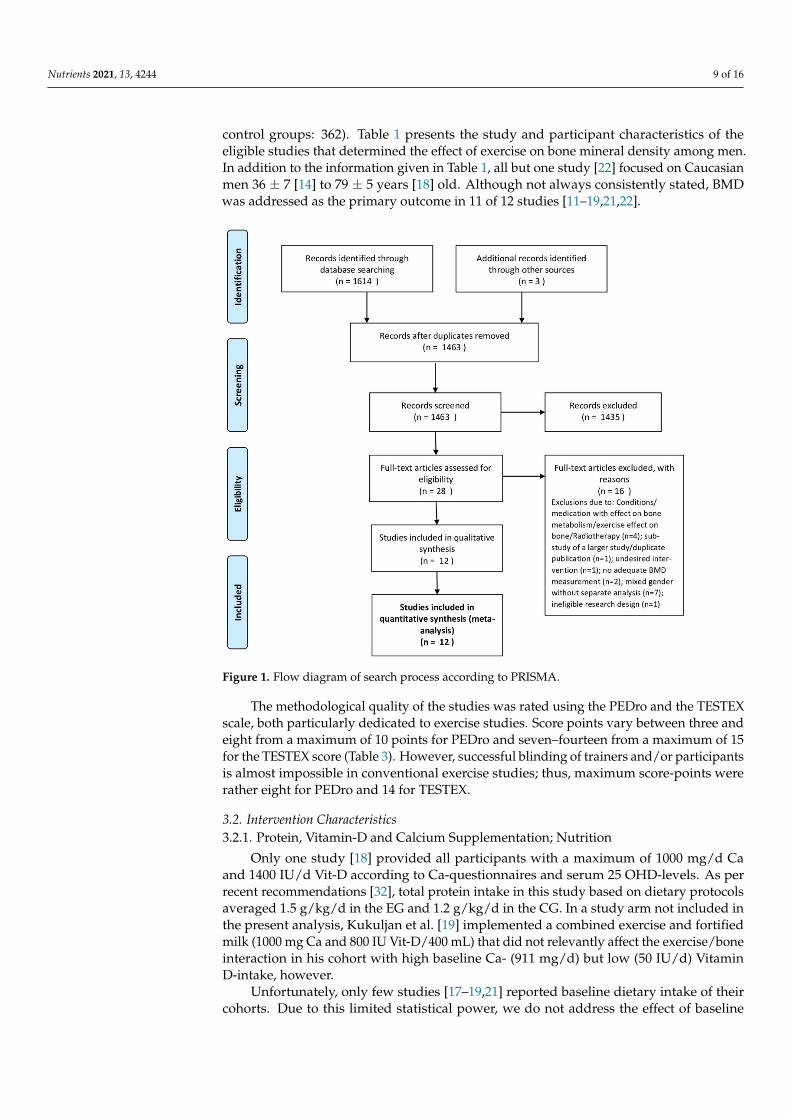
In total, our search identified twelve studies [11–22] (Figure 1) with 16 exercise and12 control groups. The pooled number of participants was 823 (intervention groups: 461,
Nutrients 2021, 13, 4244 9 of 16
control groups: 362). Table 1 presents the study and participant characteristics of theeligible studies that determined the effect of exercise on bone mineral density among men.In addition to the information given in Table 1, all but one study [22] focused on Caucasianmen 36 ± 7 [14] to 79 ± 5 years [18] old. Although not always consistently stated, BMDwas addressed as the primary outcome in 11 of 12 studies [11–19,21,22].
Nutrients 2021, 13, x FOR PEER REVIEW 12 of 20
3. Results 3.1. Study Characteristics and Quality Assessment
In total, our search identified twelve studies [11–22] (Figure 1) with 16 exercise and 12 control groups. The pooled number of participants was 823 (intervention groups: 461, control groups: 362). Table 1 presents the study and participant characteristics of the eli-gible studies that determined the effect of exercise on bone mineral density among men. In addition to the information given in Table 1, all but one study [22] focused on Caucasian men 36 ± 7 [14] to 79 ± 5 years [18] old. Although not always consistently stated, BMD was addressed as the primary outcome in 11 of 12 studies [11–19,21,22].
Figure 1. Flow diagram of search process according to PRISMA.
The methodological quality of the studies was rated using the PEDro and the TESTEX scale, both particularly dedicated to exercise studies. Score points vary between three and eight from a maximum of 10 points for PEDro and seven–fourteen from a maximum of 15 for the TESTEX score (Table 3). However, successful blinding of trainers and/or partici-pants is almost impossible in conventional exercise studies; thus, maximum score-points were rather eight for PEDro and 14 for TESTEX.
3.2. Intervention Characteristics 3.2.1. Protein, Vitamin-D and Calcium Supplementation; Nutrition
Only one study [18] provided all participants with a maximum of 1000 mg/d Ca and 1400 IU/d Vit-D according to Ca-questionnaires and serum 25 OHD-levels. As per recent recommendations [32], total protein intake in this study based on dietary protocols aver-aged 1.5 g/kg/d in the EG and 1.2 g/kg/d in the CG. In a study arm not included in the present analysis, Kukuljan et al. [19] implemented a combined exercise and fortified milk (1000 mg Ca and 800 IU Vit-D/400 mL) that did not relevantly affect the exercise/bone
Figure 1. Flow diagram of search process according to PRISMA.
The methodological quality of the studies was rated using the PEDro and the TESTEXscale, both particularly dedicated to exercise studies. Score points vary between three andeight from a maximum of 10 points for PEDro and seven–fourteen from a maximum of 15for the TESTEX score (Table 3). However, successful blinding of trainers and/or participantsis almost impossible in conventional exercise studies; thus, maximum score-points wererather eight for PEDro and 14 for TESTEX.
3.2. Intervention Characteristics3.2.1. Protein, Vitamin-D and Calcium Supplementation; Nutrition
Only one study [18] provided all participants with a maximum of 1000 mg/d Caand 1400 IU/d Vit-D according to Ca-questionnaires and serum 25 OHD-levels. As perrecent recommendations [32], total protein intake in this study based on dietary protocolsaveraged 1.5 g/kg/d in the EG and 1.2 g/kg/d in the CG. In a study arm not included inthe present analysis, Kukuljan et al. [19] implemented a combined exercise and fortifiedmilk (1000 mg Ca and 800 IU Vit-D/400 mL) that did not relevantly affect the exercise/boneinteraction in his cohort with high baseline Ca- (911 mg/d) but low (50 IU/d) VitaminD-intake, however.
Unfortunately, only few studies [17–19,21] reported baseline dietary intake of theircohorts. Due to this limited statistical power, we do not address the effect of baseline
Nutrients 2021, 13, 4244 10 of 16
dietary intake (e.g., Vit-D, Ca, Protein, energy intake) on the exercise bone/interaction bysub-analyses.
3.2.2. Exercise Characteristics
Table 3 specifies the exercise intervention of the included studies. Most of the RCTscompared a single exercise group with a single inactive control group. The study of Allisonet al. [12] applied unilateral loading (“hopping”) and used the unloaded leg as control.Four other exercise trials implemented two exercise arms with different types of exerciseinterventions [15,16,22]. Another trial incorporated study arms with combined exerciseand/or fortified milk supplementation [19] but was not included in the present analysis. Onlyone study established an active control group. This group was advised to undertake three ×30 min of unsupervised brisk walking/week [21]; however, adherence was not monitored inthis CG. Although not always specified, pre-study exercise status or corresponding inclusioncriteria were reported by most studies [11–15,17–19,21,22]. However, there is some evidencethat men with exercise habits potentially relevant for subsequent intervention effects on BMDoutcomes were included in some studies (e.g., [11,21]).
Net exercise frequency (reported exercise frequency adjusted for attendance) variedfrom ≈1.5 session [15,16] to ≥6 sessions/week [12]; however, most trials (Table 3) averagedbetween 2 and 2.5 sessions/week at least when considering attendance rate.
3.3. Results on BMD at the Lumbar Spine (LS)-ROI
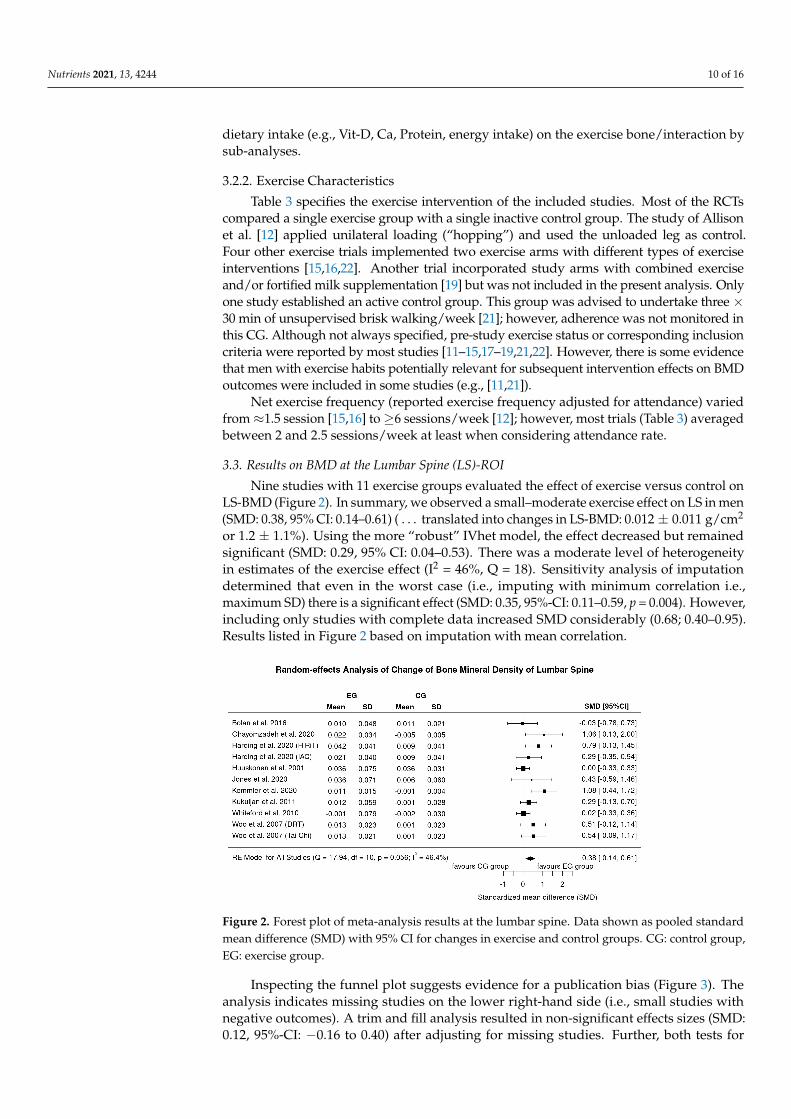
Nine studies with 11 exercise groups evaluated the effect of exercise versus control onLS-BMD (Figure 2). In summary, we observed a small–moderate exercise effect on LS in men(SMD: 0.38, 95% CI: 0.14–0.61) ( . . . translated into changes in LS-BMD: 0.012 ± 0.011 g/cm2
or 1.2 ± 1.1%). Using the more “robust” IVhet model, the effect decreased but remainedsignificant (SMD: 0.29, 95% CI: 0.04–0.53). There was a moderate level of heterogeneityin estimates of the exercise effect (I2 = 46%, Q = 18). Sensitivity analysis of imputationdetermined that even in the worst case (i.e., imputing with minimum correlation i.e.,maximum SD) there is a significant effect (SMD: 0.35, 95%-CI: 0.11–0.59, p = 0.004). However,including only studies with complete data increased SMD considerably (0.68; 0.40–0.95).Results listed in Figure 2 based on imputation with mean correlation.
Nutrients 2021, 13, x FOR PEER REVIEW 13 of 20
interaction in his cohort with high baseline Ca- (911 mg/d) but low (50 IU/d) Vitamin D-intake, however.
Unfortunately, only few studies [17–19,21] reported baseline dietary intake of their cohorts. Due to this limited statistical power, we do not address the effect of baseline die-tary intake (e.g., Vit-D, Ca, Protein, energy intake) on the exercise bone/interaction by sub-analyses.
3.2.2. Exercise Characteristics Table 3 specifies the exercise intervention of the included studies. Most of the RCTs
compared a single exercise group with a single inactive control group. The study of Alli-son et al. [12] applied unilateral loading (“hopping”) and used the unloaded leg as control. Four other exercise trials implemented two exercise arms with different types of exercise interventions [15,16,22]. Another trial incorporated study arms with combined exercise and/or fortified milk supplementation [19] but was not included in the present analysis. Only one study established an active control group. This group was advised to undertake three × 30 min of unsupervised brisk walking/week [21]; however, adherence was not monitored in this CG. Although not always specified, pre-study exercise status or corre-sponding inclusion criteria were reported by most studies [11–15,17–19,21,22]. However, there is some evidence that men with exercise habits potentially relevant for subsequent intervention effects on BMD outcomes were included in some studies (e.g., [11,21]).
Net exercise frequency (reported exercise frequency adjusted for attendance) varied from ≈1.5 session [15,16] to ≥6 sessions/week [12]; however, most trials (Table 3) averaged between 2 and 2.5 sessions/week at least when considering attendance rate.
3.3. Results on BMD at the Lumbar Spine (LS)-ROI Nine studies with 11 exercise groups evaluated the effect of exercise versus control
on LS-BMD (Figure 2). In summary, we observed a small–moderate exercise effect on LS in men (SMD: 0.38, 95% CI: 0.14–0.61) (…translated into changes in LS-BMD: 0.012 ± 0.011 g/cm2 or 1.2 ± 1.1%). Using the more “robust” IVhet model, the effect decreased but re-mained significant (SMD: 0.29, 95% CI: 0.04–0.53). There was a moderate level of hetero-geneity in estimates of the exercise effect (I2 = 46%, Q = 18). Sensitivity analysis of imputa-tion determined that even in the worst case (i.e., imputing with minimum correlation i.e., maximum SD) there is a significant effect (SMD: 0.35, 95%-CI: 0.11–0.59, p = 0.004). How-ever, including only studies with complete data increased SMD considerably (0.68; 0.40–0.95). Results listed in Figure 2 based on imputation with mean correlation.
Figure 2. Forest plot of meta-analysis results at the lumbar spine. Data shown as pooled standardmean difference (SMD) with 95% CI for changes in exercise and control groups. CG: control group,EG: exercise group.
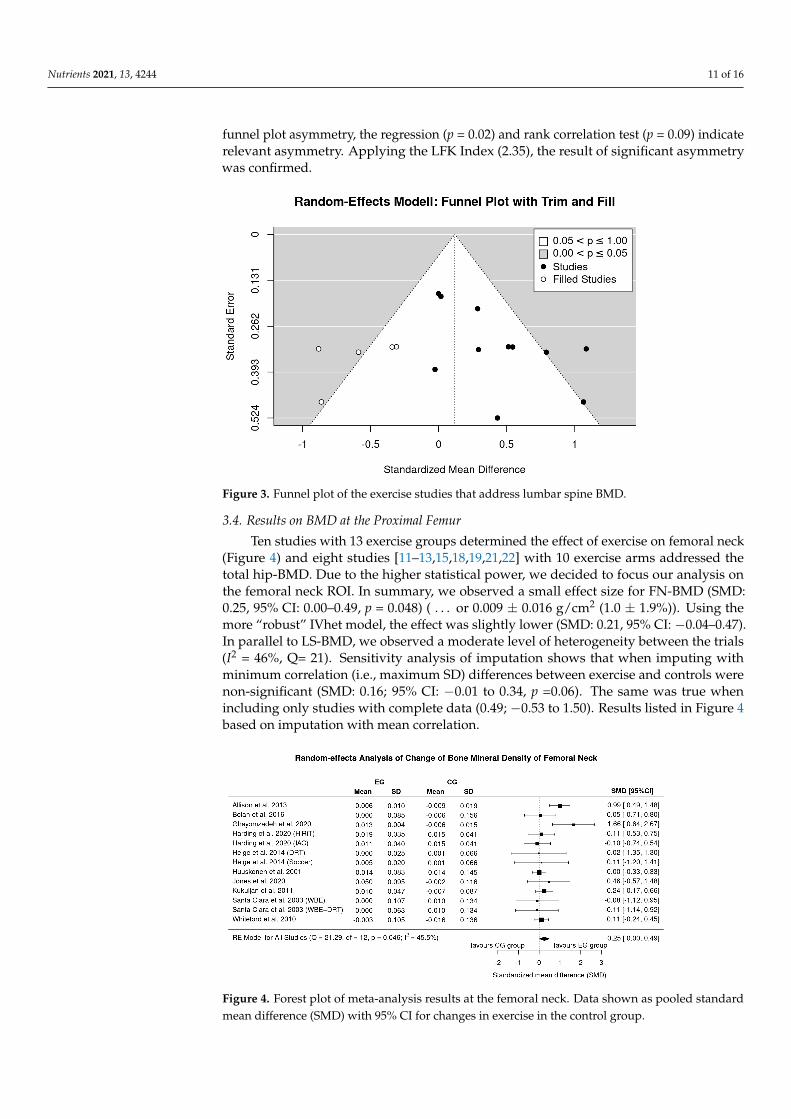
Inspecting the funnel plot suggests evidence for a publication bias (Figure 3). Theanalysis indicates missing studies on the lower right-hand side (i.e., small studies withnegative outcomes). A trim and fill analysis resulted in non-significant effects sizes (SMD:0.12, 95%-CI: −0.16 to 0.40) after adjusting for missing studies. Further, both tests for
Nutrients 2021, 13, 4244 11 of 16
funnel plot asymmetry, the regression (p = 0.02) and rank correlation test (p = 0.09) indicaterelevant asymmetry. Applying the LFK Index (2.35), the result of significant asymmetrywas confirmed.
Nutrients 2021, 13, x FOR PEER REVIEW 14 of 20
Figure 2. Forest plot of meta-analysis results at the lumbar spine. Data shown as pooled standard mean difference (SMD) with 95% CI for changes in exercise and control groups. CG: control group, EG: exercise group
Inspecting the funnel plot suggests evidence for a publication bias (Figure 3). The analysis indicates missing studies on the lower right-hand side (i.e., small studies with negative outcomes). A trim and fill analysis resulted in non-significant effects sizes (SMD: 0.12, 95%-CI: −0.16 to 0.40) after adjusting for missing studies. Further, both tests for fun-nel plot asymmetry, the regression (p = 0.02) and rank correlation test (p = 0.09) indicate relevant asymmetry. Applying the LFK Index (2.35), the result of significant asymmetry was confirmed.
Figure 3. Funnel plot of the exercise studies that address lumbar spine BMD.
3.4. Results on BMD at the Proximal Femur Ten studies with 13 exercise groups determined the effect of exercise on femoral neck
(Figure 4) and eight studies [11–13,15,18,19,21,22] with 10 exercise arms addressed the total hip-BMD. Due to the higher statistical power, we decided to focus our analysis on the femoral neck ROI. In summary, we observed a small effect size for FN-BMD (SMD: 0.25, 95% CI: 0.00–0.49, p = 0.048) (…or 0.009 ± 0.016 g/cm2 (1.0 ± 1.9%)). Using the more “robust” IVhet model, the effect was slightly lower (SMD: 0.21, 95% CI: −0.04–0.47). In parallel to LS-BMD, we observed a moderate level of heterogeneity between the trials (I2 = 46%, Q= 21). Sensitivity analysis of imputation shows that when imputing with mini-mum correlation (i.e., maximum SD) differences between exercise and controls were non-significant (SMD: 0.16; 95% CI: −0.01 to 0.34, p =0.06). The same was true when including only studies with complete data (0.49; −0.53 to 1.50). Results listed in Figure 4 based on imputation with mean correlation.
Figure 3. Funnel plot of the exercise studies that address lumbar spine BMD.
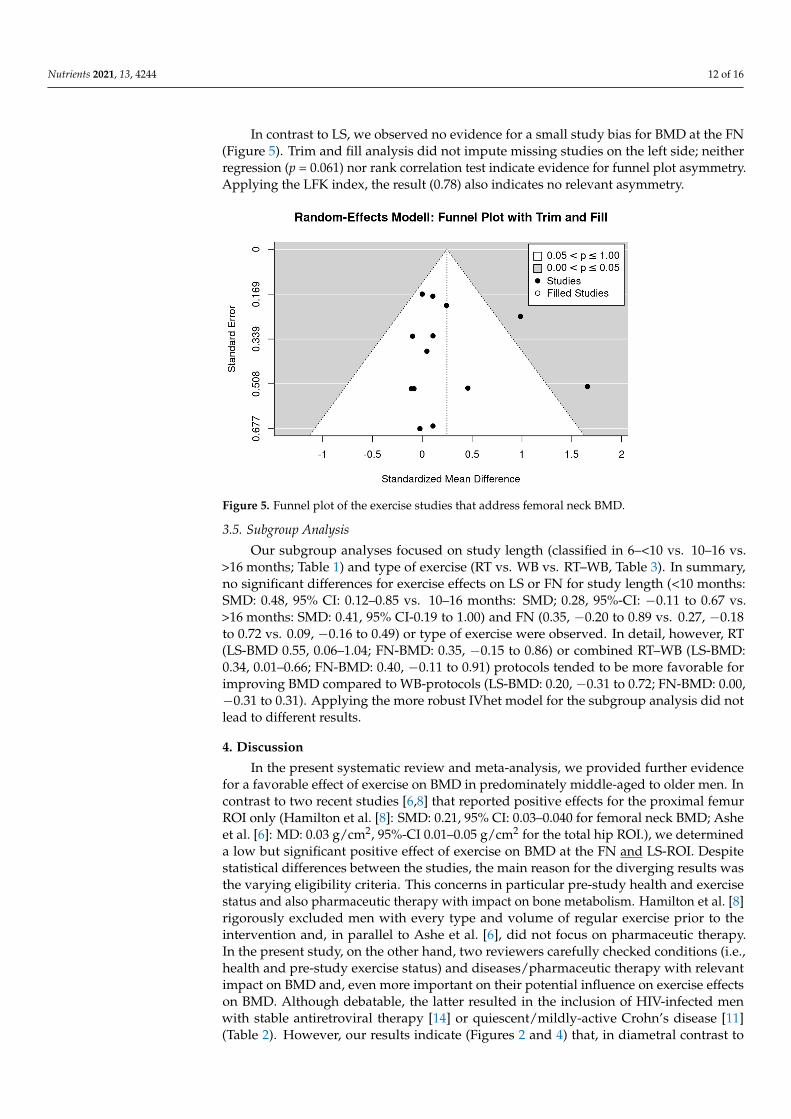
3.4. Results on BMD at the Proximal Femur
Ten studies with 13 exercise groups determined the effect of exercise on femoral neck(Figure 4) and eight studies [11–13,15,18,19,21,22] with 10 exercise arms addressed thetotal hip-BMD. Due to the higher statistical power, we decided to focus our analysis onthe femoral neck ROI. In summary, we observed a small effect size for FN-BMD (SMD:0.25, 95% CI: 0.00–0.49, p = 0.048) ( . . . or 0.009 ± 0.016 g/cm2 (1.0 ± 1.9%)). Using themore “robust” IVhet model, the effect was slightly lower (SMD: 0.21, 95% CI: −0.04–0.47).In parallel to LS-BMD, we observed a moderate level of heterogeneity between the trials(I2 = 46%, Q= 21). Sensitivity analysis of imputation shows that when imputing withminimum correlation (i.e., maximum SD) differences between exercise and controls werenon-significant (SMD: 0.16; 95% CI: −0.01 to 0.34, p =0.06). The same was true whenincluding only studies with complete data (0.49; −0.53 to 1.50). Results listed in Figure 4based on imputation with mean correlation.
Nutrients 2021, 13, x FOR PEER REVIEW 15 of 20
Figure 4. Forest plot of meta-analysis results at the femoral neck. Data shown as pooled standard mean difference (SMD) with 95% CI for changes in exercise in the control group.
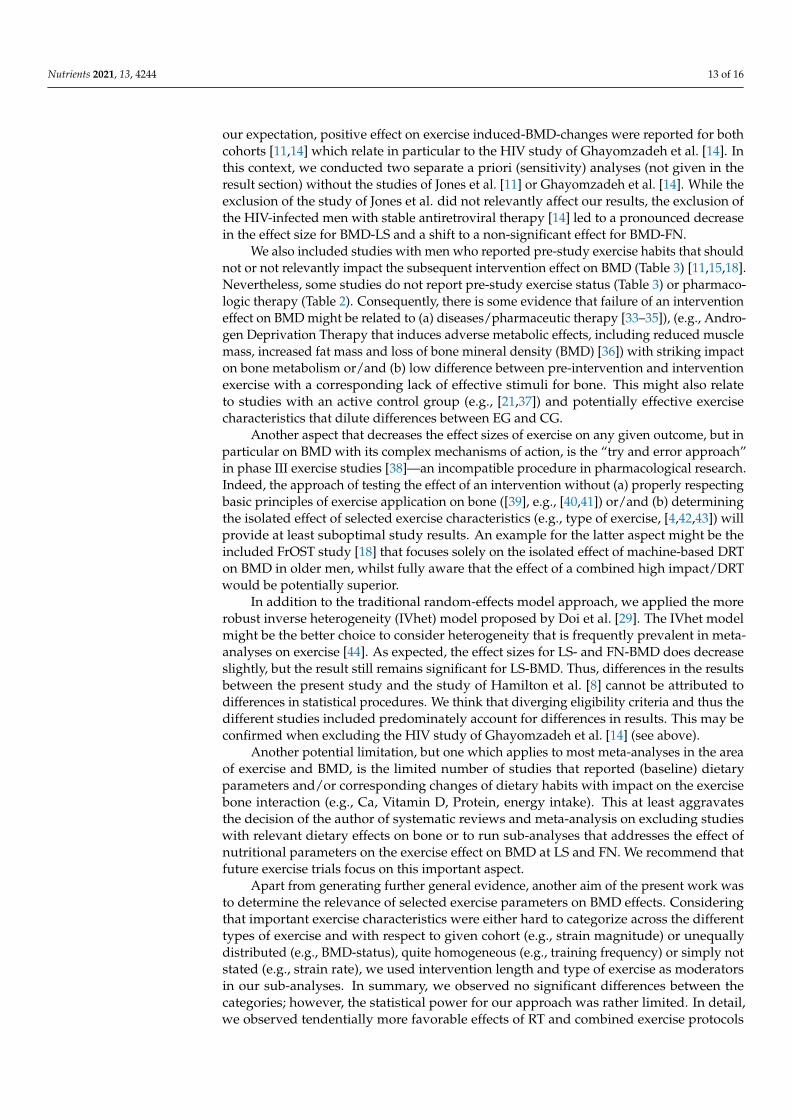
In contrast to LS, we observed no evidence for a small study bias for BMD at the FN (Figure 5). Trim and fill analysis did not impute missing studies on the left side; neither regression (p = 0.061) nor rank correlation test indicate evidence for funnel plot asym-metry. Applying the LFK index, the result (0.78) also indicates no relevant asymmetry.
Figure 5. Funnel plot of the exercise studies that address femoral neck BMD.
3.5. Subgroup Analysis Our subgroup analyses focused on study length (classified in 6– < 10 vs. 10–16 vs. >16
months; Table 1) and type of exercise (RT vs. WB vs. RT–WB, Table 3). In summary, no significant differences for exercise effects on LS or FN for study length (<10 months: SMD: 0.48, 95% CI: 0.12–0.85 vs. 10–16 months: SMD; 0.28, 95%-CI: −0.11 to 0.67 vs. >16 months: SMD: 0.41, 95% CI-0.19 to 1.00) and FN (0.35, −0.20 to 0.89 vs. 0.27, −0.18 to 0.72 vs. 0.09, −0.16 to 0.49) or type of exercise were observed. In detail, however, RT (LS-BMD 0.55, 0.06–1.04; FN-BMD: 0.35, −0.15 to 0.86) or combined RT–WB (LS-BMD: 0.34, 0.01–0.66; FN-BMD: 0.40, −0.11 to 0.91) protocols tended to be more favorable for improving BMD com-
Figure 4. Forest plot of meta-analysis results at the femoral neck. Data shown as pooled standardmean difference (SMD) with 95% CI for changes in exercise in the control group.
Nutrients 2021, 13, 4244 12 of 16
In contrast to LS, we observed no evidence for a small study bias for BMD at the FN(Figure 5). Trim and fill analysis did not impute missing studies on the left side; neitherregression (p = 0.061) nor rank correlation test indicate evidence for funnel plot asymmetry.Applying the LFK index, the result (0.78) also indicates no relevant asymmetry.
Nutrients 2021, 13, x FOR PEER REVIEW 15 of 20
Figure 4. Forest plot of meta-analysis results at the femoral neck. Data shown as pooled standard mean difference (SMD) with 95% CI for changes in exercise in the control group.
In contrast to LS, we observed no evidence for a small study bias for BMD at the FN (Figure 5). Trim and fill analysis did not impute missing studies on the left side; neither regression (p = 0.061) nor rank correlation test indicate evidence for funnel plot asym-metry. Applying the LFK index, the result (0.78) also indicates no relevant asymmetry.
Figure 5. Funnel plot of the exercise studies that address femoral neck BMD.
3.5. Subgroup Analysis Our subgroup analyses focused on study length (classified in 6– < 10 vs. 10–16 vs. >16
months; Table 1) and type of exercise (RT vs. WB vs. RT–WB, Table 3). In summary, no significant differences for exercise effects on LS or FN for study length (<10 months: SMD: 0.48, 95% CI: 0.12–0.85 vs. 10–16 months: SMD; 0.28, 95%-CI: −0.11 to 0.67 vs. >16 months: SMD: 0.41, 95% CI-0.19 to 1.00) and FN (0.35, −0.20 to 0.89 vs. 0.27, −0.18 to 0.72 vs. 0.09, −0.16 to 0.49) or type of exercise were observed. In detail, however, RT (LS-BMD 0.55, 0.06–1.04; FN-BMD: 0.35, −0.15 to 0.86) or combined RT–WB (LS-BMD: 0.34, 0.01–0.66; FN-BMD: 0.40, −0.11 to 0.91) protocols tended to be more favorable for improving BMD com-
Figure 5. Funnel plot of the exercise studies that address femoral neck BMD.
3.5. Subgroup Analysis
Our subgroup analyses focused on study length (classified in 6–<10 vs. 10–16 vs.>16 months; Table 1) and type of exercise (RT vs. WB vs. RT–WB, Table 3). In summary,no significant differences for exercise effects on LS or FN for study length (<10 months:SMD: 0.48, 95% CI: 0.12–0.85 vs. 10–16 months: SMD; 0.28, 95%-CI: −0.11 to 0.67 vs.>16 months: SMD: 0.41, 95% CI-0.19 to 1.00) and FN (0.35, −0.20 to 0.89 vs. 0.27, −0.18to 0.72 vs. 0.09, −0.16 to 0.49) or type of exercise were observed. In detail, however, RT(LS-BMD 0.55, 0.06–1.04; FN-BMD: 0.35, −0.15 to 0.86) or combined RT–WB (LS-BMD:0.34, 0.01–0.66; FN-BMD: 0.40, −0.11 to 0.91) protocols tended to be more favorable forimproving BMD compared to WB-protocols (LS-BMD: 0.20, −0.31 to 0.72; FN-BMD: 0.00,−0.31 to 0.31). Applying the more robust IVhet model for the subgroup analysis did notlead to different results.
4. Discussion
In the present systematic review and meta-analysis, we provided further evidencefor a favorable effect of exercise on BMD in predominately middle-aged to older men. Incontrast to two recent studies [6,8] that reported positive effects for the proximal femurROI only (Hamilton et al. [8]: SMD: 0.21, 95% CI: 0.03–0.040 for femoral neck BMD; Asheet al. [6]: MD: 0.03 g/cm2, 95%-CI 0.01–0.05 g/cm2 for the total hip ROI.), we determineda low but significant positive effect of exercise on BMD at the FN and LS-ROI. Despitestatistical differences between the studies, the main reason for the diverging results wasthe varying eligibility criteria. This concerns in particular pre-study health and exercisestatus and also pharmaceutic therapy with impact on bone metabolism. Hamilton et al. [8]rigorously excluded men with every type and volume of regular exercise prior to theintervention and, in parallel to Ashe et al. [6], did not focus on pharmaceutic therapy.In the present study, on the other hand, two reviewers carefully checked conditions (i.e.,health and pre-study exercise status) and diseases/pharmaceutic therapy with relevantimpact on BMD and, even more important on their potential influence on exercise effectson BMD. Although debatable, the latter resulted in the inclusion of HIV-infected menwith stable antiretroviral therapy [14] or quiescent/mildly-active Crohn’s disease [11](Table 2). However, our results indicate (Figures 2 and 4) that, in diametral contrast to
Nutrients 2021, 13, 4244 13 of 16
our expectation, positive effect on exercise induced-BMD-changes were reported for bothcohorts [11,14] which relate in particular to the HIV study of Ghayomzadeh et al. [14]. Inthis context, we conducted two separate a priori (sensitivity) analyses (not given in theresult section) without the studies of Jones et al. [11] or Ghayomzadeh et al. [14]. While theexclusion of the study of Jones et al. did not relevantly affect our results, the exclusion ofthe HIV-infected men with stable antiretroviral therapy [14] led to a pronounced decreasein the effect size for BMD-LS and a shift to a non-significant effect for BMD-FN.
We also included studies with men who reported pre-study exercise habits that shouldnot or not relevantly impact the subsequent intervention effect on BMD (Table 3) [11,15,18].Nevertheless, some studies do not report pre-study exercise status (Table 3) or pharmaco-logic therapy (Table 2). Consequently, there is some evidence that failure of an interventioneffect on BMD might be related to (a) diseases/pharmaceutic therapy [33–35]), (e.g., Andro-gen Deprivation Therapy that induces adverse metabolic effects, including reduced musclemass, increased fat mass and loss of bone mineral density (BMD) [36]) with striking impacton bone metabolism or/and (b) low difference between pre-intervention and interventionexercise with a corresponding lack of effective stimuli for bone. This might also relateto studies with an active control group (e.g., [21,37]) and potentially effective exercisecharacteristics that dilute differences between EG and CG.
Another aspect that decreases the effect sizes of exercise on any given outcome, but inparticular on BMD with its complex mechanisms of action, is the “try and error approach”in phase III exercise studies [38]—an incompatible procedure in pharmacological research.Indeed, the approach of testing the effect of an intervention without (a) properly respectingbasic principles of exercise application on bone ([39], e.g., [40,41]) or/and (b) determiningthe isolated effect of selected exercise characteristics (e.g., type of exercise, [4,42,43]) willprovide at least suboptimal study results. An example for the latter aspect might be theincluded FrOST study [18] that focuses solely on the isolated effect of machine-based DRTon BMD in older men, whilst fully aware that the effect of a combined high impact/DRTwould be potentially superior.
In addition to the traditional random-effects model approach, we applied the morerobust inverse heterogeneity (IVhet) model proposed by Doi et al. [29]. The IVhet modelmight be the better choice to consider heterogeneity that is frequently prevalent in meta-analyses on exercise [44]. As expected, the effect sizes for LS- and FN-BMD does decreaseslightly, but the result still remains significant for LS-BMD. Thus, differences in the resultsbetween the present study and the study of Hamilton et al. [8] cannot be attributed todifferences in statistical procedures. We think that diverging eligibility criteria and thus thedifferent studies included predominately account for differences in results. This may beconfirmed when excluding the HIV study of Ghayomzadeh et al. [14] (see above).
Another potential limitation, but one which applies to most meta-analyses in the areaof exercise and BMD, is the limited number of studies that reported (baseline) dietaryparameters and/or corresponding changes of dietary habits with impact on the exercisebone interaction (e.g., Ca, Vitamin D, Protein, energy intake). This at least aggravatesthe decision of the author of systematic reviews and meta-analysis on excluding studieswith relevant dietary effects on bone or to run sub-analyses that addresses the effect ofnutritional parameters on the exercise effect on BMD at LS and FN. We recommend thatfuture exercise trials focus on this important aspect.
Apart from generating further general evidence, another aim of the present work wasto determine the relevance of selected exercise parameters on BMD effects. Consideringthat important exercise characteristics were either hard to categorize across the differenttypes of exercise and with respect to given cohort (e.g., strain magnitude) or unequallydistributed (e.g., BMD-status), quite homogeneous (e.g., training frequency) or simply notstated (e.g., strain rate), we used intervention length and type of exercise as moderatorsin our sub-analyses. In summary, we observed no significant differences between thecategories; however, the statistical power for our approach was rather limited. In detail,we observed tendentially more favorable effects of RT and combined exercise protocols
Nutrients 2021, 13, 4244 14 of 16
compared with weight bearing protocols particularly for the FN-ROI. However, threeout of five WB-protocols scheduled low intensity exercise such as brisk walking or TaiChi [17,20,22]. Nevertheless, this result confirmed the results of a recent meta-analysiswith 84 included trials that did not observe relevant differences on BMD at LS and FNafter resistance vs. weight bearing vs. combined exercise protocols in postmenopausalwomen [45]. We thus conclude that the ability of comprehensive meta-analyses to deriveeven raw exercise recommendations is rather limited [46,47], independently of the out-come. The close interaction between exercise parameters (e.g., strain magnitude, rate, cyclenumber, rest periods, training frequency [39,46]) along with the aspect that even slight dif-ferences in exercise composition might significantly modify the exercise effect on BMD [48]underscore the complexity of exercise effects on BMD that obviously collide with simplemeta-analytic/meta regression approaches. A possible solution to nevertheless derive(more) dedicated exercise recommendations might be to focus on trials with comparativestudy arms for a given exercise parameter (e.g., exercise frequency, intensity) but otherwiseidentical exercise and participant characteristics (e.g., [49]).
In summary, we provided further evidence for a low, but significant effect of exerciseon BMD at LS and proximal femur in men. However, we are unable to provide evenrough recommendations for an exercise program dedicated to bone. Due the limitednumber of exercise trials with men, it might be a successful approach to determine genderdifferences in bone adaptation to exercise. This would legitimize the transfer of the muchmore extensively evaluated recommendations of exercise studies in women to men.
Author Contributions: All authors (M.M., M.S., M.K., S.v.S., C.B., M.G., F.J., K.K.-S., B.K., N.K., U.L.,S.M., S.P., D.S., C.C.S., R.T., F.E.T., M.U. and W.K.) conceived and designed this systematic reviewand meta-analysis and drafted and revised the manuscript. Article search, screening, data extractionand rating was performed by M.M., M.S., S.v.S., D.S. and W.K. Formal analysis was conducted byM.K. All authors read the final version of the manuscript. All authors have read and agreed to thepublished version of the manuscript.
Funding: This research received no external funding; however, the project S3-Guideline “körperlichesTraining zur Frakturprophylaxe” was supported by the Elsbeth Bonhoff Foundation.
Institutional Review Board Statement: Not applicable.
Informed Consent Statement: Not applicable.
Data Availability Statement: The data that support the findings of this study are available from thecorresponding author (WK) upon reasonable request.
Acknowledgments: We would like to thank Katherine Jones for providing data for her male co-hort [11]. The present study is part of the German Guideline on Exercise and Fracture Prevention(AWMF No. 183–002) initiated by the Dachverband Osteologie (DVO; Osteology umbrella associa-tion) Austria/Germany/Suisse. The work was performed in (partial) fulfillment of the requirementsfor Michelle Mages obtaining the degree med. dent.
Conflicts of Interest: Michelle Mages, Mahdieh Shojaa, Matthias Kohl, Simon von Stengel, ClemensBecker, Markus Gosch, Franz Jakob, Katharina Kerschan-Schindl, Bernd Kladny, Nicole Klöckner,Uwe Lange, Stefan Middeldorf, Stefan Peters, Daniel Schoene, Cornel Sieber, Reina Tholen, FriederikeThomasius, Michael Uder and Wolfgang Kemmler state that they have no conflicts of interest.
References1. National Steering Group. Best Practice Guidelines to Prevent and Manage Osteoporosis and Fractures; National Council on Aging and
Older People: Dublin, Ireland, 2008.2. RACGP. Osteoporosis Prevention, Diagnosis and Management in Postmenopausal Women and Men over 50 Years of Age; The Royal
Australian College of General Practitioners and Osteoporosis Australia: East Melbourne, Australia, 2017.3. SIGN. Management of Osteoporosis and the Prevention of Fragility Fractures; A National Clinical Guideline; Scottish Intercollegiate
Guidelines Network: Edinburgh, Scotland, 2020.4. Shojaa, M.; Von Stengel, S.; Kohl, M.; Schoene, D.; Kemmler, W. Effects of dynamic resistance exercise on bone mineral density in
postmenopausal women: A systematic review and meta-analysis with special emphasis on exercise parameters. Osteoporos. Int.2020, 31, 1427–1444. [CrossRef] [PubMed]
Nutrients 2021, 13, 4244 15 of 16
5. Shojaa, M.; Von Stengel, S.; Schoene, D.; Kohl, M.; Barone, G.; Bragonzoni, L.; Dallolio, L.; Marini, S.; Murphy, M.H.; Stephenson,A.; et al. Effect of Exercise Training on Bone Mineral Density in Post-menopausal Women: A Systematic Review and Meta-Analysisof Intervention Studies. Front. Physiol. 2020, 11, 652. [CrossRef]
6. Ashe, M.C.; dos Santos, I.K.; Edwards, N.Y.; Burnett, L.A.; Barnes, R.; Fleig, L.; Puyat, J.H.; Sale, J.E.M.; McKay, H.A.; Giangregorio,L.M. Physical Activity and Bone Health in Men: A Systematic Review and Meta-Analysis. J. Bone Metab. 2021, 28, 27–39. [CrossRef][PubMed]
7. Bolam, K.A.; Van Uffelen, J.G.Z.; Taaffe, D.R. The effect of physical exercise on bone density in middle-aged and older men: Asystematic review. Osteoporos. Int. 2013, 24, 2749–2762. [CrossRef] [PubMed]
8. Hamilton, B.R.; Staines, K.A.; Kelley, G.A.; Kelley, K.S.; Kohrt, W.M.; Pitsiladis, Y.; Guppy, F.M. The Effects of Exercise on BoneMineral Density in Men: A Systematic Review and Meta-Analysis of Randomised Controlled Trials. Calcif. Tissue Int. 2021, 109,1–16. [CrossRef]
9. Kemmler, W.; Shojaa, M.; Kohl, M.; Von Stengel, S. Exercise effects on bone mineral density in older men: A systematic reviewwith special emphasis on study interventions. Osteoporos. Int. 2018, 29, 1493–1504. [CrossRef]
10. Moher, D.; Shamseer, L.; Clarke, M.; Ghersi, D.; Liberati, A.; Petticrew, M.; Shekelle, P.; Stewart, L.A. Preferred reporting items forsystematic review and meta-analysis protocols (PRISMA-P) 2015 statement. Syst. Rev. 2015, 4, 1. [CrossRef]
11. Jones, K.; Baker, K.; Speight, R.A.; Thompson, N.P.; Tew, G.A. Randomised clinical trial: Combined impact and resistance trainingin adults with stable Crohn’s disease. Aliment. Pharmacol. Ther. 2020, 52, 964–975. [CrossRef]
12. Allison, S.; Folland, J.P.; Rennie, W.J.; Summers, G.D.; Brooke-Wavell, K. High impact exercise increased femoral neck bonemineral density in older men: A randomised unilateral intervention. Bone 2013, 53, 321–328. [CrossRef]
13. Bolam, K.A.; Skinner, T.; Jenkins, D.; Taaffe, D. The Osteogenic Effect of Impact-Loading and Resistance Exercise on Bone MineralDensity in Middle-Aged and Older Men: A Pilot Study. Gerontology 2015, 62, 22–32. [CrossRef]
14. Ghayomzadeh, M.; Earnest, C.P.; Hackett, D.; Alinaghi, S.S.; Navalta, J.W.; Gholami, M.; Rouzbahani, N.H.; Mohraz, M.; Voltarelli,F.A. Combination of resistance and aerobic exercise for six months improves bone mass and physical function in HIV infectedindividuals: A randomized controlled trial. Scand. J. Med. Sci. Sports 2021, 31, 720–732. [CrossRef]
15. Harding, A.T.; Weeks, B.; Lambert, C.; Watson, S.L.; Weis, L.J.; Beck, B.R. A Comparison of Bone-Targeted Exercise Strategiesto Reduce Fracture Risk in Middle-Aged and Older Men with Osteopenia and Osteoporosis: LIFTMOR-M Semi-RandomizedControlled Trial. J. Bone Miner. Res. 2020, 35, 1404–1414. [CrossRef]
16. Helge, E.W.; Andersen, T.R.; Schmidt, J.F.; Jørgensen, N.R.; Hornstrup, T.; Krustrup, P.; Bangsbo, J. Recreational football improvesbone mineral density and bone turnover marker profile in elderly men. Scand. J. Med. Sci. Sports 2014, 24, 98–104. [CrossRef][PubMed]
17. Huuskonen, J.; Väisänen, S.B.; Kröger, H.; Jurvelin, J.S.; Alhava, E.; Rauramaa, R. Regular Physical Exercise and Bone MineralDensity: A Four-Year Controlled Randomized Trial in Middle-aged Men. The DNASCO Study. Osteoporos. Int. 2001, 12, 349–355.[CrossRef] [PubMed]
18. Kemmler, W.; Kohl, M.; Jakob, F.; Engelke, K.; Von Stengel, S. Effects of High Intensity Dynamic Resistance Exercise and WheyProtein Supplements on Osteosarcopenia in Older Men with Low Bone and Muscle Mass. Final Results of the RandomizedControlled FrOST Study. Nutrients 2020, 12, 2341. [CrossRef] [PubMed]
19. Kukuljan, S.; Nowson, C.; Sanders, K.; Nicholson, G.; Seibel, M.; Salmon, J.; Daly, R.M. Independent and Combined Effects ofCalcium-Vitamin D3 and Exercise on Bone Structure and Strength in Older Men: An 18-Month Factorial Design RandomizedControlled Trial. J. Clin. Endocrinol. Metab. 2011, 96, 955–963. [CrossRef]
20. Santa-Clara, H.; Fernhall, B.; Baptista, F.; Mendes, M.; Sardinha, L.B. Effect of a one-year combined exercise training program onbody composition in men with coronary artery disease. Metababolism 2003, 52, 1413–1417. [CrossRef]
21. Whiteford, J.; Ackland, T.R.; Dhaliwal, S.S.; James, A.P.; Woodhouse, J.J.; Price, R.; Prince, R.L.; Kerr, D.A. Effects of a 1-yearrandomized controlled trial of resistance training on lower limb bone and muscle structure and function in older men. Osteoporos.Int. 2010, 21, 1529–1536. [CrossRef]
22. Woo, J.; Hong, A.; Lau, E.; Lynn, H. A randomised controlled trial of Tai Chi and resistance exercise on bone health, musclestrength and balance in community-living elderly people. Age Ageing 2007, 36, 262–268. [CrossRef]
23. Maher, C.G.; Sherrington, C.; Herbert, R.D.; Moseley, A.M.; Elkins, M. Reliability of the PEDro Scale for Rating Quality ofRandomized Controlled Trials. Phys. Ther. 2003, 83, 713–721. [CrossRef]
24. Smart, N.A.; Waldron, M.; Ismail, H.; Giallauria, F.; Vigorito, C.; Cornelissen, V.; Dieberg, G. Validation of a new tool for theassessment of study quality and reporting in exercise training studies: TESTEX. Int. J. Evid. Based Healthc. 2015, 13, 9–18.[CrossRef] [PubMed]
25. De Avila, V.R.; Bento, T.; Gomes, W.; Leitao, J.; De Sousa, N.F. Functional Outcomes and Quality of Life After Ankle FractureSurgically Treated: A Systematic Review. J. Sport Rehabil. 2018, 27, 274–283. [CrossRef] [PubMed]
26. Higgins, J.P.T.; Altman, D.G.; Gøtzsche, P.C.; Jüni, P.; Moher, D.; Oxman, A.D.; Savovic, J.; Schulz, K.F.; Weeks, L.; Sterne, J.A.C.;et al. The Cochrane Collaboration’s tool for assessing risk of bias in randomised trials. BMJ 2011, 343, d5928. [CrossRef]
27. Viechtbauer, W. Conducting Meta-Analyses in R with the metafor Package. J. Stat. Softw. 2010, 36, 1–48. [CrossRef]28. R Development Core Team. R: A Language and Environment for Statistical Computing; R Foundation for Statistical Computing:
Vienna, Austria, 2020.
Nutrients 2021, 13, 4244 16 of 16
29. Doi, S.A.; Barendregt, J.J.; Khan, S.; Thalib, L.; Williams, G. Advances in the meta-analysis of heterogeneous clinical trials I: Theinverse variance heterogeneity model. Contemp. Clin. Trials 2015, 45, 130–138. [CrossRef]
30. Duval, S.; Tweedie, R. A Nonparametric “Trim and Fill” Method of Accounting for Publication Bias in Meta-Analysis. J. Am. Stat.Assoc. 2000, 95, 89. [CrossRef]
31. Furuya-Kanamori, L.; Barendregt, J.J.; Doi, S.A. A new improved graphical and quantitative method for detecting bias inmeta-analysis. Int. J. Evid. Based Health 2018, 16, 195–203. [CrossRef]
32. Bauer, J.; Biolo, G.; Cederholm, T.; Cesari, M.; Cruz-Jentoft, A.J.; Morley, J.E.; Phillips, S.; Sieber, C.C.; Stehle, P.; Teta, D.; et al.Evidence-Based Recommendations for Optimal Dietary Protein Intake in Older People: A Position Paper From the PROT-AGEStudy Group. J. Am. Med. Dir. Assoc. 2013, 14, 542–559. [CrossRef]
33. Bjerre, E.D.; Brasso, K.; Jørgensen, A.B.; Petersen, T.H.; Eriksen, A.R.; Tolver, A.; Christensen, J.F.; Poulsen, M.H.; Madsen, S.S.;Østergren, P.B.; et al. Football Compared with Usual Care in Men with Prostate Cancer (FC Prostate Community Trial): APragmatic Multicentre Randomized Controlled Trial. Sports Med. 2019, 49, 145–158. [CrossRef] [PubMed]
34. Kim, S.H.; Seong, D.H.; Yoon, S.M.; Choi, Y.D.; Choi, E.; Song, Y.; Song, H. The Effect on Bone Outcomes of Home-based ExerciseIntervention for Prostate Cancer Survivors Receiving Androgen Deprivation Therapy: A Pilot Randomized Controlled Trial.Cancer Nurs. 2018, 41, 379–388. [CrossRef]
35. Uth, J.; Hornstrup, T.; Christensen, J.F.; Christensen, K.B.; Jørgensen, N.R.; Helge, E.W.; Schmidt, J.F.; Brasso, K.; Helge, J.;Jakobsen, M.D.; et al. Football training in men with prostate cancer undergoing androgen deprivation therapy: Activity profileand short-term skeletal and postural balance adaptations. Graefe’s Arch. Clin. Exp. Ophthalmol. 2016, 116, 471–480. [CrossRef][PubMed]
36. Kim, T.J.; Koo, K.C. Pathophysiology of Bone Loss in Patients with Prostate Cancer Receiving Androgen-Deprivation Therapyand Lifestyle Modifications for the Management of Bone Health: A Comprehensive Review. Cancers 2020, 12, 1529. [CrossRef]
37. McCartney, N.; Hicks, A.L.; Martin, J.; Webber, C.E. Long-term Resistance Training in the Elderly: Effects on Dynamic Strength,Exercise Capacity, Muscle, and Bone. J. Gerontol. Ser. A Boil. Sci. Med Sci. 1995, 50, B97–B104. [CrossRef]
38. Kemmler, W. Meta-analysis and exercise related sports medicine [Meta-Analysen im trainingswissenschaftlichen und sportmedi-zinischen Spannungsfeld]. Dt. Ztschr. Sportmedizin. 2013, 64, 96–98.
39. Kemmler, W.; Stengel, V. The Role of Exercise on Fracture Reduction and Bone Strengthening; Avademic Press: London, UK, 2019.40. Gomez-Bruton, A.; Gonzalez-Aguero, A.; Gómez-Cabello, A.; Casajús, J.A.; Vicente-Rodríguez, G. Is Bone Tissue Really Affected
by Swimming? A Systematic Review. PLoS ONE 2013, 8, e70119. [CrossRef]41. Olmedillas, H.; Gonzalez-Aguero, A.; Moreno, L.A.; Casajus, J.A.; Vicente-Rodríguez, G. Cycling and bone health: A systematic
review. BMC Med. 2012, 10, 168. [CrossRef] [PubMed]42. James, M.M.-S.; Carroll, S. Meta-analysis of walking for preservation of bone mineral density in postmenopausal women. Bone
2008, 43, 521–531. [CrossRef]43. James, M.M.-S.; Caroll, S. High intensity resistance training and postmenopausal bone loss: A meta-analysis. Osteoporos Int. 2006,
17, 1225–1240. [CrossRef] [PubMed]44. Furuya-Kanamori, L.; Thalib, L.; Barendregt, J. Meta-analysis in evidence-based healthcare: A paradigm shift away from random
effects is overdue. Int. J. Evid. 2017, 15, 152–160.45. Shojaa, M.; Von Stengel, S.; Schoene, D.; Kohl, M.; Kemmler, W. Effect of different types of exercise on bone mineral density in
postmenopausal women: A systematic review and meta-analysis. Calcif. Tissue Int. 2020, 107, 409–439. [CrossRef]46. Weineck, J. Optimales Training; Spitta: Erlangen, Germany, 2019.47. Gentil, P.; Arruda, A.; Souza, D.; Giessing, J.; Paoli, A.; Fisher, J.; Steele, J. Is There Any Practical Application of Meta-Analytical
Results in Strength Training? Front. Physiol. 2017, 8, 1. [CrossRef] [PubMed]48. Von Stengel, S.; Kemmler, W.; Lauber, D.; Weineck, J.; Kalender, W.A.; Engelke, K. Power Training is more Effective than Strength
Training to Maintain Bone Mineral Density in Postmenopausal Woman. J. Appl. Physiol. 2005, 99, 181–188. [CrossRef] [PubMed]49. Souza, D.; Barbalho, M.; Ramirez-Campillo, R.; Martins, W.; Gentil, P. High and low-load resistance training produce similar
effects on bone mineral density of middle-aged and older people: A systematic review with meta-analysis of randomized clinicaltrials. Exp. Gerontol. 2020, 138, 110973. [CrossRef] [PubMed]