Effects of milk ingestion on prolonged exercise capacity in young, healthy men
Upload
independentCategory
view
4download
0
Exercise Capacity and Mortality in Black and White MenPeter Kokkinos, PhD; Jonathan Myers, PhD; John Peter Kokkinos; Andreas Pittaras, MD;
Puneet Narayan, MD; Athanasios Manolis, MD; Pamela Karasik, MD;Michael Greenberg, MD; Vasilios Papademetriou, MD; Steven Singh, MD
Background—Exercise capacity is inversely related to mortality risk in healthy individuals and those with cardiovasculardiseases. This evidence is based largely on white populations, with little information available for blacks.
Methods and Results—We assessed the association between exercise capacity and mortality in black (n�6749; age,58�11 years) and white (n�8911; age, 60�11 years) male veterans with and without cardiovascular disease whosuccessfully completed a treadmill exercise test at the Veterans Affairs Medical Centers in Washington, DC, and PaloAlto, Calif. Fitness categories were based on peak metabolic equivalents (METs) achieved. Subjects were followed upfor all-cause mortality for 7.5�5.3 years. Among clinical and exercise test variables, exercise capacity was the strongestpredictor of risk for mortality. The adjusted risk was reduced by 13% for every 1-MET increase in exercise capacity(hazard ratio, 0.87; 95% confidence interval, 0.86 to 0.88; P�0.001). Compared with those who achieved �5 METs,the mortality risk was �50% lower for those with an exercise capacity of 7.1 to 10 METs (hazard ratio, 0.51; 95%confidence interval, 0.47 to 0.56; P�0.001) and 70% lower for those achieving �10 METs (hazard ratio, 0.31; 95%confidence interval, 0.26 to 0.36; P�0.001). The findings were similar for those with and without cardiovascular diseaseand for both races.
Conclusions—Exercise capacity is a strong predictor of all-cause mortality in blacks and whites. The relationship wasinverse and graded, with a similar impact on mortality outcomes for both blacks and whites. (Circulation. 2008;117:614-622.)
Key Words: African Americans � epidemiology � exercise tolerance � mortality � exercise test
Evidence from long-term and widely cited epidemiologi-cal studies supports the concept that the fitness status of
an individual is inversely and strongly related to cardiovas-cular and overall mortality in apparently healthy individu-als1–9 and in patients with documented cardiovascular disease(CVD).10 This relationship remains robust even after adjust-ments of potential confounding factors.1–10 In addition, thesehealth benefits are realized at relatively low fitness levels andincrease with higher physical activity patterns or fitness statusin a dose-response fashion.1,2,6,7,9 However, most of thisevidence is based on studies conducted among individuals inthe middle and upper socioeconomic strata1–4,6,9; limitedinformation is available for other populations.10 In particular,information on the association between exercise capacity andmortality for blacks is lacking, and potential racial differencesrelated to this association have not been explored.
Clinical Perspective p 622It is well documented that the age-adjusted all-cause
mortality rates in blacks are as much as 60% higher than thoseof whites.11,12 This has been attributed in part to the fact that
race and income are reported to negatively influence access tomedical care.13 The Veterans Health Administration in the USDepartment of Veterans Affairs Health Care System is uniquein that it ensures equal access to care independently of apatient’s financial status.14 Improved access to care andhigher-quality health have been demonstrated in the VeteransAffairs Health Care System.14 In addition, the VeteransAffairs electronic healthcare database is uniquely suited todetermine mortality and other outcomes accurately and facil-itates risk-adjustment models to study outcomes.15 Thus, thesystem provides a unique opportunity to assess the associa-tion between mortality and exercise capacity in blacks andwhites while minimizing the influence of disparities inmedical care.
In the present study, we assessed the prognostic value ofexercise capacity among black and white patients referred foran exercise test for clinical reasons. We addressed thefollowing questions: Is exercise capacity an independentpredictor of overall mortality for both black and white men?And are there racial differences in how exercise capacityinfluences the risk of mortality?
Received August 17, 2007; accepted November 8, 2007.From the Veterans Affairs Medical Center, Cardiology Department (P. Kokkinos, J.P.K., A.P., P.N., A.M., P. Karasik, M.G., V.P.) and Georgetown
University School of Medicine (P. Kokkinos, S.S.), Washington, DC, and Veterans Affairs Palo Alto Health Care System, Cardiology Division, andStanford University, Stanford, Calif (J.M.).
Correspondence to Peter F. Kokkinos, PhD, Veterans Affairs Medical Center/Cardiology Division, 50 Irving St NW, Washington, DC 20422. [email protected]
© 2008 American Heart Association, Inc.
Circulation is available at http://circ.ahajournals.org DOI: 10.1161/CIRCULATIONAHA.107.734764
614
Exercise Physiology
by guest on September 18, 2016
http://circ.ahajournals.org/D
ownloaded from

Methods
Study Design and PopulationBetween May 1983 and December 30, 2006, a symptom-limitedexercise tolerance test was administered to 15 660 male veterans atthe Veterans Affairs Medical Center, Washington, DC (n�8982),and the Veterans Affairs Palo Alto (Calif) Health Care System(n�6618) either as a routine evaluation or to evaluate for exercise-induced ischemia. The following patients were excluded from thestudy: those with a history of an implanted pacemaker, those whodeveloped left bundle-branch block during the test, and those whowere unstable or required emergent intervention.16 To avoid anoverestimation of the impact of exercise capacity on mortality,individuals with impaired chronotropic response, defined as a ratioof �0.8 between the percent heart rate (HR) reserve to metabolicreserve achieved at peak exercise,17,18 also were excluded from theanalysis.
The 15 660 participants included in the study were either black(n�6749) or white (n�8911) men. All subjects gave written consentbefore the exercise tolerance test. The study was approved by theInternal Review Board at each institution. All demographic, clinical,and medication information was obtained from patients’ computer-ized medical records just before the exercise tolerance test. Eachindividual also was asked to verify the computerized informationwith regard to history of chronic disease, current medications, andcigarette smoking habits. Body weight and height were recordedbefore the test. Body mass index (BMI) was calculated as weight(kg) divided by height squared (m2). Demographic data are includedin Table 1. Individuals with CVD were defined as those with ahistory of myocardial infarction, angiographically documented cor-onary artery disease, coronary angioplasty, coronary bypass surgery,chronic heart failure, and/or peripheral vascular disease.
We recorded death dates from the Veterans Affairs BeneficiaryIdentification and Record Locator System File. This system, used todetermine benefits to survivors of veterans, is complete and accu-rate.19 The Social Security Death Index was used to match allsubjects to their record according to Social Security number. Vitalstatus was determined as of June 30, 2007.
Exercise AssessmentsThe exercise capacity for the individuals at the Veterans AffairsMedical Center (Washington, DC) was assessed by the standardBruce protocol. For the individuals assessed at the Veterans AffairsPalo Alto Health Care System, an individualized ramp protocol wasused as described elsewhere.20 Peak exercise time was recorded inminutes. Peak workload was estimated as metabolic equivalents(METs). One MET is defined as the energy expended at rest, whichis equivalent to an oxygen consumption of 3.5 mL/kg body weightper minute.21 Exercise capacity (in METs) was estimated on thebasis of exercise time via a commonly used equation for the Bruceprotocol22 and based on American College of Sports Medicineequations for the ramp protocol.21 Subjects were encouraged toexercise until volitional fatigue in the absence of symptoms or otherindicators of ischemia.16 The use of handrails during the exercise testwas discouraged. Age-predicted peak exercise HR was determinedwith standardized methods.23 Medications were not changed orstopped before testing.
Supine resting HR and blood pressure (BP) were assessed after 5minutes of rest. Exercise BP was recorded at 2 minutes of eachexercise stage, at peak exercise, and during recovery. Indirectarm-cuff sphygmomanometry was used for all BP assessments.ST-segment depression was measured visually. ST depression�1.0 mm that was horizontal or downsloping was consideredsuggestive of ischemia.
Table 1. Demographic and Clinical Characteristics in Blacks and Whites
Variables Total (n�15 660) Blacks (n�6749) Whites (n�8911) P
Age, y 59�11 58.0�11 60�11 �0.001
BMI, kg/m2 28.2�5.2 28.4�5.3 28.2�5.1 0.06
Resting HR, bpm 73�14 73�14 73�14 0.07
Resting systolic BP, mm Hg 133�21 134�21 132�20 �0.001
Resting diastolic BP, mm Hg 81�12 82�12 80�11 �0.001
CVD, % 33.6 35.6 32.1 �0.001
Previous MI, % 40.3 37.1 46.1 �0.001
Smoking, % 30.5 32.7 28.9 �0.001
Hypertension, % 49.1 54.8 44.7 �0.001
Diabetes mellitus, % 17.5 23.6 12.9 �0.001
Dyslipidemia, % 12.9 17.6 9.4 �0.001
Obesity (BMI �30 kg/m2), % 31.6 32.7 29.6 �0.001
�-Blocker, % 15.6 11.7 18.6 �0.001
CCB, % 20.8 20.2 21.2 0.103
ACE-I, % 13.5 14.8 12.5 �0.001
Diuretics, % 8.8 14.8 4.2 �0.001
Nitrates, % 12.1 7.7 15.3 �0.001
Statins, % 5.1 5.3 5.0 0.323
Exercise data*
Peak HR, bpm 139�27 141�26 137�27 �0.001
Peak systolic BP, mm Hg 180�31 186�32 176�30 �0.001
Peak diastolic BP, mm Hg 87�18 91�16 84�18 �0.001
Peak METs 7.3�2.9 6.9�2.4 7.6�3.2 �0.001
MI indicates myocardial infarction; CCB, calcium channel blocker; and ACE-I, angiotensin-converting enzyme inhibitor.*Adjusted for age and resting systolic and diastolic BPs.
Kokkinos et al Exercise Capacity and Mortality 615
by guest on September 18, 2016
http://circ.ahajournals.org/D
ownloaded from

Determination of Fitness CategoriesFour fitness categories were established on the basis of the METlevel achieved. For practical reasons, the MET cutoffs used to definethe fitness categories were based on the approximate MET level foreach stage of the Bruce protocol. Subjects who achieved �5 METsmade up the low fitness category (Low-Fit; n�3170); those whoachieved 5 to 7 METs were in the moderate fitness category(Moderate-Fit; n�5153); those who achieved 7.1 to 10 METs madeup the high fitness category (High-Fit; n�5075); and those whoachieved �10 METs made up the highest fit category (Very-High-Fit; n�2261).
Statistical AnalysisContinuous variables are presented as mean�SD; categorical vari-ables are expressed as absolute and relative frequencies (percent).Associations between categorical variables were tested with Pear-son’s �2 test. One-way ANOVA was applied to determine age andBMI differences between the 2 races and among fitness categories.Post hoc procedures also were used to discern differences betweenfitness categories. The Bonferroni rule to correct for the inflation inthe type I error was applied with multiple comparisons. Equality ofvariances between treatment groups was tested by the Levene’s test.ANCOVA was used to assess whether exercise variables wereassociated with race.
The relative risk for mortality was calculated for each fitnesscategory. We considered individuals with an exercise capacity of �5METs as Low-Fit; these subjects made up the reference group.Survival analysis was performed with the use of Kaplan-Meiercurves, and Cox proportional-hazard models were used to determinethe variables that were independently and significantly associatedwith mortality. The analyses were adjusted for age in years, BMI,cardiovascular medications (aspirin, angiotensin-converting enzymeinhibitors, �-blockers, calcium channel blockers, vasodilators, andstatins), and risk factors (hypertension, diabetes, dyslipidemia, andsmoking) as categorical variables. Receiver-operating characteristiccurves (ROCs) were constructed to compare the MET levelachieved, age, BMI, and cardiovascular risk factors in terms of theirdiscriminatory accuracy in predicting survival and to determine anoptimal MET level threshold for mortality. Logistic regression(forward stepwise) was applied to determine the relative risk formortality based on this threshold.
Values of P�0.05 using 2-sided tests were considered statisticallysignificant. All statistical analyses were performed with SPSSsoftware (SPSS version 15.0, SPSS Inc, Chicago, Ill).
The authors had full access to and take full responsibility for theintegrity of the data. All authors have read and agree to themanuscript as written.
ResultsThe mean�SD follow-up period was 7.5�5.3 years (range,0.08 to 22.92 years). A total of 3912 deaths occurred, with anaverage annual mortality of 3.3%. Approximately 80% ofsubjects achieved a peak HR that was at least 85% of theage-predicted value. Approximately 35% of those who didnot achieve this level were receiving �-blockers.
Comparisons between fitness categories revealed that agewas significantly lower (P�0.001) for the more fit versus theless fit categories (51�11, 56�10; 62�10, and 66�10 years,respectively). Similar findings were observed for both races.BMI was lower (P�0.001) in the 2 highest fitness categoriescompared with the Moderate-Fit and Low-Fit categories(28.2�5.7 versus 28.7�5.5, 28.3�4.7, and 27�4 kg/m2,respectively). Thus, age and BMI were used as covariateswhen assessing differences in resting and exercise HR, BP,and MET levels among the fitness categories.
Demographic and Clinical CharacteristicsParticipant characteristics and exercise data for the entirecohort and for each race are presented in Table 1. Blacks wereyounger than whites (58�11 versus 60�11 years; P�0.001)and had higher resting systolic and diastolic BPs. They alsowere more likely to smoke; to be obese; and to have CVD,hypertension, diabetes, and dyslipidemia. Accordingly, theywere more likely to be treated with angiotensin-convertingenzyme inhibitors and diuretics. Whites had a higher preva-lence of a previous myocardial infarction and were morelikely to be treated with �-blockers and nitrates. Afteradjustment for age and resting BP, the peak exercise systolicand diastolic BPs and HR were significantly higher in blackscompared with whites, whereas peak MET level was higherin whites.
Racial Differences in MortalityAfter adjustments for racial differences in age, resting BP,smoking habits, myocardial infarction, cardiovascular riskfactors, and cardiac medications (Table 2), mortality was11% higher in blacks than in whites (hazard ratio, 1.11; 95%confidence interval [CI], 1.01 to 1.18; P�0.001). Blacks who
Table 2. Hazard Ratios for Mortality Accordingto Exercise Capacity
VariablesHazardRatio 95% CI P
All (n�15 660)
Peak exercise capacity (for each1-MET increment)
0.82 0.81–0.83 �0.001
Adjusted for age and BMI 0.87 0.86–0.88 �0.001
Adjusted for age, BMI, CV riskfactors,* and CV medications†
0.87 0.86–0.88 �0.001
Adjusted for Age, BMI, CV riskfactors, CV medications, and CVD‡
0.87 0.86–0.88 �0.001
Blacks (n�6749)
Peak exercise capacity (for each1-MET increment)
0.79 0.78–0.81 �0.001
Adjusted for age and BMI 0.85 0.83–0.88 �0.001
Adjusted for age, BMI, CV riskfactors, and CV Medications†
0.85 0.83–0.88 �0.001
Adjusted for age, BMI, CV riskfactors, CV medications, and CVD
0.86 0.83–0.88 �0.001
Whites (n�8911)
Peak exercise capacity (for each1-MET increment)
0.83 0.82–0.84 �0.001
Adjusted for age and BMI 0.87 0.86–0.89 �0.001
Adjusted for age, BMI, CV riskfactors, and CV medications
0.88 0.86–0.89 �0.001
Adjusted for age, BMI, CV riskfactors*, CV medications,† and CVD‡
0.88 0.86–0.89 �0.001
*Cardiovascular (CV) risk factors include hypertension, diabetes mellitus,dyslipidemia, and smoking.
†CV medications include �-blockers, calcium channel blockers, angioten-sin-converting enzymes, diuretics, nitrates, vasodilators, and statins.
‡CVD includes cardiac surgery for coronary artery disease, percutaneoustransluminal coronary angioplasty, myocardial infarction, stroke, heart failure,and peripheral vascular disease.
616 Circulation February 5, 2008
by guest on September 18, 2016
http://circ.ahajournals.org/D
ownloaded from
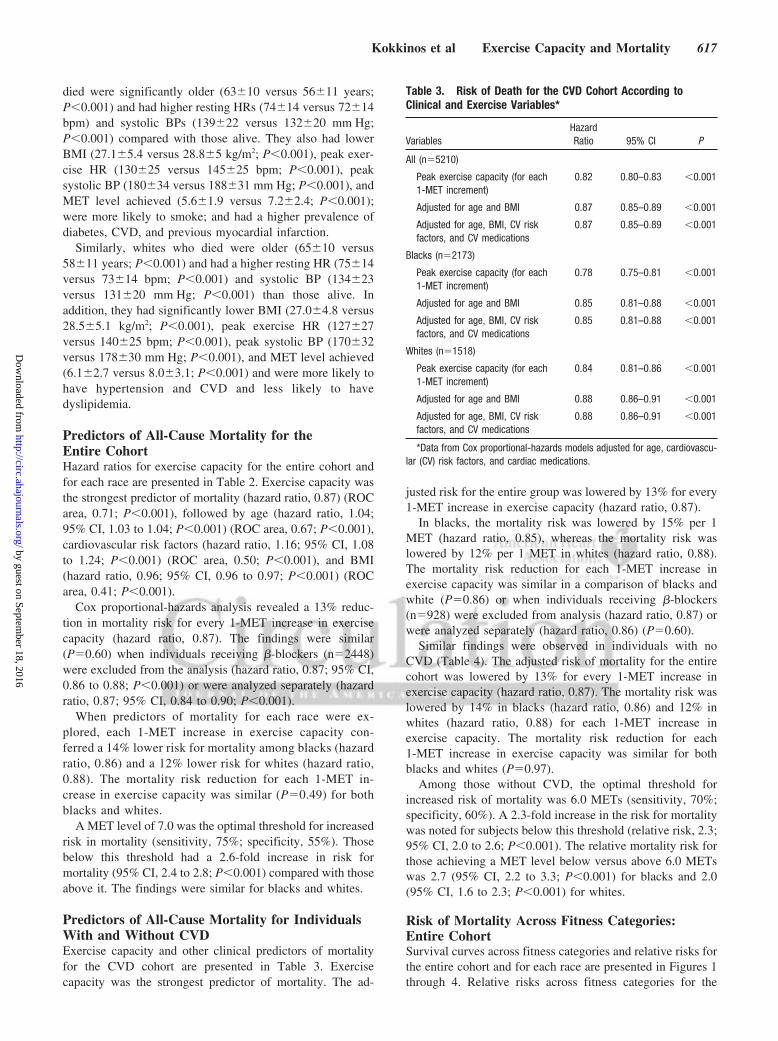
died were significantly older (63�10 versus 56�11 years;P�0.001) and had higher resting HRs (74�14 versus 72�14bpm) and systolic BPs (139�22 versus 132�20 mm Hg;P�0.001) compared with those alive. They also had lowerBMI (27.1�5.4 versus 28.8�5 kg/m2; P�0.001), peak exer-cise HR (130�25 versus 145�25 bpm; P�0.001), peaksystolic BP (180�34 versus 188�31 mm Hg; P�0.001), andMET level achieved (5.6�1.9 versus 7.2�2.4; P�0.001);were more likely to smoke; and had a higher prevalence ofdiabetes, CVD, and previous myocardial infarction.
Similarly, whites who died were older (65�10 versus58�11 years; P�0.001) and had a higher resting HR (75�14versus 73�14 bpm; P�0.001) and systolic BP (134�23versus 131�20 mm Hg; P�0.001) than those alive. Inaddition, they had significantly lower BMI (27.0�4.8 versus28.5�5.1 kg/m2; P�0.001), peak exercise HR (127�27versus 140�25 bpm; P�0.001), peak systolic BP (170�32versus 178�30 mm Hg; P�0.001), and MET level achieved(6.1�2.7 versus 8.0�3.1; P�0.001) and were more likely tohave hypertension and CVD and less likely to havedyslipidemia.
Predictors of All-Cause Mortality for theEntire CohortHazard ratios for exercise capacity for the entire cohort andfor each race are presented in Table 2. Exercise capacity wasthe strongest predictor of mortality (hazard ratio, 0.87) (ROCarea, 0.71; P�0.001), followed by age (hazard ratio, 1.04;95% CI, 1.03 to 1.04; P�0.001) (ROC area, 0.67; P�0.001),cardiovascular risk factors (hazard ratio, 1.16; 95% CI, 1.08to 1.24; P�0.001) (ROC area, 0.50; P�0.001), and BMI(hazard ratio, 0.96; 95% CI, 0.96 to 0.97; P�0.001) (ROCarea, 0.41; P�0.001).
Cox proportional-hazards analysis revealed a 13% reduc-tion in mortality risk for every 1-MET increase in exercisecapacity (hazard ratio, 0.87). The findings were similar(P�0.60) when individuals receiving �-blockers (n�2448)were excluded from the analysis (hazard ratio, 0.87; 95% CI,0.86 to 0.88; P�0.001) or were analyzed separately (hazardratio, 0.87; 95% CI, 0.84 to 0.90; P�0.001).
When predictors of mortality for each race were ex-plored, each 1-MET increase in exercise capacity con-ferred a 14% lower risk for mortality among blacks (hazardratio, 0.86) and a 12% lower risk for whites (hazard ratio,0.88). The mortality risk reduction for each 1-MET in-crease in exercise capacity was similar (P�0.49) for bothblacks and whites.
A MET level of 7.0 was the optimal threshold for increasedrisk in mortality (sensitivity, 75%; specificity, 55%). Thosebelow this threshold had a 2.6-fold increase in risk formortality (95% CI, 2.4 to 2.8; P�0.001) compared with thoseabove it. The findings were similar for blacks and whites.
Predictors of All-Cause Mortality for IndividualsWith and Without CVDExercise capacity and other clinical predictors of mortalityfor the CVD cohort are presented in Table 3. Exercisecapacity was the strongest predictor of mortality. The ad-
justed risk for the entire group was lowered by 13% for every1-MET increase in exercise capacity (hazard ratio, 0.87).
In blacks, the mortality risk was lowered by 15% per 1MET (hazard ratio, 0.85), whereas the mortality risk waslowered by 12% per 1 MET in whites (hazard ratio, 0.88).The mortality risk reduction for each 1-MET increase inexercise capacity was similar in a comparison of blacks andwhite (P�0.86) or when individuals receiving �-blockers(n�928) were excluded from analysis (hazard ratio, 0.87) orwere analyzed separately (hazard ratio, 0.86) (P�0.60).
Similar findings were observed in individuals with noCVD (Table 4). The adjusted risk of mortality for the entirecohort was lowered by 13% for every 1-MET increase inexercise capacity (hazard ratio, 0.87). The mortality risk waslowered by 14% in blacks (hazard ratio, 0.86) and 12% inwhites (hazard ratio, 0.88) for each 1-MET increase inexercise capacity. The mortality risk reduction for each1-MET increase in exercise capacity was similar for bothblacks and whites (P�0.97).
Among those without CVD, the optimal threshold forincreased risk of mortality was 6.0 METs (sensitivity, 70%;specificity, 60%). A 2.3-fold increase in the risk for mortalitywas noted for subjects below this threshold (relative risk, 2.3;95% CI, 2.0 to 2.6; P�0.001). The relative mortality risk forthose achieving a MET level below versus above 6.0 METswas 2.7 (95% CI, 2.2 to 3.3; P�0.001) for blacks and 2.0(95% CI, 1.6 to 2.3; P�0.001) for whites.
Risk of Mortality Across Fitness Categories:Entire CohortSurvival curves across fitness categories and relative risks forthe entire cohort and for each race are presented in Figures 1through 4. Relative risks across fitness categories for the
Table 3. Risk of Death for the CVD Cohort According toClinical and Exercise Variables*
VariablesHazardRatio 95% CI P
All (n�5210)
Peak exercise capacity (for each1-MET increment)
0.82 0.80–0.83 �0.001
Adjusted for age and BMI 0.87 0.85–0.89 �0.001
Adjusted for age, BMI, CV riskfactors, and CV medications
0.87 0.85–0.89 �0.001
Blacks (n�2173)
Peak exercise capacity (for each1-MET increment)
0.78 0.75–0.81 �0.001
Adjusted for age and BMI 0.85 0.81–0.88 �0.001
Adjusted for age, BMI, CV riskfactors, and CV medications
0.85 0.81–0.88 �0.001
Whites (n�1518)
Peak exercise capacity (for each1-MET increment)
0.84 0.81–0.86 �0.001
Adjusted for age and BMI 0.88 0.86–0.91 �0.001
Adjusted for age, BMI, CV riskfactors, and CV medications
0.88 0.86–0.91 �0.001
*Data from Cox proportional-hazards models adjusted for age, cardiovascu-lar (CV) risk factors, and cardiac medications.
Kokkinos et al Exercise Capacity and Mortality 617
by guest on September 18, 2016
http://circ.ahajournals.org/D
ownloaded from

CVD and no CVD cohorts and for each race are presented inFigures 5 and 6.
For the entire cohort, the adjusted relative risks for thosewho achieved peak exercise capacity levels of 5 to 7, 7.1 to10, and �10 METs compared with those in the Low-Fitcategory (�5 METs) are shown in Figure 4. The relative riskof mortality was progressively lower as exercise capacityincreased to 5 to 7 METs (hazard ratio, 0.80; 95% CI, 0.74 to0.86; P�0.001), 7.1 to 10 METs (hazard ratio, 0.51; 95% CI,0.47 to 0.56; P�0.001), and �10 METs (hazard ratio, 0.31;95% CI, 0.26 to 0.36; P�0.001).
For blacks, the relative risk also was progressively lowerfor those achieving 5 to 7 METs (hazard ratio, 0.81; 95% CI,0.73 to 0.90; P�0.001), 7.1 to 10 METs (hazard ratio, 0.50;95% CI, 0.43 to 0.58; P�0.001), and �10 METs (hazardratio, 0.26; 95% CI, 0.18 to 0.37; P�0.001). Among whites,the corresponding relative risks were 0.79 (95% CI, 0.71 to0.87; P�0.001), 0.52 (95% CI, 0.46 to 0.58; P�0.001), and0.34 (95% CI, 0.28 to 0.41; P�0.001).
Risk of Mortality Across Fitness Categories forSubjects With and Without CVDFor individuals with CVD, the adjusted relative risks forthose in each fitness category are shown in Figure 5. For theentire CVD cohort, the relative risk of mortality was progres-sively lower for those achieving 5 to 7 METs (hazard ratio,0.81; 95% CI, 0.73 to 0.90; P�0.001), 7.1 to 10 METs(hazard ratio, 0.50; 95% CI, 0.43 to 0.58; P�0.001), and �10METs (hazard ratio, 0.42; 95% CI, 0.31 to 0.56; P�0.001).
In blacks, the relative risk was similar for individuals whoachieved �5 and 5 to 7 METs (hazard ratio, 0.86; 95% CI,0.73 to 1.0; P�0.07). Significantly higher risk was noted onlyfor individuals achieving 7.1 to 10 METs (hazard ratio, 0.46;95% CI, 0.36 to 0.59; P�0.001) and �10 METs (hazardratio, 0.34; 95% CI, 0.18 to 0.63; P�0.001). For whites, therelative risk was progressively lower for those achieving 5 to7 METs (hazard ratio, 0.78; 95% CI, 0.67 to 0.91; P�0.002),7.1 to 10 METs (hazard ratio, 0.53; 95% CI, 0.44 to 0.65;P�0.001), and �10 METs (hazard ratio, 0.46; 95% CI, 0.33to 0.64; P�0.001). For those with no CVD (Figure 6), thefindings were similar to those of the entire cohort.
DiscussionIn the present study, we assessed the association betweenexercise capacity and all-cause mortality in black and whitemale veterans. Our findings support a strong inverse andgraded reduction in mortality risk with increased exercisecapacity. In accordance with recent reports,10,24–26 we found
Table 4. Risk of Death for Those With No CVD According toClinical and Exercise Variables*
VariablesHazardRatio 95% CI P
All (n�10 450)
Peak exercise capacity (for each1-MET increment)
0.82 0.81–0.83 �0.001
Adjusted for age and BMI 0.87 0.85–0.88 �0.001
Adjusted for age, BMI, CV riskfactors, and CV medications
0.87 0.85–0.88 �0.001
Blacks (n�4217)
Peak exercise capacity (for each1-MET increment)
0.80 0.78–0.83 �0.001
Adjusted for age and BMI 0.86 0.83–0.89 �0.001
Adjusted for age, BMI, CV riskfactors, and CV medications
0.86 0.83–0.89 �0.001
Whites (n�5987)
Peak exercise capacity (for each1-MET increment)
0.83 0.83–0.89 �0.001
Adjusted for age and BMI 0.87 0.85–0.89 �0.001
Adjusted for age, BMI, CV riskfactors, and CV medications
0.88 0.86–0.89 0.007
*Data from Cox proportional-hazards models adjusted for age, cardiovascu-lar (CV) risk factors, and cardiac medications.
Figure 1. Cumulative survival and exer-cise capacity for the entire cohort.
618 Circulation February 5, 2008
by guest on September 18, 2016
http://circ.ahajournals.org/D
ownloaded from

that exercise capacity was a more powerful predictor of riskfor all-cause mortality than established risk factors amongboth blacks and whites after adjustment for cardiac medica-tions and traditional CVD risk factors.
The risk for mortality was 13% lower for every 1-METincrease in exercise capacity for the entire cohort, withsimilar reductions observed for those with and without CVD.The findings did not change significantly when individualstreated with �-blockers were included or excluded in theanalysis. When fitness tertiles were considered, the relativerisk for all-cause mortality for the entire cohort was �20%lower in those with an exercise capacity of 5 to 7 METs(Moderate-Fit category) compared with those achieving �5METs. For those with an exercise capacity �7 METs, themortality risk was �50% to 70% lower compared with thoseachieving �5 METs (Figure 4). This gradient for a reductionin mortality with increasing fitness was similar in blacks and
whites in the entire cohort (Figure 4) and in individuals withand without CVD (Figures 5 and 6).
Low levels of physical activity, as determined by self-reported activity questionnaires, have been associated with anincreased risk of mortality.3–6,9 These observations have beensupported by studies using exercise capacity, a more objec-tive assessment of fitness, to classify the physical status ofapparently healthy men1,2,8,10,27 and women.1,2,8–10,27 Ourfindings support these previous reports.1–10,27 In particular,the 13% reduction in mortality risk for every 1-MET increasein exercise capacity we observed is similar to the 12%reduction reported previously in a veteran cohort10 but some-what lower than the 17% to 20% reduction reported inwomen.25,27
Several aspects about the present study are unique. First,the 15 660 subjects make it the largest to assess the associa-tion between fitness and mortality in a clinically referred
Figure 2. Cumulative survival and exer-cise capacity for blacks.
Figure 3. Cumulative survival and exer-cise capacity for whites.
Kokkinos et al Exercise Capacity and Mortality 619
by guest on September 18, 2016
http://circ.ahajournals.org/D
ownloaded from

cohort. Second, our findings make a unique contribution toexisting knowledge by providing needed information on theassociation between exercise capacity and mortality in arelatively large cohort of blacks and compare them withwhites. Moreover, we had the opportunity to examine theassociation between exercise capacity and mortality in blacksand whites with CVD. In this regard, subtle differences wereobserved among those with CVD and those without CVD.For example, for every 1-MET increase in exercise capacity,the risk for all-cause mortality was 15% lower in blackscompared with 12% in whites. Another finding with poten-tially important clinical implications was the mortality riskdifferences between tertiles in the CVD cohort. Specifically,the relative risk among individuals with CVD and an exercisecapacity between 5 and 7 METs was significantly lower onlyin whites, whereas among blacks, significant reductions wererealized only when exercise capacity exceeded 7 METs(Figure 6). This suggests that blacks with CVD may requirea higher fitness level for the same cardiovascular protection.
Third, most information on the association between phys-ical activity, exercise capacity, and health is derived frompopulations of middle to upper socioeconomic strata.1–4,6,9
Such individuals are likely to have greater access to health-related information and may be in a better position toparticipate in and maintain a healthy lifestyle. Thus, the
association between fitness and mortality may be accentuatedin such individuals. In contrast, most of the individuals in thepresent study were of relatively low socioeconomic strata.The 50% lower mortality risk for those with an exercisecapacity �7 METs versus �5 METs is similar to thatreported by Blair and coworkers1,2 in middle to uppersocioeconomic strata populations. Thus, our findings andthose reported earlier10 in a similar population (patients from2 Veterans Affairs Medical Centers) strengthen the evidencethat higher exercise capacity is associated with lower all-cause mortality regardless of factors related to socioeconomicstrata.
Our finding of a slightly higher overall mortality in blackscompared with whites is in contrast to a recent reportdemonstrating higher mortality rates in white veterans com-pared with blacks and Hispanics.28 The different findings inthe 2 studies may be explained by differences in age andbaseline comorbidities between the races. In the earlierstudy,28 whites were 6.4 years older than blacks, whereas inthe present study, the difference in age was only 2 years. Withregard to baseline comorbidities, the prevalence of CVD inthe present study was significantly higher in blacks than inwhites, whereas the prevalence of all other comorbidities wassimilar.
0.8 0.81 0.79
0.51 0.5 0.52
0.310.26
0.34
0
0.2
0.4
0.6
0.8
1
1.2
Relative Risk
ALL African-American Caucasian
Figure 4. Relative risk of all-cause mortalityamong individuals who achieved an exercisecapacity of 5 to 7, 7.1 to 10, or �10 METsvs those who achieved an exercise capacity�5 METs.
0.810.86
0.78
0.50.46
0.53
0.42
0.34
0.46
0
0.2
0.4
0.6
0.8
1
1.2
Relative Risk
ALL African-American Caucasian
Figure 5. Relative risk of all-cause mortalityamong individuals with CVD who achievedan exercise capacity of 5 to 7, 7.1 to 10, or�10 METs vs those who achieved an exer-cise capacity �5 METs.
620 Circulation February 5, 2008
by guest on September 18, 2016
http://circ.ahajournals.org/D
ownloaded from

Our study has several limitations. The inverse relationshipbetween fitness and mortality does not demonstrate cause.Although similar relationships have been demonstrated forCVD mortality, we had information only on all-cause mor-tality, not cardiovascular interventions. In addition, we didnot have information on the physical activity level of theindividuals in our study; the extent to which exercise capacityreflects the physical activity pattern in our sample is un-known. The onset of chronic diseases, their severity, andduration of therapy were not evaluated in our study becauseof incomplete records. In addition, it is likely that directmeasurements of oxygen uptake would yield more precisefindings. The use of 2 different exercise protocols to assessfitness also is a potential limitation. Our previous worksuggests that the ramp protocol is somewhat more accurate inpredicting measured METs.20 We analyzed the data sepa-rately from both locations and found that for every 1-METincrement, the Bruce protocol yielded an �14% reduction inrisk and the ramp protocol yielded a 13% reduction inmortality. Thus, the differences in protocols did not have asubstantial impact on results. Finally, our findings are basedon men only and cannot be extrapolated to women.
Our findings have a number of clinical applications. Theseresults extend the public health message about the healthbenefits of fitness and physical activity.29–31 Because higherexercise capacity is associated with a lower risk of mortality,physicians and other healthcare professionals should encour-age individuals to initiate and maintain a physically activelifestyle consisting of moderate-intensity activities (briskwalking or similar activities). Such programs are likely toimprove exercise capacity and lower the risk of mortality.Exercise capacity as assessed by an exercise test is astandardized procedure used throughout the world. Thus,inferences can be made for the many patients undergoing thisprocedure, and the prognostic power of exercise capacityapplies equally to blacks and whites. In fact, a salient findingis that mortality risk was 50% lower for both blacks andwhites who achieved an exercise capacity of 7 to 10 METscompared with those who achieved �5 METs regardless ofCVD status (Figures 4 through 6). These findings also expandthe clinical applications of the relationship between fitnessand mortality to patients treated with �-blockers. Collec-tively, these results support the concept that exercise capacity
should be given as much attention by clinicians as othermajor risk factors.
DisclosuresNone.
References1. Blair SN, Kampert JB, Kohl HW, Harold W, Barlow CE, Macera CA,
Paffenbarger RS Jr, Gibbons LW. Influences of cardiorespiratory fitnessand other precursors on cardiovascular disease and all-cause mortality inmen and women. JAMA. 1996;276:205–210.
2. Blair SN, Kohl HW 3rd, Paffenbarger RS Jr, Clark DG, Cooper KH,Gibbons LW. Physical fitness and all-cause mortality. A prospectivestudy of healthy men and women. JAMA. 1989;262:2395–2401.
3. Paffenbarger RS Jr, Hyde RT, Wing AL, Hsieh CC. Physical activity,all-cause mortality, and longevity of college alumni. N Engl J Med.1986;314:605–613.
4. Paffenbarger RS Jr, Hyde RT, Wing AL, Lee IM, Jung DL, Kampert JB.The association of changes in physical-activity level and other lifestylecharacteristics with mortality among men. N Engl J Med. 1993;328:538–545.
5. Ekelund LG, Haskell WL, Johnson JL, Whaley FS, Criqui MH, ShepsDS. Physical fitness as a predictor of cardiovascular mortality in asymp-tomatic North American men: the Lipid Research Clinics MortalityFollow-up Study. N Engl J Med. 1988;319:1379–1384.
6. Manson JE, Greenland P, LaCroix AZ, Stefanick ML, Mouton CP,Oberman A, Perri MG, Sheps DS, Pettinger M, Siscovick DS. Walkingcompared with vigorous exercise for the prevention of cardiovascularevents in women. N Engl J Med. 2002;347:716–725.
7. Lee IM, Hsieh CC, Paffenbarger RS Jr. Exercise intensity and longevityin men: the Harvard Alumni Health Study. JAMA. 1995;273:1179–1184.
8. Sandvik L, Erikssen J, Thaulow E, Erikssen G, Mundal R, Rodahl K.Physical fitness as a predictor of mortality among healthy, middle-agedNorwegian men. N Engl J Med. 1993;328:533–537.
9. Manson JE, Hu FB, Rich-Edwards JW, Colditz GA, Meir JS, Willett WC,Speizer FE, Hennekens CH. A prospective study of walking as comparedwith vigorous exercise in the prevention of coronary heart disease inwomen. N Engl J Med. 1999;341:650–658.
10. Myers J, Prakash M, Froelicher V, Do D, Partington S, Atwood JE.Exercise capacity and mortality among men referred for exercise testing.N Engl J Med. 2002;346:793–801.
11. Marcella S, Miller JE. Racial differences in colorectal cancer mortality:the importance of stage and socioeconomic status. J Clin Epidemiol.2001;54:359–366.
12. Armstrong D, Wing S, Tyroler HA. Race differences in estimates ofsudden coronary heart disease mortality, 1980–1988: the impact of ill-defined death. J Clin Epidemiol. 1996;49:1247–1251.
13. Gornick ME, Eggers PW, Reilly TW, Mentnech RM, Leslye K. FittermanLK, Kucken LE, Vladeck BC. Effects of race and income on mortalityand use of services among Medicare beneficiaries. N Engl J Med. 1996;335:791–799.
0.79 0.79 0.78
0.51 0.52 0.5
0.270.23
0.3
0
0.2
0.4
0.6
0.8
1
1.2
ALL
Relative Risk
African-American Caucasian
Figure 6. Relative risk of all-cause mortalityamong individuals with no CVD who achievedan exercise capacity of 5 to 7, 7.1 to 10, or �10METs vs those who achieved an exercisecapacity �5 METs.
Kokkinos et al Exercise Capacity and Mortality 621
by guest on September 18, 2016
http://circ.ahajournals.org/D
ownloaded from

14. Kizer KW, Demakis JG, Feussner JR. Reinventing VA health care:systematizing quality improvement and quality innovation. Med Care.2000;38(suppl 1):I7–I16.
15. Selim AJ, Berlowitz DR, Fincke G, Rosen AK, Ren XS, Christiansen CL,Cong Z, Lee A, Kazis L. Risk-adjusted mortality rates as a potentialoutcome indicator for outpatient quality assessments. Med Care. 2002;40:237–245.
16. Gibbons RJ, Balady GJ, Bricker JT, Chaitman BR, Fletcher GF, Fro-elicher VF, Mark DB, McCallister BD, Mooss AN, O’Reilly MG,Winters WL Jr, Gibbons RJ, Antman EM, Alpert JS, Faxon DP, Fuster V,Gregoratos G, Hiratzka LF, Jacobs AK, Russell RO, Smith SC Jr, for theAmerican College of Cardiology/American Heart Association Task Forceon Practice Guidelines (Committee to Update the 1997 Exercise TestingGuidelines). ACC/AHA 2002 guideline update for exercise testing:summary article: a report of the American College of Cardiology/American Heart Association Task Force on Practice Guidelines (Com-mittee to Update the 1997 Exercise Testing Guidelines). Circulation.2002;106:1883–1892.
17. Dresing TJ, Blackstone EH, Pashkow FJ, Snader CE, Marwick TH, LauerMS. Usefulness of impaired chronotropic response to exercise as a pre-dictor of mortality, independent of the severity of coronary artery disease.Am J Cardiol. 2000;86:602–609.
18. Wilkoff BL, Miller RE. Exercise testing for chronotropic assessment.Cardiol Clin. 1992;10:705–717.
19. Boyle CA, Decoufle P. National sources of vital status information:extent of coverage and possible selectivity in reporting. Am J Epidemiol.1990;131:160–168.
20. Myers J, Buchanan N, Walsh D, Kraemer M, McAuley P, Hamilton-Wessler M, Froelicher VF. Comparison of the ramp versus standardexercise protocols. J Am Coll Cardiol. 1991;17:1334–1342.
21. American College of Sports Medicine. ACSM’s Guidelines for ExerciseTesting and Prescription. 6th ed. Baltimore, Md: Lippincott Williams &Wilkins; 2000.
22. Foster C, Jackson AS, Pollock ML, Taylor MM, Hare J, Sennett SM, RodJL, Sarwar M, Schmidt DH. Generalized equations for predicting func-tional capacity from treadmill performance. Am Heart J. 1984;107:1229–1234.
23. Morris CK, Myers J, Froelicher VF, Kawaguchi T, Ueshima K, Hideg A.Nomogram based on metabolic equivalents and age for assessing aerobicexercise capacity in men. J Am Coll Cardiol. 1993;22:175–182.
24. Balady GJ, Larson MG, Vasan RS, Leip EP, O’Donnell CJ, Levy D.Usefulness of exercise testing in the prediction of coronary disease riskamong asymptomatic persons as a function of the Framingham risk score.Circulation. 2004;110:1920–1925.
25. Mora S, Redberg RF, Cui Y, Whiteman MK, Flaws JA, Sharrett AR,Blumenthal RS. Ability of exercise testing to predict cardiovascular andall-cause death in asymptomatic women: a 20-year follow-up of the lipidresearch clinics prevalence study. JAMA. 2003;290:1600–1607.
26. Myers J. Beyond ST segment displacement: Newer diagnostic and prog-nostic markers for exercise test. Am J Med Sports. 2003;5:332–336.
27. Gulati M, Pandey DK, Arnsdorf MF, Lauderdale DS, Thisted RA,Wicklund RH, Al-Hani AJ, Black HR. Exercise capacity and the risk ofdeath in women: the St James Women Take Heart Project. Circulation.2003;108:1554–1559.
28. Prakash M, Partington S, Froelicher VF, Heidenreich PA, Myers J. Theeffect of ethnicity on survival in male veterans referred for electrocardi-ography and treadmill testing. Arch Intern Med. 2003;163:2204–2210.
29. Haskell WL, Lee IM, Pate RR, Powell KE, Blair SN, Franklin BA,Macera CA, Heath GW, Thompson PD, Bauman A. Physical activity andpublic health: updated recommendation for adults from the AmericanCollege of Sports Medicine and the American Heart Association. Med SciSports Exerc. 2007;39:1423–1434.
30. Pate RR, Pratt M, Blair SN, Haskell WL, Macera CA, Bouchard C,Buchner D, Ettinger W, Heath G, King A, Kriska A, Leon AS, MarcusBH, Morris J, Paffenbarger RS Jr, Patrick K, Pollock ML, Rippe JM,Sallis J, Wilmore JH. Physical activity and public health: a recommen-dation from the Centers for Disease Control and Prevention and theAmerican College of Sports Medicine. JAMA. 1995;273:402–407.
31. Nelson ME, Rejeski WJ, Blair SN, Duncan PW, Judge JO, King AC,Macera CA, Castaneda-Sceppa C. Physical activity and public health inolder adults: recommendation from the American College of SportsMedicine and the American Heart Association. Med Sci Sports Exerc.2007;39:1435–1445.
CLINICAL PERSPECTIVEThe findings of the present study reinforce the concept that the fitness status of an individual is inversely and stronglyrelated to mortality in individuals with and without cardiovascular disease, regardless of factors related to socioeconomicstrata. The gradient for a reduction in mortality with increasing fitness was similar in blacks and whites. Specifically,mortality was 13% lower for every 1-MET increase in exercise capacity and 50% lower for both blacks and whites whoachieved a moderate exercise capacity (7 to 10 metabolic equivalents [METs]) compared with those who achieved a poorexercise capacity (�5 METs) regardless of cardiovascular disease status. Because exercise capacity as assessed by anexercise test is a standardized procedure used throughout the world, inferences can be made for the many patientsundergoing this procedure. The prognostic power of exercise capacity applies equally to blacks and whites and to thosewith and without cardiovascular disease. It also expands the clinical applications of the relationship between fitness andmortality to patients treated with �-blockers. Collectively, the results of the present and other recent studies support theconcept that exercise capacity should be given as much attention by clinicians as other major risk factors.
622 Circulation February 5, 2008
by guest on September 18, 2016
http://circ.ahajournals.org/D
ownloaded from

SinghAthanasios Manolis, Pamela Karasik, Michael Greenberg, Vasilios Papademetriou and Steven
Peter Kokkinos, Jonathan Myers, John Peter Kokkinos, Andreas Pittaras, Puneet Narayan,Exercise Capacity and Mortality in Black and White Men
Print ISSN: 0009-7322. Online ISSN: 1524-4539 Copyright © 2008 American Heart Association, Inc. All rights reserved.
is published by the American Heart Association, 7272 Greenville Avenue, Dallas, TX 75231Circulation published online January 22, 2008;Circulation.
http://circ.ahajournals.org/content/early/2008/01/22/CIRCULATIONAHA.107.734764.citationWorld Wide Web at:
The online version of this article, along with updated information and services, is located on the
http://circ.ahajournals.org//subscriptions/
is online at: Circulation Information about subscribing to Subscriptions:
http://www.lww.com/reprints Information about reprints can be found online at: Reprints:
document. Permissions and Rights Question and Answer this process is available in the
click Request Permissions in the middle column of the Web page under Services. Further information aboutOffice. Once the online version of the published article for which permission is being requested is located,
can be obtained via RightsLink, a service of the Copyright Clearance Center, not the EditorialCirculationin Requests for permissions to reproduce figures, tables, or portions of articles originally publishedPermissions:
by guest on September 18, 2016
http://circ.ahajournals.org/D
ownloaded from
Copyright © 2022 FDOKUMEN