Exchange and refund of complementary products - eScholarship
13
Exchange and refund of complementary products Yoonju Han 1 & Sandeep R. Chandukala 2 & Hai Che 1 # Springer Science+Business Media New York 2015 Abstract A common dilemma a consumer faces during product return pertains to the decision of exchanging the product or obtaining a refund. This issue becomes even more salient for durable goods, when the initial purchase involves complementary products from different categories. This research examines consumer’ s trade-off deci- sion between returning and keeping complementary products by exploring various retail actions (using umbrella branded products (UBP)) and customer characteristics. We also investigate the trade-off between product exchange and refund when consumer returns a product. We find interesting extensions to past research wherein UBP are returned less and result in greater exchange than refund. Furthermore, an interesting caveat is that higher degree of complementarity between UBP intensifies the impact of various factors on exchange as opposed to refund of products. Implications for retail managers and sales teams are explored. Keywords Product return . Product exchange and refund . Umbrella branding . Nested logit . Multinomial logit The US consumer electronics industry spent $16.7 billion in 2011 to deal with product returns, such as receiving, repairing, restocking, and reselling returned merchandise (Douthit et al. 2011). Manufacturers and retailers found return rates for consumer electronics to be between 11 and 20 (Lawton 2008), and 58 % of retailers were Mark Lett DOI 10.1007/s11002-015-9393-7 We thank the Informs Society of Marketing Science (ISMS) (http://www.informs.org/Community/ISMS) for providing the data. * Sandeep R. Chandukala [email protected] Yoonju Han [email protected] Hai Che [email protected] 1 Kelley School of Business, Indiana University, Bloomington, IN, USA 2 Lee Kong Chian School of Business, Singapore Management University, Singapore, Singapore
-
Upload
khangminh22 -
Category
Documents
-
view
2 -
download
0
Transcript of Exchange and refund of complementary products - eScholarship
Exchange and refund of complementary products
Yoonju Han1& Sandeep R. Chandukala2 & Hai Che1
# Springer Science+Business Media New York 2015
Abstract A common dilemma a consumer faces during product return pertains to thedecision of exchanging the product or obtaining a refund. This issue becomes evenmore salient for durable goods, when the initial purchase involves complementaryproducts from different categories. This research examines consumer’s trade-off deci-sion between returning and keeping complementary products by exploring variousretail actions (using umbrella branded products (UBP)) and customer characteristics.We also investigate the trade-off between product exchange and refund when consumerreturns a product. We find interesting extensions to past research wherein UBP arereturned less and result in greater exchange than refund. Furthermore, an interestingcaveat is that higher degree of complementarity between UBP intensifies the impact ofvarious factors on exchange as opposed to refund of products. Implications for retailmanagers and sales teams are explored.
Keywords Product return . Product exchange and refund . Umbrella branding . Nestedlogit . Multinomial logit
The US consumer electronics industry spent $16.7 billion in 2011 to deal with productreturns, such as receiving, repairing, restocking, and reselling returned merchandise(Douthit et al. 2011). Manufacturers and retailers found return rates for consumerelectronics to be between 11 and 20 (Lawton 2008), and 58 % of retailers were
Mark LettDOI 10.1007/s11002-015-9393-7
We thank the Informs Society of Marketing Science (ISMS) (http://www.informs.org/Community/ISMS) forproviding the data.
* Sandeep R. [email protected]
Yoonju [email protected]
1 Kelley School of Business, Indiana University, Bloomington, IN, USA2 Lee Kong Chian School of Business, Singapore Management University, Singapore, Singapore
experiencing higher return rates than in previous years. These high numbers lead firmsto use product returns as part of their marketing activities. For example, while retailerslike Nordstrom and Zara always provide free product returns, Gap and American EagleOutfitters offered free product returns during their 2012 Black Friday sales promotions.Offering convenient or free returns help firms increase their initial sales by demon-strating their confidence in product quality while lowering consumer’s risk (Moorthyand Srinivasan 1995). However, if the number of product returns increases, firms haveto incur the costs due to reverse logistics (Lee and Chan 2009).
Product return provides firms another opportunity to interact andmaintain the long-termrelationship with their consumers (Reinartz and Kumar 2003). In general, product returncan result in one of two scenarios: consumers can either take their money back (i.e., refund)or exchange it for another product. An exploratory study by Park (2006) found that 53.54%of customers were interested in receiving a refund, while 46.46% of customers opted for anexchange during product return. The implications of refund or exchange, however, for aretailer can be quite different. Product exchange provides the retailer another opportunity tointeract with the customer and recoup their loss; the same may not be true for refund. Yet,the determinants of consumer’s product return decision and the underlying drivers ofconsumer’s choice between exchange and refund have not been investigated in pastresearch. In the durable goods industry, product return decision and the trade-off betweenexchange and refund become even more salient as the costs associated with repairing,restocking, and reselling are usually higher. Additionally, durable good sales commonlyinvolve two or more products (for example, TV–DVD player, washer–dryer), which areoften complementary to each other in functionality and consumption. This further raises theissue of the role of complementary products in return, exchange, and refund decisions.
In this study we focus on three main aspects pertaining to complementary products.First, complementary products in two categories could be from the same manufacturer, andbe part of themanufacturer’s umbrella branding strategy.We explore the role of this strategyon product return, exchange, and refund. Second, in terms of functionality, we demonstratethat the degree of complementarity or interdependence between the products could play asignificant role in consumer’s product exchange vs. refund decisions. Finally, in durableproduct categories, for complementary products, we investigate the differential role of theprimary and the accessory products during product exchange and refund decisions.
This research offers several contributions to the literature: (1) We extend productreturn literature by investigating how consumers make tradeoff decisions betweenproduct exchange and refund; (2) We aim to bridge the gap between two disparatestreams of research, product returns and umbrella branding of complementary products;(3) We extend the literature on complementary products by incorporating the degree ofcomplementarity and the interdependence of the products (primary and accessory) inunderstanding the product return, exchange, and refund decisions. Managerially, weprovide implications on how retailer’s marketing activities (e.g., promotions, extendedservice contracts, and sale of umbrella branded pairs) and customer characteristics(gender, income, and age) affect consumer’s return decision.
Results from our empirical analysis provide rich insights about product return, aswell as exchange and refund. In particular, we find that consumers are less likely toreturn the product if their initial purchase involved umbrella branded complementaryproducts and if they bought an extended service contract. But, price promotion does nothave an impact on the return decision. Also, males, high income and older customers
Mark Lett
are less likely to return products. Furthermore, when exchanging a product, consumersare more likely to pay a higher price, opt for an umbrella branded pair, and exchange theprimary product more than the accessory product. Finally, we find that higher the degreeof complementarity, the more influential the impact of umbrella branding strategy on thechoice decision during product exchange and larger the impact of various factors onexchange and refund of products. Consequently, our research addresses some of the keyissues faced by managers during product return, related to understanding the role theirinitial marketing activities play during product return, exchange, and refund.
1 Theoretical background
Product return has become an integral part of the transaction process. In the past,product return was mainly introduced as a competitive strategy that can help inreducing product quality uncertainty. Increasingly, firms are gravitating toward stricterreturn policies due to either high costs involved in handling the entire process or strictermanufacturer guidelines (Janakiraman and Ordóñez 2011). In light of these develop-ments, a majority of research on product returns has focused on the following:understanding the impact of different product return policies on firm profits(Anderson et al. 2009) and customer buying, return and firm allocation (Petersen andKumar 2009). However, an important and interesting issue faced by retailers duringproduct return, largely ignored in extant research, is understanding the trade-offbetween product exchange and refund, the role of complementary products, andassociated umbrella branding strategy.
The main focus of this research is the purchase, return, exchange, and refund ofcomplementary products. A complementary product is often consumed together withanother product, and its demand would not decrease when the price of the other productdecreases (Mas-Colell et al. 1995). Depending on the marginal rate of substitution (orcomplementarity), a pair of products can be perceived by consumers as perfect orimperfect complements (Eaton et al. 2011). We aim to (1) understand the various retailfactors and customer characteristics that result in the observed consumer’s returnbehavior of complementary products; and (2) investigate the impact of umbrellabranding of complementary products on consumer’s return followed by exchangeand refund decisions.
2 Returning or keeping the product
In the case of high-ticketed durable goods, there could be a lot of actions that a retailermight take to convince the customer and finalize the initial sale. What roles do theactions taken by the retailer, during initial sale of the product, play when consumersmake the product return decision? Specifically, we investigate the roles of product(umbrella branding strategy), retail (promotions), and customer characteristics (age,income, and gender) on product return decision.
Umbrella branding refers to the same brand name being used for multiple productsthat results in the transfer of brand quality perceptions between the products (Erdem1998). The initial purchase usage experience and advertising for one category of
Mark Lett
umbrella branded products have a positive influence on the utility of the umbrella brandin the other product category (Erdem and Sun 2002). It is however unclear what rolesumbrella branded products play in the product return scenario.
Retailers frequently provide promotions during initial purchase of products. Incomeeffect from promotions result in purchase of more expensive brands indicating that,ceteris paribus, consumers are less likely to return a product since they boughtsomething more expensive for a lower price. However, perceived value hypothesissuggests that customers are less likely to return the product on sale (Petersen andKumar 2009). We, therefore, investigate the impact of initial purchase involvingpromotions on the likelihood of product returns.
3 Exchange or refund
Product exchange has various implications and provides the retailer another opportu-nity to interact with the customer. This interaction could result in the customer optingfor the same product or buying a different higher or lower valued product. Furthermore,research has demonstrated product returns to be positively related to customer’s futurevalue to the firm (Reinartz and Kumar 2003). Therefore, the exchange scenariobecomes critical to retailers because it provides opportunity for maximum interactionwith the customer during product return. Hence, we empirically examine variousfactors that affect consumer’s repurchase decision during product exchange.Specifically, we investigate consumer’s intention of maintaining an umbrella brandedpair, exchanging primary compared to accessory products and the exchange pricecompared to the initial purchase.
The uncertainty of the exchange decision outcome could be due to two sources: theproblem with the product itself and the level of compatibility or the degree of brandmatching (Rahinel and Redden 2013) between the product to be exchanged and thecomplementary item. Consumers may believe that the same branded products weredesigned and produced to work with each other so the functional or abstract fit betweenthem would be high. This could be a direct result of synergistic effect of the products(Shine et al. 2007) or the endowment effect (Wood 2001) of the brand that they alreadyown. Furthermore, for complementary products, the role of each product should havean influence in the product exchange process. Whether the returned product is theprimary or the accessory product could affect the utility of brand choice decision duringproduct exchange. We identify the primary product to be of higher price and of moreimportant functionality in a complementary product pair and investigate if consumersare more likely to exchange primary as opposed to accessory products and the role ofUBP in this decision.
Additionally, a pair of complementary products in durable goods can exhibitdifferent levels of dependence or degree of complementarity between the primaryand the accessory product. For example, personal computer and monitor are highlydependent on each other (or have high degree of complementarity), where oneproduct cannot function to its full capacity without the other. While for productslike TVand DVD player, TV can function and has other avenues for use without theDVD player, but the DVD player requires a TV. Research has demonstrated thatincreasing the degree of complementarity increases price competition and
Mark Lett
sometimes leads to smaller profits (Sinitsyn 2015). We believe that given moreintense price competition between products (even UBP products) with highercomplementarity, we might observe less upsell (i.e., exchange to a higher pricedproduct than the returned product) for exchanged products. The intense pricecompetition could result in the manufacturer providing alternate options that arenot significantly higher in price. Manufacturers of durable product pairs with highercomplementarity might have lower product margin for each product in the pair, butcould still gain from consumer’s exchange of a product to a different product fromthe same manufacturer (without a significant increase in price due to intense pricecompetition). We investigate if the degree of interdependence between various pairsof durable goods plays a role in the product exchange and refund decisions.
Finally, price plays an important role in product purchase and exchange. Simonson(1991) finds that if a lower priced product fails, consumers feel regret and blame self;while if a higher priced product fails, consumers tend to blame the manufacturer. Thus,depending on the price of the product, consumers’ source of blame shifts from self tothe retailer or manufacturer. Furthermore, research on complementary categories(Sinitsyn 2012) demonstrates that switchers are willing to pay a price premium forcomplementary products as they infer better match between the products due to thesame brand name. Hence, we investigate the role of price in the exchange and refunddecisions.
4 Empirical analysis
4.1 Data description
The ISMS durable goods dataset is used for empirical analysis. It includes thetransaction history of 19,936 households from 1176 stores of a single major USelectronics chain from December 1998 to November 2004 (Ni et al. 2012). Anadvantage of this dataset is it comes from one single retailer and the returnpolicy inferred from the data is 30 days. We focus on complementary productsbecause the retailers for durable goods observe higher purchase and return ofthese products. For example, we find that complementary products are returnedalmost three times more than single products. We chose two types of comple-mentary products based on the interdependency of the products in the pair. Thefirst pair has a lower degree of complementarity than the second and consistsof a TV and VCR player (pair 1 hereafter). The second pair consists of apersonal computer and monitor (pair 2 hereafter). Additionally, the reason forchoosing these two pairs is due to a large number of transactions for these twopairs (97 % of the transactions in the complementary products involve thesetwo pairs) and also the varying levels of interdependency (which we test).While a TV can be used without a VCR player, a personal computer cannotbe fully utilized without the visual output from a monitor.
We combine the brand information into four different brands (the largestthree brands for each pair and all other brands combined as the fourth brand).Refund is coded as the outside good option. Table 1 provides the summarystatistics for the transactions related to each pair. The last row of Table 1
Mark Lett
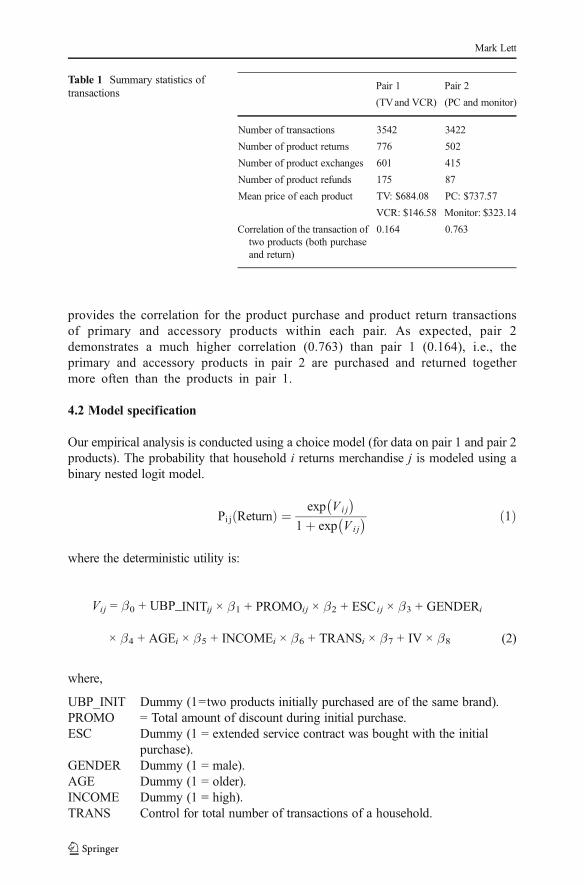
provides the correlation for the product purchase and product return transactionsof primary and accessory products within each pair. As expected, pair 2demonstrates a much higher correlation (0.763) than pair 1 (0.164), i.e., theprimary and accessory products in pair 2 are purchased and returned togethermore often than the products in pair 1.
4.2 Model specification
Our empirical analysis is conducted using a choice model (for data on pair 1 and pair 2products). The probability that household i returns merchandise j is modeled using abinary nested logit model.
Pi j Returnð Þ ¼ exp V i j
� �1þ exp V i j
� � ð1Þ
where the deterministic utility is:
Vij = β0 + UBP_INITij × β1 + PROMOij × β2 + ESC ij × β3 + GENDERi
× β4 + AGEi × β5 + INCOMEi × β6 + TRANSi × β7 + IV × β8 (2)
where,
UBP_INIT Dummy (1=two products initially purchased are of the same brand).PROMO = Total amount of discount during initial purchase.ESC Dummy (1 = extended service contract was bought with the initial
purchase).GENDER Dummy (1 = male).AGE Dummy (1 = older).INCOME Dummy (1 = high).TRANS Control for total number of transactions of a household.
Table 1 Summary statistics oftransactions
Pair 1 Pair 2
(TVand VCR) (PC and monitor)
Number of transactions 3542 3422
Number of product returns 776 502
Number of product exchanges 601 415
Number of product refunds 175 87
Mean price of each product TV: $684.08 PC: $737.57
VCR: $146.58 Monitor: $323.14
Correlation of the transaction oftwo products (both purchaseand return)
0.164 0.763
Mark Lett
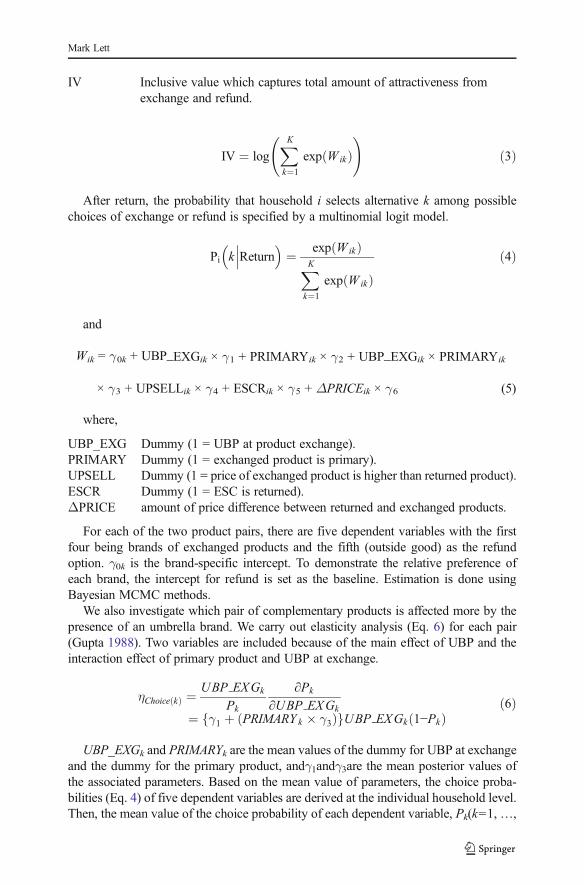
IV Inclusive value which captures total amount of attractiveness fromexchange and refund.
IV ¼ logXKk¼1
exp Wikð Þ !
ð3Þ
After return, the probability that household i selects alternative k among possiblechoices of exchange or refund is specified by a multinomial logit model.
Pi k���Return� �
¼ exp Wikð ÞXKk¼1
exp Wikð Þð4Þ
and
Wik = γ0k + UBP_EXGik × γ1 + PRIMARYik × γ2 + UBP_EXGik × PRIMARYik
× γ3 + UPSELLik × γ4 + ESCRik × γ5 + ΔPRICEik × γ6 (5)
where,
UBP_EXG Dummy (1 = UBP at product exchange).PRIMARY Dummy (1 = exchanged product is primary).UPSELL Dummy (1 = price of exchanged product is higher than returned product).ESCR Dummy (1 = ESC is returned).ΔPRICE amount of price difference between returned and exchanged products.
For each of the two product pairs, there are five dependent variables with the firstfour being brands of exchanged products and the fifth (outside good) as the refundoption. γ0k is the brand-specific intercept. To demonstrate the relative preference ofeach brand, the intercept for refund is set as the baseline. Estimation is done usingBayesian MCMC methods.
We also investigate which pair of complementary products is affected more by thepresence of an umbrella brand. We carry out elasticity analysis (Eq. 6) for each pair(Gupta 1988). Two variables are included because of the main effect of UBP and theinteraction effect of primary product and UBP at exchange.
ηChoice kð Þ ¼UBP EXGk
Pk
∂Pk
∂UBP EXGk¼ γ1 þ PRIMARYk � γ3ð Þf gUBP EXGk 1−Pkð Þð6Þ
UBP_EXGk and PRIMARYk are the mean values of the dummy for UBP at exchangeand the dummy for the primary product, andγ1andγ3are the mean posterior values ofthe associated parameters. Based on the mean value of parameters, the choice proba-bilities (Eq. 4) of five dependent variables are derived at the individual household level.Then, the mean value of the choice probability of each dependent variable, Pk(k=1,…,
Mark Lett
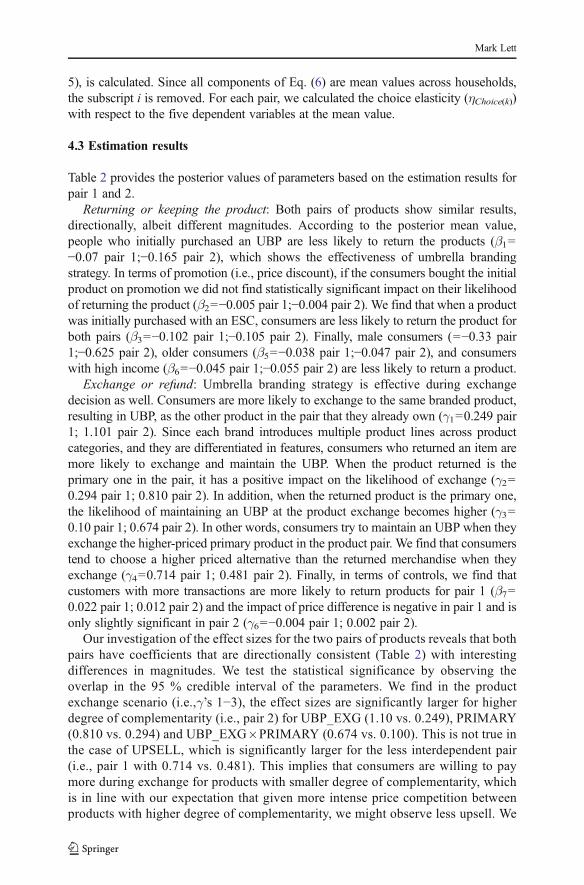
5), is calculated. Since all components of Eq. (6) are mean values across households,the subscript i is removed. For each pair, we calculated the choice elasticity (ηChoice(k))with respect to the five dependent variables at the mean value.
4.3 Estimation results
Table 2 provides the posterior values of parameters based on the estimation results forpair 1 and 2.
Returning or keeping the product: Both pairs of products show similar results,directionally, albeit different magnitudes. According to the posterior mean value,people who initially purchased an UBP are less likely to return the products (β1=−0.07 pair 1;−0.165 pair 2), which shows the effectiveness of umbrella brandingstrategy. In terms of promotion (i.e., price discount), if the consumers bought the initialproduct on promotion we did not find statistically significant impact on their likelihoodof returning the product (β2=−0.005 pair 1;−0.004 pair 2). We find that when a productwas initially purchased with an ESC, consumers are less likely to return the product forboth pairs (β3=−0.102 pair 1;−0.105 pair 2). Finally, male consumers (=−0.33 pair1;−0.625 pair 2), older consumers (β5=−0.038 pair 1;−0.047 pair 2), and consumerswith high income (β6=−0.045 pair 1;−0.055 pair 2) are less likely to return a product.
Exchange or refund: Umbrella branding strategy is effective during exchangedecision as well. Consumers are more likely to exchange to the same branded product,resulting in UBP, as the other product in the pair that they already own (γ1=0.249 pair1; 1.101 pair 2). Since each brand introduces multiple product lines across productcategories, and they are differentiated in features, consumers who returned an item aremore likely to exchange and maintain the UBP. When the product returned is theprimary one in the pair, it has a positive impact on the likelihood of exchange (γ2=0.294 pair 1; 0.810 pair 2). In addition, when the returned product is the primary one,the likelihood of maintaining an UBP at the product exchange becomes higher (γ3=0.10 pair 1; 0.674 pair 2). In other words, consumers try to maintain an UBP when theyexchange the higher-priced primary product in the product pair. We find that consumerstend to choose a higher priced alternative than the returned merchandise when theyexchange (γ4=0.714 pair 1; 0.481 pair 2). Finally, in terms of controls, we find thatcustomers with more transactions are more likely to return products for pair 1 (β7=0.022 pair 1; 0.012 pair 2) and the impact of price difference is negative in pair 1 and isonly slightly significant in pair 2 (γ6=−0.004 pair 1; 0.002 pair 2).
Our investigation of the effect sizes for the two pairs of products reveals that bothpairs have coefficients that are directionally consistent (Table 2) with interestingdifferences in magnitudes. We test the statistical significance by observing theoverlap in the 95 % credible interval of the parameters. We find in the productexchange scenario (i.e.,γ’s 1−3), the effect sizes are significantly larger for higherdegree of complementarity (i.e., pair 2) for UBP_EXG (1.10 vs. 0.249), PRIMARY(0.810 vs. 0.294) and UBP_EXG�PRIMARY (0.674 vs. 0.100). This is not true inthe case of UPSELL, which is significantly larger for the less interdependent pair(i.e., pair 1 with 0.714 vs. 0.481). This implies that consumers are willing to paymore during exchange for products with smaller degree of complementarity, whichis in line with our expectation that given more intense price competition betweenproducts with higher degree of complementarity, we might observe less upsell. We
Mark Lett
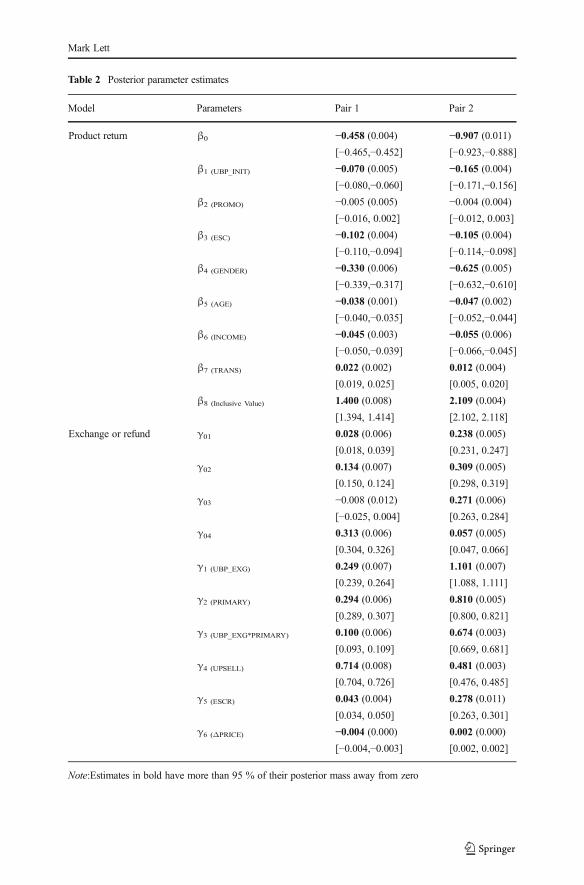
Table 2 Posterior parameter estimates
Model Parameters Pair 1 Pair 2
Product return β0 −0.458 (0.004) −0.907 (0.011)
[−0.465,−0.452] [−0.923,−0.888]β1 (UBP_INIT) −0.070 (0.005) −0.165 (0.004)
[−0.080,−0.060] [−0.171,−0.156]β2 (PROMO) −0.005 (0.005) −0.004 (0.004)
[−0.016, 0.002] [−0.012, 0.003]β3 (ESC) −0.102 (0.004) −0.105 (0.004)
[−0.110,−0.094] [−0.114,−0.098]β4 (GENDER) −0.330 (0.006) −0.625 (0.005)
[−0.339,−0.317] [−0.632,−0.610]β5 (AGE) −0.038 (0.001) −0.047 (0.002)
[−0.040,−0.035] [−0.052,−0.044]β6 (INCOME) −0.045 (0.003) −0.055 (0.006)
[−0.050,−0.039] [−0.066,−0.045]β7 (TRANS) 0.022 (0.002) 0.012 (0.004)
[0.019, 0.025] [0.005, 0.020]
β8 (Inclusive Value) 1.400 (0.008) 2.109 (0.004)
[1.394, 1.414] [2.102, 2.118]
Exchange or refund γ01 0.028 (0.006) 0.238 (0.005)
[0.018, 0.039] [0.231, 0.247]
γ02 0.134 (0.007) 0.309 (0.005)
[0.150, 0.124] [0.298, 0.319]
γ03 −0.008 (0.012) 0.271 (0.006)
[−0.025, 0.004] [0.263, 0.284]
γ04 0.313 (0.006) 0.057 (0.005)
[0.304, 0.326] [0.047, 0.066]
γ1 (UBP_EXG) 0.249 (0.007) 1.101 (0.007)
[0.239, 0.264] [1.088, 1.111]
γ2 (PRIMARY) 0.294 (0.006) 0.810 (0.005)
[0.289, 0.307] [0.800, 0.821]
γ3 (UBP_EXG*PRIMARY) 0.100 (0.006) 0.674 (0.003)
[0.093, 0.109] [0.669, 0.681]
γ4 (UPSELL) 0.714 (0.008) 0.481 (0.003)
[0.704, 0.726] [0.476, 0.485]
γ5 (ESCR) 0.043 (0.004) 0.278 (0.011)
[0.034, 0.050] [0.263, 0.301]
γ6 (ΔPRICE) −0.004 (0.000) 0.002 (0.000)
[−0.004,−0.003] [0.002, 0.002]
Note:Estimates in bold have more than 95 % of their posterior mass away from zero
Mark Lett
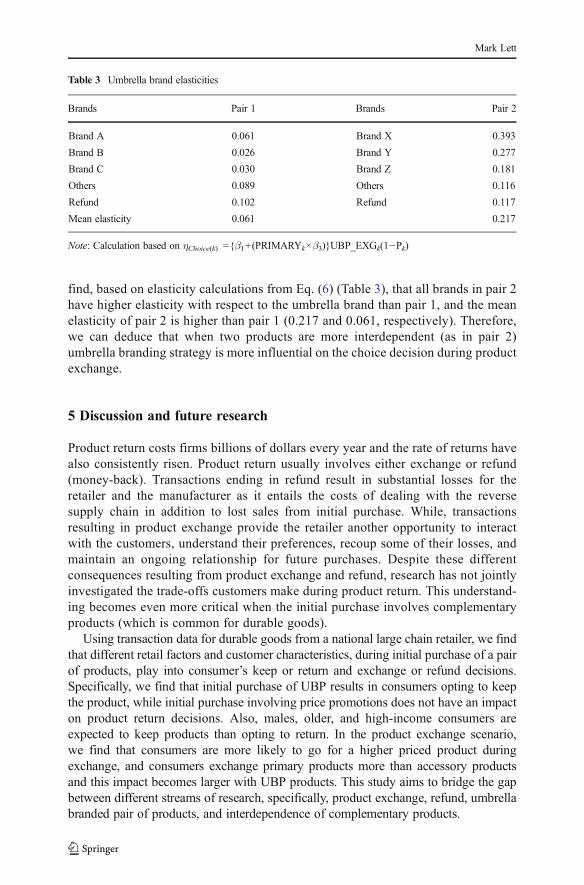
find, based on elasticity calculations from Eq. (6) (Table 3), that all brands in pair 2have higher elasticity with respect to the umbrella brand than pair 1, and the meanelasticity of pair 2 is higher than pair 1 (0.217 and 0.061, respectively). Therefore,we can deduce that when two products are more interdependent (as in pair 2)umbrella branding strategy is more influential on the choice decision during productexchange.
5 Discussion and future research
Product return costs firms billions of dollars every year and the rate of returns havealso consistently risen. Product return usually involves either exchange or refund(money-back). Transactions ending in refund result in substantial losses for theretailer and the manufacturer as it entails the costs of dealing with the reversesupply chain in addition to lost sales from initial purchase. While, transactionsresulting in product exchange provide the retailer another opportunity to interactwith the customers, understand their preferences, recoup some of their losses, andmaintain an ongoing relationship for future purchases. Despite these differentconsequences resulting from product exchange and refund, research has not jointlyinvestigated the trade-offs customers make during product return. This understand-ing becomes even more critical when the initial purchase involves complementaryproducts (which is common for durable goods).
Using transaction data for durable goods from a national large chain retailer, we findthat different retail factors and customer characteristics, during initial purchase of a pairof products, play into consumer’s keep or return and exchange or refund decisions.Specifically, we find that initial purchase of UBP results in consumers opting to keepthe product, while initial purchase involving price promotions does not have an impacton product return decisions. Also, males, older, and high-income consumers areexpected to keep products than opting to return. In the product exchange scenario,we find that consumers are more likely to go for a higher priced product duringexchange, and consumers exchange primary products more than accessory productsand this impact becomes larger with UBP products. This study aims to bridge the gapbetween different streams of research, specifically, product exchange, refund, umbrellabranded pair of products, and interdependence of complementary products.
Table 3 Umbrella brand elasticities
Brands Pair 1 Brands Pair 2
Brand A 0.061 Brand X 0.393
Brand B 0.026 Brand Y 0.277
Brand C 0.030 Brand Z 0.181
Others 0.089 Others 0.116
Refund 0.102 Refund 0.117
Mean elasticity 0.061 0.217
Note: Calculation based on ηChoice(k) ={β1+(PRIMARYk×β3)}UBP_EXGk(1−Pk)
Mark Lett
5.1 Managerial implications
This research provides insights into different retail, product, and customer characteris-tics that managers’ need to focus on to maintain an ongoing relationship with theircustomers. Since, our research emphasized the pivotal role of umbrella brandingstrategy in the product return decisions; we now demonstrate its true impact on thebottom line of retailers.
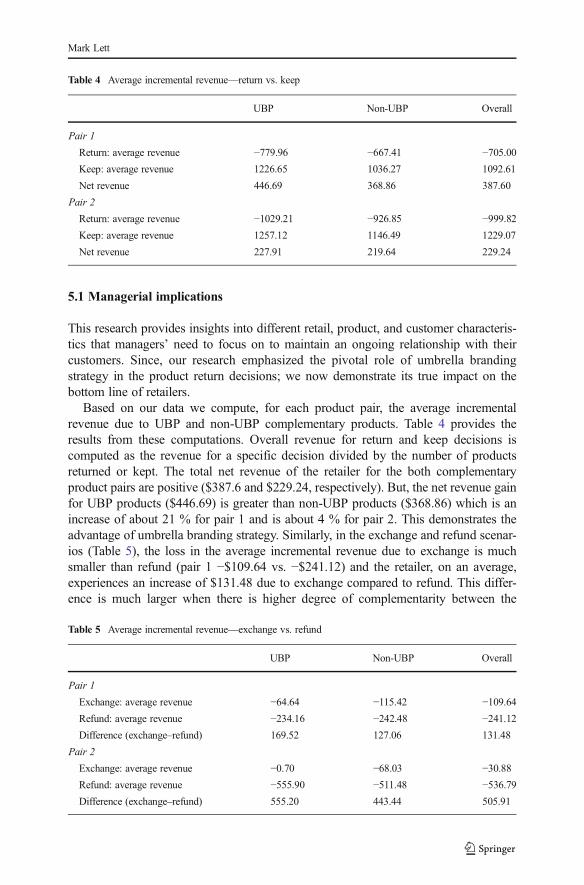
Based on our data we compute, for each product pair, the average incrementalrevenue due to UBP and non-UBP complementary products. Table 4 provides theresults from these computations. Overall revenue for return and keep decisions iscomputed as the revenue for a specific decision divided by the number of productsreturned or kept. The total net revenue of the retailer for the both complementaryproduct pairs are positive ($387.6 and $229.24, respectively). But, the net revenue gainfor UBP products ($446.69) is greater than non-UBP products ($368.86) which is anincrease of about 21 % for pair 1 and is about 4 % for pair 2. This demonstrates theadvantage of umbrella branding strategy. Similarly, in the exchange and refund scenar-ios (Table 5), the loss in the average incremental revenue due to exchange is muchsmaller than refund (pair 1 −$109.64 vs. −$241.12) and the retailer, on an average,experiences an increase of $131.48 due to exchange compared to refund. This differ-ence is much larger when there is higher degree of complementarity between the
Table 4 Average incremental revenue—return vs. keep
UBP Non-UBP Overall
Pair 1
Return: average revenue −779.96 −667.41 −705.00Keep: average revenue 1226.65 1036.27 1092.61
Net revenue 446.69 368.86 387.60
Pair 2
Return: average revenue −1029.21 −926.85 −999.82Keep: average revenue 1257.12 1146.49 1229.07
Net revenue 227.91 219.64 229.24
Table 5 Average incremental revenue—exchange vs. refund
UBP Non-UBP Overall
Pair 1
Exchange: average revenue −64.64 −115.42 −109.64Refund: average revenue −234.16 −242.48 −241.12Difference (exchange–refund) 169.52 127.06 131.48
Pair 2
Exchange: average revenue −0.70 −68.03 −30.88Refund: average revenue −555.90 −511.48 −536.79Difference (exchange–refund) 555.20 443.44 505.91
Mark Lett
products (pair 2 $505.91). It should be noted that these are conservative estimates as weare computing the average. The actual gain would be much larger because the numberof exchanges is much greater than the number of refunds.
However, we find interesting differences between UBP and non-UBP products. Wefind that, for pair 1, the average gain in incremental revenue due to exchange asopposed to refund is $169.52 for UBP compared to $127.06 for non-UBP products,which is a 25 % gain. Similarly, for pair 2 we find that this gain is about 20.1 %($555.20 vs. $443.44). These findings clearly demonstrate the benefits of the sale ofUBP products. We believe that this provides valuable information to retailers toemphasize through feature, displays, and in-store advertising to push for UBP products.Another interesting observation from Table 5 is the large difference in magnitude inincremental revenue for products in pair 2 compared to pair 1. Therefore, retailers canfocus on educating consumers about the degree of complementarity of various pairs ofproducts through their sales personnel. There is a certain push from manufacturers andretailers to include better instruction guides and studies have demonstrated that it doeshave a positive impact on reducing product returns (Lawton 2008).
Interestingly, we find that degree of complementarity of products plays a critical rolein the product exchange scenario. In particular, we observe that higher degree ofcomplementarity amplifies the impact of most factors (maintaining UBP and exchang-ing primary product) during product exchange. However, the lower degree of comple-mentarity results in the purchase of higher priced products than higher degree ofcomplementarity. Thus, from a retail standpoint, lower degree of complementaritybetween the products could still result in larger revenue during product exchange. Webelieve this is indeed an interesting implication. Currently, we do not have any otherfactors to decide if there are any inherent differences between the two categories, andhence, complementarity is primarily decided based on our elasticity calculations. Thiscould be investigated further in future research.
References
Anderson, E. T., Hansen, K., & Simester, D. (2009). The option value of returns: theory and empiricalevidence. Marketing Science, 28(3), 405–423.
Douthit, David, Michael Flach and Vivek Agarwal (2011), BA Breturning problem^ reducing the quantity andcost of product returns in consumer electronics,^ Accenture, 1-20.
Eaton, B.C., D. F. Eaton, and D. W. Allen (2011), Microeconomics: theory with applications, 8th edition,Prentice Hall.
Erdem, T. (1998). An empirical analysis of umbrella branding. Journal of Marketing Research, 35(3),339–351.
Erdem, T., & Sun, B. (2002). An empirical investigation of the spillover effects of advertising and salespromotions in umbrella branding. Journal of Marketing Research, 39(4), 408–420.
Gupta, S. (1988). Impact of sales promotions on when, what, and how much to buy. Journal of MarketingResearch, 25(4), 342–355.
Janakiraman, N., & Ordóñez, L. (2011). Effect of effort and deadlines on consumer product return. Journal ofConsumer Psychology, 22(2), 260–271.
Lawton, C. (2008), BThe war on returns,^ Wall Street Journal (May 8) D1.Lee, C. K. M., & Chan, T. M. (2009). Development of RFID-based reverse logistics system. Expert Systems
with Applications, 36(5), 9299–9307.Mas-Colell, Andreu, Michael Dennis Whinston, and Jerry R. Green (1995), Microeconomic theory, Oxford
University Press.
Mark Lett
Moorthy, S., & Srinivasan, K. (1995). Signaling quality with a money-back guarantee: the role of transactionCosts. Marketing Science, 14(4), 442–466.
Ni, J., Neslin, S. A., & Sun, B. (2012). Database submission—the ISMS durable goods data sets. MarketingScience, 31(6), 1008–1013.
Park, K. (2006). An exploratory study of consumer return experiences. Journal of the Korean Society ofClothing and Textiles, 30(6), 961–970.
Petersen, A. J., & Kumar, V. (2009). Are product returns a necessary evil? Antecedents and consequences.Journal of Marketing, 73(May), 35–51.
Rahinel, R., & Redden, J. P. (2013). Brands as product coordinators: matching brands make joint consumptionexperiences more enjoyable. Journal of Consumer Research, 39(6), 1290–1299.
Reinartz, W. J., & Kumar, V. (2003). The impact of customer relationship characteristics on profitable lifetimeduration. Journal of Marketing, 67(1), 77–99.
Shine, B. C., Jongwon, P., & Wyer, R. S., Jr. (2007). BBrand synergy effects in multiple brand extensions,^.Journal of Marketing Research, 44(4), 663–670.
Simonson, I. (1991). The influence of anticipating regret and responsibility on purchase decisions. Journal ofConsumer Research, 19(1), 105–118.
Sinitsyn, M. (2012). Coordination of price promotions in complementary categories. Management Science,58(11), 2076–2094.
Sinitsyn, Maxim (2015), BChoosing the quality of the fit between complementary products,^ Journal ofEconomics and Management Strategy, forthcoming
Wood, S. L. (2001). Remote purchase environments: the influence of return policy leniency on two-stagedecision processes. Journal of Marketing Research, 38(2), 157–169.
Mark Lett