Examining the relationship between service quality and ... - DOI
15
Examining the relationship between service quality and customer satisfaction in the public service. The case of Botswana PHETOGO MOSIMANEGAPE Botswana Open University, B OLUMIDE JAIYEOBA Botho University, B CHUX GERVASE IWU Cape Peninsula University of Technology, S CHENESO CHEKULA-MAHAMA Tonata Sub Regional Education, Ministry of Basic Education, B Abstract: - Sustaining public confidence in any government is also a function of the consistency in the delivery of public goods and services. For several years, customers across public organizations have complained about the quality of services delivered to them. It is therefore important for public organizations to regularly evaluate service quality in order to better understand how best to satisfy customers. This study investigated the extent to which dimensions of service quality influence customer satisfaction in the Tonota Sub Region. With the aid of a questionnaire, data were collected from 135 respondents located at 27 basic education sites (secondary and primary schools) in the Tonota Sub Region. Descriptive and inferential statistics were used for data analysis. The findings reveal that service quality dimensions of tangibility, empathy, assurance, and responsiveness impact customer satisfaction positively. This study recommends amongst others, training of employees on managing customer complaints, records management and increasing service reliability to improve service quality. The outcome of this study will guide the formulation of customer satisfaction strategy and policy aligned with service standards to drive service quality delivery. Future research is recommended on perceptions of teachers and other members of the public regarding the extent to which service quality impacts customer satisfaction so as to comprehensively discern public service quality dimensions. An understanding of customer satisfaction within the public service will likely kindle better relations between the public and government thereby improving public trust in government programs. Managers are also likely to tap into this to further levels of job satisfaction for public sector employees. Key-Words: - Customer satisfaction; Quality service delivery, Service quality dimensions, Public Service, Tonota-Botswana; SERVQUAL Received: December 28, 2019. Revised: May 14, 2020. Re-revised: May 29, 2020. Accepted: June 1, 2020. Published: June 4, 2020. 1 Introduction According to Jenkins [1], sustainability refers to “a capacity to maintain some entity, outcome, or process over time”. This description suggests that “to sustain something, the resources that it depends on must be available at all times for it to continue to exist” [2]. Sustainable public service can then be argued to mean a service that is harvested over a long period and offers the capacity to delight. Therefore, to measure public service quality requires a determination of the extent to which customers and or users of public service are satisfied. Customer satisfaction has globally become a strategic initiative for organizations to achieve their objectives. Customer satisfaction is primarily measured to assess how well an organization meets the needs of its customers and what should be done better [3; 4]. According to Paul, Mittal and Srivastav [5] and Kant and Jaiswal [6], the perceived performance of a product is compared to the expected standards of that performance. This implies that customer satisfaction is more of an outcome of comparison between the level of service provision or product performance and the set organizational standards of service. Basically, the customer undertakes a comparison of a product or service before and after a purchase [5; 6; 7]. Therefore, a customer is said to be satisfied when (1) the purchasing experience is delightful and (2) the product or service meets the reasons for its purchase [5; 6]. Poor service delivery is widely reported within the public sector. For example, several WSEAS TRANSACTIONS on BUSINESS and ECONOMICS DOI: 10.37394/23207.2020.17.57 Phetogo Mosimanegape, Olumide Jaiyeoba, Chux Gervase Iwu, Cheneso Chekula-Mahama E-ISSN: 2224-2899 579 Volume 17, 2020
-
Upload
khangminh22 -
Category
Documents
-
view
1 -
download
0
Transcript of Examining the relationship between service quality and ... - DOI
Examining the relationship between service quality and customer
satisfaction in the public service. The case of Botswana
PHETOGO MOSIMANEGAPE
Botswana Open University, BOTSWANA
OLUMIDE JAIYEOBA
Botho University, BOTSWANA
CHUX GERVASE IWU
Cape Peninsula University of Technology, SOUTH AFRICA
CHENESO CHEKULA-MAHAMA
Tonata Sub Regional Education, Ministry of Basic Education, BOTSWANA
Abstract: - Sustaining public confidence in any government is also a function of the consistency in the delivery
of public goods and services. For several years, customers across public organizations have complained about
the quality of services delivered to them. It is therefore important for public organizations to regularly evaluate
service quality in order to better understand how best to satisfy customers. This study investigated the extent to
which dimensions of service quality influence customer satisfaction in the Tonota Sub Region. With the aid of a
questionnaire, data were collected from 135 respondents located at 27 basic education sites (secondary and
primary schools) in the Tonota Sub Region. Descriptive and inferential statistics were used for data analysis.
The findings reveal that service quality dimensions of tangibility, empathy, assurance, and responsiveness
impact customer satisfaction positively. This study recommends amongst others, training of employees on
managing customer complaints, records management and increasing service reliability to improve service
quality. The outcome of this study will guide the formulation of customer satisfaction strategy and policy
aligned with service standards to drive service quality delivery. Future research is recommended on perceptions
of teachers and other members of the public regarding the extent to which service quality impacts customer
satisfaction so as to comprehensively discern public service quality dimensions. An understanding of customer
satisfaction within the public service will likely kindle better relations between the public and government
thereby improving public trust in government programs. Managers are also likely to tap into this to further
levels of job satisfaction for public sector employees.
Key-Words: - Customer satisfaction; Quality service delivery, Service quality dimensions, Public Service,
Tonota-Botswana; SERVQUAL
Received: December 28, 2019. Revised: May 14, 2020. Re-revised: May 29, 2020. Accepted: June 1,
2020. Published: June 4, 2020.
1 Introduction According to Jenkins [1], sustainability refers to “a
capacity to maintain some entity, outcome, or
process over time”. This description suggests that
“to sustain something, the resources that it depends
on must be available at all times for it to continue to
exist” [2]. Sustainable public service can then be
argued to mean a service that is harvested over a
long period and offers the capacity to delight.
Therefore, to measure public service quality
requires a determination of the extent to which
customers and or users of public service are
satisfied.
Customer satisfaction has globally become
a strategic initiative for organizations to achieve
their objectives. Customer satisfaction is primarily
measured to assess how well an organization meets
the needs of its customers and what should be done
better [3; 4]. According to Paul, Mittal and Srivastav
[5] and Kant and Jaiswal [6], the perceived
performance of a product is compared to the
expected standards of that performance. This
implies that customer satisfaction is more of an
outcome of comparison between the level of service
provision or product performance and the set
organizational standards of service. Basically, the
customer undertakes a comparison of a product or
service before and after a purchase [5; 6; 7].
Therefore, a customer is said to be satisfied when
(1) the purchasing experience is delightful and (2)
the product or service meets the reasons for its
purchase [5; 6].
Poor service delivery is widely reported
within the public sector. For example, several
WSEAS TRANSACTIONS on BUSINESS and ECONOMICS DOI: 10.37394/23207.2020.17.57
Phetogo Mosimanegape, Olumide Jaiyeoba, Chux Gervase Iwu, Cheneso Chekula-Mahama
E-ISSN: 2224-2899 579 Volume 17, 2020

studies [8; 9; 10] have reported excessive
complaints by customers seeking to access public
services. This is despite the decentralization of
functions to districts by government as a way to
bring services closer to the people in an attempt to
facilitate service delivery. Owing to frequent
customer complaints regarding poor quality service
within government parastatals, management of
public sector services has come under severe
scrutiny [8]. Governments are therefore under
pressure to provide the needed services to their
citizens on time [9; 11]. Essentially, service
delivery remains an important obligation of any
government to its citizens, which heightens the need
for reform programs and processes aimed at
bringing about access to quality public goods and
services [11].
Several studies have established the
nomological web between customer satisfaction and
service quality metrics: reliability, responsiveness,
assurance, empathy and tangibility. For instance, a
study by Pizam et al. [3] on customer satisfaction in
hospitality enterprises in the United States of
America established that the aforementioned service
quality metrics positively influenced customer
satisfaction. Ali, Dey and Filieri [12] examined
service quality and customer satisfaction of air
travel in Pakistan and found that all service quality
dimensions (responsiveness, reliability, empathy
and assurance) had strong influence on customer
satisfaction. Furthermore, Wu’s [13] research on
how some dimensions of service quality impacted
gaming establishments in China found that service
quality substantially influenced perceived value and
corporate image. Wu [13] also found that perceived
value and corporate image were determining factors
of customer satisfaction.
As far as we know, only very few service
quality-oriented studies have taken place in
Botswana. Therefore, this study adds to the
literature on service quality as it affects Botswana.
Besides this, and as Table 1 depicts, there is no
study which has investigated the nomological web
between service quality and customer satisfaction in
Botswana’s public sector specifically the education
sector.
The value of this study is consistent with the
national human resource development value
proposition as indicated in the National Human
Resource Development Strategy, 2009-2022 [14]:
Realising Our Potentials: Republic of Botswana:
Ministry of Education and Skills Development.
This strategic document is centred around
national development, but more importantly aligned
to issues of education and training, citizen
empowerment, and research and innovation that
facilitates the development of the average citizen of
Botswana. The citizens of Botswana are the greatest
asset and the guarantors of the nation’s long term
Table 1: Papers Published on Service Quality
and Customer Satisfaction in Botswana
1. Effects of Service Quality on Customer
Satisfaction on Botswana’s Mobile
Telecommunications Industry by G.B
Selelo and K.R Lekobane: Archives of
Business Research Vol. 5 No. 3 (2017)
2. A service quality Framework for the
Botswana Hospitality Sector: G.M
Musikavanhu (Unpublished Dissertation
PhD: Tourism Management, North-West
University, Potchesfstroom Campus.
3. A netrographic Analysis of Online Reviews
of Restaurant Service in Botswana by D.
Chatibura and M. Siya, Botswana Journal of
Business Vol. 11 No. 1 (2018).
4. Customer Satisfaction in the Airline
Industry : The role of service quality, Brand
image and customer value, M.O Madikwe:
Unpublished MBA Dissertation.
5. E-service usage and satisfaction in
Botswana by O.O Jaiyeoba, T.T, Chimbise
and M. Roberts Lombard: African Journal
of Economic and Management Studies
(2018).
6. BOCRA customer satisfaction survey Draft
Final Report (2015) by Botswana Institute
for Development Policy Analysis (BIDPA).
7. Customers perception of Service Quality
and its impact on reputation in the
Hospitality industry by T. Mmutle and L.
Shonhe, Vol. 6 No. 3 (2017): African
Journal of Hospitality, Tourism and Leisure.
8. The Gaps Model of Service Quality and
Higher Education Delivery in Botswana: An
internal Customer Perspective by Ushe
Makambe Vol. 5 Issue 3 (2016)
International Review of Management and
Business Research: Gaps Model of Service
quality is different from the parsimonious
model adopted for this empirical study.
9. Perceptions of quality service at the
University of Botswana Library: What
Nova says: A.P Thapisa and V. Gamini,
Journal of Library Management (1999).
Vol. 20, No. 7 pp: 373-383
10. Using the Servqual Model to Evaluate the
impact of Public service reforms in the
Provision of Primary Health Care in
Botswana: J. Pansiri and R.N Mmereki
(2010): pp: 219-234.
WSEAS TRANSACTIONS on BUSINESS and ECONOMICS DOI: 10.37394/23207.2020.17.57
Phetogo Mosimanegape, Olumide Jaiyeoba, Chux Gervase Iwu, Cheneso Chekula-Mahama
E-ISSN: 2224-2899 580 Volume 17, 2020
prosperity as indicated in NHRDS, 2009-2022 [14].
Based on the aforementioned, service quality and
customer satisfaction lend credence to access,
quality, relevance, excellence and developing a high
performance culture as enshrined in the NHRDS
2019 Annual Report. As stated in the annual report,
a comprehensive and quality secondary education
system provides various opportunities to graduates
to pursue several walks of life. To this end, an
understanding of the quality of services offered by
education authorities will go a long way in
addressing issues that not only hamper the delivery
of teaching and learning, but also facilitates the
elevation of Botswana in global competitiveness.
Currently, Botswana ranks 91 out of the 140
countries in the global competitiveness report
published by the World Economic Forum [15].
Most of the studies pertaining to service
quality have taken place in the cities of Gaborone
and Francistown. Tonota Sub district is a
burgeoning region located in the Central District of
Botswana and has recently become a beehive of
economic activity following in the heels of
Gaborone and Francistown, which are renowned for
their commercial status.
2. Literature review
2.1. The state of public service delivery in
Botswana
In Botswana’s government departments, service
delivery is badly characterized by long queues,
arduous paper work, bureaucracy, cramped spaces
and a lot of frustration [9]. According to Kealesitse
et al. [8], Ramakele and Koloi-Keaikitse [10], and
Hope [16], the public sector in Botswana is known
for not sufficiently responding to the needs of its
customers.
There are several examples in Botswana of
low levels of customer satisfaction in terms of the
delivery or implementation of public service
programs or projects across the ministries [17; 18;
19]. According to Botlhale [18], examples of
projects which were poorly delivered include the
National Stadium in Gaborone, Sir Seretse Khama
International Airport in Gaborone, Francistown
Stadium in Francistown, Morupule B Power Plant in
Palapye and the Glass Plant in Palapye. Other
examples of poor delivery include the under-spent
development budget of about 17.3% between
2012/2013 and 2013/2014 years; cost overruns, poor
quality projects; and the water crisis [18; 17].
Similarly, Jaiyeoba, Chimbise, Makanyeza
and Iwu [20] reported that the health insurance
sector in Botswana is faced with problems of
inexpediency and customer discontent. The authors
lamented that these could be counterproductive for
businesses such as the Associated Funds
Administrators (AFA), Botswana Public Officers
Medical Aid Scheme (BPOMAS) and PULA
Medical Aid (PULA). As far as the current study is
concerned, the Tonota Sub Region Education Office
is not exonerated from the poor service delivery
record of Botswana, and hence the need for this
study. According to Yuen and Thai [21] and Shin,
Thai and Yuen [22], the lack of trust and
commitment in the maritime logistics industry, was
identified as one of the key factors preventing firms
from collaborating or obtaining full benefits of
service industry in an era of global competitiveness
in the service industry.
Recently in April 2018, the Botswana Daily
News newspaper reported that the President, Mr.
Mokgweetsi Masisi was concerned about poor
customer service delivery in Botswana, particularly
in the public sector. Swiftly, he took his entire
Cabinet Ministers for a retreat to share his vision
and strategy on improving public service delivery in
Batswana [23]. Notwithstanding some chequered
reporting of service delivery issues within the public
sector of Botswana government, the government
introduced initiatives such as the National
Productivity Program, Work Improvement Teams
Strategy (WITS), decentralization and a
Performance Management System (PMS) to address
concerns over public service delivery.
Despite the above initiatives, reports of
customer dissatisfaction continue to be recorded in
Botswana as noted by Botlhale [18]; Jaiyeoba et al.
[20] and NDP 11 [19]. However, interestingly, some
studies equally found a positive influence of service
quality dimensions on satisfaction. For instance,
Kealesitse et al. [8] found that improved
performance and responsiveness shaped customer
perception positively. Similarly, Jaiyeoba et al. [20]
found that responsiveness had a positive impact on
customer satisfaction for services at the Botswana
Public Officers Medical Aid Scheme and Pula
Medical Aid.
Numerous studies on customer satisfaction with
regard to public service in Botswana and elsewhere
have focused on the final customers [24]. Few
studies have focused on internal customer
satisfaction delivery [25; 26; 20] with particular
reference to school managers and supervisory
departments or units. For this reason, this study
focused on customer satisfaction and service quality
WSEAS TRANSACTIONS on BUSINESS and ECONOMICS DOI: 10.37394/23207.2020.17.57
Phetogo Mosimanegape, Olumide Jaiyeoba, Chux Gervase Iwu, Cheneso Chekula-Mahama
E-ISSN: 2224-2899 581 Volume 17, 2020

within the Tonota Sub Region’s Education Office in
Botswana.
3. Theoretical Foundations
3.1. Customer satisfaction There are numerous descriptions ascribed to
customer satisfaction. Bellingkrodt and Wallenburg
[27] define customer satisfaction as the extent to
which customers of an organization repeatedly
identify with an organization’s products and
services. Thus, if customers continually perceive a
product or service positively, Bellingkrodt and
Wallenburg [27] argue that this mental state can
nurture customer loyalty.
Examining whether customers of a public
utility in Malawi are satisfied or not led Chodzaza
and Gombachika [28] to define customer
satisfaction as a reflection of the pleasure level of a
consumer. Customer satisfaction should rather be
seen as the overall attainment of a customer’s
expectation. This is the contention of Oludele et al.
[24] while researching the degree of citizen
satisfaction with regard to public service in South
Africa. In other words, to understand customer
satisfaction requires measuring the extent to which a
customer’s expectations have been met. This
description is consistent with the definition offered
by Jaiyeoba, Chimbise and Roberts-Lombard [29] in
a study of E-service usage and satisfaction in
Botswana where they referred customer satisfaction
as the mindset of customers regarding positive
expectations of a product or service. They further
argued that providing high-quality customer care,
including constant communication and good
employee conduct have the potential to keep a
customer satisfied.
Based on the aforementioned, this study
lends credence to the theory of reasoned action
expanded by Fishbein and Ajzen [30]. According to
this theory, the attitude toward behavior and
subjective norms make up one’s behavioral
intention and subsequent display of behavior.
Interestingly, the subjective norm represents one’s
set of beliefs while the normative beliefs represent
the probability that an intention and or its
subsequent display is approved as argued by
Meskaran, Ismail, and Shanmugam [31]. As far
back as 1975, Fishbein and Ajzen argued that
whatever behavior is displayed is dependent on
one’s instincts, which often are made up of four
distinct elements: the action, the target at which the
action is directed, the context in which the action is
performed and the time at which it is performed.
Tsoukatos and Mastrojianni [32], thus suggest that
continuous evaluation of the dimensions of
SERVQUAL is critical in order to fulfil customers’
aspirations. Hamzah, Lee and Moghavvemi [33]
context-specific understanding of SERVQUAL
remains a key issue that requires further
investigation, thus the need for the development of
service quality metrics dimensionality for public
sector in Botswana. This study thus seeks to adopt
Lee and Moghavvemi’s [34] study which identified
dimensions based on the most cited and most
applicable SERVQUAL dimensions namely
tangibles, empathy, reliability and convenience.
Even though the mental state associated
with satisfaction starts with what the customer
expects, much of its consideration is retrospective.
The views of Daniel and Nicholas [35] are also
consistent with this account in that if a customer
notes dissatisfaction with a product or service, it is
based on the customer’s analysis of his or her
expectations before and the experience on
encountering the product or service. This suggests
that the customer would have evaluated the overall
experience of encountering the product or service
over a period. Jamali [36] agrees with this ex post
facto illustration of customer satisfaction. Her view
is that post‐consumption evaluation contains both
cognitive and affective elements and goes further to
distinguish for example between “satisfaction as
contentment or happiness”, “satisfaction as pleasure
or enjoyment”, and “satisfaction as relief or
assistance” implying that customers have different
motives for different levels of satisfaction.
Customer satisfaction may further be
viewed as a psychological attainment derived from
product or service use; or a mental state whereby the
customer undertakes a comparison of a product or
service before and after a purchase [5]. It can be
concluded that with regard to public service,
customer satisfaction is concerned with level of
service delivery expectations before receiving
service and perceptions after getting the service. It
could be argued therefore that in public service,
customers would be satisfied when they are happy
with the service they receive without experiencing
delays or any difficulty.
3.2. Service quality Several researchers such as Paul et al. [5] describe
service quality as the difference between what a
customer expected of a service prior to encountering
it and his or her perceptions of the service after it is
received. Specifically, service quality is determined
on the basis of customers’ assessment of the service
that they receive [6].
WSEAS TRANSACTIONS on BUSINESS and ECONOMICS DOI: 10.37394/23207.2020.17.57
Phetogo Mosimanegape, Olumide Jaiyeoba, Chux Gervase Iwu, Cheneso Chekula-Mahama
E-ISSN: 2224-2899 582 Volume 17, 2020

Service quality metrics or attributes are used
to measure the orientation of services as perceived
by the customer. Service quality perspectives have
been described as the elements or factors or
parameters widely accepted and adopted to measure
service quality in the SERVQUAL instrument.
These parameters are adopted to infer service
quality metrics or gauge levels of customer
satisfaction in any organization [37].
3.3. The SERVQUAL model The SERVQUAL model is commonly adopted to
understand customer satisfaction. It is especially
adopted to measure gaps in service orientation. The
SERVQUAL model postulated by Parasuraman et
al. [38] over the years has been extensively applied
by many authors [37; 5].
According to Hui and Zheng [7], in terms of
the SERVQUAL model, customers evaluate service
quality dimensions by comparing service outcome
with actual performance. They indicate that service
dimension is a function of the perspectives between
expectations and perceptions. Therefore, Alzaydi et
al. [37] define service quality as the difference
between perception (P) and expectation (E).
Jaiyeoba et al. [20] and Jaiyeoba et al. [29], in a
study of e-service usage metrics and satisfaction in
Botswana contended that SERVQUAL is a leading
model used to evaluate service quality and to assess
customer satisfaction.
The SERVQUAL instrument has 22 scale
items used to evaluate service quality dimensions
namely tangibility, reliability, responsiveness,
assurance and empathy. Each sub construct
measures expectations and perceptions [37]. With
minor modifications, Alzaydi et al. [37], Chodzaza
and Gombachika [28] and Wisniewki [40] argue
that the SERVQUAL can be adapted in any firm. By
doing so, service quality gaps are identified which
managers benefit from while investigating how best
to target performance metrics. In fact, Alzaydi et al.
[37], Chodzaza and Gombachika [28] and
Wisniewki [40] are also of the view that the
identification of these gaps including pinpointing
the performance metrics lead to better focus on
performance outcomes.
In addition, positive gap in service or exceeded
expectations indicate that there are “over‐supplied”
features of the service and re‐deployment of
resources. This is relevant for the public sector as
its resources are increasingly under pressure [37].
Furthermore, a breakdown of five service
quality dimensions into separate statements allows a
firm to focus on particular problem areas thereby
improving service delivery. For example, in the UK
and Scotland, the SERVQUAL model has been used
in different sectors including catering service, public
libraries, housing, grounds maintenance and leisure
services [40]. This is an indication that
SERVQUAL model can be applied across different
public sector services to assess the customer
satisfaction.
Based on the aforementioned, it is clear that
the SERVQUAL model can be utilized to
investigate service quality and service performance
in either the public or private sector.
3.4. Theoretical model development This section describes customer satisfaction and
explores its importance and relationship to service
delivery in Botswana. A conceptual framework is
derived based on meta analytical review of extant
literature.
3.4.1 Reliability and customer satisfaction
Reliability has been defined as the firm’s capability
to provide services accurately, and efficiently [37].
In a study using the SERVQUAL
instrument to evaluate customer satisfaction metrics
on public sector services, Wisniewki [40] found that
reliability had positive gap scores meaning that what
the customers expected were surpassed by the
public library. For example, the library had reliable
equipment such as photocopiers, internet, and
processes that helped it to attain the needs of the
library users. Similarly, in India, Paul et al. [5]
found that in public and private sector banks,
reliability positively influenced customer
satisfaction. The study also found that trust and
dependable services influenced the users’ evaluation
of service quality in public and private sector banks.
The reliable uses of the internet, ATMs and
operational times were cited as examples considered
by customers.
In another study, Andrews and Turner [41] found
that reliability had a substantial affirmative
influence on customer satisfaction in the UK. The
findings showed that the employee’s commitment to
provide dependable quality service positively
influenced customer satisfaction. A similar study by
Brysland and Curry [42] found similar results in the
UK.
Other studies that found a significantly
positive influence of reliability on customer
satisfaction include: Jamali [36] in Lebanon and
Kaura [46] in India. In Botswana, Thapisa and
Gamini [43] found a positive relationship between
user-friendliness of library services at the University
of Botswana and the reliability of available
information. In another study in Botswana, Jaiyeoba
WSEAS TRANSACTIONS on BUSINESS and ECONOMICS DOI: 10.37394/23207.2020.17.57
Phetogo Mosimanegape, Olumide Jaiyeoba, Chux Gervase Iwu, Cheneso Chekula-Mahama
E-ISSN: 2224-2899 583 Volume 17, 2020
et al. [20] found that efficiency and system
availability had a positive impact on the customers
also established a positive relationship to the
perceived value of the health insurance. We
therefore hypothesize that:
H1: Reliability measure is significantly and
positively related to customer satisfaction.
3.4.2. Responsiveness and customer satisfaction
Responsiveness has been defined as the desire to
help customers and the ability to provide timely
services [37]. Andrews and Turner [41], in a study
on customer experience in service delivery in the
UK public sector established that the quality of
employee performance, marked by responsiveness,
competence, and promptness, influenced customer
satisfaction. Silvestri et al. [44], in a study on
service quality and customer satisfaction in thermal
tourism, found that the employee’s desire to help
customers, the promptness of services, and the
capacity to provide individualized attention to
clients provided more customer satisfaction.
Other studies that found a positive impact of
promptness and responsiveness on customer service
respectively include those of Bitterncourt et al. [45],
Kant and Jaiswal [6] in India; Kaura [46] and Jamali
[36] in Lebanon. Similarly, Frimpong and Wilson
[47], in a study of the relative importance of
satisfaction dimensions on service performance in
Ghana, established that all the dimensions predicted
customer satisfaction. In Namibia, Whyte and
Bytheway [48] found that responsiveness, courtesy
and competence had a positive impact on customer
satisfaction on service orientation. They argued that
responsiveness, competence and courtesy of staff
reflected the culture of the organization towards
service quality performance.
Finally, in Botswana, different studies have
similarly found a positive influence of the service
quality metrics on customer satisfaction. For
example, Kealesitse et al. [8], in a study on
customer-focused public sector reward schemes in
Botswana, found that customer orientation sets the
platform for enhancing customer satisfaction and
competitiveness. They also suggested that customer
orientation had a positive influence on employees’
performance and motivation within the public
sector. The study found that responsiveness reduced
queues and hassles when customers sought services.
Jaiyeoba et al. [20] also found that responsiveness
had a positive effect on customer satisfaction for
websites services and value of the e-mail services.
This study was conducted on the Botswana Public
Officers Medical Aid Scheme and Pula Medical
Aid. The study further found that responsiveness
contributed to efficiency and fulfilment in
addressing the health insurance schemes members’
complaints. Based on the aforementioned, we
further hypothesize that:
H2: Responsiveness measure is significantly and
positively related to customer satisfaction.
3.4.3. Assurance and customer satisfaction
Assurance signifies employees’ knowhow,
competence, courtesy, safety and capability to
inspire trust and establish confidence in customers
[37].
The empirical findings in a study by Kant
and Jaiswal [6] reveal that assurance was a
significant antecedent of customer satisfaction in
public sector banks in India. Similarly, Kaura [46],
in a study on banks in India, found that assurance
metric had a positive influence on customer
satisfaction. Brysland and Curry [42], in a study
investigating service improvement in public services
in the UK, found that the assurance dimension,
which received the highest expectations score from
the education and housing departments, had a
significant influence on customer satisfaction.
Other dimensions with a positive impact on
customer satisfaction include: customer focus;
abilities, trustworthiness and assurance; assurance
and responsiveness; professional service, efficiency,
courtesy; and security. Jaiyeoba et al. [20] in a study
on health care insurance in Botswana found that
assurance positively impacted customer satisfaction
with the use of websites and emails. Also in
Botswana, Thapisa and Gamini [43] found that
assurance had a positive relationship with user-
friendliness of library services at the University of
Botswana. Jain [26] also reported that employee
commitment and customer focus (implying
assurance) influence customers in a study on
Botswana National Library Services. We thus
hypothesize that:
H3: Assurance measure is significantly and
positively related to customer satisfaction.
3.4.4. Empathy and customer satisfaction
Empathy indicates the provision of caring,
individualized attention to customers. It covers
access, effective communications, market driven
customer needs, and friendliness [37].
Kaura [46] and Kant and Jaiswal [6]
conducted different studies that found that
politeness, personalized attention and empathy of
the employees towards customers had a positive
WSEAS TRANSACTIONS on BUSINESS and ECONOMICS DOI: 10.37394/23207.2020.17.57
Phetogo Mosimanegape, Olumide Jaiyeoba, Chux Gervase Iwu, Cheneso Chekula-Mahama
E-ISSN: 2224-2899 584 Volume 17, 2020

influence on their satisfaction in the Indian public
and private sector banks. Employee courtesy, trust,
social bonds (empathy), expertise, efficiency, and
image were found to positively impact customer
satisfaction on service delivery by Paul et al. [5] in
Indian public banks as well.
In another study investigating customer
experience in the public sector, Andrews and Turner
[41] found that the quality of employee performance
and empathy generated guests’ emotional
experience that had positive effect on customer
satisfaction. In addition, Silvestri et al. [44] found
that the employees’ ability to perform accurately,
dependably - desire to help customers, provision of
timely service and personalized attention or
empathy - appeared to give more satisfaction to
users in thermal tourism. Biscaia et al. [49] in
Portugal conducted a study in retail sports stores and
found a positive effect of image and empathy
dimensions on customer satisfaction with regard to
service orientation.
In Nigeria, Izogo and Ogba [25] found that
positive relationship exists between the empathy
dimension of service quality and customer
satisfaction in the automobile sector. The study
found that as the empathy perspective increases,
customer satisfaction level will also increase. On
the other hand, Russell and Bvuma [50], in a study
of service delivery and public sector reform found
that initiatives like Batho Pele (putting people first -
implying empathy) positively influenced customer
satisfaction. Finally, in Botswana, Jaiyeoba et al.
[20] found that system availability, efficiency,
fulfilment, empathy and contact had a significant
and positive influence on customer satisfaction for
websites and e-mail services for the health insurance
sector. We thus hypothesize that:
H4: Empathy measure is significantly and positively
related to customer satisfaction.
3.4.5. Tangibility and customer satisfaction
Tangibility signifies the physical facilities,
equipment, appearance of personnel, corporate
image, cleanliness and intangible elements [37].
Several studies have confirmed a positive
effect of tangibility on customer satisfaction in the
Indian public sector banks. Silvestri et al. [44] in a
study of service quality and customer satisfaction in
thermal tourism found that appearance, cleanliness,
comfort, safety and tangibility of the resort spa and
thermal pool gave more satisfaction to the users. In
another study, tangibility and security were found
by Whyte and Bytheway [48] to have a positive
effect on customer satisfaction in Namibia. The
study found that in terms of tangibility, banks are
perceived to perform excellently.
However, Kaura [46] found that with the
exception of tangibility, other dimensions of service
metrics had a positive influence on customer
satisfaction in Indian banking sector. Similarly, in a
study on customer experience on service delivery in
the UK public sector, Andrews and Turner [41]
found that tangible elements have less influence on
customer satisfaction. This might suggest less
attractive service environment and equipment which
shrinks performance.
Finally, in Nigeria, Izogo and Ogba [25], in
a study of services orientation metrics and customer
satisfaction on automobile repair sector, found a
positive relationship between the tangibility metrics
of service perspectives and customer satisfaction
and loyalty. The authors argue that the perceived
level of tangibility lend credence to customer
satisfaction and loyalty. We thus hypothesize that:
H5: Tangibility measure is significantly and
positively related to customer satisfaction.
Figure 1: Conceptual model of Customer
satisfaction
Source: Partially adapted and modified from Kant and Jaiswal
[6].
In Figure 1, the conceptual model shows that
customer satisfaction is affected by the service
quality metrics of tangibility, reliability,
responsiveness, assurance and empathy. The model
explicates a relationship between each service
quality dimension and customer satisfaction. The
link between each of the five service quality metric
may resonate with customer satisfaction.
4. Materials and Methods As previously indicated, this study investigated
customer satisfaction in the Tonata sub region of
WSEAS TRANSACTIONS on BUSINESS and ECONOMICS DOI: 10.37394/23207.2020.17.57
Phetogo Mosimanegape, Olumide Jaiyeoba, Chux Gervase Iwu, Cheneso Chekula-Mahama
E-ISSN: 2224-2899 585 Volume 17, 2020

Botswana. Thus, adopting the methodological
practices of Chodzaza and Gombachika [28]; Paul et
al [5]; Kant and Jaiswal [6] and Hui and Zheng [7],
a self-administered questionnaire was used to collect
data from school managers comprising heads of
schools, deputy heads of schools and heads of
departments in each of the twenty-seven (27)
schools in the Tonota Sub Region as they represent
key informants in decision making. In each school,
there were three heads of departments, one head of
school, and one deputy school head. Therefore, in
total, there were twenty-seven (27) heads of schools,
twenty-seven (27) deputy heads of schools and
eighty-one (81) heads of departments. Basically, one
hundred and thirty-five (135) respondents
participated in this study.
However, out of the 135 administered
questionnaires, only 101 were returned giving a
response rate of 74.8%. Of the 101 questionnaires,
two were unusable hence 99 questionnaires were
finally used. This gave a 98.02% accuracy in
completing the questionnaire. Since sampling frame
is known, probability sampling technique using
stratified random sampling technique was
conducted.
A descriptive statistical analysis was applied while
scale items were used to assess the underlying
constructs of service quality and customer
satisfaction. The items were evaluated for reliability
using Cronbach's alpha.
4.1. Questionnaire description
The first part of the survey instrument consisted of
demographic questions which enabled the collection
of data about the respondents’ background such as
age, academic level, position at work, length of
service and how long the person had occupied the
current post.
The second part of the questionnaire
consisted of 22 items that evaluated the respondents'
rating of service offered by the Sub Region’s
Education Office on five sub constructs of
SERVQUAL distributed as follows: tangibility (four
items), reliability (five items), responsiveness (four
items), assurance (five items) and empathy (four
items) (1988); Kant and Jaiswal [6]; Paul et al. [5].
All the items were measured on a Five-point Likert
scale (strongly disagree=1, disagree = 2, can’t say =
3, agree = 4, strongly agree = 5).
The third part of the questionnaire
comprised three items which measured respondents'
level of satisfaction towards the service offered by
the public education office. Also, three items
measured factors hindering customer satisfaction.
All the items were measured on a Five-point Likert
scale (strongly disagree–1, disagree– 2, can’t say –
3, agree – 4, strongly agree – 5).
Table 2: Constructs and items
Tangibility (TGB)
X1 Tonota Sub Region Office information banners
and boards are visually appealing
X2 Employees are well dressed and appear neat
X3 Latest equipment is available in Tonota Sub
Region Office
X4 Tonota Sub Region Office has clean, attractive
and convenient physical facilities
Responsiveness (RSP)
X5 Employees give prompt service to customers
X6 Employees are always willing to help customers
X7 Tonota Sub Region Office has an effective
complaint handling procedure
X8 Employees are well trained for delivering the
services and solving customers queries.
Empathy (EMP)
X9 Tonota Sub Region Office gives customers
individual attention
X10 Tonota Sub Region Office employees
understand specific needs of customers
X11 Employees at Tonota Sub Region Office give
customers feedback on time
X12 Tonota Sub Region Office have their customers
interest at heart
Assurance (ASR)
X13 Tonota Sub Region Office believes in fast
delivery of services
X14 Reports submitted to Tonota Sub Region
Office are safely handled
X15 I am sure that Tonota Sub Region Office keeps
my confidential details safe
X16 I feel safe to email or fax information to Tonota
Sub Region Office
Reliability (RLB)
X17 Tonota Sub Region Office delivers services
within the promised time limit
X18 Tonota Sub Region Office is sincere in solving
customers problems
X19 Tonota Sub Region Office keeps
records/information accurately
X20 Tonota Sub Region Office provides accurate
services as promised
X21 Tonota Sub Region Office services are
consistent and dependable
Customer Satisfaction (CS)
X22 Tonota Sub Region Office is a good service
provider
X23 Tonota Sub Region Office fulfils my
expectations while offering quality services
X24 Overall, I am satisfied with Tonota Sub Region
WSEAS TRANSACTIONS on BUSINESS and ECONOMICS DOI: 10.37394/23207.2020.17.57
Phetogo Mosimanegape, Olumide Jaiyeoba, Chux Gervase Iwu, Cheneso Chekula-Mahama
E-ISSN: 2224-2899 586 Volume 17, 2020
Office service delivery
Source: Adapted from Kant & Jaiswal (2017);
Parasuraman et al (1988)
4.2. Ethical consideration
Prior to administering the questionnaire, permission
was sought from the Tonota Sub Region Office
through a letter. Permission was granted on
conditions of anonymity and confidentiality of
participants. Basically, the respondents were
informed that their identities would not be disclosed,
and primarily their particulars would remain
confidential especially considering the sensitive
nature of the study. The Tonota Sub Region Office
was also assured that the data would only be used
for academic purposes.
5. Results
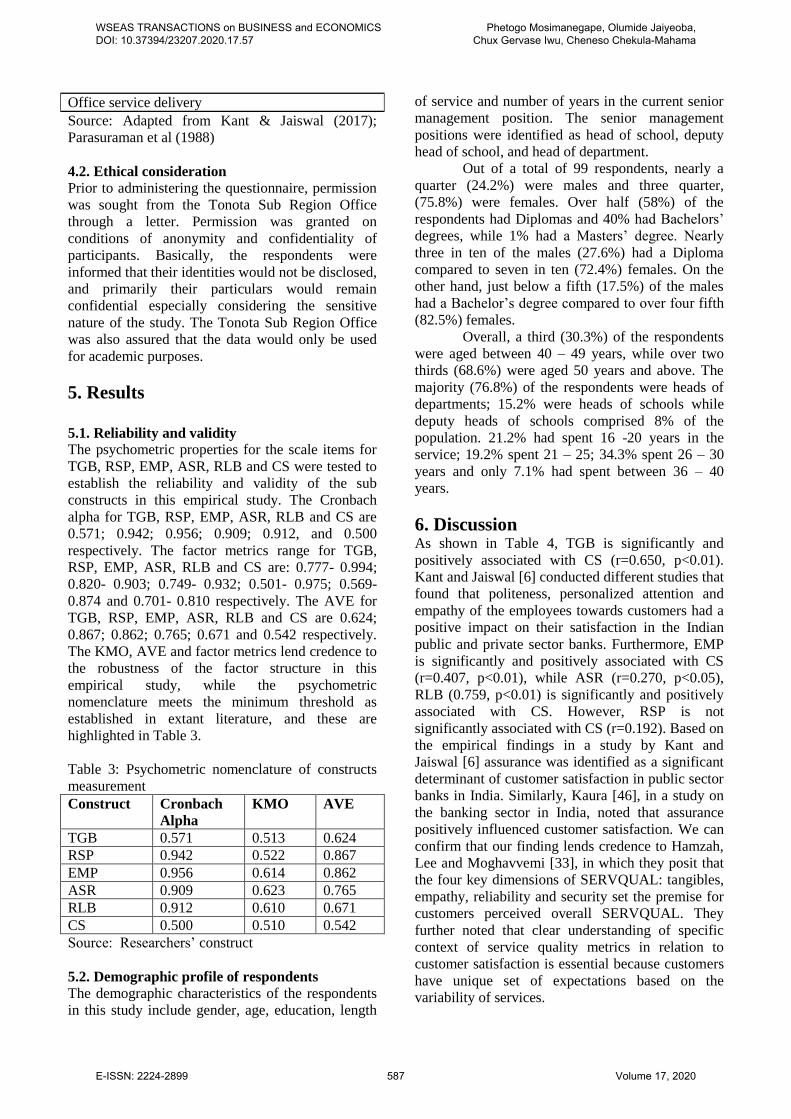
5.1. Reliability and validity
The psychometric properties for the scale items for
TGB, RSP, EMP, ASR, RLB and CS were tested to
establish the reliability and validity of the sub
constructs in this empirical study. The Cronbach
alpha for TGB, RSP, EMP, ASR, RLB and CS are
0.571; 0.942; 0.956; 0.909; 0.912, and 0.500
respectively. The factor metrics range for TGB,
RSP, EMP, ASR, RLB and CS are: 0.777- 0.994;
0.820- 0.903; 0.749- 0.932; 0.501- 0.975; 0.569-
0.874 and 0.701- 0.810 respectively. The AVE for
TGB, RSP, EMP, ASR, RLB and CS are 0.624;
0.867; 0.862; 0.765; 0.671 and 0.542 respectively.
The KMO, AVE and factor metrics lend credence to
the robustness of the factor structure in this
empirical study, while the psychometric
nomenclature meets the minimum threshold as
established in extant literature, and these are
highlighted in Table 3.
Table 3: Psychometric nomenclature of constructs
measurement
Construct Cronbach
Alpha
KMO AVE
TGB 0.571 0.513 0.624
RSP 0.942 0.522 0.867
EMP 0.956 0.614 0.862
ASR 0.909 0.623 0.765
RLB 0.912 0.610 0.671
CS 0.500 0.510 0.542
Source: Researchers’ construct
5.2. Demographic profile of respondents
The demographic characteristics of the respondents
in this study include gender, age, education, length
of service and number of years in the current senior
management position. The senior management
positions were identified as head of school, deputy
head of school, and head of department.
Out of a total of 99 respondents, nearly a
quarter (24.2%) were males and three quarter,
(75.8%) were females. Over half (58%) of the
respondents had Diplomas and 40% had Bachelors’
degrees, while 1% had a Masters’ degree. Nearly
three in ten of the males (27.6%) had a Diploma
compared to seven in ten (72.4%) females. On the
other hand, just below a fifth (17.5%) of the males
had a Bachelor’s degree compared to over four fifth
(82.5%) females.
Overall, a third (30.3%) of the respondents
were aged between 40 – 49 years, while over two
thirds (68.6%) were aged 50 years and above. The
majority (76.8%) of the respondents were heads of
departments; 15.2% were heads of schools while
deputy heads of schools comprised 8% of the
population. 21.2% had spent 16 -20 years in the
service; 19.2% spent 21 – 25; 34.3% spent 26 – 30
years and only 7.1% had spent between 36 – 40
years.
6. Discussion As shown in Table 4, TGB is significantly and
positively associated with CS (r=0.650, p<0.01).
Kant and Jaiswal [6] conducted different studies that
found that politeness, personalized attention and
empathy of the employees towards customers had a
positive impact on their satisfaction in the Indian
public and private sector banks. Furthermore, EMP
is significantly and positively associated with CS
(r=0.407, p<0.01), while ASR (r=0.270, p<0.05),
RLB (0.759, p<0.01) is significantly and positively
associated with CS. However, RSP is not
significantly associated with CS (r=0.192). Based on
the empirical findings in a study by Kant and
Jaiswal [6] assurance was identified as a significant
determinant of customer satisfaction in public sector
banks in India. Similarly, Kaura [46], in a study on
the banking sector in India, noted that assurance
positively influenced customer satisfaction. We can
confirm that our finding lends credence to Hamzah,
Lee and Moghavvemi [33], in which they posit that
the four key dimensions of SERVQUAL: tangibles,
empathy, reliability and security set the premise for
customers perceived overall SERVQUAL. They
further noted that clear understanding of specific
context of service quality metrics in relation to
customer satisfaction is essential because customers
have unique set of expectations based on the
variability of services.
WSEAS TRANSACTIONS on BUSINESS and ECONOMICS DOI: 10.37394/23207.2020.17.57
Phetogo Mosimanegape, Olumide Jaiyeoba, Chux Gervase Iwu, Cheneso Chekula-Mahama
E-ISSN: 2224-2899 587 Volume 17, 2020

Table 4: Nomological web between Tangibility,
Responsiveness, Empathy, Assurance, Reliability
and Customer Satisfaction in the Tonota Sub
District (Correlation Matrix)
Correlations
Custo
mer
Satisf
action
Tangi
bility
Respons
iveness
Emp
athy
Assu
rance
Relia
bility
Custom
er
Satisfac
tion
Pears
on
Corre
lation
1 .650** .192 .407**
.270* .759*
*
Sig.
(2-
tailed
)
.000 .073 .000 .011 .000
N 88 88 88 88 88 88
Tangibil
ity
Pears
on
Corre
lation
.650** 1 .349** .525**
.474*
*
.674*
*
Sig.
(2-
tailed
)
.000
.001 .000 .000 .000
N 88 88 88 88 88 88
Respons
iveness
Pears
on
Corre
lation
.192 .349** 1 -
.235*
-
.285*
*
.059
Sig.
(2-
tailed
)
.073 .001
.027 .007 .583
N 88 88 88 88 88 88
Empath
y
Pears
on
Corre
lation
.407** .525** -.235* 1 .989*
*
.885*
*
Sig.
(2-
tailed
)
.000 .000 .027
.000 .000
N 88 88 88 88 88 88
Assuran
ce
Pears
on
Corre
lation
.270* .474** -.285** .989**
1 .807*
*
Sig.
(2-
tailed
)
.011 .000 .007 .000
.000
N 88 88 88 88 88 88
Reliabil
ity
Pears
on
Corre
lation
.759** .674** .059 .885**
.807*
*
1
Sig.
(2-
tailed
)
.000 .000 .583 .000 .000
N 88 88 88 88 88 88
**. Correlation is significant at the 0.01 level (2-
tailed).
*. Correlation is significant at the 0.05 level (2-
tailed).
Source: Researchers’ construct
The nexus of relationship between tangibility,
responsiveness, empathy, assurance, reliability and
customer satisfaction as shown in Table 4 indicate
that TGB (β=0.300, t=6.18); RSP (β=0.373, t
=8.59); ASR (β=1.276, t=18.91); RLB (β= 1.606,
t=23.07). However, EMP is not significantly related
to CS in the Tonota sub district. Based on the
aforementioned, Hypotheses, H1, H2, H4 and H5
are supported in this empirical study, while
Hypothesis H3 is not supported. Similarly,
Frimpong and Wilson [47], in a study of the
influence of satisfaction dimensions on service
performance in Ghana, established that all the
dimensions predicted customer satisfaction.
Table 5: Nexus of relationship between Tangibility,
Responsiveness, Empathy, Assurance, Reliability
and Customer Satisfaction in Tonota Sub District
Coefficients
Model
Unstan
dardize
d
Coeffic
ients
Stand
ardize
d
Coeffi
cients
t
Si
g.
95.0%
Confi
dence
Interv
al for
B
Correlat
ions
Colline
arity
Statisti
cs
B
Std.
Erro
r Beta
Lo
we
r
Bo
un
d
Up
per
Bo
un
d
Ze
ro
-
or
de
r
Pa
rti
al
P
ar
t
Tole
ranc
e
VI
F
1 (Consta
nt)
8.1
60
.000
22
.0
1
.0
0
0
8.1
60
8.1
60
Tangibi
lity
.32
4
.000 .303 6.
18
.0
0
0
.32
4
.32
4
.6
50
1.0
00
.2
0
2
.445 2.
24
7
WSEAS TRANSACTIONS on BUSINESS and ECONOMICS DOI: 10.37394/23207.2020.17.57
Phetogo Mosimanegape, Olumide Jaiyeoba, Chux Gervase Iwu, Cheneso Chekula-Mahama
E-ISSN: 2224-2899 588 Volume 17, 2020

Respon
sivenes
s
.19
3
.000 .373 8.
59
.0
0
0
.19
3
.19
3
.1
92
1.0
00
.2
8
1
.568 1.
76
2
Assura
nce
.55
4
.000 1.276 18
.9
1
.0
0
0
.55
4
.55
4
.2
70
1.0
00
.6
1
9
.235 4.
25
4
Reliabil
ity
.59
0
.000 1.606 23
.0
7
.0
0
0
.59
0
.59
0
.7
59
1.0
00
.7
5
5
.221 4.
53
0
a. Dependent Variable: Customer satisfaction
Source: Researchers’ construct
Table 6: Measures for goodness of fit (measurement
model) CMIN DF P CMIN/DF NFI RFI IFI TLI CFI RMSEA
368.14 129 0.00 2.85 0.94 0.91 0.92 0.90 0.91 0.061
A confirmatory factor analysis (CFA) was
performed on the 24 items with respect to the
parsimonious model of service quality metrics and
customer satisfaction. Table 6 explicates the results
for the measurement model and it can be confirmed
that all goodness of fit measures is within the
threshold as postulated by Hair, Black, Babin and
Anderson [51]. The normed chi square (X2/df), NFI,
RFI, IFI, TLI and CFI are all above the threshold of
0.9 and the RMSEA is below the value of 0.08.
6.1 Convergent validity, discriminant validity
and composite trait reliability
As shown in Table 7, it is evident that the AVEs for
all the 6 constructs exceed 0.5 and range between
0.542 and 0.86, thus confirming convergent validity.
The divergent validity was also established as
shown in Table 7 in which the inter item
correlations which range between 0.289 and 0.536
are less than the lowest variance extracted (54.2%).
In addition, the composite trait reliability is between
0.500 to 0.942. Composite trait reliability could
therefore be confirmed in this empirical study.
Table 7: Average variance extracted, squared
interconstruct correlations and composite trait
reliability. Variabl
e
TGB RSP EMP ASR RLB CS
TGB 0.624
*
RSP 0.536 0.867
*
EMP 0.347 0.473 0.862
*
ASR 0.424 0.381 0.415 0.765
*
RLB 0.370 0.297 0.325 0.386 0.671
*
CS 0.289 0.321 0.296 0.292 0.474 0.542
* Composite
Trait
Reliability
0.571 0.942 0.956 0.909 0.912 0.500
AVE reflected diagonally and squared
correlations below AVE.
With respect to structured model assessment in
Table 8, the NFI, RFI, IFI, TLI and CFI are all
within the 0.90 threshold and RMSEA is below the
value of 0.08 which indicates the goodness of fit as
postulated in extant literature by Hair, et al [51].
Table 8: Measures for goodness of fit (Structured
model) CMIN DF P CMIN/DF NFI RFI IFI TLI CFI RMSEA
426.12 124 0.00 3.44
0.94 0.89 0.92 0.90 0.97 0.05
Table 9: Summary of Findings
H1 TGB/CS Supported
H2a RSP/CS Supported
H2b EMP/CS Rejected
H2c ASR/CS Supported
H2d RLB/CS Supported
Source: Researchers’ construct
7. Implications of our findings It is common knowledge that satisfying customers –
private or public - can be a challenging task. The
public sector gets more criticism anyhow. The spate
of service delivery protests in Southern Africa for
instance is testament to the degree of desperation
and unhappiness that citizens experience with
respect to service delivery rating of government.
Therefore, understanding customer satisfaction in
the public service is important for managers to
devise initiatives that meet customers’ needs so as to
improve public trust on government programs. This
could kindle some sort of impetus on employees to
support public service delivery initiatives. Even
though customer satisfaction is increasingly used to
measure the quality of provision of public sector
goods and services, this study reinforces the utility
of SERVQUAL dimensions in gauging the nature
and extent of service quality in the public sector
generally and in Botswana specifically.
While the results show that respondents
ranked tangibility higher than empathy, assurance,
and responsiveness respectively in terms of
contributing towards customer satisfaction, the
results also identified poor information
management, poor ICT equipment, poor handling of
customers’ grievances, and unwillingness to go an
extra mile to help customers as limiting the ability
of government to sufficiently deliver required
WSEAS TRANSACTIONS on BUSINESS and ECONOMICS DOI: 10.37394/23207.2020.17.57
Phetogo Mosimanegape, Olumide Jaiyeoba, Chux Gervase Iwu, Cheneso Chekula-Mahama
E-ISSN: 2224-2899 589 Volume 17, 2020

services to citizens. In fact, some of the complaints
linked failure to provide services within promised
time limit and poor customer feedback as key to
public service customer satisfaction. After all,
public service is the system for providing
government programs and projects to meet citizens’
welfare using government organizations tasked to
deliver goods and services to meet citizens or
customers’ needs based on established norms.
Significant implications of this study’s
findings beyond adding to the discussions on
customer service quality and customer satisfaction
include the identification of the need for training of
employees on managing customer complaints,
record management and increasing service
reliability amongst others to improve service
quality. Added to this is the call to use this study as
a guide to formulate customer satisfaction strategies
and policies aligned to service standards to drive
service quality delivery. Essentially, as we have
found in this study, the SERVQUAL model
continues to revel in its capacity to help services
managers improve performance in a number of
areas as has been suggested by the likes of Alzaydi
et al, [37] and Wisniewki [40]. This, as we have
found in this study, can provide service managers
with diagnostic support to drive continuous
improvements required to meet customer needs. The
gap scores as illustrated in our study can assist
service managers in assessing current service quality
as well as quantify gaps and taking action.
The dimensions of service quality provide
the immense opportunity to assess the extent to
which customers are satisfied or dissatisfied with
the goal of instituting appropriate interventions. The
obvious implication of this finding is the need for
continuous training and development of managers of
public service offices and programs in the art of
understanding and using service quality dimensions
to assess how sufficiently they are supporting and
satisfying their customers.
There are equally some scholarly
implications. First is our acknowledgment of the
limitation of this study, which offers a new vista for
research opportunities in the subject matter and in
Botswana. The first limitation is our use of the
quantitative method in collecting data. The
quantitative approach to collecting data can be
limiting in the sense that it does not allow for
opportunities for intimate expression of feelings and
experience. The utility of the Likert scale only
allows for responses to prepared questions hence
participants are not able to properly disclose or
express their real life experiences. In this regard,
future research on the subject within Botswana may
best deploy a mixed methods approach to derive
rather generalizable conclusions.
Speaking of generalizable conclusions, we
are wary of another shortcoming of this study and
that is that our study only considered basic school
management teams comprising school heads, deputy
school heads and heads of departments and
managers within a sub-regional education office in
Tonota, Botswana. While there is a likelihood that
the experience of the management teams in Tonota
may be reflective of the experiences of other
management teams in other regions, we are hesitant
to suggest that our findings may be generalized. In
addition, the hypotheses have only been tested in the
public service of Botswana which limits the external
validity of the results. Based on the foregoing, one
should be cautious in generalizing the findings
across other industry, sector or countries. Equally
of concern is the number of participants in this
study. Perhaps, a larger sample could realize a
different result. Therefore, a future study may
consider other regions using the mixed methods
approach, a larger sample and perhaps an extensive
and rigorous statistical method. Furthermore, other
dimensions of SERVQUAL such as trust,
commitment, adaptation, communication,
cooperation as suggested by Shin, Thai and Yuen
[22] could be proposed in order to explicate the
nomological web of psychometric competence of
the factor structure. Future research could also
examine numerous industries to set the premise for
generalizations and representativeness. Service
quality metrics for the private and public sector
could also be compared most especially as
Botswana seeks to transform its economy from
mineral-led to knowledge based economy.
8. Conclusions We set out to examine the extent to which
dimensions of service quality influence customer
satisfaction in the Tonota Sub Region using a
questionnaire, which facilitated the collection of
data from 135 respondents from 27 basic education
facilities and we found that service quality
dimensions of tangibility, empathy, assurance and
responsiveness impact customer satisfaction
positively. But, these findings are not enough. We
declare this on the basis of the continued
dissatisfaction of customers regarding public sector
service delivery standards. Despite the Botswana’s
governments interventions namely the National
Productivity Program, Work Improvement Teams
Strategy (WITS), decentralization and a
Performance Management System (PMS) to address
concerns over public service delivery, this study
WSEAS TRANSACTIONS on BUSINESS and ECONOMICS DOI: 10.37394/23207.2020.17.57
Phetogo Mosimanegape, Olumide Jaiyeoba, Chux Gervase Iwu, Cheneso Chekula-Mahama
E-ISSN: 2224-2899 590 Volume 17, 2020

insists that the government of Botswana and several
others will continue to experience service delivery
displeasures unless a proper establishment and
uptake of training programs by the government and
its employees; the establishment of reward and
incentive programs for excellent performance as
well as a continuous review of service quality
standard programs take place.
References:
[1] Jenkins, W. (2009). Sustainability theory
Berkshire encyclopedia of sustainability: the spirit
of sustainability, 380-384.
[2] Iwu, CG. (2018) The sustainability of small or
medium enterprises growth in emerging markets. In
Proceedings of the International Conference on
Business and Management Dynamics (ICBMD),
213-221.
[3] Pizam, A., Shapoval, V; and Ellis, T. (2016)
Customer satisfaction and its measurement in
hospitality enterprises: a revisit and update,
International Journal of Contemporary Hospitality
Management, 28(1) 2-35,
https://doi.org/10.1108/IJCHM-04-2015-0167.
[4] Makanyeza, C and Chikazhe, L. (2017)
Mediators of the relationship between service
quality and customer loyalty: Evidence from the
banking sector in Zimbabwe, International Journal
of Bank Marketing, 35(3) 540-556,
https://doi.org/10.1108/IJBM-11-2016-0164.
[5] Paul, J., Mittal, A. and Srivastav, G. (2016)
Impact of service quality on customer satisfaction in
private and public sector banks, International
Journal of Bank Marketing, 34(5) 606-622,
https://doi.org/10.1108/IJBM-03-2015-0030.
Accessed 28/02/2018.
[6] Kant, R and Jaiswal, D. (2017) The impact of
perceived service quality dimensions on customer
satisfaction: An empirical study on public sector
banks in India, International Journal of Bank
Marketing, 35 (3) 411-430,
https://doi.org/10.1108/IJBM-04-2016-0051.
[7] Hui, E. C. M., and Zheng, X. (2010) Measuring
customer satisfaction of FM service in housing
sector: A structural equation model approach,
Facilities, 28(5/6) 306-320,
https://doi.org/10.1108/02632771011031538.
[8] Kealesitse, B., O’Mahony, B., Lloyd-Walker, B.,
and Jay-Polonsky, M. (2013) Developing customer-
focused public sector reward schemes: Evidence
from the Botswana government's performance-based
reward system (PBRS). International Journal of
Public Sector Management, 26 (1), 33-55
https://doi.org/10.1108/09513551311293426.
[9] Nkwe, N. E-Government: Challenges and
Opportunities in Botswana, (2012) International
Journal of Humanities and Social Science, 2 (17).
[10] Ramakele, M and Koloi-Keaikitse, S. (2016)
Analysis of performance management system as an
appraisal tool used in Botswana colleges of
education. Mosenodi Journal,19(1) 86 – 105.
[11] Alam-Siddiquee, N, (2008) Service delivery
innovations and governance: The Malaysian
experience, Transforming Government: People,
Process and Policy, 2(3) 2 194-213,
https://doi.org/10.1108/17506160810902194.
[12] Ali, F., Dey, B.L., and Filieri, R. (2015) An
assessment of service quality and resulting customer
satisfaction in Pakistan International Airlines:
Findings from foreigners and overseas Pakistani
customers, International Journal of Quality &
Reliability Management, 32(5) 486-502,
https://doi.org/10.1108/IJQRM-07-2013-0110.
[13] Wu, H.C. (2014) The effects of customer
satisfaction, perceived value, corporate image and
service quality on behavioural intentions in gaming
establishments, Asia Pacific Journal of Marketing
and Logistics, 26(4),540-565.
https://doi.org/10.1108/APJML-03-2014-0049.
Accessed on 28/04/2018.
14] National Human Resource Development
Strategy (NHRDS:2009-2022): Realising Our
Potentials: Republic of Botswana: Ministry of
Education and Skills Development.
[15] World Economic Forum, (2019). Global
Competitiveness Report.
[16] Hope, K.P.S. (1995) Managing the public
sector in Botswana: Some emerging constraints and
the administrative reform responses, International
Journal of Public Sector Management, 8(6), 51-62
https://doi.org/10.1108/09513559510100024.
[17] Matambo, O.K. (2015) Budget Speech,
Ministry of Finance and Development Planning,
WSEAS TRANSACTIONS on BUSINESS and ECONOMICS DOI: 10.37394/23207.2020.17.57
Phetogo Mosimanegape, Olumide Jaiyeoba, Chux Gervase Iwu, Cheneso Chekula-Mahama
E-ISSN: 2224-2899 591 Volume 17, 2020

Republic of Botswana, Government Printers,
Gaborone.
[18] Botlhale, E, (2017), Enhancing public project
implementation in Botswana during the NDP 11
period. Africa’s public service delivery and
performance review, 5(1) 163.
https://doi.org/10.4102/apsdpr.v5i1.163
[19] NDP 11. National Development Plan 11, April
2017 – March 2023. (2016); 1. Government
Printers. Gaborone.
[20] Jaiyeoba, O.O., Chimbise, T.T., Makanyeza,
C., and Iwu, C.G (2018a). Distribution efficiency of
e-services in the health insurance sector: the case of
Botswana, Journal of Distribution Science, 16(5) 5-
15.
[21] Yuen, K., and Thai, V., (2017) The influence of
Supply chain integration on operational
performance: a comparison between product and
service supply chains., International Journal of
Logistics Management, 28(2), 444-463.
[22] Shin, T.V., and Yuen, K.F. (2018) The impact
of supply chain performance in the maritime
logistics industry in light of firm characteristics, The
International Journal of Logistics Management,
29(3) 1077-1097.
[23] Daily News (2018). In our quest to improve
service delivery within public service, we pledge the
following to our customers. Botswana Daily News,
071, 13
[24] Oludele, A. A., Emilie, C. K., and Mandisa, P.
M. (2012) An analysis of citizen satisfaction with
public service delivery in the Sedibeng district
municipality of South Africa, International Journal
of Social Economics, 39(3) 182-199,
https://doi.org/10.1108/03068291211199350.
[25] Izogo, E.E.,and Ogba, I.E.(2015) Service
quality customer satisfaction and loyalty in
automobile repair services sector, International
Journal of Quality & Reliability Management,
32(3) 250-269, https://doi.org/10.1108/IJQRM-05-
2013-0075.
[26] Jain, P. (2005) Strategic human resource
development in the public libraries in Botswana,
Library Management, 26 (6/7) 2005; 336-350,
https://doi.org/10.1108/01435120410609752.
[27] Bellingkrodt, S., and Wallenburg, C. M. (2015)
The role of customer relations for innovativeness
and customer satisfaction: a comparison of service
industries, The International Journal of Logistics
Management, 26(2), 254-274,
https://doi.org/10.1108/IJLM-06-2012-0038.
[28] Chodzaza, G. E., and Gombachika, H. S. H.
(2013) Service quality, customer satisfaction and
loyalty among industrial customers of a public
electricity utility in Malawi, International Journal of
Energy Sector Management, 7(2) 269-282,
https://doi.org/10.1108/IJESM-02-2013-0003.
[29] Jaiyeoba, O.O., Chimbise, T.T., Roberts-
Lombard, M. (2018) E-service usage and
satisfaction in Botswana, African Journal of
Economic and Management Studies, 9(1), 1, 2-13,
https://doi.org/10.1108/AJEMS-03-2017-0061.
[30] Fishbein,M., and Ajzen,I., (1975) Belief,
Attitude, Intention and Behaviour: An introduction
to Theory and Research, ARRB Group. Victoria.
[31] Meskaran, F., Isamil, Z., and Shanmugam, B.,
(2015) Online purchase intention: effects of trust
and security perception, Australian Journal of Basic
and Applied Sciences, 17(6), 307-315.
[32] Tsoukatos, E., and Mastrojianni, E, (2010) Key
determinants of service quality in retail banking,
Euromed Journal of Business, 5(1) 85-100.
[33] Hamzah, Z.L, Lee, S.P., and Moghavvemi, S
(2016), Elucidating perceived overall service quality
in retail banking, International Journal of Bank
Marketing, 35(5), 781-804.
[34] Lee, S.P., and Moghavvemi, S, (2015) The
dimension of service quality and its impact on
customer satisfaction, trust and Loyalty: Case of
Malaysian Banks, Asian Journal of Business and
Accounting, 8(2)., 91-121.
[35] Daniels, K.T.,and Nicholas, R. (2013)
Determinants of customer loyalty in Kenya: does
corporate image play a moderating role? The TQM
Journal, 25(5) 473-491,
https://doi.org/10.1108/TQM-11-2012-0102.
[36] Jamali, D. (2007) A study of customer
satisfaction in the context of a public private
partnership, International Journal of Quality &
Reliability Management, 24(4) 370-385,
https://doi.org/10.1108/02656710710740545.
WSEAS TRANSACTIONS on BUSINESS and ECONOMICS DOI: 10.37394/23207.2020.17.57
Phetogo Mosimanegape, Olumide Jaiyeoba, Chux Gervase Iwu, Cheneso Chekula-Mahama
E-ISSN: 2224-2899 592 Volume 17, 2020

[37] Alzaydi, Z.M., Ali-Hajla, A., Nguyen, B., and
Jayawardhena, C. (2018) A review of service
quality and service delivery: Towards a customer
co-production and customer-integration approach,
Business Process Management Journal, 24(1) 295-
328, https://doi.org/10.1108/BPMJ-09-2016-0185.
[39] Parasuraman, A., Zeithaml, V.A. and Berry,
L.L. (1988) Servqual: A multiple-item scale for
measuring consumer perceptions of service quality.
Journal of Retailing, 1988, 64(1), 12.
[40] Wisniewki, M. (2001) Using SERVQUAL to
assess customer satisfaction with public sector
services, Managing Service Quality: An
International Journal, 11(6) 380-388,
https://doi.org/10.1108/EUM0000000006279.
[41] Andrews, D., and Turner, S. (2017) Improving
the customer experience through consistency and
effective service delivery in the United Kingdom
public house sector, British Food Journal, 119(3)
Vol. 119 587-599, https://doi.org/10.1108/BFJ-07-
2016-0326.
[42] Brysland, A., and Curry, A. (2001) Service
improvements in public services using
SERVQUAL, Managing Service Quality: An
International Journal, 11(6) 389-401,
https://doi.org/10.1108/09604520110410601.
[43] Thapisa, A.P.N.,and Gamini, V. (1999)
Perceptions of quality service at the University of
Botswana Library: what Nova says, Library
Management, 20(7) , 373-383,
https://doi.org/10.1108/01435129910285145.
[44] Silvestri, C., Aquilani, B. and Rugieri, A.
(2017) Service quality and customer satisfaction in
thermal tourism, The TQM Journal, 29(1) 55-81,
https://doi.org/10.1108/TQM-06-2015-0089.
[45] Bittencourt O, Verter V, and Yalovsky M.
(2018) Hospital capacity management based on the
queueing theory. International Journal of
Productivity and Performance Management, 67(2),
224-38. https://doi.org/10.1108/IJPPM-12-2015-
0193.
[46] Kaura, V. (2013) Antecedents of customer
satisfaction: a study of Indian public and private
sector banks, International Journal of Bank
Marketing, 31(3) 167-186,
https://doi.org/10.1108/02652321311315285.
Accessed on 07/06/2018
[47] Frimpong, K., and Wilson, A. (2013) Relative
importance of satisfaction dimensions on service
performance: A developing country context, Journal
of Service Management, 24(4) 401-419,
https://doi.org/10.1108/JOSM-07-2012-0151.
[48] Whyte, G and Bytheway, A. (2017) The V-
model of service quality: An African case study,
European Journal of Marketing, 51(5/6) 923-945,
https://doi.org/10.1108/EJM-05-2015-0270.
[49] Biscaia, A. R., Rosa, M.J., Moura, E.S.P., and
Sarrico, C.S. (2017) Assessing customer satisfaction
and loyalty in the retail sector, International Journal
of Quality & Reliability Management, 34(9) 1508-
1529, https://doi.org/10.1108/IJQRM-03-2015-
0039.
[50] Russell, E.W and Bvuma, D. G. (2001)
Alternative service delivery and public service
transformation in South Africa, International Journal
of Public Sector Management, 14(3) 241-265,
https://doi.org/10.1108/09513550110390819.
[51] Hair, J.F., Black,W.C., Babin,B.J., Anderson,
R.E.,(2014) Multivariate Data Analysis, 7th
Edition., Pearson, Harlow,
Creative Commons Attribution License 4.0
(Attribution 4.0 International , CC BY 4.0)
This article is published under the terms of the
Creative Commons Attribution License 4.0
https://creativecommons.org/licenses/by/4.0/deed.en
_US
WSEAS TRANSACTIONS on BUSINESS and ECONOMICS DOI: 10.37394/23207.2020.17.57
Phetogo Mosimanegape, Olumide Jaiyeoba, Chux Gervase Iwu, Cheneso Chekula-Mahama
E-ISSN: 2224-2899 593 Volume 17, 2020

![ACCOUNTANCY EXAMINING BOARD[193A]](https://static.fdokumen.com/doc/165x107/6323acc9be5419ea700eb5e1/accountancy-examining-board193a.jpg)