Examining contextual and nonlinear associations between the ...
115
Examining contextual and nonlinear associations between the living environment and life satisfaction DISSERTATION SUBMITTED TO THE FACULTY OF THE UNIVERSITY OF MINNESOTA BY XINYI WU IN PARTIAL FULFILLMENT OF THE REQUIREMENTS FOR THE DEGREE OF DOCTOR OF PHILOSOPHY Professor Jason Cao, Advisor May 2021
-
Upload
khangminh22 -
Category
Documents
-
view
2 -
download
0
Transcript of Examining contextual and nonlinear associations between the ...

Examining contextual and nonlinear associations
between the living environment and life satisfaction
DISSERTATION SUBMITTED TO THE FACULTY OF THE
UNIVERSITY OF MINNESOTA
BY
XINYI WU
IN PARTIAL FULFILLMENT OF THE REQUIREMENTS
FOR THE DEGREE OF
DOCTOR OF PHILOSOPHY
Professor Jason Cao, Advisor
May 2021

© Copyright 2021
Xinyi Wu

i
Acknowledgements
I would like to express the deepest sense of gratitude to my advisor, Professor Jason Cao.
He was the one who offered me this precious opportunity to study in a wonderful Ph.D.
program. He has been dedicating an enormous amount of hours and effort to educate and
support me. He offers guidance and encouragement when I need them the most. He is
also considerate and patient at the same time. I have always looked up to his diligence,
which inspires me to pursue higher career goals. I am extremely thankful for his
nurturing throughout my Ph.D. trajectory. I would never have come this far without his
help and support.
I am so grateful for the support from Professor Yingling Fan. Her fascinating work
inspired me to conduct research on subjective well-being. She offered me large amounts
of help and encouragement throughout the process of developing my dissertation. Her
intelligence and dedication motivate me to keep moving forward along the academic
career path.
A special thank goes to Professor Greg Lindsey, with whom I worked as a research
assistant during my master’s study. My work with him introduced me to the beauty of
academic research and drove me to pursue a Ph.D. degree. I would also like to thank
Professor Edward Goetz and Professor Susan Handy for the time and effort they spent
serving on my dissertation committee.
I would like to thank my friends and colleagues. They provided me with not only
valuable work-related insights but also precious emotional support. The help and
encouragement I received from them are truly priceless.
Finally, I would like to thank my families. My mom and dad, despite being on the other
side of the globe, have been giving me unconditional love. They miss my company very
much, yet they still support my dream. I owe a debt of gratitude to all the love they have
given me. I would also love to thank my better half, Zhenming. As a Ph.D. student
himself, he resonates with my struggle and has offered me an immeasurable amount of
emotional support. I am so grateful to have such a caring partner during this process of
developing my dissertation.

ii
Abstract
Planners have long sought to reveal how the living environment, including housing and
neighborhood, influences individuals’ satisfaction with life and other domains. Despite
the great contribution made by planning scholars, the literature falls short in several
major topics. This dissertation addresses these issues with three empirical studies.
The literature implies that the same living environment elements could have distinctive
associations with different types of satisfaction outcomes (e.g., life satisfaction vs.
neighborhood satisfaction). However, most studies examine the correlates of only one
type of satisfaction and do not compare those of multiple types of satisfaction. Chapter 2
fills this gap and compares neighborhood associates of neighborhood satisfaction and life
satisfaction. Many features show different relationships with the two types of
satisfaction. Specifically, neighborhood satisfaction reacts more strongly to physical
features and appearances of the neighborhood, whereas life satisfaction has stronger
associations with social cohesions and leisure amenities.
Moreover, the correlates of life satisfaction tend to differ across contexts, but the
discussion on contexts is severely lacking in related research. Chapters 3 and 4 add to the
understanding of the role contexts play. Chapter 3 compares neighborhood correlates of
life satisfaction in higher-income and lower-income neighborhoods. In general, residents

iii
of lower-income neighborhoods value attributes related to basic needs (such as safety and
air quality) more, whereas access to leisure and educational facilities carries more weight
in higher-income neighborhoods. Chapter 4 compares the relationships of a set of living
environment variables with life satisfaction in the Twin Cities, U.S. and Guangzhou,
China. The findings show that the living environment has a substantially larger
association with life satisfaction in Guangzhou than in the Twin Cities. Compared with
Guangzhou residents, residents living in the Twin Cities associate life satisfaction more
with socioeconomic status and their defining characteristics.
Finally, many studies are built on the assumption that living environment attributes are
linearly correlated with life satisfaction. An increasing number of empirical findings
have implied that satisfaction may react to its correlates in a nonlinear manner. This
nonlinearity is still in need of discussion. This dissertation tests the presence of
nonlinearity and all three empirical studies show prevalent nonlinear relationships
between living environment attributes and satisfaction.
Based on the empirical results, this dissertation highly recommends that researchers
establish a holistic conceptual framework to connect the living environment, life
satisfaction, and relevant domain satisfaction, conduct mixed-method studies, and test the
generalizability of specific findings in future studies. It also encourages planners to
consider nonlinearity in practice and make policy decisions based on localized evidence
instead of predetermined standards.

iv
Table of Contents
Acknowledgements .......................................................................................................................... i
Abstract ........................................................................................................................................... ii
Table of Contents ........................................................................................................................... iv
Chapter 1 Introduction .................................................................................................................. 1
Chapter 2 How Do Neighborhood Features Affect Satisfaction? .............................................. 8
2.1 Introduction .......................................................................................................................... 8
2.2 Literature Review ............................................................................................................... 10
2.3 Data and Method ................................................................................................................ 14
2.3.1 Data ............................................................................................................................... 14
2.3.2 Method .......................................................................................................................... 17
2.4 Results and Discussion ....................................................................................................... 19
2.4.1 Correlates of neighborhood satisfaction .................................................................... 20
2.4.2 Correlates of life satisfaction ...................................................................................... 23
2.4.3 Discussion ..................................................................................................................... 26
2.5 Conclusion ........................................................................................................................... 32
Chapter 3 What Affects Life Satisfaction of Residents in Neighborhoods with Different
Income Levels? .............................................................................................................................. 35
3.1 Introduction ........................................................................................................................ 35
3.2 Literature Review ............................................................................................................... 37
3.2.1 Neighborhood correlates of life satisfaction under various contexts ...................... 37
3.2.2 The Nonlinearity of Satisfaction ................................................................................. 41
3.3 Data and Methods ............................................................................................................... 43
3.3.1 Data ............................................................................................................................... 43
3.3.2 Methods ........................................................................................................................ 47
3.4 Results and discussion ........................................................................................................ 51
3.4.1 Relative Influences ...................................................................................................... 51

v
3.4.2 Impact-Asymmetry Analysis ...................................................................................... 57
3.5 Conclusion ........................................................................................................................... 63
Chapter 4 Does Context Matter? A Comparison Study of the Living Environment and Life
Satisfaction in the U.S. and China. .............................................................................................. 66
4.1 Introduction ........................................................................................................................ 66
4.2 Literature Review ............................................................................................................... 69
4.2.1 Life Satisfaction across Contexts ................................................................................ 69
4.2.2 Impacts of the Living Environment on Life Satisfaction ......................................... 71
4.3 Research Design .................................................................................................................. 74
4.3.1 Data and Variables ...................................................................................................... 74
4.3.2 Methodology ................................................................................................................. 77
4.4 Results and Discussion ....................................................................................................... 79
4.4.1 Results ........................................................................................................................... 79
4.4.2 Discussion ..................................................................................................................... 82
4.5 Conclusion ........................................................................................................................... 87
Chapter 5 Conclusion ................................................................................................................... 89
Bibliography .................................................................................................................................. 94
Appendix ...................................................................................................................................... 103

vi
List of Figures
Figure 1 The mechanism of satisfaction ........................................................................................... 4
Figure 2 Selected Study Neighborhoods ......................................................................................... 16
Figure 3 The Associations between Selected Neighborhood Attributes and Neighborhood
Satisfaction ..................................................................................................................................... 23
Figure 4 The Associations between Selected Neighborhood Attributes and Life Satisfaction ....... 26
Figure 5 Study Areas ....................................................................................................................... 44
Figure 6 Neighborhood Attributes in Hierarchy of Humen Needs .................................................. 46
Figure 7 Influence pattern of IAA Factors ....................................................................................... 50
Figure 8 Illustration of Impact Asymmetry Analysis ....................................................................... 58
Figure 9 Study Areas in the Twin Cities ........................................................................................... 75
Figure 10 Study Areas in Guangzhou .............................................................................................. 76
Figure 11 Partial Dependence Plots for Living Environment Variables in the Twin Cities Model ... 81
Figure 12 Partial Dependence Plots for Living Environment Variables in the Guangzhou Model .. 82
Figure 13 Correlation between life satisfaction and income .......................................................... 86
vii
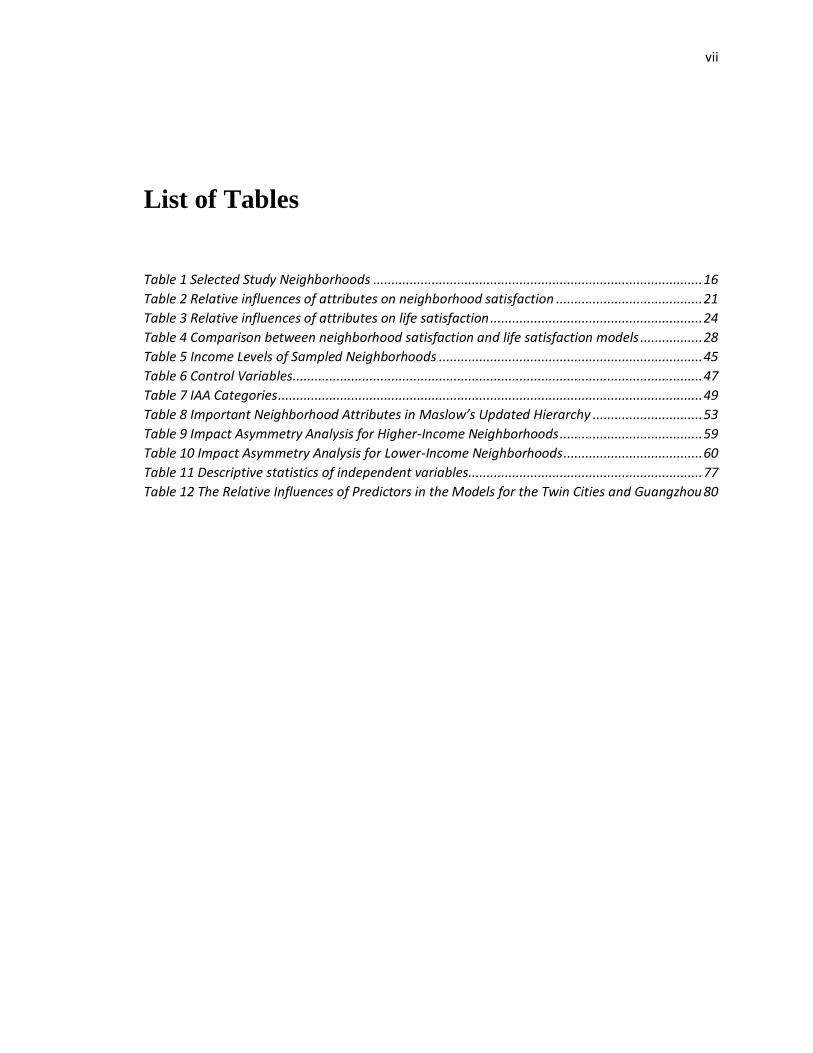
List of Tables
Table 1 Selected Study Neighborhoods .......................................................................................... 16
Table 2 Relative influences of attributes on neighborhood satisfaction ........................................ 21
Table 3 Relative influences of attributes on life satisfaction .......................................................... 24
Table 4 Comparison between neighborhood satisfaction and life satisfaction models ................. 28
Table 5 Income Levels of Sampled Neighborhoods ........................................................................ 45
Table 6 Control Variables ................................................................................................................ 47
Table 7 IAA Categories .................................................................................................................... 49
Table 8 Important Neighborhood Attributes in Maslow’s Updated Hierarchy .............................. 53
Table 9 Impact Asymmetry Analysis for Higher-Income Neighborhoods ....................................... 59
Table 10 Impact Asymmetry Analysis for Lower-Income Neighborhoods ...................................... 60
Table 11 Descriptive statistics of independent variables................................................................ 77
Table 12 The Relative Influences of Predictors in the Models for the Twin Cities and Guangzhou 80

1
Chapter 1
Introduction
It is well known that people’s subjective well-being (SWB) correlates with the condition
of their living environments (Evans, Wells, & Moch, 2003; Ma, Dong, Chen, & Zhang,
2018). This dissertation integrates an advanced modeling technique (gradient boosting
decision trees) and a recently developed theoretical framework (impact asymmetry
analysis) to examine living environment correlates of life satisfaction and neighborhood
satisfaction across different contexts. The goals are to offer a novel understanding of the
connections and provide nuanced implications for neighborhood planning.
SWB is composed of two aspects: the cognitive aspect and the affective aspect. The
cognitive aspect refers to the judgment and evaluation of one’s living quality, such as
marital satisfaction, job satisfaction, and life satisfaction. The affective aspect refers to
the momentary assessment of one’s emotions such as happiness and unhappiness (Diener,
1984). In this dissertation, I use life satisfaction, the cognitive aspect of SWB, as the
indicator of well-being (Diener & Seligman, 2002). Life satisfaction is the global
evaluation of one’s living quality. Compared with the affective aspect of SWB, life
2
satisfaction is more stable and less prone to the impact of sudden events or emotions
(Huebner, Suldo, & Gilman, 2006). This relatively perpetual nature of life satisfaction
corresponds with the temporal horizon of urban planning: what a community or
neighborhood will look like in the next 20 years or later. Life satisfaction is also a
broader topic that relates to various life domains such as job, health, and community
(Pavot & Diener, 2008). This broadness helps offer a holistic depiction of one’s living
quality. Furthermore, neighborhood satisfaction, the global cognitive evaluation of the
living environment, is a vital component of life satisfaction.
High life satisfaction is beneficial to various aspects of human lives. Many studies have
shed light on the linkages between high life satisfaction and improved health conditions
such as reduced risks of health conditions (Siahpush, Spittal, & Singh, 2008) and
increased longevity (Xu & Roberts, 2010). Moreover, high life satisfaction promotes
thriving social lives such as good social networks and stable marital status (Diener &
Seligman, 2002; Pavot & Diener, 2008). There is also evidence for the positive
association between life satisfaction and educational performances (Antaramian, 2015;
Renshaw & Cohen, 2014).
Because of the benefits of life satisfaction, many researchers have been exploring
programs and strategies to improve people’s life satisfaction. Among the various
domains of life satisfaction, the living environment, including the housing and
neighborhood, plays an essential role. The literature has shown that many aspects of
housing, including homeownership (Cheng, King, Smyth, & Wang, 2016), physical
conditions (Clapham, Foye, & Christian, 2018), and housing sizes (Zhang, Zhang, &
Hudson, 2018), are correlated with residents’ life satisfaction. Neighborhood conditions,

3
such as the sense of community (Prezza, Amici, Roberti, & Tedeschi, 2001),
neighborhood design (Mason, 2010), and greenness (Akers et al., 2012), also have
significant associations with life satisfaction. For a comprehensive list of housing and
neighborhood conditions explored in the literature, please refer to appendix A in Lovejoy,
Handy, and Mokhtarian (2010), Table 1 in Cao, Hao, Yang, Yin, and Huang (2020), and
Table 1 in Abidin, Abdullah, Basrah, and Alias (2019).
This dissertation sheds further light on the correlation between the living environment
and life satisfaction. To measure the quality of the living environment, I use residents’
subjective assessments of (or satisfaction with) specific attributes of their neighborhoods
and housing conditions. Compared with objective measures or perceived measures of the
living environment, the assessment measures have a more direct connection with the
satisfaction outcome. According to Campbell, Converse, and Rodgers (1976), objective
conditions of living environment characteristics are the sources of the cognitive and
evaluative processes mentioned above (Figure 1). Because of the variation of personal
experiences, the perceptions of these objective characteristics differ among residents.
Perceptions lead to different assessments of neighborhood characteristics by residents
because of their different personal characteristics and internal standards of comparison.
The standards of comparison further correlate with culture and social norms that different
households are accustomed with (Morris & Winter, 1975). Due to the divergence in
standards of comparison, similar perceptions could lead to opposite assessments. It is the
assessment that directly connects with the satisfaction outcome. Therefore, this
dissertation uses residents’ satisfaction with living environment elements as the

4
independent variables. In later chapters, all the living environment variables refer to
respondents’ self-reported satisfaction with them unless otherwise stated.
Figure 1 The mechanism of satisfaction (Adapted from Campbell, Converse, and Rodgers (1976))
Many studies have explored the impacts of neighborhood attributes on a specific type of
satisfaction such as life satisfaction or neighborhood satisfaction (Cummins, 2005; Hur,
Nasar, & Chun, 2010), but few have examined multiple satisfaction outcomes
simultaneously. The same neighborhood attribute may have distinctive impacts on
different satisfaction outcomes. For example, attributes that are futile to neighborhood
satisfaction could show substantial effects on life satisfaction, and vice versa (Ciorici &
Dantzler, 2018; Lovejoy et al., 2010; Senlier, Yildiz, & Aktaş, 2009; Vemuri, Morgan
Grove, Wilson, & Burch Jr, 2011). The importance of such attributes could have been
neglected if only one type of satisfaction outcomes was examined, leading to false
planning implications.
Furthermore, a limited number of studies have explored the role different contexts play in
the connection between the living environment and life satisfaction. It is known that the
same living environment attributes could have distinctive influences on life satisfaction in
different geographic areas (Yang, 2008). However, most studies on the relationships
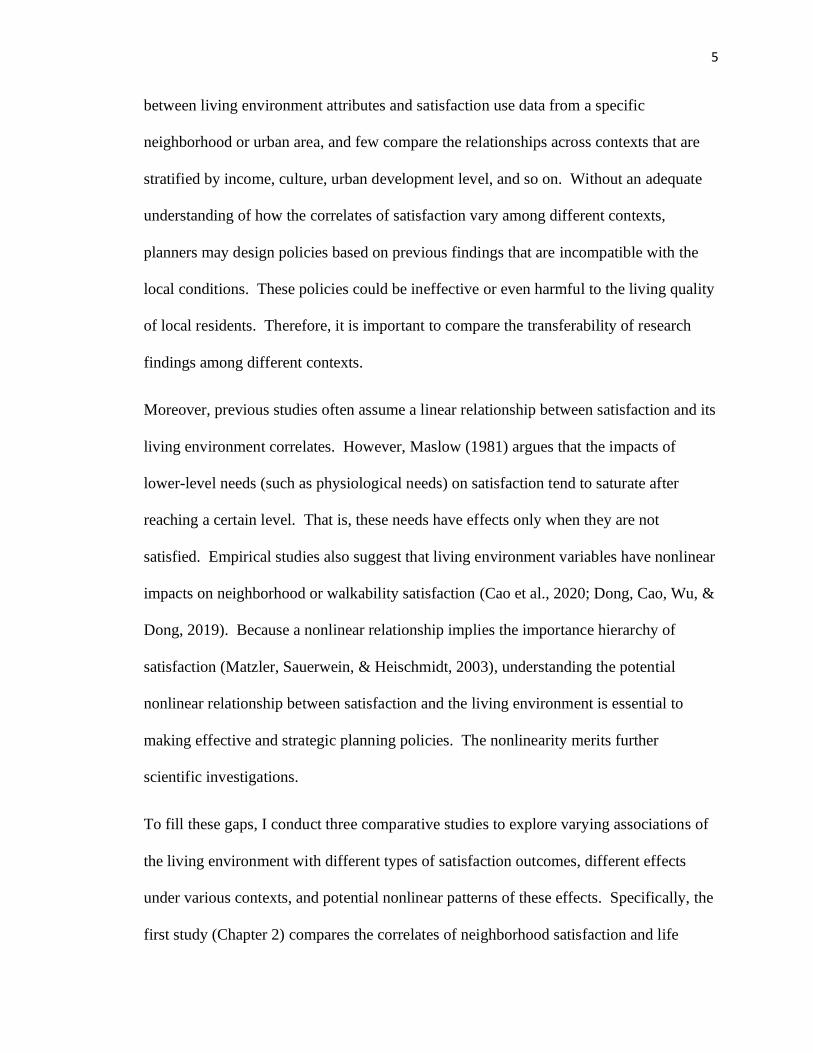
5
between living environment attributes and satisfaction use data from a specific
neighborhood or urban area, and few compare the relationships across contexts that are
stratified by income, culture, urban development level, and so on. Without an adequate
understanding of how the correlates of satisfaction vary among different contexts,
planners may design policies based on previous findings that are incompatible with the
local conditions. These policies could be ineffective or even harmful to the living quality
of local residents. Therefore, it is important to compare the transferability of research
findings among different contexts.
Moreover, previous studies often assume a linear relationship between satisfaction and its
living environment correlates. However, Maslow (1981) argues that the impacts of
lower-level needs (such as physiological needs) on satisfaction tend to saturate after
reaching a certain level. That is, these needs have effects only when they are not
satisfied. Empirical studies also suggest that living environment variables have nonlinear
impacts on neighborhood or walkability satisfaction (Cao et al., 2020; Dong, Cao, Wu, &
Dong, 2019). Because a nonlinear relationship implies the importance hierarchy of
satisfaction (Matzler, Sauerwein, & Heischmidt, 2003), understanding the potential
nonlinear relationship between satisfaction and the living environment is essential to
making effective and strategic planning policies. The nonlinearity merits further
scientific investigations.
To fill these gaps, I conduct three comparative studies to explore varying associations of
the living environment with different types of satisfaction outcomes, different effects
under various contexts, and potential nonlinear patterns of these effects. Specifically, the
first study (Chapter 2) compares the correlates of neighborhood satisfaction and life

6
satisfaction. It analyzes survey data collected in the Twin Cities using gradient boosting
decision trees (GBDT) and answers the following research questions:
• Which neighborhood attributes are critical to neighborhood satisfaction and life
satisfaction, respectively?
• What are the patterns of their associations?
• How do the influences of neighborhood attributes on neighborhood satisfaction
and life satisfaction differ?
The second study (Chapter 3) compares the correlates of life satisfaction in three higher-
income and three lower-income neighborhoods in the Twin Cities using GBDT. It also
employs the impact-asymmetry analysis (IAA) to classify important attributes based on
the pattern of their impacts on life satisfaction. This chapter answers the following
research questions:
• What are the most important neighborhood attributes in higher-income and lower-
income neighborhoods, respectively?
• What explains the similarities and differences in the correlates of life satisfaction
across neighborhoods?
• Do neighborhood attributes have nonlinear impacts on life satisfaction?
The third study (Chapter 4) analyzes survey data from the Twin Cities, U.S. and
Guangzhou, China using GBDT to compare the correlates of life satisfaction in these two
urban areas. It answers the following research questions:
• How important is the living environment to life satisfaction?
• What are the most important correlates of life satisfaction?

7
• Are there any differences in the results between the two regions?

8
Chapter 2
How Do Neighborhood Features Affect
Satisfaction?
2.1 Introduction
As an overall evaluation of people’s quality of life, life satisfaction is associated with
many positive outcomes of human lives (Antaramian, 2017). Life satisfaction relates to
various domains such as job and health (Pavot & Diener, 2008; Rojas, 2006). Among all
the domain satisfactions, neighborhood satisfaction is an important one. It measures
residents’ cognitive assessment of their neighborhoods, covering both physical and social
neighborhood attributes. Many studies have explored the effects of neighborhood quality
on neighborhood satisfaction and life satisfaction, respectively. However, few have
examined the essential constituents of neighborhood satisfaction and life satisfaction
simultaneously and the potentially differing effects of the same attributes. A
consequence is that when examining only one outcome, planners may devalue
neighborhood attributes that affect the other.

9
This study fills this research gap by exploring how satisfaction with same neighborhood
attributes affects neighborhood satisfaction and life satisfaction in different degrees and
patterns. We employ gradient boosting decision tree, a machine-learning technique, to
data from six neighborhoods in the Twin Cities Metropolitan area, Minnesota. We aim to
answer the following research questions: Which neighborhood attributes are critical to
neighborhood satisfaction and life satisfaction, respectively? What are the patterns of
their associations? How are neighborhood attributes associated differently with
neighborhood satisfaction and life satisfaction?
To our knowledge, this is the first study that compares different impacts of the same set
of attributes on satisfaction with neighborhood (the assessment of a specific life domain)
and satisfaction with life (a global evaluation of life). It contributes to the literature and
practice in two ways. First, this study illustrates a holistic picture of the association
between neighborhood characteristics and satisfaction outcomes, including their degrees
and patterns, and their differing effects on neighborhood satisfaction and life satisfaction.
Accordingly, planners can capture all the key attributes that affect satisfaction.
Moreover, by examining the nonlinear patterns of the correlations, this study offers
valuable implications to planning practices regarding the following question: To what
extent should planners invest each neighborhood attribute to enhance satisfaction
efficiently?
The study is organized as follows: in section 2, we review the literature on neighborhood
satisfaction and life satisfaction; in section 3, we introduce the data and the method used
in the study; in section 4, we present and discuss the empirical results; in the final section,
we summarize key findings and provide implications for future research and practice.

10
2.2 Literature Review
Life satisfaction, a cognitive component of subjective well-being, depicts a person’s
global evaluation of life (Oishi, Diener, Lucas, & Suh, 2009). It has positive associations
with many aspects of human lives. Higher life satisfaction is associated with a greater
likelihood to get married and have children, and a smaller likelihood to have negative life
events such as marital separation and unemployment (Luhmann, Lucas, Eid, & Diener,
2013). Life satisfaction relates to physical health because higher life satisfaction is
correlated with better health levels and fewer health conditions (Siahpush et al., 2008).
Moreover, life satisfaction affects educational performances. College students with
higher life satisfaction have greater academic self-efficacy and less stress (Antaramian,
2015; O’Sullivan, 2011).
Life satisfaction is a construct of satisfaction with various domains (Pavot & Diener,
2008; Rojas, 2006). Cummins (2005) grouped 173 individual domains into seven major
domains including material well-being, health, productivity, intimacy, safety, community,
and emotional well-being. A key life domain is residential community that includes
many dimensions of the living environment such as city, neighborhood, and home. The
neighborhood as an entity has significant effects on individuals in forms of concentrated
poverty (Wilson, 2012) and social mix (Arthurson, 2012; Van Ham, Manley, Bailey,
Simpson, & Maclennan, 2012). This suggests that, as the place that provides residence
and social interactions, residential neighborhood is an essential domain of human lives,

11
which affects not only satisfaction with this specific domain but also the global life
satisfaction.
Neighborhood conditions are associated with neighborhood satisfaction. The influential
attributes constitute societal conditions and physical conditions. Some studies focus on
the impact of social factors on neighborhood satisfaction. Basolo and Strong (2002)
found that safety is an important contributor to neighborhood satisfaction. Parkes,
Kearns, and Atkinson (2002) discovered that crime and unfriendliness have greater
impacts on residents living in less affluent areas. Dassopoulos and Monnat (2011) found
that perceived social cohesion is positively associated with neighborhood satisfaction.
Other studies emphasize physical built environment attributes. Hamersma, Tillema,
Sussman, and Arts (2014) examined satisfaction with a neighborhood adjacent to a
highway and found that residents’ evaluations of air quality, noise, and accessibility are
important to neighborhood satisfaction. Ellis, Lee, and Kweon (2006) explored the
effects of trees and shrubs and found that access to trees and shrubs can mitigate the
negative association between retail land use and neighborhood satisfaction. Hur et al.
(2010) concluded that building density directly affects satisfaction, whereas vegetation
rate has indirect effects.
Many studies have also examined the direct impacts of neighborhood attributes on life
satisfaction. In general, neighborhood correlates of life satisfaction also fall into the
same two groups: societal conditions and physical conditions. Among all the societal
factors, social interactions and the sense of belonging are the most influential. Dittmann
and Goebel (2010) concluded that, comparing with other neighborhood attributes, having
social networks has the strongest impact on life satisfaction. O'Brien and Ayidiya (1991)

12
examined the impact of the sense of belonging on life satisfaction. Their study not only
identified the substantial influence of the feeling of belonging but also found that this
feeling could serve as a moderation in the linkage between life satisfaction and other
factors. Physical environments are also major correlates of life satisfaction. Street
connectivity, for instance, has recognizable correlations with life satisfaction (Cao, 2016).
The quality and safety of open spaces are also correlated with life satisfaction (Sugiyama,
Thompson, & Alves, 2009).
Overall, the literature offers ample evidence on neighborhood correlates of neighborhood
satisfaction and life satisfaction. It also implies that the same neighborhood attributes
could have different impacts on neighborhood satisfaction and life satisfaction.
Conceptually, neighborhood satisfaction measures people’s evaluation of the
neighborhood, so it is more likely to correlate with neighborhood conditions than other
aspects of human lives. By contrast, life satisfaction is a global evaluation of life that
relates to multiple life domains. Neighborhood should have a limited correlation with life
satisfaction because other domains, such as health, wealth, and personal development,
may have considerable impacts on life satisfaction. For instance, Lovejoy et al. (2010)
found that the quality of schools is not related to neighborhood satisfaction, whereas
Senlier et al. (2009) suggested that education facilities are an important correlate of life
satisfaction. Vemuri et al. (2011) found an association between homeownership and
neighborhood satisfaction, but Ciorici and Dantzler (2018) concluded that
homeownership does not have a substantial correlation with life satisfaction.
Not only may neighborhood attributes have different sizes of effects on neighborhood
satisfaction and life satisfaction, these effects may show different patterns. Many studies
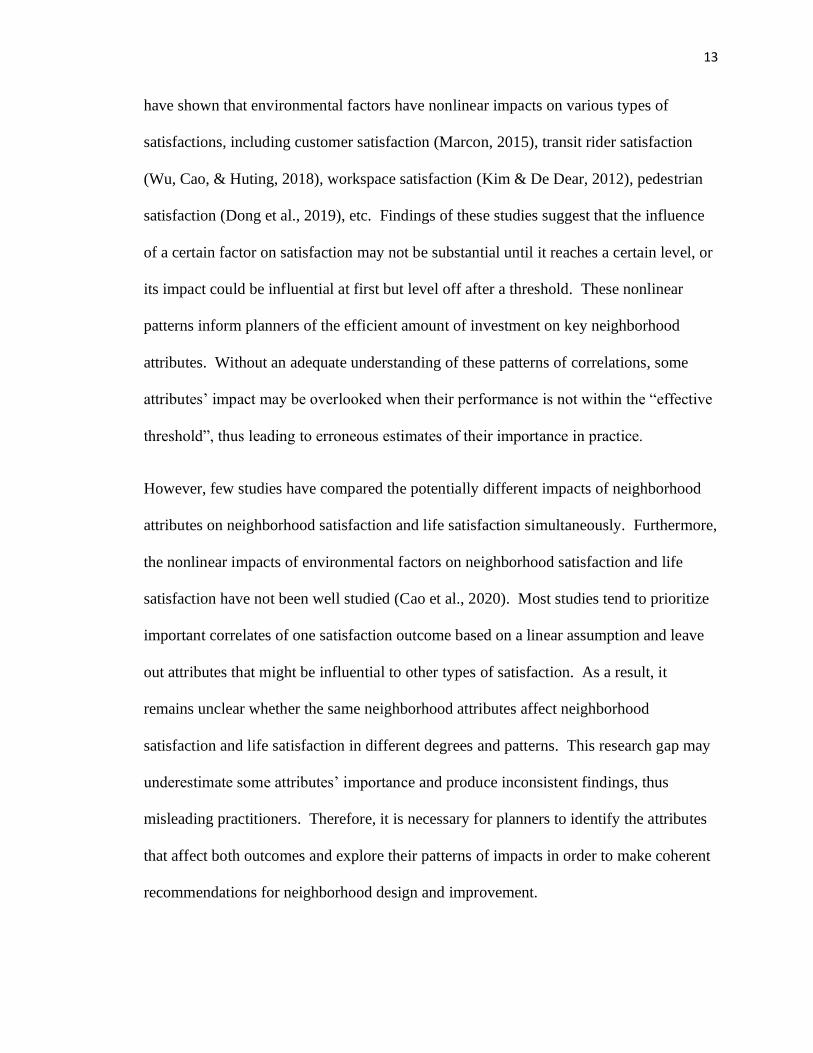
13
have shown that environmental factors have nonlinear impacts on various types of
satisfactions, including customer satisfaction (Marcon, 2015), transit rider satisfaction
(Wu, Cao, & Huting, 2018), workspace satisfaction (Kim & De Dear, 2012), pedestrian
satisfaction (Dong et al., 2019), etc. Findings of these studies suggest that the influence
of a certain factor on satisfaction may not be substantial until it reaches a certain level, or
its impact could be influential at first but level off after a threshold. These nonlinear
patterns inform planners of the efficient amount of investment on key neighborhood
attributes. Without an adequate understanding of these patterns of correlations, some
attributes’ impact may be overlooked when their performance is not within the “effective
threshold”, thus leading to erroneous estimates of their importance in practice.
However, few studies have compared the potentially different impacts of neighborhood
attributes on neighborhood satisfaction and life satisfaction simultaneously. Furthermore,
the nonlinear impacts of environmental factors on neighborhood satisfaction and life
satisfaction have not been well studied (Cao et al., 2020). Most studies tend to prioritize
important correlates of one satisfaction outcome based on a linear assumption and leave
out attributes that might be influential to other types of satisfaction. As a result, it
remains unclear whether the same neighborhood attributes affect neighborhood
satisfaction and life satisfaction in different degrees and patterns. This research gap may
underestimate some attributes’ importance and produce inconsistent findings, thus
misleading practitioners. Therefore, it is necessary for planners to identify the attributes
that affect both outcomes and explore their patterns of impacts in order to make coherent
recommendations for neighborhood design and improvement.

14
In summary, the literature shows that many aspects of the neighborhood have
associations with neighborhood satisfaction and life satisfaction. It also implies that the
same neighborhood attribute might have distinctive impacts on these two outcomes and
the pattern of these impacts could be nonlinear. Nevertheless, most studies choose to
focus on only one outcome. They often emphasize the effect size without paying
attention to the nonlinear pattern of the impact. These research gaps could devalue some
attributes in practice when they affect only one of the satisfaction outcomes or when they
have yet to reach the threshold to be effective. By examining how the same
neighborhood attributes affect neighborhood satisfaction and life satisfaction, this
research depicts a holistic view on the influences of neighborhood attributes and offers
insights to planning research and practice.
2.3 Data and Method
2.3.1 Data
The data were collected in the Neighborhood Environment, Daily Activities, and Well-
Being Study funded by the National Science Foundation. This study belongs to the
Sustainable Healthy City Research Network at the University of Minnesota. The data
collection took place over a year from October 2016 to October 2017. The sample
contains 360 valid observations. The data collection was conducted using a quasi-
experimental and cross-sectional design. Researchers used the condition of
neighborhood infrastructures as the treatment.

15
The rationale of sampling consists of three major components: the sample population, the
sample frame, and the sampling strategy. The study area is the Twin Cities, MN, so the
sample population contains all the residents living in the Twin Cities Metro area. Then, a
sample frame was constructed to ensure the diversity and representativeness of the
sample. Researchers decided that the selected neighborhoods should vary regarding three
criteria: neighborhood infrastructure, urban form, and transportation access. Considering
the practical difficulty of evaluating neighborhood infrastructures on-site, income level
was used as a proxy to differentiate the level of neighborhood infrastructures.
Researchers referenced the median income of U.S. census and categorized the
neighborhoods into low-income and middle-income groups. Then, urban forms were
taken into consideration. Specifically, researchers assured that both urban and suburban
neighborhoods are included in the sample. Finally, researchers used access to the light
rail as an indicator of transportation accessibility and selected neighborhoods both with
and without light rail accesses. Based on the above-mentioned sampling rationale, six
neighborhoods were selected to represent neighborhoods in the Twins Cities metro area
(Table 1). Figure 2 illustrates the locations of the six neighborhoods. Researchers
randomly selected 921 census blocks in the study areas and sent out invitations to 1,700
households within these census blocks. About 400 households participated in the
research, and each participant received an incentive of 50 dollars. After identifying the
sample size, the research team randomly drew blocks based on the U.S. Census data and
sent out postcards about the study and followed up with interviews if applicable. A total
of 360 valid observations were collected.

16
Table 1 Selected Study Neighborhoods
Neighborhood Urban form Income Level Light Rail Access
Near North Urban Low No
Phillips Urban Low Yes
Prospect Park Urban Middle Yes
St. Anthony Park Urban Middle Yes
Blaine Suburban Middle No
Brooklyn Center Suburban Low No
Figure 2 Selected Study Neighborhoods
In the survey, neighborhood satisfaction was measured on a five-point Likert scale
ranging from “very dissatisfied” to “very satisfied”. Life satisfaction was measured using
the Satisfaction with Life Scale (SWLS) developed by Diener et al. (1985). Survey
participants evaluated five statements about their lives on a seven-level scale from
“strongly agree” to “strongly disagree”. These five statements include “In most ways my

17
life is close to my ideal”, “The conditions of my life are excellent”, “I am satisfied with
my life”, “So far I have gotten the important things I want in life”, and “If I could live my
life over, I would change almost nothing”.
As shown in Appendix Table A1, satisfaction with neighborhood attributes contain 31
items, evaluated on a five-point Likert scale ranging from “very dissatisfied” to “very
satisfied”. Participants evaluated their satisfaction regarding five main aspects of the
neighborhood: characteristics (look, design, noise, safety…), infrastructure (trails,
paths, parks, sidewalks..), amenities/accessibility (access to childcare, schools, grocery
stores…), city services (snow removing, street cleaning, garbage collection…), and sense
of community (number of friends, relationship with residents, participation in
neighborhood decision-making). We also controlled for seven socio-demographic
variables: age, race, income, household sizes, vehicle ownership, property ownership,
employment status, and years spent in the neighborhood.
2.3.2 Method
We employed GBDT to analyze the correlation between satisfaction with neighborhood
attributes and life satisfaction. GBDT combines the results of multiple individual
decision trees to provide the final output. These algorithms reduce errors of the final
model by correcting and learning from errors in each round of iterations. GBDT has
many advantages compared with traditional regression (Ding, Cao, & Næss, 2018). As
an ensemble-based algorithm, GBDT provides more accurate and stable results than
individual regression models. GBDT is also more robust in dealing with

18
multicollinearity. Like other boosting and tree-based algorithms, correlations between
independent variables are already accounted for in the process of building trees. Finally,
GBDT handles missing values well, requires much less data cleaning and works well
with both categorical and continuous data.
When used in practice, given a sample of (y, x), the goal of gradient boosting is to fit a
function of f(x) that minimizes the loss function ψ [y, f(x)]. Friedman (2001) developed
this gradient boosting algorithm. The output of a gradient boosting model can be
presented as follow (Ding et al., 2018; Zhang & Haghani, 2015):
We carry out this algorithm using the “gbm” package in R (Ridgeway, 2007). The main
outputs of GBDT models are as follows:
• Squared error loss: An average of the squared error (the deviation between
observed values and predicted values).
• The optimized number of decision trees: The number of decision trees that
minimizes the squared error loss.
• Relative influence: The increase of the squared error when an independent
variable is excluded, relative to other predictors.

19
• Partial dependence plot: A graph showing how the predicted value of the
dependent variable changes with respect to the changes of an independent
variable while controlling for other variables.
2.4 Results and Discussion
Using GBDT, we built two models with neighborhood satisfaction and life satisfaction as
dependent variables, respectively. Building separate models for neighborhood
satisfaction and life satisfaction may seem contradictory to the literature suggesting that
neighborhood satisfaction is a domain that constructs life satisfaction. Nevertheless, in
the structural equation model I built using the same variables, the path between
neighborhood satisfaction and life satisfaction was insignificant after controlling for
neighborhood attributes as well as demographic and socioeconomic characteristics. This
suggests that neighborhood attributes do not necessarily correlate with life satisfaction
through neighborhood satisfaction. Instead, many of them could have direct correlations
with life satisfaction. Therefore, I have decided to discard the structural equation model
and build separate models for these two satisfaction outcomes to capture these direct
associations between neighborhood attributes and life satisfaction.
In both models, independent variables included satisfaction with 31 neighborhood
attributes as well as a list of demographic and socioeconomic variables (see appendix).
The initial number of trees was set to be 50,000 in both models to leave rooms for tuning
in later steps. Both models were built at a slow learning rate of 0.001 to minimize
overfitting. For each model, we conducted a five-fold cross-validation to identify the

20
optimal number of trees that minimizes the prediction error. Models with the optimal
numbers of trees are used for further analyses. According to the R-square, the model for
neighborhood satisfaction (0.66) has a larger explanatory power than that for life
satisfaction (0.57).
The two models produced the relative influence of all predictors on reducing prediction
errors and partial dependence plots illustrating the patterns of their impacts. It is worth
noting that the comparison between the two models is based on relative influences
instead of absolute influences. In other words, the purpose is to compare the importance
of each predictor to the outcome relative to other predictors in the same model and not
the absolute degrees of importance across models. This comparison addresses the first
two research questions: Which neighborhood attributes are critical to neighborhood
satisfaction and life satisfaction, respectively? What are the patterns of their associations?
2.4.1 Correlates of neighborhood satisfaction
In the neighborhood satisfaction model (Table 2), demographic and socioeconomic
variables collectively account for 21% of the predictive power and satisfaction with
neighborhood attributes jointly account for 79%. Among satisfaction with all the
attributes, the look and safety of neighborhoods are the most impactful, with relative
influences of 17.61% and 12.74%, respectively. All the top four influential correlates of
neighborhood satisfaction, “the look or design of the neighborhood”, “safety from crime
in the neighborhood”, “neighborhood cleanliness”, and “noise in the neighborhood”,
belong to the category of neighborhood characteristics in the survey (see appendix). In

21
other words, these influential variables describe basic features of the neighborhood itself,
instead of factors beyond the scope of the neighborhood (such as city services and
availability of transportation options). This suggests that neighborhood satisfaction is
predominantly associated with the features within the neighborhood, especially its
appearance (look and design) and basic features (safety, cleanliness, and noise). Besides
neighborhood attributes, one control variable, namely “years living in the neighborhood”
(6.24%), have a large relative influence.
Table 2 Relative influences of attributes on neighborhood satisfaction
Note: Relative influence of a variable refers to its contribution to decreasing prediction errors, relative to all
other predictors.
Modelling Statistics
The number of iterations 2,800
Squared Error Loss 0.24
R2 0.66
Collective Relative Influences (%)
Neighborhood Attributes (Total) 78.99
Demographic and Socioeconomic Characteristics (Total) 21.01
Important Attributes (with a relative influence larger than 2%)
Important Neighborhood Attributes Relative influence (%)
The look or design of the neighborhood 17.61
Safety from crime in your neighborhood 12.74
Neighborhood cleanliness 10.29
Noise in the neighborhood 9.78
Relations with residents of your neighborhood 4.42
Access to quality schools and other educational institutions 4.29
Street cleaning in your neighborhood 2.56
Air quality in the neighborhood 2.49
Ability to participate in neighborhood decisions that impact you/your family 2.25
Important Demographic and Socioeconomic Attributes Relative influence (%)
Years living in the neighborhood 6.24

22
Figure 3 presents partial dependence plots of the top four influential attributes and
illustrates the patterns of their influences. “Neighborhood cleanliness” has an
approximately linear influence on neighborhood satisfaction. As its performance
increases from poor (1) to medium (2) and from medium (2) to good (3), the resulted
increases in neighborhood satisfaction are somewhat similar. By contrast, “the look or
design of the neighborhood” causes little increase in neighborhood satisfaction when its
performance increases from poor to medium. However, after its performance reaches
medium, it starts to have greater impacts. Safety and noise in the neighborhood show a
similar influence pattern. They generate more variations in neighborhood satisfaction
when having a relatively poor performance (below two). However, their impacts become
smaller once their performances exceed the medium level. These nonlinear patterns of
influential attributes indicate that caution must be exercised when enhancing them.
While some attributes only need to be improved to a certain performance level because of
their diminishing return, others need to reach a certain performance level to have an
impact.

23
Figure 3 The Associations between Selected Neighborhood Attributes and Neighborhood Satisfaction
Look or design of the neighborhood
(17.61%) Safety from crime (12.74%)
Neighborhood cleanliness (10.29%) Noise in the neighborhood (9.78%)
Notes:
1. Percentages in the parentheses represent the relative influence of the corresponding attributes.
2. Numbers on the x-axis of each graph represents the performance level of each attribute (1 =
“poor”, 2 = “medium”, 3 = “good”).
2.4.2 Correlates of life satisfaction
Taken together, satisfaction with neighborhood attributes contribute 51% to the model,
and the rest 49% is attributable to demographic and socioeconomic variables (Table 3).
In the life satisfaction model, no attribute shows a dominant impact. Relatively,
satisfaction with “ability to participate in neighborhood decisions that impact you/your
family” as well as “parks and playgrounds in your neighborhood” have the largest
influences, followed by “accessibility to schools and educational institutions”. Important
correlates of life satisfaction are more connected with the need for leisure, social

24
cohesion, and cognition. Life satisfaction is associated with a few demographic and
socioeconomic variables. Income (19.58%), vehicle ownership (5.63%) and two race-
related variables (10.09%) show considerable level of influences on life satisfaction.
Table 3 Relative influences of attributes on life satisfaction
Modelling Statistics
The number of iterations 3,500
Squared Error Loss 86.01
R2 0.57
Collective Relative Influences (%)
Neighborhood Attributes (Total) 51.02
Demographic and Socioeconomic Characteristics (Total) 48.98
Important Attributes (with a relative influence larger than 2%)
Important Neighborhood Attributes Relative influence (%)
Ability to participate in neighborhood decisions that impact you/your family 5.68
Parks and playgrounds in your neighborhood 5.59
Access to quality schools and other educational institutions 4.65
Drainage in your neighborhood 3.55
Bike trail/paths in your neighborhood 3.35
The number of friends you have in your neighborhood 3.18
Relations with residents of your neighborhood 2.97
Access to quality leisure, recreation and entertainment 2.90
Sidewalks in your neighborhood 2.36
Noise in the neighborhood 2.13
Important Demographic and Socioeconomic Attributes Relative influence (%)
Income 19.6%
Race Being White 7.07%
Being Black 3.03%
Vehicle Ownership 5.6%
Note: Relative influence of a variable refers to its contribution to decreasing prediction errors, relative to all
other predictors.
Because important neighborhood attributes show a relatively balanced impact in the life
satisfaction model, we chose to generate partial dependence plots for the top six most
important attributes (with relative influences larger than 3%).

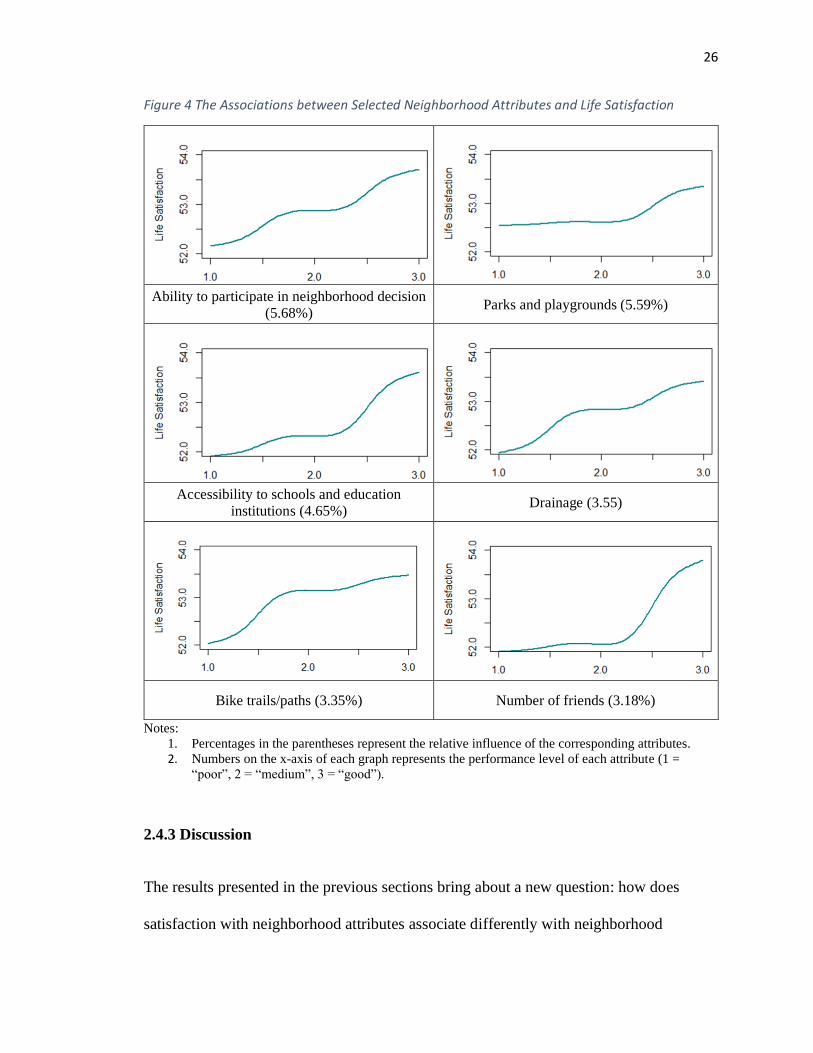
25
Figure 4 shows that the ability to participate in neighborhood decisions and drainage have
approximately linear impacts. Parks and playgrounds, access to schools and educational
institutions, and the number of friends have nonlinear impacts and their nonlinear
patterns are similar. They have relatively limited influences when performing poorly.
After their performance reaches the medium level, however, their influences greatly
increase. By contrast, bike trails/paths start with a considerable effect when performing
poorly, but its effect saturates after its performance reaches the middle ground, generating
only a small increase in life satisfaction afterward.
26
Figure 4 The Associations between Selected Neighborhood Attributes and Life Satisfaction
Ability to participate in neighborhood decision
(5.68%) Parks and playgrounds (5.59%)
Accessibility to schools and education
institutions (4.65%) Drainage (3.55)
Bike trails/paths (3.35%) Number of friends (3.18%)
Notes:
1. Percentages in the parentheses represent the relative influence of the corresponding attributes.
2. Numbers on the x-axis of each graph represents the performance level of each attribute (1 =
“poor”, 2 = “medium”, 3 = “good”).
2.4.3 Discussion
The results presented in the previous sections bring about a new question: how does
satisfaction with neighborhood attributes associate differently with neighborhood
27
satisfaction and life satisfaction? Table 4 compares the relatively important attributes and
the collective contribution of all neighborhood attributes in each model. In the
neighborhood satisfaction model, satisfaction with four neighborhood attributes have
dominant impacts compared with other attributes. By contrast, no satisfaction with
neighborhood attributes dominates the life satisfaction model.
Taken together, the 31 neighborhood attributes contribute 79% to the prediction of
neighborhood satisfaction and 51% to the prediction of life satisfaction. The finding is
consistent with the existing knowledge that life satisfaction is a complex construct
affected by many domains of satisfaction such as job satisfaction and marital satisfaction
(Pavot & Diener, 2008). With more factors coming into play, the effect of a single
domain is limited. The neighborhood is only one of the many aspects of people’s daily
lives, thus having only limited impacts on life satisfaction. On the other hand,
neighborhood satisfaction specifically evaluates the neighborhood, so it is highly
correlated with neighborhood-related attributes. Influential demographic and
socioeconomic characteristics also follow the same pattern. The most influential
socioeconomic variable in the neighborhood satisfaction mode is “years living in the
neighborhood”, which is also highly correlated with the neighborhood. As for life
satisfaction, the most influential demographic and socioeconomic variables are income,
vehicle ownership, and race. All three are less related to the neighborhood and more to
personal wealth and defining characteristics.

28
Table 4 Comparison between neighborhood satisfaction and life satisfaction models
Neighborhood Satisfaction Life Satisfaction
Collective influences of
neighborhood
attributes
79% 51%
Important
neighborhood
attributes
The look or design of the
neighborhood (17.61%)
Safety from crime (12.74%)
Neighborhood cleanliness
(10.29%)
Noise in the neighborhood (9.78%)
Ability to participate in
neighborhood decisions that impact
you/your family (5.68%)
Parks and playgrounds in your
neighborhood (5.59%)
Access to quality schools and other
educational institutions (4.65%)
Drainage in your neighborhood
(3.55%)
Bike trail/paths in your
neighborhood (3.35%)
The number of friends you have in
your neighborhood (3.18%)
Important
demographic and
socioeconomic
attributes
Years living in the neighborhood
(6.24%)
Income (19.58%)
Race (10.09%)
Vehicle ownership (5.63%)
All the four variables that have dominant impacts on neighborhood satisfaction describe
basic and physical features of the neighborhood. The large influence of the look or
design of neighborhood (17.61%) is consistent with existing studies showing that the
appearance of the neighborhood is one of the most important correlates of neighborhood
satisfaction (Hur & Morrow-Jones, 2008; Sirgy & Cornwell, 2002). Safety from crime is
the second most impactful attribute in our model with a relative influence of 12.74%.
Many studies have shown that safety is essential to keep residents satisfied with the
neighborhood (Hur & Morrow-Jones, 2008; Lovejoy et al., 2010). It is worth noting that
the evaluation of neighborhood safety may be associated with the look of the
neighborhood, especially with the upkeep and maintenance. When neighborhood upkeep
improves, perceived safety and neighborhood satisfaction also increase (Hur & Nasar,

29
2014). Therefore, the look and design of the neighborhood have not only a direct impact
on neighborhood satisfaction but also an indirect effect through its association with
satisfaction with neighborhood safety.
Cleanliness is another influential physical attribute of the neighborhood in our model.
Research shows that neighborhood cleanliness has an association with the health
condition of residents (Chan & Liu, 2018). Our study further suggests that cleanliness
has a considerable effect on residents’ satisfaction with the neighborhood. Noise is also
an important basic correlate of neighborhood satisfaction. Residents could feel less
satisfied with their neighborhoods if they are exposed to continuous noises that are larger
than the tolerance level. High levels of noise are often seen in deprived neighborhoods,
where satisfaction with the neighborhood also tends to be lower (Mouratidis, 2020).
Compared to neighborhood satisfaction, the main correlates of life satisfaction are less
related to basic and physical features but more connected with leisure, societal, and
cognitive needs. The literature also shows that the main correlates of life satisfaction
tend to be societal, personal, and experiential factors (Veenhoven, 1996). For example,
self-esteem is one major correlate of life satisfaction especially in individualistic
countries such as the U.S., where feeling respected carries a great weight (Diener &
Diener, 2009). This helps explain why an esteem and cohesion related attribute (“ability
to participate in neighborhood decisions that impact you/your family”) shows a relatively
large influence (5.68%) on life satisfaction. Social relationship is also an essential factor
of life satisfaction. Higher levels of social involvements generate a large increase in life
satisfaction (Powdthavee, 2008). In our model, the importance of “the number of friends
in the neighborhood” (3.18%) corresponds with its relevance shown in the literature.

30
Leisure infrastructures play a role in the formation of life satisfaction. Three
infrastructure-related attributes show considerable impacts: parks and playgrounds
(5.59%), drainage (3.55%), and bike paths/trails (3.35%). The importance of
infrastructures is in accordance with previous findings suggesting that the development of
infrastructure could impact human development and further affect the quality of life and
well-being of urban population (Fischer & Amekudzi, 2011; Navarrete-Hernandez &
Laffan, 2019). Among the three influential attributes, two are related to leisure and green
infrastructures: “parks and playgrounds in your neighborhood” and “bike trails/paths in
your neighborhood”. Added together, these two types of infrastructure contribute 8.94%
to the model. These infrastructures encourage participation in leisure activities and
further contribute to life satisfaction (Brajša-Žganec, Merkaš, & Šverko, 2011). Their
impacts could also attribute to the potential of green infrastructures to decrease stress and
increase happiness of urban residents (Navarrete-Hernandez & Laffan, 2019).
The results also reveal the link between life satisfaction and the need for cognition
(“access to quality schools and other educational institutions”). Cognitive need refers to
the desire for comprehension and knowledge gaining, which is an important predictor of
life satisfaction (Coutinho & Woolery, 2004; Gauthier, Christopher, Walter, Mourad, &
Marek, 2006). This need is also essential to satisfying other physiological needs that
affect life satisfaction. For instance, to satisfy the need for physical health, one must
have the knowledge to attain quality food and shelter. Moreover, the connection between
income and life satisfaction also relates to the impact of cognitive needs. Higher-income
parents are more willing to pay housing premiums to reside in high-quality school
districts, which leads to the clustering of affluent households in these areas (Owens,

31
2018). As discussed later, income has a positive relationship with life satisfaction. The
linkage between income and life satisfaction can help explain why the accessibility to
quality schools shows great importance to life satisfaction as well.
After controlling for neighborhood attributes, most demographic variables have limited
impacts on neighborhood satisfaction. Nevertheless, there is one exception: “years living
in the neighborhood” has a large relative influence (6.24%) on neighborhood satisfaction
and its impact is in a nonlinear pattern. The length of residence is positively associated
with neighborhood satisfaction until it reaches about 20 years, after which neighborhood
satisfaction stabilizes. A potential reason for this pattern is the strong sense of
community in the neighborhood resulting from long residence. In particular, long
residence allows residents to make more friends in the neighborhood, thus developing a
strong sense of community and stable social relations. These stronger social ties could
lead to higher satisfaction with the neighborhood.
Demographic and socioeconomic variables have a larger correlation with life satisfaction
than on neighborhood satisfaction. Among them, income, vehicle ownership, and race
have the strongest impacts. Both income (19.58%) and vehicle ownership (5.63%) are
indicators of wealth. They have positive correlations with life satisfaction, just as wealth
does. The positive correlation between wealth and life satisfaction has been confirmed in
many studies (Frijters, Haisken-DeNew, & Shields, 2004; Kahneman & Deaton, 2010).
The two race-related dummy variables (being white and black) account for 10.09% of the
predictive power in total. Being white has a positive association with life satisfaction,
whereas being black has a negative association. This difference may result from the
systematic racism that leads to lower satisfaction with life among the black population

32
(Broman, 1997). Black residents’ experiences and perceptions of discrimination also
correlate with their life satisfaction (Yap, Settles, & Pratt-Hyatt, 2011).
2.5 Conclusion
This study explored how satisfaction with same neighborhood attributes are associated
with neighborhood satisfaction and life satisfaction in different ways. Using data
collected in the Twin Cities in Minnesota, we employed gradient boosting decision trees
to develop two models for satisfaction with neighborhood and satisfaction with life,
respectively. Results show that, after controlling for demographic and socioeconomic
variables, satisfaction with neighborhood attributes contributes over 50% to the variation
in neighborhood satisfaction and life satisfaction, but the collective impact is greater on
neighborhood satisfaction than on life satisfaction. Furthermore, the most influential
attributes of neighborhood satisfaction relate closely to physical appearance and basic
features of the neighborhood, whereas attributes that are critical to life satisfaction are
pertinent to leisure, social cohesion, and cognition. These influential attributes also show
different patterns of nonlinear influences on the two outcomes. In general, neighborhood
satisfaction and life satisfaction are impacted by completely different neighborhood
attributes.
This study has two main takeaways. First, although the literature implies that life
satisfaction and specific domain satisfaction react differently to the same environmental
correlates, our findings substantiate the hypothesis. Because of the divergence,
examining a single satisfaction outcome tells only part of a story. In particular, this study
shows that investigating only neighborhood satisfaction will understate the role of

33
attributes related to leisure, cohesion, and cognition in generating life satisfaction. By
contrast, emphasizing only life satisfaction will regard basic features of residential
neighborhoods fruitless. In fact, all these attributes are important to residents’ subjective
well-being. Therefore, future research should cover multiple satisfaction domains to
illustrate the influences of neighborhood attributes in a holistic way.
Second, the nonlinear relationships identified in this study have important implications
for planning practices. The nonlinear influence patterns help answer the following
question: how much investment should planners make for each attribute? For example, if
an attribute becomes impactful only after exceeding the medium level (such as
neighborhood look/design and access to educational facilities), planners should enhance
the design standard of the attribute. On the contrary, if an attribute’s effect saturates after
reaching the medium level (such as neighborhood noise and bike trails), planners could
choose to lower the design standard to the medium level and redistribute limited
resources elsewhere. Comparing with the traditional way of simply ranking the
importance of attributes, the examination of nonlinear relationships enables planners to
strategically invest neighborhood attributes and hence effectively improve neighborhood
quality. More studies are needed to better understand the nonlinear associations between
neighborhood characteristics and resident satisfaction.
We recommend two directions for future studies. First, a mixed-method study is
desirable. Findings from qualitative research could provide valuable insights on
understanding quantitative results, for example, why do some neighborhood attributes
have different associations with different domains of satisfaction? Although we
discussed the plausibility of these results based on the literature, it is ideal to obtain direct

34
evidence from the same respondents. Second, researchers could consider exploring the
influences of the same neighborhood attributes on neighborhood satisfaction and life
satisfaction in other regions. If our findings are generalizable to other regions, we will be
more confident using research results to inform planning practice.

35
Chapter 3
What Affects Life Satisfaction of Residents in
Neighborhoods with Different Income Levels?
3.1 Introduction
Neighborhoods serve as the “cell” of urban areas where residents live, interact, and
maintain social networks. They have profound impacts on many aspects of human lives,
among which life satisfaction is the ultimate one. The literature shows that life
satisfaction has significant associations with many neighborhood features, including
social support (Shields, Price, & Wooden, 2009), accessibility (Kwon, Pickett, Lee, &
Lee, 2019), population density (Li, Sun, Yin, Zhang, & Liu, 2018), land use mix (Cao,
2016), and so on. These studies provide implications regarding how to make residents
happier with their lives by neighborhood design.
However, most studies treat selected neighborhoods homogenously and overlook the
potential disparities across neighborhoods. Psychological theories posit that human
beings tend to have different needs as they move up to the higher income ladder

36
(Alderfer, 1969; Maslow, 1943). For example, Maslow’s theory argues that people’s
needs tend to move from lower, basic needs to higher, growth needs in a hierarchy.
Therefore, if planners do not differentiate neighborhoods with different income levels in
their study, they will not be able to understand and accommodate various needs of
residents living in these diverse neighborhoods.
Maslow’s theory also implies potential nonlinear influences of human needs. It
categorizes lower needs in the hierarchy as “deficiency needs”, suggesting that they
would be the focus if deficient, but once satisfied, people tend to shift their attention
elsewhere. By contrast, “growth needs” can continuously have impacts. This
categorization implies that human needs have different patterns of influences, and
deficient needs have a nonlinear pattern. However, most studies tend to build analyses on
the assumption that attributes linearly affect satisfaction. An accurate identification of
resident needs depends on the validity of model assumptions. Without a clear
understanding of the shape of the influences, it would be hard for planners to make
effective decisions in neighborhood design.
This study fills the two research gaps by conducting a comparison study between higher-
income and lower-income neighborhoods and by examining nonlinear impacts of
satisfaction with neighborhood attributes on life satisfaction of residents living in these
two types of neighborhoods. We applied the gradient boosting decision tree (GBDT)
approach to discover the most influential neighborhood attributes in higher-income and
lower-income neighborhoods, respectively. We further employed the impact-asymmetry
analysis (IAA) to explore nonlinear relationships between neighborhood attributes and
life satisfaction. We aim to answer three research questions in this study: What are the

37
most important neighborhood attributes in higher-income and lower-income
neighborhoods, respectively? What explains the similarities and differences in the
correlates of life satisfaction across neighborhoods? Do neighborhood attributes have
nonlinear impacts on life satisfaction?
The rest of this paper is organized as follows: Section 2 reviews the related literature and
sets the foundation for the analyses; Section 3 introduces the data and methods; Section 4
discusses the analytical results; and Section 5 summarizes the main findings and
concludes the paper.
3.2 Literature Review
3.2.1 Neighborhood correlates of life satisfaction under various contexts
With a growing number of studies examining the link between neighborhood and life
satisfaction (Kwon et al., 2019; W. Li et al., 2018; Shields et al., 2009), some researchers
have acknowledged the relevance of context in this topic, which motivates them to
conduct comparison studies across neighborhoods/regions. Yin, Shao, Dong, and Wang
(2019) compared urban areas with various rates of urbanization and found that,
depending on the urbanization rate, residents tend to react differently to the built
environment. In the areas with urbanization rates lower than 50%, residents’ happiness is
only correlated with the built environment at the neighborhood level. In comparison, in
the areas with higher than 50% urbanization rates, residents’ happiness is correlated with
the built environment at both the neighborhood level and the city level. Helliwell,
Shiplett, and Barrington-Leigh (2019) further expanded the comparison to urban and

38
rural residents. They found that urban dwellers tend to have lower life satisfaction,
potentially due to more frequent moves and less sense of community than rural dwellers.
Kim and Lee (2018) brought the comparison to an international level. They explored the
link between perceived neighborhood conditions and happiness among young people in
Japan and South Korea. They concluded that Japanese youngsters react more strongly to
safer and more walkable neighborhoods, whereas young people in South Korea show a
higher satisfaction in the neighborhoods with good relationships. Overall, context
matters to environmental correlates of life satisfaction.
Income is one of the most important factors that lead to the differences across contexts.
The disparities between high-income and low-income neighborhoods tend to result in
profound impacts on their residents from many perspectives. Family education, for
instance, is a major outcome that is influenced by neighborhood wealth (Rosenblatt &
DeLuca, 2012). Jocson and McLoyd (2015) found that neighborhood and housing
disorder are correlated with higher mental distress of parents, which then causes child
development issues. Neighborhood wealth also serves as an essential indicator of the
relationship between household income and children’s participation in out-of-school
activities (Dearing et al., 2009). The health and safety conditions of residents living in
low-income neighborhoods are usually at high risks. Communities with lower income
tend to have more crimes and violence like homicide (Ohmer, Warner, & Beck, 2010). A
study conducted in Northern Manhattan shows that children living in the neighborhoods
with mainly low-income households are much more likely to be injured and assaulted
than average (Durkin, Davidson, Kuhn, O'Connor, & Barlow, 1994). Low-income
neighborhoods also have a limited access to healthy foods, so residents living in these

39
neighborhoods have to rely on informal food assistance and local food supplies at
relatively high prices (Chaufan, Davis, & Constantino, 2011). In general, high-income
neighborhoods have better exercising and recreational facilities than low-income
neighborhoods (Sallis et al., 2011). Therefore, residents of high-income neighborhoods
tend to have lower BMI and higher physical quality of life than people living in low-
income neighborhoods (Sallis et al., 2009).
Psychological theories imply that residents living in the neighborhoods with different
practical conditions, amenities, and income levels might have varying needs and
preferences for their living environments. Maslow states that individuals need to
sufficiently satisfy one level of needs before moving on to pursue another. He thinks that
after an unmet demand has been satisfied to a certain point, individuals would naturally
direct their focus to the needs that still need to be met. Based on this premise, Maslow
(1954) proposed a five-level hierarchy of human needs: physiological needs, safety
needs, love and belongingness needs, esteem needs, and self-actualization needs. This
hierarchy was later expanded to include cognitive needs, aesthetic needs, and
transcendence needs (Maslow, 1981; McLeod, 2007).
• Physiological needs refer to biological requirements for the basic survival of
human beings such as food, drink, shelter, clothing, etc.
• Safety needs refer to safety and security and the need of order and control,
including personal safety, financial safety, social stability, etc.
• Love and belongingness needs refer to the need of connection and
companionship that can be met by having friends and family or being part of a
group.

40
• Esteem needs refer to dignity and reputation, which emphasize the need for
respect, achievements, status, etc.
• Cognitive needs refer to the need to acquire knowledge and to satisfy curiosity.
• Aesthetic needs refer to the pursuit of beauty and harmony.
• Self-actualization needs refer to the need to be the true self and to maximize
personal potential to pursue personal growth and fulfillment.
• Transcendence needs refer to the need that transcend personal selves such as
religious beliefs, the pursuit of science, etc.
Maslow’s theory implies that residents living in low-income neighborhoods tend to focus
more on basic needs whereas residents in high-income neighborhoods are more likely to
emphasize growth needs. However, Alderfer (1969) argues that satisfying lower-level
needs is not a prerequisite for the pursuit of higher-level needs. He develops the ERG
(Existence, Relatedness, and Growth) theory of human needs, based on Maslow’s
original five-level hierarchy. In particular, existence needs contain physiological and
safety needs; related needs emphasize love and belonging needs; and growth needs
contain the need for esteem and self-actualization. The ERG theory argues that, in the
situation where one level of needs is not satisfied, people could pursue higher- or lower-
level needs. For example, although the so-called “starving artists” usually can not
sufficiently satisfy their physiological needs, they progress to the need for self-
actualization at the higher level.
The theories of Maslow and Alderfer have different implications for planning practice. If
Maslow’s theory holds true, planners should focus more on higher needs in higher-
income neighborhoods and basic needs in lower-income neighborhoods. But if

41
Alderfer’s theory applies better, planners should not make decisions based simply on
income levels. Instead, context-based approaches should be employed to cater to
different needs of residents. Therefore, it is important to check the relevance of these two
theories in the context of neighborhood planning.
Despite the necessity to differentiate neighborhoods with different income levels, few
studies have compared the needs of residents in high and low-income neighborhoods.
Moreover, no studies have examined the relevance of Maslow’s and Alderfer’s theories
in the same context. The lack of knowledge in this area could lead to ineffective
planning in neighborhoods. To fill this gap, this study analyzes and compares the
implicit importance of neighborhood attributes to life satisfaction of residents living in
high-income and low-income neighborhoods and discusses the relevance of the two
theories. This understanding is valuable to planning and improvement in neighborhoods
with different income levels.
3.2.2 The Nonlinearity of Satisfaction
After identifying important correlates of satisfaction, a new question emerges: how does
satisfaction change in response to the variation in its correlates? It is common to assume
a linear pattern and conduct analyses based on this premise. However, many theories and
studies have argued otherwise. For example, Maslow (1981) states that the impacts of
deficiency needs on satisfaction tend to saturate after reaching a certain level. That is,
deficiency needs only have effects when they are not satisfied. After these needs are met,
the additional increase would not have further positive impacts on human development.

42
Instead, people find motivations from higher-level needs. Therefore, deficiency needs
have nonlinear impacts on human development.
Galster (1985) also suggested a nonlinear relationship between residential satisfaction
and its environmental correlates. He found that people’s satisfaction greatly increases as
the performance of residential features improves from the “worst possible” to the
“aspiration/need level”, but further improvements to the “best possible” level generate a
trivial increase in satisfaction. Galster explained this linkage using the law of
diminishing returns in economics. He argued that the improvement in amenities could
only increase satisfaction until reaching a threshold, after which the effect would saturate.
Other empirical studies have also discovered this nonlinear pattern. Dong et al. (2019)
examined the linkage between pedestrian satisfaction and the built environment in gated
and open neighborhoods. They found that many key correlates have nonlinear
associations with pedestrian satisfaction. For example, in gated communities, the ease of
seeing neighbors has a strong negative impact when performing poorly but few positive
effects when performing well. By contrast, in open communities, the quality of
sidewalks delights residents when performing well but does not show a strong negative
impact when performing poorly. Cao et al. (2020) examined the impacts of
neighborhood attributes on residential satisfaction in urban, suburban, and exurban
neighborhoods. They found that neighborhood correlates of residential satisfaction differ
across contexts, and most attributes have nonlinear impacts on residential satisfaction.
Given the potential nonlinear associations, understanding this nonlinearity is essential to
improving satisfaction in effective and efficient ways. However, few studies have

43
explicitly examined the nonlinear relationship between life satisfaction and its
environmental correlates. If the potential nonlinearity is not fully understood, resources
could be wasted without achieving desired outcomes. This study fills this research gap
by employing IAA to analyze the influence pattern of environmental correlates of life
satisfaction.
3.3 Data and Methods
3.3.1 Data
The data used in this study were collected in the Neighborhood Environment, Daily
Activities, and Well-Being Study. The data collection took place in the Twin Cities
Metro Area over a year from October 2016 to October 2017. The rationale of sampling
consists of three components: the population, the sampling frame, and the sampling
strategy. The population contains all the residents living in the Twin Cities. Then, a
sampling frame was constructed to ensure the diversity and representativeness of the
sample. Researchers decided that the selected neighborhoods should vary regarding three
criteria: neighborhood infrastructure, urban form, and transportation access. Considering
the practical difficulty of evaluating neighborhood infrastructures on site, income level
was used as a proxy to differentiate the level of neighborhood infrastructures.
Researchers referenced the median income of U.S. census and categorized the
neighborhoods into lower-income and higher-income groups. Then, urban forms were
taken into consideration. Specifically, researchers assured that both urban and suburban
neighborhoods are included in the sample. Finally, researchers used access to the light

44
rail as an indicator of transportation accessibility and selected neighborhoods both with
and without light rail accesses. Based on this sampling rationale, six neighborhoods were
selected to represent neighborhoods in the Twins Cities (Figure 5). We further divided
the six neighborhoods into higher-income and lower-income neighborhoods (Table 5).
Researchers identified a proper sample size and employed the probability sampling
strategy to select participants within the six neighborhoods. They randomly selected 921
census blocks in the study areas and sent out invitations to 1,700 households within these
census blocks. About 400 households participated in the research, and each participant
received an incentive of 50 dollars. A total of 360 valid observations were collected.
Figure 5 Study Areas

45
Table 5 Income Levels of Sampled Neighborhoods
Neighborhoods Median household income
Near North $25,000 TO $49,999
Lower income Phillips $25,000 TO $49,999
Brooklyn Center $50,000 TO $74,999
Blaine $75,000 TO $99,999
Higher income Prospect Park $75,000 TO $99,999
St. Anthony Park $100,000 OR MORE
The survey measured satisfaction with life using the Satisfaction with Life Scale (SWLS)
developed by Diener et al. (1985). Survey participants evaluated five statements about
their lives on a seven-level scale from “strongly agree” to “strongly disagree”. These five
statements include “In most ways my life is close to my ideal”, “The conditions of my
life are excellent”, “I am satisfied with my life”, “So far I have gotten the important
things I want in life”, and “If I could live my life over, I would change almost nothing”.
SWLS shows good psychometric characteristics and is widely used in many studies to
assess life satisfaction (Pavot & Diener, 1993). In the survey, respondents were also
asked to assess their satisfaction with 31 neighborhood attributes on a five-level Likert
scale from “very dissatisfied” to “very satisfied”. Based on Maslow’s hierarchy of
human needs, we classified these neighborhood attributes into seven categories (Figure
6).

46
Figure 6 Neighborhood Attributes in Hierarchy of Humen Needs
We also controlled for seven socio-demographic variables: age, race, sex, household size,
vehicle ownership, employment, and years spent in the neighborhood. Table 6
summarizes the main characteristics of the sample.

47
Table 6 Control Variables
High-Income
Neighborhoods
Low-Income
Neighborhoods
Number of observations 190 169
Average age 51 49
Average household sizes 3 3
Percent of female 35% 32%
Percent of full-time workers 46% 38%
Percent of non-white population 9% 36%
Average vehicle per household 2 2
Average years lived in the neighborhood 16 14
3.3.2 Methods
3.3.2.1 Gradient boosting decision tree (GBDT)
We employed GBDT to analyze the correlation between satisfaction with neighborhood
attributes and life satisfaction. GBDT combines the results of multiple individual
decision trees to provide the final output. These algorithms reduce errors of the final
model by correcting and learning from errors in each round of iterations. GBDT has
many advantages compared with traditional regression (Ding et al., 2018). As an
ensemble-based algorithm, GBDT provides more accurate and stable results than
individual regression models. GBDT is also more robust in dealing with
multicollinearity. Like other boosting and tree-based algorithms, correlations between
independent variables are already accounted for in the process of building trees. Finally,
GBDT handles missing values well, requires much less data cleaning and works well
with both categorical and continuous data.
When used in practice, given a sample of (y, x), the goal of gradient boosting is to fit a
function of f(x) that minimizes the loss function ψ [y, f(x)]. Friedman (2001) developed

48
this gradient boosting algorithm. The output of a gradient boosting model can be
presented as follow (Ding et al., 2018; Zhang & Haghani, 2015):
We carry out this algorithm using the “gbm” package in R (Ridgeway, 2007). The main
outputs of GBDT models are as follows:
• Squared error loss: An average of the squared error (the deviation between
observed values and predicted values).
• The optimized number of decision trees: The number of decision trees that
minimizes the squared error loss.
• Relative influence: The increase of the squared error when an independent
variable is excluded, relative to other predictors.
• Partial dependence plot: A graph showing how the predicted value of the
dependent variable changes with respect to the changes of an independent
variable while controlling for other variables.
3.3.2.2 Impact-Asymmetry Analysis (IAA)
We employed IAA to illustrate the potential nonlinear relationship between life
satisfaction and satisfaction with its environmental correlates. Mikulić and Prebežac

49
(2008) developed IAA to better illustrate asymmetric and nonlinear relationships between
service attributes and satisfaction. It is a form of penalty-reward contrast analysis and
has a nuanced implementation method (Cao et al., 2020; Dong et al., 2019). An attribute
provides reward when it performs well and increases satisfaction. When an attribute
performs poorly and decreases satisfaction, it provides penalty. IAA compares the
relative strength of reward and penalty of each attribute and classifies it into one of the
five categories shown in Table 7. In Section 4.1, we describe specific steps of conducting
an IAA.
Table 7 IAA Categories
Categorizations Descriptions Reward vs.
Penalty
Dissatisfiers
Cause dissatisfaction when performing
poorly, but do not lead to satisfaction when
performing well.
Reward < Penalty
Frustrators Extreme cases of dissatisfiers Reward << Penalty
Satisfiers
Lead to satisfaction when performing well,
but do not cause dissatisfaction when
performing poorly
Reward > Penalty
Delighters Extreme cases of satisfiers Reward >> Penalty
Hybrids Cause both satisfaction and dissatisfaction
and have linear impacts on satisfaction Reward ≈ Penalty
IAA classifications have implications for the importance hierarchy of satisfaction and
policymaking. First, frustrators and dissatisfiers cause dissatisfaction when performing
poorly but have limited effects on generating satisfaction when performing well.
Although these attributes do not make neighborhoods fancy, they can be the so-called
“deal-breaker” in many cases. Therefore, frustrators and dissatisfiers are key to
neighborhood planning and need to be fulfilled first. The planning goal is to make them

50
meet resident expectation. However, additional investment may not be fruitful because
they do not delight residents. Second, hybrids have linear impacts on life satisfaction,
which make them influential when performing both well and poorly. As a result,
planners should invest hybrids as long as resources are available. Finally, delighters and
satisfiers generate satisfaction when performing well but have very limited impacts when
performing poorly. They are advanced features that do not upset residents and are
capable to delight them. The planning goal is to make them exceed resident expectation.
Overall, for neighborhood attributes with a similar magnitude of impacts, frustrators are
the most important, followed by dissatisfiers, hybrids, satisfiers, and delighters (Figure
7).
Figure 7 Influence pattern of IAA Factors

51
3.4 Results and discussion
We ran two GBDT models for lower-income and higher-income neighborhoods,
respectively. We set the initial number of trees as 50,000 in both models to leave rooms
for tuning in the later steps. Both models were built at a slow learning rate of 0.001 to
avoid overfitting. Based on the initial models, we conducted five-fold cross-validations
and identified the optimal numbers of trees that minimize the prediction error. We used
the models with the optimal numbers of trees for further analyses. A comparison of R-
squares shows that the model for lower-income neighborhoods (0.58) has a higher
explanatory power than that for higher-income neighborhoods (0.41).
3.4.1 Relative Influences
One feature of the GBDT model is that it can produce the relative influence of a
predictor, which measures the marginal contribution of the predictor to reducing
prediction errors, relative to other predictors. The relative influences of all predictors in a
model add up to 100%. After controlling for socio-economic and demographic variables,
satisfaction with neighborhood attributes have a higher collective relative influence in
higher-income neighborhoods (75%) than in lower-income neighborhoods (57%). In
other words, socio-economic and demographic variables have a larger power to predict
life satisfaction of residents living in lower-income neighborhoods.

52
Table 8 summarizes the neighborhood attributes whose relative influences rank about the
top one third in each model. These attributes are placed in groups based on Maslow’s
updated hierarchy of human needs. Four attributes have strong influences on life
satisfaction of inhabitants in both types of neighborhoods (as shown in the underlined
texts in Table 8). Three of the four common variables are associated with societal needs,
including esteem (“ability to participate in neighborhood decisions that impact you/your
family”) as well as love and belonging (“the number of friends” and “relations with
residents of your neighborhood”). Needs for esteem, love, and belonging are part of the
higher-level ones, and they show similar levels of influences in both types of
neighborhoods. Moreover, bike infrastructure contributes substantially to life satisfaction
in both types of neighborhoods. This is not surprising in that Minneapolis is one of the
most bikeable cities in the U.S.

53
Table 8 Important Neighborhood Attributes in Maslow’s Updated Hierarchy
Higher-income Neighborhoods Lower-income Neighborhoods
Transcendence needs
• Access to place of worship (3.56%)
Aesthetic needs
• Access to quality leisure, recreation
and entertainment (5.02%)
• Parks and playgrounds in your
neighborhood (4.96%)
• Neighborhood greenery (4.19%)
Cognitive needs
• Access to quality schools and other
educational institutions (11.35%)
Esteem needs
• Ability to participate in neighborhood
decisions that impact you/your family
(3.62%)
• Ability to participate in
neighborhood decisions that
impact you/your family (4.89%)
Love and belongingness needs
• The number of friends you have in
your neighborhood (4.43%)
• Relations with residents of your
neighborhood (3.81%)
• The number of friends you have in
your neighborhood (3.92%)
• Relations with residents of your
neighborhood (3.57%)
Safety needs
• Access to quality banks and other
financial institutions (2.71%)
• Safety from crime in your
neighborhood (2.05%)
Physiological needs
• Sidewalks in your neighborhood
(5.38%)
• Access to quality stores for all
other purchases (other than
grocery stores) (4.29%)
• Bike trail/paths in your
neighborhood (4.13%)
• Drainage in your neighborhood
(6.02%)
• Air quality in the neighborhood
(3.12%)
• Noise in the neighborhood
(2.93%)
• Bike trail/paths in your
neighborhood (4.92%)
Notes:
1. The attributes are placed in groups based on Maslow’s updated hierarchy of human needs.
2. Percentages in the parentheses show the relative influence of each attribute.
3. Attributes that are influential in both models are shown in underlined texts.

54
Although several attributes carry weights in both models, most attributes show noticeable
influences only in one model. As shown in Table 8, six attributes appear only in higher-
income neighborhoods. Two of them fall into the category of physiological needs in
Maslow’s updated hierarchy, whereas the rest four attributes belong to higher-level
needs. In particular, aesthetic needs (“parks and playgrounds in your neighborhood” and
“access to quality leisure, recreation and entertainment”) contribute substantially to life
satisfaction in these affluent neighborhoods. Likewise, residents in higher-income
neighborhoods value cognitive needs (i.e., “access to quality schools and other
educational institutions”) and transcendence needs (i.e., “access to place of worship”)
more, which satisfy their needs for personal growth and religious beliefs.
Among all the neighborhood attributes in the model for higher-income neighborhoods,
“access to quality schools and other educational institutions” has a dominating effect,
with a relative influence of 11.35%. The finding is reasonable because higher-income
parents emphasize school quality in their residential choice. Many studies have shown
the positive link between school performance and housing prices of neighborhoods
within the same school district (Black & Machin, 2011; Weimer & Wolkoff, 2001).
Higher-income parents are more willing to pay housing premiums for the opportunity to
send their children to a high-quality school. This phenomenon leads to the income
segregation across school districts (Owens, 2018). Higher-income households would
cluster in high-quality school districts, where access to quality schools carries a larger
weight than in other areas.
By contrast, most of the six attributes that are important to only lower-income
neighborhoods fall into categories of lower-level needs in Maslow’s updated hierarchy.

55
Apart from “neighborhood greenery”, the rest five attributes belong to physiological and
safety needs. Both air quality and noise in the neighborhood are associated with
biological needs such as breathing and sleeping. “Safety from crime in your
neighborhood” and “access to quality banks and other financial institutions” affect
personal and financial safety.
Drainage has the largest influence on life satisfaction in lower-income neighborhoods,
which may be related to flooding vulnerability. The vulnerability essentially results from
the lack of quality infrastructure (such as drainage and sewage), which happens more
often in lower-income neighborhoods. Poverty at the community level may cause greater
damages of flooding due to inadequate preparation (Ajibade, McBean, & Bezner-Kerr,
2013; Brouwer, Akter, Brander, & Haque, 2007).
“Access to banks and other financial institutions” is important to residents in lower-
income neighborhoods. More presence of bank branches can improve the financial
condition of residents living nearby (Ergungor, 2010). However, the banking needs of
residents living in lower-income neighborhoods are often left unmet. Bank branches are
underrepresented in lower-income neighborhoods (Caskey, 1994), which potentially
makes their residents dependent on alternative financial services such as payday lenders
and check cashers (Faber, 2019). Our results are along the same line and confirm the
importance of providing quality financial services in low-income neighborhoods. Lower-
income neighborhoods also tend to suffer from disproportionally high levels of noise and
air pollution (Casey et al., 2017; Verbeek, 2019), thus making noise and air quality
important to residents living in these neighborhoods. “Safety from crime in your
neighborhood” is also of some importance in the model. Lower-income neighborhoods
56
are often at greater risks of crime and violence (Durkin et al., 1994; Ohmer et al., 2010),
which make safety a concern of residents living in these neighborhoods.
Table 8 shows that residents living in lower-income neighborhoods are more likely to
value lower-level needs than those in higher-income ones, which corresponds with
Maslow’s updated hierarchy of human needs. Residents in lower-income neighborhoods
still suffer from the deprivation of basic neighborhood features such as safety, clean air,
and quietness, which affect their basic living needs on a daily basis. Therefore, they tend
to concentrate on satisfying these lower-level needs before pursuing needs at higher
levels. In comparison, residents in higher-income neighborhoods focus on advanced
needs related to aesthetics, cognition, and transcendence. Their physiological and safety
needs are often satisfied already, thus allowing them to shift their focus from basic
features to higher hierarchies.
On the other hand, if we look at commonalities between the two models, the results are
somewhat incongruent with Maslow’s updated hierarchy and are consistent with
Alderfer’s ERG theory. The needs for esteem, love, and belonging, which are part of
higher-level needs, show importance in both models. This suggests that people’s needs
do not necessarily move from lower to higher hierarchies. Instead, when lower needs are
not met, people could progress to higher needs, and vice versa. Many studies have found
a positive linkage between neighborhood social capital and residents’ well-being
(Altschuler, Somkin, & Adler, 2004; Lochner, Kawachi, Brennan, & Buka, 2003;
Mohnen, Groenewegen, Völker, & Flap, 2011). Higher social capital could act as a
buffer against the negative impact of poverty (Cramm, Van Dijk, & Nieboer, 2013). Our

57
results show that social capital is an essential attribute in both higher-income and lower-
income neighborhoods.
3.4.2 Impact-Asymmetry Analysis
Based on the results of GBDT, we further carried out an IAA and classified the top 10
most important satisfactions with neighborhood attributes into five categories (delighters,
satisfiers, hybrids, dissatisfiers, and frustrators). The basic rationale of IAA classification
is to compare an attribute’s relative capability to generate reward and penalty. As
illustrated in Figure 8, on a three-level scale, when an attribute does not perform well
(moving from medium (2) to poor (1)), it tends to negatively impact satisfaction, which
we refer to as penalty index (PI). By contrast, when the attribute performs well (moving
from medium (2) to good (3)), it tends to offer a positive effect on satisfaction, which we
refer to as reward index (RI). For each attribute, the IAA starts by calculating its PI and
RI. Thereafter, we divide the RI and PI by its total range of impact on satisfaction (RIS)
and produce its relative capabilities to cause satisfaction and dissatisfaction: satisfaction
generating potential (SGP) and dissatisfaction generating potential (DGP). The
difference between SGP and DGP is the impact asymmetry (IA) index, which we use for
factor classification.
Here we follow the classification criteria from Lee and Min (2013) to define the
categories:
• Delighters (IA ≥ 0.7)
• Satisfiers (0.2 ≤ IA < 0.7)
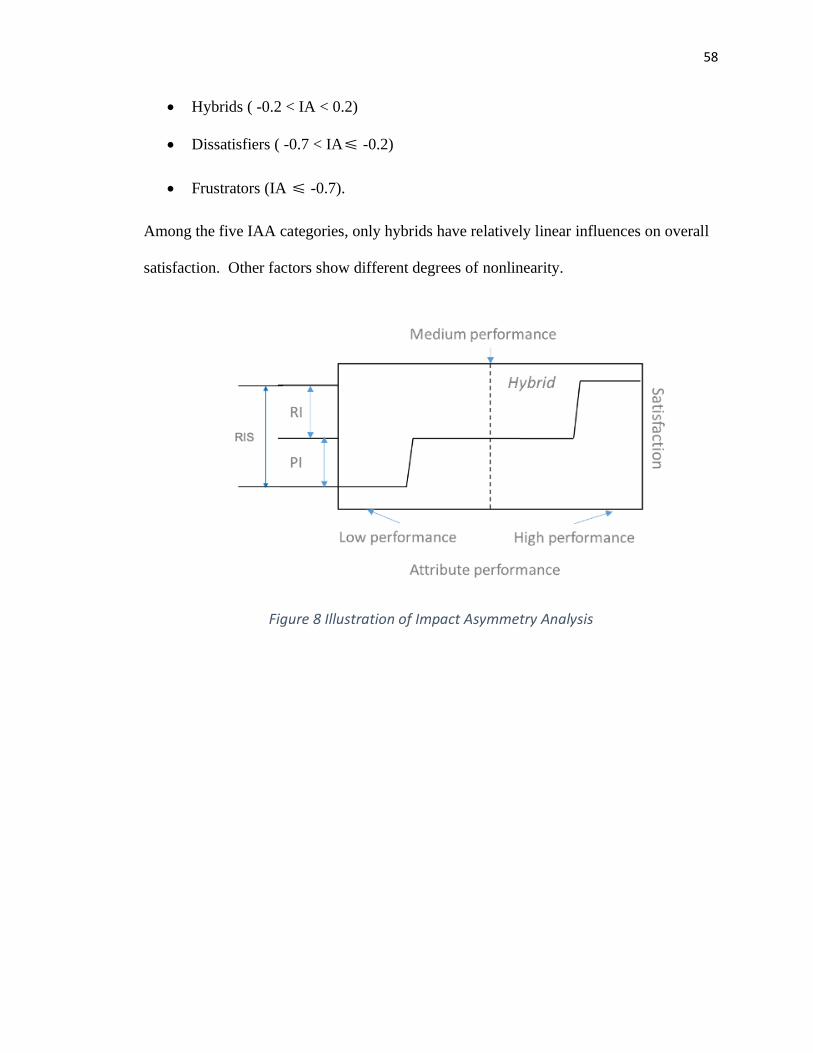
58
• Hybrids ( -0.2 < IA < 0.2)
• Dissatisfiers ( -0.7 < IA≤ -0.2)
• Frustrators (IA ≤ -0.7).
Among the five IAA categories, only hybrids have relatively linear influences on overall
satisfaction. Other factors show different degrees of nonlinearity.
Figure 8 Illustration of Impact Asymmetry Analysis

59
Table 9 Impact Asymmetry Analysis for Higher-Income Neighborhoods
RIS RI PI SGP DGP IA Classification Mean
Access to quality schools and other educational
institutions 3.50 3.50 0.00 1.00 0.00 1.00 Delighter 2.84
Sidewalks in your neighborhood 1.35 1.34 0.02 0.99 0.01 0.98 Delighter 2.68
Access to quality leisure, recreation and
entertainment 1.85 1.21 0.64 0.65 0.35 0.31 Satisfier 2.53
Parks and playgrounds in your neighborhood 0.47 0.44 0.02 0.95 0.05 0.90 Delighter 2.79
The number of friends you have in your
neighborhood 1.78 1.72 0.06 0.97 0.03 0.94 Delighter 2.50
Access to quality stores for all other purchases 1.85 0.52 1.33 0.28 0.72 -0.44 Dissatisfier 2.54
Bike trail/paths in your neighborhood 1.01 0.59 0.42 0.58 0.42 0.16 Hybrid 2.47
Relations with residents of your neighborhood 1.57 0.47 1.10 0.30 0.70 -0.40 Dissatisfier 2.71
Ability to participate in neighborhood decisions
that impact you/your family 0.91 0.43 0.48 0.47 0.53 -0.06 Hybrid 2.58
Access to place of worship 1.63 1.63 0.00 1.00 0.00 1.00 Delighter 2.76
Notes:
RIS: Range of Impact on Satisfaction; RI: Reward Index; PI: Penalty Index; SGP: Satisfaction generating potential; DGP: Dissatisfaction
generating potential; IA: IA index

60
Table 10 Impact Asymmetry Analysis for Lower-Income Neighborhoods
RIS RI PI SGP DGP IA Classification Mean
Drainage in your neighborhood 2.79 0.21 2.59 0.07 0.93 -0.85 Frustrator 2.45
Bike trail/paths in your neighborhood 2.50 0.53 1.97 0.21 0.79 -0.58 Dissatisfier 2.40
Ability to participate in neighborhood decisions
that impact you/your family 2.51 1.43 1.07 0.57 0.43 0.14 Hybrid 2.13
Neighborhood greenery 2.25 1.95 0.31 0.86 0.14 0.73 Delighter 2.57
The number of friends you have in your
neighborhood 2.08 1.72 0.36 0.83 0.17 0.65 Satisfier 2.39
Relations with residents of your neighborhood 1.92 1.23 0.68 0.64 0.36 0.29 Satisfier 2.54
Air quality in the neighborhood 1.87 0.66 1.21 0.35 0.65 -0.29 Dissatisfier 2.34
Noise in the neighborhood 1.48 0.38 1.11 0.25 0.75 -0.49 Dissatisfier 2.01
Access to quality banks and other financial
institutions 1.35 1.21 0.14 0.90 0.10 0.80 Delighter 2.48
Safety from crime in your neighborhood 1.00 0.50 0.50 0.50 0.50 0.00 Hybrid 1.90
Notes:
RIS: Range of Impact on Satisfaction; RI: Reward Index; PI: Penalty Index; SGP: Satisfaction generating potential; DGP: Dissatisfaction
generating potential; IA: IA index

61
Table 9 and Table 10 show that most of the important neighborhood attributes tend to
have nonlinear correlations with life satisfaction of residents living in both types of
neighborhoods. The IAA classification for higher-income neighborhoods (Table 9)
results in two hybrids: “bike trails/paths in your neighborhood” and “ability to participate
in neighborhood decisions that impact you/your family” linearly affect life satisfaction.
For lower-income neighborhoods (Table 10), life satisfaction is linearly associated with
two attributes (“ability to participate in neighborhood decisions that impact you/your
family” and “safety from crime in your neighborhood”). All other neighborhood
attributes have asymmetric relationships with life satisfaction. Specifically, in higher-
income neighborhoods, one attribute is a satisfier and five are delighters. In lower-
income neighborhoods, two attributes are satisfiers and two are delighters. Satisfiers and
delighters increase satisfaction when performing well but do not greatly decrease
satisfaction when performing poorly. Moreover, in higher-income neighborhoods, two
attributes are dissatisfiers. In lower-income neighborhoods, one attribute is a frustrators
and three are dissatisfiers. Contrary to satisfiers and delighters, dissatisfiers and
frustrators decrease satisfaction when performing poorly, but do not greatly increase
satisfaction when performing well.
There are more delighters/satisfiers in the higher-income model and more
frustrators/dissatisfiers in the lower-income model. A potential reason for this pattern is
that different neighborhoods are under the influence of different attributes. In general,
most of the influential attributes in higher-income neighborhoods belong to advanced
needs such cognitive needs (access to schools), aesthetic needs (access to parks and
access to leisure and entertainment), and transcendence needs (access to places of

62
worship). They can largely increase residents’ quality of life when performing well but
are not essential needs. In other words, they are value-added, a key feature of satisfiers
and delighters. By contrast, most of the attributes showing strong influences in the
lower-income models are physiological needs (such as drainage, bike infrastructure, air
quality, and noise). These needs are necessities to daily living, which makes them
dissatisfiers and frustrators. This distinction also corresponds with Maslow’s theory.
Two attributes appear in both models but show different influence patterns. “Relations
with residents of your neighborhood” is a dissatisfier in higher-income neighborhoods
but a satisfier in lower-income neighborhoods. Having good social relations with
neighbors is a necessary feature that could upset residents in higher-income
neighborhoods, where the length of stay is longer and social relations are more stable
than lower-income neighborhoods. Residents living in lower-income neighborhoods
usually reside for a shorter duration than places with lower poverty rates (Ye et al., 2016).
In many cases, their mobility decisions are not made for improving living quality but for
alleviating financial burdens. As a result, residents tend to focus on issues essential to
basic needs, thus having little expectation on “relations with residents of your
neighborhood”. Therefore, when performing poorly, satisfaction with this attribute has a
limited contribution to life dissatisfaction in lower-income neighborhoods. This does not
mean that this attribute is negligible in lower-income neighborhoods. On the contrary,
social support is especially necessary to maintain the living quality of low-income
residents (Skobba & Goetz, 2013). The finding of this chapter points to the need to
improve basic features of lower-income neighborhoods and allow residents to focus on
building stable social networks.

63
“Bike trails/paths in your neighborhood” is a hybrid in higher-income neighborhoods but
a dissatisfier in lower-income neighborhoods. Residents in higher-income neighborhoods
might also use bike trails/paths for recreational trips. In these neighborhoods, bike
trails/paths are also referred to as recreational facilities, so they would continue
delighting residents by satisfying both utilitarian and recreational travel needs. By
contrast, many residents living in lower-income neighborhoods are dependent on bike
trails/paths for utilitarian trips. Bike infrastructure is a necessity to their daily lives, so it
leads to dissatisfaction when performing poorly but does not delight residents when
performing well.
It is worth noting that several attributes have a moderate RIS but a large PI. They might
be easily overlooked due to the size of their overall impacts, yet they could substantially
dissatisfy residents when performing poorly. In higher-income neighborhoods, “access to
quality stores for all other purchases” and “relations with residents of your
neighborhood” are of this type. So are “air quality in the neighborhood” and “noise in
the neighborhood” in lower-income neighborhoods. These attributes are either
dissatisfiers or frustrators, representing residents’ basic needs.
3.5 Conclusion
This study analyzes life satisfaction of residents living in higher-income and lower-
income neighborhoods and discusses the relevance of two psychological theories of
human needs (Maslow’s Hierarchy and Alderfer’s ERG theory) in the field of planning.
Applying gradient boosting decision trees (GBDT) and impact-asymmetry analysis (IAA)

64
to the two sub-samples, we identified the satisfactions with neighborhood attributes that
are important to their life satisfaction, respectively. The GBDT results show that several
attributes contribute to both models, while many other attributes show different
associations across neighborhoods. In general, residents in higher-income neighborhoods
tend to value advanced needs, whereas residents in lower-income neighborhoods are
more likely to emphasize necessities. Moreover, the IAA results show that higher-
income neighborhoods have more delighters/satisfiers (i.e., value-added attributes),
whereas lower-income neighborhoods have more dissatisfiers and frustrators (i.e., must-
be attributes). These divergences correspond with Maslow’s theory positing that people
tend to shift focus to more advanced needs after necessities have been met. On the other
hand, the commonalities of the GBDT results between neighborhoods imply that the
ERG theory is also at work. Therefore, both Maslow’s hierarchy and the ERG theory
have important implications in practice. Using only one theory as the foundation in
practice could lead to ineffective results.
This study is also one of the few to test the nonlinear impact of neighborhood attributes
on residents’ life satisfaction. The IAA results show that the majority of neighborhood
attributes have nonlinear and asymmetric correlations with life satisfaction. If the
nonlinearity is overlooked, we will produce biased estimates for the influences of
neighborhood attributes and misreport their relative influence. This is detrimental to
identifying importance hierarchy of neighborhood attributes. Furthermore, some
dissatisfiers and frustrators that are not that important in terms of the relative influence
can substantially decrease satisfaction when performing poorly. The examples in this
study include store accessibility and neighbor relations in higher-income neighborhoods

65
and air quality and noise in lower-income neighborhoods. These attributes could be the
“deal-breaker” for residents, but they are also easily neglected by planners due to their
moderate total influences.
The comparison of IAA results between neighborhoods reveals that the same
neighborhood attribute could have distinct patterns of impacts in higher-income and
lower-income neighborhoods. The IAA framework indicates that meeting the acceptable
level of performance would be sufficient for dissatisfiers and frustrators; hybrids should
be improved as much as possible, and if resources permit, satisfiers and delighters should
be improved to the highest level to delight residents. Therefore, a “one size fits all”
approach is undesirable and context-specific strategies are needed in different type of
neighborhoods.
More importantly, the results of this research provide the foundation for collaborative
planning. Communication with residents is vital to fully understand why residents of
different neighborhoods have certain needs that differ. Using the information and the
analytical approaches presented in this paper, planners could also conduct detailed and
in-depth research on the potential needs of different neighborhoods, based on which they
could effectively identify improvement priorities and engage stakeholders. This
collaborative process based on analytical results has a great potential to substantially
improve the living quality of residents of various types of neighborhoods.

66
Chapter 4
Does Context Matter? A Comparison Study of the
Living Environment and Life Satisfaction in the
U.S. and China.
4.1 Introduction
Life satisfaction reflects one’s overall cognitive evaluation of quality of life (Diener et
al., 1985). Improving people’s life satisfaction has been one of the major goals of urban
planning and sustainable development (Cao, 2016; Neve & Sachs, 2020; United Nations,
2020). Urban planners across the world have strived to improve the quality of the living
environment, which has been identified as an important correlate of life satisfaction
(Dong & Qin, 2017; Musikanski, Polley, Cloutier, Berejnoi, & Colbert, 2017; Zhang &
Zhang, 2019). Life satisfaction has also been empirically investigated in different
cultural contexts. Previous studies confirmed that both individual characteristics and
environmental attributes are important correlates of life satisfaction in both developed
and developing countries (Appleton & Song, 2008; Bai, Wu, Zheng, & Ren, 2011; Cao,
2016; Friedman, Parikh, Giunta, Fahs, & Gallo, 2012; Liu, Zhang, Wu, Liu, & Li, 2017;
Pfeiffer, Ehlenz, Andrade, Cloutier, & Larson, 2020).
67
A closer look at the relative importance of the associates of life satisfaction, however,
reveals that geographical variations may exist in different regions. For example,
according to the World Happiness Report, in America, health plays the most important
role in predicting subjective well-being while in Asia, economic development and
institutional justice are the most important correlates of subjective well-being (Neve &
Sachs, 2020). The regional heterogeneity of the correlates leads to an important lesson:
planners should make decisions based on context-specific evidence instead of previous
findings. Without a sufficient understanding of the differences across contexts,
practitioners could be referencing findings that do not apply to their conditions, thus
leading to ineffective planning and undesirable results. However, comparisons of the
roles of environmental associates in predicting life satisfaction across regions and
cultures have seldom been conducted (Pfeiffer & Cloutier, 2016). Moreover, many
studies focus on estimating the presence of impacts without sufficient attention to the size
of the impact, especially the impact size of the living environment collectively. This lack
of understanding may mis-prioritize the elements when improving the living
environment.
This study intends to fill these research gaps through a comparison study between two
metropolitan areas: The Twin Cities in the U.S. and Guangzhou in China. These two
regions are selected because they differ greatly in economic, political, and cultural
systems, which may influence the evaluation of life satisfaction. For example, while
China’s collectivist culture may emphasize social norms, the U.S.’s individualistic
culture may encourage personal emotions when evaluating life satisfaction (Suh, Diener,
Oishi, & Triandis, 1998). Using a machine learning algorithm –– gradient boosting

68
decision trees (GBDT), we aim to find out how the potential differences impact the
correlates of life satisfaction in the two regions. This study will answer the following
main research questions: How important is the living environment to life satisfaction?
What are the most important correlates of life satisfaction? Are there any differences in
the results between the two regions?
This study contributes to the life satisfaction literature in two aspects. First, we compared
the correlates of life satisfaction in two completely different cultural contexts. Our
findings indicated that context does matter – different antecedents play different roles in
determining life satisfaction in varying cultural contexts. Second, as advocated by Ziliak
and McCloskey (2004), studies should report the size of correlation, which would allow
planners and private sector actors to direct resources to the most important aspects (Cao,
Wu, & Yuan, 2018). We took a step further – estimating not only the relative influence of
each correlate of life satisfaction but also the collective impact of living environment
variables. The estimation of collective impacts helps advocate related policies in
policymaking.
The rest of the paper is organized as follows: Section 2 reviews the existing knowledge
on life satisfaction and its living environment correlates; Section 3 introduces the data
and method used for the analyses; Section 4 presents major findings and discusses the
results; and Section 5 summarizes the paper and provides implications for practice and
future research.

69
4.2 Literature Review
4.2.1 Life Satisfaction across Contexts
Philosophers in human history have been seeking the meaning of a good life for
centuries. Many of them agreed that a good life requires a person to feel happy and be
satisfied with one’s life (Tatarkiewicz, 1976). Life satisfaction, therefore, has emerged to
evaluate a person’s quality of life (Diener et al., 1985; Shin & Johnson, 1978). It is one
of the sub-dimensions of subjective well-being (SWB), which refers to a person’s general
evaluation of one’s life, both emotionally and cognitively (Diener, 1984; Diener et al.,
1985). The affective and emotional component of subjective well-being measures a
person’s emotions and moods, whereas the judgmental and cognitive component of
subjective well-being usually measures a person’s overall satisfaction with life, known as
life satisfaction (Diener, Suh, Lucas, & Smith, 1999). Instead of subjective well-being,
we used life satisfaction in this comparison study for several reasons. First, unlike the
controversy of subjective well-being, life satisfaction has been used extensively and its
validity and reliability have been examined across gender, age, culture, and time (Bai et
al., 2011). Second, as a term originally developed in the U.S., life satisfaction has also
been validated in the Chinese context (Appleton & Song, 2008; Bai et al., 2011), making
it a better candidate for a comparison study between the U.S. and China. Third, in
English language studies on subjective well-being, life satisfaction, and happiness are
often used interchangeably while in Chinese, the meaning of the two terms are quite
different and even reversed (Chen, Davis, Wu, & Dai, 2015). Thus, to avoid potential
70
confusion and achieve a parsimonious model, life satisfaction is adopted to investigate
the differences of antecedents between the U.S. and China.
Some studies suggest that correlates of life satisfaction tend to differ across contexts
(Oishi, Schimmack, & Diener, 2001; Suh et al., 1998). The difference is particularly
substantial between individualistic and collectivistic cultures. Suh et al. (1998) found
that, in individualistic countries, emotion stands out in affecting people’s life satisfaction.
In comparison, for people living in collectivistic countries, social norms have an equal
level of impact as emotions. People in individualistic countries also connect their life
satisfaction more closely with life goals regarding self-enjoyment, but those who live in
collectivistic countries have more increases in life satisfaction when pursuing goals that
please others (Oishi et al., 2009). Likewise, people from a collectivistic culture tend to
evaluate life satisfaction based on others’ opinions (such as social appraisals), whereas
people in a country of individualism often make the evaluation based on their own
feelings (Suh, Diener, & Updegraff, 2008).
The level of general wealth among the population plays important yet different roles in
life satisfaction across contexts as well (Diener & Diener, 2009; Inglehart, 1990;
Kahneman & Deaton, 2010). When estimating life satisfaction, satisfaction with finance
serves as a better predictor among the poorer population, while home life works better in
predicting the life satisfaction of wealthier people (Diener & Diener, 2009). Although
richer countries tend to have higher life satisfaction in general than poorer countries,
positive life events have fewer impacts on their life satisfaction levels (Oishi, Diener,
Choi, Kim-Prieto, & Choi, 2007). In the cultures/countries known for high life
satisfaction, positive events happen more often, so a single good event does not seem to

71
have a strong impact. By contrast, in low satisfaction cultures/countries where positive
events happen less often, people react more strongly to the good things in life.
In general, as many above-mentioned studies have pointed out, contexts have strong
influences on the formation of life satisfaction. Culture, socioeconomic status, and daily
experiences affect how people make cognitive judgments about their lives. An in-depth
understanding of the construct of life satisfaction requires examination across cultures
and regions. However, a limited number of studies have explored the variation in life
satisfaction associated with living environment correlates across regions and cultures.
Therefore, planners may develop policies based on findings that apply only under a
different context. The lack of an adequate understanding of and consideration of the
context could lead to policymaking that are ineffective or even counterproductive.
4.2.2 Impacts of the Living Environment on Life Satisfaction
Researchers in the field of planning have discovered many living environment correlates
of life satisfaction and general well-being, among which housing is an important one
(Clapham et al., 2018). Many studies have found that homeownership has a positive
relationship with life satisfaction, both in China (Cheng et al., 2016) and the U.S. (Rohe
& Stegman, 1994). Full ownership shows greater positive significance than partial
ownership and minor ownership (Cheng et al., 2016). The physical condition of housing
also has a substantial effect on life satisfaction (Clapham et al., 2018; Evans et al., 2003;
Zhang et al., 2018). Factors such as poor lighting, lack of gardens, and noise tend to have
negative correlations with life satisfaction (Fujiwara, 2013), while housing size has a

72
positive impact on life satisfaction (Zhang et al., 2018). Housing types, such as single-
family home or multi-family dwelling, also show a correlation with life satisfaction
(Evans et al., 2003). In general, the impacts of housing characteristics on life satisfaction
in China are consistent with those of studies in the U.S. However, how important the role
of housing plays in different contexts is still underexplored.
Neighborhood is another major environmental correlate of life satisfaction and well-
being. The positive relationship between well-being and sense of community has been
tested and confirmed (Cantarero, Potter, & Leach, 2007; Prezza et al., 2001; Ramos,
Suarez, Leon, & Trinidad, 2017). Among various indicators of sense of community,
neighborhood relations have a great positive impact on life satisfaction, in particular
(Prezza et al., 2001). Physical characteristics of neighborhoods also have observable
links with well-being and life satisfaction (Pfeiffer & Cloutier, 2016). Neighborhoods
with compact design help promote social engagements, thus having positive relationships
with happiness (Dolan, Peasgood, & White, 2008; Mason, 2010). Access to open space
and greenness also bolster happiness by providing a sense of serenity (Akers et al., 2012).
As a result, seniors who live near parks report better physical health and mental well-
being (Loukaitou-Sideris, Levy-Storms, Chen, & Brozen, 2016). The physical features of
neighborhoods could also correlate with life satisfaction through indirect paths.
Neighborhood attributes such as landscape and street lighting could affect residents’
overall neighborhood satisfaction, which then impact their life satisfaction (Sirgy &
Cornwell, 2002). It should be noted that, while research on the role of neighborhood
characteristics in life satisfaction is relatively rich in developed countries, only a few

73
studies have investigated this relationship in the Chinese context (Liu, Dijst, & Geertman,
2017; Yuqi Liu et al., 2017).
The above-mentioned studies contribute greatly to the understanding of housing and
neighborhood’s association with life satisfaction. Nevertheless, many of them emphasize
only specific attributes and fall short in the discussion on the collective impact of living
environment variables. Quantifying the collective impact is essential to understanding
their effect sizes relative to demographic and socioeconomic variables, which further
helps advocate planning policies that aim to improve the living environment. Currently,
the collective impact of living environment variables is still in need of more in-depth
discussion.
To better explore the role context plays in the influential mechanism of life satisfaction in
urban areas as well as the collective impact of living environment variables, this study
compares the correlation of the same set of living environment attributes in two regions
in the U.S. and China, respectively. We discuss the results based on the differences of
cultural, socioeconomic, and urban form between these two regions. The research
findings deepen the understanding of the role of context in life satisfaction and provide
implications for future planning and research.

74
4.3 Research Design
4.3.1 Data and Variables
We used two data sets in this study. The Twin Cities data collection took place over a
year from October 2016 to October 2017. The sample contains 360 valid observations.
The Guangzhou data were collected from December 2016 to January 2017. The sample
contains 650 valid observations. The rationale of sampling consists of three major
components: the sample population, the sample frame, and the sampling strategy. The
sample population contains all the residents living in the Twin Cities and Guangzhou
Metro areas. Then, a sample frame was constructed to ensure the diversity and
representativeness of the sample. For the Twin Cities sample, researchers decided that
the selected neighborhoods should vary regarding three criteria: neighborhood
infrastructure, urban form, and transportation access. Income level was used as a proxy
to differentiate the level of neighborhood infrastructures. Then, urban forms were taken
into consideration. Researchers assured that both urban and suburban neighborhoods are
included in the sample. Finally, researchers used access to the light rail as an indicator of
transportation accessibility and selected neighborhoods both with and without light rail
accesses. Based on the above-mentioned sampling rationale, six neighborhoods were
selected to represent neighborhoods in the Twins Cities metro area (Figure 9).
In Guangzhou, the majority of people live in the several main urban districts, which have
a higher urban density and more intensive usage of public transportation compared to the
Twin Cities. In addition, a neighborhood in China usually takes the form of enclosed
high-rise residential buildings, which have visible boundaries (Lu, 2006). Thus, we

75
adopted a slightly different sampling strategy in Guangzhou. First, neighborhood sample
size was assigned to each of the five main districts of Guangzhou based on the population
size and neighborhood type in each district. Then, neighborhoods in each district were
randomly selected. We selected a total of 60 neighborhoods in the Guangzhou metro
area. Figure 10 illustrates the spatial distributions of the studied neighborhoods.
Figure 9 Study Areas in the Twin Cities

76
Figure 10 Study Areas in Guangzhou
We used the SWLS scale to measure life satisfaction in our surveys. Survey participants
evaluated five statements about their lives as follows: “In most ways my life is close to
my ideal,” “The conditions of my life are excellent,” “I am satisfied with my life,” “So
far I have gotten the important things I want in life,” “If I could live my life over, I would
change almost nothing.” After confirming the internal consistency of these five
statements, we calculated the average of the five evaluations and use the mean as the
dependent variable (Table A1 in the Appendix).
In response to the local context, the two data sets examined satisfaction with
neighborhood and housing conditions in slightly different ways, but they both identify
four categories of interest: housing conditions, neighborhood characteristics, sense of
community, and accessibility. The Cronbach Alpha coefficients within each of the four

77
categories all locate around 0.7 and 0.8, indicating that each category has an acceptable
level of internal consistency (Table A2 and A3 in the Appendix). We then calculated the
average of these four categories and formed four independent variables (Table 11). They
are both evaluated on a five-level Likert Scale from very dissatisfied (1) to very satisfied
(5). Besides life satisfaction and living environment variables, we also controlled for six
demographic and socioeconomic variables: age, gender, education level, household size,
income, and years lived in the neighborhood.
Table 11 Descriptive statistics of independent variables
Living environment variables Twin Cities Guangzhou
Mean Std. Dev. Mean Std. Dev.
Housing conditions 4.33 0.62 3.30 0.66
Neighborhood Characteristics 2.43 0.60 3.19 0.67
Sense of community 2.50 0.60 3.66 0.56
Accessibility 2.58 0.39 3.92 0.69
4.3.2 Methodology
We employ the gradient boosting decision tree (GBDT) to analyze the correlation
between life satisfaction and living environment variables. GBDT is a machine learning
algorithm that improves its prediction of the outcome through iterations. GBDT
improves weak learners by minimizing a loss function (the discrepancies between
predicted values and true values). Following a gradient descent procedure, GBDT adds
base learners to the previous learner one at a time to reduce the residual loss. The output
of each learner is considered in each iteration to improve the model accuracy. This
process will repeat until the number of iterations reaches a preset number or when the
loss function is minimized (Brownlee, 2016).

78
We carried out this algorithm using the “gbm” package in R (Ridgeway, 2007). The
main outputs of GBDT models are as follows:
• Squared error loss: An average of the squared error (deviation between true
values and predicted values).
• The optimized number of decision trees: The number of decision trees that
minimizes the squared error loss.
• Relative influence: An independent variable’s contribution to decreasing
prediction errors, relative to all other predictors. All the relative influences are
normalized and added up to 100.
• Partial Dependence plot: A graph showing how the predicted value changes
with respect to the changes of an independent variable after controlling other
variables.
The major drawback of GBDT is that it is more prone to overfitting, which makes it
necessary to cross-validate and adjust the number and depth of decision trees.
Nevertheless, GBDT still has many advantages compared with traditional regression. As
an ensemble-based algorithm, GBDT provides more accurate and reliable results than
individual regression models. GBDT is also more robust in dealing with
multicollinearity. Like other boosting and tree-based algorithms, correlations between
independent variables are already accounted for in the process of building trees. Finally,
GBDT handles missing values better, requires much less data cleaning, and works better
with both categorical and continuous data than regression approaches.

79
When used in practice, given a sample of (y, x), the goal of gradient boosting is to fit a
function of f(x) that minimizes the loss function ψ [y, f(x)]. Friedman (2001) developed
this gradient boosting algorithm. The output of a gradient boosting model can be
presented as follows (Ding et al., 2018; Zhang & Haghani, 2015):
4.4 Results and Discussion
4.4.1 Results
Using the GBDT algorithm, we conducted two separate analyses using data from the
Twin Cities and Guangzhou, respectively. The initial number of iterations was set to be
50,000 to leave room for decision tree tuning. Both models ran at a slow learning rate of
0.001 to minimize the possibility of overfitting. The iteration numbers for the two
models were then improved to achieve optimal results. The Twin Cities model has a
Pseudo R2 of 0.55. The Guangzhou model has a Pseudo R2 of 0.43.
The two models show substantial differences between the Twin Cities and
Guangzhou (Table 12). After controlling for demographic and socioeconomic variables,
satisfaction with living environment variables collectively have a greater contribution to
residents’ life satisfaction in Guangzhou (75%) than in the Twin Cities (53%).

80
Specifically, housing conditions have large influences in both models, but its contribution
is larger in the Guangzhou model (38%) than in the Twin Cities model (28%). The
influence of sense of community in Guangzhou (21%) is about twice as large as that in
the Twin Cities (11%). Accessibility has relatively small impacts in both models, with a
greater impact in Guangzhou (6%) than in the Twin Cities (3%). As to demographic and
socioeconomic variables, household income has considerable contributions to life
satisfaction in both regions, but it has a more dominating influence in the Twin Cities
model than in the Guangzhou model (22% vs. 6%).
Table 12 The Relative Influences of Predictors in the Models for the Twin Cities and Guangzhou
Variables Twin Cities Guangzhou
Relative Influences
Living
Environment
Housing conditions 28% 38%
Sense of community 11% 21%
Neighborhood characteristics 11% 10%
Accessibility 3% 6%
Subtotal 53% 75%
Demographics
and
Socioeconomics
Income 22% 6%
Education 3% 2%
Age 11% 8%
Household size 4% 2%
Years living in the neighborhood 5% 5%
Gender (Being Female) 2% 4%
Subtotal 47% 27%
Model Statistics
Squared error loss 0.82 0.32
Number of iteration 2,924 2,898
Pseudo R Square 0.55 0.43
Notes:
1. The relative influence of a variable refers to its contribution to reducing prediction errors,
relative to all other variables.
2. All the percentages are rounded to integers so the relative influences in the last column do not
add up to 100.
We also produced partial dependence plots for living environment variables (Figure 11
and Figure 12). In general, the same variables show similar patterns of influences in the
two regions. Specifically, housing conditions, sense of community, and accessibility
have trivial impacts when their performances are below medium. However, once

81
exceeding the medium level, they start to impose substantial positive impacts on life
satisfaction. Note that accessibility has a smaller overall impact on life satisfaction than
housing conditions and sense of community, resonating with the results in Table 2.
Neighborhood characteristics show a different influence pattern from the other three
living environment variables. In both models, they affect life satisfaction when
performing relatively poorly, but their impacts gradually saturate after reaching the
medium level.
The Twin Cities
Figure 11 Partial Dependence Plots for Living Environment Variables in the Twin Cities Model

82
Guangzhou
Figure 12 Partial Dependence Plots for Living Environment Variables in the Guangzhou Model
Overall, two differences stand out the most from the comparison of the two models.
First, among living environment variables, both housing conditions and sense of
community have notably larger influences in Guangzhou than in the Twin Cities.
Moreover, besides living environment variables, income shows a much greater impact in
the Twin Cities than in Guangzhou. These distinctions potentially result from economic
and cultural differences between the two regions.
4.4.2 Discussion
A comparison of model results shows that satisfaction with housing conditions have
different degrees of correlations with life satisfaction in the two regions. We could
interpret this discrepancy from financial, cultural, and psychological perspectives.
Financially, compared with the Twin Cities, housing in Guangzhou is much less

83
affordable. In 2014, the housing price-to-income ratio in Minneapolis is 2.84, meaning
that it costs a median-income household 2.84 years of annual income on average to
purchase a home (Department of Numbers, 2014). By contrast, the ratio in Guangzhou in
the same year is 9.10 (Information Times, 2015). The lower housing affordability in
Guangzhou makes housing conditions a higher priority. Thus, housing conditions in
Guangzhou have a stronger correlation with life satisfaction than those in the Twin Cities.
Cultural differences between the U.S. and China also contribute to the different results of
housing conditions. Chinese have the tradition to value fixed assets as a status symbol.
In China, as one of the most important fixed assets, housing is a stronger indicator of
wealth, lifestyle, and social hierarchy than it is in the U.S. (Li & Song, 2012). Therefore,
housing conditions have a greater value to Chinese than to Americans. Moreover, an
interesting point of view argues that the imbalanced sex ratio in China further adds to the
focus on housing conditions (Wei & Zhang, 2011). Because traditional Chinese prefer
boys to girls, the one-child policy motivates some of them to abort female fetuses
illegally. The excess of males among younger Chinese makes it difficult for males to go
into marriage. More and more males would choose to purchase private properties to
show their competency in the marriage “market”, which may boost the society’s
emphasis on housing conditions.
Finally, from a psychological point of view, the lower income of and wider wealth gap
among Guangzhou residents render their life satisfaction more affected by housing
conditions. Guangzhou ($22,676) has much lower per capita GDP than the Twin Cities
($65,343) (China Daily, 2020; MN DEED, 2019). The lower income puts Guangzhou
residents on a lower level of the Maslow hierarchy of human needs, emphasizing more on

84
physiological needs including sleep and shelter, which housing provides. The wealth
inequality in Guangzhou also contributes to residents’ focus on housing conditions. Due
to a larger wealth gap, Guangzhou residents’ housing conditions have greater disparities
than those in the Twin Cities. According to the social comparison theory, people tend to
determine their societal and personal worth by comparing with each other (Festinger,
1954). When there are substantial differences between individuals, the comparison will
generate more attitudes and emotions, which then affect satisfaction (Suls & Wills,
1991). Housing conditions vary greatly among Guangzhou residents, so their
comparisons of housing conditions produce more emotional fluctuations and then result
in a larger variation in life satisfaction. By contrast, the relatively homogenous housing
conditions in the Twin Cities do not have the same level of impacts.
Satisfaction with sense of community is another variable that has a stronger correlation
with life satisfaction in Guangzhou than that in the Twin Cities. Due to a more
collectivistic culture, it is natural that Chinese tend to value social ties and norms, thus
focusing more on sense of community. This finding could also partly attribute to the
“danwei” system in China. “Danwei” refers to the work units of state- or collectively-
owned institutions, which used to be the most typical form of neighborhoods in urban
China (Wang & Lin, 2014). Danwei compounds usually have designated residential
areas as well as their own services and facilities that can support employees and their
families to work and live within the compound. This relatively enclosed environment
with little residential mobility fosters the development of a strong sense of community.
In some ways, the danwei culture helped shape the urban culture in modern China (Li,
1993). Although danwei has experienced a decline and many residential neighborhoods

85
are now commercialized through market-oriented housing reforms, the place attachment
and social ties associated with the danwei culture remain strong in Chinese urban
neighborhoods (Li, Kleinhans, & van Ham, 2018).
Among the demographic and socioeconomic variables, income has relatively large
contributions to life satisfaction of residents living in both regions. Nevertheless, its
relative influences differ drastically between the two regions (22% vs. 6%). The lower
relative influence in Guangzhou is partially due to the potential mediation effect of
expensive housing. Instead of directly affecting life satisfaction, income may have
indirect influences through residents’ financial capacity to afford desirable housing and
neighborhood conditions in Guangzhou. That is, housing conditions capture some
influences of income. Moreover, urban dwellers in China suffer greatly from relative
deprivation, meaning that they focus less on absolute income levels but more on their
income relative to others (Knight & Gunatilaka, 2010). In other words, the relative
income level has a larger influence on life satisfaction of Guangzhou residents than the
absolute income level included in our model.
To illustrate the influence patterns of income, we produced partial dependence plots of its
marginal impacts (Figure 13). Interestingly, the impacts of income on life satisfaction are
opposite between the Twin Cities and Guangzhou. As household income grows, life
satisfaction in the Twin Cities increases, whereas that in Guangzhou decreases. The
pattern of the Twin Cities corresponds with existing research showing that income has a
positive association with life satisfaction in the U.S. (Kahneman & Deaton, 2010). On
the contrary, the negative relationship between income and life satisfaction in Guangzhou
seems counterintuitive at first glance. Two potential causes contribute to this

86
phenomenon (Knight & Gunatilaka, 2010). First, as mentioned earlier, urban dwellers in
China tend to suffer from relative deprivation. Their life satisfaction is affected by their
income relative to others and the capability of their income to sustain their desired
lifestyle. As income increases, people are likely to switch their reference group for
comparison to people with higher income levels than before. They are also more likely to
desire high living qualities. Both changes lead to aspiration gaps, which in turn decrease
people’s satisfaction with life. Second, as one of the largest cities in a rapidly developing
economy, Guangzhou’s social and economic status is in continuous transitions (Knight &
Gunatilaka, 2011). Rapid transitions in a city generate the feeling of insecurity, putting
its residents in a state of anomie with no traditional norms and guidelines to follow
(Durkheim, 1911). People with higher incomes also have more access to diverse sources
of information, thus allowing them to know more downside of the rapid economic
development (such as inequality and corruption). These drawbacks of a transitioning
society could potentially make people less satisfied with their lives.
Figure 13 Correlation between life satisfaction and income
87
4.5 Conclusion
Using data collected from the Twin Cities in the U.S. and Guangzhou in China, this study
explores how satisfaction with living environment variables and demographic and
socioeconomic characteristics affect life satisfaction under different contexts. The results
suggest that satisfaction with living environment has a substantial association with life
satisfaction both in the U.S. and in China. Nevertheless, the assessment of life
satisfaction, a subjective measure, should be context-specific. In particular, among the
four types of living environment variables, satisfaction with housing conditions and sense
of community have drastically different levels of impacts in these two regions. Both
have greater relative influences on life satisfaction in Guangzhou than in the Twin Cities.
The divergence could be attributable to the differences in culture, wealth, psychology,
and urban form between the two regions. Moreover, income has different degrees and
opposite directions of impacts in the Twin Cities and Guangzhou. These differences
could result from different cultural backgrounds and stages of economic development
between the two regions.
These findings have implications for urban planning and design practices. First,
policymaking should be based on contextual evidence instead of predetermined
standards. For instance, our findings suggest that sense of community has substantial
association with life satisfaction in Guangzhou but only moderate correlations in the
Twin Cities. Therefore, planners should conduct an in-depth investigation and adopt
contextualized and targeted strategies in housing and neighborhood designs and
improvements. Second, because living environment attributes have nonlinear
correlations with life satisfaction, planners should consider this nonlinearity in practice.

88
If an attribute’s impact saturates after reaching a threshold, the design standard of this
attribute could be set at a relatively low level, thus saving limited resources for other
attributes. On the other hand, if an attribute is not effective until reaching a certain
threshold, it should be designed with a high-level standard to secure its positive impact.
We recommend future research to conduct similar comparisons across regions and
cultural backgrounds. More comparison studies along the same line could offer a deeper
and wider understanding of the influence mechanism of the living environment on life
satisfaction and the transferability of life satisfaction research among different regions
and cultures. We also recommend qualitative studies across contexts as a future research
direction. Qualitative data and analyses would allow for a deeper understanding of why
differences across contexts exist and how planners could improve life satisfaction using
customized approaches.

89
Chapter 5
Conclusion
By conducting the three empirical studies, this dissertation fills the three major research
gaps identified in the introduction. First, the findings of Chapter 2 substantiate the
implications of previous research, showing that the same neighborhood attributes indeed
have different degrees and patterns of impacts on neighborhood satisfaction and life
satisfaction, respectively. In particular:
• Neighborhood satisfaction reacts more strongly to satisfaction with physical
features and appearances of the neighborhood, whereas life satisfaction correlates
more with satisfaction with cognition, leisure activities, and social cohesion.
• Many important attributes show nonlinear associations with neighborhood
satisfaction and life satisfaction.
• Important correlates of these two satisfaction outcomes differ drastically and do
not overlap with each other.
Second, the results of Chapters 3 and 4 confirm the divergence in living environment’s
influences across contexts. Chapter 3 suggests that neighborhood correlates of life
satisfaction differ in higher-income and lower-income neighborhoods. Specifically:

90
• Residents of higher-income neighborhoods value advanced needs (e.g. access to
leisure, educational facilities, and places of worship), whereas residents living in
lower-income neighborhoods attach greater importance to necessities (e.g. safety,
noise, air quality). Nevertheless, the need for love, belonging, and esteem shows
strong correlations with life satisfaction in both higher-income and lower-income
neighborhoods.
• The differences between the two types of neighborhoods correspond with
Maslow’s hierarchy of human needs, arguing that people’s needs progress to
high-level after satisfying low-level needs. Similarities between the two types of
neighborhoods, however, are better explained by Alderfer’s ERG (existence,
relatedness, and growth) theory, indicating that human needs can progress to
higher levels without satisfying lower-level needs first.
• The majority of important neighborhood attributes have nonlinear impacts on life
satisfaction of residents living in both higher-income and lower-income
neighborhoods.
Chapter 4 shows that it is not only the type of neighborhoods, but geographical locations,
economic status, and cultural backgrounds also have substantial influences on how
satisfaction with living environments contributes to life satisfaction. Its main findings
include:
• After controlling for demographic and socioeconomic variables, satisfaction with
living environment attributes show substantial impacts on life satisfaction in both
the Twin Cities and Guangzhou.

91
• Among the living environment attributes tested here, housing conditions and
sense of community have the largest correlations with life satisfaction.
• Collectively, living environment attributes have much larger impacts in
Guangzhou than in the Twin Cities. In particular, both housing conditions and
sense of community show substantially larger impacts in Guangzhou than in the
Twin Cities. It is also worth noting that, as an important socioeconomic variable,
income has opposite directions of impact in the Twin Cities and in Guangzhou.
These findings have important policy implications for planning practices:
Make Evidence-Based Policy Decisions
One of the most important contributions of this set of research is that it confirms the
essential role context plays in the influence mechanism of the living environment on life
satisfaction. Therefore, planning policymaking should be based on localized evidence
instead of solely on previous findings and predetermined standards. Furthermore,
planners should consider satisfaction outcomes of various domains in which the living
environment plays a key role. With multiple satisfactions being taken into account, a
wider range of neighborhood attributes will be considered in neighborhood designs and
improvements.
Consider Nonlinearity in Neighborhood Design and Improvement
This dissertation emphasizes the relevance of nonlinearity. The presence of nonlinearity
indicates that it could be wasteful and ineffective to treat neighborhood attributes
homogeneously in planning. Instead, planners should make strategic policy decisions
based on the pattern of influences. We highly recommend the use of approaches like the

92
impact-asymmetry analysis (IAA) in practice to identify and classify attributes based on
the shape of their associations with satisfaction. With an adequate understanding of these
nonlinear relationships, planners could allocated resources effectively and efficiently.
This dissertation also offers recommendations for future research on related topics:
Establish a Comprehensive Framework when Examining Satisfaction Outcomes
Our findings show that different satisfaction outcomes tend to react to the same living
environment attributes in different ways. Some attributes could appear to be futile to one
satisfaction outcome but influential to another. Therefore, I recommend establishing a
comprehensive framework of satisfaction outcomes when exploring their correlates. This
allows researchers to draw conclusions based on a panoramic depiction of the
relationship instead of an isolated examination.
Conduct Mixed-Method Research
Although the quantitative analyses conducted in this dissertation offer several new
perspectives on the relationship between the living environment and satisfaction, they
could not fully uncover the reasons underlying these empirical findings. For example, it
is hard to tell from quantitative results why some attributes’ impact saturates after
reaching a threshold, whereas other attributes won’t be effective until reaching a certain
point. The qualitative aspect of mixed-method research would allow for a deeper
exploration of these statistical findings and help answer the “why” question. By
conducting interviews and/or focus groups, researchers could gain a profound
understanding of the reason why residents react to certain attributes in the way they do,
which provide valuable insights in practice and academic research in the future.

93
Test the Generalizability of this Dissertation’s Findings
This dissertation research is based on the data from selected neighborhoods in two metro
areas. I am interested in the transferability of these results to other regions. I highly
recommend future studies to conduct similar analyses using data from diverse regions
and cultural contexts to test the generalizability of the empirical findings presented in this
research. I also encourage researchers to explore different correlates of life satisfaction
across diverse types of neighborhoods.

94
Bibliography
Abidin, N. Z., Abdullah, M. I., Basrah, N., & Alias, M. N. (2019). Residential satisfaction: Literature review and a conceptual framework. Paper presented at the IOP Conference Series: Earth and Environmental Science.
Ajibade, I., McBean, G., & Bezner-Kerr, R. (2013). Urban flooding in Lagos, Nigeria: Patterns of vulnerability and resilience among women. Global Environmental Change, 23(6), 1714-1725.
Akers, A., Barton, J., Cossey, R., Gainsford, P., Griffin, M., & Micklewright, D. (2012). Visual color perception in green exercise: Positive effects on mood and perceived exertion. Environmental science & technology, 46(16), 8661-8666.
Alderfer, C. P. (1969). An empirical test of a new theory of human needs. Organizational behavior and human performance, 4(2), 142-175.
Altschuler, A., Somkin, C. P., & Adler, N. E. (2004). Local services and amenities, neighborhood social capital, and health. Social science & medicine, 59(6), 1219-1229.
Antaramian, S. (2015). Assessing psychological symptoms and well-being: Application of a dual-factor mental health model to understand college student performance. Journal of Psychoeducational Assessment, 33(5), 419-429.
Antaramian, S. (2017). The importance of very high life satisfaction for students’ academic success. Cogent Education, 4(1), 1307622.
Appleton, S., & Song, L. (2008). Life satisfaction in urban China: Components and determinants. World Development, 36(11), 2325-2340.
Arthurson, K. (2012). Social Mix, reputation and stigma: Exploring residents’ perspectives of neighbourhood effects. In Neighbourhood effects research: New perspectives (pp. 101-119): Springer.
Bai, X., Wu, C., Zheng, R., & Ren, X. (2011). The psychometric evaluation of the Satisfaction with Life Scale using a nationally representative sample of China. Journal of Happiness Studies, 12(2), 183-197.
Basolo, V., & Strong, D. (2002). Understanding the neighborhood: From residents’ perceptions and needs to action. Housing Policy Debate, 13(1), 83-105.
Black, S. E., & Machin, S. (2011). Housing valuations of school performance. In Handbook of the Economics of Education (Vol. 3, pp. 485-519): Elsevier.
Brajša-Žganec, A., Merkaš, M., & Šverko, I. (2011). Quality of life and leisure activities: How do leisure activities contribute to subjective well-being? Social Indicators Research, 102(1), 81-91.
Broman, C. L. (1997). Race-related factors and life satisfaction among African Americans. Journal of Black Psychology, 23(1), 36-49.

95
Brouwer, R., Akter, S., Brander, L., & Haque, E. (2007). Socioeconomic vulnerability and adaptation to environmental risk: a case study of climate change and flooding in Bangladesh. Risk Analysis: An International Journal, 27(2), 313-326.
Brownlee, J. (2016). Supervised and unsupervised machine learning algorithms. Machine Learning Mastery, 16(03).
Campbell, A., Converse, P. E., & Rodgers, W. L. (1976). The quality of American life: Perceptions, evaluations, and satisfactions: Russell Sage Foundation.
Cantarero, R., Potter, J. J., & Leach, C. K. (2007). Perceptions of quality of life, sense of community, and life satisfaction among elderly residents in Schuyler and Crete, Nebraska. Architecture Program: Faculty Scholarly and Creative Activity, 35-38.
Cao, J., Hao, Z., Yang, J., Yin, J., & Huang, X. (2020). Prioritizing neighborhood attributes to enhance neighborhood satisfaction: An impact asymmetry analysis. Cities, 105, 102854.
Cao, X., Wu, X., & Yuan, Y. (2018). Examining built environmental correlates of neighborhood satisfaction: A focus on analysis approaches. Journal of Planning Literature, 33(4), 419-432.
Cao, X. J. (2016). How does neighborhood design affect life satisfaction? Evidence from Twin Cities. Travel Behaviour and Society, 5, 68-76.
Casey, J. A., Morello-Frosch, R., Mennitt, D. J., Fristrup, K., Ogburn, E. L., & James, P. (2017). Race/ethnicity, socioeconomic status, residential segregation, and spatial variation in noise exposure in the contiguous United States. Environmental health perspectives, 125(7), 077017.
Caskey, J. P. (1994). Bank representation in low-income and minority urban communities. Urban Affairs Quarterly, 29(4), 617-638.
Chan, I. Y., & Liu, A. M. (2018). Effects of neighborhood building density, height, greenspace, and cleanliness on indoor environment and health of building occupants. Building and Environment, 145, 213-222.
Chaufan, C., Davis, M., & Constantino, S. (2011). The twin epidemics of poverty and diabetes: understanding diabetes disparities in a low-income Latino and immigrant neighborhood. Journal of community Health, 36(6), 1032.
Chen, J., Davis, D. S., Wu, K., & Dai, H. (2015). Life satisfaction in urbanizing China: The effect of city size and pathways to urban residency. Cities, 49, 88-97.
Cheng, Z., King, S. P., Smyth, R., & Wang, H. (2016). Housing property rights and subjective wellbeing in urban China. European Journal of Political Economy, 45, 160-174.
China Daily. (2020). Top 10 Chinese cities by per capita GDP in 2019. Retrieved from https://www.chinadaily.com.cn/a/202004/27/WS5ea60b68a310a8b241151c50_3.html
Ciorici, P., & Dantzler, P. (2018). Neighborhood Satisfaction: A Study of a Low-Income Urban Community. Urban Affairs Review, 1078087418755515.
Clapham, D., Foye, C., & Christian, J. (2018). The concept of subjective well-being in housing research. Housing, Theory and Society, 35(3), 261-280.
Coutinho, S. A., & Woolery, L. M. (2004). THE NEED FOR COGNITION AND LIFE SATISFACTION AMONG COLLEGESTUDENTS. College Student Journal, 38(2).
Cramm, J. M., Van Dijk, H. M., & Nieboer, A. P. (2013). The importance of neighborhood social cohesion and social capital for the well being of older adults in the community. The Gerontologist, 53(1), 142-152.
Cummins, R. A. (2005). The domains of life satisfaction: An attempt to order chaos. In Citation classics from social indicators research (pp. 559-584): Springer.

96
Dassopoulos, A., & Monnat, S. M. (2011). Do perceptions of social cohesion, social support, and social control mediate the effects of local community participation on neighborhood satisfaction? Environment and Behavior, 43(4), 546-565.
Dearing, E., Wimer, C., Simpkins, S. D., Lund, T., Bouffard, S. M., Caronongan, P., . . . Weiss, H. (2009). Do neighborhood and home contexts help explain why low-income children miss opportunities to participate in activities outside of school? Developmental psychology, 45(6), 1545.
Department of Numbers. (2014). Minneapolis, Minnesota Home Affordability. Retrieved from https://www.deptofnumbers.com/affordability/minnesota/minneapolis/
Diener, E. (1984). Subjective well-being. Psychological bulletin, 95(3), 542. Diener, E., & Diener, M. (2009). Cross-cultural correlates of life satisfaction and self-esteem. In
Culture and well-being (pp. 71-91): Springer. Diener, E., Emmons, R. A., Larsen, R. J., & Griffin, S. (1985). The satisfaction with life scale.
Journal of personality assessment, 49(1), 71-75. Diener, E., & Seligman, M. E. (2002). Very happy people. Psychological science, 13(1), 81-84. Diener, E., Suh, E. M., Lucas, R. E., & Smith, H. L. (1999). Subjective well-being: Three decades of
progress. Psychological bulletin, 125(2), 276. Ding, C., Cao, X. J., & Næss, P. (2018). Applying gradient boosting decision trees to examine non-
linear effects of the built environment on driving distance in Oslo. Transportation Research Part A: Policy and Practice, 110, 107-117.
Dittmann, J., & Goebel, J. (2010). Your house, your car, your education: The socioeconomic situation of the neighborhood and its impact on life satisfaction in Germany. Social Indicators Research, 96(3), 497-513.
Dolan, P., Peasgood, T., & White, M. (2008). Do we really know what makes us happy? A review of the economic literature on the factors associated with subjective well-being. Journal of Economic Psychology, 29(1), 94-122.
Dong, H., & Qin, B. (2017). Exploring the link between neighborhood environment and mental wellbeing: A case study in Beijing, China. Landscape and Urban Planning, 164, 71-80.
Dong, W., Cao, X., Wu, X., & Dong, Y. (2019). Examining pedestrian satisfaction in gated and open communities: An integration of gradient boosting decision trees and impact-asymmetry analysis. Landscape and Urban Planning, 185, 246-257. doi:https://doi.org/10.1016/j.landurbplan.2019.02.012
Durkheim, E. (1911). De la division du travail social: F. Alcan. Durkin, M. S., Davidson, L. L., Kuhn, L., O'Connor, P., & Barlow, B. (1994). Low-income
neighborhoods and the risk of severe pediatric injury: a small-area analysis in northern Manhattan. American journal of public health, 84(4), 587-592.
Ellis, C. D., Lee, S.-W., & Kweon, B.-S. (2006). Retail land use, neighborhood satisfaction and the urban forest: an investigation into the moderating and mediating effects of trees and shrubs. Landscape and Urban Planning, 74(1), 70-78.
Ergungor, O. E. (2010). Bank branch presence and access to credit in low‐to moderate‐income
neighborhoods. Journal of Money, Credit and Banking, 42(7), 1321-1349. Evans, G. W., Wells, N. M., & Moch, A. (2003). Housing and mental health: a review of the
evidence and a methodological and conceptual critique. Journal of Social Issues, 59(3), 475-500.
Faber, J. W. (2019). Segregation and the cost of money: Race, poverty, and the prevalence of alternative financial institutions. Social Forces, 98(2), 819-848.
Festinger, L. (1954). A theory of social comparison processes. Human relations, 7(2), 117-140.

97
Fischer, J. M., & Amekudzi, A. (2011). Quality of life, sustainable civil infrastructure, and sustainable development: Strategically expanding choice. Journal of urban planning and development, 137(1), 39-48.
Friedman, D., Parikh, N. S., Giunta, N., Fahs, M. C., & Gallo, W. T. (2012). The influence of neighborhood factors on the quality of life of older adults attending New York City senior centers: Results from the Health Indicators Project. Quality of Life Research, 21(1), 123-131.
Friedman, J. H. (2001). Greedy function approximation: a gradient boosting machine. Annals of statistics, 1189-1232.
Frijters, P., Haisken-DeNew, J. P., & Shields, M. A. (2004). Money does matter! Evidence from increasing real income and life satisfaction in East Germany following reunification. American Economic Review, 94(3), 730-740.
Fujiwara, D. (2013). The social impact of housing providers. HACT, London. Galster, G. C. (1985). Evaluating indicators for housing policy: Residential satisfaction vs marginal
improvement priorities. Social Indicators Research, 16(4), 415-448. doi:10.1007/BF00333289
Gauthier, K. J., Christopher, A. N., Walter, M. I., Mourad, R., & Marek, P. (2006). Religiosity, religious doubt, and the need for cognition: Their interactive relationship with life satisfaction. Journal of Happiness Studies, 7(2), 139-154.
Hamersma, M., Tillema, T., Sussman, J., & Arts, J. (2014). Residential satisfaction close to highways: The impact of accessibility, nuisances and highway adjustment projects. Transportation Research Part A: Policy and Practice, 59, 106-121.
Helliwell, J. F., Shiplett, H., & Barrington-Leigh, C. P. (2019). How happy are your neighbours? Variation in life satisfaction among 1200 Canadian neighbourhoods and communities. PLoS One, 14(1), e0210091.
Huebner, E. S., Suldo, S. M., & Gilman, R. (2006). Life Satisfaction. Hur, M., & Morrow-Jones, H. (2008). Factors That Influence Residents' Satisfaction With
Neighborhoods. Environment and Behavior, 40(5), 619-635. Hur, M., & Nasar, J. L. (2014). Physical upkeep, perceived upkeep, fear of crime and
neighborhood satisfaction. Journal of Environmental Psychology, 38, 186-194. doi:http://dx.doi.org/10.1016/j.jenvp.2014.02.001
Hur, M., Nasar, J. L., & Chun, B. (2010). Neighborhood satisfaction, physical and perceived naturalness and openness. Journal of Environmental Psychology, 30(1), 52-59.
Information Times. (2015). The Price-to-Income Ratio of Guangzho Ranked Sixth in the Country. Retrieved from https://gz.leju.com/news/2015-08-17/06496038813683856228772.shtml
Inglehart, R. (1990). Values, ideology, and cognitive mobilization in new social movements. Challenging the political order: new social and political movements in western democracies, 43-66.
Jocson, R. M., & McLoyd, V. C. (2015). Neighborhood and housing disorder, parenting, and youth adjustment in low-income urban families. American journal of community psychology, 55(3-4), 304-313.
Kahneman, D., & Deaton, A. (2010). High income improves evaluation of life but not emotional well-being. Proceedings of the national academy of sciences, 107(38), 16489-16493.
Kim, J.-W., & Lee, S.-m. (2018). Perceived neighborhood conditions and happiness of young Japanese and Koreans. Development and society, 47(1), 1-37.
Kim, J., & De Dear, R. (2012). Nonlinear relationships between individual IEQ factors and overall workspace satisfaction. Building and Environment, 49, 33-40.

98
Knight, J., & Gunatilaka, R. (2010). Great expectations? The subjective well-being of rural–urban migrants in China. World development, 38(1), 113-124.
Knight, J., & Gunatilaka, R. (2011). Does economic growth raise happiness in China? Oxford Development Studies, 39(1), 1-24.
Kwon, M., Pickett, A. C., Lee, Y., & Lee, S. (2019). Neighborhood physical environments, recreational wellbeing, and psychological health. Applied Research in Quality of Life, 14(1), 253-271.
Lee, J.-S., & Min, C.-k. (2013). Prioritizing convention quality attributes from the perspective of three-factor theory: The case of academic association convention. International Journal of Hospitality Management, 35, 282-293. doi:https://doi.org/10.1016/j.ijhm.2013.07.003
Li, B. (1993). Danwei culture as urban culture in modern China: The case of Beijing from 1949 to 1979. Urban anthropology in China, 345-352.
Li, P., & Song, S. (2012). Why are housing prices so high in urban China? The Journal of China and Global Economics, 1(1), 39-42.
Li, W., Sun, B., Yin, C., Zhang, T., & Liu, Q. (2018). Does metro proximity promote happiness? Evidence from Shanghai. Journal of Transport and Land Use, 11(1), 1271-1285.
Li, X., Kleinhans, R., & van Ham, M. (2018). Ambivalence in place attachment: The lived experiences of residents in danwei communities facing demolition in Shenyang, China. Housing Studies, 34(6), 997-1020.
Liu, Y., Dijst, M., & Geertman, S. (2017). The subjective well-being of older adults in Shanghai: The role of residential environment and individual resources. Urban Studies, 54(7), 1692-1714.
Liu, Y., Zhang, F., Wu, F., Liu, Y., & Li, Z. (2017). The subjective wellbeing of migrants in Guangzhou, China: The impacts of the social and physical environment. Cities, 60, 333-342.
Lochner, K. A., Kawachi, I., Brennan, R. T., & Buka, S. L. (2003). Social capital and neighborhood mortality rates in Chicago. Social science & medicine, 56(8), 1797-1805.
Loukaitou-Sideris, A., Levy-Storms, L., Chen, L., & Brozen, M. (2016). Parks for an aging population: Needs and preferences of low-income seniors in Los Angeles. Journal of the American planning association, 82(3), 236-251.
Lovejoy, K., Handy, S., & Mokhtarian, P. (2010). Neighborhood satisfaction in suburban versus traditional environments: An evaluation of contributing characteristics in eight California neighborhoods. Landscape and Urban Planning, 97(1), 37-48.
Lu, D. (2006). Remaking Chinese urban form: Modernity, scarcity and space, 1949-2005: Routledge.
Luhmann, M., Lucas, R. E., Eid, M., & Diener, E. (2013). The prospective effect of life satisfaction on life events. Social Psychological and Personality Science, 4(1), 39-45.
Ma, J., Dong, G., Chen, Y., & Zhang, W. (2018). Does satisfactory neighbourhood environment lead to a satisfying life? An investigation of the association between neighbourhood environment and life satisfaction in Beijing. Cities, 74, 229-239.
Marcon, M. d. F. (2015). Nonlinear impact of online retail characteristics on customer satisfaction and loyalty. International Journal of Quality and Service Sciences, 7(2-3), 152-169.
Maslow, A. H. (1943). A theory of human motivation. Psychological review, 50(4), 370. Maslow, A. H. (1954). The instinctoid nature of basic needs. Journal of personality. Maslow, A. H. (1981). Motivation and personality: Prabhat Prakashan.

99
Mason, S. G. (2010). Can community design build trust? A comparative study of design factors in Boise, Idaho neighborhoods. Cities, 27(6), 456-465.
Matzler, K., Sauerwein, E., & Heischmidt, K. (2003). Importance-performance analysis revisited: the role of the factor structure of customer satisfaction. The Service Industries Journal, 23(2), 112-129.
McLeod, S. (2007). Maslow's hierarchy of needs. Simply psychology, 1, 1-8. Mikulić, J., & Prebežac, D. (2008). Prioritizing improvement of service attributes using impact
range-performance analysis and impact-asymmetry analysis. Managing Service Quality: An International Journal, 18(6), 559-576.
MN DEED. (2019). Compare Minneapolis/St. Paul: See how the Twin Cities compare to other large metro areas across the country. Retrieved from https://mn.gov/deed/ed/compare/compare-metro/economy/gdp.jsp
Mohnen, S. M., Groenewegen, P. P., Völker, B., & Flap, H. (2011). Neighborhood social capital and individual health. Social science & medicine, 72(5), 660-667.
Morris, E. W., & Winter, M. (1975). A theory of family housing adjustment. Journal of Marriage and the Family, 79-88.
Mouratidis, K. (2020). Neighborhood characteristics, neighborhood satisfaction, and well-being: The links with neighborhood deprivation. Land Use Policy, 99, 104886.
Musikanski, L., Polley, C., Cloutier, S., Berejnoi, E., & Colbert, J. (2017). Happiness in communities: How neighborhoods, cities and states use subjective well-being metrics. Journal of Social Change, 9(1), 3.
Navarrete-Hernandez, P., & Laffan, K. (2019). A greener urban environment: Designing green infrastructure interventions to promote citizens’ subjective wellbeing. Landscape and Urban Planning, 191, 103618.
Neve, J.-E. D., & Sachs, J. D. (2020). World happiness report: Sustainable development and human well-being. Retrieved from https://worldhappiness.report/ed/2020/sustainable-development-and-human-well-being/
O'Brien, D. J., & Ayidiya, S. (1991). Neighborhood community and life satisfaction. Community Development, 22(1), 21-37.
O’Sullivan, G. (2011). The relationship between hope, eustress, self-efficacy, and life satisfaction among undergraduates. Social Indicators Research, 101(1), 155-172.
Ohmer, M. L., Warner, B. D., & Beck, E. (2010). Preventing violence in low-income communities: Facilitating residents' ability to intervene in neighborhood problems. J. Soc. & Soc. Welfare, 37, 161.
Oishi, S., Diener, E., Choi, D.-W., Kim-Prieto, C., & Choi, I. (2007). The dynamics of daily events and well-being across cultures: When less is more. Journal of personality and social psychology, 93(4), 685.
Oishi, S., Diener, E., Lucas, R. E., & Suh, E. M. (2009). Cross-cultural variations in predictors of life satisfaction: Perspectives from needs and values. In Culture and well-being (pp. 109-127): Springer.
Oishi, S., Schimmack, U., & Diener, E. (2001). Pleasures and subjective well‐being. European
Journal of Personality, 15(2), 153-167. Owens, A. (2018). Income segregation between school districts and inequality in students’
achievement. Sociology of Education, 91(1), 1-27. Parkes, A., Kearns, A., & Atkinson, R. (2002). What makes people dissatisfied with their
neighbourhoods? Urban studies, 39(13), 2413-2438. Pavot, W., & Diener, E. (1993). The affective and cognitive context of self-reported measures of
subjective well-being. Social Indicators Research, 28(1), 1-20.

100
Pavot, W., & Diener, E. (2008). The satisfaction with life scale and the emerging construct of life satisfaction. The journal of positive psychology, 3(2), 137-152.
Pfeiffer, D., & Cloutier, S. (2016). Planning for happy neighborhoods. Journal of the American planning association, 82(3), 267-279.
Pfeiffer, D., Ehlenz, M. M., Andrade, R., Cloutier, S., & Larson, K. L. (2020). Do neighborhood walkability, transit, and parks relate to residents’ life satisfaction? Journal of the American Planning Association, 86(2), 171-187.
Powdthavee, N. (2008). Putting a price tag on friends, relatives, and neighbours: Using surveys of life satisfaction to value social relationships. The Journal of Socio-Economics, 37(4), 1459-1480.
Prezza, M., Amici, M., Roberti, T., & Tedeschi, G. (2001). Sense of community referred to the whole town: Its relations with neighboring, loneliness, life satisfaction, and area of residence. Journal of Community Psychology, 29(1), 29-52.
Ramos, A. K., Suarez, M. C., Leon, M., & Trinidad, N. (2017). Sense of community, participation, and life satisfaction among Hispanic immigrants in rural Nebraska. Kontakt, 19(4), e284-e295.
Renshaw, T. L., & Cohen, A. S. (2014). Life satisfaction as a distinguishing indicator of college student functioning: Further validation of the two-continua model of mental health. Social Indicators Research, 117(1), 319-334.
Ridgeway, G. (2007). Generalized Boosted Models: A guide to the gbm package. Retrieved from http://cran.r-project.org/web/packages/gbm/vignettes/ gbm.pdf
Rohe, W. M., & Stegman, M. A. (1994). The effects of homeownership: On the self-esteem, perceived control and life satisfaction of low-income people. Journal of the American planning association, 60(2), 173-184.
Rojas, M. (2006). Life satisfaction and satisfaction in domains of life: is it a simple relationship? Journal of Happiness Studies, 7(4), 467-497.
Rosenblatt, P., & DeLuca, S. (2012). “We Don't Live Outside, We Live in Here”: Neighborhood and
Residential Mobility Decisions Among Low‐Income Families. City & Community, 11(3),
254-284. Sallis, J. F., Saelens, B. E., Frank, L. D., Conway, T. L., Slymen, D. J., Cain, K. L., . . . Kerr, J. (2009).
Neighborhood built environment and income: examining multiple health outcomes. Social science & medicine, 68(7), 1285-1293.
Sallis, J. F., Slymen, D. J., Conway, T. L., Frank, L. D., Saelens, B. E., Cain, K., & Chapman, J. E. (2011). Income disparities in perceived neighborhood built and social environment attributes. Health & Place, 17(6), 1274-1283.
Senlier, N., Yildiz, R., & Aktaş, E. D. (2009). A perception survey for the evaluation of urban quality of life in Kocaeli and a comparison of the life satisfaction with the European cities. Social Indicators Research, 94(2), 213-226.
Shields, M. A., Price, S. W., & Wooden, M. (2009). Life satisfaction and the economic and social characteristics of neighbourhoods. Journal of Population Economics, 22(2), 421-443.
Shin, D. C., & Johnson, D. M. (1978). Avowed happiness as an overall assessment of the quality of life. Social Indicators Research, 5(1-4), 475-492.
Siahpush, M., Spittal, M., & Singh, G. K. (2008). Happiness and life satisfaction prospectively predict self-rated health, physical health, and the presence of limiting, long-term health conditions. American Journal of Health Promotion, 23(1), 18-26.
Sirgy, M. J., & Cornwell, T. (2002). How neighborhood features affect quality of life. Social Indicators Research, 59(1), 79-114.

101
Skobba, K., & Goetz, E. G. (2013). Mobility decisions of very low-income households. Cityscape, 155-171.
Sugiyama, T., Thompson, C. W., & Alves, S. (2009). Associations between neighborhood open space attributes and quality of life for older people in Britain. Environment and Behavior, 41(1), 3-21.
Suh, E., Diener, E., Oishi, S., & Triandis, H. C. (1998). The shifting basis of life satisfaction judgments across cultures: emotions versus norms. Journal of personality and social psychology, 74(2), 482.
Suh, E. M., Diener, E., & Updegraff, J. A. (2008). From culture to priming conditions: Self-construal influences on life satisfaction judgments. Journal of Cross-Cultural Psychology, 39(1), 3-15.
Suls, J. E., & Wills, T. A. E. (1991). Social comparison: Contemporary theory and research: Lawrence Erlbaum Associates, Inc.
Tatarkiewicz, W. (1976). Analysis of happiness. The Hague, Netherlands: Martinus Nijhoff. United Nations. (2020). Sustainable development goals. Retrieved from
https://www.un.org/sustainabledevelopment/sustainable-development-goals/ Van Ham, M., Manley, D., Bailey, N., Simpson, L., & Maclennan, D. (2012). Neighbourhood
effects research: New perspectives. In Neighbourhood effects research: New perspectives (pp. 1-21): Springer.
Veenhoven, R. (1996). The study of life-satisfaction. Vemuri, A. W., Morgan Grove, J., Wilson, M. A., & Burch Jr, W. R. (2011). A tale of two scales:
Evaluating the relationship among life satisfaction, social capital, income, and the natural environment at individual and neighborhood levels in metropolitan Baltimore. Environment and Behavior, 43(1), 3-25.
Verbeek, T. (2019). Unequal residential exposure to air pollution and noise: a geospatial environmental justice analysis for Ghent, Belgium. SSM-population health, 7, 100340.
Wang, D., & Lin, T. (2014). Residential self-selection, built environment, and travel behavior in the Chinese context. Journal of Transport and Land Use, 7(3), 5-14.
Wei, S.-J., & Zhang, X. (2011). The competitive saving motive: Evidence from rising sex ratios and savings rates in China. Journal of political Economy, 119(3), 511-564.
Weimer, D. L., & Wolkoff, M. J. (2001). School performance and housing values: Using non-contiguous district and incorporation boundaries to identify school effects. National Tax Journal, 231-253.
Wilson, W. J. (2012). The truly disadvantaged: The inner city, the underclass, and public policy: University of Chicago Press.
Wu, X., Cao, J., & Huting, J. (2018). Using three-factor theory to identify improvement priorities for express and local bus services: An application of regression with dummy variables in the Twin Cities. Transportation Research Part A: Policy and Practice, 113, 184-196.
Xu, J., & Roberts, R. E. (2010). The power of positive emotions: It’sa matter of life or death—Subjective well-being and longevity over 28 years in a general population. Health Psychology, 29(1), 9.
Yang, Y. (2008). A tale of two cities: Physical form and neighborhood satisfaction in metropolitan Portland and Charlotte. Journal of the American planning association, 74(3), 307-323.
Yap, S. C., Settles, I. H., & Pratt-Hyatt, J. S. (2011). Mediators of the relationship between racial identity and life satisfaction in a community sample of African American women and men. Cultural Diversity and Ethnic Minority Psychology, 17(1), 89.
Ye, H., Lee, S., & Kim, H. (2016). Effects of neighborhood characteristics on length of inpatient stay: findings from the US national data. Social Work Research, 40(2), 117-126.
102
Yin, C., Shao, C., Dong, C., & Wang, X. (2019). Happiness in urbanizing China: The role of commuting and multi-scale built environment across urban regions. Transportation Research Part D: Transport and Environment, 74, 306-317.
Zhang, C., & Zhang, F. (2019). Effects of housing wealth on subjective well-being in urban China. Journal of Housing and the Built Environment, 34(4), 965-985.
Zhang, F., Zhang, C., & Hudson, J. (2018). Housing conditions and life satisfaction in urban China. Cities, 81, 35-44.
Zhang, Y., & Haghani, A. (2015). A gradient boosting method to improve travel time prediction. Transportation Research Part C: Emerging Technologies, 58, 308-324.
Ziliak, S. T., & McCloskey, D. N. (2004). Size matters: The standard error of regressions in the American Economic Review. The Journal of Socio-Economics, 33(5), 527-546.

103
Appendix
Table A1 List of independent variables
Categories Neighborhood Attributes
Neighborhood
characteristics
• The looks or design of the neighborhood
• Neighborhood cleanliness (e.g., being free from trash,
litter)
• Noise in the neighborhood (e.g., from vehicles,
neighbors, machinery, etc.)
• Air quality in the neighborhood
• Safety from crime in your neighborhood
• Safety from traffic in your neighborhood
• Neighborhood greenery (e.g., trees, bushes, yards,
etc.)
Neighborhood
infrastructure
• Parks and playgrounds in your neighborhood
• Streets in your neighborhood
• Parking in your neighborhood
• Sidewalks in your neighborhood
• Bike trail/paths in your neighborhood
Amenities in or
accessible from
neighborhood
• Access to public transportation in your neighborhood
• Access to highways from your neighborhood
• Street lighting in your neighborhood
• Drainage in your neighborhood
• Access to quality leisure, recreation and entertainment
(e.g., theaters, movies, restaurants, bars, etc.)
Opportunities other than parks and playgrounds in
your neighborhood
• Access to quality medical facilities (e.g., hospitals,
clinics, etc.)
• Access to quality schools and other educational
institutions
• Access to quality childcare
• Access to quality community and public facilities
(e.g., post offices, libraries, community centers, etc.)
• Access to quality banks and other financial institutions
• Access to quality grocery stores or farmers markets
• Access to quality stores for all other purchases (other
than grocery stores)
• Access to places of worship

104
Categories Neighborhood Attributes
City services in the neighborhood
• Garbage collection and trash removal in your
neighborhood
• Snow removal in your neighborhood
• Street cleaning in your neighborhood
Sense of community in
the neighborhood
• The number of friends you have in your neighborhood
• Relations with residents of your neighborhood
• Ability to participate in neighborhood decisions that
impact you/your family
Control Variables
• Age
• Race
• Sex
• Race
• Income
• Household Size
• Vehicle ownership
• Employment Status
Table A2 Relative influences of attributes on neighborhood satisfaction
Neighborhood Attributes Relative influence
(%)
The looks or design of the neighborhood 17.61
Safety from crime in your neighborhood 12.74
Neighborhood cleanliness 10.29
Noise in the neighborhood 9.78
Relations with residents of your neighborhood 4.42
Access to quality schools and other educational institutions 4.29
Street cleaning in your neighborhood 2.56
Air quality in the neighborhood 2.49
Ability to participate in neighborhood decisions that impact you/your
family 2.25
The number of friends you have in your neighborhood 1.72
Safety from traffic in your neighborhood 1.67
Access to quality leisure, recreation and entertainment 1.17
Access to quality childcare 1.16
Neighborhood greenery 1.11
Parking in your neighborhood 1.03
Bike trail/paths in your neighborhood 0.71
Access to places of worship 0.69
Access to quality banks and other financial institutions 0.61
Drainage in your neighborhood 0.50

105
Table A3 Relative influences of attributes on life satisfaction
Neighborhood Attributes Relative influence
(%)
Ability to participate in neighborhood decisions that impact you/your
family 5.68
Parks and playgrounds in your neighborhood 5.59
Access to quality schools and other educational institutions 4.65
Drainage in your neighborhood 3.55
Bike trail/paths in your neighborhood 3.35
The number of friends you have in your neighborhood 3.18
Relations with residents of your neighborhood 2.97
Access to quality leisure, recreation and entertainment 2.90
Sidewalks in your neighborhood 2.36
Noise in the neighborhood 2.13
Neighborhood Attributes Relative influence
(%)
Sidewalks in your neighborhood 0.39
Garbage collection and trash removal in your neighborhood 0.36
Parks and playgrounds in your neighborhood 0.34
Streets in your neighborhood 0.20
Access to quality stores for all other purchases 0.19
Snow removal in your neighborhood 0.17
Street lighting in your neighborhood 0.15
Access to public transportation in your neighborhood 0.15
Access to quality grocery stores or farmers markets 0.13
Access to quality medical facilities 0.06
Access to highways from your neighborhood 0.02
Access to quality community and public facilities 0.02
Demographic and Socioeconomic Variables Relative Influences
(%)
Income 1.20
Age 2.76
Household Size 1.94
Vehicle Ownership 2.32
Gender 0.96
Employment Status 0.29
Years living in the neighborhood 6.23
White 4.33
Black 0.96
Asian 0.00
Hispanic 0.00
Other races 0.03
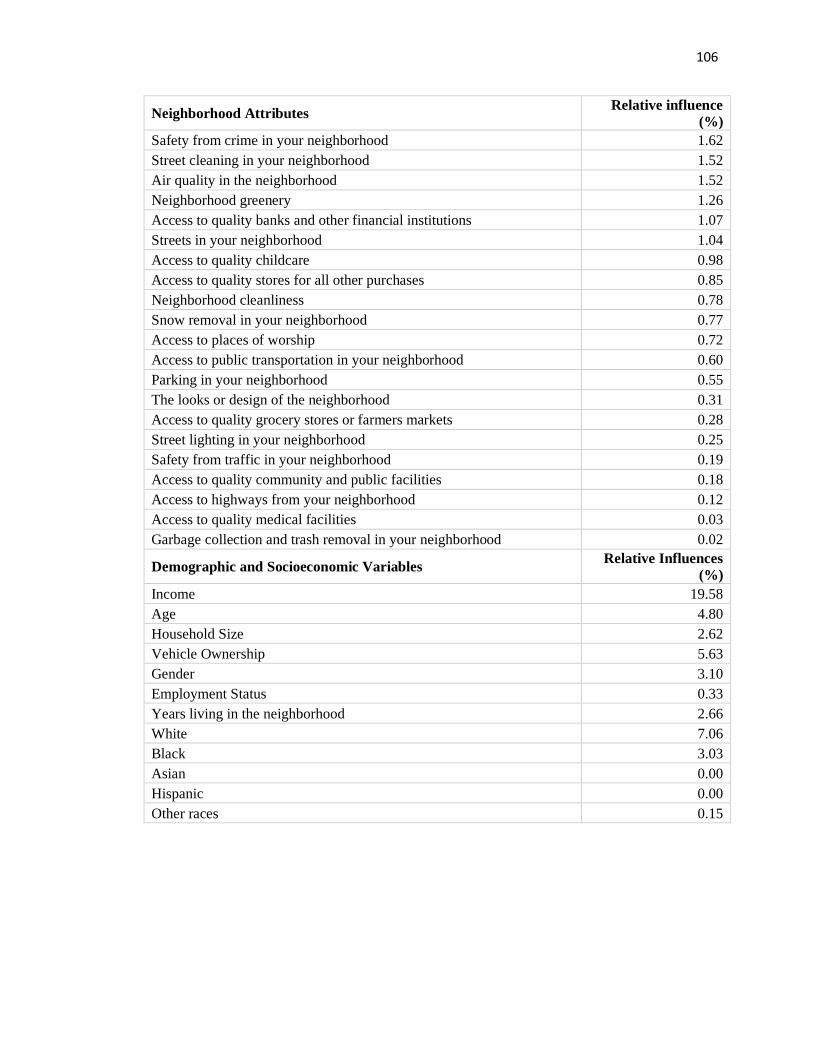
106
Neighborhood Attributes Relative influence
(%)
Safety from crime in your neighborhood 1.62
Street cleaning in your neighborhood 1.52
Air quality in the neighborhood 1.52
Neighborhood greenery 1.26
Access to quality banks and other financial institutions 1.07
Streets in your neighborhood 1.04
Access to quality childcare 0.98
Access to quality stores for all other purchases 0.85
Neighborhood cleanliness 0.78
Snow removal in your neighborhood 0.77
Access to places of worship 0.72
Access to public transportation in your neighborhood 0.60
Parking in your neighborhood 0.55
The looks or design of the neighborhood 0.31
Access to quality grocery stores or farmers markets 0.28
Street lighting in your neighborhood 0.25
Safety from traffic in your neighborhood 0.19
Access to quality community and public facilities 0.18
Access to highways from your neighborhood 0.12
Access to quality medical facilities 0.03
Garbage collection and trash removal in your neighborhood 0.02
Demographic and Socioeconomic Variables Relative Influences
(%)
Income 19.58
Age 4.80
Household Size 2.62
Vehicle Ownership 5.63
Gender 3.10
Employment Status 0.33
Years living in the neighborhood 2.66
White 7.06
Black 3.03
Asian 0.00
Hispanic 0.00
Other races 0.15

![ACCOUNTANCY EXAMINING BOARD[193A]](https://static.fdokumen.com/doc/165x107/6323acc9be5419ea700eb5e1/accountancy-examining-board193a.jpg)