Transportation Management Associations: A Reappraisal
26
Transportation Management Associations: A Reappraisal Transportation Management Associations: A Reappraisal Erik Ferguson, American University of Sharjah, United Arab Emirates Abstract is article reviews the results of eight national transportation management asso- ciation (TMA) surveys conducted between 1989 and 2003 using meta-analytical techniques. TMAs became popular as vehicles for dealing with traffic congestion and related problems in the late 1980s. Despite their initial popularity, however, many TMAs struggled in the 1990s, and by 2002 almost half of all TMAs formed in previ- ous years had disappeared. Median TMA annual budgets bottomed out in 1991, but have since rebounded to a new high in 2003. TMAs today are more diverse in terms of organizational structure, offer a wider variety of products and services, and have better financial security. With higher gasoline prices and a heightened awareness of the security issues related to foreign oil dependence, the market for TMA programs and services seems likely to grow, if perhaps at a modest pace, during the foreseeable future. Introduction Transportation management associations (TMAs) first appeared on the scene in the late 970s or early 980s, although it was not until the late 980s that these were consistently labeled as such. e boom years of the late 980s and early 990s were followed by a time of challenge, during which many formative and operational TMAs ceased to exist. In the mid-980s, TMAs were viewed by some as a form of panacea, destined to solve not only traffic congestion, but many other societal ills as well (Leinberger and Lockwood 986).
-
Upload
khangminh22 -
Category
Documents
-
view
3 -
download
0
Transcript of Transportation Management Associations: A Reappraisal
Transportation Management Associations: A Reappraisal
�
Transportation Management Associations: A Reappraisal
Erik Ferguson, American University of Sharjah, United Arab Emirates
Abstract
This article reviews the results of eight national transportation management asso-ciation (TMA) surveys conducted between 1989 and 2003 using meta-analytical techniques. TMAs became popular as vehicles for dealing with traffic congestion and related problems in the late 1980s. Despite their initial popularity, however, many TMAs struggled in the 1990s, and by 2002 almost half of all TMAs formed in previ-ous years had disappeared. Median TMA annual budgets bottomed out in 1991, but have since rebounded to a new high in 2003. TMAs today are more diverse in terms of organizational structure, offer a wider variety of products and services, and have better financial security. With higher gasoline prices and a heightened awareness of the security issues related to foreign oil dependence, the market for TMA programs and services seems likely to grow, if perhaps at a modest pace, during the foreseeable future.
IntroductionTransportation management associations (TMAs) first appeared on the scene in the late �970s or early �980s, although it was not until the late �980s that these were consistently labeled as such. The boom years of the late �980s and early �990s were followed by a time of challenge, during which many formative and operational TMAs ceased to exist. In the mid-�980s, TMAs were viewed by some as a form of panacea, destined to solve not only traffic congestion, but many other societal ills as well (Leinberger and Lockwood �986).

Journal of Public Transportation, Vol. 10, No. 4, 2007
�
Elsewhere, developers, employers, and local governments have created TMAs to find solutions to transportation problems. Besides organizing ridesharing and vanpools, promoting staggered work hours, and lobbying for government-funded capital improvements, some TMAs are expanding their role into childcare, private police, and other services for their geographic areas. It is imaginable that TMAs, born of the traffic-congestion crisis, could mature into an echelon of government well-suited to the realities of our emerging urban villages.
The reality may have been a little harsher than this early testimonial might other-wise suggest, but TMAs continue to persevere, and many are thriving in the first decade of the ��st century. The purpose of this article is to review the historical development of TMAs over the critical period of their first rise to prominence, to shed light on their prospects for growth, change, and innovation in the coming years.
One broadly inclusive definition of a TMA is “an organized group applying care-fully selected approaches to facilitating the movement of people and goods within an area” (Hendricks �004). Individual TMAs may vary in terms of their size and location, organization and management, revenues and expenses, membership and participation, and products and services offered. Alternative TMA labels include transportation management organization (TMO), transportation management initiative (TMI), and transportation management district (TMD), among others, although none of these has achieved the widespread popularity of the TMA acro-nym. To the extent that these alternative TMA designations represent real differ-ences, TMOs are more action-oriented than TMAs, TMIs refer to TMA start-ups, and TMDs refer to special purpose tax districts and/or operating areas.
DataMost of the data used to inform this article derive from eight national TMA studies conducted over a �4-year time period (�989 to �003). These are the most complete data available on TMA planning, development, and implementation, and the most current as well:
�. �989: The Association for Commuter Transportation (ACT) compiled its first comprehensive national TMA directory in �989 (ACT �989). Ferguson (�990) used these data to show that TMA characteristics varied significantly, depending on who initiated the TMA.

Transportation Management Associations: A Reappraisal
3
�. �990: The Urban Land Institute (ULI) evaluated transportation manage-ment through partnerships, with a particular focus on TMAs, between �986 and �990 (Dunphy and Lin �990). Their report focused especially on the evaluation of TMA results, measured in terms of observed changes in travel behavior.
3. �99�: The Georgia Institute of Technology conducted a national TMA sur-vey under a grant from the Urban Mass Transportation Administration in �99� (Ferguson, Ross, and Meyer �993). Ferguson (�997a) used these data to show how private sector participation affected and was affected by key TMA characteristics.
4. �993: Commuter Transportation Services, Inc. (CTS) conducted a national TMA survey in �993 under the auspices of ACT, focusing on policies and procedures, especially management and personnel issues (CTS �993). Fer-guson and Davidson (�995) compared these national TMA survey results with those from several previous studies.
5. �995: ACT compiled a new national TMA directory in �995 (ACT �995). This directory was a revised and improved version of ACT (�989).
6. �998: UrbanTrans Consultants, Inc. (UrbanTrans) conducted a national TMA survey under the auspices of ACT in �998 (UrbanTrans �998). This survey was a revised version of the one CTS conducted in �993. The results were summarized in an appendix of ACT (�00�).
7. �00�: ETF Associates (ETF) conducted a national TMA internet search in �00�. The purpose of this study was to identify the survival characteristics of all previously identified TMAs.
8. �003: The Center for Urban Transportation Research (CUTR) at the Univer-sity of South Florida conducted a national TMA survey under the auspices of ACT in �003 (Hendricks �004). This survey was a revised and expanded version of the ones previously conducted in �993 and �998.
The �989 and �995 data are closely related, as are the �993, �998, and �003 data. The �990, �99�, and �00� data are unique unto themselves. The �995 data have never before been used for scholarly research. Ferguson and Davidson (�995) gave a cursory overview of several previous TMA studies, but focused mainly on comparing the �99� and �993 data. Hendricks (�004) compared selected survey results from the �993, �998, and �003 studies. This article seeks to provide a more
Journal of Public Transportation, Vol. 10, No. 4, 2007
4
comprehensive overview of survey results from all eight studies using a variety of formal and informal meta-analytical techniques (Hunter �98�).
OrganizationACT (�989) identified 5� TMAs nationally, of which many presumably were still in the earliest formative stage at the time the directory was compiled. Dunphy and Lin (�990) identified 7� TMAs nationally between �986 and �990, of which only 34 were operational at the time. Ferguson, Meyer and Ross (�993) identified ��0 TMAs nationally in �99�, of which 64 responded to their survey. CTS (�993) identified �36 TMAs in �993, of which 5� responded to their survey. ACT (�995) identified 78 TMAs nationally in �995. UrbanTrans (�998) identified �35 TMAs nationally in �998, of which 8� responded to their survey. Hendricks (�004) identi-fied �46 TMAs nationally in �003, of which 97 responded to her survey.
It would appear that the number of TMAs in the United States grew rapidly from �989 to �99�, but leveled off sometime shortly thereafter. ETF Associates con-ducted a national search for TMAs in �00� (ETF �00�), seeking answers to four simple questions:
�. How many TMAs are there?
�. In what year were they formed?
3. In what year were they disbanded (if relevant)?
4. Does the TMA have a website (if it currently exists)?
ETF (�00�) identified a total of �37 active TMAs in existence in �00�, of which more than �00 currently maintained their own websites. Although the number of TMAs in existence in �00� did not rise much above the number previously identi-fied in �99�, it would appear that there were more “fully operational” TMAs in �00� than in previous years.
ETF (�00�) identified a grand total of �49 past and present TMAs based on infor-mation derived from various national studies, as well as personal contacts with industry professionals. Of these, ��� TMAs were confirmed no longer to exist. In fact, many of these dissolved TMAs never really got off the ground in the first place, having failed to get past the earliest formative stages of development. This information was difficult but not impossible to ascertain, despite the short institu-tional memory frequently associated with failed public policy experiments.

Transportation Management Associations: A Reappraisal
5
Year of formation was identified for all �49 of the TMAs included in ETF (�00�), with multiple data points available in many cases. Four previous studies provided this information for between 34 and 78 TMAs each, yielding a total of �5� data points representing ��3 different TMAs (Dunphy and Lin �990; Ferguson, Ross, and Meyer �993; ACT �995; UrbanTrans �998). Year of formation was identified for an additional 8� TMAs from their websites and/or Internet correspondence. Year of formation was interpolated for the remaining 45 TMAs based on other information. Whereas definitive information was available for the year in which �04 of the �49 TMAs identified by ETF (�00�) were formed, the year of dissolution could be identified for only �3 of the ��� TMAs that no longer existed.
National trends in TMA formation are illustrated in Figure �. As can be seen from this five-year moving average, the peak year for TMA formation was �990. The number of TMAs formed each year has declined steadily since then, although the number of active TMAs formed each year has remained relatively stable for more than a decade. It would appear that overall stability in the total number of TMAs identified nationally in previous studies dating back to �993 is the result of two related factors:
�. The number of TMAs formed each year has declined.
�. The number of TMAs disbanded (or which failed to get past the formative stage) has declined even more.
Figure 1. TMA Formation, 1980-2000

Journal of Public Transportation, Vol. 10, No. 4, 2007
6
The overall result is stability in the total number of TMAs in existence. This implies that there is still some turnover, but that the rate of turnover has decreased, the average age of TMAs has increased, and the percentage of TMAs that are “fully operational” is higher today than it was �0 or �5 years ago.
TMA formation varies across space as well as time. Western states, especially Cali-fornia, were early leaders in the formation of TMAs (Figure �). Southern and mid-western states entered the field somewhat later. Although California continues to have more TMAs than any other single state, the regional distribution of TMAs is today more even than at any previous time.
Figure 2. TMA Distribution 1990-2002
TMA formation also varies by metropolitan location. Of the �49 TMAs identified by ETF (�00�), �3� (93%) were located in the 48 standard metropolitan statisti-cal areas with populations exceeding �,000,000. These same metropolitan areas account for “only” 54 percent of the total U.S. population, demonstrating that TMAs are primarily a phenomenon of large urban areas. Interestingly, of the �8 remaining TMAs located in rural and small urban areas (generally speaking the latter), �3 were still in existence in �00�, demonstrating that these out-of-the-

Transportation Management Associations: A Reappraisal
7
ordinary small urban TMAs had a much stronger likelihood of surviving than did their large urban counterparts.
Older TMAs are significantly more likely than newer ones to use technology cre-atively (maintain websites, provide online matching, etc.), to be insured against liability damages, and to be incorporated as a nonprofit organization. Older TMAs have slightly larger governing boards with a somewhat higher percentage of voting members as well (UrbanTrans �998). There are clear advantages to survival for a longer period of time, so one might well ask what caused so many TMAs to fail as innovative public/private partnerships in transportation in the early �990s.
FinanceOne possible explanation for the demise of so many TMAs seemingly at the height of their popularity is financing, or the lack thereof. TMAs in �989 had a median annual budget of $�45,000, which fell by �99� to $��0,000, only to rise again to a new high of more than $�00,000 in �003. Adjusted for inflation, TMA financial resources fell in the early �990s, and were only restored to their �989 level in �003 (Figure 3). A large number of TMAs entered the market in the early �990s, starting out with limited resources, and attempted to build a secure financial base. Many would not succeed.
Figure 3. TMA Finance, 1989-2003
Journal of Public Transportation, Vol. 10, No. 4, 2007
8
In �99�, TMAs estimated their median annual start-up budget at $80,000, their median current budget at $��0,000, and their median anticipated �995 budget at $�75,000 (Ferguson, Ross, and Meyer �993). The observed increase in TMA bud-gets between �99� and �993 was identified by some as a positive sign (Ferguson and Davidson �995). The median budget figures for both �995 and �998 remained well below those projected in �99� for �995, however, suggesting that many TMAs continued to struggle in their efforts to achieve financial security long after the crunch in �99� had passed. Only in �003 was there a significant increase in TMA financial resources over previous years, and then only in nominal terms.
California TMAs differed considerably from their counterparts in other states in �99�. California TMAs in �99� projected that membership dues would increase considerably from �0 percent at start-up to 49 percent in �995, private grants would increase modestly from 3� percent to 40 percent, while government grants would decline precipitously from 50 percent to only 5 percent. In contrast to these major anticipated changes in California TMA financing, TMAs in other states in �99� projected that membership dues would increase modestly from �0 percent at start-up to �4 percent in �995, private grants would fall slightly from �� percent to �4 percent, and government grants would fall even more slightly from 63 per-cent to 57 percent (Ferguson, Ross, and Meyer �993).
Of 66 California TMAs that have been formed at one time or another, only �9 remained active in �00�, producing a rather imposing 7� percent overall failure rate. Only the Midwest joined California with a failure rate exceeding half (53%). The average failure rate in all other parts of the country was only about 30 percent (ETF �00�). Clearly, it would seem that California TMAs suffered a much higher mortality rate than those located in other parts of the country. To the extent that financial insolvency was a primary factor in the demise of TMAs generally, it would seem that California’s approach to TMA financing, eschewing government grants in favor of private grants and voluntary membership dues, may have been at least partially to blame. Many failed California TMA start-ups (as well as some of the more successful ones) were funded initially by Caltrans seed grants that were lim-ited in duration to three years maximum (Diggins and Schreffler �99�).
California TMAs in �998 received more revenue from membership dues and less from grants than did those in any other region, showing that their �99� financial objectives were at least partially met. Northeastern and southern TMAs had the most resources in �998, followed by California TMAs, those in other western states, and those in the Midwest. Northeastern and southern TMAs spent the

Transportation Management Associations: A Reappraisal
9
most money on marketing in �998. Northeastern and California TMAs spent the most money on direct service provision (UrbanTrans �998).
What is perhaps most interesting about the information presented in Table � is that TMAs that derive a higher percentage of their revenues from membership dues would seem to have a much higher propensity to fail as well. California and midwestern TMAs both derive about 40 percent of their revenues from member-ship dues. Both of these groups of TMAs are underfunded, at least in relation to northeastern and southern TMAs. Both groups have shown a much higher failure rate than those in other parts of the country. Since membership dues have long been touted by industry pundits as the best and most secure form of long-term TMA funding (Dunphy and Lin �990; Ferguson, Ross, and Meyer �993; Ferguson and Davidson �995), this finding is rather surprising, to say the least. It appears that purely voluntary membership organizations and dues often fail to provide sufficient financial stability for long-term TMA survival.
Table 1. TMA Revenues and Expenses by Region, 1998
OtherBudgetCategory Northwest Midwest South West California
Office operations $6�,�85 $8�,�50 $86,�54 $5�,073 $49,39�
Marketing amd promotion $46,9�3 $�5,6�5 $53,808 $�4,854 $�4,658
Capital services $�9,�07 $4�7 $�,44� $6,563 $��,�00
Other services $3�,4�7 $�,04� $�7,404 $9,79� $3�,333
Other $�8,�79 $0 $35,4�3 $�6,05� $��,350
Total $198,810 $108,333 $194,231 $108,333 $140,833
Member dues $4�,93� $4�,583 $45,643 $�3,973 $6�,9��
Grants and subsidies $�43,568 $4�,4�7 $��0,07� $58,973 $45,890
Service fees $��,7�9 $0 $6,4�9 $�4,73� $809
Developer funding $4,4�7 $0 $�3,750 $5,357 $��,0�5 agreements
Other $�8,708 $�4,333 $6,964 $�8,393 $3�,3�6
Total $221,354 $108,333 $192,857 $121,429 $152,941
R
even
ues
Expe
nses
Journal of Public Transportation, Vol. 10, No. 4, 2007
�0
MembershipMembership in most TMAs is predicated on the interaction between two clearly separate and distinct principles. First, most TMAs serve a specific geographic location, which may include one or more cities, counties, travel corridors, activity centers, and/or an entire metropolitan region, or some significant part thereof. Second, within any given TMA’s clearly designated service area boundaries, it may seek to recruit members, volunteers or participants from among land owners, developers, employers, employees, residents, local governments, state agencies, transportation providers, and other potentially interested individuals and organi-zations in either the public or the private sectors.
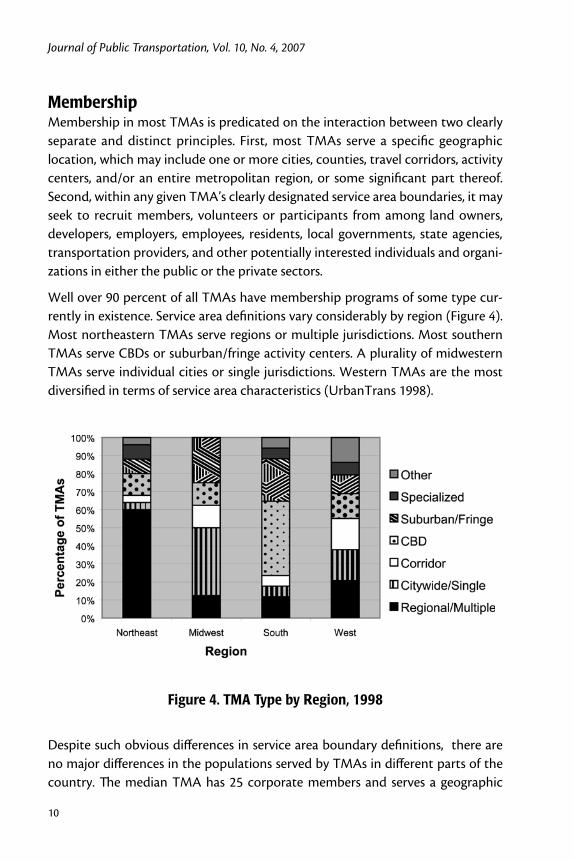
Well over 90 percent of all TMAs have membership programs of some type cur-rently in existence. Service area definitions vary considerably by region (Figure 4). Most northeastern TMAs serve regions or multiple jurisdictions. Most southern TMAs serve CBDs or suburban/fringe activity centers. A plurality of midwestern TMAs serve individual cities or single jurisdictions. Western TMAs are the most diversified in terms of service area characteristics (UrbanTrans �998).
Figure 4. TMA Type by Region, 1998
Despite such obvious differences in service area boundary definitions, there are no major differences in the populations served by TMAs in different parts of the country. The median TMA has �5 corporate members and serves a geographic

Transportation Management Associations: A Reappraisal
��
area that encompasses �5,000 commuters nationally. This varies from a high of 36 members and 30,000 commuters in the South to a low of �0 members in the Midwest and �6,600 commuters in the West. Although there are some differ-ences among regions in terms of total TMA membership, such differences do not appear to vary systematically based on either service area boundaries or financial characteristics.
In �998, 6� percent of all TMA members nationally were businesses, �7 percent government agencies, 8 percent developers, 5 percent nonprofits, and � percent residents. These figures varied hardly at all by region. The average TMA reported a net gain of five members in �998, with only two of 6� respondents admitting to an actual net loss in TMA membership during that year. TMAs in the South claimed the greatest market penetration, with 5� percent of the potential market included within their membership, followed by the West at 36 percent. The Northeast and Midwest lagged behind at �� percent each (UrbanTrans �998).
The most popular TMA recruitment strategy in �998 was peer-to-peer contact, which basically entailed using current members to recruit new ones in the private sector (73%), followed by personal letters from the TMA executive director (66%), brochures (56%), cold calls (44%), and governmental or contractual mandates (�6%) of one kind or another. The single most effective technique in �998 was peer-to-peer contacts (43%), followed by mandates (30%), letters (�3%) and any-thing else (�4%). Clearly, mandates were underutilized as a recruitment device in �998, based on their reported effectiveness (UrbanTrans �998).
It would appear that membership is rising for almost all TMAs, at least among those choosing to participate in the �998 national study. TMA membership does not seem to relate to either TMA finance or the propensity of TMAs to succeed or fail, however, at least not in any observably systematic fashion. This suggests that TMA membership, at least by itself, cannot explain either TMA financial success or the survivability of TMAs. This once again seems strange and unexpected, requir-ing further thought and analysis.
ServicesMembership has its benefits, and it is these benefits that determine the desirability of membership, which is the propensity of individuals or firms to join organiza-tions as members, to maintain their organizational membership in good standing, and to pay their membership dues on a regular and timely basis, if and as required

Journal of Public Transportation, Vol. 10, No. 4, 2007
��
for the continuation of both their membership and any of its associated benefits. In the case of nonprofit organizations, the question of membership benefits can at times become somewhat more obscure to public view. Is membership in a TMA a form of profit-making activity, a charitable contribution to society, a necessary adjunct to other related decisions (such as the location of economic activities across both time and space), all of the above, or none of the above?
TMAs may choose to provide specific programs and services to their members, to nonmembers located within their designated service area boundaries, or to oth-ers located outside their service area boundaries on a special or case-by-case basis (Ferguson �997a). TMAs may choose to provide particular programs and services directly, indirectly through brokerage or referral, or not at all. TMAs may chose to provide programs and services at cost, at a higher price than cost (as a private firm does to generate profits, or simply to cover indirect overhead in the case of non-profit organizations), at a lower price than cost (a form of subsidy), at no cost (free of charge, although one could argue that membership dues broadly cover all or at least a portion of related costs), or even at negative cost (in the form of a cash pay-ment, voucher, or other financial instrument that exceeds the out-of-pocket cost to the commuter or other designated beneficiary of the program and/or service).
Member services may be distinguished in terms of pricing policy as loss leaders (subsidies), nonprofit (break even), or income producing (profit centers). Most nonprofits, including most TMAs, base their pricing schedules on a cost or subsidy basis, ignoring overhead, treating office and administration expenses as a sunk cost. Subsidies paid to corporate members and their employees are a tangible benefit of TMA membership, a return on the investment of membership fees that have already been paid. Subsidies paid to nonmembers and their employees are nominally free, but may come with strings attached, such as the expectation of future membership, and are thus linked to marketing and recruitment efforts. Subsidies paid to firms and employees outside the designated TMA service area boundary typically include no future expectations whatsoever, and are thus essen-tially a form of charity (Table �).
Prices higher than market rates (or the TMA’s cost basis, whichever is higher) are a form of profit taking, although in the case of indirectly provided services there may be some basis for a modest mark-up to cover TMA costs related to brokerage or referral services, similar to those imposed by travel agencies, for example. Some products and services may not be available at all, either because the TMA does not provide these services, or more generally because these are not provided, are

Transportation Management Associations: A Reappraisal
�3
not suitable, or are not relevant to the local service area. Membership-based TMAs need not offer any of their products and services to either nonmembers or firms and employees outside their designated service area. If and when TMAs do offer benefits of any kind to nonmembers, it is not necessary for them to employ the same pricing policy. A TMA may exclude any nonmember from receiving a prod-uct or service that is available to members, or to offer such products and services to nonmembers at a higher price.
The only previous national study to consider direct versus indirect TMA services offered was the �99� Georgia Tech study (Figure 5). The most common type of TMA service offered in �99� was information (e.g., carpool, vanpool, and transit information). The least likely was on-site services, which includes childcare, bank-ing, etc. With the exception of on-site services, which were relatively uncommon in �99�, all services were offered indirectly by between �5 percent and �7 percent of responding TMAs, a limited range of variability that suggests TMAs were more limited by the availability of selections than selective in their choice of indirect services to offer.
The �993 CTS, �998 UrbanTrans and �003 CUTR surveys each included a set of related questions about the availability of TMA services to TMA members (regard-less of price) and to nonmembers (with or without a nonmember price surcharge). The use of TMA services as a marketing tool (provided to nonmembers at the same price as members) has increased gradually from 38 percent in �993 to 40 percent in �998 and 43 percent in �003. The use of price surcharges to exclude
Table 2. TMA Services by Membership, Location, and Fee or Charge
Members Non-Members OutsideServiceArea
FeeorCharge Direct Indirect Direct Indirect Direct Indirect
Not available Not offered Unavailable Excluded Unavailable Excluded Unavailable (at any price)
Higher price Profit Mark-up Profit Mark-up Profit Mark-up
Market price Market Broker Market Referral Market Referral (or cost basis)
Lower price Subsidy Subsidy Marketing Marketing Charity Charity
Free (no charge) Inclusive Inclusive Marketing Marketing Charity Charity
Negative price Incentive Incentive Marketing Marketing Charity Charity(cash bonus)

Journal of Public Transportation, Vol. 10, No. 4, 2007
�4
nonmembers from TMA services (a negative enticement to join the TMA) has fallen from �9 percent in �993 to �0 percent in �998 and 6 percent in �003.
The number of TMA services included in each successive ACT survey has grown, and the labels in many cases have changed, sometimes expanding, sometimes contracting, the definition of the specific service in question. Four general types of TMA services are included in all three national ACT TMA surveys. These include marketing and public relations, employer services, commuter services, and parking services.
Marketing and public relations include regional and local advocacy and promo-tional materials and events. These services have declined in importance relatively speaking in recent years, but continue to be among the most popular offered by TMAs (Table 3). Employer services include ETC training, trip reduction plan preparation, site design assistance, and employee surveys. These services have declined slightly as well, with a new service, tax benefit assistance, emerging as the most popular among these in �003. Commuter services have expanded over the years, increasing in both number and relative popularity between �993 and �003. Parking services are the least common type of TMA service, and declined slightly between �998 and �003.
Figure 5. TMA Services, 1991

Transportation Management Associations: A Reappraisal
�5
Tabl
e 3.
TM
A M
embe
rs S
ervi
ces,
199
3-20
03

Journal of Public Transportation, Vol. 10, No. 4, 2007
�6
Tabl
e 3.
TM
A M
embe
rs S
ervi
ces,
199
3-20
03 (c
ont’d
.)

Transportation Management Associations: A Reappraisal
�7
Personnel
Another possible explanation for the poor financial performance of TMAs in the �990s might be inadequate staff or inappropriate hiring decisions. In �998, the average TMA had �.0 full-time employees, 0.8 part-time employees, and 0.3 contract employees, for a total of 3.� employees. The median TMA had only � full-time employee, � part-time employee, and no contract employees, for a total of just � staff, � of these being part time. Clearly, TMAs are not overstaffed. The average “value added” of the median TMA employee is $75,000 per year, which is not unreasonable given the extent to which TMAs contract out for staff, products, and/or services.
In �998, 33 percent of all TMA executive directors indicated their professional background was in transportation, followed by marketing (�6%), administra-tive (��%), public relations (��%), planning (��%), and nonprofit or government management (��%). This would seem to be an appropriate mix to manage public-private partnerships in transportation. In �998, the most common TMA executive director educational backgrounds included public service (�3%), planning (��%), education (��%), marketing (9%), public relations (9%), transportation (8%), and a rather large contingent in the “other” category (��%). Executive director educa-tional backgrounds were more diverse than professional backgrounds, with less specific emphasis on transportation. This is a reflection of the educational system in the United States and indeed the entire world, which only began to pay serious attention to transportation as an academic subject and professional training issue in the last few decades (Figure 6).
In �998, as TMA staff size increased, so too did the average qualifications of those hired to do the job. While 38 percent of �-person TMA staff were contract employ-ees and 50 percent of �-person TMA staff worked part-time, fully 7� percent of all 3- or more person TMA staff were full-time employees. As TMA staff size increased, so too did each of the following critical parameters:
• The percentage of TMAs that contracted out for specific services, had writ-ten personnel policies, and conducted annual employee reviews
• The executive director’s average level of education, annual salary, years of service with the TMA, and overall years of experience in TDM
• The number of employee benefits offered (especially paid holidays, seminar and conference attendance, professional membership dues, and medical, dental, life and vision insurance)
Tabl
e 3.
TM
A M
embe
rs S
ervi
ces,
199
3-20
03 (c
ont’d
.)

Journal of Public Transportation, Vol. 10, No. 4, 2007
�8
Figure 6. TMA Leadership, 1998
It would seem that TMA personnel have suitable backgrounds for the work they are engaged in. Further, the level of professional expectations and rewards both increase as the number of TMA employees increase. Thus, it would seem that TMA growing pains are not associated with either insufficient staff or inadequate staff preparation.
EvaluationAn evaluation of TMA performance may contribute to a better understanding of past, present, and future expectations. TMA evaluation has been the subject of intense scrutiny in the past (Dunphy and Lin �990), and may once again become a topic of research interest in the future. TMA evaluation may take place at several different levels of analysis, using diverse information sources, to serve a multiplicity of goals and objectives. Some people seem to expect TMAs to perform congestion mitigation miracles on shoestring budgets (see Ferguson, Ross, and Meyer �993), while others think TMAs do not require any evaluation at all (see Ferguson and Davidson �995). The answer presumably lies somewhere in between.
TMA evaluation criteria may include one or more of the following general types of performance measures (ACT �00�):

Transportation Management Associations: A Reappraisal
�9
�. Corporate leadership and involvement
�. Suitability of goals and objectives
3. Development and deployment of strategic plan
4. Financial management systems
5. Degree of external visibility
6. Effectiveness of programs
7. Measures of commuter and member satisfaction
8. Other (completely open-ended, tailored to the specific needs and require-ments of individual TMA boards, members, clientele, etc.)
These are organized from the most general to the most specific. The first five are all internalized performance measures, which relate to the way the TMA sees itself in the broader context of urban travel markets, regional transportation policy, and corporate client concerns. The sixth and seventh are those most often found in external reviews of TMA performance as an objective evaluation outcome. Clearly, TMA evaluation is mainly, although not entirely exclusively, a subjectively experi-enced phenomenon, at least from the TMA industry perspective.
In �989, only �4 percent of 5� responding TMAs indicated they had any experience with evaluation of any kind (ACT �989). Dunphy and Lin (�990) devoted much of their attention to measuring TMA performance, with mixed results. Their rela-tively few examples of drive-alone rates and peak-period congestion in suburban activity centers with and without TMAs are good indicators of how a TMA evalua-tion ought to be done, but rather poor examples of TMA performance in practice. This is mainly because most TMAs were not yet operational at the time the ULI study was conducted.
In �99�, the performance indicators most commonly felt to be appropriate by TMAs in terms of their own evaluation criteria were (�) changes in employee mode of travel (89%) and (�) changes in the number of vehicle trips made (80%). In �99�, �8 percent of 60 responding TMAs had completed, �7 percent were con-ducting, �0 percent had proposed, and 55 percent had not performed any type of evaluation within the last three years (Ferguson, Ross, and Meyer �993).
Most TMA evaluations in �99� were conducted externally (73%). The most com-mon TMA auditors included government agencies (68%), private consultants (37%), and universities (�6%). In �99�, more than half (54%) of responding TMAs indicated they intended to conduct at least one evaluation within the next three

Journal of Public Transportation, Vol. 10, No. 4, 2007
�0
years, while 36 percent did not intend to conduct any evaluations within the next five years. Nonetheless, 47 percent of all responding TMAs in �99� reported that annual evaluations were the best approach, at least under ideal circumstances. These results reinforce the notion that TMA evaluation is potentially controver-sial, possibly even a divisive issue within the TMA community itself.
In �993, 54 percent of responding TMAs provided at least one example of an evalu-ation product, while �5 percent provided two or more such examples (CTS �993). Clearly, as time passed, more TMA evaluations were being performed. ACT (�995) included text describing three different qualitative aspects of program evaluation, including the following:
�. Monitoring and enforcement
�. Successes to date
3. Reports and publications
No analysis was performed on any of these items in �995, nor were specific results from any of these references either confirmed or denied through external valida-tion. In the �998 national TMA survey, for the first time no questions of any kind were included on the subject of TMA evaluation (UrbanTrans �998). Clearly, there is a dearth of recent information on measurable performance indicators for TMA programs, services, and related activities.
Ferguson (�997a) provides two concrete examples of TMAs that achieved measur-able changes in employee mode split among commuters within their designated service areas, but quantitative results such as these remain relatively scarce within the TMA community. One should recall, however, that the median TMA serves �5,000 commuters on an annual budget of $�50,000, which yields just $6 per commuter per year. Even assuming that only the employees of TMA members are served, the median TMA still has only $�8 annually per employee to spend on modifying travel behavior, reducing traffic congestion, and improving air quality. This is a quite modest sum to work with. For TMAs to produce measurable results, one might conclude that greater financial and staff resources than these would be required.
This depends entirely on the performance measure used to evaluate TMA produc-tivity. Reducing traffic congestion in an urban environment is an expensive propo-sition, even when it falls into the “low cost” category. Recruiting TMA members and encouraging alternative forms of transportation is less costly than reducing traffic congestion. Increasing people’s awareness of alternatives is the least costly

Transportation Management Associations: A Reappraisal
��
of all, though it may not be associated with measurable changes in local or regional transportation system performance.
ExpectationsAs previously demonstrated, much of the confusion over TMA performance in relation to external expectations is due to variations, not so much in financial resources or staff commitments, but rather much broader social and organiza-tional goals and objectives. There are in fact almost as many different types of TMAs as there are TMAs themselves, since each is described uniquely by the individual circumstances that led to its creation in the first place. Nonetheless, it is possible to discern several broad categories of endeavor within the TMA domain, based primarily on service type rather than service area or boundary definitions, for example. These different levels of TMA service may include some or all of the following:
�. Promoter: Advocacy, marketing, and promotions
�. Broker: Brokerage and referral services
3. Provider: Direct provider of corporate and/or commuter services, focusing on the exchange of information and other more tangible incentives
4. Owner/operator: Facility and equipment manager, e.g. parking, vanpools, shuttle, etc.
The first type listed is the most common among TMAs today, the last perhaps least common. Many TMAs provide a range of services covering more than one of these categories. It may be that some or all of these service delivery options oper-ate on a hierarchical or sequential basis, with those listed above required for those below to become fully operational, but this hypothesis has yet to be tested on real data, which at present do not exist for that purpose.
As TMA products and services grow increasingly more sophisticated, their cost may be expected to rise, and demands for adequate performance monitoring and evaluation will increase correspondingly. TMAs that focus their efforts primarily on promotional activities may not have much of an impact on commuter travel markets, other than as a form of emergency back-up, with some additional appeal as a vehicle for improved public relations.
There may be some hope yet for more tangible TMA results. Ferguson (�997b) developed a model of carpooling as a function of average fleet fuel economy, real

Journal of Public Transportation, Vol. 10, No. 4, 2007
��
gasoline prices, and a trend variable representing demographic changes in society. When this model is applied to more recent national data, it suggests that carpool-ing may have done slightly better than expected in the �990s, even if there was a slight decline in carpooling mode split overall between �990 and �000 (Figure 7). Even more dramatic, the rapid rise in driving alone that occurred in both previous decades did not materialize in the �990s (Figure 8).
Figure 7. National Trends in Carpooling, 1970-2000
The large declines in transit use and walking observed in previous decades were not repeated in the �990s (U.S. Census Bureau �000). It thus appears that something happened in the �990s that did not occur in either the �970s or �980s before it.
Washington State, which currently possesses the only mandatory statewide com-mute trip reduction ordinance in the country, actually saw a slight decline from 73.9 percent driving alone to work in �990 to 73.3 percent in �000. King County, which includes the City of Seattle, saw a much larger decline from 7�.4 percent driving alone in �990 to 68.7 percent in �000, a 3.7 percent shift from driving alone to work into alternative modes of travel.

Transportation Management Associations: A Reappraisal
�3
Figure 8. National Trends in Driving Alone, 1970-2000
While one cannot attribute any of Washington State’s success in commute trip reduction specifically to the performance of individual TMAs, there are a number of these in Washington State, most formed within the last �0 years. These results do suggest that TDM can work on a large regional scale, at least under some cir-cumstances. TMAs may be one of the institutional mechanisms needed to imple-ment more efficient and effective TDM programs in the future.
ConclusionsTMAs have evolved considerably over the last �5 years. Initially conceived as pub-lic/private partnerships formed on a voluntary basis to advocate on behalf of local stakeholders to alleviate traffic congestion in rapidly growing transportation cor-ridors and suburban activity centers, TMAs today have diversified into a broader range of institutional forms serving a wider range of organizational interests.
After a shake-out in the �990s, the number of TMAs nationally is rising slowly but steadily. TMAs have access to more financial resources today, promising greater long-term stability and viability. TMAs are more widely and evenly spread out across the nation, although their primary focus continues to be large metropolitan areas and their environs. TMAs in recent years have concentrated more on provid-
Journal of Public Transportation, Vol. 10, No. 4, 2007
�4
ing services directly to commuters, and less on indirect services though employers and regional advocacy.
TMAs are an integral part of regional TDM programs in many urban areas of the United States, as well as an increasing number of cities in other parts of the world (Hendricks �004). TMAs are unlikely to grow into an alternative form of govern-mental entity, as predicted by Leinberger and Lockwood in �986, however, these highly innovative organizations are likely to maintain an important role as niche TDM service providers in a global economy, or “flat world,” increasingly domi-nated by large urban agglomerations, which is where TMAs seem to thrive best.
Acknowledgements
The author would like to thank Diane Davidson, David Ungemah, and Sara Hen-dricks for access to data and/or results from the �993, �998, and �003 national TMA studies. The author would also like to thank Chris Park, Rebecca Garrison, Malaika Rivers, Rhonda Abell, and many other members of the ACT TMA Council for their assistance in identifying current information on national TMA activities. Finally, the author would like to thank several anonymous TMA liaisons at met-ropolitan planning organizations, regional transit agencies, and state departments of transportation in the United States and abroad for their help in identifying rele-vant information on the formation of TMAs within their respective jurisdictions.
References
Association for Commuter Transportation. �989. TMA directory. �nd ed. Wash-ington, DC: ACT.
Association for Commuter Transportation. �995. TMA directory. 3rd ed. Washing-ton, DC: ACT.
Association for Commuter Transportation. �00�. TMA handbook. �nd ed. Denver, CO: ACT.
Commuter Transportation Services. �993. 1993 TMA policies and procedures sur-vey. Los Angeles, CA: CTS.
Diggins, L., and E. N. Schreffler. �99�. Status report on transportation management association development in California. Transportation Research Record �346: 53–6�.

Transportation Management Associations: A Reappraisal
�5
Dunphy, R. T., and B. C. Lin. �990. Transportation management through partner-ships. Washington, DC: Urban Land Institute.
ETF Associates. �00�. TMA Internet search. Unpublished data based on compre-hensive telephone interviews, broadcast e-mails, and exhaustive web searches. Atlanta, GA: ETF.
Ferguson, E. �990. Transportation demand management: planning, development and implementation. Journal of the American Planning Association 56(4): 44�–456.
Ferguson, E. �997a. Privatization as choice probability, policy process and program outcome: The case of transportation management associations. Transporta-tion Research A 3�(5): 353–364.
Ferguson, E. �997b. The rise and fall of the American carpool: �970–90. Transporta-tion �4(4): 349–376.
Ferguson, E., and D. Davidson. �995. Transportation management associations: An update. Transportation Quarterly 49(�): 45–60.
Ferguson, E., M. Meyer, and C. Ross. �993. Transportation management associa-tions. Transportation Quarterly 47(�): �07–��9.
Hendricks, S. J. �004. Results of the 2003 TMA survey. Tampa, FL: Center for Urban Transportation Research.
Hunter, J. E. �98�. Meta analysis. Beverly Hills, CA: Sage.
Leinberger, Christopher B., and Charles Lockwood. �986. How business is reshap-ing America. The Atlantic Monthly �58(4): 43–5�.
U.S. Census Bureau. �000. 2000 census of population and housing, journey to work statistics. Washington, DC: U.S. Census Bureau.
UrbanTrans Consultants. �998. 1998 TMA operational survey. Denver, CO: Urban-Trans.
About the Author
Erik Ferguson ([email protected]) teaches transportation planning, urban economics, and research methods at the American University of Sharjah. He coined the term “transportation demand management” while working for Commuter Transportation Services, Inc. in Los Angeles in �984. He has written extensively on
Journal of Public Transportation, Vol. 10, No. 4, 2007
�6
the subjects of transportation demand management in general and transportation management associations in particular. His current research interests include parking planning by design and the art and science of public policy decision making.