Exact and approximate rebinning algorithms for 3-D PET data
14
IEEE TRANSACTIONS ON MEDICAL IMAGING, VOL. 16, NO. 2, APRIL 1997 145 Exact and Approximate Rebinning Algorithms for 3-D PET Data Michel Defrise,* P. E. Kinahan, D. W. Townsend, Member, IEEE, C. Michel, Member, IEEE, M. Sibomana, and D. F. Newport Abstract— This paper presents two new rebinning algorithms for the reconstruction of three-dimensional (3-D) positron emis- sion tomography (PET) data. A rebinning algorithm is one that first sorts the 3-D data into an ordinary two-dimensional (2-D) data set containing one sinogram for each transaxial slice to be re- constructed; the 3-D image is then recovered by applying to each slice a 2-D reconstruction method such as filtered-backprojection. This approach allows a significant speedup of 3-D reconstruction, which is particularly useful for applications involving dynamic acquisitions or whole-body imaging. The first new algorithm is obtained by discretizing an exact analytical inversion formula. The second algorithm, called the Fourier rebinning algorithm (FORE), is approximate but allows an efficient implementation based on taking 2-D Fourier transforms of the data. This second algorithm was implemented and applied to data acquired with the new generation of PET systems and also to simulated data for a scanner with an 18 axial aperture. The reconstructed images were compared to those obtained with the 3-D reprojection algorithm (3DRP) which is the standard “exact” 3-D filtered- backprojection method. Results demonstrate that FORE provides a reliable alternative to 3DRP, while at the same time achieving an order of magnitude reduction in processing time. Index Terms—Image reconstruction, medical imaging, positron emission tomography, X-ray transform. I. INTRODUCTION P OSITRON emission tomography (PET) is one of the medical imaging modalities for which the transition from two-dimensional (2-D) to three-dimensional (3-D) acquisition has been most successful. Following pioneering work in extending PET to 3-D imaging [1]–[3], the development after 1989 of multiring scanners equipped with retractable septa [4]–[6] has led to the present widespread utilization of volume PET scanners [7]–[10]. These scanners have an open, collimator-less cylindrical geometry which allows the Manuscript received May 8, 1996; revised November 14, 1996. The Associate Editor responsible for coordinating the review of this paper and recommending its publication was C. J. Thompson. Asterisk indicates corresponding author. *M. Defrise is with the Division of Nuclear Medicine, Free University of Brussels AZ-VUB, Laarbeeklaan 101, Brussels B-1090 Belgium (e-mail: [email protected]). He is also with the National Fund for Scientific Research (Belgium). P. E. Kinahan and D. W. Townsend are with PET Facility, University of Pittsburgh Medical Center, Pittsburgh, PA 15260 USA. C. Michel is with PET Laboratory, Catholic University of Louvain, Louvain-La Neuve 1348 Belgium. He is also with the National Fund for Scientific Research (Belgium). M. Sibomana is with PET Laboratory, Catholic University of Louvain, Louvain-La Neuve 1348 Belgium. D. F. Newport is with CTI, Knoxville, TN 37921 USA. Publisher Item Identifier S 0278-0062(97)02488-9. measurement of coincidences between all pairs of detectors on the cylindrical surface. These 3-D data approximate line integrals of the radioactive tracer distribution along lines of response (LOR’s) which are not restricted to lie within transaxial planes, in contrast with the 2-D data acquired when the scanner is operated in 2-D mode, with interslice septa. The transition from 2-D acquisition to 3-D acquisition leads to a significant improvement of the scanner sensitivity, due to the increased number of measured LOR’s and to the elimination of the detector shadowing by the septa. Usually, 3-D PET data are reconstructed using the 3-D reprojection algorithm (3DRP), a 3-D filtered-backprojection (FBP) method obtained by discretizing an analytical recon- struction formula and by estimating data not measured by the scanner [11]. Owing to the considerable number of LOR’s measured in 3-D mode, it is not surprising that the 3DRP algorithm is much more time consuming than the 2-D slice- by-slice FBP used to reconstruct data acquired in 2-D mode. A further reason for this increased complexity is that the reconstruction of the 3-D image is not decomposed into the reconstruction of a set of independent slices. Other algorithms relying on exact analytical formulas [12]–[15] have so far been unable to reduce reconstruction time by factors larger than two compared to the 3DRP algorithm. In contrast, sig- nificant improvements in the reconstruction speed have been achieved using various combinations of the three following approaches. The first one is the introduction of faster, but often expensive, hardware and the optimization of the im- plementation of the 3DRP algorithm [16]–[18]. The second approach uses a reduced sampling of the 3-D data to decrease the number of LOR’s which must be backprojected. Reduced sampling is achieved by adding groups of adjacent LOR’s in such a way that the resulting loss of spatial resolution remains acceptable for a given type of study. Finally, the third successful approach to faster 3-D reconstruction has been the introduction of approximate algorithms based on rebinning the 3-D data in plane integrals [19] or in a 2-D data set [20]–[22]. This paper presents new algorithms belonging to this latter family. A rebinning algorithm is defined as an algorithm which sorts (rebins) the 3-D data into a stack of ordinary 2-D data sets, where for each transaxial slice the 2-D data are organized as a sinogram. These rebinned data are equivalent geometrically to data collected in the conventional 2-D mode and can therefore be reconstructed by applying the 2-D FBP algorithm to each slice separately. Thus, rebinning decomposes 0278–0062/97$10.00 1997 IEEE
-
Upload
rohitkaranth -
Category
Documents
-
view
1 -
download
0
Transcript of Exact and approximate rebinning algorithms for 3-D PET data

IEEE TRANSACTIONS ON MEDICAL IMAGING, VOL. 16, NO. 2, APRIL 1997 145
Exact and Approximate RebinningAlgorithms for 3-D PET DataMichel Defrise,* P. E. Kinahan, D. W. Townsend,Member, IEEE,
C. Michel, Member, IEEE, M. Sibomana, and D. F. Newport
Abstract—This paper presents two new rebinning algorithmsfor the reconstruction of three-dimensional (3-D) positron emis-sion tomography (PET) data. A rebinning algorithm is one thatfirst sorts the 3-D data into an ordinary two-dimensional (2-D)data set containing one sinogram for each transaxial slice to be re-constructed; the 3-D image is then recovered by applying to eachslice a 2-D reconstruction method such as filtered-backprojection.This approach allows a significant speedup of 3-D reconstruction,which is particularly useful for applications involving dynamicacquisitions or whole-body imaging. The first new algorithm isobtained by discretizing an exact analytical inversion formula.The second algorithm, called the Fourier rebinning algorithm(FORE), is approximate but allows an efficient implementationbased on taking 2-D Fourier transforms of the data. This secondalgorithm was implemented and applied to data acquired with thenew generation of PET systems and also to simulated data for ascanner with an 18� axial aperture. The reconstructed imageswere compared to those obtained with the 3-D reprojectionalgorithm (3DRP) which is the standard “exact” 3-D filtered-backprojection method. Results demonstrate that FORE providesa reliable alternative to 3DRP, while at the same time achievingan order of magnitude reduction in processing time.
Index Terms—Image reconstruction, medical imaging, positronemission tomography, X-ray transform.
I. INTRODUCTION
POSITRON emission tomography (PET) is one of themedical imaging modalities for which the transition from
two-dimensional (2-D) to three-dimensional (3-D) acquisitionhas been most successful. Following pioneering work inextending PET to 3-D imaging [1]–[3], the developmentafter 1989 of multiring scanners equipped with retractablesepta [4]–[6] has led to the present widespread utilizationof volume PET scanners[7]–[10]. These scanners have anopen, collimator-less cylindrical geometry which allows the
Manuscript received May 8, 1996; revised November 14, 1996. TheAssociate Editor responsible for coordinating the review of this paperand recommending its publication was C. J. Thompson.Asterisk indicatescorresponding author.
*M. Defrise is with the Division of Nuclear Medicine, Free Universityof Brussels AZ-VUB, Laarbeeklaan 101, Brussels B-1090 Belgium (e-mail:[email protected]). He is also with the National Fund for ScientificResearch (Belgium).
P. E. Kinahan and D. W. Townsend are with PET Facility, University ofPittsburgh Medical Center, Pittsburgh, PA 15260 USA.
C. Michel is with PET Laboratory, Catholic University of Louvain,Louvain-La Neuve 1348 Belgium. He is also with the National Fund forScientific Research (Belgium).
M. Sibomana is with PET Laboratory, Catholic University of Louvain,Louvain-La Neuve 1348 Belgium.
D. F. Newport is with CTI, Knoxville, TN 37921 USA.Publisher Item Identifier S 0278-0062(97)02488-9.
measurement of coincidences between all pairs of detectorson the cylindrical surface. These3-D data approximate lineintegrals of the radioactive tracer distribution along linesof response (LOR’s) which are not restricted to lie withintransaxial planes, in contrast with the 2-D data acquired whenthe scanner is operated in 2-D mode, with interslice septa. Thetransition from 2-D acquisition to 3-D acquisition leads to asignificant improvement of the scanner sensitivity, due to theincreased number of measured LOR’s and to the eliminationof the detector shadowing by the septa.
Usually, 3-D PET data are reconstructed using the 3-Dreprojection algorithm(3DRP), a 3-D filtered-backprojection(FBP) method obtained by discretizing an analytical recon-struction formula and by estimating data not measured by thescanner [11]. Owing to the considerable number of LOR’smeasured in 3-D mode, it is not surprising that the 3DRPalgorithm is much more time consuming than the 2-D slice-by-slice FBP used to reconstruct data acquired in 2-D mode.A further reason for this increased complexity is that thereconstruction of the 3-D image is not decomposed into thereconstruction of a set of independent slices. Other algorithmsrelying on exact analytical formulas [12]–[15] have so farbeen unable to reduce reconstruction time by factors largerthan two compared to the 3DRP algorithm. In contrast, sig-nificant improvements in the reconstruction speed have beenachieved using various combinations of the three followingapproaches. The first one is the introduction of faster, butoften expensive, hardware and the optimization of the im-plementation of the 3DRP algorithm [16]–[18]. The secondapproach uses a reduced sampling of the 3-D data to decreasethe number of LOR’s which must be backprojected. Reducedsampling is achieved by adding groups of adjacent LOR’sin such a way that the resulting loss of spatial resolutionremains acceptable for a given type of study. Finally, the thirdsuccessful approach to faster 3-D reconstruction has been theintroduction of approximate algorithms based on rebinning the3-D data in plane integrals [19] or in a 2-D data set [20]–[22].This paper presents new algorithms belonging to this latterfamily.
A rebinning algorithm is defined as an algorithm whichsorts (rebins) the 3-D data into a stack of ordinary 2-Ddata sets, where for each transaxial slice the 2-D data areorganized as a sinogram. These rebinned data are equivalentgeometrically to data collected in the conventional 2-D modeand can therefore be reconstructed by applying the 2-D FBPalgorithm to each slice separately. Thus, rebinning decomposes
0278–0062/97$10.00 1997 IEEE
146 IEEE TRANSACTIONS ON MEDICAL IMAGING, VOL. 16, NO. 2, APRIL 1997
the 3-D reconstruction problem into a set of independent 2-D Radon transforms. Provided the rebinning procedure itselfis efficient, reconstruction becomes almost as fast as in the2-D mode, while retaining the increased sensitivity of 3-Dacquisition because the complete set of 3-D LOR’s are usedin the reconstruction.
Rebinning requires a way to estimate the value of thedirectLOR’s, which lie within a transaxial slice, from the measuredoblique LOR’s which traverse several slices. The simplestway to do this is to neglect altogether the angle between anoblique LOR and the transaxial plane and to reassign thatoblique LOR to the slice lying midway axially between the twodetectors in coincidence. This is how 2-D data are acquiredwith multiring scanners operated with interslice septa, althoughin this case the presence of the septa restricts the angle betweenthe LOR’s and the transaxial plane to small values. Theextension of the same principle to 3-D acquisition leads to thesingle-slice rebinning algorithm (SSRB), which is an orderof magnitude faster than the 3DRP algorithm [20]. As caneasily be appreciated geometrically, the SSRB approximationis accurate only when the tracer distribution is concentratedclose to the axis of the scanner [23]. Thus, accurate SSRBreconstructions have been obtained with the 16-ring ECAT953B for receptor studies involving the human basal ganglia[24]. For Ffluorodeoxyglucose (FDG) brain imaging, the tracerdistribution extends further transaxially, and larger distortionscould be expected with the SSRB algorithm, especially whenthe brain is not well centered in the field-of-view (FOV). Evenin this case, the differences with images obtained with the3DRP algorithm are often minor because the axial aperture ofmany current PET scanners does not exceed 10. However,other applications such as whole-body imaging, or brainimaging with wide aperture scanners [10] require either exact3-D reconstruction or more accurate rebinning methods. Anexample of such a method is the multislice rebinning algorithm(MSRB), in which an oblique LOR contributes to the sinogramof all slices which it traverses [21], [25]. This algorithm ismore accurate than SSRB, but is less stable in the presenceof noise [25]–[27].
This paper introduces a class of rebinning algorithms basedon a new exact inversion formula and describes in detail theimplementation and performance of one particular algorithm[28], theFourier rebinning algorithm(FORE). The substantialgain in reconstruction time achieved by this algorithm isparticularly useful for applications where multiple 3-D datasets must be reconstructed as in dynamic PET studies or inwhole-body imaging. The new inversion formula is derived inSection II and leads to an exact rebinning algorithm related tothe direct 3-D Fourier reconstruction method [13]. This newalgorithm is expected to be faster than the 3DRP algorithm,but its numerical complexity remains high compared to theSSRB algorithm, particularly because the unmeasured pro-jection data which are truncated axially must be estimatedas in the 3DRP algorithm. Therefore, this paper focuseson approximate but faster rebinning algorithms which areobtained by expanding the exact rebinning formula in powersof the angle between the LOR’s and the transaxial plane. Thelowest order approximation, setting , corresponds to the
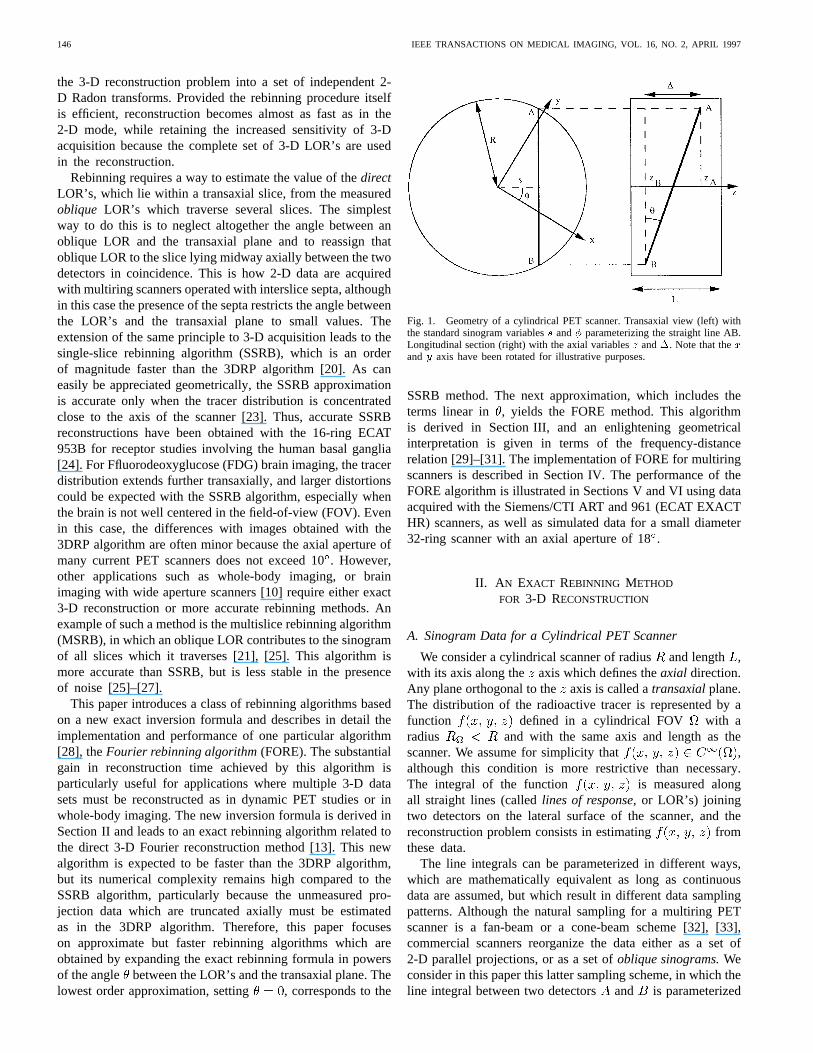
Fig. 1. Geometry of a cylindrical PET scanner. Transaxial view (left) withthe standard sinogram variabless and� parameterizing the straight line AB.Longitudinal section (right) with the axial variablesz and�. Note that thexandy axis have been rotated for illustrative purposes.
SSRB method. The next approximation, which includes theterms linear in , yields the FORE method. This algorithmis derived in Section III, and an enlightening geometricalinterpretation is given in terms of the frequency-distancerelation [29]–[31]. The implementation of FORE for multiringscanners is described in Section IV. The performance of theFORE algorithm is illustrated in Sections V and VI using dataacquired with the Siemens/CTI ART and 961 (ECAT EXACTHR) scanners, as well as simulated data for a small diameter32-ring scanner with an axial aperture of 18.
II. A N EXACT REBINNING METHOD
FOR 3-D RECONSTRUCTION
A. Sinogram Data for a Cylindrical PET Scanner
We consider a cylindrical scanner of radiusand length ,with its axis along the axis which defines theaxial direction.Any plane orthogonal to the axis is called atransaxialplane.The distribution of the radioactive tracer is represented by afunction defined in a cylindrical FOV with aradius and with the same axis and length as thescanner. We assume for simplicity that ,although this condition is more restrictive than necessary.The integral of the function is measured alongall straight lines (calledlines of response,or LOR’s) joiningtwo detectors on the lateral surface of the scanner, and thereconstruction problem consists in estimating fromthese data.
The line integrals can be parameterized in different ways,which are mathematically equivalent as long as continuousdata are assumed, but which result in different data samplingpatterns. Although the natural sampling for a multiring PETscanner is a fan-beam or a cone-beam scheme [32], [33],commercial scanners reorganize the data either as a set of2-D parallel projections, or as a set ofoblique sinograms.Weconsider in this paper this latter sampling scheme, in which theline integral between two detectorsand is parameterized

DEFRISEet al.: EXACT AND APPROXIMATE REBINNING ALGORITHMS FOR 3-D PET DATA 147
as (Fig. 1)
(1)
where is a unit vector along the line ofintegration
(2)
and the four variables, , , and are defined as follows.The variables and are related to the axial coordinatesand of the two detectors in coincidence by
and
Thus, is the axial coordinate of the point midway betweenthe two detectors and is the axial spacing between thetwo detectors. For a fixed value of the pair ( ), the dataare parameterized by the same variablesand as in anordinary sinogram: is the distance between theaxis andthe projection of the line onto a transaxial plane;is the anglebetween this projection and theaxis (Fig. 1). Therefore wedefine the set of data corresponding to a fixed pair () asan oblique sinogram.When , the sinogram is called adirect sinogram.For a PET scanner with rings, each pairof rings corresponds to a fixed pair ( ), and hence the dataacquired in 3-D mode consist of sinograms, in which areincluded direct sinograms and oblique sinograms.
The range of the four variables are, and . Due to the finite
length of the cylindrical scanner, therange depends onand does not cover the whole FOV, except for thesubset. This reduction in the range with increasing isreferred to as thetruncation of the 3-D data.
The new rebinning formula derived below is based on aslightly different parametrization defined by
(3)
where is the tangent of the anglebetween an LOR and thetransaxial plane, and where the variable of integrationis nowalong the projection of the LOR in the transaxial plane at axialposition [instead of along the LOR, as in (1)]. In a multiringscanner the variableis proportional to the difference betweenthe indexes of the two rings in coincidence and, therefore,
Fig. 2. The principle of a rebinning algorithm, illustrated for the slicesampling typical for existing multiring scanners, withN “direct” slices lyingin the plane of theN detector rings andN � 1 “cross” slices lying midway,axially, between adjacent detector rings.
with a small abuse of terminology, will be called theringdifference.The range of the axial variables areand .1 Building a set of data parameterizedaccording to (3), from the measured data corresponding to (1)requires a one-dimensional (1-D) interpolation across differentoblique sinograms. However, when , the angle isapproximately constant in a given oblique sinogram and theresampling reduces in this case to a weighting by .With the ECAT EXACT HR, for instance, the variation ofin a sinogram does not exceed 1.4for a 40-cm FOV, andthis variation is neglected in most implementations of the3DRP algorithm (even though it may in some cases exceedthe angular data sampling interval). We assume below that theresampling has been achieved, or that it can be neglected. Thispaper addresses the problem of solving the integral (3).
B. What is a Rebinning Algorithm?
When a scanner is operated in 2-D mode, the measuredLOR’s are restricted to lie in a transaxial plane, so that
. Therefore, a 2-D data set is also described by (3),but with
(4)
These 2-D data contain, for each slice, one ordinary (ordirect) sinogram which can be reconstructed by 2-D FBP,independently of the other slices. Not surprisingly, this sliceby slice reconstruction of a three-parameter data set is con-siderably faster than the reconstruction of the four-parameter3-D data set with the 3DRP algorithm.
This observation suggests an alternative approach to 3-D reconstruction, in which the 3-D data are not directlyreconstructed, but serve to estimate 2-D data from whichthe image can then be recovered using any 2-D reconstruc-tion algorithm such as FBP (Fig. 2). Therefore, we definea rebinning algorithmas a method to estimate
1As can be seen from (3), the actual range isjzj � L=2� j�jpR2 � s2
and depends on the variables. For simplicity we use the maximum range thatis independent ofs.
148 IEEE TRANSACTIONS ON MEDICAL IMAGING, VOL. 16, NO. 2, APRIL 1997
from . A useful rebinning algorithm should be asfollows:
1) fast (otherwise there would be no advantage with respectto other techniques);
2) accurate and ideally based on an exact analytical inver-sion formula;
3) as stable with respect to noise as the 3DRP method.
Note the importance of this last requirement. Noise-free 3-DPET data are redundant in the sense that thedirect sinograms,i.e., the sinograms with , are sufficient for an exactreconstruction. Hence, without requirement three, rebinningcould be achieved trivially by extracting from the 3-D data thedirect sinograms, according to (4). While valid for noise-freedata, this approach would not take advantage of the increasedsensitivity achieved by a 3-D acquisition. An optimal signal-to-noise ratio (SNR) in the reconstructed image can be obtainedonly if the rebinning method incorporates the whole 3-D data,as does the 3DRP algorithm.
C. Derivation of an Exact Rebinning Formula
The inverse problem defined by the integral (3) is invariantfor rotations around the axis, and also for translationsalong the radial variable. These invariances can be exploitedby calculating, for each pair ( ), the continuous Fouriertransform of the oblique sinogram with respect to the variable
and the Fourier series with respect to the azimuthal angle
(5)
where is the radial frequency and theFourier index. As the oblique sinograms are sampled only for
, (5) is calculated in practice using the symmetry
(6)
Substituting (3) into (5) one has
(7)
which can also be written using cylindrical coordinates as
(8)
Owing to data truncation, (3) is not invariant for axial transla-tions because the measured range of thevariable is limited
to . The 3DRP algorithm overcomes thisaxial truncation by initially estimating the data for a largerrange covering the whole FOV, that is [recallthat here represents the axial coordinate of the midpoint ofthe LOR’s in the sinogram ( )]. This is done by forwardprojecting an initial image estimate reconstructed from thedirect sinograms only. Similarly, we assume here that the datahave been extrapolated to all. Invariance for axial translationsis thereby restored, and we take the Fourier transform of (8)with respect to
(9)
where is the axial frequency and is the 1-Daxial Fourier transform of written with cylindricalcoordinates
(10)
In (9) the integration variable is no longer present inthe argument of , and hence can befactored out of the integral. Using the standard integralrepresentation of Bessel functions [34] one has
(11)
where the arctan is defined in the interval .Putting (11) into (9) yields
(12)
The new exact rebinning formula is a direct consequence of(12). Indeed, noting that the second exponential factor as wellas the square root are independent of the integration variablesand , and rewriting (12) for the particular case of thedirectsinograms with
(13)

DEFRISEet al.: EXACT AND APPROXIMATE REBINNING ALGORITHMS FOR 3-D PET DATA 149
yields the following relation between the 3-D Fourier trans-forms of oblique and direct sinograms:
(14)
An equivalent formula is obtained by swapping the left- andright-hand side and by replacing by
(15)
where the arcsine is defined in the interval [ ].2
Equations (14) and (15) are the main theoretical results of thispaper.
D. The Truncation Problem: An Implementation of (14)
For each value of the ring difference satisfying thecondition , (15) provides an independent estimateof . In the absence of noise all these estimatesare equal, but when the data are noisy the SNR is increasedby averaging all estimates. Thus, the rebinned 2-D data arecalculated in (16) shown at the bottom of the page, where
(17)
and is the 3-D Fourier transform of the 2-D data, (4)
(18)
Only positive values of appear in (16) because the sinogramswith negative have been merged when calculating the 2-DFourier transform (6).
An attractive property of (16) is that it only requiresa 1-D interpolation along the radial frequency, and acomplex multiplication with the exponential factor. On theother hand, a major problem is the assumption in Section II-Cthat is available for all . As the
2A remarkable, though purely formal, identity exists between (15) and thesolution to the 2-D attenuated radon transform given by Bellini [35] and Metzand Pan [36, eq. 24]. The link is seen by considering (15) for a fixed!z , andby taking� = i=�at, where�at is the constant attenuation coefficient.
cylindrical scanner only covers the range ,implementation of the exact rebinning formula is possible onlyif one first estimates over the unmeasured range
. Following the sameapproach as in the 3DRP algorithm, this can be done by usingthe 2-D data subset corresponding to . Thefollowing algorithm results.
Algorithm 1—Exact Rebinning:
1) Initialize a stack of rebinned Fourier transformed sino-grams .
2) Calculate the 3-D fast Fourier transform (FFT) of themeasured sinograms . This will beused to estimate the truncated data.
3) Consider sequentially each value of:
a) calculate the 2-D FFT of the data with respect toand to get on the measured range
;
b) estimate fromusing the result of Step 2 and (14);
c) take the inverse 1-D FFT of with respect toto get an estimate of over the missingrange ;
d) merge the result of 3a) and 3c) to geton the full range ;
e) calculate the 1-D FFT with respect to to get;
f) for each sample ( ), use (14) to increment therebinned datawith the appropriate values of . Thisstep involves a 1-D interpolation in;
4) Normalize the rebinned data to take into accountthe variable number of contributions to each frequencycomponent . The normalization factor is equalto in (17).
5) Take the inverse 3-D FFT of to obtain the stack ofrebinned sinograms
6) Reconstruct each slice usingany 2-D reconstructionalgorithm.
This algorithm [cf. Step 3f)] can be viewed as a “datadriven” implementation of the integral in (16), and the Steps3b)–3d) correspond to the reprojection step in the 3DRPalgorithm. The numerical complexity is comparable to thatof a direct 3-D Fourier reconstruction [13] with the added ad-vantage that it only involves 1-D interpolations. Nevertheless,the numerical complexity remains considerable compared toSSRB, and the actual implementation is beyond the scope ofthis paper. Rather, considering the need for fast algorithms,the rest of the paper concentrates on approximate but moreefficient rebinning methods.
(16)
150 IEEE TRANSACTIONS ON MEDICAL IMAGING, VOL. 16, NO. 2, APRIL 1997
III. A PPROXIMATE REBINNING ALGORITHMS
The aim of this section is to derive from the exact rebinning(14) approximations which lead to fast implementations. Themain result will be the Fourier rebinning equation (28).
First define the variable
(19)
where and are the transaxial and axial frequencies,respectively, and is the angle between the LOR’s and thetransaxial plane. The exact rebinning (14) can be written as
(20)
where , as before, is the 3-D Fourier transform of the data,and we have defined thephase shift
(21)
and thefrequency scaling
(22)
A class of rebinning algorithms of increasing accuracy canbe obtained by considering truncated Taylor expansions inof the phase shift and of the frequency scaling factor. Thealgorithms incorporating terms up to , , and arediscussed below.
A. Zeroth-Order: The SSRB Approximation
The zeroth-order approximation is found by settingin (20)
(23)
In this limit the inverse 3-D Fourier transform with respect to, , and can be calculated explicitly
(24)
Equation (24) is the SSRB approximation [20]. Each obliquesinogram ( ) is an estimate of the direct sinogram ( ),and therefore the rebinned sinogram for a given sliceiscalculated as the average of the oblique sinograms (), forall available values of .
B. First-Order: Fourier Rebinning Approximation
The next approximation is obtained by keeping terms whichare linear in . Noting that
(25)
and
(26)
one obtains
(27)
As the only dependence on the axial frequencyis a linearphase shift, it is possible to calculate the inverse 1-D Fouriertransform of (27) with respect to
(28)
Equation (28) is theFourier rebinning approximation[28],[37], [38]. It relates the 2-D Fourier transform of an obliquesinogram ( ) to the 2-D Fourier transform of the directsinogram of a slice shifted axially by a frequency-dependentoffset . The implementation of (28) will bediscussed in Section IV, but two important properties shouldbe stressed.
a) Implementation only involves a 1-D interpolation in.No interpolation is needed in the frequency variablesand .
b) In contrast with the exact rebinning based on (14),Fourier rebinning does not require taking an axialFourier transform with respect to. This considerablysimplifies the implementation, not only because of thesmaller number of FFT, but more importantly becausethe data need no longer be known for all values of,and hence the truncated data need not be estimated.
C. Second-Order: Estimating the Accuracyof Fourier Rebinning
The accuracy of Fourier rebinning can be estimated bycalculating the second-order approximation. Using (25) and
(29)
one obtains
(30)
Taking the inverse axial Fourier transform and noting thatmultiplication of the Fourier transform by is equivalentto a second derivative with respect to, one obtains
(31)
where as before. The second term in theright-hand side of (31) is a correction to (28), and its mag-nitude is an estimate of the accuracy of the Fourier rebinningapproximation.
The behavior of the correction term at low frequenciescan be understood by considering the consistency condition

DEFRISEet al.: EXACT AND APPROXIMATE REBINNING ALGORITHMS FOR 3-D PET DATA 151
for the 2-D Radon transform, which is expressed in terms ofthe 2-D Fourier transform of a sinogram ( ) as
(32)
where is the radius of the FOV [33, Sec. III-3]. Equation(32) shows that for large values ofthe consistency conditionforces the data to be zero precisely in the lowregion wherethe Fourier rebinning approximation would be invalid due tothe dependence in the correction term in (31). Therefore,the correction term is significant only in the region of the( ) plane whereboth and are small.
Three other properties are apparent from (31).
1) The Fourier rebinning is exact if dependslinearly on . In this case, is also linearin and hence its secondderivative in (31) vanishes.The same property holds for the SSRB algorithm.
2) The second term in the right-hand side of (31) isproportional to the square of the ring difference[recall
]. The Fourier rebinning approximationis therefore expected to break down when the axialaperture of the scanner becomes too large. In this case,the exact rebinning algorithm in Section II-D should beused instead of Fourier rebinning.
3) Actually calculating the correction to improve the ac-curacy of the reconstruction is probably impracticalbecause the second derivative with respect towouldstrongly amplify noise.
D. Geometrical Interpretation of theFourier Rebinning Equation
The Fourier rebinning equation has been derived inSection III-B by approximating an exact inversion formula,(14). The original derivation of Fourier rebinning [28] wasbased on thefrequency-distance relation,a property of the2-D Radon transform discovered by Edholmet al. [29].This alternative derivation provides an instructive geometricalinterpretation of Fourier rebinning and is summarized in thissection.
We first introduce the frequency-distance relation for anoblique sinogram ( )
(33)
Consider the 2-D Fourier transform of thissinogram, calculated according to (5).The frequency-distancerelation states that the value of at the frequency( )receives contributions mainly from sources located at a fixeddistance along the lines of integration.Note thatis the integration variable in (33) and represents the signeddistance measured on a transaxial projection of the LOR,from the midpoint of the LOR. This remarkable approximateproperty can be viewed as a “virtual time of flight principle”since it provides information about the location of a sourcealong the LOR’s, something that is not possible in non time-of-flight tomography. The price to pay is that this information
Fig. 3. Geometrical interpretation of Fourier rebinning: a virtual sourceS
corresponding to a frequency component (!; k) is at a transaxial distancetfrom the midpoint of the LOR AB. The axial coordinate of the source canthen be calculated asz0
= z + t tan (�).
is obtained only after mixing all measured LOR’s when takingthe 2-D Fourier transform. Applications of the frequency-distance relation can be found in [29]–[31]. Let us alsomention that the consistency condition (32) is a corollary ofthe frequency-distance relation. For, if the activity is containedwithin a FOV of radius , then the distance of any sourcealong any LOR cannot exceed , and hence the frequency-distance relation implies that the Fourier transformed data mustvanish when . Applications of this propertycan be found in [39] and [40].
We now apply the frequency-distance relation to the rebin-ning of 3-D PET data. Consider the contribution of a pointsource to an oblique sinogram ( ), and assume that thetransaxial position of along an LOR is known. Then, usingthe known angle between that LOR and thetransaxial plane, the axial position of can be obtained as
(34)
where is the axial coordinate of the point midway along theLOR (Fig. 3). The contribution the source would make for
can then be rebinned into a direct sinogram ( ).This method appears impractical because no unique value of
can be associated with an LOR. However, after taking the2-D Fourier transform of the sinogram, the frequency-distancerelation gives an estimate of for each “virtual” sourcecorresponding to a frequency ( ). Application of (34) thenimmediately leads to the Fourier rebinning (28).
IV. THE FOURIER REBINNING ALGORITHM (FORE)
The main result of the previous section is the relation (28)between the 2-D Fourier transform of an oblique sinogram andthe 2-D Fourier transform of a direct sinogram. This sectiondescribes the Fourier rebinning algorithm (FORE) based onthis relation. The principle of the method is first presentedin Section IV-A, then implementation details are given inSections IV-B and IV-C, and the section concludes with astep by step description of the algorithm in Section IV-D.
152 IEEE TRANSACTIONS ON MEDICAL IMAGING, VOL. 16, NO. 2, APRIL 1997
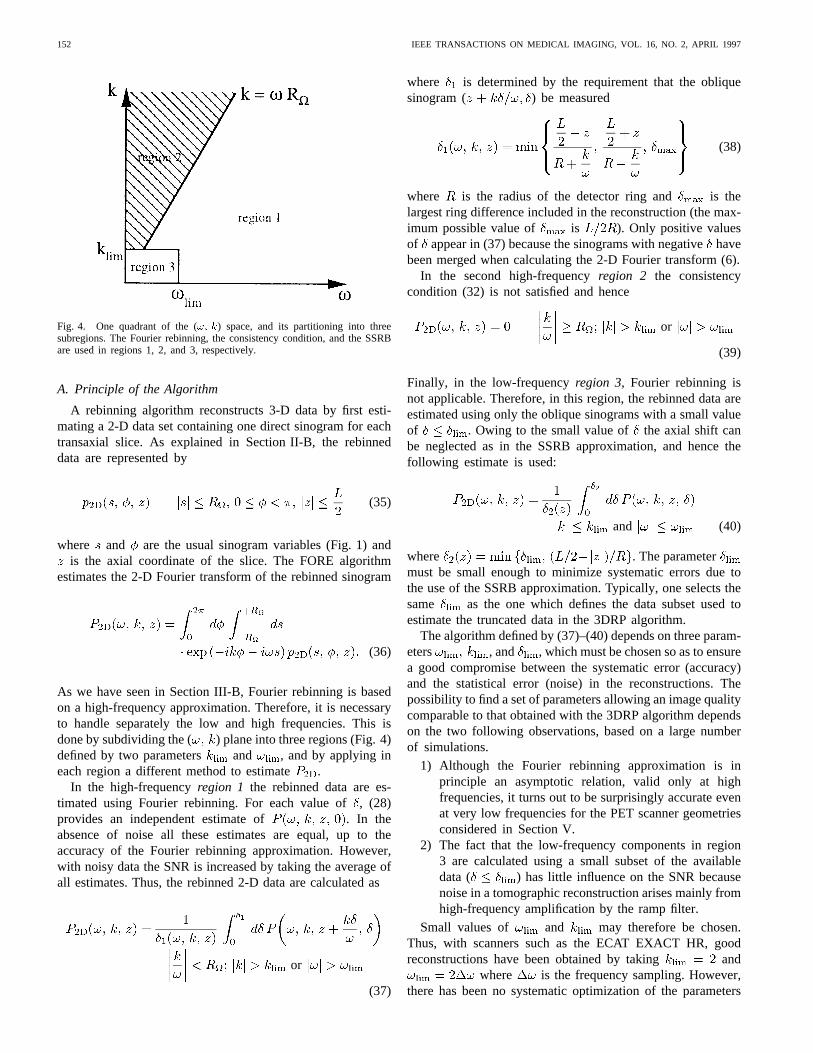
Fig. 4. One quadrant of the (!; k) space, and its partitioning into threesubregions. The Fourier rebinning, the consistency condition, and the SSRBare used in regions 1, 2, and 3, respectively.
A. Principle of the Algorithm
A rebinning algorithm reconstructs 3-D data by first esti-mating a 2-D data set containing one direct sinogram for eachtransaxial slice. As explained in Section II-B, the rebinneddata are represented by
(35)
where and are the usual sinogram variables (Fig. 1) andis the axial coordinate of the slice. The FORE algorithm
estimates the 2-D Fourier transform of the rebinned sinogram
(36)
As we have seen in Section III-B, Fourier rebinning is basedon a high-frequency approximation. Therefore, it is necessaryto handle separately the low and high frequencies. This isdone by subdividing the ( ) plane into three regions (Fig. 4)defined by two parameters and , and by applying ineach region a different method to estimate .
In the high-frequencyregion 1 the rebinned data are es-timated using Fourier rebinning. For each value of, (28)provides an independent estimate of . In theabsence of noise all these estimates are equal, up to theaccuracy of the Fourier rebinning approximation. However,with noisy data the SNR is increased by taking the average ofall estimates. Thus, the rebinned 2-D data are calculated as
or
(37)
where is determined by the requirement that the obliquesinogram ( ) be measured
(38)
where is the radius of the detector ring and is thelargest ring difference included in the reconstruction (the max-imum possible value of is ). Only positive valuesof appear in (37) because the sinograms with negativehavebeen merged when calculating the 2-D Fourier transform (6).
In the second high-frequencyregion 2 the consistencycondition (32) is not satisfied and hence
or
(39)
Finally, in the low-frequencyregion 3, Fourier rebinning isnot applicable. Therefore, in this region, the rebinned data areestimated using only the oblique sinograms with a small valueof . Owing to the small value of the axial shift canbe neglected as in the SSRB approximation, and hence thefollowing estimate is used:
and (40)
where . The parametermust be small enough to minimize systematic errors due tothe use of the SSRB approximation. Typically, one selects thesame as the one which defines the data subset used toestimate the truncated data in the 3DRP algorithm.
The algorithm defined by (37)–(40) depends on three param-eters , and , which must be chosen so as to ensurea good compromise between the systematic error (accuracy)and the statistical error (noise) in the reconstructions. Thepossibility to find a set of parameters allowing an image qualitycomparable to that obtained with the 3DRP algorithm dependson the two following observations, based on a large numberof simulations.
1) Although the Fourier rebinning approximation is inprinciple an asymptotic relation, valid only at highfrequencies, it turns out to be surprisingly accurate evenat very low frequencies for the PET scanner geometriesconsidered in Section V.
2) The fact that the low-frequency components in region3 are calculated using a small subset of the availabledata ( ) has little influence on the SNR becausenoise in a tomographic reconstruction arises mainly fromhigh-frequency amplification by the ramp filter.
Small values of and may therefore be chosen.Thus, with scanners such as the ECAT EXACT HR, goodreconstructions have been obtained by taking and
where is the frequency sampling. However,there has been no systematic optimization of the parameters
DEFRISEet al.: EXACT AND APPROXIMATE REBINNING ALGORITHMS FOR 3-D PET DATA 153
, and , and more generally, of the partitioningof the ( ) plane.
The rest of this section gives details on the implementationof FORE.
B. Organization of the 3-D Data
The FORE algorithm requires the 3-D data, (3), to beorganized as a set of oblique sinograms, each of which ischaracterized by a pair ( ). The algorithm processes eachsinogram independently of the other, and its implementationis therefore independent of the way in which the variables
and are sampled. We describe in the rest of this sectionthe particular sampling schemes used by the ECAT scannersdescribed in Section V.
Consider a -ring scanner3 with a spacingbetween adjacent rings. This scanner collects one obliquesinogram for each pair of rings ( ), where the ring indexesand run between zero and . This generates the followingsampling of and :
where
where
(41)
where is the axial angular sampling andis the axial coordinate of the center of the first ring. The
parameter determines the maximum value of in theacquired data. Equation (41) represents the standard samplingscheme on the first generation of volume scanners. To gainboth memory and reconstruction speed, the scanners used inthis study acquire 3-D data with a reduced axial sampling.The rationale is that, for many PET studies where is notlarge, the axial angular sampling is finer than required tosatisfy Shannon’s sampling condition. Therefore, the followingsinogram sampling is used:
(42)
where is an integer parameter called thespan, and. Each discrete sample ( ) is
obtained by summing the range of LOR’s aboutdefined bywhere is defined in (41). The number
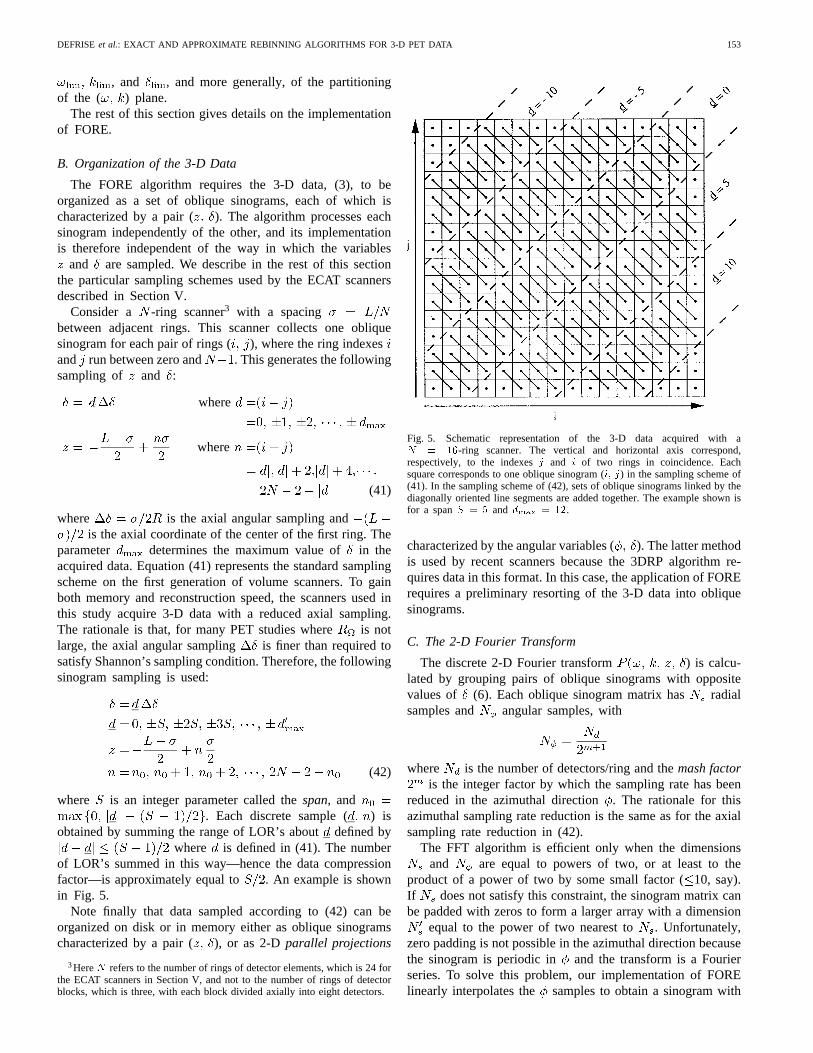
of LOR’s summed in this way—hence the data compressionfactor—is approximately equal to . An example is shownin Fig. 5.
Note finally that data sampled according to (42) can beorganized on disk or in memory either as oblique sinogramscharacterized by a pair ( ), or as 2-Dparallel projections
3HereN refers to the number of rings of detector elements, which is 24 forthe ECAT scanners in Section V, and not to the number of rings of detectorblocks, which is three, with each block divided axially into eight detectors.
Fig. 5. Schematic representation of the 3-D data acquired with aN = 16-ring scanner. The vertical and horizontal axis correspond,respectively, to the indexesj and i of two rings in coincidence. Eachsquare corresponds to one oblique sinogram (i; j) in the sampling scheme of(41). In the sampling scheme of (42), sets of oblique sinograms linked by thediagonally oriented line segments are added together. The example shown isfor a spanS = 5 and dmax = 12.
characterized by the angular variables (). The latter methodis used by recent scanners because the 3DRP algorithm re-quires data in this format. In this case, the application of FORErequires a preliminary resorting of the 3-D data into obliquesinograms.
C. The 2-D Fourier Transform
The discrete 2-D Fourier transform ) is calcu-lated by grouping pairs of oblique sinograms with oppositevalues of (6). Each oblique sinogram matrix has radialsamples and angular samples, with
where is the number of detectors/ring and themash factoris the integer factor by which the sampling rate has been
reduced in the azimuthal direction. The rationale for thisazimuthal sampling rate reduction is the same as for the axialsampling rate reduction in (42).
The FFT algorithm is efficient only when the dimensionsand are equal to powers of two, or at least to the
product of a power of two by some small factor (10, say).If does not satisfy this constraint, the sinogram matrix canbe padded with zeros to form a larger array with a dimension
equal to the power of two nearest to . Unfortunately,zero padding is not possible in the azimuthal direction becausethe sinogram is periodic in and the transform is a Fourierseries. To solve this problem, our implementation of FORElinearly interpolates the samples to obtain a sinogram with
154 IEEE TRANSACTIONS ON MEDICAL IMAGING, VOL. 16, NO. 2, APRIL 1997
a dimension equal to the nearest power of two larger than. The rebinned sinograms are then built with the same
number of samples .
D. The Algorithm
Discretizing the integral in (37) using a standard quadra-ture would not allow each oblique sinogram to be processedindependently. Therefore, the implementation of FORE fol-lows the data driven approach described below. For simplicitywe have kept the same names for the discretized variables, andthe sampling of , , , and is implicit in all expressions.
Algorithm 2—FORE:
1) Initialize a stack of rebinned 2-D Fourier transformedsinograms .
2) Consider sequentially each pair of oblique sinograms( ) and ( ):
a) if needed, pad in and interpolate in to getappropriate dimensions and ;
b) using (6), calculate the 2-D FFT with respect toand to get );
c) for each sample ( ) in region 1 (or )
calculate (one easily checks that) use linear interpolation to increment the
two closest sampled slices :add toadd to ;
d) if , consider each sample ( ) in region 3( and )
add to .
3) Normalize the rebinned data to take into account thevariable number of contributions to each sample .The normalization factors are determined by applyingprocedure 2c)–2d) to unit data .
4) Take the inverse 2-D FFT of to obtain thestack of rebinned sinograms
5) Reconstruct each slice withany 2-D reconstruction al-gorithm.
This algorithm can be viewed as factoring 3-D backpro-jection into a 1-D axial backprojection [Step 2c)] and a 2-Dtransaxial backprojection [Step 5)], with intermediate dataconsisting of the rebinned sinograms . Contrary toa real 2-D data set, these intermediate data are not distributedas independent Poisson variables, although their statisticalproperties (covariance matrix) could in principle be calculatedusing the normalization factors in Step 3). In Section V the2-D rebinned data are reconstructed using 2-D FBP withan optional axial smoothing. For low count rate studies,however, Step 5) could also be implemented using iterativemethods such as, for example, the ordered subsets expectation-maximization (OSEM) algorithm [41].
V. ILLUSTRATIVE EXAMPLES
In this section, we report on two areas where the FOREalgorithm is expected to provide the most significant speedadvantage compared to the 3DRP algorithm, even when using
the array processors now standard on most commercial PETscanners. The two application areas are high resolution dy-namic brain imaging, where multiple time frames (typically 10to 25) are used to follow the time course of neuroligands, andwhole-body oncology imaging, where multiple bed positions(typically 4–10) are used to image extensive regions of thebody. We also investigate the applicability of FORE to futuregenerations of volume-imaging PET scanners with large axialapertures. For all studies with measured data, we used thesampling scheme defined by (42). After normalization andcorrection for attenuation and scatter (using standard ECATsoftware) the data were reconstructed using either the 3DRPmethod, or first rebinned with FORE and then reconstructedwith the standard 2-D FBP algorithm. It should be noted thatthe goal of these studies was to investigate the equivalenceof images reconstructed by 3DRP and 2-D FBP after FORErebinning.
To reconstruct images with the 3DRP algorithm, a parallelimplementation for an array of i860 processors was used,while for the images reconstructed with FORE, a nonoptimizedimplementation for SUN Sparc stations was used.
A. High-Resolution Brain Imaging
To illustrate the FORE algorithm we performed two studieson an ECAT EXACT HR scanner [8], which is well-suitedfor high-resolution dynamic brain imaging. The EXACT HRis a 24-ring scanner with a diameter of 82 cm and an axialFOV of 15 cm. Each ring has 784 detectors providing a radialsinogram sampling 1.65 mm, and the ring spacing is
6.25 mm.For the first study a line source (length 25 cm, in-
ternal diameter 1 mm) containing a small amount ofFfluorodeoxyglucose (FDG) was placed, in air, in a
central transaxial section, and positioned radially throughthe axis of the scanner with one extremity at 20 cm fromthis axis. Data were acquired with a span and
, corresponding to a maximum value of the angle. The raw sinograms were
acquired with and . For the FOREreconstruction, the sinogram was interpolated in the azimuthaldirection as explained in Section IV-C, to obtain a sinogramwith and . The reconstructions weredone without apodizing in the axial or transverse directionsand with a pixel size of 1 mm. The full-width half-maximum(FWHM) was determined at 1-mm intervals along the line byfitting a Gaussian function to the tangential and axial profilesthrough the reconstructed line source.
For the second study, we extracted the last 10-min frameof a 60-min dynamic FDG brain scan (where 10.1 mCiwere injected), acquired with a span and .This frame contained about 127 million coincidences. Thesinograms were acquired with and ,and were corrected for scatter and for attenuation (usingmeasured transmission data). For the FORE reconstruction,the sinograms were interpolated in the azimuthal direction to
. Data were reconstructed with 2-mm pixels, usinga Hamming window with a cutoff at 0.24 mm, both in thetransaxial and axial directions.
DEFRISEet al.: EXACT AND APPROXIMATE REBINNING ALGORITHMS FOR 3-D PET DATA 155
B. Whole-Body Imaging
To evaluate the FORE algorithm for use with whole-bodyimaging, we performed a study on an ECAT ART scanner,which is designed for cost-effective clinical imaging. TheART scanner consists of two rotating banks of detectors, andis geometrically equivalent to the ECAT EXACT, a 24-ringscanner with 384 detectors/ring . The ring spacing is6.75 mm and the radial sinogram sampling 3.375 mm.Data are acquired with the standard sampling scheme definedby (42), with and . This corresponds to
.Using the ART scanner we measured a torso phantom
containing lung (air) and spine (teflon) inserts, and threepairs of hot and cold spheres having volumes of 5 cm,2.5 cm , and 1.25 cm. The main chamber of the phantomcontained 0.8 mCi of FDG, and the activity in the hotsphere inserts was a factor of 3.5 larger than the activityin the main chamber. There were 74 million coincidences(including scatter) collected during a 30 min acquisition. Thedata were corrected for attenuation and scatter using a 60-mintransmission scan.
C. Large Aperture Scanners
The FORE method is potentially less accurate at largermaximum ring differences, as indicated by (31). Since severalvolume PET cameras with axial FOV’s of 24 cm or greaterhave been recently developed [10], we used simulation studiesto test the applicability of FORE to scanners with large axialapertures.
We simulated a 32-ring scanner with a diameter of 49 cmand an axial FOV of 20 cm, with the sampling scheme definedby (41), with 3.0 mm, 6.25 mm, , and
. Reconstructions were done with a maximum ringdifference , which corresponds to an aperture of18 .
Data were simulated for a line source defined as a cylinderof length 380 mm and diameter 3.6 mm, positioned with itsaxis oriented radially in the central transaxial section, andreconstructed without apodizing in the axial or transversedirections and with a pixel size of 1 mm. The effects ofattenuation and scatter were not included in the simulationas the goal of these studies was to determine the equivalenceof images reconstructed by 3DRP and 2-D FBP after FORErebinning.
To study noise properties, data were also simulated fora uniform cylinder (diameter 20 cm) extending throughoutthe axial FOV. Noise free data were first calculated as lineintegrals of the distribution, and Poisson noise was then added,corresponding to a total of 100 million coincidences.
VI. RESULTS
A. High-Resolution Brain Imaging
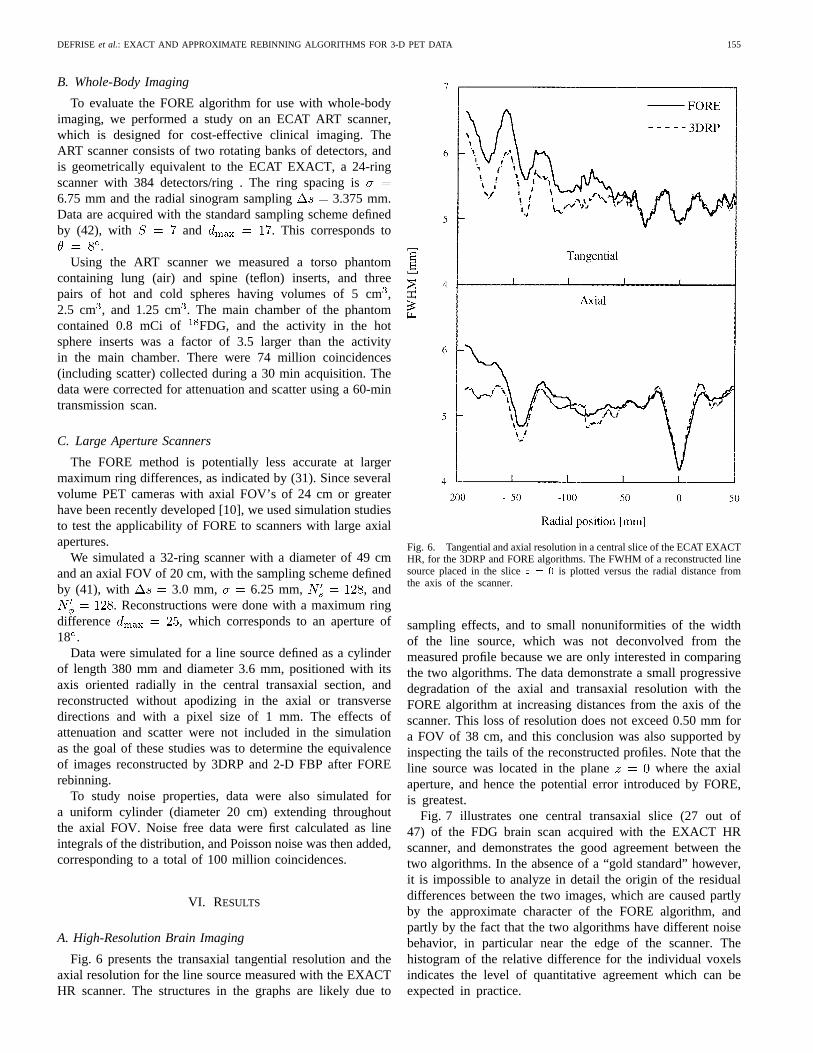
Fig. 6 presents the transaxial tangential resolution and theaxial resolution for the line source measured with the EXACTHR scanner. The structures in the graphs are likely due to
Fig. 6. Tangential and axial resolution in a central slice of the ECAT EXACTHR, for the 3DRP and FORE algorithms. The FWHM of a reconstructed linesource placed in the slicez = 0 is plotted versus the radial distance fromthe axis of the scanner.
sampling effects, and to small nonuniformities of the widthof the line source, which was not deconvolved from themeasured profile because we are only interested in comparingthe two algorithms. The data demonstrate a small progressivedegradation of the axial and transaxial resolution with theFORE algorithm at increasing distances from the axis of thescanner. This loss of resolution does not exceed 0.50 mm fora FOV of 38 cm, and this conclusion was also supported byinspecting the tails of the reconstructed profiles. Note that theline source was located in the plane where the axialaperture, and hence the potential error introduced by FORE,is greatest.
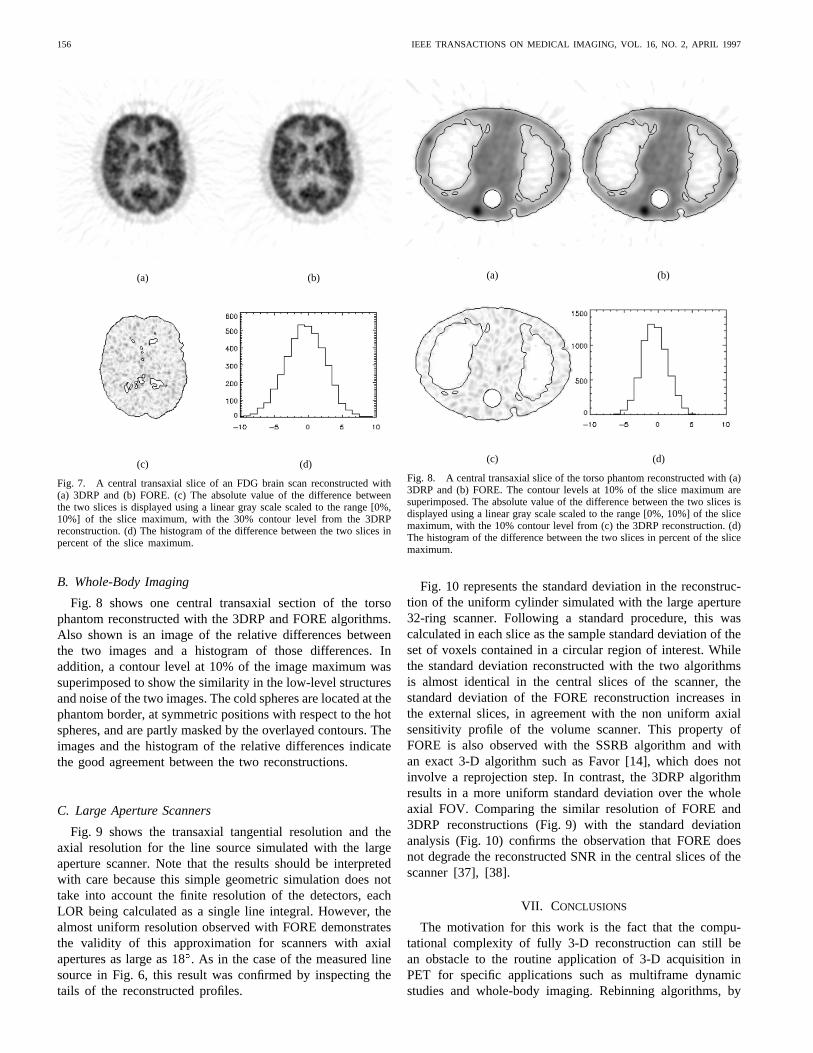
Fig. 7 illustrates one central transaxial slice (27 out of47) of the FDG brain scan acquired with the EXACT HRscanner, and demonstrates the good agreement between thetwo algorithms. In the absence of a “gold standard” however,it is impossible to analyze in detail the origin of the residualdifferences between the two images, which are caused partlyby the approximate character of the FORE algorithm, andpartly by the fact that the two algorithms have different noisebehavior, in particular near the edge of the scanner. Thehistogram of the relative difference for the individual voxelsindicates the level of quantitative agreement which can beexpected in practice.
156 IEEE TRANSACTIONS ON MEDICAL IMAGING, VOL. 16, NO. 2, APRIL 1997
(a) (b)
(c) (d)
Fig. 7. A central transaxial slice of an FDG brain scan reconstructed with(a) 3DRP and (b) FORE. (c) The absolute value of the difference betweenthe two slices is displayed using a linear gray scale scaled to the range [0%,10%] of the slice maximum, with the 30% contour level from the 3DRPreconstruction. (d) The histogram of the difference between the two slices inpercent of the slice maximum.
B. Whole-Body Imaging
Fig. 8 shows one central transaxial section of the torsophantom reconstructed with the 3DRP and FORE algorithms.Also shown is an image of the relative differences betweenthe two images and a histogram of those differences. Inaddition, a contour level at 10% of the image maximum wassuperimposed to show the similarity in the low-level structuresand noise of the two images. The cold spheres are located at thephantom border, at symmetric positions with respect to the hotspheres, and are partly masked by the overlayed contours. Theimages and the histogram of the relative differences indicatethe good agreement between the two reconstructions.
C. Large Aperture Scanners
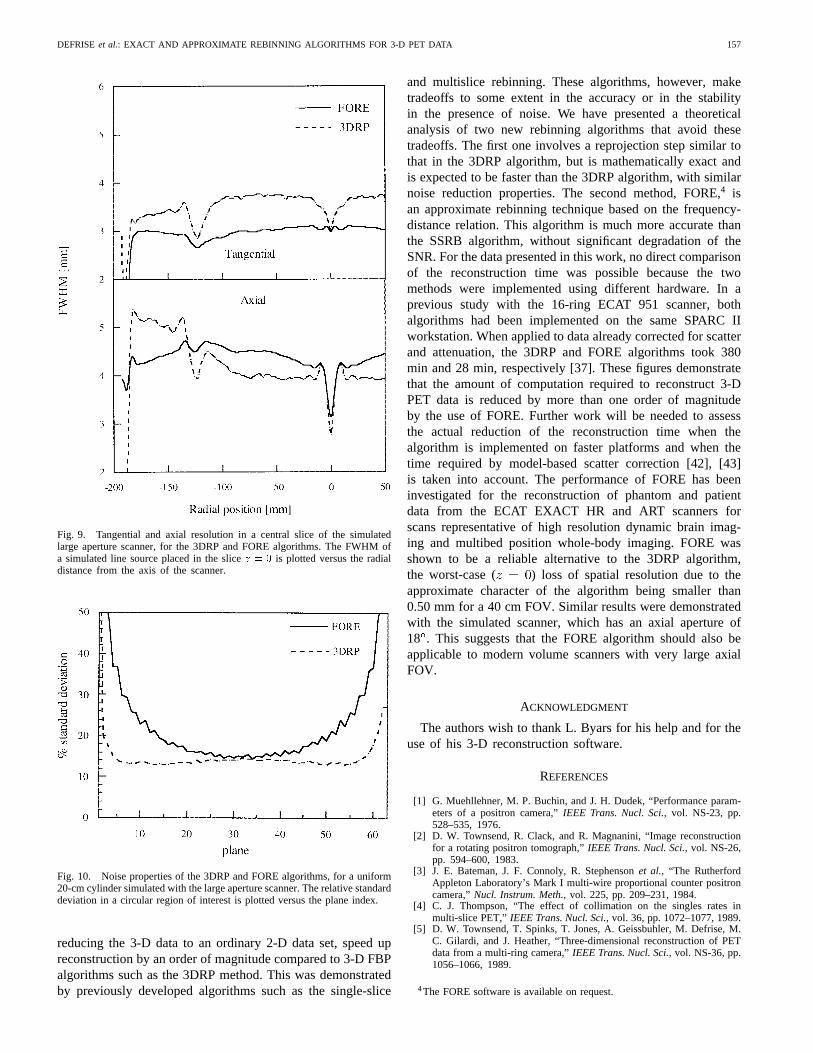
Fig. 9 shows the transaxial tangential resolution and theaxial resolution for the line source simulated with the largeaperture scanner. Note that the results should be interpretedwith care because this simple geometric simulation does nottake into account the finite resolution of the detectors, eachLOR being calculated as a single line integral. However, thealmost uniform resolution observed with FORE demonstratesthe validity of this approximation for scanners with axialapertures as large as 18. As in the case of the measured linesource in Fig. 6, this result was confirmed by inspecting thetails of the reconstructed profiles.
(a) (b)
(c) (d)
Fig. 8. A central transaxial slice of the torso phantom reconstructed with (a)3DRP and (b) FORE. The contour levels at 10% of the slice maximum aresuperimposed. The absolute value of the difference between the two slices isdisplayed using a linear gray scale scaled to the range [0%, 10%] of the slicemaximum, with the 10% contour level from (c) the 3DRP reconstruction. (d)The histogram of the difference between the two slices in percent of the slicemaximum.
Fig. 10 represents the standard deviation in the reconstruc-tion of the uniform cylinder simulated with the large aperture32-ring scanner. Following a standard procedure, this wascalculated in each slice as the sample standard deviation of theset of voxels contained in a circular region of interest. Whilethe standard deviation reconstructed with the two algorithmsis almost identical in the central slices of the scanner, thestandard deviation of the FORE reconstruction increases inthe external slices, in agreement with the non uniform axialsensitivity profile of the volume scanner. This property ofFORE is also observed with the SSRB algorithm and withan exact 3-D algorithm such as Favor [14], which does notinvolve a reprojection step. In contrast, the 3DRP algorithmresults in a more uniform standard deviation over the wholeaxial FOV. Comparing the similar resolution of FORE and3DRP reconstructions (Fig. 9) with the standard deviationanalysis (Fig. 10) confirms the observation that FORE doesnot degrade the reconstructed SNR in the central slices of thescanner [37], [38].
VII. CONCLUSIONS
The motivation for this work is the fact that the compu-tational complexity of fully 3-D reconstruction can still bean obstacle to the routine application of 3-D acquisition inPET for specific applications such as multiframe dynamicstudies and whole-body imaging. Rebinning algorithms, by
DEFRISEet al.: EXACT AND APPROXIMATE REBINNING ALGORITHMS FOR 3-D PET DATA 157
Fig. 9. Tangential and axial resolution in a central slice of the simulatedlarge aperture scanner, for the 3DRP and FORE algorithms. The FWHM ofa simulated line source placed in the slicez = 0 is plotted versus the radialdistance from the axis of the scanner.
Fig. 10. Noise properties of the 3DRP and FORE algorithms, for a uniform20-cm cylinder simulated with the large aperture scanner. The relative standarddeviation in a circular region of interest is plotted versus the plane index.
reducing the 3-D data to an ordinary 2-D data set, speed upreconstruction by an order of magnitude compared to 3-D FBPalgorithms such as the 3DRP method. This was demonstratedby previously developed algorithms such as the single-slice
and multislice rebinning. These algorithms, however, maketradeoffs to some extent in the accuracy or in the stabilityin the presence of noise. We have presented a theoreticalanalysis of two new rebinning algorithms that avoid thesetradeoffs. The first one involves a reprojection step similar tothat in the 3DRP algorithm, but is mathematically exact andis expected to be faster than the 3DRP algorithm, with similarnoise reduction properties. The second method, FORE,4 isan approximate rebinning technique based on the frequency-distance relation. This algorithm is much more accurate thanthe SSRB algorithm, without significant degradation of theSNR. For the data presented in this work, no direct comparisonof the reconstruction time was possible because the twomethods were implemented using different hardware. In aprevious study with the 16-ring ECAT 951 scanner, bothalgorithms had been implemented on the same SPARC IIworkstation. When applied to data already corrected for scatterand attenuation, the 3DRP and FORE algorithms took 380min and 28 min, respectively [37]. These figures demonstratethat the amount of computation required to reconstruct 3-DPET data is reduced by more than one order of magnitudeby the use of FORE. Further work will be needed to assessthe actual reduction of the reconstruction time when thealgorithm is implemented on faster platforms and when thetime required by model-based scatter correction [42], [43]is taken into account. The performance of FORE has beeninvestigated for the reconstruction of phantom and patientdata from the ECAT EXACT HR and ART scanners forscans representative of high resolution dynamic brain imag-ing and multibed position whole-body imaging. FORE wasshown to be a reliable alternative to the 3DRP algorithm,the worst-case ( ) loss of spatial resolution due to theapproximate character of the algorithm being smaller than0.50 mm for a 40 cm FOV. Similar results were demonstratedwith the simulated scanner, which has an axial aperture of18 . This suggests that the FORE algorithm should also beapplicable to modern volume scanners with very large axialFOV.
ACKNOWLEDGMENT
The authors wish to thank L. Byars for his help and for theuse of his 3-D reconstruction software.
REFERENCES
[1] G. Muehllehner, M. P. Buchin, and J. H. Dudek, “Performance param-eters of a positron camera,”IEEE Trans. Nucl. Sci.,vol. NS-23, pp.528–535, 1976.
[2] D. W. Townsend, R. Clack, and R. Magnanini, “Image reconstructionfor a rotating positron tomograph,”IEEE Trans. Nucl. Sci.,vol. NS-26,pp. 594–600, 1983.
[3] J. E. Bateman, J. F. Connoly, R. Stephensonet al., “The RutherfordAppleton Laboratory’s Mark I multi-wire proportional counter positroncamera,”Nucl. Instrum. Meth.,vol. 225, pp. 209–231, 1984.
[4] C. J. Thompson, “The effect of collimation on the singles rates inmulti-slice PET,”IEEE Trans. Nucl. Sci.,vol. 36, pp. 1072–1077, 1989.
[5] D. W. Townsend, T. Spinks, T. Jones, A. Geissbuhler, M. Defrise, M.C. Gilardi, and J. Heather, “Three-dimensional reconstruction of PETdata from a multi-ring camera,”IEEE Trans. Nucl. Sci.,vol. NS-36, pp.1056–1066, 1989.
4The FORE software is available on request.

158 IEEE TRANSACTIONS ON MEDICAL IMAGING, VOL. 16, NO. 2, APRIL 1997
[6] S. Cherry, M. Dahlbom, and E. J. Hoffman, “Three-dimensional PETusing a conventional multi-slice tomograph without septa,”J. Comput.Assist. Tomogr.,vol. 15, pp. 655–668, 1991.
[7] T. J. Spinks, T. Jones, D. L. Bailey, D. W. Townsend, S. Grootoonk,P. M. Bloomfield, M.-C. Gilardi, M. E. Casey, B. Sipe, and J. Reed,“Physical performance of a positron tomograph for brain imaging withretractable septa,”Phys. Med. Biol.,vol. 37, pp. 1637–1655, 1992.
[8] K. Wienhard, M. Dahlbom, L. Eriksson, C. Michel, T. Bruckbauer, U.Pietrzyk, and W.-D. Heiss, “The ECAT exact HR: Performance of anew high resolution positron scanner,”J. Comput. Assist. Tomogr.,vol.18, pp. 110–118, 1994.
[9] T. K. Lewellen, S. G. Kohlmyer, R. S. Miyaoka, S. Schubert, and C. W.Stearns, “Investigation of the count rate performance of General ElectricADVANCE positron emission tomograph,”IEEE Trans. Nucl. Sci.,vol.42, pp. 1051–1057, 1995.
[10] J. S. Karp, R. Freifelder, P. E. Kinahan, M. J. Geagan, G. Muehllehner,L. Shao, and R. M. Lewitt, “Evaluation of volume imaging with theHEAD PENN-PET scanner,” inProc. 1994 IEEE Med. Imag. Symp.,Norfolk, VA, 1995, pp. 1877–1881.
[11] P. E. Kinahan and J. G. Rogers, “Analytic three-dimensional imagereconstruction using all detected events,”IEEE Trans. Nucl. Sci.,vol.36, pp. 964–968, 1990.
[12] Z. H. Cho, J. B. Ra, and S. K. Hilal, “True three-dimensional recon-struction—Application of algorithm toward full utilization of obliquerays,” IEEE Trans. Med. Imag.,vol. MI-2, pp. 6–18, 1983.
[13] C. W. Stearns, D. A. Chesler, and G. L. Brownell, “Accelerated imagereconstruction for a cylindrical positron tomograph using Fourier domainmethods,”IEEE Trans. Nucl. Sci.,vol. 37, pp. 773–777, 1990.
[14] M. Defrise, D. W. Townsend, and R. Clack, “Favor: A fast reconstruc-tion algorithm for volume imaging in PET,” inConf. Rec. IEEE 1991Nucl. Sci. Symp.,Santa Fe, NM, 1992, pp. 1919–1923.
[15] M. W. Stazyk, J. G. Rogers, and R. Harrop, “Full data utilization inPVI using the 3-D Radon transform,”Phys. Med. Biol.,vol. 37, pp.689–704, 1992.
[16] P. S. Crandall and C. W. Stearns, “A scalable multiprocessor imple-mentation of the reprojection algorithm for volumetric PET imaging,”in Conf. Rec. IEEE 1995 Nucl. Sci. Symp.,San Francisco, CA, 1996,pp. 1184–1188.
[17] D. F. Newport, “A methodology for designing parallel/pipelined sys-tems,” Doctoral thesis, University of Tennessee, Knoxville, 1995.
[18] M. Egger, “Fast volume reconstruction in positron emission tomography:Implementation of four algorithms on a high-performance scalableparallel platform,” Ph.D. thesis, Univ. Lausanne, Switzerland, 1996.
[19] C. Wu, C. E. Ordonez, and C.-T. Chen, “FIPI: Fast 3-D PET recon-struction by Fourier inversion of rebinned plane integrals,” inThree-Dimensional Image Reconstruction in Radiology and Nuclear Medicine,P. Grangeat and J.-L. Amans, Eds. Dordrecht: Kluwer, 1996, pp.277–296.
[20] M. E. Daube-Witherspoon and G. Muehllehner, “Treatment of ax-ial data in three-dimensional PET,”J. Nucl. Med., vol. 28, pp.1717–1724, 1987.
[21] R. M. Lewitt, G. Muehllehner, and J. S. Karp, “Three-dimensional re-construction for PET by multi-slice rebinning and axial image filtering,”Phys. Med. Biol.,vol. 39, pp. 321–340, 1994.
[22] K. Erlandsson, P. D. Esser, S.-E. Strand, and R. L. van Heertum, “3-Dreconstruction for a multi-ring PET scanner by single-slice rebinningand axial deconvolution,”Phys. Med. Biol.,vol. 39, pp. 619–629, 1994.
[23] P. E. Kinahan and J. S. Karp, “Figures of merit for comparing recon-struction algorithms with a volume-imaging PET scanner,”Phys. Med.Biol., vol. 39, pp. 631–642, 1994.
[24] V. Sossi, M. W. Stazyk, P. E. Kinahan, and T. J. Ruth, “The performanceof the single-slice rebinning technique for imaging the human striatum asevaluated by phantom studies,”Phys. Med. Biol.,vol. 39, pp. 369–380,1994.
[25] L. Shao, R. M. Lewitt, J. S. Karp, and G. Muehllehner, “Combination ofWiener filtering and singular value decomposition filtering for volumeimaging PET,”IEEE Trans. Med. Imag.,vol. 42, pp. 1228–1234, 1995.
[26] M. Defrise, A. Geissbuhler, and D. W. Townsend, “A performance studyof 3-D reconstruction algorithms for PET,”Phys. Med. Biol.,vol. 39,pp. 321–340, 1994.
[27] P. E. Kinahan, “Image reconstruction algorithms for volume imagingPET scanners,” Ph.D. thesis, Univ. Pennsylvania, Philadelphia, PA,1994.
[28] M. Defrise, “A factorization method for the 3-D X-ray transform,”Inverse Problems,vol. 11, pp. 983–994, 1995.
[29] P. R. Edholm, R. M. Lewitt, and B. Lindholm, “Novel properties of theFourier decomposition of the sinogram,” inInt. Workshop Physics andEngineering of Computerized Multidimensional Imaging and Processing,Proc. SPIE,1986, vol. 671, pp. 8–18.
[30] S. J. Glick, B. C. Penney, M. A. King, and C. L. Byrne, “Noniterativecompensation for the distance-dependent detector response and photonattenuation in SPECT imaging,”IEEE Trans. Med. Imag.,vol. 13, pp.363–374, 1994.
[31] W. Xia, R. M. Lewitt, and P. Edholm, “Fourier correction for spatiallyvariant collimator blurring in SPECT,”IEEE Trans. Med. Imag.,vol.14, pp. 100–115, 1995.
[32] G. T. Herman, “Reconstruction algorithms,” inPositron Emission To-mography,M. Reivich and A. Alavi, Eds. New York: A. R. Liss.,1985.
[33] F. Natterer, The Mathematics of Computerized Tomography.NewYork: Wiley, 1986.
[34] M. Abramowitz and I. Stegun,Handbook of Mathematical Functions.New York: Dover, 1972.
[35] S. Bellini, M. Piacenti, C. Caffario, and F. Rocca, “Compensation oftissue absorption in emission tomography,”IEEE Trans. Acoust. SpeechSignal Processing,vol. ASSP-27, pp. 213–218, 1979.
[36] C. E. Metz and X. Pan, “A unified analysis of exact methods of invertingthe 2-D exponential radon transform, with implications for noise controlin SPECT,” IEEE Trans. Med. Imag.,vol. 14, pp. 643–658, 1995.
[37] M. Defrise, P. K. Kinahan, and D. W. Townsend, “A new rebinningalgorithm for 3-D PET: Principle, implementation and performance,” inProc. 1995 Int. Symp. 3-D Reconstruction,Aixles-Bains, France, 1995.
[38] M. Defrise, M. Sibomana, C. Michel, and D. Newport, “3-D PETreconstruction with the ECAT EXACT HR using Fourier rebinning,”in Conf. Rec. IEEE 1995 Nucl. Sci. Symp.,San Francisco, CA, 1996,pp. 1316–1320.
[39] J. S. Karp, G. Muehllehner, and R. M. Lewitt, “Constrained Fourierspace method for compensation of missing data in emission computedtomography,”IEEE Trans. Med. Imag.,vol. 7, pp. 21–25, 1988.
[40] G. H. Glover and D. C. Noll, “Consistent projection reconstructiontechniques for magnetic resonance imaging,”Magnetic Resonance inMedicine,vol. 29, pp. 345–351, 1993.
[41] H. M. Hudson and R. S. Larkin, “Accelerated image reconstructionusing ordered subsets of projection data,”IEEE Trans. Med. Imag.,vol.13, pp. 601–609, 1994.
[42] J. M. Ollinger, “Model-based scatter correction for fully 3-D PET,”Phys. Med. Biol.,vol. 41, pp. 153–176, 1996.
[43] C. C. Watson, D. Newport, and M. E. Casey, “A single scatter simulationtechnique for scatter correction in 3-D PET,” inThree-DimensionalImage Reconstruction in Radiology and Nuclear Medicine,P. Grangeatand J.-L. Amans, Eds. Dordrecht: Kluwer, 1996, pp. 255–268.