Evolving map matching with markov decision processes
21
Evolving map matching with markov decision processes Adrian Wöltche ∗ Institute of Information Systems at Hof University October 12, 2021 Abstract Map matching is about finding the best route of a given track in a road network. This can be useful for many statistical analyses on mobility. With increasing spread of modern cars and mobile devices many tracks are available to match. The difficulty in map matching lies in the geospatial differences between tracks and road networks. Current technologies resolve such differences with Hidden Markov Models and Viterbi algorithm. They majorly vary concerning the used metrics for the probabilities in the models. In this research we improve map matching technology by refining the underlying algorithms, models and metrics. We will introduce Markov Decision Processes with Value Iteration and Q-Learning to the map matching domain and we will compare them to Hidden Markov Models with Viterbi algorithm. Markov Decision Processes allow to use active decisions and rewards, which are not available in previous methods. Combined with improvements concerning the preparation of tracks and the road network, and various technologies for improved processing speed, we will show on a publicly available map matching data set that our approach has a higher overall performance compared to previous map matching technology. We will eventually discuss more possibilities we enable with our approach. Keywords — map matching, geospatial information science, markov decision process, hidden markov models 1 Introduction The world is full of devices (e.g., smartphones, GPS trackers, navigation systems, cars) that are able to track their geospatial positions. There are various reasons for this (e.g., navigation, way-tracking, geolocation). Albeit these devices record their geospatial location the real world location (the actual road network location) is often the main interest. For mapping the geospatial locations recorded as tracks to the underlying road network map matching can be applied. The difficulty here lies in finding the best matching road edges. One intricacy is the inaccuracy of positioning systems and maps. Sometimes maps are build from aerial imagery, personal knowledge, or GPX traces. Of course, such maps are not guaranteed to be accurate but they still can serve as the underlying road network for map matching. Most recorded tracks are created with the help of global satellite based geospatial positioning systems such as the Global Positioning System (GPS) 1 [54] , Galileo 2 [22], GLONASS 3 , or BeiDou 4 . Some geospatial positioning is also done with the help of regional systems such as the Indian IRNSS 5 , or the Japanese QZSS 6 . Sometimes Differential GPS is also used but most GPS tracks rely on smartphone sensors (e.g., Floating Car Data often comes from smartphone apps). Concerning smartphones, additional location sources and sensors, such as wireless hotspot locations, cell provider tower locations, and internal device sensors (i.e., orientation, acceleration sensors, and more) are used for improving accuracy of positioning [16]. The internal sensor positioning often becomes worse ∗ E-Mail: [email protected] 1 https://www.gps.gov/ 2 https://www.gsa.europa.eu/ 3 https://www.glonass-iac.ru/en/ 4 http://en.beidou.gov.cn/ 5 https://www.isro.gov.in/irnss-programme 6 https://qzss.go.jp/en/ 1
-
Upload
khangminh22 -
Category
Documents
-
view
1 -
download
0
Transcript of Evolving map matching with markov decision processes

Evolving map matching with markov decision processesAdrian Wöltche∗
Institute of Information Systems at Hof University
October 12, 2021
Abstract
Map matching is about finding the best route of a given track in a road network. This can beuseful for many statistical analyses on mobility. With increasing spread of modern cars and mobiledevices many tracks are available to match. The difficulty in map matching lies in the geospatialdifferences between tracks and road networks. Current technologies resolve such differences withHidden Markov Models and Viterbi algorithm. They majorly vary concerning the used metrics forthe probabilities in the models. In this research we improve map matching technology by refiningthe underlying algorithms, models and metrics. We will introduce Markov Decision Processes withValue Iteration and Q-Learning to the map matching domain and we will compare them to HiddenMarkov Models with Viterbi algorithm. Markov Decision Processes allow to use active decisions andrewards, which are not available in previous methods. Combined with improvements concerningthe preparation of tracks and the road network, and various technologies for improved processingspeed, we will show on a publicly available map matching data set that our approach has a higheroverall performance compared to previous map matching technology. We will eventually discuss morepossibilities we enable with our approach.
Keywords — map matching, geospatial information science, markov decision process, hidden markovmodels
1 IntroductionThe world is full of devices (e.g., smartphones, GPS trackers, navigation systems, cars) that are ableto track their geospatial positions. There are various reasons for this (e.g., navigation, way-tracking,geolocation). Albeit these devices record their geospatial location the real world location (the actual roadnetwork location) is often the main interest.
For mapping the geospatial locations recorded as tracks to the underlying road network map matchingcan be applied. The difficulty here lies in finding the best matching road edges. One intricacy is theinaccuracy of positioning systems and maps. Sometimes maps are build from aerial imagery, personalknowledge, or GPX traces. Of course, such maps are not guaranteed to be accurate but they still canserve as the underlying road network for map matching.
Most recorded tracks are created with the help of global satellite based geospatial positioning systemssuch as the Global Positioning System (GPS)1 [54] , Galileo2 [22], GLONASS3, or BeiDou4. Somegeospatial positioning is also done with the help of regional systems such as the Indian IRNSS5, or theJapanese QZSS6. Sometimes Differential GPS is also used but most GPS tracks rely on smartphonesensors (e.g., Floating Car Data often comes from smartphone apps).
Concerning smartphones, additional location sources and sensors, such as wireless hotspot locations,cell provider tower locations, and internal device sensors (i.e., orientation, acceleration sensors, and more)are used for improving accuracy of positioning [16]. The internal sensor positioning often becomes worse
∗E-Mail: [email protected]://www.gps.gov/2https://www.gsa.europa.eu/3https://www.glonass-iac.ru/en/4http://en.beidou.gov.cn/5https://www.isro.gov.in/irnss-programme6https://qzss.go.jp/en/
1

the longer no external ground truth sensor data is available. Relying on internal sensor positioning iscalled dead reckoning [10] and often it is combined with external positioning systems for minimizing theworst-case effects of both [e.g., 1, 62]. In case of smartphones the sampling interval also plays a role inthe record accuracy [83] because the optimization of battery usage in todays mobile operating systemsoften reduces the sampling frequency.
The range we are confronted with measured positions in tracks is from several meters (e.g., GPS,Galileo) up to kilometers (e.g., cell provider station tracking, see [39]). There is technology to improve thegeolocation error alone (e.g., Kalman filters, see [13], actor-critic algorithms, see [86]) but the differencesbetween roads and tracks remains, which is why map matching technology is needed.
1.1 Map matchingThe key idea of map matching is that a measured track lies within the underlying road network. Ofcourse the assumption is that the map is correct, which is not guaranteed. This is why exceptions to thisassumption are made in map generation algorithms. In this case we can distinguish between algorithmsthat are based on individual tracks [e.g., 56, 12, 69, 52], often combined with regular map matchingand others relying on statistical aggregation of many tracks, i.e., from Floating Car Data (FCD) [e.g.,43, 68, 67, 88, 90]. These algorithms introduce new roads in case the underlying road network has nosufficient matching solution to the given tracks. As it is not possible to verify whether the road networkis in fact sufficient or not, even fully integrated road networks are altered by such algorithms [see 12].This makes it difficult to blindly trust map generation algorithms though they are currently the onlyknown way to find good matches when the road network is wrong.
Regular map matching that is trusting the correctness of the map can be divided into online andoffline map matching. Online map matching occurs while the record of a track is still running (e.g., slidingwindow from [27, 44, 66]). With using the latest history of recorded positions, this can be used for livenavigation or tracking.
Offline map matching is the extension so that the entire record is used. In comparison to live navigationthere is no goal that is approximated by the best route towards it [see 28, 51]. Instead the first and lastpoint of the track mark the source and destination. Moreover, not only driven tracks but also walked [7],wheelchaired [60], bicycled [61], swum [6], or flown [17] tracks are matched sometimes. This depends onthe tuning of the probabilities and the road network excerpt being used.
The key aspect in optimizing map matching is the definition of ‘typical road behavior’. The more itreflects the reality the more realistic and probable the matched routes fit to the given tracks [74].
1.2 Current stateCurrent offline map matching technologies that are state-of-the-art are e.g., Barefoot7 [47], Fast mapmatching8 [79], Map Matching based on GraphHopper9, Open Source Routing Machine10, Valhalla11,and pgMatch12 [50].
Common in all these established projects is that they are derived from Hidden Markov Models (HMMs)solved with Viterbi algorithm [25] as described in [53], which itself relies on previous work in [35] and[33]. There are sometimes additional map matching algorithms available in these tools. For example in‘Fast map matching’ [79] the ST-Match [46] algorithm also exists. Nevertheless, most established toolsprimarily or solely rely on HMMs and Viterbi algorithm based on [53]. Therefore, we will compare ourapproach at least with HMMs and Viterbi algorithms as they mark the state-of-the-art in map matching.
Current research in the field of map matching merges from two complementary main views of theproblem. One view is about optimizing processing speed [e.g., 49, 46, 70, 5, 85, 79, 24, 26], the other oneis about optimizing accuracy of the output of map matching algorithms [e.g., 33, 35, 57, 53, 30, 74, 81,82, 7, 48, 40, 15, 31]. More accurate results are usually enabled by using technologies with a higher timecomplexity. Often, this goes hand-in-hand with technologies for improving the processing speed so thatthe incremented complexity has less impact on the processing time.
Some processing speed optimizations use caching mechanisms and partial route precomputation [79],others filter unnecessary input data [e.g., 35, 53]. Different ideas, such as ST-Match [46], use less complex
7https://github.com/bmwcarit/barefoot8https://github.com/cyang-kth/fmm9https://github.com/graphhopper/map-matching
10https://github.com/Project-OSRM/osrm-backend11https://github.com/valhalla/valhalla12https://github.com/amillb/pgMapMatch
2

models for reducing time complexity. Such models are sometimes again improved, for example, in [84] anInteractive-Voting Based Map Matching Algorithm (IVMM) is introduced for improving over ST-Match.Additionally, there are ideas for using parallelization and distribution with cluster computing [e.g., 85, 26]or Graphical Processing Units [GPUs, see 5].
Accuracy improvement mainly depends on the used algorithms and metrics. Early research workedon simple geometric point-to-curve and curve-to-curve matching [e.g., 9, 76]. More recent work usedDiscrete Fréchet Distance [21] and Free Space Diagrams [3] for fast, up to subquadratic time [2] geometriccurve-to-curve matching [11].
Recent research however majorly relies on global max-weight optimization [see 46, 74]. Such statisticalapproaches can easily deal with outliers by assigning low probabilities to them [53]. Still, hybrid approaches[74] are able to improve further the ‘weight function’ metrics over solely statistical ones [75].
A recurring conclusion of map matching literature is the lack of accuracy in map matching algorithms,e.g., finding the correct road position especially in complex road scenarios. This was concluded forexample in [59] which is an older survey literature before HMMs with their higher matching accuracybecame common with [53]. Even today after many more advances in matching accuracy, recent mapmatching surveys [e.g., 14, 32] still state that map matching performance needs to further improve,concerning e.g., unnecessary detours, matching uncertainty, matching breaks, geometric and topologicalprinciples, candidate search based on current vehicle situation, and distributed computing. We see thatboth processing speed as well as accuracy improvement are still of huge interest in current and futureresearch.
An interesting research direction to HMMs was introduced by [78] based on [45] by empoweringConditional Random Fields (CRFs) for map matching. The idea for using CRFs instead of HMMscomes from [38] which describes the so-called ‘label bias’ as being a statistical drawback when per-statenormalization is used in non-generative models (i.e., when conditional probabilities instead of jointprobabilities are used). The authors show that the ‘label bias’ happens in Maximum-Entropy MarkovModels (MEMMs) but clarify that HMMs are not affected because they are generative models with jointprobabilities (which is also confirmed in [18] and [29]). Also CRFs don’t suffer from ‘label bias’ and intheir comparison of CRFs with MEMMs and HMMs, the authors show that CRFs have a significantlyhigher accuracy but are affected by a huge processing speed impact compared to HMMs. This researchdirection seems to have no further current works in it.
One promising research direction left is using reinforcement learning algorithms for map matching. In[89] Inverse Reinforcement Learning (IRL) is used on a Markov Decision Process (MDP) that is modeledafter the nodes and edges of the road network with recorded tracks of taxis for learning and predictingroute recommendations. This approach is further refined in [63]. Inverse Reinforcement Learning usesexpert demonstrations for learning the reward function. This allows the reinforcement learning agent tofind optimal policies on similar but new input data. In [23], Markov Decision Processes are combined withmulti-agent MDPs for predicting airplane trajectories and demand-capacity balancing. Reinforcementlearning can also be used with Actor Critic models as in [86] for reducing the noise on raw GPS tracks.With such sanitized tracks existing map matching technologies can produce more accurate results.
Finally, in [64], History Markov Decision Processes with Q-Learning are used for low-sample mapmatching. Here the authors first use filtered (outliers removed) high-sample taxi tracks with a time step of30 s with the incremental map matching algorithm from [11] to generate a label database (history tracks).The high-sample tracks are then thinned out to low-sample tracks with time steps of 1 min, 2 min, 4 min,and 16 min. The authors create a MDP with the state being a candidate position of a GPS measurementand the action being the selection of the next candidate position. The reward is calculated as weightedsum of the percentage of available history tracks between both candidate points (or else the shortestpath if no history tracks were found) from all history tracks and the weighted distance between GPSmeasurement and candidate of the current state. The weights were computed by trying out all valuesfrom 0.1, 0.2, . . . , 0.9. The low-sample tracks are matched by applying Q-Learning on the constructedMDP. Finally the results of the low-sample reinforcement learning match are compared with the resultsof the filtered high-sample incremental match. This comparison is further compared with IVMM from[84]. A major flaw we see in this approach is that the authors take the results from an incrementalmatching algorithm as ground truth data for training the reinforcement learning algorithm. This way, itis impossible for the reinforcement learning algorithm to improve over what the incremental algorithmmatched.
Still, with the availability of huge amounts of FCD without ground truth routes, reinforcement learningis a very promising technology because reinforcement learning intrinsically has the ability to learn fromits own experience instead of labels computed from preceded algorithms. Nevertheless, the reviewed
3

research of route predictions with IRL and MDPs that are based on the results of expert demonstrationsor incremental methods is a great way to enhance advanced map matching algorithm results as long assuch labels are available or can be generated truthfully.
Our new approach with MDPs and reinforcement learning will be able to find solutions with noexisting ground truth data available. We will introduce an evolved MDP that gives a learning agentthe possibility to learn an optimal policy without any prior knowledge, similar to the map matchingtechnologies that work on HMMs.
1.3 ApproachAs [74] demonstrates the superiority of hybrid global max-weight approaches we adhere to this idea. Weimplement Markov Decision Processes [MDPs, see 8] for replacing Hidden Markov Models to enablean active action selection during the map matching process. This combines the advantages of iterativepoint-to-curve, and global max-weight algorithms for improving overall performance. Still it extends thetuning possibilities for action selection, state and reward function design. The mixed rewards in MDPsfurthermore facilitate the ‘weight function design’, which has a major impact on map matching accuracy[75]. Furthermore, we expand the usage of reinforcement learning algorithms on map matching, whichenables more potential to improve poor accuracy map matching results with reusing previously learnedknowledge. We want our algorithms to learn and apply what we call ‘typical road behavior’. This behavioris intrinsically contained in FCD but not directly applicable without the further statistical analysis thatlearning algorithms permit. For this research we will stick to a complex, parametrable reward functiondefining our current understanding of ‘typical road behavior’. Further research may fine tune the weightsof the parameters and implement more conditions for improved resemblance to ‘typical road behavior’.
data
import
geography
MDP
matching
road network
graph spatial index track
floating car data
routing candidate search
action environment reward
reinforcement learning policy
matching result
Figure 1: Technology Roadmap for our Q-Learning map matching approach. First we import the data ofthe road network and floating car data we want to process. We build a bidirectional graph from the roadnetwork and generate a spatial index (R-Tree) on top of the edges of the graph. When we want to find amatch for a selected track, our reinforcement learning algorithm first initializes the environment of theMarkov Decision Process (MDP). This executes a candidate search of the selected track with the help ofthe spatial index. The reinforcement learning algorithm is then able to send actions to the environment.An action selects a next position from a current one. For each action a route (shortest path) is searchedwithin the graph of the road network. The found route is then evaluated with the current action and thereward is given back to the reinforcement learning algorithm. After an optimal policy has been found thematching result for the selected track can be computed and returned.
For our evolved MDP for the reinforcement learning algorithms we will compare Value Iteration[55, 65] with Q-Learning [72, 65]. We will also compare with HMMs and Viterbi algorithm that weimplemented with similar metrics to our MDP. We will see that Value Iteration and Viterbi algorithmare able to find theoretical optimal policies and that Q-Learning is still able to find good, up to optimal[73], policies. We will additionally compare our results with the Fast map matching [79] algorithm whichis based on HMMs and Viterbi algorithm. Moreover, the Fast map matching open source tool13 alsocontains the less complex map matching model ST-Match [46] for large area networks, which makes itinteresting to compare to this model as well.
13https://github.com/cyang-kth/fmm
4

2 ModelOur evolved model is based on Markov Decision Processes [MDPs, see 8] which relies on Markov chainsthe same way Hidden Markov Models (HMMs) do. The differences are that in HMMs observation andtransition probabilities are jointly calculated, whereas in MDPs rewards are given for taking actions instates. Another difference is that HMMs are only partially observable, whereas MDPs are fully controllableby the agent.
When calculating the probabilities or rewards existing data from the recorded track and given roadnetwork can be used. There are for example distances and routes [53], bearings [58], trajectories [40], andvelocity and timings [46] that can be computed. Typically, routes in the road network are calculated withDijkstra’s shortest path algorithm [19]. From the computed metrics either the probabilities for HMMsare computed or the rewards for the selected actions in a MDP are returned.
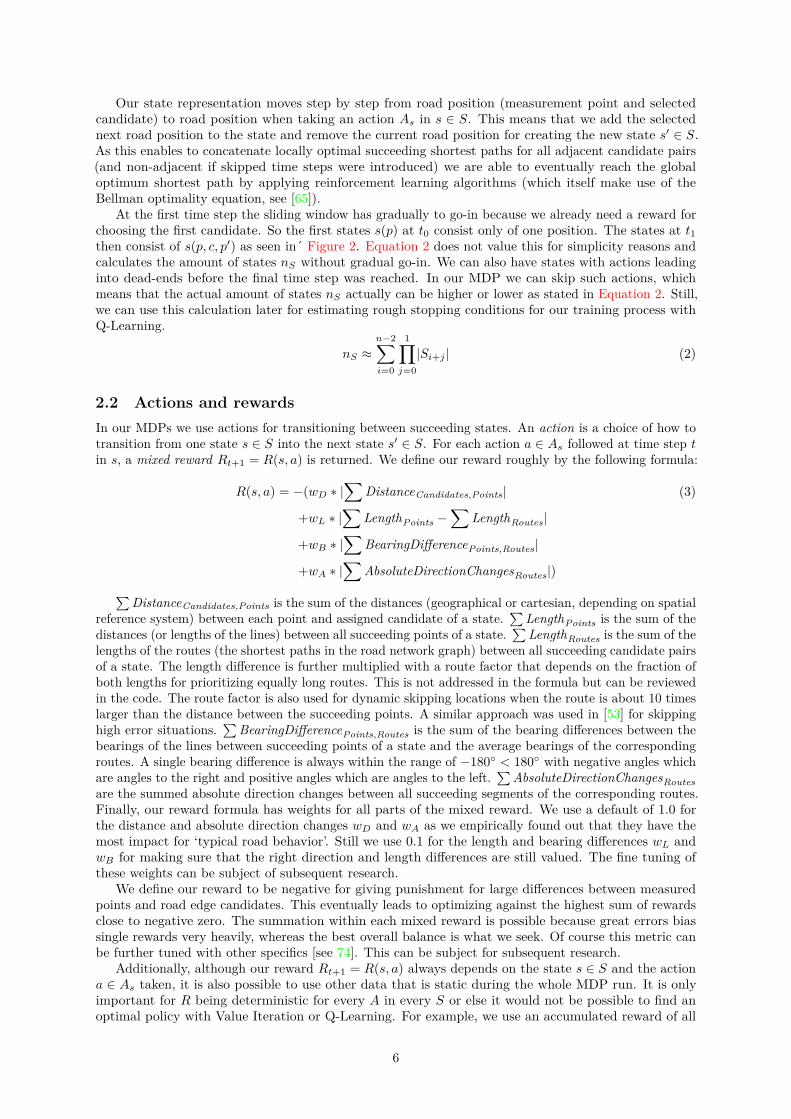
2.1 Markov decision processesThe idea for the Markov Decision Process (MDP) we use in this research is deduced from the waynavigation happens. A navigator selects, depending on its current state, a next road to transition to foreventually reaching its goal with the lowest effort. Our MDP is designed specifically after this approach,as seen in Figure 2.
c00
c01
c11
c02
c03
c13
c04
c14
c05
p0 p1 p2 p3 p4 p5
t0 t1 t2 t3 t4 t5
t0 t1 t2 t3 t4 t5
Figure 2: Markov Decision Process for map matching. Here we present in red a possible state s(p, c, p′) ∈ Swith current measured point p = Pn with p ∈ P , current candidate c = Cm
n with c ∈ C, and next measuredpoint p′ = Pn+1 with p′ ∈ P . We also present in green the possible actions As that allow to choose thenext candidate c′ = Cm′
n+1 with c′ ∈ C. So a state s is composed of the current road position (givenby p and c) in time step t ∈ T and the next measurement p′ in time step t + 1 ∈ T . With this state aroad connection to position c′ can be found by choosing an a ∈ As. With this state representation thereward (violet lines plus chosen green action) can be computed from the distances dc,p = |c − p| and d′
c′,p′
between the points p, p′ and corresponding candidates c, c′, the distance (and other metrics e.g., bearing,vehicle speed, timings) between the points dp,p′ , and the length of the route rc,c′ = shortest_path(c, c′)between the candidates dr = |r|. This representation is not necessarily bound to the t ∈ T being adjacent.It is also possible to skip certain t ∈ T so that a state s ∈ S with As is composed from the measurementpoints and candidates of non-adjacent t ∈ T , for example t2 and t5.
Concerning the complexity of this model we can compute the amount of possible end-to-end sequenceswith Equation 1. This shows that the number of possible routes may grow exponentially with the numberof points. As such, we use track sanitation and network simplification algorithms for reducing the amountof candidates by removing unnecessary information.
nseq =t−1∏i=0
|Cti| (1)
5
Our state representation moves step by step from road position (measurement point and selectedcandidate) to road position when taking an action As in s ∈ S. This means that we add the selectednext road position to the state and remove the current road position for creating the new state s′ ∈ S.As this enables to concatenate locally optimal succeeding shortest paths for all adjacent candidate pairs(and non-adjacent if skipped time steps were introduced) we are able to eventually reach the globaloptimum shortest path by applying reinforcement learning algorithms (which itself make use of theBellman optimality equation, see [65]).
At the first time step the sliding window has gradually to go-in because we already need a reward forchoosing the first candidate. So the first states s(p) at t0 consist only of one position. The states at t1then consist of s(p, c, p′) as seen in´ Figure 2. Equation 2 does not value this for simplicity reasons andcalculates the amount of states nS without gradual go-in. We can also have states with actions leadinginto dead-ends before the final time step was reached. In our MDP we can skip such actions, whichmeans that the actual amount of states nS actually can be higher or lower as stated in Equation 2. Still,we can use this calculation later for estimating rough stopping conditions for our training process withQ-Learning.
nS ≈n−2∑i=0
1∏j=0
|Si+j | (2)
2.2 Actions and rewardsIn our MDPs we use actions for transitioning between succeeding states. An action is a choice of how totransition from one state s ∈ S into the next state s′ ∈ S. For each action a ∈ As followed at time step tin s, a mixed reward Rt+1 = R(s, a) is returned. We define our reward roughly by the following formula:
R(s, a) = −(wD ∗ |∑
DistanceCandidates,Points| (3)
+wL ∗ |∑
LengthPoints −∑
LengthRoutes|
+wB ∗ |∑
BearingDifferencePoints,Routes|
+wA ∗ |∑
AbsoluteDirectionChangesRoutes|)∑DistanceCandidates,Points is the sum of the distances (geographical or cartesian, depending on spatial
reference system) between each point and assigned candidate of a state.∑
LengthPoints is the sum of thedistances (or lengths of the lines) between all succeeding points of a state.
∑LengthRoutes is the sum of the
lengths of the routes (the shortest paths in the road network graph) between all succeeding candidate pairsof a state. The length difference is further multiplied with a route factor that depends on the fraction ofboth lengths for prioritizing equally long routes. This is not addressed in the formula but can be reviewedin the code. The route factor is also used for dynamic skipping locations when the route is about 10 timeslarger than the distance between the succeeding points. A similar approach was used in [53] for skippinghigh error situations.
∑BearingDifferencePoints,Routes is the sum of the bearing differences between the
bearings of the lines between succeeding points of a state and the average bearings of the correspondingroutes. A single bearing difference is always within the range of −180◦ < 180◦ with negative angles whichare angles to the right and positive angles which are angles to the left.
∑AbsoluteDirectionChangesRoutes
are the summed absolute direction changes between all succeeding segments of the corresponding routes.Finally, our reward formula has weights for all parts of the mixed reward. We use a default of 1.0 forthe distance and absolute direction changes wD and wA as we empirically found out that they have themost impact for ‘typical road behavior’. Still we use 0.1 for the length and bearing differences wL andwB for making sure that the right direction and length differences are still valued. The fine tuning ofthese weights can be subject of subsequent research.
We define our reward to be negative for giving punishment for large differences between measuredpoints and road edge candidates. This eventually leads to optimizing against the highest sum of rewardsclose to negative zero. The summation within each mixed reward is possible because great errors biassingle rewards very heavily, whereas the best overall balance is what we seek. Of course this metric canbe further tuned with other specifics [see 74]. This can be subject for subsequent research.
Additionally, although our reward Rt+1 = R(s, a) always depends on the state s ∈ S and the actiona ∈ As taken, it is also possible to use other data that is static during the whole MDP run. It is onlyimportant for R being deterministic for every A in every S or else it would not be possible to find anoptimal policy with Value Iteration or Q-Learning. For example, we use an accumulated reward of all
6
remaining point distances in situations where we fail to find a route and have not reached the end of thetrack yet. This error comes not directly from the state but is static for a specific state during the MDPrun and it helps the reinforcement learning algorithm to omit high error situations.
For our HMM the probabilities are similar to our MDP reward. Instead of using absolute values, weneed to calculate probabilities (so relative fractions) for the Viterbi algorithm to work on our HMM. Thedistances are fractions of the current candidate distance to the longest candidate distance of a point.They are the observation probabilities. The lengths are fractions to each other, similar to the route factorabove. The bearing differences are relative to 180◦. The absolute direction changes are relative to 360◦.If a route is around 10 times longer than the distance between the points, its probability is set to 0.01as no dynamic skips can be used in a static HMM. The Viterbi algorithm needs a precomputed HMMcompared to Value Iteration and Q-Learning that compute the state-action pairs of the MDP duringtheir runs. The HMM transition probabilities are also combined to a mixed transition probability withthe same weights as above. The probabilities are also converted to log-probabilities for faster calculationwith the Viterbi algorithm.
3 AlgorithmsAfter building our models we use an optimized version of Value Iteration [55, 65] which is a dynamicprogramming algorithm comparable to Viterbi algorithm [25] for solving our MDPs. We compare withQ-Learning [72, 65] which is a temporal-difference reinforcement learning algorithm that improves in anincremental manner. We use an optimized ε-greedy variant that has some additional conditions for actionselection and training stopping that are beyond the scope of this paper but can be reviewed in our code.We also compare with Viterbi algorithm that we implemented on a HMM with the probability metricsdescribed above. Both Value Iteration and Viterbi algorithm share a common idea in finding an optimalglobal solution in the underlying model by combining locally optimal solutions with globally optimalsequences over an iteratively computed memory. The idea is to combine the current (state) error withthe next best (state) error for eventually finding the smallest global (state sequence) error. The Viterbialgorithm is a little bit faster in this case because, as the HMM is a static model precomputed before thealgorithm is run, the algorithm can grow the error backwards in one run, so the ‘next’ error is alreadycomputed before being applied to the current error. Value Iteration however is iteratively improved untila threshold is reached, when the global error does not change any further. This is because MDPs have a‘direction’ when an action is selected in a specific state and because they are computed on the fly, theycannot be run backwards like a HMM since the rewards simply don’t exist when the algorithm starts.Therefore the ‘next’ error is in fact the error in the next state from the previous episode. When that errordoes not exist yet, for example in the first episode, an error of zero is assumed. This does not matter asthe training continues until the global error does not change any further. Eventually, the global error alsogrows backwards after many episodes, which stops the process then when the threshold is reached. Withrespect to this backwards error growing, we swipe through our state space in a similar backwards order,so we calculate the errors from the states in the later track before the errors of the states in the trackbefore. Due to the update formula in Value Iteration computing the value of a state with respect to thevalue of the succeeding state, this allows to reduce the amount of iterations needed for Value Iterationto converge, which makes our algorithm comparably fast to the Viterbi algorithm. More about thisoptimization can be reviewed in our code. Still, we see that depending on the model Viterbi algorithm ismore an optimization algorithm whereas Value Iteration is more a learning algorithm similar to a reallearning algorithm like Q-Learning which also improves incrementally with many episodes.
3.1 Preparations and candidate searchBefore we can successfully match a track, previous research suggests filtering the track from improbableand unnecessary points. In our case we first remove all spatially duplicate points because such pointscontain no additional information about the movement of the underlying tracking device. Then we employDouglas-Peucker algorithm [20] with a setting of 5.0 m (distance around the line) for removing additionalpoints that contain no significant additional information about the movement. This retains curves anddirection changes but removes most points within straight lines. For our map matching algorithms, itmakes no difference concerning the errors if many small straight segments or a large straight segmentare compared, the errors after Equation 3 are similar. However, it makes a difference concerning theprocessing speed and amount of candidates found in candidate search, so removing unnecessary points ishighly recommended.
7

After that first step, we further reduce the amount of measured positions by using a similar filteringcircle as suggested in [53] for sanitizing noisy track parts. There they use a circle of r = 2σz = 2∗4.07 m =8.14 m because this is the GPS noise they extracted from their measured data. For our work, we use afiltering circle with a rounded fixed radius of 10.0 m as we did not extract any GPS noise from the data.Within that circle we retain the median point from the selected points. This is different to [53] when thecircle was only used to remove points around an existing point, in our case we further remove outliers byretaining only the median point. For this it is important to only select points that are directly connectedwithin the filtering circles’ radius, in order to avoid removing points that accidentally cross the circlefrom later parts of the track. The idea of sanitizing noisy track parts is that stochastic models are easilydistracted by noise and outliers, so the less noise the easier for a stochastic process to find a true optimalsolution. The latter sanitation step naturally makes it more difficult to rely on timestamps of the GPSpositions in the used metrics. This is the reason why we omit timestamps completely in our metrics. Notrelying on GPS timestamps also makes it possible to match tracks that are given as geographic lineswithout any time information (for example WKT strings). Only relying on the geographical positions infact makes our algorithms wider applicable compared to algorithms that rely on timing information intheir metrics.
Alternatively to our sanitation approach, other ‘heuristic’ filtering circle radii, dynamic radii or moreadvanced trajectory simplification algorithms [e.g., 41, 42, 82] can be applied. The combination andbenchmark of alternative sanitation technologies with our approach can be subject of subsequent research.
With the sanitized track we now have all points of P for searchinig possible candidates. A candidate isa road edge that might have been actual part of the track followed in reality. The process of finding thesecandidates is called candidate search [e.g., 35, 53, 27, 75, 15, 79, 24] and is usually also done by applyinga search circle around each point, or by using k-nearest search, or by using both. Without candidatesearch we had to consider all roads of the entire road network for every measured point. Obviously, thiswould be too much to compute and it is also not reasonable due to GPS accuracy fluctuating only withinspecific ranges [see 77, 54].
For reducing unnecessary candidates our road network is simplified before candidate search is applied.We simplify by removing all nodes that can be removed without altering the network integrity or shape(lossless simplification). The specific conditions are beyond the scope of this paper but can be reviewed inour code. For example curves can be represented by small segments each having a start and end node inthe road network graph. These segments can be concatenated into a single line with its start and endnode being the next adjacent crossroad or T-junction. After this lossless simplification, we have less edgesand nodes in the road network graph with the edges being more complex lines instead of simple segments.As such, our candidate search finds less edges and our shortest paths algorithm needs to consider fewernodes. This simplification step improves the processing speed significantly.
Considering the radius of the search circle, if we have GPS points, we can for example use the findingsfrom the GPS Performance Analysis Report [see 77, Table 7-2], which states a maximum horizontal errorof various international GPS sites of 27.98 m in 99.99% of cases. This is obviously true for GPS devicesbut for example smartphones sometimes have larger errors due to battery optimization. It is also possibleto derivate the radius from search radii used in previous research, e.g., 15 m [24], 30 m [75], 50 m [27],200 m [35, 53], or 100 m, 200 m, and 300 m [79]. Moreover, it is also possible to use dynamic radii [15]depending on the distances between succeeding measurement points. In a MDP as we suggest it, it isalso possible to expand the search radius at run-time when specific conditions are fulfilled, such as hugelength differences or exceptional bad rewards for all s ∈ S at t ∈ T in comparison to other time steps.This dramatically increases processing times, as the already converged algorithms then need to find anew global optimum. Therefore we disabled this feature, it can be the topic of subsequent research. Forthis work, we make only one candidate search and we use a dynamic radius approach with a minimumradius of 200 m. If no points are found within that radius, we double the radius until we find points orthe limit of 10 000 m is reached, in which case we skip the point. In our tests, this never happened. Theradius is also increased up to the minimum half distance between succeeding points, for example whenthree points each lie 500 m next to each other, the radius around the points is increased to 250 m sothat in low sample situations our map matching algorithm has more possibilities to find the best route.The minimum radius makes sure that in dense areas with points very near to each other, no probablyimportant candidates are left, especially when the points have a larger noise or are farther apart from theroads, e.g., when alternative side roads are taken that are not part of the underlying road network.
In our MDP each candidate is an edge intersecting our search radius around a point. Each nearestpoint for every candidate edge can be perpendicular to the edge or can be an end point of it. Afterwe found all these candidates for each point of our track, we use an additional processing that we call
8

candidate adoption. In the first step, we exchange all candidates between succeeding points, so each pointadopts the candidates from its previous and next point, except the ones that were already within its ownlist. This leads to each road position being mapped to at least two points (in the start and end of thetrack) up to three points for all remaining points inbetween. Next, we make an additional index basedsearch around each point with the radius of the farthest candidate distance and adopt all candidates thatwe found in this circle not being already in our list. In dense areas with many points remaining, even afterour track sanitation, this adopts candidates from points further apart and allows for more possibilites tonavigate within difficult dense situations. Our candidate space C grows very large after these steps but itallows our optimization algorithms to choose from a lot of possibilities. In our tests, we found out thatthe candidate adoption dramatically improves matching accuracy. Many noisy points can then point tothe same candidate position which effectively eliminates round travels and forward-backward (zig-zag)routes. Further investigation of how these methods impact the map matching process can be subject ofsubsequent research as our code base allows for additional configuration of these processing steps.
3.2 Performance adjustmentsOur code contains more adjustments that specifically improve the processing speed, which in turn allowedus to increase our model complexity, for example by using candidate adoption.
Concerning the network, we use a custom adjacency list graph with fat-initialized and simplified edges.During the import and simplification, we use lists for fast modification. We then convert our graph intovectors for fast and constant time access during Dijkstra (routing) algorithm. Our edges contain allsegments, segment lengths, segment bearings and the accumulated length, edge bearing, and directionchanges, as well as absolute direction changes. This is also true for our imported tracks before and aftersanitation.
The fat-initialization of the tracks is used for fast track sanitation with a custom Douglas-Peucker [20]algorithm, for fast map matching reward calculation, and for fast line comparison for error calculationbetween matching results and ground truth routes. Concerning the edges, the fat-initialization is alsoused for fast subline extraction during candidate search.
For each candidate search, we use an R-tree on the segments of the network with each segment pointingto its edge. This allows for fast retrieval of references to candidate edges. We then calculate the closestpoint to each edge and extract two sublines from start to closest point and from closest point to end.These sublines are saved with each candidate. We also save all nodes of all edges with each candidate.
When we want to compute a route from one candidate position to the next candidate position, westart a single-source Dijkstra algorithm on the target node of the edge of the current candidate to allnodes of the next candidate. When all nodes were visited, meaning we have the shortest paths to all givennodes, we early-stop the Dijkstra algorithm with a custom visitor as we have no need to search the entiregraph from that point on. All the results are saved in a hash map accessible by ids of the nodes. Thisway we can retrieve the other found results without the need to run the Dijkstra algorithm again duringthe following iterations when we want to reward the alternative routes from the source candidate to thetarget nodes of the next candidate. This saves a lot of Dijkstra algorithm queries which is known tohave a huge impact in map matching performance. For example in Fast map matching [79], for reducingthe impact of the Dijkstra algorithm, a precomputed routing table (UBODT) is created before the mapmatching is applied. Our approach does not precompute an UBODT for the whole graph but dynamicallyprecomputes and caches only the candidate pair routes presumably needed for matching a specific track.When multiple tracks are matched on the same graph, this route cache speeds up following tracks if theylie within the same bounds of the previous tracks.
The routes we receive from the Dijkstra algorithm only contain references to the fat edges of thenetwork graph. Since we can only route between nodes of the graph, but eventually we want routesbetween two candidate positions, we have to combine the routes of the graph with the precomputedsubline extracts of the candidates. For this, we can simply concatenate the references of the source subline,the route between the target of the source subline and the source of the target subline, and the targetsubline. Then we only have to fat-initialize the new length and directions from the already fat-initializedreferences but we don’t need to copy any fat objects or recalculate any lengths or inner directions, onlythe directions between the three lines. One exception is the bearing for the whole line which always needsto be recalculated, but we introduced a cache so that we can retrieve bearings between any two pointsthat were already calculated before. We do the same with lengths between any two points, just in case,because when we skip points in our MDP, new lengths might need to be calculated between points thatwere not directly connected before. Our code is able to calculate the lengths and angles in geographic
9

spatial reference systems (SRSs) as well as in cartesian SRSs. As the calculations in a geographic SRSrely on computationally heavy calculations, in our case Andoyer [4], but also the more expensive Vincenty[71] and Karney [34] are available, the caching and fat-initialization saves a lot of computational resourceswhen accessing the same distances and bearings multiple times. This also makes our map matching in thegeographic SRS much faster in comparison to the cartesian SRS, because expensive bearing and distancecalculations are minimized by caches, fat-initializations and references. With the computed fat-initializedroute, calculating the reward is very fast as no new geographical calculations need to be done.
For our MDP und HMM models, we use index mapping on vectors instead of hash maps for fasteraccess of rewards from previous episodes for specific state-action pairs and we use vectors for transitionand observation probabilities. Both vectors and hash maps have an access time of O(1) but index mappingwas about eight times faster in our tests because no hash needs to be calculcated for finding a position,a position can directly be accessed by the already available index. Our code base still contains bothalgorithms with hash map and with index mapping, which can be interesting for reviewing, but in ourbenchmarks we only use the much faster index mapping technology.
4 Results and analysisWe validate our approach with the map matching data set [36] from [37] available under CC BY-SA 4.014
at https://zenodo.org/record/57731. This data set specifically created for benchmarking map matchingalgorithms consists of 100 tracks from the OpenStreetMap Planet GPX dataset15 available under CCBY-SA 2.016, 100 corresponding road network extracts from OpenStreetMap Planet OSM17 availableunder ODbL18 from 100 different locations around the world, and hand corrected matches for each track.By matching the given tracks against the given road network with our algorithms, we can compare ourmatching results to the provided hand matches and calculate the matching error.
The data set is given in the GPS spatial reference system WGS 84 (EPSG:4326). For our imple-mentations, we generally stay within this SRS. For the FMM algorithms, we convert the data into theWGS 84 / Pseudo-Mercator (EPSG:3857) SRS. WGS 84 / Pseudo-Mercator is a reprojected (cartesian)SRS used by Google Maps, OpenStreetMap, and others. We need to use a reprojected SRS with FMMbecause it internally uses the much faster cartesian distance calculations and does not support the moreprecise geographical distance calculations as our algorithms do. For the sake of comparison, we alsobenchmarked the data set in the reprojected SRS with Value Iteration. We will later see that the error issimilar good. Still, exact error difference examinations can be subject of subsequent research, our codeallows for comparing both geographical and cartesian SRSs.
The hand matches are given as a list of edges of the road network. Unfortunately, this leads to somediscrepancies between the tracks, our matches and the hand matches. Often, tracks do not start directlyat the beginning or ending of an edge but somewhere in-between. For example, when starting a movementfrom a parking lot aside of the road, the track does not begin at the start node of the corresponding edgebut somewhere inbetween. As such, it is practically impossible for our algorithms to find a match that isperfectly fitting the given hand match (so has an error of exactly zero).
We can compute the error fraction of our map matching result to the hand match with the followingequation from [53] with ds being the distances erroneously subtracted, da being the distances erroneouslyadded, and dc being the correct distance:
e = (ds + da)/dc (4)
For computing the error fraction, we compare the lines directly with each other. This enables toextract exactly the mismatching parts, even when the hand match contains the entire edge (by id) andour results start somewhere in the middle of the edge. Because our results consist of floating points(geographical points) our comparison algorithm has a complex sanitation and adaption process in the firststep. This process adapts the lines to each other in nearby locations for eliminating the floating pointdifferences and splits the lines when they divide into different directions for exact extracting of similarand different parts. This of course lets very tiny differences vanish but significant map matching errorsonly happen when different roads are taken, tiny differences between close points thus can be neglected.
14https://creativecommons.org/licenses/by-sa/4.0/legalcode15https://planet.openstreetmap.org/gps/16https://creativecommons.org/licenses/by-sa/2.0/17https://planet.openstreetmap.org/18https://opendatacommons.org/licenses/odbl/
10

Our comparison algorithm in the second step then can work on binary equal positions and can exactlydetect similar and different parts, even in roundabouts, zig-zag movements, reverse movements, and multilines with gaps. After extracting all erroneously added and subtracted parts of the hand match, we cancalculate the error after Equation 4.
For both tools that we compared, we used the default program parameters for the models. We assumethat the authors of Fast map matching (FMM and ST-Match) know best which default parameters lead tofine results. For our tool, we also set default parameters that we found good working on a large variety oftracks. Our defaults, as long as they are not already explained in this paper, can be reviewed in our codeby running our program without any parameters or with the ‘--help’ parameter. Fast map matching inthe version we benchmarked by default used an UBODT upper bound distance of 3000 m, a candidatesearch radius of 300 m and it retained the 8 k-nearest candidates within the found candidates for eachtrack point. FMM calculated the distance error for its HMM observation probabilities relative to 50 mmeter (called GPS error). The transition probabilities were calculated from the length fractions of thedistance between point pairs and the length of the related found route, similar to our length metric partof our mixed reward. There were no bearings or direction changes used for the probabilities in FMM asfar as we understood the program.
Our tests were all run on a Dual Socket AMD EPYC 7742 system with 2x 64 CPU-Cores and 1024GB DDR4-3200 RAM on local RAIZ-Z1 SSD storage. We ran all tests in sequence so that the timingmeasurements were not impacted by any bandwidth limits or schedulers. For the memory and timingmeasurements we used /usr/bin/time. All tests were run on Ubuntu 20.04 LTS and both C++ programs(ours and FMM/ST-Match) were compiled locally with GCC 9.3.
0 0.1 0.2 0.3 0.4 0.5 0.6 0.7 0.8 0.9 1
0.0001
0.001
0.01
0.1
1
percentile of results
erro
rfr
actio
n
Error fraction comparison benchmark
Value Iteration Viterbi Q-LearningFMM ST-Match Value Iteration Reprojected
Figure 3: Benchmark results for accuracy – We compare on our MDP Value Iteration, Q-Learning andwe also employ Value Iteration on reprojected coordinates for faster distance and bearing calculations.On our HMM we employ a Viterbi algorithm. We compare our results with FMM which is also basedon HMM and Viterbi algorithm and ST-Match from the same tool suite. We can see that FMM andST-Match fail to find results for all tracks of the map matching data set. This happened especially whenthe tracks had large gaps or the UBODT had no entries for a point pair. Our algorithms can handle thisand find results for all tracks of the map matching data set. An error fraction > 1.0 means that therewere more wrongly added or missed matches than the hand match is long. We can see that our algorithmshave generally significantly fewer matching errors than FMM and ST-Match and always stay below anerror fraction of 1.0. In the results with high matching errors, our Value Iteration on MDP approach alsooutperforms our Viterbi on HMM implementation significantly. Q-Learning is mostly worse than bothValue Iteration and Viterbi but still is able to find good results in comparison with FMM and ST-Match.
11

algorithm count min Q0.01 Q0.10 Q0.25 Q0.50 Q0.75 Q0.90 Q0.99 max meanValue Iteration 100 0.0004 0.0004 0.0015 0.0053 0.0130 0.0283 0.0600 0.2194 0.3142 0.0259VI Reprojected 100 0.0004 0.0004 0.0013 0.0052 0.0105 0.0296 0.0630 0.2186 0.2392 0.0265Viterbi 100 0.0000 0.0002 0.0016 0.0056 0.0120 0.0333 0.0837 0.4637 0.5120 0.0404Q-Learning 100 0.0005 0.0009 0.0022 0.0062 0.0140 0.0347 0.0738 0.7793 0.8850 0.0459FMM 90 0.0005 0.0007 0.0037 0.0086 0.0172 0.0663 0.1904 1.0605 1.4227 0.0976ST-Match 94 0.0005 0.0008 0.0031 0.0071 0.0271 0.0796 0.3680 2.1069 2.8196 0.1690
Table 1: Benchmark results for accuracy – Here are some detailed error fraction metrics from Figure 3.We can see that Value Iteration on our MDP is on average (mean) much better than every other algorithmand model. We can also see that using a reprojected SRS (VI = Value Iteration) leads to similar goodmatching errors as using a geographic SRS even though cartesian distance and bearing calculations areless exact than geographic ones.
0 0.1 0.2 0.3 0.4 0.5 0.6 0.7 0.8 0.9 1
0.1
1
10
100
1,000
percentile of results
time
inse
cond
s
Time comparison
Value Iteration Viterbi Q-LearningFMM ST-Match UBODT-GENValue Iteration Reprojected
Figure 4: Benchmark results for duration – We see that ST-Match is the overall fastest algorithm andtakes less than a second in more than 70% of the cases. However, the result errors were not so favorableon average compared with our algorithms and models. FMM only works after an UBODT has beengenerated. We can see that the UBODT generation takes the longest time and even then, FMM issignificantly slower on some tracks than our algorithms. This is because we did not only measure thematching time but also the time it needed to import the UBODT. For our algorithms, we also not onlymeasured the matching time but also the network import and sanitation times of networks and tracks.After all, when matching one track, the whole running time is important. Our Value Iteration algorithm isnearly as fast as our Viterbi algorithm, which behaves exactly as expected. Our Value iteration algorithmon the reprojected SRS is significantly faster in all cases than our Value Iteration on the geographic SRS.Q-Learning is often slower than our Value Iteration algorithm due to the many episodes needed untilconvergence.
12

algorithm min Q0.01 Q0.10 Q0.25 Q0.50 Q0.75 Q0.90 Q0.99 max meanValue Iteration 0.23 0.36 0.90 1.90 5.03 10.88 16.35 44.87 104.98 8.30VI Reprojected 0.06 0.09 0.23 0.57 1.76 3.98 7.29 22.72 37.93 3.24Viterbi 0.23 0.36 0.89 1.83 4.74 9.63 15.75 44.63 83.17 7.56Q-Learning 0.23 0.33 0.94 2.02 4.37 12.77 27.34 84.41 375.83 13.69UBODT-GEN 0.12 0.12 0.96 3.94 19.13 50.58 167.67 337.43 351.62 51.20FMM 0.09 0.09 0.49 1.75 7.49 20.11 143.16 618.68 1822.28 55.46ST-Match 0.08 0.11 0.20 0.29 0.51 0.97 1.62 35.46 475.59 5.95
Table 2: Benchmark results for duration – Here are some detailed duration measurements in secondsto Figure 4. We can see than on average our Value Iteration (=VI) on the reprojected SRS is muchfaster than ST-Match (which also computes on the reprojected SRS). This comes mainly from one trackwhere ST-Match needs nearly ≈ 8 min to match whereas our algorithm on reprojected SRS only needs≈ 0.63 min maximum. We can also see that Fast map matching (FMM) needs much more time than allour algorithms. This is mainly because for every track an UBODT needs to be generated and importedfor the whole corresponding network graph though only a fraction of routes is really needed. We can alsosee that the Viterbi algorithm on HMM is only slightly faster compared to our Value Iteration on MDPalgorithm, as expected, but this comes with a larger matching error. We can see that Q-Learning is notreally fast in comparison, which is the expected behavior of a learning algorithm. Still it is not extremelyslow, so more tuning in the action selection process can further improve the speed.
algorithm min Q0.01 Q0.10 Q0.25 Q0.50 Q0.75 Q0.90 Q0.99 max meanValue Iteration 32.90 39.04 64.33 107.81 231.16 383.28 582.52 1200.44 3154.63 303.29VI Reprojected 35.12 38.30 51.58 79.11 145.56 240.06 335.20 625.66 1318.00 188.98Viterbi 32.63 37.23 51.38 82.89 150.35 251.31 368.11 590.16 1073.63 186.33Q-Learning 33.43 38.37 61.27 106.79 208.95 371.18 544.62 1203.46 3326.86 286.36UBODT-GEN 53.62 53.98 54.59 55.93 59.16 69.04 89.91 134.16 149.76 66.82UBODT filesize 1.41 1.51 16.88 72.69 338.15 903.66 2729.45 5137.22 5303.60 873.58FMM 57.32 57.83 84.00 179.17 573.22 1439.52 3562.72 6628.64 6682.41 1241.42ST-Match 55.29 55.59 57.32 59.51 64.90 75.21 104.86 149.44 156.62 73.13
Table 3: Benchmark results for memory consumption – These are some details of the memory measurementsin MegaBytes from Figure 5. For the UBODT filesize we used the filesize from the filesystem. We can seethat on average, Q-Learning needs less memory than Value Iteration because it visits less states of theMDP whereas Value Iteration visits all states. Still the difference is not much and the matching error ofValue Iteration is significantly better.
algorithm min Q0.01 Q0.10 Q0.25 Q0.50 Q0.75 Q0.90 Q0.99 max meanValue Iteration 6664 36226 233483 514140 1733568 3596893 6943929 23123159 58768564 3386264VI Reprojected 6866 25147 128589 270955 754477 1594903 3049655 9204441 21261622 1470803Viterbi 5240 33796 224442 502229 1743849 3586903 6879679 23035197 58389964 3363861Q-Learning 6280 35640 233161 495833 1662620 3552087 6850338 22726828 57627268 3279703FMM 16704 22977 37933 57920 92096 178672 273453 1028020 1235968 158177ST-Match 16704 22977 37933 57920 92096 178672 273453 1028020 1235968 158177
Table 4: Benchmark results for candidate combinations – These are some details of the candidatecombinations from Figure 6. We can see that our geographic MDP and HMM algorithms on averageuse ≈ 20 times more candidate combinations than FMM and ST-Match. Though this is a huge amountof additional candidate combinations to examine in comparison, our best algorithm (Value Iteration onMDP) on average only needs ≈ 2 times more processing time and ≈ 4 times more memory than the fastestalgorithm ST-Match while finding matching results with ≈ 6 times less errors (for all tracks, compared toST-Match which fails on six tracks). Concerning the one track where ST-Match needed ≈ 10 min andcomparing the maximum candidate combinations with our Value Iteration and Viterbi algorithms, wecan see that our algorithms are more robust in edge cases concerning the processing speed.
13

0 0.1 0.2 0.3 0.4 0.5 0.6 0.7 0.8 0.9 11
10
100
1,000
10,000
percentile of results
mem
ory
cons
umpt
ion
inM
egaB
ytes
Memory consumption (resident set size) comparison
Value Iteration Viterbi Q-LearningFMM ST-Match UBODT-GENValue Iteration Reprojected UBODT (filesize)
Figure 5: Benchmark results for memory consumption – Here we can see how much Random AccessMemory (RAM) each algorithm needed for matching. For the UBODT we also plotted the file size onthe file system. This shows why FMM needs much more memory in comparison to all other algorithms,because it needs to import the UBODT before it can match. We are sure that with better chosenprogram parameters FMM becomes faster and less resource hungry, but we compared all tools withdefault parameters in our experiments. ST-Match mostly needs very few memory due to its simplermodel design and because it needs no UBODT. Our algorithms all need most of the time more memorythan ST-Match but always less than FMM because we only compute the routes that we need. From ouralgorithms, our Q-Learning and Value Iteration on MDP algorithms need most memory in comparison.Using the Viterbi algorithm and HMM model needs significantly less memory but has a higher matchingerror. Using a reprojected SRS also needs less memory, because less candidate combinations are examined(see Figure 6).
14

0 0.1 0.2 0.3 0.4 0.5 0.6 0.7 0.8 0.9 1
10,000
100,000
1,000,000
10,000,000
100,000,000
percentile of results
cand
idat
eco
mbi
natio
ns
Candidate combinations comparison
Value Iteration Viterbi Q-LearningFMM ST-Match Value Iteration Reprojected
Figure 6: Benchmark results for candidate combinations – Here we can see how many pairs of candidateseach algorithm examined during matching. Each candidate combination is equal to computing a rewardafter Equation 3. Our algorithms wrote out the exact number of combinations by returning the size ofthe internal state-action cache used in index mapping. For FMM and ST-Match, we used the followingformula (8 ∗ 8) ∗ (npoints − 1) with npoints being the points of the track. Each point had 8 k-nearestcandidates, so between each pair of candidates, 8 ∗ 8 combinations had to be examined. We can seethat our algorithms generally examine much more candidate combinations with our default programparameters, which is due to our candidate adoption and search circle without k-nearest. This has aprocessing speed and memory penalty on our algorithms compared to ST-Match and the map matchingphase of FMM without UBODT generation and import. But concerning the comparably huge amountof candidate combinations our algorithms examine, the additional memory and time consumption weneed is impressively small, due to our performance adjustments. We can also see that our Q-Learning,Viterbi and Value Iteration algorithm all examine comparable amounts of candidate combinations. Ourreprojected algorithm examines much less candidate combinations, which explains why it is faster andneeds less memory. The reason for this is that a search circle with a radius of 200 m in a cartesian SRS issmaller than a circle with a radius of 200 m in a geographic SRS, so less candidates are found and needto be examined. Even though our reprojected algorithm uses less candidates, it finds similar good results(see Table 1). Further tuning of our default parameters for increased processing speed while maintainingsimilar results can be subject of subsequent research. Also comparing FMM and ST-Match with higherthan default k-nearest setting remains of interest but is out of scope in this work.
15

5 Discussion and conclusionWe were able to show that map matching with MDPs and Value Iteration is a more robust solutioncompared to HMMs with Viterbi algorithm concerning its matching error especially in difficult mapmatching situations. Though our MDPs are a little bit slower to compute than HMMs, they are still verycompeting due to their much lower error fractions. On average, our MDPs with Value Iteration has amatching error of ≈ 2.59% compared to our HMMs with Viterbi algorithm with an average matchingerror of ≈ 4.04%, which is ≈ 35.9% more accurate while being only ≈ 9.7% slower.
We showed that on our MDP it is also possible to employ learning algorithms such as Q-Learning,although they need more tuning for increased performance. Also, more advanced reinforcement learningalgorithms, for example ‘n-step’ bootstrapping [65] can further improve the performance. This remainssubject of subsequent research. Still, we have shown that HMMs with Viterbi algorithm also can benefitfrom more complex metrics such as direction changes compared to HMMs with Viterbi algorithm withoutsuch complex metrics, such as the implementations in FMM. Most of our improvements (e.g., our candidateadoption, index mapping, simplification, sanitation improvements, and others) can be used in both HMMmethods as well as our new MDP methods.
We have seen that an understanding of ‘typical road behavior’ can be implemented by using absolutereward metrics as in Equation 3. The benchmark of different weights from 0.0 to 1.0 or more againsteach other to see how much impact each fraction of our metrics formula has on the matching error can bepart of subsequent research.
Moreover, it is possible to combine artificial neural networks with our reinforcement learning algorithms,for example trajectory pattern analysis can further reduce the amount of candidates [80]. Similarly, it ispossible to rely on the history of the measurements for selecting next candidates [87].
We believe our work contains many ideas and details on how to improve map matching technology.Empowering Markov Decision Processes for map matching in fact shows a promising and flexible way ofreducing remaining matching errors while still being competitive concerning their computational speed.
Data and codes availability statementThe map matching data set [36] from [37] is available under CC BY-SA 4.019 athttps://zenodo.org/record/57731
Our code is available as C++ code (CMake project) under AGPL 3.020 license athttps://github.com/iisys-hof/map-matching-2Please review the provided Dockerfile for instructions on how to compile and run the software.
Disclosure statementThere are no competing interests.
FundingThis work was supported by the ‘Bundesministerium für Verkehr und digitale Infrastruktur’ in theresearch projects ‘Mobilität Digital Hochfranken’ and ‘Shuttle Modellregion Oberfranken’.
References[1] E. Abbott and D. Powell. Land-vehicle navigation using GPS. Proceedings of the IEEE, 87(1):145–162,
1 1999.
[2] Pankaj K. Agarwal, Rinat Ben Avraham, Haim Kaplan, and Micha Sharir. Computing the DiscreteFréchet Distance in Subquadratic Time. CoRR, 4 2012.
[3] Helmut Alt, Alon Efrat, Günter Rote, and Carola Wenk. Matching planar maps. Journal ofAlgorithms, 49(2):262–283, 11 2003.
19https://creativecommons.org/licenses/by-sa/4.0/legalcode20https://www.gnu.org/licenses/agpl-3.0.en.html
16

[4] Henri Andoyer. Formule Donnant la Longueur de la Géodésique Joignant 2 Points de L’ellipsoïdeDonnés Par Leurs Coordonnées Géographiques. Notices Scientifiques, 34(1):77–81, 4 1932.
[5] Markus Auer, Hubert Rehborn, Sven-Eric Molzahn, and Klaus Bogenberger. Boosting performanceof map matching algorithms by parallelization on graphics processors. In 2017 IEEE IntelligentVehicles Symposium (IV), pages 462–467. IEEE, 6 2017.
[6] Ali Esref Aytac, Orhan Aksoy, and Yusuf Sinan Akgul. Ship positioning by matching radar imagesand map data. In 2014 22nd Signal Processing and Communications Applications Conference (SIU),pages 1423–1426. IEEE, 4 2014.
[7] Yoonsik Bang, Jiyoung Kim, and Kiyun Yu. An improved map-matching technique based on thefréchet distance approach for pedestrian navigation services. Sensors, 16(10):1768–1786, 10 2016.
[8] Richard Bellman. A markovian decision process. Journal of Mathematics and Mechanics, 6(5):679–68,4 1957.
[9] David Bernstein and Alain L. Kornhauser. An introduction to map matching for personal navigationassistants, 8 1996.
[10] Nathaniel Bowditch. The American Practical Navigator. National Imagery and Mapping Agency,Bethesda, Maryland, 1 1995.
[11] Sotiris Brakatsoulas, Dieter Pfoser, Randall Salas, and Carola Wenk. On map-matching vehicletracking data. In Proceedings of the 31st International Conference on Very Large Data Bases, VLDB’05, pages 853–864, Trondheim, Norway, 8 2005. VLDB Endowment.
[12] Benedikt Budig. An algorithm for map matching on incomplete road databases. Master’s thesis,Julius-Maximilians-Universität Würzburg, Würzburg, 2 2012.
[13] Francois Caron, Emmanuel Duflos, Denis Pomorski, and Philippe Vanheeghe. GPS/IMU datafusion using multisensor kalman filtering: introduction of contextual aspects. Information Fusion,7(2):221–230, 6 2006.
[14] Pingfu Chao, Yehong Xu, Wen Hua, and Xiaofang Zhou. A survey on map-matching algorithms, 102019.
[15] Mingliang Che, Yingli Wang, Chi Zhang, and Xinliang Cao. An enhanced hidden markov mapmatching model for floating car data. Sensors (Basel), 18(6):1758–1777, 5 2018.
[16] P. Dabove, G. Ghinamo, and A. M. Lingua. Inertial sensors for smartphones navigation. SpringerPlus,4(1):834–852, 12 2015.
[17] Anthony J. DeGregoria. Gravity Gradiometry and Map Matching: An Aid to Aircraft InertialNavigation Systems. Air Force Institute of Technology, Ohio, 10 2010.
[18] Thomas G. Dietterich. Machine learning for sequential data: A review. In Lecture Notes in ComputerScience, pages 15–30. Springer Berlin Heidelberg, Berlin, Heidelberg, 1 2002.
[19] Edsger Wybe Dijkstra. A note on two problems in connexion with graphs. In Numerische Mathematik,volume 1, pages 269–271. Springer, 1 1959.
[20] David H. Douglas and Thomas K. Peucker. Algorithms for the reduction of the number of pointsrequired to represent a digitized line or its caricature. Cartographica: The International Journal forGeographic Information and Geovisualization, 10(2):112–122, 10 1973.
[21] Thomas Eiter and Heikki Mannila. Computing discrete frechet distance, 5 1994.
[22] European Global Navigation Satellite Systems Agency. European GNSS (galileo) open servicedefinition document, 5 2019.
[23] Esther Calvo Fernández, J. Cordero, G. Vouros, N. Pelekis, Theocharis Kravaris, H. Georgiou,G. Fuchs, Enrique Casado, P. Costas, and S. Ayhan. DART: A machine-learning approach totrajectory prediction and demand-capacity balancing. In Seventh SESAR Innovation Days, SESAR,11 2017.
17

[24] David Fiedler, Michal Čáp, Jan Nykl, Pavol Žilecký, and Martin Schaefer. Map Matching Algorithmfor Large-scale Datasets. CoRR, 9 2019.
[25] G.D. Forney. The viterbi algorithm. Proceedings of the IEEE, 61(3):268–278, 3 1973.
[26] Matteo Francia, Enrico Gallinucci, and Federico Vitali. Map-matching on big data: a distributedand efficient algorithm with a hidden markov model. In 2019 42nd International Convention onInformation and Communication Technology, Electronics and Microelectronics (MIPRO), pages1238–1243. IEEE, 5 2019.
[27] C.Y. Goh, J. Dauwels, N. Mitrovic, M. T. Asif, A. Oran, and P. Jaillet. Online map-matching basedon hidden markov model for real-time traffic sensing applications. In 2012 15th International IEEEConference on Intelligent Transportation Systems, pages 776–781. IEEE, 9 2012.
[28] Joshua S. Greenfeld. Matching GPS observations to locations on a digital map. In TransportationResearch Board 81st Annual Meeting, Washington D.C., 1 2002.
[29] Awni Hannun. The label bias problem, 11 2019.
[30] Noriaki Hirosue. Map matching with hidden markov model on sampled road network. In Proceedingsof the 21st International Conference on Pattern Recognition (ICPR2012), pages 2242–2245. IEEE,11 2012.
[31] Yigong Hu and Binbin Lu. A hidden markov model-based map matching algorithm for low samplingrate trajectory data. IEEE Access, 7:178235–178245, 12 2019.
[32] Zhengfeng Huang, Shaojie Qiao, Nan Han, Chang-an Yuan, Xuejiang Song, and Yueqiang Xiao.Survey on vehicle map matching techniques. CAAI Transactions on Intelligence Technology, 6 2020.
[33] Britta Hummel. Map matching for vehicle guidance. Dynamic and mobile GIS. Ed.: J. Drummond,10:157–168, 1 2006.
[34] Charles F. F. Karney. Algorithms for geodesics. Journal of Geodesy, 87(1):43–55, 1 2013.
[35] John Krumm, Eric Horvitz, and Julie Letchner. Map matching with travel time constraints. In SAEWorld Congress & Exhibition, Warrendale, PA, United States, 4 2007. SAE International.
[36] Matej Kubicka, Arben Cela, Philippe Moulin, Hugues Mounier, and S. I. Niculescu. Dataset fortesting and training map-matching methods, 7 2016.
[37] Matej Kubicka, Arben Cela, Philippe Moulin, Hugues Mounier, and S.I. Niculescu. Dataset fortesting and training of map-matching algorithms. In 2015 IEEE Intelligent Vehicles Symposium(IV). IEEE, 6 2015.
[38] John D. Lafferty, Andrew McCallum, and Fernando C. N. Pereira. Conditional random fields:Probabilistic models for segmenting and labeling sequence data. In Proceedings of the EighteenthInternational Conference on Machine Learning, ICML ’01, pages 282–289, San Francisco, CA, USA,6 2001. Morgan Kaufmann Publishers Inc.
[39] B. D. S. Lakmali and Dileeka Dias. Database correlation for GSM location in outdoor & indoorenvironments. In 2008 4th International Conference on Information and Automation for Sustainability,pages 42–47. IEEE, 12 2008.
[40] Bijun Li, Yuan Guo, Jian Zhou, and Yi Cai. A data correction algorithm for low-frequency floatingcar data. Sensors, 18(11):3639–3656, 10 2018.
[41] Hengfeng Li, Lars Kulik, and Kotagiri Ramamohanarao. Spatio-temporal trajectory simplificationfor inferring travel paths. In Proceedings of the 22nd ACM SIGSPATIAL International Conferenceon Advances in Geographic Information Systems, SIGSPATIAL ’14, pages 63–72, New York, NY,USA, 11 2014. Association for Computing Machinery.
[42] Hengfeng Li, Lars Kulik, and Kotagiri Ramamohanarao. Robust inferences of travel paths from GPStrajectories. International Journal of Geographical Information Science, 29(12):2194–2222, 12 2015.
18

[43] Jun Li, Qiming Qin, Chao Xie, and Yue Zhao. Integrated use of spatial and semantic relationships forextracting road networks from floating car data. International Journal of Applied Earth Observationand Geoinformation, 19:238–247, 10 2012.
[44] Biwei Liang, Tengjiao Wang, Shun Li, Wei Chen, Hongyan Li, and Kai Lei. Online learning foraccurate real-time map matching. In James Bailey, Latifur Khan, Takashi Washio, Gill Dobbie,Joshua Zhexue Huang, and Ruili Wang, editors, Advances in Knowledge Discovery and Data Mining,pages 67–78, Cham, 4 2016. Springer International Publishing.
[45] Lin Liao, Dieter Fox, and Henry Kautz. Extracting places and activities from GPS traces usinghierarchical conditional random fields. The International Journal of Robotics Research, 26(1):119–134,1 2007.
[46] Yin Lou, Chengyang Zhang, Yu Zheng, Xing Xie, Wei Wang, and Yan Huang. Map-matching forlow-sampling-rate GPS trajectories. In Proceedings of the 17th ACM SIGSPATIAL InternationalConference on Advances in Geographic Information Systems, GIS ’09, pages 352–361, New York, NY,USA, 11 2009. Association for Computing Machinery.
[47] Thomas Louail, Maxime Lenormand, Oliva García Cantú, Miguel Picornell, Ricardo Herranz, EnriqueFrias-Martinez, José J. Ramasco, and Marc Barthelemy. From mobile phone data to the spatialstructure of cities. Scientific Reports, 4(1):5276–5287, 6 2014.
[48] An Luo, Shenghua Chen, and Bin Xv. Enhanced map-matching algorithm with a hidden markovmodel for mobile phone positioning. ISPRS International Journal of Geo-Information, 6(11):327–344,10 2017.
[49] F. Marchal, J. Hackney, and K. W. Axhausen. Efficient map matching of large global positioningsystem data sets: Tests on speed-monitoring experiment in zürich. Transportation Research Record,1935(1):93–100, 1 2005.
[50] Adam Millard-Ball, Robert C. Hampshire, and Rachel R. Weinberger. Map-matching poor-qualityGPS data in urban environments: the pgmapmatch package. Transportation Planning and Technology,42(6):539–553, 5 2019.
[51] Koichi Miyashita, Tsutomu Terada, and Shojiro Nishio. A map matching algorithm for car navigationsystems that predict user destination. In 22nd International Conference on Advanced InformationNetworking and Applications - Workshops (aina workshops 2008), pages 1551–1556. IEEE, 3 2008.
[52] James Murphy, Yuanyuan Pao, and Albert Yuen. Map matching when the map is wrong: Efficientvehicle tracking on- and off-road for map learning, 9 2019.
[53] Paul Newson and John Krumm. Hidden markov map matching through noise and sparseness. InProceedings of the 17th ACM SIGSPATIAL International Conference on Advances in GeographicInformation Systems, GIS ’09, pages 336–343, New York, NY, USA, 11 2009. Association forComputing Machinery.
[54] Office of the Department of Defense. Global positioning system standard positioning serviceperformance standard, 4 2020.
[55] Elena Pashenkova, Irina Rish, and Rina Dechter. Value iteration and policy iteration algorithms formarkov decision problem, 4 1996.
[56] Francisco Câmara Pereira, Hugo Costa, and Nuno Martinho Pereira. An off-line map-matchingalgorithm for incomplete map databases. European Transport Research Review, 1(3):107–124, 9 2009.
[57] Oliver Pink and Britta Hummel. A statistical approach to map matching using road networkgeometry, topology and vehicular motion constraints. In 2008 11th International IEEE Conferenceon Intelligent Transportation Systems, pages 862–867. IEEE, 10 2008.
[58] Mohammed Quddus and Simon Washington. Shortest path and vehicle trajectory aided map-matching for low frequency GPS data. Transportation Research Part C: Emerging Technologies,55:328–339, 6 2015.
19
[59] Mohammed A. Quddus, Washington Y. Ochieng, and Robert B. Noland. Current map-matchingalgorithms for transport applications: State-of-the art and future research directions. TransportationResearch Part C: Emerging Technologies, 15(5):312–328, 10 2007.
[60] Ming Ren. Advanced Map Matching Technologies and Techniques for Pedestria/Wheelchair Navigation.PhD thesis, University of Pittsburg, Pittsburgh, 3 2012.
[61] Joerg Schweizer, Federico Rupi, and Silvia Bernardi. Map-matching algorithm applied to bicycleglobal positioning system traces in bologna. IET Intelligent Transport Systems, 10(4):244–250, 62016.
[62] I. Skog and P. Handel. In-car positioning and navigation technologies - a survey. IEEE Transactionson Intelligent Transportation Systems, 10(1):4–21, 2 2009.
[63] Aaron J. Snoswell, Surya P. N. Singh, and Nan Ye. Revisiting Maximum Entropy Inverse Re-inforcement Learning: New Perspectives and Algorithms. In 2020 IEEE Symposium Series onComputational Intelligence (SSCI). IEEE, 12 2020.
[64] Wenbin Sun and Ting Xiong. A low-sampling-rate trajectory matching algorithm in combination ofhistory trajectory and reinforcement learning. Acta Geodaetica et Cartographica Sinica, 45(11):1328,1 2016.
[65] Richard S. Sutton and Andrew G. Barto. Reinforcement Learning: An Introduction (Second Edition).Adaptive computation and machine learning series. The MIT Press, Cambridge, Massachusetts, 12018.
[66] Shun Taguchi, Satoshi Koide, and Takayoshi Yoshimura. Online map matching with route prediction.IEEE Transactions on Intelligent Transportation Systems, 20(1):338–347, 3 2018.
[67] Luliang Tang, Xue Yang, Zhen Dong, and Qingquan Li. CLRIC: Collecting lane-based road informa-tion via crowdsourcing. IEEE Transactions on Intelligent Transportation Systems, 17(9):2552–2562,3 2016.
[68] Luliang Tang, Xue Yang, Zihan Kan, and Qingquan Li. Lane-level road information mining fromvehicle GPS trajectories based on naïve bayesian classification. ISPRS International Journal ofGeo-Information, 4(4):2660–2680, 11 2015.
[69] Fernando Torre, David Pitchford, Phil Brown, and Loren Terveen. Matching GPS traces to (possibly)incomplete map data: Bridging map building and map matching. In Proceedings of the 20thInternational Conference on Advances in Geographic Information Systems, SIGSPATIAL ’12, pages546–549, New York, NY, USA, 11 2012. Association for Computing Machinery.
[70] Nagendra R. Velaga, Mohammed A. Quddus, and Abigail L. Bristow. Improving the performance ofa topological map-matching algorithm through error detection and correction. Journal of IntelligentTransportation Systems, 16(3):147–158, 7 2012.
[71] T. Vincenty. Direct and Inverse Solutions of Geodesics on the Ellipsoid with Application of NestedEquations. Survey Review, 23(176):88–93, 4 1975.
[72] Christopher John Cornish Hellaby Watkins. Learning from Delayed Rewards. PhD thesis, King’sCollege, 5 1989.
[73] Christopher John Cornish Hellaby Watkins and Peter Dayan. Q-learning. Technical Report 3-4,Machine Learning, 5 1992.
[74] Hong Wei, Yin Wang, George Forman, and Yanmin Zhu. Map matching: Comparison of approachesusing sparse and noisy data. In Proceedings of the 21st ACM SIGSPATIAL International Conferenceon Advances in Geographic Information Systems, SIGSPATIAL ’13, pages 444–447, New York, NY,USA, 11 2013. Association for Computing Machinery.
[75] Hong Wei, Yin Wang, George Forman, Yanmin Zhu, and Haibing Guan. Fast viterbi map matchingwith tunable weight functions. In Proceedings of the 20th International Conference on Advances inGeographic Information Systems, SIGSPATIAL ’12, pages 613–616, New York, NY, USA, 11 2012.Association for Computing Machinery.
20

[76] Christopher E White, David Bernstein, and Alain L Kornhauser. Some map matching algorithms forpersonal navigation assistants. Transportation Research Part C: Emerging Technologies, 8(1-6):91–108,2 2000.
[77] William J. Hughes Technical Center. Global positioning system (GPS) standard positioning service(SPS) performance analysis report. Technical report, Atlantic City International Airport, Washington,DC, 1 2017.
[78] Ming Xu, Yiman Du, Jianping Wu, and Yang Zhou. Map matching based on conditional randomfields and route preference mining for uncertain trajectories. Mathematical Problems in Engineering,2015:1–13, 9 2015.
[79] Can Yang and Győző Gidófalvi. Fast map matching, an algorithm integrating hidden markov modelwith precomputation. International Journal of Geographical Information Science, 32(3):547–570, 32018.
[80] Can Yang and Győző Gidófalvi. Detecting regional dominant movement patterns in trajectory datawith a convolutional neural network. International Journal of Geographical Information Science,34(5):996–1021, 12 2019.
[81] Haiqiang Yang, Shaowu Cheng, Huifu Jiang, and Shi An. An enhanced weight-based topologicalmap matching algorithm for intricate urban road network. Procedia - Social and Behavioral Sciences,96:1670–1678, 11 2013.
[82] Yifang Yin, Rajiv Ratn Shah, and Roger Zimmermann. A general feature-based map matchingframework with trajectory simplification. In Proceedings of the 7th ACM SIGSPATIAL InternationalWorkshop on GeoStreaming, IWGS ’16, pages 1–10, New York, NY, USA, 10 2016. Association forComputing Machinery.
[83] Mohamed A. Yousef and Mustafa K. Ragheb. Effect of recording interval on GPS accuracy. Journalof Engineering Sciences, 42(5):1215–1231, 9 2014.
[84] Jing Yuan, Yu Zheng, Chengyang Zhang, Xing Xie, and Guang-Zhong Sun. An interactive-votingbased map matching algorithm. In 2010 Eleventh International Conference on Mobile Data Manage-ment, pages 43–52. IEEE, 5 2010.
[85] Ayman Zeidan, Eemil Lagerspetz, Kai Zhao, Petteri Nurmi, Sasu Tarkoma, and Huy T. Vo. Geomatch:Efficient large-scale map matching on apache spark. In 2018 IEEE International Conference on BigData (Big Data), pages 384–391. IEEE, 12 2018.
[86] Ethan Zhang and Neda Masoud. Increasing GPS localization accuracy with reinforcement learning.IEEE Transactions on Intelligent Transportation Systems, pages 1–12, 2 2020.
[87] Kai Zhao, Jie Feng, Zhao Xu, Tong Xia, Lin Chen, Funing Sun, Diansheng Guo, Depeng Jin, andYong Li. DeepMM: Deep learning based map matching with data augmentation. In Proceedingsof the 27th ACM SIGSPATIAL International Conference on Advances in Geographic InformationSystems, SIGSPATIAL ’19, pages 452–455, New York, NY, USA, 11 2019. Association for ComputingMachinery.
[88] Ke Zheng and Dunyao Zhu. A novel clustering algorithm of extracting road network from low-frequency floating car data. Cluster Computing, 22(5):12659–12668, 1 2018.
[89] Brian D. Ziebart, Andrew Maas, J. Andrew Bagnell, and Anind K. Dey. Maximum entropy inversereinforcement learning. In Proceedings of the 23rd National Conference on Artificial Intelligence,volume Volume 3 of AAAI ’08, pages 1433–1438. AAAI Press, 7 2008.
[90] Xinyan Zou, Zhixiang Fang, Haoyu Zhong, Zhongheng Wu, and Xiongyan Liu. Inertia mutationenergy model to extract roads by crowdsourcing trajectories. IEEE Access, 7:186393–186408, 122019.
21