Evolutionary and taxonomic relationships among Far-Eastern salmonid fishes inferred from...
15
Journal of Fish Biology (1996) 49, 815–829 Evolutionary and taxonomic relationships among Far-Eastern salmonid fishes inferred from mitochondrial DNA divergence S. V. S’*, L. K. G*, I. Z. P² A. V. E* *Institute of Biology and Soil Sciences, Vladivostok 690022, Russia and ²Pacific Research Institute of Fisheries and Oceanography, Vladivostok 690600, Russia (Received 30 August 1995, Accepted 14 April 1996) Mitochondrial DNA (mtDNA) restriction analysis was used to examine the evolutionary and taxonomic relationships among 11 taxa of the subfamily Salmoninae. The genera Brachymystax and Hucho were closely related, diverging by sequence divergence estimates of 3·1%. Because the mtDNA sequence divergence between blunt- and sharp-snouted forms of Brachymystax (2·24%) was similar to divergence level of Brachymystax and Hucho, then taking into account the distinct morphological, ecological and allozyme differences between them, it is possible to recognize these forms as two separate species. The subgenus Parahucho formed a very distinct group differing by 6·35–7·08% (sequence divergence estimate) from both Brachymystax and Hucho and must be considered as a valid genus. The UPGMA and neighbour-joined phenograms showed that the five genera studied are divided into two main groupings: (1) Hucho, Brachymystax and Salvelinus; and (2) Oncorhynchus and Parahucho species. The mtDNA sequence divergence estimates between these groupings were about 8·1%. However, the subsequent bootstrap analysis of mtDNA RFLP data did not support the monophyly of the latter grouping. The concordance of morphological and mtDNA phylogenetic patterns is discussed. ? 1996 The Fisheries Society of the British Isles Key words: salmonid fishes; mitochondrial DNA; phylogeny. INTRODUCTION The taxonomy and evolutionary relationships of Asiatic salmonid genera (Brachymystax, Hucho and Parahucho) to other genera of the subfamily Salmoninae (Salmo, Salvelinus, Oncorhynchus) remains uncertain. Usually, after Tchernavin (1939) and Norden (1961), the genus Brachymystax is considered as primitive and its origin is connected with the first round of divergence of the common ancestor of Salmoninae, which further evolution resulted in the successive origin of Hucho (including Parahucho as subgenus), Salvelinus, Salmo and Oncorhynchus (e.g. Smith & Stearley, 1989; Phillips & Pleyte, 1991). This evolutionary hypothesis is based on morphological data and assumes the primary freshwater origin of Salmoninae. However, recent karyological and biochemical data do not support this hypothesis. The freshwater genera Brachymystax and Hucho are very similar and their ancestral forms diverged after the phyletic line of anadromous Parahucho has arisen (Anbinder et al., 1982; Viktorovsky et al., 1985; Osinov, 1991). In the present study, the evolutionary and taxonomic relationships among 11 taxa representing five genera of Salmoninae (Brachymystax, Hucho, Parahucho, Salvelinus and Oncorhynchus) were determined using mitochondrial DNA 815 0022–1112/96/110815+15 $25.00/0 ? 1996 The Fisheries Society of the British Isles
-
Upload
independent -
Category
Documents
-
view
2 -
download
0
Transcript of Evolutionary and taxonomic relationships among Far-Eastern salmonid fishes inferred from...
Journal of Fish Biology (1996) 49, 815–829
Evolutionary and taxonomic relationships amongFar-Eastern salmonid fishes inferred from mitochondrial
DNA divergence
S. V. S’*, L. K. G*, I. Z. P† A. V. E*
*Institute of Biology and Soil Sciences, Vladivostok 690022, Russia and†Pacific Research Institute of Fisheries and Oceanography, Vladivostok 690600, Russia
(Received 30 August 1995, Accepted 14 April 1996)
Mitochondrial DNA (mtDNA) restriction analysis was used to examine the evolutionaryand taxonomic relationships among 11 taxa of the subfamily Salmoninae. The generaBrachymystax and Hucho were closely related, diverging by sequence divergence estimates of3·1%. Because the mtDNA sequence divergence between blunt- and sharp-snouted forms ofBrachymystax (2·24%) was similar to divergence level of Brachymystax and Hucho, then takinginto account the distinct morphological, ecological and allozyme differences between them, it ispossible to recognize these forms as two separate species. The subgenus Parahucho formed avery distinct group differing by 6·35–7·08% (sequence divergence estimate) from bothBrachymystax and Hucho and must be considered as a valid genus. The UPGMA andneighbour-joined phenograms showed that the five genera studied are divided into two maingroupings: (1) Hucho, Brachymystax and Salvelinus; and (2) Oncorhynchus and Parahuchospecies. The mtDNA sequence divergence estimates between these groupings were about 8·1%.However, the subsequent bootstrap analysis of mtDNA RFLP data did not support themonophyly of the latter grouping. The concordance of morphological and mtDNAphylogenetic patterns is discussed. ? 1996 The Fisheries Society of the British Isles
Key words: salmonid fishes; mitochondrial DNA; phylogeny.
INTRODUCTION
The taxonomy and evolutionary relationships of Asiatic salmonid genera(Brachymystax, Hucho and Parahucho) to other genera of the subfamilySalmoninae (Salmo, Salvelinus, Oncorhynchus) remains uncertain. Usually, afterTchernavin (1939) and Norden (1961), the genus Brachymystax is consideredas primitive and its origin is connected with the first round of divergence ofthe common ancestor of Salmoninae, which further evolution resulted in thesuccessive origin of Hucho (including Parahucho as subgenus), Salvelinus, Salmoand Oncorhynchus (e.g. Smith & Stearley, 1989; Phillips & Pleyte, 1991). Thisevolutionary hypothesis is based on morphological data and assumes theprimary freshwater origin of Salmoninae. However, recent karyological andbiochemical data do not support this hypothesis. The freshwater generaBrachymystax and Hucho are very similar and their ancestral forms divergedafter the phyletic line of anadromous Parahucho has arisen (Anbinder et al.,1982; Viktorovsky et al., 1985; Osinov, 1991).In the present study, the evolutionary and taxonomic relationships among 11
taxa representing five genera of Salmoninae (Brachymystax, Hucho, Parahucho,Salvelinus and Oncorhynchus) were determined using mitochondrial DNA
815
0022–1112/96/110815+15 $25.00/0 ? 1996 The Fisheries Society of the British Isles
(mtDNA) restriction analysis. Previous analyses of mtDNA variation within theSalmoninae subfamily have been restricted to comparisons of only a few speciesof two or three genera (e.g. Berg & Ferris, 1984; Gyllensten & Wilson, 1987;Ginatulina et al., 1988; Grewe et al., 1990; McVeigh & Davidson, 1991; Shedlocket al., 1992).
MATERIAL AND METHODS
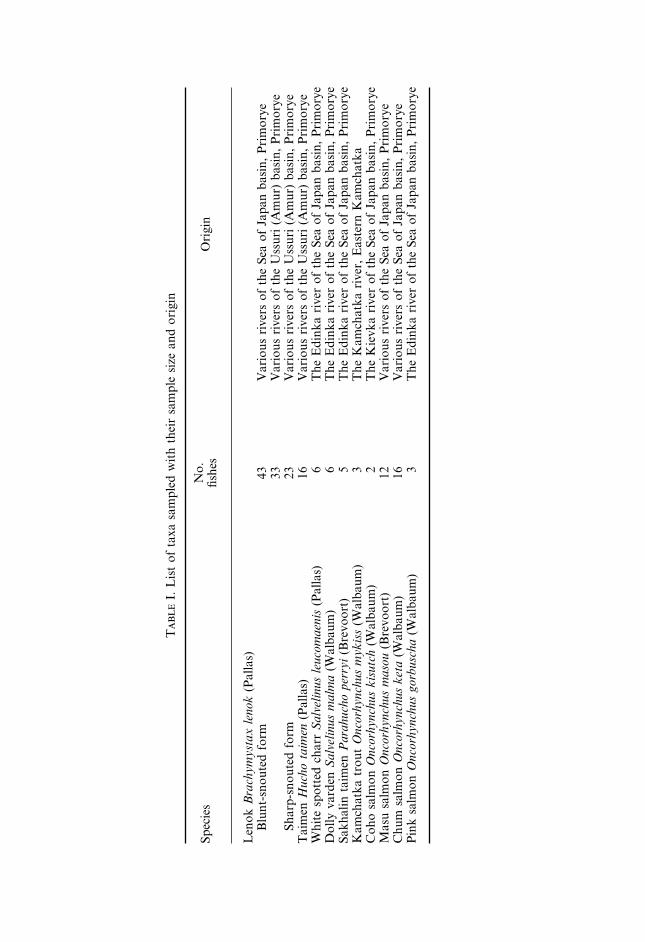
A total of 168 specimens representing 11 taxa were sampled (Table I). MitochondrialDNA was purified from liver by the alkaline extraction method (Palva & Palva, 1985).Aliquots of mtDNA were digested with one multihexameric (Hinc II) and 15 hexameric(Bam HI, Bgl I, Bgl II, Cfr 42I, Eco RI, Eco 32I, Eco 81I, Eco 91I, Eco 105I, Hind III,Nco I, Pvu II, Pst I, Sca I and Xba I) restriction enzymes in conditions recommended bythe supplier (Fermentas, Lithuania). Restriction fragments were separated on 0·6–1·2%agarose gels and visualized by UV radiation after ethidium bromide staining. Fragmentswere sized by comparison with 1-kilobase ladder standard (Bethesda Research Labs). Noattempt to visualize fragments less than 400 base pairs (bp) was made. However, in somecases small fragments were detected by incomplete digestions.Because of the large number of taxa examined and the high mtDNA diversity
observed, it was not feasible to map all restriction sites. Therefore, further analysis waslimited to the fragments themselves. The mtDNA fragment data were already utilized forassessing evolutionary relationships among several species of Salmoninae (e.g. Berg &Ferris, 1984; Gyllensten & Wilson, 1987; Ginatulina et al., 1988). The results of thesestudies were almost completely concordant with those based on restriction site (Thomaset al., 1986) or sequence (Thomas & Beckenbach, 1989; McVeigh & Davidson, 1991;Shedlock et al., 1992) comparisons. Accordingly, we considered it justifiable to estimateevolutionary relationships using restriction fragment analysis in this work.Distinct single endonuclease patterns were designated by a specific letter in order of
appearance. Each fish was assigned a multiletter code which described its compositemtDNA genotype. The composite data were also summarized in a presence/absencematrix of all mtDNA fragments, which was then employed to compute p (the averagenumber of substitutions per nucleotide site) between genotypes according to Nei & Li(1979). The resulting distance matrix was used to construct a phenogram using bothconstant (UPGMA; Sokal & Sneath, 1963) and varying evolutionary rate [neighbour-joined method (NJ); Saitou & Nei, 1987; tree was routed by midpoint] clustering methodsin the NTSYS package (Rohlf, 1993).*The robustness of specific nodes of the resulting trees was then tested by the bootstrap
method (Felsenstein, 1985). Using an original Pascal computer program (written byS.V.S.), we resampled our data (all fragment patterns for each of 16 restriction enzymeshere, not individual fragments) to construct 100 fictional sets of data. Each of these wasconstructed by the iterative sampling of 16 restriction enzymes from an original set ofdata with replacement. For each fictional set of data we made a presence/absence matrixof all mtDNA fragments, which then was used for estimation of sequence divergencebetween fictional mtDNA genotypes and following construction of the UPGMA andNJ trees.
RESULTS
Fifteen of the 16 restriction endonucleases used produced polymorphicpatterns and resolved 57 fragments per mtDNA genotype on average. A total of29 composite genotypes was found among the 11 taxa examined (Table II,*The parsimony methods of reconstruction of phylogeny were not employed because of violation of the
requirement of independence characters—the gain or loss of a fragment (character) affects the presence ofother fragments produced by a particular restriction enzyme.
816 . . ’ .
T
I.Listoftaxasampledwiththeirsamplesizeandorigin
Species
No.
fishes
Origin
Lenok
Brachymystaxlenok(Pallas)
Blunt-snoutedform
43VariousriversoftheSeaofJapanbasin,Primorye
33VariousriversoftheUssuri(Amur)basin,Primorye
Sharp-snoutedform
23VariousriversoftheUssuri(Amur)basin,Primorye
TaimenHuchotaimen(Pallas)
16VariousriversoftheUssuri(Amur)basin,Primorye
WhitespottedcharrSalvelinusleucomaenis(Pallas)
6TheEdinkariveroftheSeaofJapanbasin,Primorye
DollyvardenSalvelinusmalma(Walbaum
)6
TheEdinkariveroftheSeaofJapanbasin,Primorye
SakhalintaimenParahuchoperryi(Brevoort)
5TheEdinkariveroftheSeaofJapanbasin,Primorye
Kamchatka
troutOncorhynchusmykiss(Walbaum
)3
TheKamchatka
river,EasternKamchatka
Cohosalmon
Oncorhynchuskisutch(Walbaum
)2
TheKievkariveroftheSeaofJapanbasin,Primorye
Masusalmon
Oncorhynchusmasou(Brevoort)
12VariousriversoftheSeaofJapanbasin,Primorye
Chumsalmon
Oncorhynchusketa(Walbaum
)16
VariousriversoftheSeaofJapanbasin,Primorye
Pinksalmon
Oncorhynchusgorbuscha(Walbaum
)3
TheEdinkariveroftheSeaofJapanbasin,Primorye
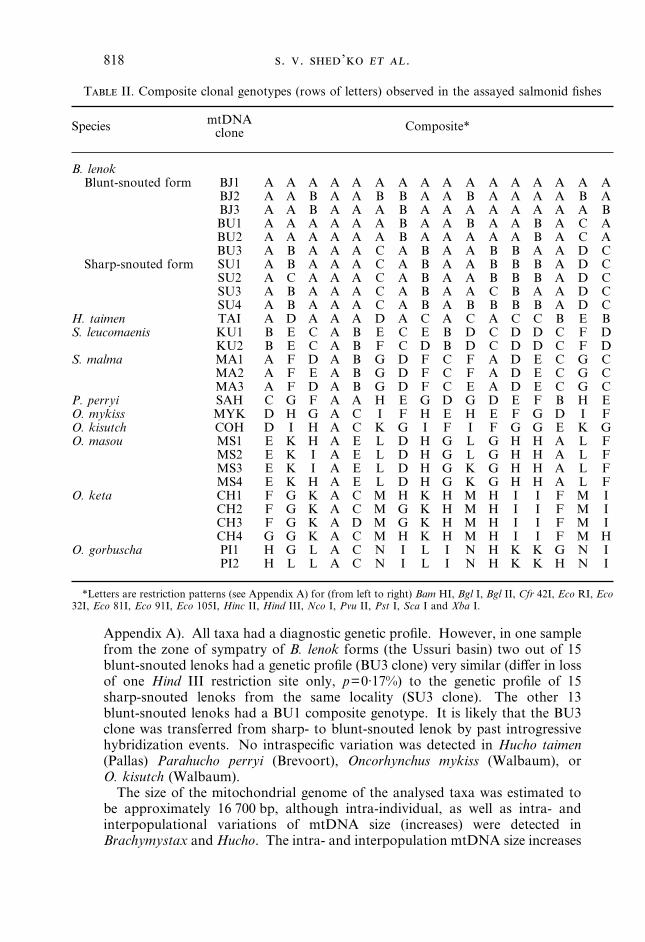
Appendix A). All taxa had a diagnostic genetic profile. However, in one samplefrom the zone of sympatry of B. lenok forms (the Ussuri basin) two out of 15blunt-snouted lenoks had a genetic profile (BU3 clone) very similar (differ in lossof one Hind III restriction site only, p=0·17%) to the genetic profile of 15sharp-snouted lenoks from the same locality (SU3 clone). The other 13blunt-snouted lenoks had a BU1 composite genotype. It is likely that the BU3clone was transferred from sharp- to blunt-snouted lenok by past introgressivehybridization events. No intraspecific variation was detected in Hucho taimen(Pallas) Parahucho perryi (Brevoort), Oncorhynchus mykiss (Walbaum), orO. kisutch (Walbaum).The size of the mitochondrial genome of the analysed taxa was estimated to
be approximately 16 700 bp, although intra-individual, as well as intra- andinterpopulational variations of mtDNA size (increases) were detected inBrachymystax andHucho. The intra- and interpopulation mtDNA size increases
T II. Composite clonal genotypes (rows of letters) observed in the assayed salmonid fishes
Species mtDNAclone Composite*
B. lenokBlunt-snouted form BJ1 A A A A A A A A A A A A A A A A
BJ2 A A B A A B B A A B A A A A B ABJ3 A A B A A A B A A A A A A A A BBU1 A A A A A A B A A B A A B A C ABU2 A A A A A A B A A A A A B A C ABU3 A B A A A C A B A A B B A A D C
Sharp-snouted form SU1 A B A A A C A B A A B B B A D CSU2 A C A A A C A B A A B B B A D CSU3 A B A A A C A B A A C B A A D CSU4 A B A A A C A B A B B B B A D C
H. taimen TAI A D A A A D A C A C A C C B E BS. leucomaenis KU1 B E C A B E C E B D C D D C F D
KU2 B E C A B F C D B D C D D C F DS. malma MA1 A F D A B G D F C F A D E C G C
MA2 A F E A B G D F C F A D E C G CMA3 A F D A B G D F C E A D E C G C
P. perryi SAH C G F A A H E G D G D E F B H EO. mykiss MYK D H G A C I F H E H E F G D I FO. kisutch COH D I H A C K G I F I F G G E K GO. masou MS1 E K H A E L D H G L G H H A L F
MS2 E K I A E L D H G L G H H A L FMS3 E K I A E L D H G K G H H A L FMS4 E K H A E L D H G K G H H A L F
O. keta CH1 F G K A C M H K H M H I I F M ICH2 F G K A C M G K H M H I I F M ICH3 F G K A D M G K H M H I I F M ICH4 G G K A C M H K H M H I I F M H
O. gorbuscha PI1 H G L A C N I L I N H K K G N IPI2 H L L A C N I L I N H K K H N I
*Letters are restriction patterns (see Appendix A) for (from left to right) Bam HI, Bgl I, Bgl II, Cfr 42I, Eco RI, Eco32I, Eco 81I, Eco 91I, Eco 105I, Hinc II, Hind III, Nco I, Pvu II, Pst I, Sca I and Xba I.
818 . . ’ .
ranged from 60 to 180 bp and from 60 to 300 bp, respectively (the details of theanalysis of these data will be presented elsewhere).Averaged mtDNA differences among taxa were highly variable (Table III).
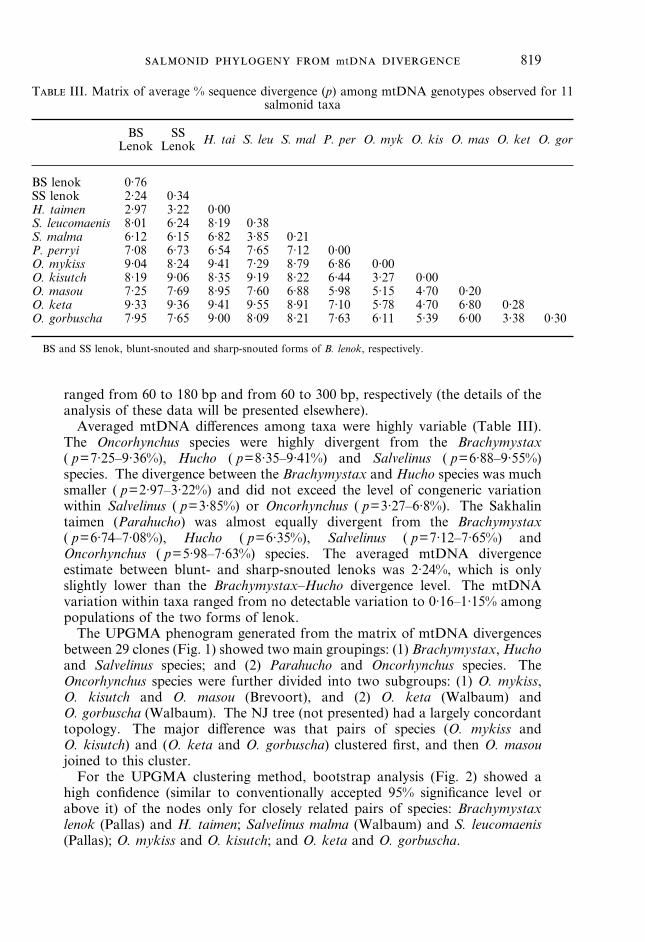
The Oncorhynchus species were highly divergent from the Brachymystax( p=7·25–9·36%), Hucho ( p=8·35–9·41%) and Salvelinus ( p=6·88–9·55%)species. The divergence between the Brachymystax and Hucho species was muchsmaller ( p=2·97–3·22%) and did not exceed the level of congeneric variationwithin Salvelinus ( p=3·85%) or Oncorhynchus ( p=3·27–6·8%). The Sakhalintaimen (Parahucho) was almost equally divergent from the Brachymystax( p=6·74–7·08%), Hucho ( p=6·35%), Salvelinus ( p=7·12–7·65%) andOncorhynchus ( p=5·98–7·63%) species. The averaged mtDNA divergenceestimate between blunt- and sharp-snouted lenoks was 2·24%, which is onlyslightly lower than the Brachymystax–Hucho divergence level. The mtDNAvariation within taxa ranged from no detectable variation to 0·16–1·15% amongpopulations of the two forms of lenok.The UPGMA phenogram generated from the matrix of mtDNA divergences
between 29 clones (Fig. 1) showed two main groupings: (1) Brachymystax,Huchoand Salvelinus species; and (2) Parahucho and Oncorhynchus species. TheOncorhynchus species were further divided into two subgroups: (1) O. mykiss,O. kisutch and O. masou (Brevoort), and (2) O. keta (Walbaum) andO. gorbuscha (Walbaum). The NJ tree (not presented) had a largely concordanttopology. The major difference was that pairs of species (O. mykiss andO. kisutch) and (O. keta and O. gorbuscha) clustered first, and then O. masoujoined to this cluster.For the UPGMA clustering method, bootstrap analysis (Fig. 2) showed a
high confidence (similar to conventionally accepted 95% significance level orabove it) of the nodes only for closely related pairs of species: Brachymystaxlenok (Pallas) and H. taimen; Salvelinus malma (Walbaum) and S. leucomaenis(Pallas); O. mykiss and O. kisutch; and O. keta and O. gorbuscha.
T III. Matrix of average % sequence divergence (p) among mtDNA genotypes observed for 11salmonid taxa
BSLenok
SSLenok H. tai S. leu S. mal P. per O. myk O. kis O. mas O. ket O. gor
BS lenok 0·76SS lenok 2·24 0·34H. taimen 2·97 3·22 0·00S. leucomaenis 8·01 6·24 8·19 0·38S. malma 6·12 6·15 6·82 3·85 0·21P. perryi 7·08 6·73 6·54 7·65 7·12 0·00O. mykiss 9·04 8·24 9·41 7·29 8·79 6·86 0·00O. kisutch 8·19 9·06 8·35 9·19 8·22 6·44 3·27 0·00O. masou 7·25 7·69 8·95 7·60 6·88 5·98 5·15 4·70 0·20O. keta 9·33 9·36 9·41 9·55 8·91 7·10 5·78 4·70 6·80 0·28O. gorbuscha 7·95 7·65 9·00 8·09 8·21 7·63 6·11 5·39 6·00 3·38 0·30
BS and SS lenok, blunt-snouted and sharp-snouted forms of B. lenok, respectively.
mt 819

When applying the NJ tree-making algorithm, Brachymystax, Hucho andSalvelinus formed a distinct cluster in 97% of the bootstrap repeats. On thecontrary, the grouping of Parahucho and Oncorhynchus was inconstant—thisgroup occurred only 56 times out of 100 replicates. For the Oncorhynchusspecies an unresolved trichotomy was observed, which included the following
0.010.0Sequence divergence (%)
2.55.07.5
BJ1BJ3BU1BU2BJ2BU3SU3
KU1
MA1
MYKCOHMS1
CH1
PI1
SU1SU2SU4TA1
MA2MA3SAH
MS2MS3MS4
CH2CH3CH4
PI2
KU2
F. 1. UPGMA dendrogram summarizing sequence divergences among 29 composite mtDNA genotypesdetected in 11 taxa of salmonid fishes (Table II, III).
B. lenok
H. taimen
S. leucomaenis
S. malma
P. perryi
O. masou
O. mykiss
O. kisutch
O. keta
O. gorbuscha
98
97
90
56
9395
92
67
100
68
88
54
62
63
99
100
F. 2. 50% majority-rule consensus trees produced by bootstrap procedure when applying UPGMA(left) and NJ (right) clustering methods. Numbers at nodes are percentages of 100 bootstrappedreplication in which the group projecting from each node appeared monophyletic. For simplicityof presentation, details of intraspecific branchings are omitted.
820 . . ’ .
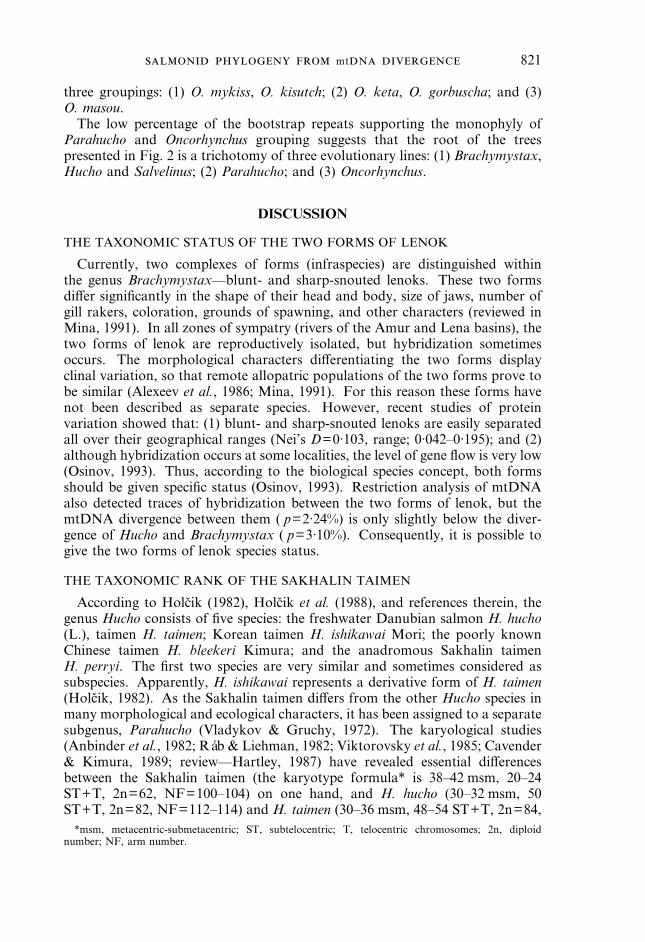
three groupings: (1) O. mykiss, O. kisutch; (2) O. keta, O. gorbuscha; and (3)O. masou.The low percentage of the bootstrap repeats supporting the monophyly of
Parahucho and Oncorhynchus grouping suggests that the root of the treespresented in Fig. 2 is a trichotomy of three evolutionary lines: (1) Brachymystax,Hucho and Salvelinus; (2) Parahucho; and (3) Oncorhynchus.
DISCUSSION
THE TAXONOMIC STATUS OF THE TWO FORMS OF LENOK
Currently, two complexes of forms (infraspecies) are distinguished withinthe genus Brachymystax—blunt- and sharp-snouted lenoks. These two formsdiffer significantly in the shape of their head and body, size of jaws, number ofgill rakers, coloration, grounds of spawning, and other characters (reviewed inMina, 1991). In all zones of sympatry (rivers of the Amur and Lena basins), thetwo forms of lenok are reproductively isolated, but hybridization sometimesoccurs. The morphological characters differentiating the two forms displayclinal variation, so that remote allopatric populations of the two forms prove tobe similar (Alexeev et al., 1986; Mina, 1991). For this reason these forms havenot been described as separate species. However, recent studies of proteinvariation showed that: (1) blunt- and sharp-snouted lenoks are easily separatedall over their geographical ranges (Nei’s D=0·103, range; 0·042–0·195); and (2)although hybridization occurs at some localities, the level of gene flow is very low(Osinov, 1993). Thus, according to the biological species concept, both formsshould be given specific status (Osinov, 1993). Restriction analysis of mtDNAalso detected traces of hybridization between the two forms of lenok, but themtDNA divergence between them ( p=2·24%) is only slightly below the diver-gence of Hucho and Brachymystax ( p=3·10%). Consequently, it is possible togive the two forms of lenok species status.
THE TAXONOMIC RANK OF THE SAKHALIN TAIMEN
According to Holcik (1982), Holcik et al. (1988), and references therein, thegenus Hucho consists of five species: the freshwater Danubian salmon H. hucho(L.), taimen H. taimen; Korean taimen H. ishikawai Mori; the poorly knownChinese taimen H. bleekeri Kimura; and the anadromous Sakhalin taimenH. perryi. The first two species are very similar and sometimes considered assubspecies. Apparently, H. ishikawai represents a derivative form of H. taimen(Holcik, 1982). As the Sakhalin taimen differs from the other Hucho species inmany morphological and ecological characters, it has been assigned to a separatesubgenus, Parahucho (Vladykov & Gruchy, 1972). The karyological studies(Anbinder et al., 1982; Ráb & Liehman, 1982; Viktorovsky et al., 1985; Cavender& Kimura, 1989; review—Hartley, 1987) have revealed essential differencesbetween the Sakhalin taimen (the karyotype formula* is 38–42 msm, 20–24ST+T, 2n=62, NF=100–104) on one hand, and H. hucho (30–32 msm, 50ST+T, 2n=82, NF=112–114) and H. taimen (30–36 msm, 48–54 ST+T, 2n=84,*msm, metacentric-submetacentric; ST, subtelocentric; T, telocentric chromosomes; 2n, diploid
number; NF, arm number.
mt 821

NF=114–120) on the other. The last two species are more similar to B. lenok(26–32 msm, 60–64 ST+T, 2n=90–92, NF=116–124), whereas the karyotype ofthe Sakhalin taimen is very similar to that found in some species of Pacific troutsespecially the Yellowstone cutthroat trout O. clarki bouvieri Behnke (40 msm,24 ST+T, 2n=64, NF=104). Based on these data, it has been suggested thatthe monotypic subgenus Parahucho should be raised to generic status (Anbinderet al., 1982; Viktorovsky et al., 1985). The recent electrophoretic data on proteinvariation in lenok, taimen and Sakhalin taimen have confirmed this opinion.The genetic divergence between taimen and lenoks (Nei’s D=0·335&0·107)is much lower than that between taimen and Sakhalin taimen (Nei’sD=0·755&0·179) (Osinov, 1991). According to the mtDNA data, H. taimenis also more similar to B. lenok ( p=3·10%) than to the Sakhalin taimen( p=6·78%), thus supporting the separation of the Sakhalin taimen into a distinctgenus.
MITOCHONDRIAL DNA V. MORPHOLOGICAL PHYLOGENY OFSALMONINAE
By tradition, the evolution of Salmoninae is viewed as successive offshoots ofthe genera Brachymystax, Hucho, Salvelinus, Salmo and Oncorhynchus from acommon stem (Tchernavin, 1939; Norden, 1961). Accordingly, the freshwaterBrachymystax was considered as the oldest and most primitive genus, whereasthe anadromous Oncorhynchus was viewed as the youngest and most advancedgenus.The mtDNA distance data do not support this view of Salmoninae evolution.
The intergeneric mtDNA divergence between freshwater Brachymystax andHucho (Table III) is the lowest one found here, and these two genera mustbe considered as the youngest. In contrast, the genera including mainlyanadromous species (Oncorhynchus, Salmo, Parahucho and Salvelinus) are muchmore divergent from each other (Table III; Berg & Ferris, 1984; Gyllensten &Wilson, 1987; Ginatulina et al., 1988; Grewe et al., 1990; McVeigh & Davidson,1991; Shedlock et al., 1992) and they should be considered as the ancientlineages. The fossil evidence suggests that Pacific salmons and trouts, taimenssimilar to Parahucho, and charrs could be as old as the late Miocene (reviews:Tomoda et al., 1977; Smith, 1981; Cavallo & Gaudant, 1987). On the contrary,the application of the 1–1·5% sequence divergence per million year molecularclock for salmonid mtDNA (Shed’ko, 1991), would suggest that the ancestralforms of Brachymystax and Hucho diverged only about 2–3 million years ago,during the late Pliocene–early Pleistocene period. The similar divergence timebetween Brachymystax and Hucho was calculated using the allozymemolecular clock (approximately 1–2 million years ago; Osinov, 1991).With respect to mtDNA data, both Brachymystax and Hucho are not the most
divergent taxa among Salmoninae (Table III; Grewe et al., 1990). According tomorphological trees (e.g. Norden, 1961; Smith & Stearley, 1989) Brachymystaxand Hucho are outgroups for all the other Salmoninae genera, whereas in thepresent trees they cluster with Salvelinus and this grouping occurred in 68–97%of the bootstrap repeats (Figs 1, 2). It should be noted, however, that these treesestimate the matriarchal genealogy of mtDNA, which is inherited as a block ofgenes without recombination. The topology of the given trees can differ from the
822 . . ’ .
species tree due to: (1) the sampling errors when estimating the geneticdivergence and the stochastic errors in the accumulation of substitution in DNA(Nei, 1987); (2) stochastic sorting of mtDNA lineages to daughter populationsfrom a polymorphic ancestral population (Neigel & Avise, 1986; Pamilo & Nei,1988); and (3) introgressive hybridization (e.g. Ferris et al., 1983). In addition,owing to the specific character of raw data (see footnote in Material andMethods) and absence of a correct outgroup (Coregonus or Thymallus species),we could not use the more powerful phylogenetic methods (e.g. parsimonyanalysis; Hillis et al., 1994). Therefore, it becomes difficult to say whether theobserved phenogram (Fig. 1) represents a significant challenge to the view thatthe freshwater Brachymystax and Hucho are outgroups for all the anadromousgenera of Salmoninae. To solve this contradiction, the phylogenetic trees ofmany independently transmitted genes, produced by the various tree-makingmethods (distance, parsimony, or maximum likelihood) must be compared.
The authors wish to thank I. L. Miroshnichenko and G. I. Nemkova for technicalassistance, Dr A. N. Nilsson for editing and two anonymous reviewers for theircomments on earlier drafts of the manuscript. The study was financed by the RussianFoundation of Fundamental Investigations Grant N 94-04-11381-a, the Russian StateProgram Frontiers in Genetics Grant N 4.302, and the International Science FoundationGrants to L.K.G. and S.V.S.
References
Alexeev, S. S., Mina, M. V. & Kondrashov, A. S. (1986). Parallel clines as a result ofcounter current dispersion and character displacement with the special reference tothe genus Brachymystax (Salmoniformes, Salmonidae). Zooogichesky Zhurnal 65,227–234 (In Russian, English summary).
Anbinder, E. M., Glubokovsky, M. K. & Pokozy, N. V. (1982). Karyotype of thesakhalin trout Hucho perryi. Biologiya Morya 8, 59–60 (In Russian, Englishsummary).
Berg, W. J. & Ferris, S. D. (1984). Restriction endonuclease analysis of salmonidmitochondrial DNA. Canadian Journal of Fisheries and Aquatic Sciences 41,1041–1047.
Cavallo, O. & Gaudant, J. (1987). Complementary observations on the fish-fauna of theMessinian marls from Cherasco (Piedmont): geodynamic implications. Bollettinodella Societá Paleontologica Italiana 26, 177–198 (In French, English summary).
Cavender, T. M. & Kimura, S. (1989). Cytotaxonomy and interrelationships of Pacificbasin Salvelinus. Physiology and Ecology of Japan, Special Volume 1, 49–68.
Felsenstein, J. (1985). Confidence limits on phylogenies: an approach using thebootstrap. Evolution 39, 783–791.
Ferris, S. D., Sage, R. D., Huang, C.-M., Nielsen, J. T., Ritte, U. & Wilson, A. C. (1983).Flow of mitochondrial DNA across a species boundary. Proceedings of theNational Academy of Sciences of the U.S.A. 80, 2290–2294.
Ginatulina, L. K., Shed’ko, S. V., Miroshnichenko, I. L. & Ginatulin, A. A. (1988).Sequence divergence in mitochondrial DNA from the Pacific salmons. ZhurnalEvolyutsionnoi Biokhimii i Fiziologii 24, 477–483 (In Russian, English summary).
Grewe, P. M., Billington, N. & Hebert, P. D. N. (1990). Phylogenetic relationshipsamong members of Salvelinus inferred from mitochondrial DNA divergence.Canadian Journal of Fisheries and Aquatic Sciences 47, 984–991.
Gyllensten, U. B. & Wilson, A. C. (1987). Mitochondrial DNA of salmonids: inter- andintraspecific variability detected with restriction enzymes. In Population Geneticsand Fishery Management (Ryman, N. & Utter, F., eds), pp. 301–317. Seattle:University of Washington Press.
mt 823
Hartley, S. (1987). The chromosomes of salmonid fishes. Biological Reviews 62,197–414.
Hillis, D. M., Huelsenbeck, J. P. & Cunningham, C. W. (1994). Application andaccuracy of molecular phylogenies. Science 264, 671–677.
Holcik, J. (1982). Review and evolution of Hucho (Salmonidae). Acta ScientiarumNaturalium Brno 16, 1–29.
Holcik, J., Hensel, K., Nieslanik, J. & Skácel, L. (1988). The Eurasian Huchen, Huchohucho, Largest Salmon of the World. Dordrecht, The Netherlands: Dr W. JunkPublishers.
McVeigh, H. P. & Davidson, W. S. (1991). A salmonid phylogeny inferred frommitochondrial cytochrome b gene sequences. Journal of Fish Biology 39 (Suppl.A), 277–282.
Mina, M. V. (1991). Microevolution of fishes: evolutionary aspects of phenetic diversity(Kohli, I., trans., & Kothekar, V. S., eds) Russian translation series 79.Rotterdam: Balkema.
Nei, M. & Li, W.-H. (1979). Mathematical model for studying genetic variation in termsof restriction endonucleases. Proceedings of the National Academy of Sciences ofthe U.S.A. 76, 5269–5273.
Nei, M. (1987). Molecular Evolutionary Genetics. New York: Columbia UniversityPress.
Neigel, J. E. & Avise, J. C. (1986). Phylogenetic relationships of mitochondrial DNAunder various demographic models of speciation. In Evolutionary Processes andTheory (Nevo, E. & Karlin, S., eds), pp. 515–534. New York: Academic Press.
Norden, C. R. (1961). Comparative osteology of representative salmonid fishes, withparticular reference to the grayling (Thymallus arcticus) and its phylogeny. Journalof Fisheries Research Board Canada 18, 679–791.
Osinov, A. G. (1991). Genetic divergence and phylogenetical relationships betweenlenoks of genus Brachymystax and huchens of genera Hucho and Parahucho.Genetica 27, 2127–2136 (In Russian, English summary).
Osinov, A. G. (1993). Counter current dispersion, secondary contact and speciation inlenoks of the genus Brachymystax. Genetica 29, 654–669 (In Russian, Englishsummary).
Palva, T. K. & Palva, E. T. (1985). Rapid isolation of animal mitochondrial DNA byalkaline extraction. FEBS Letters 192, 267–270.
Pamilo, P. & Nei, M. (1988). Relationships between gene trees and species trees.Molecular Biology and Evolution 5, 568–583.
Phillips, R. B. & Pleyte, K. A. (1991). Nuclear DNA and salmonid phylogenetics.Journal of Fish Biology 39 (Suppl. A), 259–275.
Ráb, P. & Liehman, P. (1982). Chromosome study of Danube salmon Hucho hucho(Linnaeus, 1758) (Pisces; Salmonidae). Folia Zoologica 31, 181–190.
Rohlf, F. J. (1993). NTSYS-pc: Numerical Taxonomy and Multivariate Analysis System.Version 1.70. New York: Exeter Publishing.
Saitou, N. & Nei, M. (1987). The neighbor-joining method: a new method forreconstructing phylogenetic trees. Molecular Biology and Evolution 4, 406–425.
Shed’ko, S. V. (1991). Rate of mitochondrial DNA evolution in salmonid fishes. ZhurnalEvolyutsionnoi Biokhimii i Fiziologii 27, 249–254 (In Russian).
Shedlock, A. M., Parker, J. D., Crispin, D. A., Pietsch, T. W. & Burmer, G. C. (1992).Evolution of the salmonid mitochondrial control region. Molecular Phylogeneticsand Evolution 1, 179–192.
Smith, G. R. (1981). Late Cenozoic freshwater fishes of North America. Annual Reviewof Ecology and Systematics 12, 163–193.
Smith, G. R. & Stearley, R. F. (1989). The classification and scientific names of rainbowand cutthroat trouts. Fisheries 14, 4–10.
Sokal, R. R. & Sneath, P. H. A. (1963). Principles of Numerical Taxonomy. SanFrancisco: W. H. Freeman.
Tchernavin, V. (1939). The origin of salmon. Salmon Trout Magazine 95, 120–140.
824 . . ’ .

Thomas, W. K. & Beckenbach, A. T. (1989). Variation in salmonid mitochondrial DNA:Evolutionary constraints and mechanisms of substitution. Journal of MolecularEvolution 29, 233–245.
Thomas, W. K., Withler, R. E. & Beckenbach, A. T. (1986). Mitochondrial DNAanalysis of Pacific salmonid evolution. Canadian Journal of Zoology 64, 1058–1064.
Tomoda, Y., Kodera, H., Nakajima, T. & Yasuno, T. (1977). Fossil freshwater fishesfrom Japan. The Memoirs of the Geological Society of Japan 14, 221–243 (InJapanese, English summary).
Viktorovsky, R. M., Makoedov, A. N. & Shevchishin, A. A. (1985). The chromosomalsets of Brachymystax lenok and Hucho taimen and the divergence of the salmonidgenera. Tsitologiya 27, 703–709 (In Russian, English summary).
Vladykov, V. D. & Gruchy, C. D. (1972). Comments on the nomenclature of somesubgenera of Salmonidae. Journal of Fisheries Research Board Canada 29,1631–1632.
mt 825
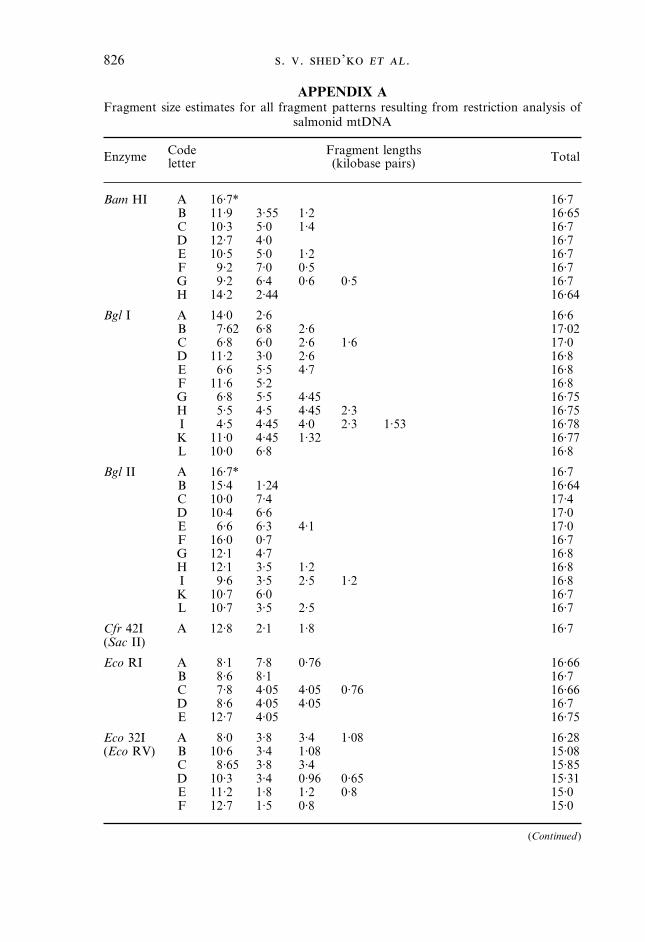
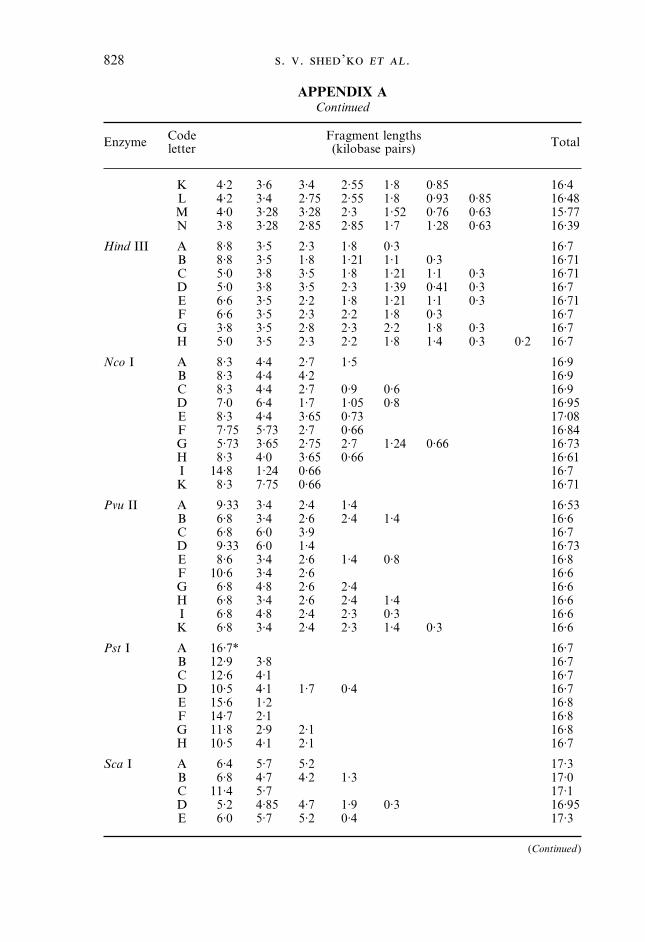
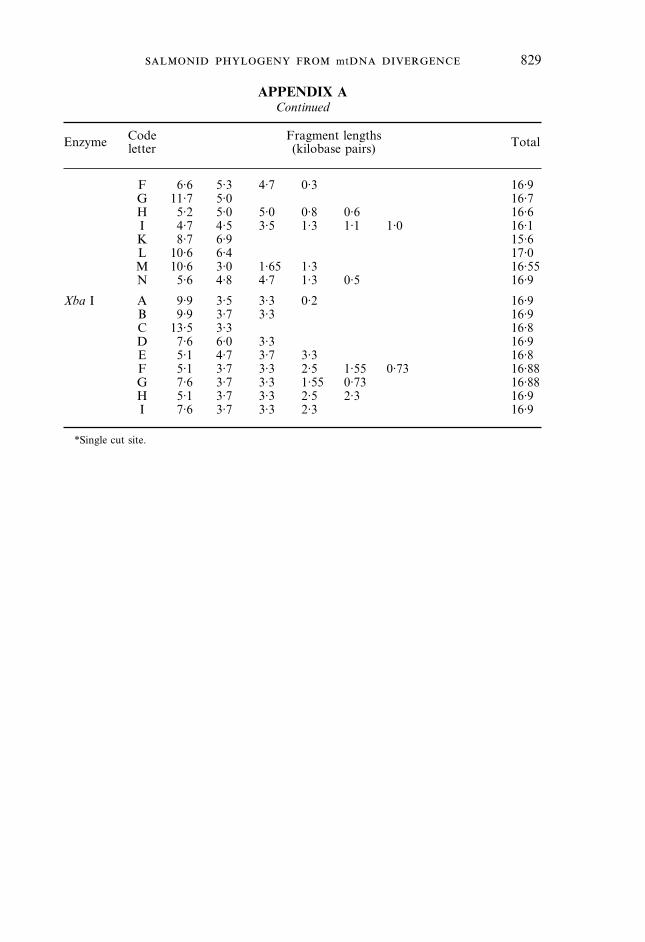
APPENDIX AFragment size estimates for all fragment patterns resulting from restriction analysis of
salmonid mtDNA
Enzyme Codeletter
Fragment lengths(kilobase pairs) Total
Bam HI A 16·7* 16·7B 11·9 3·55 1·2 16·65C 10·3 5·0 1·4 16·7D 12·7 4·0 16·7E 10·5 5·0 1·2 16·7F 9·2 7·0 0·5 16·7G 9·2 6·4 0·6 0·5 16·7H 14·2 2·44 16·64
Bgl I A 14·0 2·6 16·6B 7·62 6·8 2·6 17·02C 6·8 6·0 2·6 1·6 17·0D 11·2 3·0 2·6 16·8E 6·6 5·5 4·7 16·8F 11·6 5·2 16·8G 6·8 5·5 4·45 16·75H 5·5 4·5 4·45 2·3 16·75I 4·5 4·45 4·0 2·3 1·53 16·78K 11·0 4·45 1·32 16·77L 10·0 6·8 16·8
Bgl II A 16·7* 16·7B 15·4 1·24 16·64C 10·0 7·4 17·4D 10·4 6·6 17·0E 6·6 6·3 4·1 17·0F 16·0 0·7 16·7G 12·1 4·7 16·8H 12·1 3·5 1·2 16·8I 9·6 3·5 2·5 1·2 16·8K 10·7 6·0 16·7L 10·7 3·5 2·5 16·7
Cfr 42I A 12·8 2·1 1·8 16·7(Sac II)
Eco RI A 8·1 7·8 0·76 16·66B 8·6 8·1 16·7C 7·8 4·05 4·05 0·76 16·66D 8·6 4·05 4·05 16·7E 12·7 4·05 16·75
Eco 32I A 8·0 3·8 3·4 1·08 16·28(Eco RV) B 10·6 3·4 1·08 15·08
C 8·65 3·8 3·4 15·85D 10·3 3·4 0·96 0·65 15·31E 11·2 1·8 1·2 0·8 15·0F 12·7 1·5 0·8 15·0
(Continued)
826 . . ’ .
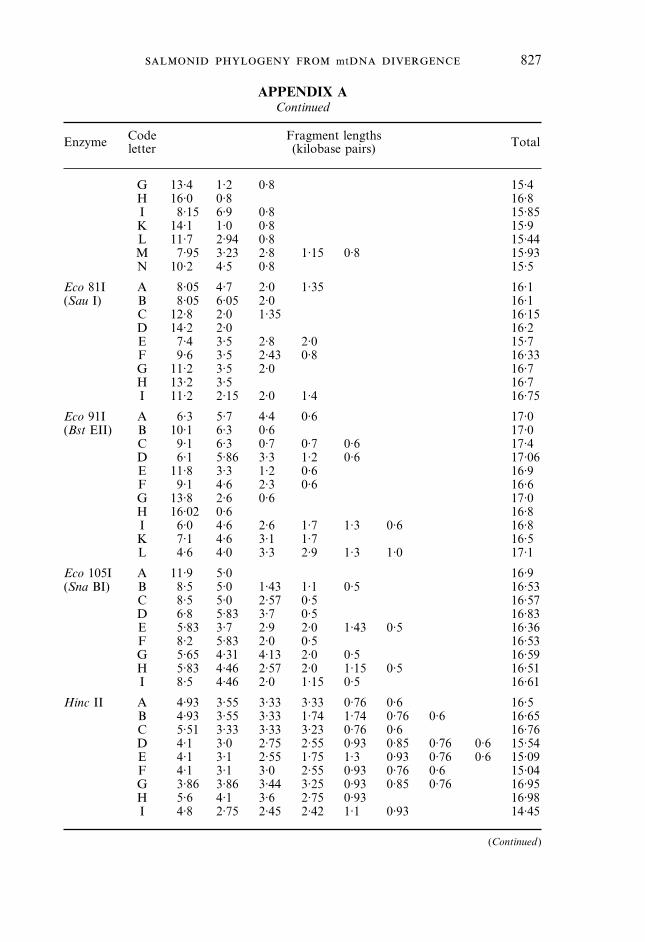
APPENDIX AContinued
Enzyme Codeletter
Fragment lengths(kilobase pairs) Total
G 13·4 1·2 0·8 15·4H 16·0 0·8 16·8I 8·15 6·9 0·8 15·85K 14·1 1·0 0·8 15·9L 11·7 2·94 0·8 15·44M 7·95 3·23 2·8 1·15 0·8 15·93N 10·2 4·5 0·8 15·5
Eco 81I A 8·05 4·7 2·0 1·35 16·1(Sau I) B 8·05 6·05 2·0 16·1
C 12·8 2·0 1·35 16·15D 14·2 2·0 16·2E 7·4 3·5 2·8 2·0 15·7F 9·6 3·5 2·43 0·8 16·33G 11·2 3·5 2·0 16·7H 13·2 3·5 16·7I 11·2 2·15 2·0 1·4 16·75
Eco 91I A 6·3 5·7 4·4 0·6 17·0(Bst EII) B 10·1 6·3 0·6 17·0
C 9·1 6·3 0·7 0·7 0·6 17·4D 6·1 5·86 3·3 1·2 0·6 17·06E 11·8 3·3 1·2 0·6 16·9F 9·1 4·6 2·3 0·6 16·6G 13·8 2·6 0·6 17·0H 16·02 0·6 16·8I 6·0 4·6 2·6 1·7 1·3 0·6 16·8K 7·1 4·6 3·1 1·7 16·5L 4·6 4·0 3·3 2·9 1·3 1·0 17·1
Eco 105I A 11·9 5·0 16·9(Sna BI) B 8·5 5·0 1·43 1·1 0·5 16·53
C 8·5 5·0 2·57 0·5 16·57D 6·8 5·83 3·7 0·5 16·83E 5·83 3·7 2·9 2·0 1·43 0·5 16·36F 8·2 5·83 2·0 0·5 16·53G 5·65 4·31 4·13 2·0 0·5 16·59H 5·83 4·46 2·57 2·0 1·15 0·5 16·51I 8·5 4·46 2·0 1·15 0·5 16·61
Hinc II A 4·93 3·55 3·33 3·33 0·76 0·6 16·5B 4·93 3·55 3·33 1·74 1·74 0·76 0·6 16·65C 5·51 3·33 3·33 3·23 0·76 0·6 16·76D 4·1 3·0 2·75 2·55 0·93 0·85 0·76 0·6 15·54E 4·1 3·1 2·55 1·75 1·3 0·93 0·76 0·6 15·09F 4·1 3·1 3·0 2·55 0·93 0·76 0·6 15·04G 3·86 3·86 3·44 3·25 0·93 0·85 0·76 16·95H 5·6 4·1 3·6 2·75 0·93 16·98I 4·8 2·75 2·45 2·42 1·1 0·93 14·45
(Continued)
mt 827
APPENDIX AContinued
Enzyme Codeletter
Fragment lengths(kilobase pairs) Total
K 4·2 3·6 3·4 2·55 1·8 0·85 16·4L 4·2 3·4 2·75 2·55 1·8 0·93 0·85 16·48M 4·0 3·28 3·28 2·3 1·52 0·76 0·63 15·77N 3·8 3·28 2·85 2·85 1·7 1·28 0·63 16·39
Hind III A 8·8 3·5 2·3 1·8 0·3 16·7B 8·8 3·5 1·8 1·21 1·1 0·3 16·71C 5·0 3·8 3·5 1·8 1·21 1·1 0·3 16·71D 5·0 3·8 3·5 2·3 1·39 0·41 0·3 16·7E 6·6 3·5 2·2 1·8 1·21 1·1 0·3 16·71F 6·6 3·5 2·3 2·2 1·8 0·3 16·7G 3·8 3·5 2·8 2·3 2·2 1·8 0·3 16·7H 5·0 3·5 2·3 2·2 1·8 1·4 0·3 0·2 16·7
Nco I A 8·3 4·4 2·7 1·5 16·9B 8·3 4·4 4·2 16·9C 8·3 4·4 2·7 0·9 0·6 16·9D 7·0 6·4 1·7 1·05 0·8 16·95E 8·3 4·4 3·65 0·73 17·08F 7·75 5·73 2·7 0·66 16·84G 5·73 3·65 2·75 2·7 1·24 0·66 16·73H 8·3 4·0 3·65 0·66 16·61I 14·8 1·24 0·66 16·7K 8·3 7·75 0·66 16·71
Pvu II A 9·33 3·4 2·4 1·4 16·53B 6·8 3·4 2·6 2·4 1·4 16·6C 6·8 6·0 3·9 16·7D 9·33 6·0 1·4 16·73E 8·6 3·4 2·6 1·4 0·8 16·8F 10·6 3·4 2·6 16·6G 6·8 4·8 2·6 2·4 16·6H 6·8 3·4 2·6 2·4 1·4 16·6I 6·8 4·8 2·4 2·3 0·3 16·6K 6·8 3·4 2·4 2·3 1·4 0·3 16·6
Pst I A 16·7* 16·7B 12·9 3·8 16·7C 12·6 4·1 16·7D 10·5 4·1 1·7 0·4 16·7E 15·6 1·2 16·8F 14·7 2·1 16·8G 11·8 2·9 2·1 16·8H 10·5 4·1 2·1 16·7
Sca I A 6·4 5·7 5·2 17·3B 6·8 4·7 4·2 1·3 17·0C 11·4 5·7 17·1D 5·2 4·85 4·7 1·9 0·3 16·95E 6·0 5·7 5·2 0·4 17·3
(Continued)
828 . . ’ .
APPENDIX AContinued
Enzyme Codeletter
Fragment lengths(kilobase pairs) Total
F 6·6 5·3 4·7 0·3 16·9G 11·7 5·0 16·7H 5·2 5·0 5·0 0·8 0·6 16·6I 4·7 4·5 3·5 1·3 1·1 1·0 16·1K 8·7 6·9 15·6L 10·6 6·4 17·0M 10·6 3·0 1·65 1·3 16·55N 5·6 4·8 4·7 1·3 0·5 16·9
Xba I A 9·9 3·5 3·3 0·2 16·9B 9·9 3·7 3·3 16·9C 13·5 3·3 16·8D 7·6 6·0 3·3 16·9E 5·1 4·7 3·7 3·3 16·8F 5·1 3·7 3·3 2·5 1·55 0·73 16·88G 7·6 3·7 3·3 1·55 0·73 16·88H 5·1 3·7 3·3 2·5 2·3 16·9I 7·6 3·7 3·3 2·3 16·9
*Single cut site.
mt 829