Evolution of the chemical fingerprint of biomass burning organic ...
35
1 Evolution of the chemical fingerprint of biomass burning organic aerosol during aging Amelie Bertrand 1,2,* , Giulia Stefenelli 3 , Coty N. Jen 4 , Simone M. Pieber 3 , Emily A. Bruns 3 , Haiyan Ni 5 , Brice Temime-Roussel 1 , Jay G. Slowik 3 , Allen H. Goldstein 4 , Imad El Haddad 3 , Urs Baltensperger 3 , André S.H. Prévôt 3 , Henri Wortham 1 and Nicolas Marchand 1 5 1 Aix Marseille Univ, CNRS, LCE, Marseille France 2 Agence de l’environnement et de la Maîtrise de l’Energie, 20, avenue du Grésillé – BP 90406 49004 Angers cedex 01 France 3 Laboratory of Atmospheric Chemistry, Paul Scherrer Institute, 5232, Villigen, Switzerland 4 Department of Environmental Sciences, Policy, and Management, University of California at Berkeley, California, United 10 States 5 Key Lab of Aerosol Chemistry and Physics, State Key Laboratory of Loess and Quaternary Geology, Institute of Earth Environment, Chinese Academy of Sciences, Xi'an, China * Now at Laboratory of Atmospheric Chemistry, Paul Scherrer Institute, 5232, Villigen, Switzerland Correspondence to: Nicolas Marchand ([email protected]) 15 20 25
-
Upload
khangminh22 -
Category
Documents
-
view
3 -
download
0
Transcript of Evolution of the chemical fingerprint of biomass burning organic ...

1
Evolution of the chemical fingerprint of biomass burning organic
aerosol during aging
Amelie Bertrand1,2,*
, Giulia Stefenelli3, Coty N. Jen
4, Simone M. Pieber
3, Emily A. Bruns
3, Haiyan Ni
5,
Brice Temime-Roussel1, Jay G. Slowik
3, Allen H. Goldstein
4, Imad El Haddad
3, Urs Baltensperger
3,
André S.H. Prévôt3, Henri Wortham
1 and Nicolas Marchand
1 5
1Aix Marseille Univ, CNRS, LCE, Marseille France
2Agence de l’environnement et de la Maîtrise de l’Energie, 20, avenue du Grésillé – BP 90406 49004 Angers cedex 01
France 3Laboratory of Atmospheric Chemistry, Paul Scherrer Institute, 5232, Villigen, Switzerland
4Department of Environmental Sciences, Policy, and Management, University of California at Berkeley, California, United 10
States 5Key Lab of Aerosol Chemistry and Physics, State Key Laboratory of Loess and Quaternary Geology, Institute of Earth
Environment, Chinese Academy of Sciences, Xi'an, China *Now at Laboratory of Atmospheric Chemistry, Paul Scherrer Institute, 5232, Villigen, Switzerland
Correspondence to: Nicolas Marchand ([email protected]) 15
20
25

2
Abstract. A Thermal Desorption Aerosol Gas Chromatograph coupled to a High Resolution – Time of Flight – Aerosol
Mass Spectrometer (TAG-AMS) was connected to an atmospheric chamber for the molecular characterization of the
evolution of organic aerosol (OA) emitted by woodstoves appliances for residential heating. Two logwood stoves (old and
modern) and one pellet stove were operated under typical conditions. Emissions were aged during a time equivalent to 5 5
hours of atmospheric aging. 5 to 7 samples were collected and analyzed with TAG-AMS during each experiment. We detect
and quantify over 70 compounds, including levoglucosan and nitrocatechols. We calculate the emission factor (EF) of these
tracers in the primary emissions and highlight the influence of the combustion efficiency on these emissions. Smoldering
combustion contribute to higher EF and a more complex composition. We also demonstrate the effect of the atmospheric
aging on the chemical fingerprint. The tracers are sorted into 3 categories according to the evolution of their concentration: 10
primary compounds, non-conventional primary compounds, and secondary compounds. For each we provide a quantitative
overview of their contribution to the OA mass at different times of the photo-oxidative process.
15
20
25
30

3
1 Introduction
Organic matter represents a major fraction (20 – 90 %) of particulate matter (PM) (Kanakidou et al., 2005). Organic
PM is a complex mixture made up of tens of thousands of compounds (Goldstein and Galbally, 2007), with some of them
established to be carcinogenic (Yu, 2002; Yang et al., 2010). Identifying and quantifying their contribution to the organic
PM mass is key in order to resolve its origins and impacts on human health and climate. 5
Extensive characterization of the molecular composition of primary organic aerosol (POA) emissions has already
been conducted. For example, biomass burning emissions from both softwood and hardwood combustions (Simoneit et al.,
1993; (Fine et al., 2001; Fine et al., 2002; 2004; Nolte et al., 2001; Schauer et al., 2001; Schmidl et al., 2008), vehicular
emissions (Rogge et al. 1993; Rogge et al., 1993b; Fraser et al., 1999; Schauer et al., 2002; El Haddad et al., 2009), and
cooking emissions (Hildemann et al., 1991; Nolte et al., 1999; Schauer et al., 1999) have been broadly characterized. The 10
full characterization of these emissions and their contribution to the concentration of total organic aerosol (OA) is of
particular interest for source apportionment of ambient PM using molecular markers. In biomass burning emissions,
compounds derived from the pyrolysis of cellulose and lignin are often reported. These include levoglucosan, a sugar
anhydride compound and by-product of the thermal degradation of cellulose, and a commonly used tracer of the biomass
burning organic aerosol (BBOA) in source apportionment (Waked et al., 2014; Bonvalot et al., 2016; Maenhaut et al., 2016), 15
as well as methoxyphenols, by-products of the thermal-degradation of lignin. In fresh emissions, the emission factors (EF) of
these compounds can vary with the type of fuel (hardwood, softwood, or herbaceous types) (Schmidl et al., 2008b; Schauer
et al., 2001, Fine et al., 2002; 2004)), the type of fire (open fire, fire places, wood stove) (Fine et al., 2002; 2004), or even the
sampling set-up (in an experimental stack, in a dilution tunnel, or ambient) (Nussbaumer et al., 2010). Anhydrosugars and
methoxyphenols are ubiquitous in the atmosphere impacted by biomass combustions and have been used to demonstrate the 20
significant contribution of biomass burning to the total organic aerosol source globally (Robinson et al., 2006; Gelencsér et
al., 2007; Puxbaum et al., 20 2007; Stone et al., 2010; Crippa et al., 2013).
Meanwhile data on the evolution of these well-known primary compounds during atmospheric aging of the
emissions remain scarce. Authors have typically focused on the gas-phase oxidation of methoxyphenols (Net et al., 2011;
Lauraguais et al., 2012; Yee et al., 2013; Lauraguais et al., 2014), only few have specifically addressed the aging of 25
levoglucosan in the particle phase (Hennigan et al., 2010; Kessler et al., 2010; Lai et al., 2014), and only Fortenberry et al.
(2017) have attempted to characterize the aged chemical fingerprint of biomass burning emissions at the molecular level, by
means of a Thermal Desorption Aerosol Gas Chromatograph (TAG) connected to a Potential Aerosol Mass (PAM) flow
reactor. Such data are of prime importance. Considering that the OA mass concentration from biomass burning can increase
up to 7 times during photochemical aging in the atmosphere (Grieshop et al., 2009; Heringa et al., 2011; Ortega et al., 2013; 30
Bruns et al., 2015; Tiitta et al., 2016), the knowledge of the sole primary chemical fingerprint is not sufficient to understand
and to assess the global impact of biomass burning on the atmospheric aerosol burden.

4
In a previous publication, we investigated the POA emissions and SOA production potential generated by three
woodstove appliances (two logwood stoves and one pellet stove) used for residential heating (Bertrand et al., 2017) using a
HR-ToF-AMS. Here, we provide a comprehensive study, including the evolution of the molecular level composition of the
emissions during a period equivalent to 5 hours of atmospheric aging. The experiments were conducted using the
atmospheric chamber of the Paul Scherrer Institute (PSI, Villigen, Switzerland). The data were obtained by means of a TAG-5
AMS (Aerodyne Research Inc.). We determine the EF and emission profiles of biomass burning tracers. In a first part, we
derive the effect of combustion conditions on the EFs and the contribution of the tracers to the POA mass concentration, and
in a second approach we determine the effect of the atmospheric aging on the contribution of tracers to the total OA mass.
2 Materials and Methods 10
2.1 Set up
The full set-up and protocol was previously fully described in Bertrand et al. (2017). The atmospheric chamber is a 5.5 m3
Teflon chamber with a set of 40 × 100 W UV lights (310 – 430 nm (Platt et al., 2013) to initiate photo-chemistry (Figure 1).
Whereas most studies conduct their experiment at ambient temperature, here the chamber was set to 2 °C in order to simulate
wintertime conditions. Relative humidity (RH) was kept at 50 %. Primary and aged emissions were characterized using a 15
suite of instrumentation. This included a TAG-AMS (Aerodyne Research Inc.) for the online speciation of the OA particle
mass (referenced in the text as identified OA), an Aethalometer (Magee Scientific Aethalometer model AE33) (Drinovec et
al., 2015) for the quantification of the equivalent black carbon (eBC) concentration, a HR-ToF-AMS (Aerodyne Research
Inc.) for the bulk-condensed chemical composition and quantification of the non-refractory fraction of the aerosol (total OA,
sulfate, nitrate, ammonium), and a Proton Transfer Reaction – Time of Flight - Mass Spectrometer (PTR-ToF-MS 8000, 20
Ionicon Analytik) for the monitoring of volatile organic compounds (VOCs). The PTR-ToF-MS was operated under standard
conditions, i.e. ion drift pressure at 2.2 mbar and drift field intensity at 125 Td. The HR-ToF-AMS was equipped with a
PM2.5 aerodynamic lens and operated under standard conditions, i.e. the temperature of the vaporizer set at 600 °C, and the
electron ionization (EI) at 70 eV.
Emissions were generated by three different wood burning appliances. Stove A was a logwood stove fabricated 25
before 2002, stove B a logwood fabricated in 2010, and stove C a pellet stove from 2010. For each stove, experiments were
replicated 3 or 4 times (Table 1). The logwood stoves were loaded with 2 – 3 kg of beech wood as logs and kindling wood,
and with a moisture content between 10 - 12 %. The pellet stove was fueled with commercial pellets, considered of premium
quality (European Standards, 2012), composed of a mixture of pine and spruce wood, and with a moisture content of 7.7 %
and a density of 600 kg m-3
. The stoves were connected from the chimney to the chamber via heated (140 °C) Silico-steel 30
lines.

5
2.2 Experimental protocol
Following ignition and prior to injection in the chamber, the emissions were diluted by a factor of 10 through an ejector
dilutor (DI-1000, Dekati Ltd.). After injection and prior to aging, the mass concentration of OA in the chamber ranged
between 10 and 177 µg m-3
(Table 1) and can thus be considered representative of ambient to plume-like conditions. The
concentration of NOx ranged from 50 to 255 ppb. Primary emissions were left static for approximately 30 minutes for 5
homogenization and stabilization. Then, 1 µL of butanol-D9 (butanol-D9, 98%, Cambridge Isotope Laboratories) was
injected. Butanol-D9 is a commonly used tracer for hydroxyl radicals (OH) in atmospheric chamber studies (Platt et al.,
2013; Bruns et al., 2015; Klein et al., 2016). Its fragment at m/z 66.126 ([C4D9] +
) which can be easily monitored by means of
a PTR-ToF-MS (Barmet et al., 2012). Nitrous acid (HONO) was injected continuously at a flow rate of 1 L min-1
. HONO
dissociates under UV lights (λ < 400 nm) to form OH. Here, to integrate the dilution factor owing to the continuous injection 10
of HONO in the chamber, we retrieved the OH exposure (OH concentration integrated over time) based on the differential
reactivity of butanol-D9 and naphthalene ([C10H8]H+, m/z 129.070). The photo-oxidation of the emissions lasted
approximately for four hours. We calculated an integrated OH exposure at the end of our experiments which ranged between
5 × 10⁶ molecules cm
−3 h and 8 × 10
6 molecules cm
−3 h. This translates to 5 to 8 hours of atmospheric aging, respectively,
with a typical average daytime OH concentration of 1 × 10⁶ OH molecules cm
−3. 15
2.3 Operation of the TAG-AMS
The TAG-AMS (Figure 1) permits the on-line collection and analysis of the OA particles at the molecular level with a time
resolution of less than an hour. The instrument presented here is a modified version of the original TAG system (Williams et
al., 2006). The TAG is coupled to a modified HR-ToF-AMS (DeCarlo et al., 2006) equipped with a quadrupole high pass-
filter (Tofwerk) and opened at the rear flange to accommodate a transfer line (Williams et al., 2014). The quadrupole deflects 20
any ions at m/z < 10. This avoids the saturation of the detector by helium, used as the carrier gas in the TAG system. The
transfer line connects the Gas Chromatography (GC) column of the TAG to the bottom of the ion cage inside the AMS. It
consists of a 15" length × 1/32" OD coated stainless steel capillary which travels through a heated copper rod. The transfer
line is maintained at all times at 300 °C. This TAG-AMS was also implemented with an online derivatization system for the
analysis of more polar compounds (Isaacman et al., 2014). 25
Emissions are sampled and passed through a parallel plate charcoal denuder to remove trace gases. The aerosol is
then humidified (65 – 95 % RH) to enhance the collection efficiency onto the Collection Thermal Desorption (CTD) cell.
The CTD cell is kept at ambient temperature during sampling and then heated progressively (in 4 minutes) to 280 °C for the
measurement. Analytes are thermally desorbed into a helium flow enriched with the derivatization agent N-methyl-N-
trimethylsilyl trifluoroacetamide (MSTFA, Sigma Aldrich). This derivatization flow is then routed to the cell in parallel of a 30
pure helium flow (purge flow). The derivatization and purge flow were set at 40 and 15 cm3 min
-1, respectively, so as to
ensure complete derivatization of the more polar compounds. The organic material is transferred onto a focusing trap (15 m

6
× 0.53 mm ID × 5 µm df MXT-1 Restek column). During the transfer, the column is kept at 40 °C. Excess MSTFA is
flushed out of the system in a subsequent purging step for approximately 4 minutes. In addition, compounds with a higher
volatility than MSTFA are also flushed out. However, this does not affect the analytes of interest studied here. The
separation of the analytes is achieved using a 15 m long x 0.18 mm diameter ValcoBond-5 fastGC capillary column. The
initial temperature of the column is 45 °C and is increased by 36 °C min-1
to 100 °C, then by 30 °C min-1
to 310 °C, and held 5
for 5 minutes. We show chromatograms in Figure S1 of the supplementary information (SI). Peak fitting and integration are
achieved using the TERN (version 1.0) (Isaacman-VanWertz et al., 2017) data analysis toolkit in Igor Pro 6.3 (Wave
Metrics).
For optimum results, the TAG-AMS should sample air at 9 L min-1
. In order to make full use of the TAG-AMS
without rapidly depleting the volume of the chamber, the sampling flow rate was restricted to 2 L min-1
. An additional line 10
which sampled outside air filtered through a high-efficiency particulate air (HEPA) filter was installed to make up for the
missing flow rate.
Five to seven samples were collected in each experiment. The first sample was systematically collected before
photo-oxidation of the emissions (POA/fresh sample). Sampling lasted between 5 and 25 minutes, depending on the OA
concentration measured in the chamber by the HR-ToF-AMS. To compensate for the loss of materials to the walls (see 15
section 2.4) during aging, the TAG-AMS sampling time was typically increased with each new sampling (Figure 2).
Identification of the compounds for which the authentic standards were available (Table S1) was performed based
on their retention times and EI mass spectra. Identification of the compounds for which the authentic standards were not
available was performed by matching their EI mass spectrum to the Wiley and National Institute of Standards and
Technology (NIST) mass spectral libraries. The identification of the compounds was also supported by 2D-GC analysis in 20
both EI and vacuum ultra violet (VUV) ionization carried out on one pair of offline samples (quartz fiber filters) collected
before and at the end of the aging phase, as illustrated in Figure 2. Details of the 2D-GC analytical procedure are provided in
the SI (Figure S2). For quantification, a deuterated internal standard mixture in acetonitrile was added prior to analysis of
each sample in the CTD cell via an automatic injection system developed by Isaacman et al. (2011). The standard mixture
included adipic acid-D10, phthalic acid-D4, eicosane-D42, and tetracosane-D50 (Sigma Aldrich). A 5-point mass calibration 25
curve of the authentic standards was achieved before and after the campaign. One point was rerun all along the campaign to
check the calibration. The response varied by < 10 %. Compounds for which the authentic standard was not available were
quantified using an appropriate surrogate (Table S1). Detection limits are presented in Table S2.
2.4 Particle wall loss corrections (pWLC) and emission factor (EF) calculations
The mass concentrations were corrected for particle wall loss following the method described in Weitkamp et al. (2007) and 30
Hildebrandt et al. (2009). Briefly, the first order decay of an inert tracer, here eBC, was used to estimate the fraction of
condensed material lost to the wall. The corrected mass concentration for particles wall losses 𝐶𝑝𝑊𝐿𝐶 of a species was
calculated following Equation 1:

7
𝐶𝑝𝑊𝐿𝐶(𝑡) = 𝐶𝑝(𝑡) + ∫ 𝑘𝑤𝑎𝑙𝑙/𝑝(𝑡)𝐶𝑝(𝑡)𝑑𝑡𝑡
0 (1)
where 𝐶𝑝 is the concentration of a species measured by the TAG-AMS or HR-ToF-AMS, t is the time since lights on (in
min) and 𝑘𝑤𝑎𝑙𝑙/𝑝 is the eBC wall loss rate constant (0.003 – 0.006 in min-1
). Unless stated otherwise, all concentrations and 5
contributions of a marker to OA reported below are corrected for particle wall loss.
This method assumes that the condensable material partitions only to the suspended particles and vapor wall losses are
considered negligible. The corrected OA mass concentration and that of the individual markers thus correspond to the lowest
estimate possible of the total mass formed. Unlike particle wall loss, vapor wall loss cannot be easily constrained by external
measurements. To estimate the loss rate, one would need to conduct a thorough investigation of several key parameters (e.g., 10
each compound’s saturation vapor concentration, particle mass accommodation coefficient, or equivalent organic mass
concentration at the wall) which are not yet properly constrained within the existing literature. Investigation into vapor wall
loss is beyond the scope of this paper but is addressed in Bertrand et al (2018). Concentrations reported here are not
corrected for vapor wall loss.
EF were calculated based the method by Andreae and Merlet (2001) (Equation 2). The equation relates the mass emitted of 15
a pollutant P to that of the amount of fuel burnt.
𝑬𝑭𝒑 = 𝜟𝑷
∆𝑪𝑪𝑶𝟐+ ∆𝑪𝑪𝑶 + ∆𝑪𝑻𝑯𝑪+ ∆𝑪𝑶𝑪+ ∆𝑪𝑩𝑪
. 𝑾𝒄 (2)
Here Δ refers to the change in concentration of the species in the atmospheric chamber between background and 20
emission/stabilization. C relates to the carbon masses of CO2, CO, THC (Total Hydrocarbon including methane), organic
carbon (OC), and black carbon (eBC). OC was inferred from the OM/OC ratio determined with the high resolution AMS
analysis (Canagaratna et al., 2015). The carbon content (Wc) of the beech logs and the pellets were determined in the
laboratory by analyzing sawdust of the wood samples with an Elemental Analyzer (Flash HT, Thermo-Fisher) and was 46 %
± 1 % (n = 8, w/w) for both types of wood (Bertrand et al., 2017). 25
3 Results
We identified 71 compounds. They include the anhydrosugars levoglucosan, mannosan, and galactosan, the
methoxyphenols (substituted guaiacols and substituted syringols, details in Section 3.2.2), as well as a variety of polycyclic
aromatic hydrocarbon (PAHs) (including methylated-PAHs and oxygenated PAHs), alkanes (C18 to C27), fatty acids
(saturated and unsaturated), and a variety of tracers found almost exclusively in the secondary emissions (see Section 3.2.3). 30

8
These compounds contribute together between 26 - 85 % of the total POA mass concentration measured by HR-ToF-AMS
(Figure 3). Their EFs for the primary emissions are reported in Table S3 of the SI.
3.1 Effect of burning conditions on the POA chemical composition
There exists a strong variability between the experiments regarding the contribution of the markers to the total POA mass
concentration as well as their EF (Figure 4). The influence of fuels on the EF of organic markers has already been 5
extensively reported in the literature (Simoneit et al., 1993; Fine et al., 2001, 2002). Therefore, in the next sections, we focus
on the influence of the combustion efficiency (MCE). While the influence of the fuel (hardwood for stove A and B, softwood
for stove C) cannot be neglected, we highlight, from our set of experiments, the overriding importance of the MCE on both
the EF of organic markers and their relative contribution to OA. Previous studies have already revealed a relationship
between the modified combustion efficiency (MCE) and characteristics of the mass spectral signature of the OA emissions 10
(Jolleys et al., 2014; Bertrand et al., 2017) but the influence of the MCE on individual organic markers emissions is still
virtually unknown. The MCE values for the logwood stoves (Stove A and B) range between 0.80 - 0.91 (Table 1), indicating
that the combustion in these stoves is typically smoldering (MCE < 0.9), but also highly variable. However, the pellet stove
(Stove C) shows little variability and produces a flaming type of combustion. The MCE values for the experiments
conducted with this stove are 0.97. More details regarding the burn variability can be found in Bertrand et al. (2017). 15
3.1.1 Levoglucosan and other anhydrosugars
The EFs of levoglucosan are in the range 26 - 249 mg kg-1
of fuel or 13 - 45 % of the total POA mass concentration.
Levoglucosan is emitted along with its two isomers, mannosan, and galactosan. The EFs of mannosan are 4 - 20 mg kg-1
and
represent an average fraction of the total POA mass concentration of < 4 % ± 2 % (n = 11). The EFs of galactosan are 0.5 -
10 mg kg-1
and contribute < 1 % of the total POA mass concentration. Therefore, anhydrosugars represent 27 – 52 % of the 20
total POA mass concentration. For comparison, previous studies detailing the chemical composition of BBOA have typically
reported lower contributions of anhydrosugars to the total POA mass concentration (7 %, n = 6) (Fine et al., 2001), (7 %, n =
6) (Fine et al., 2002), (18 %, n = 7) (Fine et al., 2004), (24 %, n = 3) (Schauer et al., 2001). The conditions and methods with
which they sampled the emissions were however different (on quartz fibers filters) with a dilution factor at least 10 times less
than what is used in this study. This could result in a higher fraction of Semi-Volatile Organic Compounds (SVOCs) 25
partitioning to the particulate phase, therefore increasing the overall OA mass, and thus decreasing the individual
contribution of the markers.
Figure 4c shows the EF of levoglucosan and its contribution to the POA as a function of the MCE. The emission of
levoglucosan correlates well with the MCE (R² = 0.61, n = 11). Overall, emissions increase with lower MCE while the actual
contribution of levoglucosan to the total POA mass concentration decreases with lower MCE. Although no clear evidence 30
can be drawn from previous studies (Fine et al, 2001, 2002, 2004a-b, Schmidl et al, 2008, Schauer et al, 2001), it is generally
admitted that the contribution of levoglucosan to OA is higher for hardwood than for softwood combustions. As shown in

9
Figure 4e, such behavior is not observed here which implies that the nature of the fuel is not the most important driver of the
chemical composition of the emitted particles. We consider therefore that while smoldering combustions increase the
emission of levoglucosan, this process also results in large emissions of a variety of other compounds (not identified nor
quantified in our experiments) along with the anhydrosugars; the chemical composition of the resulting organic aerosol is
thus more complex and the identified fraction by TAG-AMS of the total OA mass is lower. This substantial difference in the 5
contribution of levoglucosan (from 40 % – 50 % at the highest MCE, down to 15 % at the lowest MCE) is however never
considered in source profiles for source apportionment studies.
3.1.2 Methoxyphenols
They include substituted guaiacol compounds such as vanillin, acetovanillone, vanillic acid, 3-guaiacylpropanol, conyferyl
aldehyde as well as syringol and substituted syringols such as iso-eugenol, syringaldehyde, acetosyringone, syringyl acetone, 10
propionyl syringol, syringic acid, methyl syringol, and synapyl aldehyde. The total EF of the methoxyphenols is between 7
and 174 mg kg-1
. Syringyl acetone and vanillin are the most abundant compounds in their respective category with EFs
ranging from 0.4 to 80 mg kg-1
and from 2 to 7 mg kg-1
, respectively. As for levoglucosan, a strong correlation is observed
between the total EF of methoxyphenols and the MCE (R² = 0.65, n = 11, Figure 4d) which indicates that smoldering
conditions also favor the emission of this compound‘s class. 15
Methoxyphenols account for an important fraction of the POA, contributing 8 - 27 % of the total POA mass concentration.
Unlike levoglucosan, the correlation between their relative contribution to POA and the MCE is more complex (Figure 4f).
We observe a similar upward trend when considering the experiments conducted with stove A and B only (Hardwood, R² =
0.41, n = 8). Experiments conducted with stove C (softwood pellets) do not follow this trend however. For methoxyphenols,
the influence of the fuel is very well established with larger emissions of substituted guaiacols from softwood combustions 20
while hardwood combustion emissions contain a larger proportion of substituted syringols (Fine et al. (2001; 2002; Fine et
al., 2004a-b). Here, as the quantification has been performed on the same set of compounds for all the experiments, we
cannot exclude an under-representativeness of the substituted guaiacols towards the substituted syringols family.
3.1.3 Other compounds 25
Overall, the sum of PAHs, alkanes, and fatty acids accounts for less than < 8 (1. 6 – 7.6) % of the total POA mass
concentration. The EF of the individual PAHs vary between 3 µg kg-1
and 4 mg kg-1
, with combined amounts between 2 and
14 mg kg-1
. The relative contributions of the PAHs to the total POA mass concentration vary between 1.4 and 6.4 %.
Phenanthrene and fluoranthrene are the most dominant as they represent over a third of the total PAH contributions. The
total EFs of the alkanes (C18 – C27) vary between 0.5 and 2 mg kg-1
. They represent between 0.04 and 0.73 % of the total 30
POA mass concentration. Four fatty acids including the saturated acids (palmitic acid and stearic acid) and the unsaturated
acids (palmitoleic acid and oleic acid), were identified. Their total EFs are similar to the n-alkanes, and they contribute

10
between 0.03 and 1.3 % of the total POA mass concentration. Like for levoglucosan, we observe an increase of their
contribution to the total POA mass concentration as a function of the MCE (see Figure S2 in the SI). Other compounds
reported in this manuscript account for a negligible fraction of the primary OA emission, with the exception of experiment 8
(stove B) where they (mainly the nitrocatechols, see Section 3.2) contribute < 3% of the total POA mass concentration.
3.2 Effect of atmospheric aging on the chemical fingerprint of OA 5
The molecular fingerprint of the BBOA undergoes important modifications during aging. By highlighting the differences
observed between a sample of fresh and aged biomass burning emissions, Figure 5 illustrates the impact of such aging on the
molecular fingerprint of the emissions. Considering that such fast modifications can generate significant biases in our ability
to properly apportion the biomass burning source in the ambient atmosphere, quantitative data on the chemical changes of
the molecular signature are required. The contributions of the most relevant markers to the total OA mass concentration at 10
different stages of the photo-oxidative process are also reported in Table 2. A more exhaustive table is also available in the
SI (Table S4). While TAG-AMS samples are collected and analyzed approximately at the same time (after lights on)
between the experiments, the integrated OH exposure however is not homogeneous. Therefore, data are divided into seven
bins of different integrated OH exposure intervals (Figure 6) (from 0 to 9 × 10⁶ molecules cm
-3 hour). The intervals are set to
best reflect the evolution of the compounds. Note, while it is possible differences in the composition of the primary 15
emissions can influence the SOA composition, we have not found significant differences in the evolution of the individual
markers. In this section, we therefore consider all aging experiments from the three stoves. EFs of the molecular markers at
an integrated OH exposure of 5 × 10⁶ molecules cm
-3 h for each experiment are reported in Table S3.
Figure 6 further illustrates the quantitative modification of the chemical fingerprint during the aging process for one
experiment (Experiment 2). In this example, while the quantified markers represent 32 % of the total POA mass 20
concentration, only 4.5 % of the total OA mass concentration measured by HR-ToF-AMS is identified by the time the
experiment reaches an integrated OH exposure of 5 × 10⁶ molecules cm
−3 h. This result can be generalized since < 10 % of
the total POA mass concentration is quantified at the molecular level after the photo-oxidative process. This can be
explained by the nature of the emissions present at this stage of the experiment. Due to the oxidative mechanisms taking
place, aged OA emissions contain a large amount of high molecular weight, low volatility, and highly oxygenated 25
compounds (Donahue et al., 2011; Ng et al., 2011) with multiple isomers. This is reflected in the modification of the O:C
ratio (from 0.45 to 0.65). Many of these more oxidized and highly functionalized compounds cannot be easily identified by
the methods used here either because they do not elute from the TAG-AMS, or because their mass spectra are not present in
the NIST libraries.
We look at the evolution of the absolute concentrations of the compounds and their enhancement ratios (ER). The 30
ER is defined as the ratio between pWLC concentration measured in the particle phase at a time t and the concentration in
the particle phase measured at t0 or before lights on. A compound with an ER > 1 would indicate the compound is formed
11
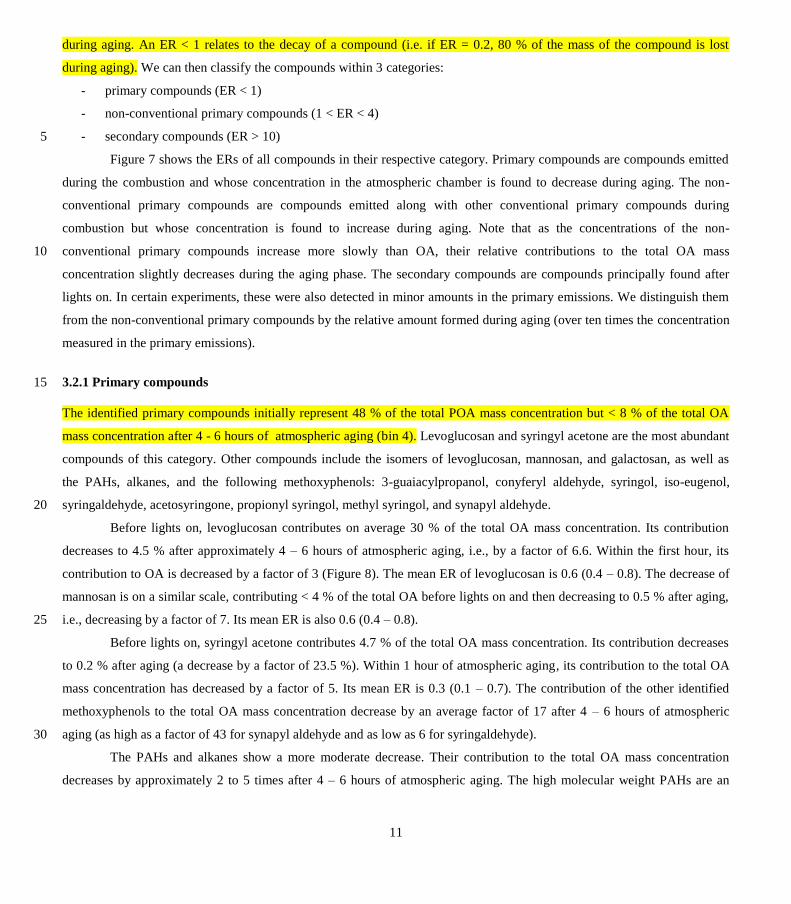
during aging. An ER < 1 relates to the decay of a compound (i.e. if ER = 0.2, 80 % of the mass of the compound is lost
during aging). We can then classify the compounds within 3 categories:
- primary compounds (ER < 1)
- non-conventional primary compounds (1 < ER < 4)
- secondary compounds (ER > 10) 5
Figure 7 shows the ERs of all compounds in their respective category. Primary compounds are compounds emitted
during the combustion and whose concentration in the atmospheric chamber is found to decrease during aging. The non-
conventional primary compounds are compounds emitted along with other conventional primary compounds during
combustion but whose concentration is found to increase during aging. Note that as the concentrations of the non-
conventional primary compounds increase more slowly than OA, their relative contributions to the total OA mass 10
concentration slightly decreases during the aging phase. The secondary compounds are compounds principally found after
lights on. In certain experiments, these were also detected in minor amounts in the primary emissions. We distinguish them
from the non-conventional primary compounds by the relative amount formed during aging (over ten times the concentration
measured in the primary emissions).
3.2.1 Primary compounds 15
The identified primary compounds initially represent 48 % of the total POA mass concentration but < 8 % of the total OA
mass concentration after 4 - 6 hours of atmospheric aging (bin 4). Levoglucosan and syringyl acetone are the most abundant
compounds of this category. Other compounds include the isomers of levoglucosan, mannosan, and galactosan, as well as
the PAHs, alkanes, and the following methoxyphenols: 3-guaiacylpropanol, conyferyl aldehyde, syringol, iso-eugenol,
syringaldehyde, acetosyringone, propionyl syringol, methyl syringol, and synapyl aldehyde. 20
Before lights on, levoglucosan contributes on average 30 % of the total OA mass concentration. Its contribution
decreases to 4.5 % after approximately 4 – 6 hours of atmospheric aging, i.e., by a factor of 6.6. Within the first hour, its
contribution to OA is decreased by a factor of 3 (Figure 8). The mean ER of levoglucosan is 0.6 (0.4 – 0.8). The decrease of
mannosan is on a similar scale, contributing < 4 % of the total OA before lights on and then decreasing to 0.5 % after aging,
i.e., decreasing by a factor of 7. Its mean ER is also 0.6 (0.4 – 0.8). 25
Before lights on, syringyl acetone contributes 4.7 % of the total OA mass concentration. Its contribution decreases
to 0.2 % after aging (a decrease by a factor of 23.5 %). Within 1 hour of atmospheric aging, its contribution to the total OA
mass concentration has decreased by a factor of 5. Its mean ER is 0.3 (0.1 – 0.7). The contribution of the other identified
methoxyphenols to the total OA mass concentration decrease by an average factor of 17 after 4 – 6 hours of atmospheric
aging (as high as a factor of 43 for synapyl aldehyde and as low as 6 for syringaldehyde). 30
The PAHs and alkanes show a more moderate decrease. Their contribution to the total OA mass concentration
decreases by approximately 2 to 5 times after 4 – 6 hours of atmospheric aging. The high molecular weight PAHs are an

12
exception. Benzofluoranthene and other five-rings PAHs are observed to decrease by a factor > 10 after 4 – 6 hours of
atmospheric aging.
The rate at which these compounds decrease is of particular interest. Many serve as molecular markers in source
apportionment studies and are as such implicitly assumed to not oxidize or volatilize. If they are not stable these markers will
introduce a bias in the results and lead to an underestimation of the contribution of biomass burning in favor of other sources 5
including the secondary fraction. Previous studies have examined the effective rate constant for the reaction of these
compounds with OH (Lambe et al., 2009b; Hennigan et al., 2010; Kessler et al., 2010; Hennigan et al., 2011; Lai et al.,
2014) at ambient temperature, and the rate at which levoglucosan decreases here is consistent with their results (at 2°C).
However, we note that our results ignore the semi-volatile nature of many of these compounds and likely wall losses. As
demonstrated by (May et al., 2012; Zhang et al., 2015) ignoring wall losses can result in an underestimation of the 10
compound concentration measured in the chamber as much as by a factor of 4. Therefore, the kOH rate constant derived from
these results must be regarded with caution. This is addressed in further detail in Bertrand et al. (2018).
3.2.2 Non-conventional primary compounds
This category includes mainly methoxyphenols such as vanillic acid, vanillin, acetovanillone, and syringic acid, and some
less known compounds: tyrosol and pyrogallol. Their contribution in the primary emissions is not significant (on average 15
less than 3 % of the total POA mass concentration in total). Unlike the other primary compounds emitted during combustion,
their pWLC concentration is found to increase during aging. (Fortenberry et al., 2017) observed a similar trend for vanillin.
As most of these compounds are detected both in the gas and particle phase of the emissions (Bruns et al., 2017; Schauer et
al., 2001), with the smaller fraction detected in the particle phase of the emissions, it is possible that their increase is partly a
result of the partitioning effect. A significant increase in the OA mass after lights on as observed in these experiments could 20
drive a larger fraction into the particle phase. However, it is likely that this effect would be reduced by the vapor wall loss
also occurring, which has been demonstrated to be significant by other authors (Zhang et al., 2015; La et al., 2016; Trump et
al., 2016; Ye et al., 2016). Therefore, the other most sensible hypothesis is that these compounds are formed during the
oxidation process. Several experiments have been conducted on the heterogeneous and gas-phase reactivity of
methoxyphenols with atmospheric oxidants (OH, NO3) (Net et al., 2011; Lauraguais et al., 2012; Yee et al., 2013). Typically, 25
they react to first form intermediate products with a structure akin to the initial methoxyphenol. For example, (Liu et al.,
2012) reported vanillin and vanillic acid as by-products of the reaction of the methoxyphenol conyferyl aldehyde in the
presence of the nitrate radical. A mechanism of the formation of vanillin from larger lignin decomposition product was also
described by (Wong et al., 2010).
The mean ER of vanillic acid is 2.2 (1.4 – 3.8). The compound represents 0.1 % to 0.3 % of the total OA mass 30
concentration at its peak concentration, during aging (Figure 8). This is within the same range of proportions observed before
lights on. Similar ER are obtained for vanillin and acetovanillone (2.1 and 2.2, respectively). Syringic acid and tyrosol shows
a slightly more moderate mean ER of 1.9 and the mean ER of the pyrogallol is 3.5 (2 - 5).

13
3.2.3 Secondary compounds
The identified secondary compounds include nitro-aromatic compounds such as 4-nitrocatechol (4-NC) and its methylated
derivatives, 4-methyl-5-nitrocatechol (4M5NC) and 3-methylated-5-nitrocatechol (3M5NC), as well as methylglutaric acid
and vanillylmandelic acid. After 4 - 6 hours of atmospheric aging, these compounds contribute 2.5 % of the total OA mass
concentration. 5
Nitrocatechols are the most abundant secondary compounds detected. (Iinuma et al. (2010), Kelly et al. (2010) and Finewax
et al. (2018) demonstrated their formation through the oxidation of cresol in the presence of NOx. The aerosol formation of
nitrocatechols varies between 7 and 65 mg kg-1
for 4-NC, between 0.3 and 6 mg kg-1
for 4M5NC and between 0.4 and 10 mg
kg-1
for 3M5NC. In the experiments where 4-NC is detected in the primary emission (< 0.2 % of total OA), the ER averages
at 80 (15 - 260). For experiment 8 only, we observe a substantial amount of 4-NC in the primary emissions (> 1% of the 10
POA mass concentration). The ER of the compound is 6 in this case. With regard to the alkylated nitrocatechols, five of the
eleven experiments present trace levels of 4M5NC in the primary emissions. The ER averages at 17 (3 to 50). The average
ER for 3M5NC is 14 (3 to 45). The concentrations of these compounds increase within the first 1 – 2 hours of atmospheric
aging, and contribute as high as 5 - 6 % of the total OA mass concentration in the case of 4-NC (Figure 8), and up to 0.4 %
and 0.8 % for 3M5NC and 4M5NC. The concentration of 3M5NC decreases soon after the initial peaking (by a factor of 2 to 15
3 near the end of the experiment), whereas the concentrations of 4-NC and 4M5NC remain stable. We hypothesize that
formation and loss processes compete especially in the case of these compounds.
Nitro-aromatic compounds have been observed at sites impacted by biomass burning before (Iinuma et al., 2010; Claeys et
al., 2012; Kitanovski et al., 2012; Mohr et al., 2013; Kahnt et al., 2013; Kitanovski et al., 2014; Frka et al., 2016; Gaston et
al., 2016) at concentration levels typically two orders of magnitude lower than that of levoglucosan (4-NC/LG ≈ 0.01 – 0.1, 20
MNC/LG ≈ 0.01 - 0.08). Here, the 4-NC/LG and MNC/LG ratios vary from 0.25 to 0.5 and 0.06 to 0.15, respectively. We
hypothesize that the higher levels of 4-nitrocatechol emissions found in the chamber are the result of high concentration of
NOx (Table 1) (in a range of 50 to 252 ppb, compared to 40 – 50 ppb in areas heavily impacted by biomass burning (Brulfert
et al., 2005; Sandradewi et al., 2008). Experiments conducted at higher NOx concentrations (i.e. experiments 9 – 11 with
stove C) (see Table 1, THC/NOx ≈ 5, Cresol/ NOx < 0.005) show the highest contribution of 4-NC to the OA mass 25
concentration (3 – 6 %).
The EI mass spectra of 4-nitrocatechol and the alkylated nitrocatechols (without derivatization) are dominated by
the ion C6H5NO4+ (m/z 155) and C6H2NO4
+ (m/z 152), respectively, which are detected with the HR-ToF-AMS. Figure 9
shows the intensity of the fragments from HR-ToF-AMS measurements (expressed in µg m-3
nitrate equivalents) against the
concentrations of the nitrocatechol compounds measured by the TAG-AMS. The best correlation is observed for 4-30
nitrocatechol (R² = 0.78). For alkylated nitrocatechols the correlation is slightly weaker (R2 = 0.64), most probably due to the
contribution of different isomers. While a proper calibration is needed, such relationships indicate that these two ions
(C6H5NO4+ and C6H2NO4
+) can potentially be considered as suitable tracers of nitrocatechol compounds in AMS

14
measurements and could offer interesting perspectives for the quantification of secondary BBOA in ambient atmosphere.
However, and because of possible interferences from other aerosol sources, this assumption must be confirmed with more
complex organic matrices.
Finally, this third category also includes less often reported compounds. They however represent only a small
fraction of the total OA mass concentration. At its peak, the methylglutaric acid contributes less than 0.05 %. The aerosol 5
formation varies between 0.01 and 2 mg kg-1
. For the majority of the experiments, this compound is detected only during
aging. Only two experiments show traces of the compound before lights on. Their ER are 9 and 15, respectively. The
vanillylmandelic acid contributes as much as 0.2 % of the total OA. The EFs for aged emissions vary between 0.04 and 1 mg
kg-1
. The compound is detected in the primary emission of all experiments but its enhancement ratio is > 10.
4 Conclusions 10
We investigate the influence of the combustion efficiency and atmospheric aging on the chemical fingerprint of the OA
emitted by biomass burning by means of a TAG-AMS. We provide a detailed quantitative analysis of the evolution of the
contribution of 71 markers to the OA mass from fresh to aged emission. We draw the following conclusions:
The emissions factors of the individual organic markers are mostly driven by the MCE. Smoldering combustion
increases the EF of the reported compounds. Within the experiments conducted with the same fuel, the 15
contribution of the markers to the total POA mass concentration also vary according to the MCE (i.e. lower
contribution at smoldering conditions). This indicates that smoldering combustion produces OA emissions with
a more complex composition. The contribution of levoglucosan for instance varies from 40 % – 50 % at the
highest MCE, down to 15 % at the lowest MCE.
The resolved fraction of fresh woodstove emissions by TAG-AMS is on average 52 %, but dramatically 20
decreases with photochemical aging to < 10% after an integrated OH exposure of 5 × 10⁶ molecules cm
-3 h.
The majority of secondary compounds thus remain unidentified.
The contribution of a variety of tracers to the total OA mass concentration evolves substantially during aging.
We establish ratios for all reported compounds as a function of the photo-oxidative processing time. For
instance, the contribution by levoglucosan, the concentration of which decreases by approximately 40 % during 25
aging, is < 10 % to the total OA mass concentration at the end of the experiment against an average
contribution of 30 % for the fresh emissions.
Nitro-aromatic compounds such as 4-nitrocatechol, 4-methyl-5-nitrocatechol (4,5-MNC) and 3-methylated-5-
nitrocatechol are formed during aging. They can contribute significantly to the total OA mass concentration (2
– 4 %), and thus may serve as aged biomass burning tracers in future source apportionment studies. 30
These data will serve to improve our ability to properly apportion the biomass burning source in the ambient atmosphere.
Already, source apportionment studies reveal a large fraction of the aged OA originate from modern sources (i.e. non-fossil

15
fuel sources). The secondary compounds highlighted in this study thus should be evaluated to serve as potential tracers of the
aged biomass burning emissions. The lack of stability of the primary compounds in the context of source apportionment
study and how this might result in an underestimated contribution of BBOA should also be further examined.
Acknowledgments
This work was supported by the French Environment and Energy Management Agency (ADEME) project VULCAIN (grant 5
number: 1562C0019). AB also acknowledges ADEME and the Provence-Alpes-Côte d’Azur (PACA) region for their
support. CNJ and AHG acknowledge support from NSF AGS Award 1524211 and NOAA Award NA16OAR4310107. The
Paul Scherrer Institute acknowledges the financial contribution by the SNF project WOOSHI and the IPR-SHOP SNF
starting grant.
10
15
20
References
Andreae, M. O. and Merlet, P.: Emission of trace gases and aerosols from biomass burning, Glob. Biogeochem. Cycles,
15(4), 955–966, doi:10.1029/2000GB001382, 2001.
Barmet, P., Dommen, J., DeCarlo, P. F., Tritscher, T., Praplan, A. P., Platt, S. M., Prévôt, A. S. H., Donahue, N. M. and
Baltensperger, U.: OH clock determination by proton transfer reaction mass spectrometry at an environmental chamber, 25
Atmos. Meas. Tech., 5(3), 647–656, doi:10.5194/amt-5-647-2012, 2012.
Bertrand, A., Stefenelli, G., Bruns, E. A., Pieber, S. M., Temime-Roussel, B., Slowik, J. G., Prévôt, A. S. H., Wortham, H.,
El Haddad, I. and Marchand, N.: Primary emissions and secondary aerosol production potential from woodstoves for
residential heating: Influence of the stove technology and combustion efficiency, Atmos. Environ., 169, 65–79,
doi:10.1016/j.atmosenv.2017.09.005, 2017. 30

16
Bertrand, A., Stefenelli, G., Pieber, S. M., Bruns, E. A., Temime-Roussel, B., Slowik, J. G., Wortham, H., Prévôt, A. S. H.,
El Haddad, I., and Marchand, N.: Influence of the vapor wall loss on the degradation rate constants in chamber experiments
of levoglucosan and other biomass burning markers, Atmos. Chem. Phys. Discuss., https://doi.org/10.5194/acp-2018-40, in
review, 2018.
Bonvalot, L., Tuna, T., Fagault, Y., Jaffrezo, J.-L., Jacob, V., Chevrier, F. and Bard, E.: Estimating contributions from 5
biomass burning, fossil fuel combustion, and biogenic carbon to carbonaceous aerosols in the Valley of Chamonix: a dual
approach based on radiocarbon and levoglucosan, Atmospheric Chem. Phys., 16(21), 13753–13772, doi:10.5194/acp-16-
13753-2016, 2016.
Brulfert, G., Chemel, C., Chaxel, E. and Chollet, J. P.: Modelling photochemistry in alpine valleys, Atmos. Chem. Phys.,
5(9), 2341–2355, 2005. 10
Bruns, E. A., Krapf, M., Orasche, J., Huang, Y., Zimmermann, R., Drinovec, L., Močnik, G., El-Haddad, I., Slowik, J. G.,
Dommen, J., Baltensperger, U. and Prévôt, A. S. H.: Characterization of primary and secondary wood combustion products
generated under different burner loads, Atmos. Chem. Phys., 15(5), 2825–2841, doi:10.5194/acp-15-2825-2015, 2015.
Bruns, E. A., Slowik, J. G., El Haddad, I., Kilic, D., Klein, F., Dommen, J., Temime-Roussel, B., Marchand, N.,
Baltensperger, U. and Prévôt, A. S. H.: Characterization of gas-phase organics using proton transfer reaction time-of-flight 15
mass spectrometry: fresh and aged residential wood combustion emissions, Atmos. Chem. Phys., 17(1), 705–720,
doi:10.5194/acp-17-705-2017, 2017.
Canagaratna, M. R., Jimenez, J. L., Kroll, J. H., Chen, Q., Kessler, S. H., Massoli, P., Hildebrandt Ruiz, L., Fortner, E.,
Williams, L. R., Wilson, K. R., Surratt, J. D., Donahue, N. M., Jayne, J. T. and Worsnop, D. R.: Elemental ratio
measurements of organic compounds using aerosol mass spectrometry: characterization, improved calibration, and 20
implications, Atmos. Chem. Phys., 15(1), 253–272, doi:10.5194/acp-15-253-2015, 2015.
Claeys, M., Vermeylen, R., Yasmeen, F., Gómez-González, Y., Chi, X., Maenhaut, W., Mészáros, T. and Salma, I.:
Chemical characterisation of humic-like substances from urban, rural and tropical biomass burning environments using
liquid chromatography with UV/vis photodiode array detection and electrospray ionisation mass spectrometry, Environ.
Chem., 9(3), 273, doi:10.1071/EN11163, 2012. 25
DeCarlo, P. F., Kimmel, J. R., Trimborn, A., Northway, M. J., Jayne, J. T., Aiken, A. C., Gonin, M., Fuhrer, K., Horvath, T.,
Docherty, K. S., Worsnop, D. R. and Jimenez, J. L.: Field-Deployable, High-Resolution, Time-of-Flight Aerosol Mass
Spectrometer, Anal. Chem., 78(24), 8281–8289, doi:10.1021/ac061249n, 2006.
Donahue, N. M., Epstein, S. A., Pandis, S. N. and Robinson, A. L.: A two-dimensional volatility basis set: 1. organic-aerosol
mixing thermodynamics, Atmos. Chem. Phys., 11(7), 3303–3318, doi:10.5194/acp-11-3303-2011, 2011. 30
Drinovec, L., Močnik, G., Zotter, P., Prévôt, A. S. H., Ruckstuhl, C., Coz, E., Rupakheti, M., Sciare, J., Müller, T.,
Wiedensohler, A. and Hansen, A. D. A.: The “dual-spot” Aethalometer: an improved measurement of aerosol black carbon
with real-time loading compensation, Atmos. Meas. Tech., 8(5), 1965–1979, doi:10.5194/amt-8-1965-2015, 2015.
El Haddad, I., Marchand, N., Dron, J., Temime-Roussel, B., Quivet, E., Wortham, H., Jaffrezo, J. L., Baduel, C., Voisin, D.,
Besombes, J. L. and Gille, G.: Comprehensive primary particulate organic characterization of vehicular exhaust emissions in 35
France, Atmos. Environ., 43(39), 6190–6198, doi:10.1016/j.atmosenv.2009.09.001, 2009.

17
European Standards: European Standards EN 15234-2 Solid biofuels - Fuel quality assurance - Part 2: Wood pellets for non-
industrial use, [online] Available from: https://www.en-standard.eu/csn-en-15234-2-solid-biofuels-fuel-quality-assurance-
part-2-wood-pellets-for-non-industrial-use/ (Accessed 20 July 2017), 2012.
Fine, P. M., Cass, G. R. and Simoneit, B. R. T.: Chemical Characterization of Fine Particle Emissions from Fireplace
Combustion of Woods Grown in the Northeastern United States, Environ. Sci. Technol., 35(13), 2665–2675, 5
doi:10.1021/es001466k, 2001.
Fine, P. M., Cass, G. R. and Simoneit, B. R. T.: Chemical Characterization of Fine Particle Emissions from the Fireplace
Combustion of Woods Grown in the Southern United States, Environ. Sci. Technol., 36(7), 1442–1451,
doi:10.1021/es0108988, 2002.
Fine, P. M., Cass, G. R. and Simoneit, B. R.: Chemical characterization of fine particle emissions from the wood stove 10
combustion of prevalent United States tree species, Environ. Eng. Sci., 21(6), 705–721, 2004.
Finewax, Z., de Gouw, J. A. and Ziemann, P. J.: Identification and Quantification of 4-Nitrocatechol Formed from OH and
NO Radical-Initiated Reactions of Catechol in Air in the Presence of NO: Implications for Secondary Organic Aerosol
Formation from Biomass Burning, Environ. Sci. Technol., 52(4), 1981–1989, doi:10.1021/acs.est.7b05864, 2018.
15
Fortenberry, C. F., Walker, M. J., Zhang, Y., Mitroo, D., Brune, W. H. and Williams, B. J.: Bulk and Molecular-Level
Characterization of Laboratory-Aged Biomass Burning Organic Aerosol from Oak Leaf and Heartwood Fuels, Atmos.
Chem. Phys. Discuss., 1–40, doi:10.5194/acp-2017-576, 2017.
Fraser, M. P., Cass, G. R. and Simoneit, B. R. T.: Particulate organic compounds emitted from motor vehicle exhaust and in
the urban atmosphere, Atmos. Environ., 33(17), 2715–2724, doi:10.1016/S1352-2310(98)00311-2, 1999. 20
Frka, S., Šala, M., Kroflič, A., Huš, M., Čusak, A. and Grgić, I.: Quantum Chemical Calculations Resolved Identification of
Methylnitrocatechols in Atmospheric Aerosols, Environ. Sci. Technol., 50(11), 5526–5535, doi:10.1021/acs.est.6b00823,
2016.
Gaston, C. J., Lopez-Hilfiker, F. D., Whybrew, L. E., Hadley, O., McNair, F., Gao, H., Jaffe, D. A. and Thornton, J. A.:
Online molecular characterization of fine particulate matter in Port Angeles, WA: Evidence for a major impact from 25
residential wood smoke, Atmos. Environ., 138, 99–107, doi:10.1016/j.atmosenv.2016.05.013, 2016.
Goldstein, A. H. and Galbally, I. E.: Known and unexplored organic constituents in the earth’s atmosphere, Environ. Sci.
Technol., 41(5), 1514–1521, 2007.
Hennigan, C. J., Sullivan, A. P., Collett, J. L. and Robinson, A. L.: Levoglucosan stability in biomass burning particles
exposed to hydroxyl radicals, Geophys. Res. Lett., 37(9), n/a-n/a, doi:10.1029/2010GL043088, 2010. 30
Hennigan, C. J., Miracolo, M. A., Engelhart, G. J., May, A. A., Presto, A. A., Lee, T., Sullivan, A. P., McMeeking, G. R.,
Coe, H., Wold, C. E., Hao, W.-M., Gilman, J. B., Kuster, W. C., de Gouw, J., Schichtel, B. A., J. L. Collett, Kreidenweis, S.
M. and Robinson, A. L.: Chemical and physical transformations of organic aerosol from the photo-oxidation of open
biomass burning emissions in an environmental chamber, Atmos. Chem. Phys., 11(15), 7669–7686, doi:10.5194/acp-11-
7669-2011, 2011. 35

18
Hildebrandt, L., Donahue, N. M. and Pandis, S. N.: High formation of secondary organic aerosol from the photo-oxidation of
toluene, Atmos. Chem. Phys., 9(9), 2973–2986, 2009.
Hildemann, L. M., Markowski, G. R., Jones, M. C. and Cass, G. R.: Submicrometer Aerosol Mass Distributions of
Emissions from Boilers, Fireplaces, Automobiles, Diesel Trucks, and Meat-Cooking Operations, Aerosol Sci. Technol.,
14(1), 138–152, doi:10.1080/02786829108959478, 1991. 5
Iinuma, Y., Böge, O., Gräfe, R. and Herrmann, H.: Methyl-Nitrocatechols: Atmospheric Tracer Compounds for Biomass
Burning Secondary Organic Aerosols, Environ. Sci. Technol., 44(22), 8453–8459, doi:10.1021/es102938a, 2010.
Isaacman, G., Kreisberg, N. M., Worton, D. R., Hering, S. V. and Goldstein, A. H.: A versatile and reproducible automatic
injection system for liquid standard introduction: application to in-situ calibration, Atmos. Meas. Tech., 4(9), 1937–1942,
doi:10.5194/amt-4-1937-2011, 2011. 10
Isaacman, G., Kreisberg, N. M., Yee, L. D., Worton, D. R., Chan, A. W. H., Moss, J. A., Hering, S. V. and Goldstein, A. H.:
On-line derivatization for hourly measurements of gas- and particle-phase Semi-Volatile oxygenated organic compounds by
Thermal desorption Aerosol Gas chromatography (SV-TAG), Atmos. Meas. Tech. Discuss., 7(7), 7495–7529,
doi:10.5194/amtd-7-7495-2014, 2014.
Isaacman-VanWertz, G., Sueper, D. T., Aikin, K. C., Lerner, B. M., Gilman, J. B., de Gouw, J. A., Worsnop, D. R. and 15
Goldstein, A. H.: Automated single-ion peak fitting as an efficient approach for analyzing complex chromatographic data, J.
Chromatogr. A, 1529(Supplement C), 81–92, doi:10.1016/j.chroma.2017.11.005, 2017.
Jolleys, M. D., Coe, H., McFiggans, G., McMeeking, G. R., Lee, T., Kreidenweis, S. M., Collett, J. L. and Sullivan, A. P.:
Organic aerosol emission ratios from the laboratory combustion of biomass fuels: BBOA emission ratios in chamber studies,
J. Geophys. Res. Atmospheres, 119(22), 12,850-12,871, doi:10.1002/2014JD021589, 2014. 20
Kahnt, A., Behrouzi, S., Vermeylen, R., Safi Shalamzari, M., Vercauteren, J., Roekens, E., Claeys, M. and Maenhaut, W.:
One-year study of nitro-organic compounds and their relation to wood burning in PM10 aerosol from a rural site in Belgium,
Atmos. Environ., 81, 561–568, doi:10.1016/j.atmosenv.2013.09.041, 2013.
Kanakidou, M., Seinfeld, J. H., Pandis, S. N., Barnes, I., Dentener, F. J., Facchini, M. C., Dingenen, R. V., Ervens, B.,
Nenes, A., Nielsen, C. J. and others: Organic aerosol and global climate modelling: a review, Atmos. Chem. Phys., 5(4), 25
1053–1123, 2005.
Kelly, J. L., Michelangeli, D. V., Makar, P. A., Hastie, D. R., Mozurkewich, M. and Auld, J.: Aerosol speciation and mass
prediction from toluene oxidation under high NOx conditions, Atmos. Environ., 44(3), 361–369,
doi:10.1016/j.atmosenv.2009.10.035, 2010.
Kessler, S. H., Smith, J. D., Che, D. L., Worsnop, D. R., Wilson, K. R. and Kroll, J. H.: Chemical Sinks of Organic Aerosol: 30
Kinetics and Products of the Heterogeneous Oxidation of Erythritol and Levoglucosan, Environ. Sci. Technol., 44(18),
7005–7010, doi:10.1021/es101465m, 2010.

19
Kitanovski, Z., Grgić, I., Vermeylen, R., Claeys, M. and Maenhaut, W.: Liquid chromatography tandem mass spectrometry
method for characterization of monoaromatic nitro-compounds in atmospheric particulate matter, J. Chromatogr. A, 1268,
35–43, doi:10.1016/j.chroma.2012.10.021, 2012.
Kitanovski, Z., Čusak, A., Grgić, I. and Claeys, M.: Chemical characterization of the main products formed through
aqueous-phase photonitration of guaiacol, Atmospheric Meas. Tech., 7(8), 2457–2470, doi:10.5194/amt-7-2457-2014, 2014. 5
Klein, F., Farren, N. J., Bozzetti, C., Daellenbach, K. R., Kilic, D., Kumar, N. K., Pieber, S. M., Slowik, J. G., Tuthill, R. N.,
Hamilton, J. F., Baltensperger, U., Prévôt, A. S. H. and El Haddad, I.: Indoor terpene emissions from cooking with herbs and
pepper and their secondary organic aerosol production potential, Sci. Rep., 6, 36623, doi:10.1038/srep36623, 2016.
La, Y. S., Camredon, M., Ziemann, P. J., Valorso, R., Matsunaga, A., Lannuque, V., Lee-Taylor, J., Hodzic, A., Madronich,
S. and Aumont, B.: Impact of chamber wall loss of gaseous organic compounds on secondary organic aerosol formation: 10
explicit modeling of SOA formation from alkane and alkene oxidation, Atmos. Chem. Phys., 16(3), 1417–1431,
doi:10.5194/acp-16-1417-2016, 2016.
Lai, C., Liu, Y., Ma, J., Ma, Q. and He, H.: Degradation kinetics of levoglucosan initiated by hydroxyl radical under
different environmental conditions, Atmos. Environ., 91, 32–39, doi:10.1016/j.atmosenv.2014.03.054, 2014.
Lambe, A. T., Miracolo, M. A., Hennigan, C. J., Robinson, A. L. and Donahue, N. M.: Effective Rate Constants and Uptake 15
Coefficients for the Reactions of Organic Molecular Markers ( n -Alkanes, Hopanes, and Steranes) in Motor Oil and Diesel
Primary Organic Aerosols with Hydroxyl Radicals, Environ. Sci. Technol., 43(23), 8794–8800, doi:10.1021/es901745h,
2009.
Lauraguais, A., Coeur-Tourneur, C., Cassez, A. and Seydi, A.: Rate constant and secondary organic aerosol yields for the
gas-phase reaction of hydroxyl radicals with syringol (2,6-dimethoxyphenol), Atmos. Environ., 55, 43–48, 20
doi:10.1016/j.atmosenv.2012.02.027, 2012.
Lauraguais, A., Coeur-Tourneur, C., Cassez, A., Deboudt, K., Fourmentin, M. and Choël, M.: Atmospheric reactivity of
hydroxyl radicals with guaiacol (2-methoxyphenol), a biomass burning emitted compound: Secondary organic aerosol
formation and gas-phase oxidation products, Atmos. Environ., 86, 155–163, doi:10.1016/j.atmosenv.2013.11.074, 2014.
Liu, C., Zhang, P., Wang, Y., Yang, B. and Shu, J.: Heterogeneous Reactions of Particulate Methoxyphenols with NO 3 25
Radicals: Kinetics, Products, and Mechanisms, Environ. Sci. Technol., 46(24), 13262–13269, doi:10.1021/es303889z, 2012.
Maenhaut, W., Vermeylen, R., Claeys, M., Vercauteren, J. and Roekens, E.: Sources of the PM10 aerosol in Flanders,
Belgium, and re-assessment of the contribution from wood burning, Sci. Total Environ., 562, 550–560,
doi:10.1016/j.scitotenv.2016.04.074, 2016.
May, A. A., Saleh, R., Hennigan, C. J., Donahue, N. M. and Robinson, A. L.: Volatility of Organic Molecular Markers Used 30
for Source Apportionment Analysis: Measurements and Implications for Atmospheric Lifetime, Environ. Sci. Technol.,
46(22), 12435–12444, doi:10.1021/es302276t, 2012.
Mohr, C., Lopez-Hilfiker, F. D., Zotter, P., Prévôt, A. S. H., Xu, L., Ng, N. L., Herndon, S. C., Williams, L. R., Franklin, J.
P., Zahniser, M. S., Worsnop, D. R., Knighton, W. B., Aiken, A. C., Gorkowski, K. J., Dubey, M. K., Allan, J. D. and
20
Thornton, J. A.: Contribution of Nitrated Phenols to Wood Burning Brown Carbon Light Absorption in Detling, United
Kingdom during Winter Time, Environ. Sci. Technol., 47(12), 6316–6324, doi:10.1021/es400683v, 2013.
Net, S., Alvarez, E. G., Gligorovski, S. and Wortham, H.: Heterogeneous reactions of ozone with methoxyphenols, in
presence and absence of light, Atmos. Environ., 45(18), 3007–3014, doi:10.1016/j.atmosenv.2011.03.026, 2011.
Ng, N. L., Canagaratna, M. R., Jimenez, J. L., Chhabra, P. S., Seinfeld, J. H. and Worsnop, D. R.: Changes in organic 5
aerosol composition with aging inferred from aerosol mass spectra, Atmos. Chem. Phys., 11(13), 6465–6474,
doi:10.5194/acp-11-6465-2011, 2011.
Nolte, C. G., Schauer, J. J., Cass, G. R. and Simoneit, B. R. T.: Highly Polar Organic Compounds Present in Meat Smoke,
Environ. Sci. Technol., 33(19), 3313–3316, doi:10.1021/es990122v, 1999.
Nolte, C. G., Schauer, J. J., Cass, G. R. and Simoneit, B. R.: Highly polar organic compounds present in wood smoke and in 10
the ambient atmosphere, Environ. Sci. Technol., 35(10), 1912–1919, 2001.
Nussbaumer, T., Verenum, Ingenieurbüro für Verfahrens-, Energie- und Umwelttechnik, Hochschule Luzern and Schweiz,
Eds.: Overview on Technologies for Biomass Combustion and Emission Levels of Particulate Matter, 11. Holzenergie-
Symposium ; 17. September 2010, ETH Zürich, TEMAS AG, Arbon., 2010.
Platt, S. M., El Haddad, I., Zardini, A. A., Clairotte, M., Astorga, C., Wolf, R., Slowik, J. G., Temime-Roussel, B., 15
Marchand, N., Ježek, I., Drinovec, L., Močnik, G., Möhler, O., Richter, R., Barmet, P., Bianchi, F., Baltensperger, U. and
Prévôt, A. S. H.: Secondary organic aerosol formation from gasoline vehicle emissions in a new mobile environmental
reaction chamber, Atmospheric Chem. Phys., 13(18), 9141–9158, doi:10.5194/acp-13-9141-2013, 2013.
Rogge, W. F., Hildemann, L. M., Mazurek, M. A., Cass, G. R. and Simoneit, B. R. T.: Sources of fine organic aerosol. 2.
Noncatalyst and catalyst-equipped automobiles and heavy-duty diesel trucks, Environ. Sci. Technol., 27(4), 636–651, 20
doi:10.1021/es00041a007, 1993a.
Rogge, W. F., Hildemann, L. M., Mazurek, M. A., Cass, G. R. and Simoneit, B. R. T.: Sources of fine organic aerosol. 3.
Road dust, tire debris, and organometallic brake lining dust: roads as sources and sinks, Environ. Sci. Technol., 27(9), 1892–
1904, doi:10.1021/es00046a019, 1993b.
Sandradewi, J., Prévôt, A. S. H., Weingartner, E., Schmidhauser, R., Gysel, M. and Baltensperger, U.: A study of wood 25
burning and traffic aerosols in an Alpine valley using a multi-wavelength Aethalometer, Atmos. Environ., 42(1), 101–112,
doi:10.1016/j.atmosenv.2007.09.034, 2008.
Schauer, J. J., Kleeman, M. J., Cass, G. R. and Simoneit, B. R. T.: Measurement of Emissions from Air Pollution Sources. 1.
C1 through C29 Organic Compounds from Meat Charbroiling, Environ. Sci. Technol., 33(10), 1566–1577,
doi:10.1021/es980076j, 1999. 30
Schauer, J. J., Kleeman, M. J., Cass, G. R. and Simoneit, B. R. T.: Measurement of Emissions from Air Pollution Sources. 3.
C1 − C29 Organic Compounds from Fireplace Combustion of Wood, Environ. Sci. Technol., 35(9), 1716–1728,
doi:10.1021/es001331e, 2001.

21
Schauer, J. J., Kleeman, M. J., Cass, G. R. and Simoneit, B. R. T.: Measurement of Emissions from Air Pollution Sources. 5.
C1 − C32 Organic Compounds from Gasoline-Powered Motor Vehicles, Environ. Sci. Technol., 36(6), 1169–1180,
doi:10.1021/es0108077, 2002.
Schmidl, C., Marr, I. L., Caseiro, A., Kotianová, P., Berner, A., Bauer, H., Kasper-Giebl, A. and Puxbaum, H.: Chemical
characterisation of fine particle emissions from wood stove combustion of common woods growing in mid-European Alpine 5
regions, Atmos. Environ., 42(1), 126–141, doi:10.1016/j.atmosenv.2007.09.028, 2008a.
Schmidl, C., Bauer, H., Dattler, A., Hitzenberger, R., Weissenboeck, G., Marr, I. L. and Puxbaum, H.: Chemical
characterisation of particle emissions from burning leaves, Atmos. Environ., 42(40), 9070–9079,
doi:10.1016/j.atmosenv.2008.09.010, 2008b.
Simoneit, B. R., Rogge, W. F., Mazurek, M. A., Standley, L. J., Hildemann, L. M. and Cass, G. R.: Lignin pyrolysis 10
products, lignans, and resin acids as specific tracers of plant classes in emissions from biomass combustion, Environ. Sci.
Technol., 27(12), 2533–2541, 1993.
Trump, E. R., Epstein, S. A., Riipinen, I. and Donahue, N. M.: Wall effects in smog chamber experiments: A model study,
Aerosol Sci. Technol., 50(11), 1180–1200, doi:10.1080/02786826.2016.1232858, 2016.
Waked, A., Favez, O., Alleman, L. Y., Piot, C., Petit, J.-E., Delaunay, T., Verlinden, E., Golly, B., Besombes, J.-L., Jaffrezo, 15
J.-L. and Leoz-Garziandia, E.: Source apportionment of PM10 in a north-western Europe regional urban background site
(Lens, France) using positive matrix factorization and including primary biogenic emissions, Atmos. Chem. Phys., 14(7),
3325–3346, doi:10.5194/acp-14-3325-2014, 2014.
Weitkamp, E. A., Sage, A. M., Pierce, J. R., Donahue, N. M. and Robinson, A. L.: Organic Aerosol Formation from
Photochemical Oxidation of Diesel Exhaust in a Smog Chamber, Environ. Sci. Technol., 41(20), 6969–6975, 20
doi:10.1021/es070193r, 2007.
Williams, B. J., Goldstein, A. H., Kreisberg, N. M. and Hering, S. V.: An In-Situ Instrument for Speciated Organic
Composition of Atmospheric Aerosols: Thermal Desorption Aerosol GC/MS-FID (TAG), Aerosol Sci. Technol., 40(8), 627–
638, doi:10.1080/02786820600754631, 2006.
Williams, B. J., Jayne, J. T., Lambe, A. T., Hohaus, T., Kimmel, J. R., Sueper, D., Brooks, W., Williams, L. R., Trimborn, 25
A. M., Martinez, R. E., Hayes, P. L., Jimenez, J. L., Kreisberg, N. M., Hering, S. V., Worton, D. R., Goldstein, A. H. and
Worsnop, D. R.: The First Combined Thermal Desorption Aerosol Gas Chromatograph—Aerosol Mass Spectrometer (TAG-
AMS), Aerosol Sci. Technol., 48(4), 358–370, doi:10.1080/02786826.2013.875114, 2014.
Wong, Z., Chen, K. and Li, J.: Formation of vanillin and syringaldehyde in an oxygen delignification process, BioResources,
5(3), 1509–1516, 2010. 30
Yang, X.-Y., Igarashi, K., Tang, N., Lin, J.-M., Wang, W., Kameda, T., Toriba, A. and Hayakawa, K.: Indirect- and direct-
acting mutagenicity of diesel, coal and wood burning-derived particulates and contribution of polycyclic aromatic
hydrocarbons and nitropolycyclic aromatic hydrocarbons, Mutat. Res. Toxicol. Environ. Mutagen., 695(1–2), 29–34,
doi:http://dx.doi.org/10.1016/j.mrgentox.2009.10.010, 2010.

22
Ye, P., Ding, X., Hakala, J., Hofbauer, V., Robinson, E. S. and Donahue, N. M.: Vapor wall loss of semi-volatile organic
compounds in a Teflon chamber, Aerosol Sci. Technol., 50(8), 822–834, doi:10.1080/02786826.2016.1195905, 2016.
Yee, L. D., Kautzman, K. E., Loza, C. L., Schilling, K. A., Coggon, M. M., Chhabra, P. S., Chan, M. N., Chan, A. W. H.,
Hersey, S. P., Crounse, J. D., Wennberg, P. O., Flagan, R. C. and Seinfeld, J. H.: Secondary organic aerosol formation from
biomass burning intermediates: phenol and methoxyphenols, Atmos. Chem. Phys., 13(16), 8019–8043, doi:10.5194/acp-13-5
8019-2013, 2013.
Yu, H.: Environmental carcinogenic polycyclic aromatic hydrocarbons: photochemistry and phototoxicity, J. Environ. Sci.
Health Part C Environ. Carcinog. Ecotoxicol. Rev., 20(2), 10.1081/GNC-120016203, doi:10.1081/GNC-120016203, 2002.
Zhang, X., Schwantes, R. H., McVay, R. C., Lignell, H., Coggon, M. M., Flagan, R. C. and Seinfeld, J. H.: Vapor wall
deposition in Teflon chambers, Atmos. Chem. Phys., 15(8), 4197–4214, doi:10.5194/acp-15-4197-2015, 2015. 10
15
20
25
Table 1: Summary of the experiments and conditions in the chamber before lights-on (after a homogenization and stabilization
period). MCE stands for modified combustion efficiency and THC is total hydrocarbon.

23
5
10
15
20
Stove Exp # MCE
Nb of TAG-
AMS samples
*[eBC]
(µg.m-3
)
*[POA]
(µg.m-3
)
**[OA]
(µg.m-3
)
*[NOx]
(ppb)
[THC]/[NOx]
(ppb/ppb)
[Cresol]/[NOx]
(ppb/ppb)
Exp 1 0.85 6 17 122 495 98 31.5 1.1 × 10⁻¹
Exp 2 0.84 7 12 177 785 252 26.9 1.1 × 10⁻¹
Exp 3 0.83 7 6 71 388 90 38.5 1.2 × 10⁻¹
Exp 4 0.91 8 5 10 72 128 7.7 2.7 × 10⁻²
Exp 5 0.80 7 5 41 143 50 47.2 1.2 × 10⁻¹
Exp 6 0.87 7 13 38 202 119 18.1 5.0 × 10⁻²
Exp 7 0.82 6 6 45 289 114 24.3 7.2 × 10⁻²
Exp 8 0.90 7 4 9 53 80 19.6 4.5 × 10⁻²
Exp 9 0.97 5 107 10 19 161 5.2 1.2 × 10⁻³
Exp 10 0.97 6 130 10 19 205 5.8 4.7 × 10⁻⁴
Exp 11 0.97 5 144 10 22 228 5.9 3.5 × 10⁻⁴
*values retrieved just before lights on
**values retrieved at integrated OH exposure = 5 × 10⁶ molecules cm
-3 hour
Stove A
(Beech as logs)
Stove B
(Beech as logs)
Stove C
(Softwood pellets)

24
Figure 1: Schemes of the atmospheric chamber set-up (a) and TAG-AMS with in-situ derivatization (b).
5
10
-
- -
-
- -
-
-
-

25
Figure 2: Example of the TAG-AMS and offline (quartz fiber filters) measurements sampling schedule during an aging
experiment conducted at the PSI atmospheric chamber with emissions generated from woodstove appliances (Exp. 7, stove B). One 5
sampling with the TAG-AMS is carried out before lights on to characterize POA. At t = 0 h, HONO is injected and the lights
turned on to initiate photo-chemistry. 4 to 6 samples were taken during the aging period.
10
350
300
250
200
150
100
50
0
Co
nce
ntr
atio
n (
µg
m-3
)
00:00 01:00 02:00 03:00
Time after lights on (hour)
Filter 1
Filter 2 SOA POA BC TAG-AMS Sampling Period
6x106543210
Integrated OH exposure (molecules cm-3
hour)

26
Figure 3: Contribution of the organic markers measured by TAG-AMS to the total POA mass concentration (indicated on graph)
measured by HR-ToF-AMS, for all experiments. 5
Others Alkanes PAHs Sub.Guaiacols Sub. Syringols Fatty acids Galactosan Mannosan Levoglucosan
Logwood Stove A
Logwood Stove B
Pellet Stove C
Exp. 1sssssssssxxxxxxxxxffffffffff
Exp. 1 Exp. 2 Exp. 3 Exp. 4
Exp. 5 Exp. 6 Exp. 7 Exp. 8
Exp. 9 Exp. 10 Exp. 11
100
80
60
40
20
0
% o
f to
tal P
OA
mass
100
80
60
40
20
0
% o
f to
tal P
OA
ma
ss
100
80
60
40
20
0
% o
f to
tal P
OA
mass
MCE : 0.85
122 µg m-3
MCE : 0.84
177 µg m-3
MCE : 0.83
71 µg m-3
MCE : 0.91
10 µg m-3
MCE : 0.80
41 µg m-3
MCE : 0.87
38 µg m-3
MCE : 0.82
45 µg m-3
MCE : 0.90
9 µg m-3
MCE : 0.97
10 µg m-3
MCE : 0.97
10 µg m-3
MCE : 0.97
10 µg m-3

27
5

28
Figure 4: Emissions factors of POA, levoglucosan, and methoxyphenols, as well as their contribution to the total OA as a function
of the modified combustion efficiency (MCE). Details on how the MCE was calculated are given in Bertrand et al. (2017).
50
40
30
20
10
0Levo
glu
cosa
n (
% O
A)
10.950.90.850.8
MCE
(e)
R2 = 0.37
25
20
15
10
5
0
Me
tho
xyp
he
no
ls (%
OA
)10.950.90.850.8
MCE
(f)
R2 = 0.41
200
150
100
50
0
Me
tho
xyp
he
no
ls (m
g.k
g-1)
R² = 0.65
(d)
300
250
200
150
100
50
0Levo
glu
cosa
n (
mg
.kg
-1)
R² = 0.61
(c)
Stove A Stove B Stove C
1.2
0.8
0.4
0
PO
A (
g.k
g-1
)
10.950.90.850.8
MCE
(a)
R2 = 0.61
100
80
60
40
20
0
% o
f tota
l PO
A id
en
tified
10.950.90.850.8
MCE
(b)
R2 = 0.51

29
Figure 5: Overview of the changes occurring in the chemical fingerprint at the molecular level of biomass burning organic aerosol
during atmospheric aging. Organic markers decaying (green) or forming (red) during the aging. The figure is a three-dimensional
representation of the difference in intensity of the peaks (normalized to the signal of the internal standards) calculated between
aged (integrated OH exposure of 5 × 10⁶ molecules cm−3 h) and fresh samples. The samples were collected on quartz fiber filters 5
and analyzed with -GCxGC EI-HR-ToF-MS (see SI). (a) view from the top, (b) view from the bottom.
10
VolatilityPolarity
4-nitrocatechol
3-methyl-5-nitrocatechol
levoglucosan
syringyl acetone
syringol
hexadecanol
octadecanol
5-nitrovanillin
2-hydroxyglutaric acid
(a)
(b)
4-methyl-5-nitrocatechol

30

31
Figure 6: Typical evolution of the chemical fingerprint of the organic aerosol emitted by biomass burning during atmospheric
aging (Exp. 2, stove A). “Identified OA mass” refers to the OA mass concentration whose molecular composition is resolved by
TAG-AMS.
5
Figure 7: Mean enhancement ratios (ER) of individual compounds in biomass burning emissions. The ER is defined as the pWLC 10
concentration measured in the particle phase within a time range corresponding to an integrated OH exposure of 4 × 10⁶ - 6 × 10⁶
molecules cm-3 hour (bin 4, Figure 6) and divided by the concentration in the particle phase measured at t0 (ie. before lights on).
An ER of 0.8 means a loss of 20 % during aging after pWLC. Note that for the secondary compounds (red) observed after the start
of the photo-oxidative process only, the ERs are calculated using the detection limit. Error bars show the standard deviation
derived from all experiments. 15
700
600
500
400
300
200
100
Ole
ic A
cid
Pa
lmito
leic
Acid
Syn
ap
yl A
lde
hyd
eB
en
zo
[j]flu
ora
nth
en
eA
ce
na
ph
tyle
ne
Syring
yl A
ce
ton
eIs
oe
ug
en
ol
Co
nyfe
ryl A
lde
hyd
e3
-Gu
aia
cylp
rop
an
ol
Ga
lacto
sa
nA
ce
tosyring
on
eS
yring
ol
Be
nzo
[k,l]x
an
the
ne
P
rop
ion
yl S
yring
ol
Be
nzo
[b]flu
ora
nth
ren
eM
an
no
sa
nL
evo
glu
co
sa
nB
en
zo
[a]a
nth
race
ne
2-m
eth
yla
nth
race
ne
He
pta
co
sa
ne
Me
thyls
yring
ol
Ch
ryse
ne
Syring
ald
eh
yd
eA
nth
race
ne
Te
tra
co
sa
ne
3-m
eth
ylp
he
na
nth
ren
eH
exa
co
sa
ne
Trico
sa
ne
1,2
-Ace
na
ph
thyle
no
ne
Ace
ph
en
an
thre
ne
Flu
ore
ne
4,9
-me
thylp
he
na
nth
ren
eP
he
na
nth
ren
eA
ce
na
ph
ten
e1
-me
thylp
he
na
nth
ren
eD
oco
sa
ne
He
ne
ico
sa
ne
Cyclo
pe
nta
[d,e
,f]p
he
na
nth
ren
e2
-me
thylp
he
na
nth
ren
eP
en
taco
sa
ne
2,3
-5,6
-Dib
en
zo
xa
len
eO
cta
de
ca
ne
Eic
osa
ne
No
na
de
ca
ne
Tyro
so
lV
an
iline
Va
nili
c a
cid
Ace
tova
nilo
ne
Pyro
ga
llol
Va
nill
ylm
an
de
lic a
cid
4-M
eth
yl-5
-Nitro
ca
tech
ol
Me
thylg
luta
ric a
cid
3-M
eth
yl-5
-Nitro
ca
tech
ol
4-N
itro
ca
tech
ol
1
0.8
0.6
0.4
0.2
0
8
41
0.8
0.6
0.4
0.2
0
Enhancem
ent
Ratio
700
600
500
400
300
200
100
8
4
*Enhancement ratio calulated from detection limit (DL) if null value in primary emissions
Primary compounds Non-conventional primary compounds Secondary compounds*

32
5
Table 2: pWLC contribution of the compounds to the total OA mass concentration at different times of the photo-oxidative
process. This table only contains a list of selected compounds and average values. Data from all experiments are divided into seven 10
bins of different integrated OH exposure intervals (from 0 to 9 × 10⁶ molecules cm-3 hour) then averaged. A full list, with minimum
and maximum values is also available in the SI.
Integrated OH exposure
(molecules cm-3 hour)
(n = nb samples)
Bin 0 Bin 1 Bin 2 Bin 3 Bin 4 Bin 5 Bin 6
0
n = 11
> 0 - 5 x 10⁵
n = 8
0.5 - 2 x 10⁶
n = 12
2 - 4 x 10⁶
n = 15
4 - 6 x 10⁶
n = 16
6 - 7.5 x 10⁶
n = 7
7.5 - 9 x 10⁶
n = 2
Total OA (µg.m-3) (min - max) 9 - 177 32 - 409 13 - 715 18 - 790 19 - 774 18 - 504 50 - 517
Total Contribution* (% OA) 52 20 20 14 10 13 9
Primary Compounds (%OA)
Levoglucosan 29.2 9.5 9.6 6.3 4.6 6.0 3.5
Mannosan 3.2 0.8 1.4 0.9 0.5 0.8 0.3
Fluorene 0.15 0.06 0.07 0.05 0.03 0.05 0.08
Phenanthrene 0.41 0.18 0.19 0.16 0.12 0.16 0.1
Anthracene 0.08 0.04 0.03 0.02 0.02 0.02 0.02
Fluoranthrene 0.22 0.07 0.14 0.13 0.1 0.2 0.14
Pyrene 0.08 0.02 0.05 0.05 0.04 0.07 0.05
1,2-Acenaphthylenone 0.31 0.14 0.15 0.10 0.08 0.11 0.08
9H-Fluoren-9-one 0.03 0.01 0.02 0.02 0.01 0.02 0.02
Cyclopenta[d,e,f]phenanthrene 0.03 < 0.01 0.01 0.01 < 0.01 0.01 0.01
3-Guaiacylpropanol 0.28 0.10 0.05 0.03 0.03 0.02 0.03
Conyferyl Aldehyde 0.29 0.07 0.04 0.03 0.02 0.02 0.02
Syringaldehyde 2.7 1.7 1.1 0.7 0.5 0.6 0.6
Syringol 1.43 1.08 0.59 0.25 0.16 0.19 0.13
Methylsyringol 0.09 0.06 0.03 0.01 0.01 0.01 0.01
Acetosyringone 0.41 0.20 0.11 0.06 0.05 0.05 0.05
Isoeugenol 1.22 0.67 0.27 0.09 0.08 0.09 0.09
Syringyl Acetone 4.6 1.5 0.4 0.2 0.2 0.2 0.3
Propionyl Syringol 0.7 0.3 0.2 0.2 0.1 0.1 0.1
Synapyl Aldehyde 0.9 0.2 0.09 0.05 0.03 0.04 0.04
Palmitic Acid 0.28 0.09 0.15 0.09 0.06 0.11 0.04
Stearic Acid 0.11 0.05 0.06 0.04 0.03 0.05 0.02
Non-Conventional Primary Compounds (% OA)
Vanillin 1.7 0.8 1.1 0.9 0.6 1.0 0.7
Acetovanillone 0.29 0.13 0.17 0.14 0.14 0.14 0.1
Vanillic Acid 0.24 0.12 0.16 0.14 0.1 0.14 0.09
Syringic Acid 0.17 0.09 0.11 0.08 0.06 0.08 0.05
Pyrogallol 0.02 0.02 0.03 0.02 0.02 0.02 0.01
Tyrosol 0.36 0.16 0.17 0.12 0.09 0.12 0.15

33
Secondary Compounds (%OA)
4 Nitrocatechol 0.2 0.8 1.7 2.4 1.8 1.9 1.1
4-Methyl-5-Nitrocatechol 0.05 0.15 0.2 0.18 0.14 0.15 0.11
3-Methyl-5-Nitrocatechol 0.15 0.48 0.45 0.32 0.25 0.24 0.19
Vanillylmandelic acid 0.02 0.08 0.06 0.04 0.03 0.03 0.02
Methylglutaric acid < 0.01 0.02 0.02 0.02 0.02 0.02 0.02
*Sum from the contribution of all compounds averaged within the bins
5

34
Figure 8: Evolution of the contribution of several markers to the OA(t) mass concentration at different time points in the photo-
oxidation process. The marker represents the mean value over all experiments within a specific range of integrated OH exposure.
The box includes the minimum and maximum within the same range. 5
5
4
3
2
1
Vanillin
6
4
2
0> 0
- 0
.5 x
10
6
0.5
- 2
x 1
06
2 -
4 x
10
6
4 -
6 x
10
6
6 -
7.5
x 1
06
7.5
- 9
x 1
06
4-Nitrocatechol
8
6
4
2
Syringil Acetone
1.0
0.8
0.6
0.4
0.2
3,5-MethylNitrocatechol
50
40
30
20
10
Levoglucosan
min - max Primary Non-conventional Primary Secondary
Co
ntr
ibutio
n t
o O
A t
ota
l (%
)
Bins of OH exposure

35
Figure 9: HR-ToF-AMS measurements against TAG-AMS measurements. C6H5NO4+ (m/z 155.022) vs. 4-nitrocatechol (top), and
C6H2NO4+ (m/z 151.098) vs. alkylated nitrocatechols (3-methyl-5-nitrocatechol and 4-methyl-5-nitrocatechol) (bottom), during the 5
aging of biomass burning emissions. Intensities of C6H5NO4+ (m/z 155.022) and C6H2NO4
+ (m/z 151.098) from the HR-ToF-AMS
data are expressed here in µg m-3 nitrate equivalent which reflects the peak intensities and not an actual concentration. A
dedicated calibration of the HR-ToF-AMS is needed.