Short-wave radiative effects of biomass burning aerosol during SAFARI2000
25
Q. J. R. Meteorol. Soc. (2004), 130, pp. 1423–1447 doi: 10.1256/qj.03.134 Short-wave radiative effects of biomass burning aerosol during SAFARI2000 By SIMON R. OSBORNE 1 ∗ , JAMES M. HAYWOOD 1 , PETER N. FRANCIS 1 and OLEG DUBOVIK 2,3 1 Met Office, Exeter, UK 2 Laboratory for Terrestrial Physics, Goddard Space Flight Center, NASA, Greenbelt, USA 3 Goddard Earth Sciences and Technology Center, University ofMaryland Baltimore County, USA (Received 29 July 2003; revised 2 February 2004) SUMMARY We present data from two case-studies during the Southern AFricAn Research Initiative (SAFARI2000) of the radiative effects of a biomass burning plume advecting over the ocean. In situ aircraft measurements were made of the aerosol vertical structure, the aerosol microphysics, and the aerosol optical properties (scattering and absorption coefficients). Remote sensing measurements of the upwelling broadband short-wave (SW) radiative fluxes (0.3–3.0 µm) were made above the plume. Together with modelling of the clear-air flux using a flexible radiation scheme, we have been able to determine the local mean direct radiative effects of the aerosol column for the two cases. Aerosol optical depths were derived using a number of techniques: the upwelling fluxes, vertical integration of the in situ extinction coefficient, and using downwelling sky radiances. These optical depths are compared and discussed; discrepancies are revealed through instrument sampling problems and horizontal inhomogeneity of the aerosol. Spectrally resolved downwelling SW sky radiances as a function of scattering angle were measured and modelled. The modelling technique illustrates the importance of including unpolluted marine boundary-layer aerosol as part of the aerosol column. A retrieval algorithm that uses the measured downwelling sky radiances as input has also been utilized. This algorithm derives a columnar aerosol size distribution for comparison against the measured biomass burning and marine boundary-layer size distributions. The retrieved columnar size distribution is acceptable in representing the atmospheric aerosol in terms of describing the effect on scattered radiances. KEYWORDS: Aerosol optical depth Aircraft measurements Downwelling sky radiances Flexible radiation code Upwelling irradiances 1. I NTRODUCTION Emissions of aerosol particles produced by the natural and, in particular, the anthropogenic burning of biomass are known to perturb global atmospheric chemistry (Andreae and Merlet 2001). The biomass burning plumes, mostly located in the tropics, also have a regional, and probably a global, impact on the radiation budget of the atmos- phere, through the direct extinction (scattering and absorption) of radiation (Penner et al. 1992). Biomass burning aerosol has also been shown to exhibit an indirect forcing through the modification of clouds on a regional scale (Kaufman and Fraser 1997), and also on a global scale (Chuang et al. 2000). Haywood et al. (2003a) describe the pertinent physical and optical properties of biomass burning plumes encountered during the Southern AFricAn Research Initiative (SAFARI2000). Haywood et al. (2003a) showed that aged biomass burning aerosols exhibit significant absorption in the visible spectrum, having a mean single scattering albedo (ω 0 ) throughout SAFARI2000 of 0.91 ± 0.04 at a wavelength of 0.55 µm. With this much absorption, the aerosol layer can produce a significant positive radiative forcing when lying above a relatively highly reflective layer of stratocumulus typical of that observed off the coasts of Namibia and Angola (Keil and Haywood 2003). Haywood et al. (2003b) have already performed a case-study from SAFARI2000 over a land surface site in northern Namibia, where aerosol optical depths at 0.55 µm, τ 0.55 , were found to be approximately 0.5. The present work shows the radiative properties of the smoke plume as it advects over an ocean surface. Additionally, the work of Haywood et al. (2003c) complements the present work as it presents similar methodology in ∗ Corresponding author: Met Office, FitzRoy Road, Exeter, Devon EX1 3PB, UK. e-mail: simon.osborne@metoffice.com c Crown copyright, 2004. 1423
-
Upload
independent -
Category
Documents
-
view
1 -
download
0
Transcript of Short-wave radiative effects of biomass burning aerosol during SAFARI2000

Q. J. R. Meteorol. Soc. (2004), 130, pp. 1423–1447 doi: 10.1256/qj.03.134
Short-wave radiative effects of biomass burning aerosol during SAFARI2000
By SIMON R. OSBORNE1∗, JAMES M. HAYWOOD1, PETER N. FRANCIS1 and OLEG DUBOVIK2,3
1Met Office, Exeter, UK2Laboratory for Terrestrial Physics, Goddard Space Flight Center, NASA, Greenbelt, USA
3Goddard Earth Sciences and Technology Center, University of Maryland Baltimore County, USA
(Received 29 July 2003; revised 2 February 2004)
SUMMARY
We present data from two case-studies during the Southern AFricAn Research Initiative (SAFARI2000) ofthe radiative effects of a biomass burning plume advecting over the ocean. In situ aircraft measurements weremade of the aerosol vertical structure, the aerosol microphysics, and the aerosol optical properties (scattering andabsorption coefficients). Remote sensing measurements of the upwelling broadband short-wave (SW) radiativefluxes (0.3–3.0 µm) were made above the plume. Together with modelling of the clear-air flux using a flexibleradiation scheme, we have been able to determine the local mean direct radiative effects of the aerosol columnfor the two cases. Aerosol optical depths were derived using a number of techniques: the upwelling fluxes,vertical integration of the in situ extinction coefficient, and using downwelling sky radiances. These optical depthsare compared and discussed; discrepancies are revealed through instrument sampling problems and horizontalinhomogeneity of the aerosol. Spectrally resolved downwelling SW sky radiances as a function of scattering anglewere measured and modelled. The modelling technique illustrates the importance of including unpolluted marineboundary-layer aerosol as part of the aerosol column. A retrieval algorithm that uses the measured downwellingsky radiances as input has also been utilized. This algorithm derives a columnar aerosol size distribution forcomparison against the measured biomass burning and marine boundary-layer size distributions. The retrievedcolumnar size distribution is acceptable in representing the atmospheric aerosol in terms of describing the effecton scattered radiances.
KEYWORDS: Aerosol optical depth Aircraft measurements Downwelling sky radiances Flexibleradiation code Upwelling irradiances
1. INTRODUCTION
Emissions of aerosol particles produced by the natural and, in particular, theanthropogenic burning of biomass are known to perturb global atmospheric chemistry(Andreae and Merlet 2001). The biomass burning plumes, mostly located in the tropics,also have a regional, and probably a global, impact on the radiation budget of the atmos-phere, through the direct extinction (scattering and absorption) of radiation (Penneret al. 1992). Biomass burning aerosol has also been shown to exhibit an indirect forcingthrough the modification of clouds on a regional scale (Kaufman and Fraser 1997), andalso on a global scale (Chuang et al. 2000).
Haywood et al. (2003a) describe the pertinent physical and optical properties ofbiomass burning plumes encountered during the Southern AFricAn Research Initiative(SAFARI2000). Haywood et al. (2003a) showed that aged biomass burning aerosolsexhibit significant absorption in the visible spectrum, having a mean single scatteringalbedo (ω0) throughout SAFARI2000 of 0.91 ± 0.04 at a wavelength of 0.55 µm.With this much absorption, the aerosol layer can produce a significant positive radiativeforcing when lying above a relatively highly reflective layer of stratocumulus typicalof that observed off the coasts of Namibia and Angola (Keil and Haywood 2003).Haywood et al. (2003b) have already performed a case-study from SAFARI2000 overa land surface site in northern Namibia, where aerosol optical depths at 0.55 µm, τ0.55,were found to be approximately 0.5. The present work shows the radiative properties ofthe smoke plume as it advects over an ocean surface. Additionally, the work of Haywoodet al. (2003c) complements the present work as it presents similar methodology in
∗ Corresponding author: Met Office, FitzRoy Road, Exeter, Devon EX1 3PB, UK.e-mail: [email protected]© Crown copyright, 2004.
1423

1424 S. R. OSBORNE et al.
studying the short-wave effects of Saharan mineral dust outbreaks off the coast ofSenegal.
The aims of this paper, through aircraft observations and modelling, are to:
• present in situ measurement of biomass burning aerosol, such as size distributionsand scattering and absorption coefficients;
• use Mie theory to calculate aerosol optical properties to compare to the measuredones;
• present measurements of the local direct radiative effect of the biomass burningplume;
• calculate τ0.55 using as many independent techniques as possible;• compare measured and modelled sky radiances as a function of scattering angle
during banked aircraft orbits;• use an inversion algorithm to derive τ0.55 and an aerosol size distribution to
compare to the other techniques.
Self-consistency in these comparisons would give us confidence in our measure-ments, and show that assumptions we have to make during the course of the analysis arerealistic.
2. OBSERVATIONS
(a) Flight patternsThis paper analyses data gathered by the Met Office C-130 research aircraft in
cloudless skies during flights A788 on 10 September and A789 on 11 September 2000.We have chosen the following aircraft manoeuvres within each flight to achieve ouraims:
(i) straight and level runs (SLRs) at high altitude above the aerosol plume to measureupwelling radiation;
(ii) a profile between this altitude and 15 m above the sea surface to ascertain thevertical structure of the biomass burning plume and its aerosol microphysics; theprofile ascent/descent rates were 2.5 m s−1 within the marine boundary layer(MBL) and 5 m s−1 in the free troposphere;
(iii) SLRs at low level (30 m above sea level) below the biomass burning plume tomeasure downwelling radiation and to measure the MBL aerosol;
(iv) banked orbits to measure sky radiances as a function of scattering angle.
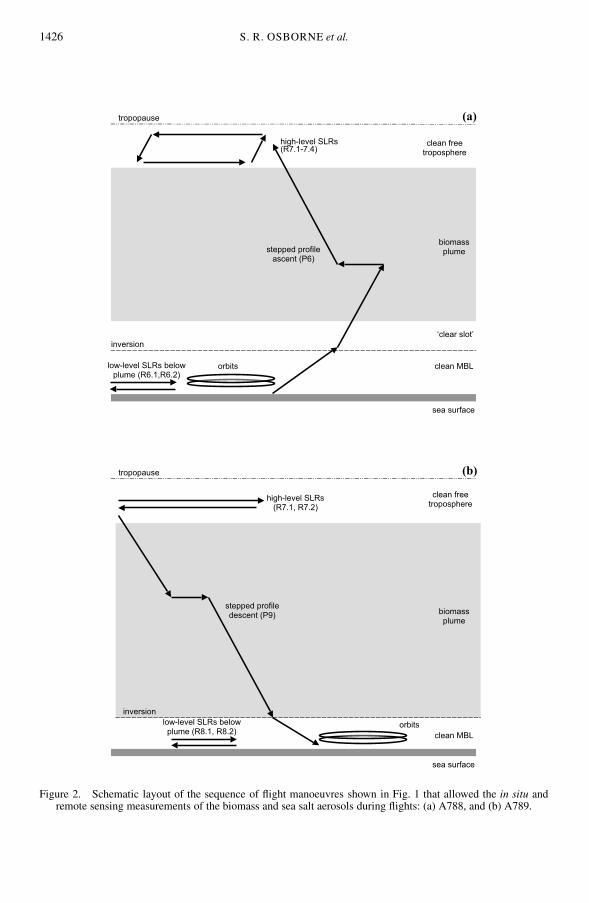
Figure 1 shows the aircraft tracks plotted using the Global Positioning System(GPS) for both flights, because their geographical positions may be relevant given anysignificant spatial inhomogeneity in the aerosol properties; the aircraft manoeuvres forboth flights shown in Fig. 1 span ∼90 km. Figure 2 depicts schematic diagrams to showthe position of the biomass burning plume relative to the various aircraft manoeuvres;the run, profile and orbit numbers have been included here for cross-reference to Fig. 1.
(b) InstrumentationA description of the basic instruments fitted to the aircraft can be found in Johnson
et al. (2000), although some details of the principal instruments referred to in thispaper are given here. Ozone concentrations were measured with a TECO 49 that usesan ultraviolet photometric method over the mixing ratio range 0–1000 ppbv with asensitivity of 2 ppbv. A Particle Measuring System (PMS) Passive Cavity AerosolSpectrometer Probe (PCASP-100X) counted and sized aerosol particles between 0.05

BIOMASS BURNING AEROSOL DURING SAFARI2000 1425
(a)
A
(b)
A
Figure 1. Plot of the aircraft GPS track from the relevant manoeuvres during: (a) flight number A788 on 10September, and (b) flight number A789 on 11 September 2002. Different line styles have been used to designatelow-level orbits and straight and level runs (SLRs, solid lines), profiles (dashed lines) and high-level SLRs (dottedlines). For A788 the manoeuvres took place in the order: R6.1, R6.2, orbits, P6, R7.1, R7.2, R7.3, R7.4, R8.1,R8.2, R9.1, R9.2. For A789, they occurred in the order: R7.1, R7.2, P9, R8.1, R8.2, orbits. Arrows indicate thedirection of flight. The points marked A indicate the convenient positions for calculating distance in Figs. 6 and 7.
Approximate distance scales have also been included.
1426 S. R. OSBORNE et al.
(a) tropopause
low-level SLRs below
plume (R6.1,R6.2)
biomass plume
inversion
(b) tropopause
orbits
low-level SLRs below plume (R8.1, R8.2)
biomass plume
stepped profile descent (P9)
high-level SLRs (R7.1, R7.2)
clean free troposphere
inversion
high-level SLRs (R7.1-7.4)
stepped profile ascent (P6)
orbits
clean free troposphere
‘clear slot’
clean MBL
sea surface
clean MBL
sea surface
Figure 2. Schematic layout of the sequence of flight manoeuvres shown in Fig. 1 that allowed the in situ andremote sensing measurements of the biomass and sea salt aerosols during flights: (a) A788, and (b) A789.

BIOMASS BURNING AEROSOL DURING SAFARI2000 1427
and 1.5 µm radius over 15 size intervals. The assumptions and errors associated withthe PCASP within biomass burning aerosol have been addressed by Haywood et al.(2003a). A Fast-Forward Scattering Spectrometer Probe (FFSSP) is designed to measurecloud droplets between 1 and 23 µm radius. It is also often used to measure similarsized aerosol particles. However, during SAFARI2000 the FFSSP was very inefficientat detecting aerosol particles (and cloud droplets) of radius less than 5 µm. This mayhave been due to low laser power or hardware rejection. Instead a Small Ice Detector(SID), an instrument designed to discriminate between ice and liquid water particlesdown to ∼1 µm, has been used to count and size particles greater than 1.5 µm radius(Hirst et al. 2001; Haywood et al. 2003a). Thus, broadly speaking, SID counts coarsemode particles while the PCASP counts accumulation mode particles. SID measures thespatial scattering pattern when an aerosol particle interacts with a 0.532 µm wavelengthlaser light, by using six detectors arranged azimuthally centred on a forward scatteringangle of 30◦ and a seventh detector positioned at the forward scattering angle. Sphericalparticles will scatter light equally on all six detectors, while non-spherical particles willscatter light unequally onto the detectors depending on particle shape and orientation.
The aerosol absorption coefficient at a wavelength of 0.55 µm (σabs0.55) wasmeasured with a Radiance Research Particle Soot Absorption Photometer (PSAP). Thecorrections suggested by Bond et al. (1999) have been applied to the PSAP data; theycorrect for overestimates in the amount of absorption by typically 20–30%. Aerosolscattering coefficients were determined at three wavelengths (0.45, 0.55, 0.70 µm) witha TSI 3563 integrating nephelometer. The corrections of Anderson and Ogren (1998)have been applied to the nephelometer data, which take into account errors in the angularsensitivity of the light source and detection (which increases the scattering by 5–40%depending on the Angstrom parameter of the aerosols), and also a temperature andpressure correction because the instrument is calibrated at standard temperature andpressure (which is determined largely by the aircraft altitude). Because of the aerosolinlet, the sampling of large particles was very inefficient, and so the nephelometer andPSAP essentially sampled sub-micron aerosol particles (Haywood et al. 2003a).
Broadband hemispherical irradiances covering the solar spectrum (0.3–3.0 µm)were measured with clear-domed Eppley PSP pyranometers mounted on top of andbeneath the aircraft so as to measure both downwelling and upwelling radiation (Foot1985). A Scanning Airborne FIlter RadiometEr (SAFIRE) was also operated in a zenithview such that radiances at 0.55, 0.62, 0.87, 1.04, 1.25, 1.61 and 2.01 µm were measuredas a function of scattering angle whilst the aircraft was performing banked orbits. Flyingbelow the biomass burning aerosol thus allowed us to analyse the sky radiance spectrumtransmitted through the aerosol column (Francis et al. 1999; Haywood et al. 2003b).
3. AEROSOL PHYSICAL AND OPTICAL PROPERTIES
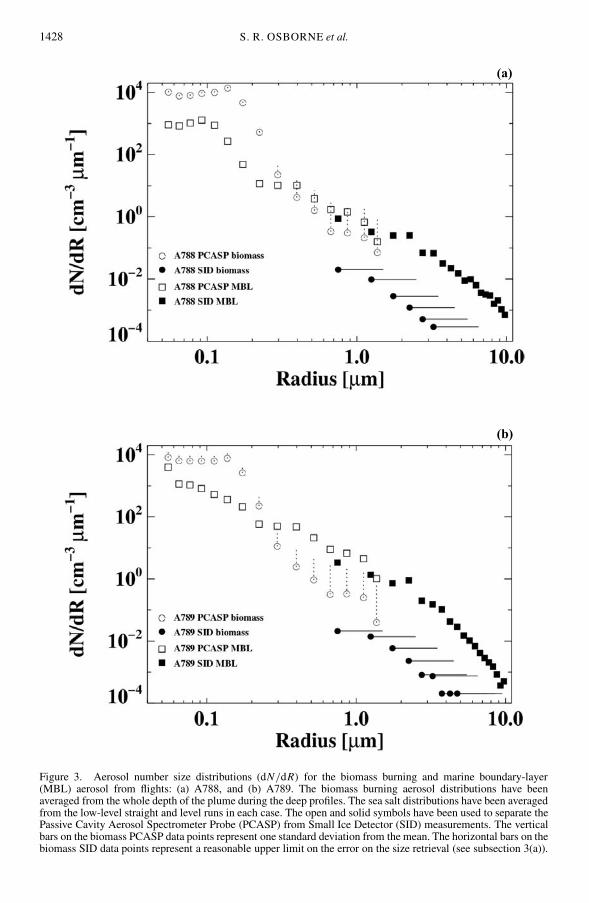
(a) Size distributionsBiomass burning and MBL aerosol size distributions from flights A788 and A789
are shown in Fig. 3. Each distribution represents a mean over ∼30 minutes of data.The vertical error bars for the PCASP biomass burning aerosol data for each flightrepresent one standard deviation from the mean. SID is capable of determining whethera particle is spherical or non-spherical (Haywood et al. 2003a), and is also capable ofsizing aerosol particles. In sizing individual particles, SID returns a radius equivalentto that of a spherical water droplet, independently of whether or not the particles arespherical. There are three main mechanisms by which SID may wrongly classify the
1428 S. R. OSBORNE et al.
(a)
(b)
Figure 3. Aerosol number size distributions (dN/dR) for the biomass burning and marine boundary-layer(MBL) aerosol from flights: (a) A788, and (b) A789. The biomass burning aerosol distributions have beenaveraged from the whole depth of the plume during the deep profiles. The sea salt distributions have been averagedfrom the low-level straight and level runs in each case. The open and solid symbols have been used to separate thePassive Cavity Aerosol Spectrometer Probe (PCASP) from Small Ice Detector (SID) measurements. The verticalbars on the biomass PCASP data points represent one standard deviation from the mean. The horizontal bars on thebiomass SID data points represent a reasonable upper limit on the error on the size retrieval (see subsection 3(a)).

BIOMASS BURNING AEROSOL DURING SAFARI2000 1429
size of an aerosol particle. Firstly, the refractive index (both the real and imaginary parts)of the aerosol particle may differ from that of water. Secondly, non-spherical scatteringeffects from randomly oriented aerosol particles may lead to reduced scattering at 20–40◦ from the forward direction. Thirdly, acceleration effects in the probe may mean thatthe particles sampled by the SID probe are not randomly oriented, but are oriented in apreferential direction determined by aerodynamic forces, which could exacerbate non-spherical scattering effects. Figure 3 shows that in the MBL the overlap between the sizedistributions derived from the SID probe are in agreement with those derived from thePCASP. This is because in the MBL the particles consist predominantly of deliquescedsea salt particles and, therefore, are spherical with a refractive index close to that ofwater. SID, therefore, sizes super-micron MBL aerosols accurately.
For the biomass burning particles a discontinuity between the PCASP and the SIDsize distributions occurs (Fig. 3). We have performed sensitivity calculations usingthe t-matrix code of Mishchenko (1991), assuming prolate and oblate spheroids, toinvestigate the effects both of the differing refractive index and the of non-sphericityon the sizing of non-spherical biomass burning aerosol particles. We assume prolatespheroids with aspect ratios of 1.5 and 2, and oblate spheroids with aspect ratios of 0.5and 0.667. Our results suggest that both refractive index and non-sphericity effects leadto an undersizing of the aerosol particles by SID. For particle sizes of ∼1 µm radius,differences in the refractive index lead to a reduction in the intensity of the scatteredradiation at scattering angles of 20–40◦ from the SID laser by a factor of 1.15. Thecombined effects of non-spherical scattering and refractive index differences lead to atotal reduction in intensity of approximately 2.15. Combining this reduction in scatteredintensity from the phase function with the geometry and response functions of thedetectors, suggests an underestimation of the particle size by factor of 1.3–1.52 (mean1.4), depending upon the mixture of non-spherical particles assumed. The effects of non-random orientation caused by particle acceleration through the SID probe is beyond thescope of this paper but, given the above analysis, a systematic under-sizing of at least afactor of 1.5 has been demonstrated. Thus, we include a horizontal error bar on the SIDdata points for biomass burning particles in Fig. 3 of a factor of two.
Measurements made during SAFARI2000 on board a Convair-580 aircraft (CV580)with an Aerosol Asymmetry Analyzer show that there was no significant departure fromspherical for the biomass burning sub-micron aerosol (Peter Hobbs, personal commu-nication 2004). Therefore the assumption of Mie scattering is appropriate with regardto the performance of the PCASP. Additionally, Haywood et al. (2003b) have shownthat sky radiances are accurately modelled for biomass burning aerosol particles whenonly the PCASP size distribution is used in radiative transfer calculations and super-micron particles are excluded. Thus, super-micron biomass burning aerosol particleshave negligible effect on the 0.3–3.0 µm radiation relevant to this study. This is becausesuper-micron particles interact only weakly with radiation at solar wavelengths, andbecause there are relatively few super-micron biomass burning particles. Therefore thefact that the SID probe has a large potential sizing error for biomass burning aerosolshas a negligible affect on the results presented in later sections. However, for sea-saltparticles Fig. 3 shows that there are proportionally one to two orders of magnitudemore super-micron particles than is the case for biomass burning aerosols, and hencethe effects of these particles upon the 0.3–3.0 µm solar spectrum cannot be consideredto be negligible.
To summarize: the MBL aerosol size distribution is well represented across sub- andsuper-micron sizes; the biomass burning aerosol is well characterized by the PCASPfor sub-micron particles, but significant undersizing by SID occurs for super-micron

1430 S. R. OSBORNE et al.
particles; however, the super-micron biomass burning aerosol does not significantlyaffect solar radiances and irradiances investigated in this study.
(b) Optical propertiesFor the purposes of Mie scattering calculations, the aerosol refractive index within
the MBL has been obtained from the literature (Shettle and Fenn 1979), by assumingthe accumulation and coarse mode aerosol to be a mixture of sea salt and water at 95%relative humidity (RH), i.e. essentially non-absorbing with a refractive index of 1.34–0i.The refractive index assumed for the biomass burning aerosol within the accumulationmode consists of the real part from Yamasoe et al. (1998), variable with wavelength butequal to 1.54 at 0.55 µm; and the imaginary part of 0.018, constant with wavelength.The imaginary part has been determined using mixing rules by Haywood et al. (2003a)as a mean throughout SAFARI2000. The mean single scattering albedo, ω0, determinedfrom the PSAP and nephelometer was 0.91 ± 0.01 for A788 and 0.89 ± 0.02 for A789,respectively. The corresponding ω0 derived from Mie scattering calculations, using thePCASP data and assuming the above refractive index, was 0.90 ± 0.01 for both flights.Therefore, the use of a single refractive index leads to a value of ω0 which is wellwithin the variability in ω0 determined from the PSAP and nephelometer in each case.Calculations suggest that an error in ω0 of 0.01 leads to an error in τ0.55 of typically2–3%. The coarse mode aerosol within the biomass burning plume has been assumedto be dust, with the refractive indices taken from WCP (1986). When calculating theoptical parameters assuming spherical particles and using Mie scattering theory, theuncertainty in the coarse mode (as outlined above regarding the SID measurements)introduces negligible differences at 0.55 µm, with significant errors only apparent in thenear infrared. The hygroscopic nature of biomass burning aerosol is neglected, becausemeasurements made on the CV580 aircraft suggest that the mid-visible scatteringcoefficient, σsca0.55, increases by less than a factor of 1.1 for RHs less than 60% (Magiand Hobbs 2003). At the RHs measured within the biomass burning plume the vastmajority of aerosol particles are likely to be dehydrated (see RH plotted against heightin Fig. 4).
4. MODELLING
A 220-band Edwards–Slingo (ES) radiation code, described in detail by Edwardsand Slingo (1996) and Taylor et al. (1996), is used for both irradiance and radiance cal-culations over the short-wave (solar) spectral region. The model is initialized whereverpossible using aircraft data to represent the state of the atmosphere at 70 model pres-sure levels (between the surface and the top of the atmosphere). These data includetemperature, specific humidity, ozone, and aerosol mass mixing ratio as a function ofstatic pressure. Concentrations of nitrous oxide and methane are taken from the biomassburning plume measurements of Cofer et al. (1996) during the SAFARI92 campaign.Other well-mixed greenhouse gas data (i.e. CO2 and CFCs) are taken from IPCC (2001).Mie scattering data consist of the scattering and absorption coefficients and moments ofthe phase function for each spectral band of the ES model; they are taken from themean size distributions in Fig. 3 and are used to compile the aerosol input to the EScode. The aerosol optical parameters are fixed at each model level for the appropri-ate number of levels that describe the biomass burning and MBL aerosol layers. Foroptical depth calculations at one wavelength, a two-stream version of the code suffices.For irradiance calculations, the sea surface is modelled using a Lommel–Seeliger four-stream reflectance function which is re-scaled using the Glew et al. (2004) algorithm.

BIOMASS BURNING AEROSOL DURING SAFARI2000 1431
This four-stream version allows greater accuracy over the two-stream in determining thespectral irradiances. For radiance calculations, greater accuracy is used with up to 101moments of the aerosol scattering phase function being determined; 21 moments of theaerosol phase function are sufficiently accurate for irradiance computations.
5. VERTICAL STRUCTURE
Figure 4 shows temperature and dew-point soundings together with the RH mea-sured during two deep aircraft profiles. Figure 5 shows σsca0.55 from the same profilesdetermined by two methods: directly with the nephelometer, and derived from thePCASP data. An adjustment is made to the nephelometer σsca0.55 to account for particlegrowth with RH in the MBL, as the nephelometer dries out the aerosol sample down toabout 45% RH from the ambient RH of about 95%. This adjustment to σsca0.55 is basedon the growth curves for pure sodium chloride in Tang et al. (1997). The derivation ofσsca0.55 from the PCASP uses the extinction coefficient as supplied from Mie scatteringcomputations, where the inputs to the Mie code were the mean size distributions shownin Fig. 3 (i.e. biomass burning aerosol and MBL sea salt where appropriate) and theassigned refractive indices described in section 3.
(a) Flight A788During flight A788 the biomass burning plume (residual of the continental bound-
ary layer) was situated above the MBL, separated by a clear stable layer of low aerosolconcentrations and high visibility. This can be seen in Figs. 4(a) and 5(a) between 600m (the subsidence inversion capping the MBL) and 1700 m (the base of the biomassburning plume). The top of the plume was at 5400 m as can be seen from the hydrolapse(i.e. the rapid decrease in humidity with height). The RH of the biomass burning plumewas always less than 60% and generally less than 40%. Because of the clear slot inhibit-ing mixing in the vertical, the MBL was unpolluted. Unpolluted MBLs with overridingbiomass burning plumes were a common feature off the coast of Namibia and Angoladuring SAFARI2000 (Haywood et al. 2003a), often with such clear stable layers.
The aerosol structure in Fig. 5(a) shows a distinct top to the plume, with the cleanfree troposphere above, the clear stable layer below the plume (having the lowest aerosolconcentrations), and the MBL below that. The structure of one main plume lying abovea much thinner but distinct plume was also evident from other profiles during the flight.The derived biomass burning σsca0.55 is generally lower than the directly measuredvalue; these differences are discussed in the next section. The agreement, however, isbetter within the MBL.
(b) Flight A789On flight A789 the biomass burning plume was situated between ∼400 m, coin-
cident with the inversion, and 5000 m above sea level. The strong inversion (∼15 K)inhibited entrainment of the biomass burning aerosol into the MBL, which was unpol-luted. The air was stable within the plume (increasing potential temperature with height)and gently subsiding under the influence of the anticyclone. The strong hydrolapse at5200 m marks the top of the plume, with clean free-tropospheric air above that. The RHwas generally very low within the plume (averaging 18%), except at the very top of theplume where it reached 80%. The mean RH within the MBL was 95%.
Figure 5(b) shows σsca0.55 against height from A789. The higher values at the top ofthe biomass burning plume were evident from other profiles during the flight. Again wesee the lower derived values compared to the direct measurements which are discussed

1432 S. R. OSBORNE et al.
(a)
(b)
Figure 4. Temperature, dew-point and relative humidity (RH) soundings from aircraft profiles during flights:(a) A788, profile ascent P6, and (b) A789, profile descent P9. The RH data have been smoothed to 0.125 Hz while
the other data are 1 Hz.

BIOMASS BURNING AEROSOL DURING SAFARI2000 1433
(a)
(b)
Figure 5. Profiles of the mid-visible scattering coefficient (σsca0.55) determined by two methods: directly fromnephelometer measurements, and as derived from the Passive Cavity Aerosol Spectrometer Probe concentration
and Mie scattering calculations, for: (a) profile P6 during flight A788, and (b) P8 during A789.

1434 S. R. OSBORNE et al.
TABLE 1. SUMMARY OF THE DIFFERENT METHODS OF CALCULATING τ0.55, THEAEROSOL OPTICAL DEPTH AT 0.55 µm
Flight τPCASP τNEPH τBBR τORBIT τDubovik Run τSLR
A788 0.16 0.37 0.24 ± 0.03 0.36 0.36 R6.1 0.28 ± 0.03R6.2 0.33 ± 0.02
A789 0.28 0.43 0.37 ± 0.02 0.45 0.46 R8.1 0.32 ± 0.04R8.2 0.44 ± 0.02
τPCASP is the integration of the product of the PCASP concentration and the mean particleextinction; τNEPH is the integration of the nephelometer and PSAP scattering and absorptioncoefficients (with RH adjustment); τBBR shows the mean and standard deviation derivedby matching measured and modelled upwelling fluxes; τORBIT is derived by matching themeasured and modelled downwelling radiances as a function of scattering angle; τDubovik isderived from the retrieval algorithm of Dubovik and King (2000), where a small correction(about 0.01 in each case) has been added to account for the aerosol column below theaircraft during the orbits; τSLR values show the mean and standard deviation from low-levelzenith-viewing SLRs using the SAFIRE radiances. See text for further details.
below. Within the MBL σsca0.55 is much higher here than during A788; this is due tothe different aerosol size distributions shown in Fig. 3. Again, we see good agreementbetween the two scattering coefficients within the MBL. This may be due to one ormore of the following: (i) a better understanding of the aerosol refractive index withinthe MBL where negligible absorption occurs; (ii) the assumption of spherical particlesfor the Mie calculations is more applicable for the deliquesced sea salt particles in theMBL; (iii) possible under-reading of the particle concentration with the PCASP. Withinthe biomass burning plume, the measured and derived aerosol scattering are in betteragreement for A789 when the aircraft was performing a profile descent, than for A788when it was performing a profile ascent. These findings are consistent with the findingsof Haywood et al. (2003b) who found that the pitch of the aircraft influenced the numberconcentration detected by the PCASP.
6. METHODS OF CALCULATING AEROSOL OPTICAL DEPTH
The principal results from calculating aerosol optical depth, τ0.55, using the methodsoutlined below, are summarized in Table 1.
(a) Based on measurements of nephelometer and PSAPMeasurement of σabs0.55 is not reliable in profiles, due to a varying flow rate through
the PSAP as the external pressure varies with altitude; within SLRs the flow rate isadjusted to a prescribed value. Therefore the mean σabs0.55 from the available SLRsfrom each flight was used together with the mean nephelometer σsca0.55 to determineω0, and hence allow us to calculate the extinction optical depth based on profiles ofσsca0.55.
Using the profiles shown in Fig. 5, the vertically integrated scattering divided bythe mean value of ω0 (0.89 for the biomass burning plume, and 0.99 for the MBL)indicates that a contribution of ∼8% to the total τ0.55 was due to MBL aerosol in A788,i.e. the total τ0.55 was 0.37, including the 0.03 contribution due to MBL aerosol. FromA789, τ0.55 using the same method was 0.43, where 0.06 was from the sea salt aerosol,where a value of ω0 = 0.91 for the biomass burning aerosol was determined from SLRsand used to adjust the integrated σsca0.55. Thus the MBL sea salt contribution to τ0.55for A789 was higher at ∼14%, and this is due to the prominence of the shape of thesub-micron sea salt aerosol size distribution. Correction of the nephelometer for effectsof RH within the MBL was found to be significant: 7% and 12% increases in the total

BIOMASS BURNING AEROSOL DURING SAFARI2000 1435
τ0.55 for A788 and A789, respectively. There is room for significant error in this aerosoldeliquescence correction, as the correction is based on one profile through the MBL andsea salt concentrations are likely to change due to horizontal variability. Internally mixedorganic material could also lead to significantly different aerosol growth factors (Mingand Russell 2001). We shall see in section 7(a) that inclusion of the MBL aerosol as partof the total aerosol optical depth was found to be important for modelling radiances.
(b) Based on PCASP and SID measurementsFor flight A788, the Mie scattering calculations show that ω0 of the biomass burning
aerosol was 0.90 and the mean extinction per biomass burning particle was 1.55 ×10⁻¹³ m−1. We can, therefore, integrate the product of this extinction coefficient and thetotal PCASP concentration with height to yield τ0.55 = 0.16 (including the integrationof the MBL sea salt aerosol extinction). The equivalent result from A789 was 0.28,where the extinction per biomass burning particle was 6.52 × 10⁻¹⁴ m−1 and ω0 wasalso 0.90; note that here the plume was deeper and the mean PCASP concentrationwas nearly double that during A788. This method results in relatively low values ofτ0.55 (note the lower σsca0.55 from the PCASP measurements in Fig. 5). This is mostlikely due to an error in the measurement of particle concentration with the PCASP aspreviously mentioned in section 5(b).
(c) Based on upwelling irradianceThe effects of the biomass burning plume on both the upwelling and downwelling
radiation were obvious to the naked eye. The lower clear-domed pyranometer on theC-130 was used to quantify the upwelling irradiance across the solar spectrum whenflying at a high level above the biomass burning plume. The upwelling fluxes above abiomass burning layer result from sunlight reflected from the sea surface, MBL aerosol,and Rayleigh scattering, as well as from the biomass burning aerosol. Figures 6 and 7are described in this section.
(i) Flight A788. Figure 6(a) shows the irradiance during three SLRs above thebiomass burning plume (denoted by R7.1, R7.2, R7.3) as a function of distance froma conveniently designated point A midway along R7.2 (shown in Fig. 1). The gradientsin the signal along the runs are due to variations in the aerosol optical thickness. Themean upwelling flux over all three runs was 71.9 ± 1.7 W m−2 (variability is onestandard deviation). The ES radiation code was used to model upwelling irradiance inclear skies (i.e. no aerosol). The mean value of this clear-sky flux was 54.4 W m−2,with negligible variation due to only a small range in the solar zenith angle (θszen)of 28.1–28.9◦. The aerosol direct radiative effect (DRE) is defined as the observedirradiance minus that which would exist without the extinction optical depth due toaerosol (i.e. the modelled clear-sky flux). Hence the mean local DRE due to the aerosolcolumn in A788, as averaged over the DRE data shown in Fig. 6(b), was −17.5 ±1.7 W m−2. The calculations show that these measurements at the altitude of the aircraftare representative of the DRE at the top of the atmosphere. Modelling was then repeatedbut with aerosol (biomass burning and the MBL), using the Mie code output fromthe mean size distribution, and reiterations were performed, varying the aerosol massin the column but keeping the biomass burning to sea salt ratio constant, until theupwelling flux matched that of the aircraft observations. This suggests that τ0.55 = 0.24± 0.03 W m−2, where τ0.55 defined as:
τ0.55 = cos θszen loge(Sc/Sa), (1)

1436 S. R. OSBORNE et al.
(a)
R7.2 R7.3
R7.1
R7.3
R7.1
R7.2
(b)
Figure 6. (a) Upwelling radiative fluxes (0.3–3.0 µm) measured using a clear-domed pyranometer from threestraight and level runs (R7.1, R7.2, R7.3) during flight A788 plotted as a function of some designated point A(midway through R7.2). The modelled clear-sky upwelling flux for this specific case-study has been calculated as54.4 W m−2, which is plotted as a dashed line. (b) The direct forcing effect of the aerosol, defined as the measuredupwelling flux minus the modelled clear-sky flux, plotted against distance from point A. The implied minimum
and maximum aerosol optical depths (τ) calculated using the model are also shown in (b).
where Sc is the downward direct irradiance with no aerosol, and Sa is the downwarddirect irradiance with aerosol. For the total optical depth (i.e. biomass burning and MBLaerosol) Sc and Sa are taken at the lowest model level.
(ii) Flight A789. Data are presented here from runs R7.1 and R7.2 (see Fig. 1(b)).Figure 7(a) shows irradiance measured during these two runs as a function of distancefrom designated point A. Parts of the data from R7.1 (10–40 km from point A) are notshown due to the spurious effect of an isolated occurrence of low-level cloud. The mean

BIOMASS BURNING AEROSOL DURING SAFARI2000 1437
(a)
R7.2
R7.2
R7.1
R7.1
(b)
Figure 7. The same as Fig. 6, but for runs R7.1 and R7.2 during flight A789. Note the lower modelled clear-skyupwelling flux of 50.6 W m−2.
upwelling irradiance from Fig. 7(a) is 79.2 ± 1.6 W m−2. The modelled mean clear-skyupwelling irradiance during R7.1 and R7.2 was 50.6 W m−2, again with a negligiblerange due to the small change in θszen (29.6–32.6◦). The DRE due to the aerosol columnin A789 (Fig. 7(b)) was −29.3 ± 1.6 W m−2. Modelling with an aerosol column thatmatches the measured upwelling irradiance was then carried out as with A788. This thensuggests the modelled aerosol has a mean τ0.55 of 0.37 ± 0.02 (from Eq. (1)), i.e. lessvariability than A788. The standard deviations in the DRE and τ0.55, particularly forA788, show that the variability is significant over distances of only ∼40 km.

1438 S. R. OSBORNE et al.
7. COMPARISONS OF OBSERVED AND MODELLED RADIANCES WITH A NARROW-BANDRADIOMETER
(a) Spectrally resolved downwelling radiances from banked orbits
Here we compare measured radiances at specified wavelengths as determined bySAFIRE in the visible and near infrared as a function of scattering angle relative tothe solar position, against modelled radiances using the ES code. Four aircraft bankedorbits were performed at an altitude of about 130 m above sea level during both flightsA788 and A789, i.e. within the MBL and below all the biomass burning aerosol. Thisaltitude means that aerosol of marine origin (e.g. sea salt), in addition to the biomassburning aerosol, will potentially have an effect on the downwelling radiation. Whenflying SLRs only one scattering angle relative to the sun can be sampled; during bankedorbits multiple scatterings can be obtained by our knowledge of the aircraft attitude andthe solar geometry. The angle of bank of the aircraft is set to be approximately equal toθszen, so that the range of scattering angles is maximized. For A788 the angle of bankwas 30◦, and for A789 it was 40◦.
Figures 8 and 9, show the angular distribution of radiance from SAFIRE mea-surements and from modelling for varying aerosol representations for A788 and A789,respectively: (a) no aerosol; (b) a biomass burning aerosol layer using aircraft aerosoldata; (c) biomass burning and sea salt layers from aircraft data; and (d) a retrievedaerosol size distribution representing both sea salt and biomass burning aerosols(described in more detail below). The aerosol mass loading in the model runs wasadjusted until there was optimum agreement with the observations at 0.55 µm. Thisthen allowed us to derive values of τ0.55 independently.
The large discrepancies for the no-aerosol comparison in terms of the slope andmagnitude of the spectra illustrate the importance of the inclusion of aerosol; com-parisons of Fig. 8(a) with 8(b), and Fig. 9(a) with 9(b), show the dramatic effect thatinclusion of biomass burning aerosol has on the distribution of sky radiances. Takinginto account the logarithmic scale of the y-axis, there are still significant disagreements.These disagreements are reduced where sea salt aerosol has been included; that rep-resents 8% of the total τ0.55 for A788 and 14% for A789 as previously determined(Figs. 8(c) and 9(c)). Discrepancies remain, in particular at 0.87 and 2.01 µm for A788and at 1.61 µm for A789. However, calculations show that the radiances are very sensi-tive to small changes in the position and width of the aerosol accumulation mode, anderrors associated with the PCASP (Haywood et al. 2003a) and SAFIRE measurements(Francis et al. 1999) may explain the remaining spectral discrepancies. Additionally,when the aircraft is banked at 30◦ and 40◦, the radiometer is observing radiation scat-tered by aerosol over areas in excess of 30 and 60 km2, respectively; as seen in Figs. 6and 7, the aerosol is unlikely to be completely homogeneous over such spatial scales.From the ES output, τ0.55 suggests a value of 0.36 for A788, and 0.45 for A789. Theseare in good agreement with the values calculated from the nephelometer, as shown inTable 1.
A flexible inversion algorithm has been developed for retrieving aerosol size distri-butions and aerosol optical properties from the Aerosol Robotic Network (AERONET)of automated ground-based radiometers (Dubovik and King 2000). This algorithm, here-after referred to as the Dubovik retrieval, has been further developed so that it can use asinput the radiance data as a function of scattering angle from the SAFIRE measurements.The basis for the Dubovik retrieval is to apply a single columnar aerosol size distributionthat minimizes the RMS differences between the measurements and the modelling of skyradiances as a function of scattering angle. In the retrievals presented here, a refractive

BIOMASS BURNING AEROSOL DURING SAFARI2000 1439
(a)
(c)
(b)
(b)
(c
) (d
)
Figu
re8.
Com
pari
son
ofm
easu
red
(sym
bols
)an
dm
odel
led
(lin
es)
dow
nwel
ling
sky
radi
ance
spec
tra,
plot
ted
asa
func
tion
ofsc
atte
ring
angl
ere
lativ
eto
the
sola
rpo
siti
onfr
omlo
w-l
evel
orbi
tsdu
ring
fligh
tA78
8.D
ata
are
pres
ente
dfo
rse
ven
wav
elen
gths
over
the
sola
rsp
ectr
um,g
iven
inth
eke
y.T
he8
Hz
Scan
ning
Air
born
eFI
lter
Rad
iom
etE
r(S
AFI
RE
)da
taha
vebe
enav
erag
edin
to1◦
scat
teri
ng-a
ngle
bins
.(a)
SAFI
RE
obse
rvat
ions
wit
hm
odel
ling
incl
ear
skie
s(n
oae
roso
l);(
b)SA
FIR
Eob
serv
atio
nsan
dm
odel
ling
wit
hbi
omas
sae
roso
lon
ly;(
c)SA
FIR
Eob
serv
atio
nsan
dm
odel
ling
wit
ha
dual
-lay
erbi
omas
san
dse
asa
ltae
roso
lco
lum
n,w
here
the
aero
sol
opti
cald
epth
at0.
55µ
m,τ
0.55
,is
asu
mof
92%
biom
ass
and
8%se
asa
lt;a
nd(d
)SA
FIR
Eob
serv
atio
nsan
dm
odel
ling
base
don
are
trie
ved
aero
sol
size
dist
ribu
tion
usin
gth
eal
gori
thm
ofD
ubov
ikan
dK
ing
(200
0).

1440 S. R. OSBORNE et al.
(a)
(b)
(c
) (d
)
Figu
re9.
The
sam
eas
Fig.
8,bu
tfor
low
-lev
elor
bits
duri
ngfli
ghtA
789.
Not
ehe
reth
atin
(c)τ 0
.55
isa
sum
of86
%bi
omas
san
d14
%se
asa
lt.
BIOMASS BURNING AEROSOL DURING SAFARI2000 1441
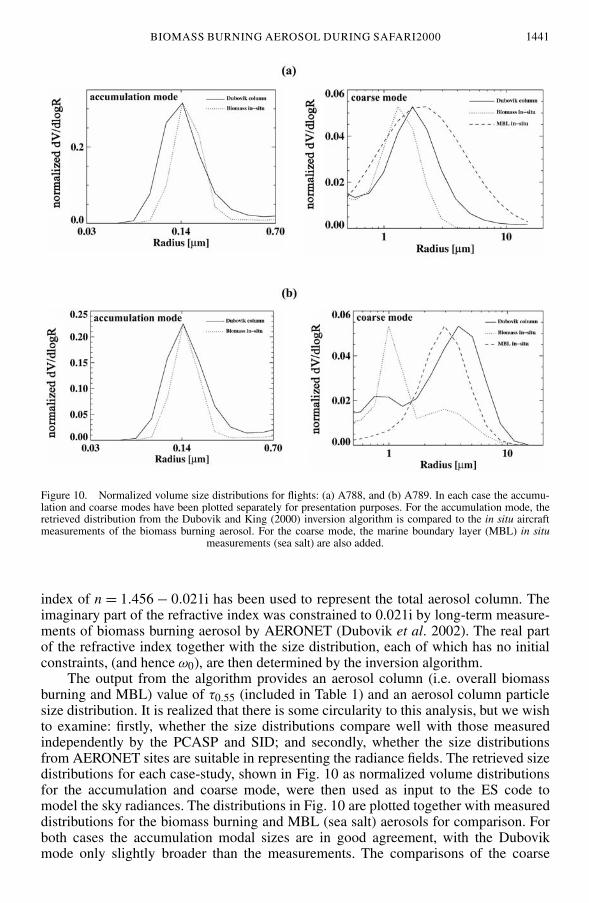
Figure 10. Normalized volume size distributions for flights: (a) A788, and (b) A789. In each case the accumu-lation and coarse modes have been plotted separately for presentation purposes. For the accumulation mode, theretrieved distribution from the Dubovik and King (2000) inversion algorithm is compared to the in situ aircraftmeasurements of the biomass burning aerosol. For the coarse mode, the marine boundary layer (MBL) in situ
measurements (sea salt) are also added.
index of n = 1.456 − 0.021i has been used to represent the total aerosol column. Theimaginary part of the refractive index was constrained to 0.021i by long-term measure-ments of biomass burning aerosol by AERONET (Dubovik et al. 2002). The real partof the refractive index together with the size distribution, each of which has no initialconstraints, (and hence ω0), are then determined by the inversion algorithm.
The output from the algorithm provides an aerosol column (i.e. overall biomassburning and MBL) value of τ0.55 (included in Table 1) and an aerosol column particlesize distribution. It is realized that there is some circularity to this analysis, but we wishto examine: firstly, whether the size distributions compare well with those measuredindependently by the PCASP and SID; and secondly, whether the size distributionsfrom AERONET sites are suitable in representing the radiance fields. The retrieved sizedistributions for each case-study, shown in Fig. 10 as normalized volume distributionsfor the accumulation and coarse mode, were then used as input to the ES code tomodel the sky radiances. The distributions in Fig. 10 are plotted together with measureddistributions for the biomass burning and MBL (sea salt) aerosols for comparison. Forboth cases the accumulation modal sizes are in good agreement, with the Dubovikmode only slightly broader than the measurements. The comparisons of the coarse
1442 S. R. OSBORNE et al.
modes are less favourable, but then there are known problems here; the large errorsassociated with measuring non-spherical biomass burning aerosol have already beendiscussed. A potential reason for unreliable retrieval of coarse mode particles is thelack of measured sky radiances at scattering angles less than ∼10◦ (because of theSAFIRE detectors saturating). Scattering at these angles is sensitive mainly to coarsemode particles.
The comparisons between the measured and modelled radiance spectra usingAERONET-derived size distributions are shown in Figs. 8(d) and 9(d). The spectrashow generally good agreement; that implies the retrieval of one representative sizedistribution for an aerosol column containing two different layers of aerosol is areasonable method for describing the effect on the scattered radiances. Looking inmore detail, we see that the Dubovik distribution has improved agreement for the threeshortest wavelengths in A788, but made the agreement worse at 1.25 and 2.01 µm. ForA789, the agreement is improved for the two shortest wavelengths and 1.61 µm, butslightly worse for the other wavelengths. These changes are most probably due to thebroader accumulation mode in the Dubovik distribution and the significant differencesin the coarse modes as shown in Fig. 10. The values of τ0.55 from this method in Table 1(after being adjusted for the small amount of sea salt aerosol below the level of theaircraft orbits) show very good agreement with the orbit method described previously.Note, however, that determination of τ0.55 from measurements made by viewing directlytowards the sun was not carried out here; this is an important constraint in ground-basedAERONET retrievals.
(b) Downwelling zenith-viewing radiances from SLRsTwo SLRs at low level orientated into-sun and down-sun were carried out in both
case-studies, and this gave us the opportunity to measure the downwelling radianceswith SAFIRE whilst viewing directly upwards. Modelling was carried out for each ofthe SAFIRE bands, taking into account the fairly small change in θszen over the SLRs,for the highest values of τ0.55 from the methods previously described. From Table 1 thisis 0.37 for A788, and 0.46 for A789. As the aircraft is pitched up whilst flying SLRs,this pitch angle had to be considered when modelling the radiances. The true viewingangles of SAFIRE were θszen + pitch angle for the into-sun runs, and θszen − pitch anglefor the down-sun runs. For A788 the pitch angle was about 4.3◦ and during A789 it wasabout 3.7◦. The measurements and model results are shown together in Fig. 11 wherethe radiances are plotted against time. The effect of the change in θszen can be seen bythe slight gradient in the model output. The jump from one run to the other, apparentin modelled and observed radiances in both case-studies, is due to the change in theviewing angle and is not attributable to changes in the aerosol; the viewing angle variedby approximately twice the pitch angle. The spatial coverage during the runs can beascertained by referring to Fig. 1.
Additional values of τ0.55 have been derived based on the mean observed radianceacross each run. These values are included in Table 1 together with the standarddeviation. The measurements imply some significant variability of the aerosol opticaldepth, as was indicated by the irradiance measurements and derived values of τ0.55 fromthe high-level SLRs. The higher variability in A789 here compared to A788, however,is not consistent with the irradiance measurements where the variability was greater forA788. But the low-level and high-level runs were carried out at different geographicallocations, which may help to explain the discrepancies. The large variation in τ0.55between R8.1 and R8.2 of A789 should be noted, where the value of 0.44 from R8.2 isin good agreement with the orbit and nephelometer methods. This agreement is obvious

BIOMASS BURNING AEROSOL DURING SAFARI2000 1443
(a)
(b)
Figure 11. Downwelling radiances measured by Scanning Airborne FIlter RadiometEr (SAFIRE) in its zenith-viewing position (symbols) plotted against time from two straight and level runs at 30 m altitude, together withmodelled radiances (lines) during flights: (a) A788, and (b) A789. Each symbol is an average over an 8 s interval,with one standard deviation from the mean shown by the vertical dotted lines. The modelled radiances have beencomputed with assumed aerosol optical depths of 0.37 for A788 and 0.45 for A789 (the highest values as shownin Table 1). The change in solar zenith angle during the two runs has also been taken into account in each case,and is reflected in the slight gradient of the modelled lines. Note the actual viewing direction is not true zenith
(see text). The key is the same as for Figs. 8 and 9.

1444 S. R. OSBORNE et al.
from Fig. 11(b) where the comparisons are also reasonable for 0.62 and 0.87 µm, whilefor the other channels the agreement is poorer. For A788, the modelled radiances basedon τ0.55 = 0.37 agree only with the highest observed radiances for each run at 0.55 µm.The observations otherwise imply lower values of τ0.55. This pattern can be seen at allthe wavelengths except 0.87 µm where the agreement is poor. The minimum value ofτ0.55 implied by the measured radiances across R8.1 and R8.2 is 0.28, i.e. it is equalto the PCASP method. There is less variability across the runs in A788 than in A789.The values of τ0.55 derived from the mean measured radiances for runs R6.1 and R6.2are 0.28 and 0.33, respectively, i.e. somewhat lower than the orbit and nephelometermethods. The minimum value of τ0.55 implied by the measured radiances across R6.1and R6.2 is 0.27, i.e. much higher than the PCASP method.
8. CONCLUSIONS
Two case-studies based on aircraft measurements have been presented of the SWradiative effect of biomass burning aerosol advecting over the ocean and overriding theunpolluted MBL. Aerosol size distributions were measured and show similarity in modalsize and dispersion over the accumulation mode. Although the accuracy of our coarsemode measurements was significantly less than those of the accumulation mode, dueto the non-spherical nature of the large particles, we have shown that the super-micronparticles have negligible effect on the SW optical properties. In situ measurements weremade of the scattering and absorption coefficients, which allowed us to calculate ω0 ofthe biomass burning aerosol; this was 0.89 and 0.91 for the two cases studied. A Miescattering code was initialized with a prescribed index of refraction and the observedaerosol size distributions. The derived values of ω0 were 0.90 in both cases, showinggood agreement with the in situ measurements.
A number of independent techniques were used to calculate the aerosol extinctionoptical depth, τ0.55, as summarized in Table 1. For each method, τ0.55 was consistentlyhigher during flight A789 than A788. But for each flight, the range in τ0.55 for thedifferent methods varied significantly. For A788 this range was 0.16–0.37 and for A789it was 0.28–0.46. Values of τ0.55 derived from the measured downwelling sky radiancesduring banked orbits using the ES flexible radiation scheme are considered the mostreliable. This technique has been proven over an AERONET site by Haywood et al.(2003b) and is, therefore, considered a baseline against which other methods can bejudged.
Integration of the nephelometer scattering coefficient with height is also a robusttechnique, with results that are in good agreement with the orbit method. The workof Kaufman et al. (2003) provides further confidence in the orbit and nephelometermethods. They used inversions of combined aircraft (backscatter from lidar) and satellite(Moderate Resolution Imaging Spectro-radiometer) data to derive profiles of aerosolextinction. Their case-study on 11 September 2000 (i.e. that coinciding with flight A789)which was centred around 22.5◦S, 12.2◦E, shows the optical depth to be 0.43 ± 0.02 at0.53 µm for the total aerosol column. This figure compares favourably with the orbitand nephelometer methods.
Integration of the PCASP aerosol concentration, however, is not a reliable tech-nique. This produced the lowest value of τ0.55 in each case, and the agreement betweenthis method and the others is particularly poor for A788. Haywood et al. (2003b) alsofound this method to produce erroneously low values of τ0.55, and suggested that PCASPaerosol concentration appears to be sensitive to the pitch of the aircraft, with profileascents and descents showing differing levels of under-reading.

BIOMASS BURNING AEROSOL DURING SAFARI2000 1445
The ES scheme was also used to derive τ0.55 based on the upwelling irradiancemeasured above the plume. These values of τ0.55 were significantly lower than the orbitor nephelometer integration methods, therefore the technique shows some problems.This is somewhat surprising given that previous studies of τ0.55, such as Haywoodet al. (2001, 2003c), have been validated both by surface-based sun-photometry and bysatellite retrievals. Given that the results from these previous studies use the identical ESradiative transfer code, it is unlikely that the radiative transfer modelling is significantlyin error in the present study. It is possible that inhomogeneities of the aerosol in thehorizontal can explain some of the discrepancies in the values of τ0.55. However, it isalso possible that the pyranometer domes could have become dirty due to impactionof biomass burning aerosol. In future, it is suggested that high-level measurements beperformed at the beginning of the flight before in situ sampling is performed.
An inversion algorithm was also employed that took the measured downwellingradiances as a function of scattering angle, and retrieved a columnar aerosol sizedistribution. The retrieved size distribution across the accumulation mode comparedwell with the in situ measurements. It is difficult to assess the agreement for the coarsemode aerosol, due to measurement difficulties. The values of τ0.55 derived using theretrieved columnar aerosol size distribution also compared well with the orbit andnephelometer methods. While we have shown that a single columnar aerosol sizedistribution can be used to optically represent the dual-layered aerosol column, in termsof the effect on the scattered radiances the inclusion of MBL aerosol leads to even betteragreement.
This study has shown that the derivation of aerosol optical depth based on air-craft measurements is far from trivial. Some of the highlighted problems, such as thedependency of the PCASP concentration on the pitch of the aircraft, will need carefulinvestigation in the near future. This will be possible on the new UK community BAe146aircraft.
ACKNOWLEDGEMENTS
The authors would like to thank Anthony Baran for performing the t-matrixcalculations. Thanks also go to Geraint Vaughan and an anonymous reviewer for usefulcomments. The aircrew of the Royal Air Force deserve credit, as always, for theirdedication and professionalism.
REFERENCES
Anderson, T. L. and Ogren, J. A. 1998 Determining aerosol radiative properties using the TSI 3563 Inte-grating Nephelometer. Aerosol Sci. Technol., 29, 57–69
Andreae, M. O. and Merlet, P. 2001 Emission of trace gases and aerosols from biomass burning.Global Biogeochem. Cycles, 15, 962–966
Bond, T. C., Anderson, T. L. andCampbell, D.
1999 Calibration and intercomparison of filter-based measurements ofvisible light absorption by aerosols. Aerosol Sci. Technol.,30, 582–600
Chuang, C. C., Penner, J. E.,Prospero, J. M., Grant, K. E.and Rau, G. H.
2000 ‘Effects of anthropogenic aerosols on cloud susceptibility: A sen-sitivity study of radiative forcing to aerosol characteristicsand global concentration’. Internal report No. UCRL-JC-139097 Rev. 1. Lawrence Livermore National Laboratory,CA, USA
Cofer, W. R., Levine, J. S.,Winstead, E. L.,Cahoon, D. R., Sebacher, D. I.,Pinto, J. P. and Stocks, B. J.
1996 Source compositions of trace gases released during Africansavannah fires. J. Geophys. Res., 101(D19), 23597–23602

1446 S. R. OSBORNE et al.
Dubovik, O. and King, M. D. 2000 A flexible inversion algorithm for retrieval of aerosol optical prop-erties from sun and sky radiance measurements. J. Geophys.Res., 105, 20673–20696
Dubovik, O., Holben, B., Eck, T. F.,Smirnov, A., Kaufman, Y. J.,King, M. D., Tanre, D. andSlutsker, I.
2002 Variability of absorption and optical properties of key aerosoltypes observed in worldwide locations. J. Atmos. Sci., 59,590–608
Edwards, J. M. and Slingo, A. 1996 Studies with a flexible new radiation code. Part I: Choosing aconfiguration for a large-scale model. Q. J. R. Meteorol. Soc.,122, 839–861
Foot, J. S. 1985 The measurement of diffuse solar radiation from an aircraft.Atmos. Environ., 19, 811–818
Francis, P. N., Hignett, P. andTaylor, J. P.
1999 Aircraft observations and modelling of sky radiance distributionsfrom aerosol during TARFOX. J. Geophys. Res., 104, 2309–2319
Glew, M. D., Hignett, P. andTaylor, J. P.
2004 ‘Aircraft measurements of sea surface albedo’. MeteorologicalResearch Flight Technical Note 47. Met Office, Exeter, UK
Haywood, J. M., Francis, P. N.,Geogdzhayev, M.,Mishchenko, M. and Frey, R.
2001 Comparison of Saharan dust aerosol optical depth retrieved us-ing aircraft mounted pyranometers and two-channel AVHRRalgorithms. Geophys. Res. Lett., 28, 2393–2396
Haywood, J. M., Osborne, S. R.,Francis, P. N., Keil, A.,Formenti, M. O. and Kaye, P.
2003a The mean physical and optical properties of regional haze domi-nated by biomass burning aerosol measured from the C-130aircraft during SAFARI2000. J. Geophys. Res., 108, 8473–8487
Haywood, J., Francis, P.,Dubovik, O., Glew, M. andHolben, B.
2003b Comparison of aerosol size distributions, radiative properties andoptical depths determined by aircraft observations and sun-photometers during SAFARI2000. J. Geophys. Res., 108,8471–8483
Haywood, J., Francis, P.,Osborne, S., Glew, M.,Loeb, N., Highwood, E.,Tanre, D., Myhre, G.,Formenti, P. and Hirst, E.
2003c Radiative properties and direct radiative effect of Saharan dustmeasured by the C-130 aircraft during SHADE: 1. Solarspectrum. J. Geophys. Res., 108, 8577–8593
Hirst, E., Kaye, P. H.,Greenaway, R. S., Field, P. andJohnson, D. W.
2001 Discrimination of micrometre-sized ice and super-cooled dropletsin mixed-phase cloud. Atmos. Environ., 35, 33–47
IPCC 2001 ‘Climate change 2001: The scientific basis’. Contribution ofWorking Group I to the Third assessment report of the Inter-governmental Panel on Climate Change. Eds. J. T. Houghton,Y. Ding, D. J. Griggs, M. Noguer, P. J. van der Linden,X. Dai, K. Maskell, and C. A. Johnson. Cambridge Univer-sity Press, New York, USA
Johnson, D. W., Osborne, S. R.,Wood, R., Suhre, K.,Johnson, R., Businger, S.,Quinn, P. K.,Wiedensohler, A.,Durkee, P. A., Russell, L. M.,Andreae, M. O., O’Dowd, C.,Noone, K., Bandy, B.,Rudolph, J. andRapsomanikis, S.
2000 An overview of the Lagrangian experiments undertaken dur-ing the North Atlantic Aerosol Characterisation Experiment(ACE-2). Tellus, 52B, 290–320
Kaufman, Y. J. and Fraser, R. S. 1997 The effect of smoke particles on clouds and climate forcing.Science, 277, 1636–1639
Kaufman, Y., Haywood, J. M.,Hobbs, P. V., Hart, W.,Kleidman, R. and Schmid, B.
2003 Remote sensing of vertical distributions of smoke aerosol off thecoast of Africa during SAFARI2000. Geophys. Res. Lett., 30,16, 1831, doi: 10.1029/2003GL017068
Keil, A. and Haywood, J. M. 2003 Solar radiative forcing by biomass burning aerosol particles dur-ing SAFARI2000: A case-study based on measured aerosoland cloud properties. J. Geophys. Res., 108, 8467
Magi, B. I. and Hobbs, P. V. 2003 Effects of humidity on aerosols in southern Africa during thebiomass burning season. J. Geophys. Res., 108(D13), 8495,doi:10.1029/2002JD002144
Ming, Y. and Russell, L. M. 2001 Predicted hygroscopic growth of sea salt aerosol. J. Geophys.Res., 106, 28259–28274
Mishchenko, M. I. 1991 Light scattering by randomly orientated axially symmetric parti-cles. J. Opt. Soc. Am. A., 8, 871–882
BIOMASS BURNING AEROSOL DURING SAFARI2000 1447
Penner, J. E., Dickinson, R. E. andO’Neill, C. A.
1992 Effects of aerosol from biomass burning on the global radiationbudget. Science, 256, 1432–1434
Shettle, E. P. and Fenn, R. W. 1979 ‘Models for the aerosols of the lower atmosphere and the effectsof humidity variations on their optical properties’. Environ-mental Research Papers, No. 676. US Air Force GeophysicsLaboratory, Massachusetts, USA
Tang, I. N., Tridico, A. C. andFung, K. H.
1997 Thermodynamic and optical properties of sea salt aerosols.J. Geophys. Res., 102, 23269–23275
Taylor, J. P., Edwards, J. M.,Glew, M. D., Hignett, P. andSlingo, A.
1996 Studies with a flexible new radiation code. Part II: Comparisonswith aircraft short-wave observations. Q. J. R. Meteorol.Soc., 122, 689–719
World Climate Program (WCP) 1986 ‘A preliminary cloudless standard atmosphere for radiationcomputation’. World Meteorological Organization, Geneva,Switzerland
Yamasoe, M. A., Kaufman, Y. J.,Dubovik, O., Remer, L. A.,Holben, B. N. and Artaxo, P.
1998 Retrieval of the real part of the refractive index of smoke particlesfrom sun/sky measurements during SCAR-B. J. Geophys.Res., 103, 31893–31902