Evolution of subsequent yield surfaces and elastic constants with finite plastic deformation. Part...
11
Evolution of subsequent yield surfaces and elastic constants with finite plastic deformation. Part II: A very high work hardening aluminum alloy (annealed 1100 Al) Akhtar S. Khan a, * , Amit Pandey a,1 , Thomas Stoughton b a Department of Mechanical Engineering, University of Maryland, Baltimore County, Baltimore, MD 21250, USA b General Motors R&D Center Warren, MI, USA article info Article history: Received 31 May 2008 Received in final revised form 26 July 2009 Available online 3 August 2009 Keywords: Proportional and non-proportional loading Subsequent yield surfaces Kinematic and isotropic hardening Cross-effect Elastic moduli abstract Results are presented on the evolution of subsequent yield surfaces with finite deformation in a very high work hardening annealed 1100 aluminum alloy. In Part I [Khan, A.S., Kazmi, R., Stoughton, T., Pandey, A., 2009a. Evolution of subsequent yield surfaces and elastic con- stants with finite plastic deformation. Part 1: a very low work hardening aluminum alloy (Al-6061–T6511) 25, 1611–1625.] of this paper, similar results are presented for a very low work hardening aluminum alloy. Those results were very different from the present ones, and all the results were for proportional loading paths. The subsequent yield surfaces are determined in tension, free end torsion and combined tension–torsion proportional and non-proportional loading paths, using 10 le deviation from linearity definition of yield. Yield surfaces are also determined after linear, bi-linear, and non-linear unloading paths after finite deformation under tension, free end torsion, and combined tension–torsion loading. The initial yield surface is closer to the von-Mises surface and the subsequent yield surfaces show distortion, expansion, positive cross-effect, and ‘‘nose” in the loading direc- tion. Additionally, the subsequent yield surfaces after non-proportional loading paths show shrinkage and compounded distortion. The yield surfaces after unloading depict strong anisotropy, positive cross-effect and exhibits different proportion of distortion in each loading conditions. The Young’s and shear modulus decrease with plastic deformation and this decrease is much less than those reported in the published literature. Ó 2009 Published by Elsevier Ltd. 1. Introduction The experimental work on the subsequent yield surfaces had been performed by Phillips’s group (Phillips et al., 1972, 1974; Phillips and Tang, 1972; Phillips and Ricciuti, 1976; Phillips and Moon, 1977; Phillips and Lee, 1979; Phillips and Chong, 1979; Phillips and Lu, 1984) on pure annealed aluminum. However, most of the work was done for less than 2% plas- tic strain and the subsequent yield surfaces were mostly determined under non-proportional loading. A dead weight loading machine was used to apply the loads except by Phillips and Lu (1984) where MTS servo-hydraulic controlled machine and strain gage were used. The yield surfaces were determined by using the proportional limit or less then 3 le deviation from linearity definitions of yield and were also known as small scale yield definitions. The subsequent yield surfaces were dis- torted and a ‘‘nose” developed in the loading direction. However, the yield surface based on less than 5 le definition of yield 0749-6419/$ - see front matter Ó 2009 Published by Elsevier Ltd. doi:10.1016/j.ijplas.2009.07.008 * Corresponding author. Tel.: +1 410 455 3301; fax: +1 410 455 1052. E-mail address: [email protected] (A.S. Khan). 1 Present address: Department of Mechanical Engineering, Johns Hopkins University, Baltimore, MD 21218, USA. International Journal of Plasticity 26 (2010) 1421–1431 Contents lists available at ScienceDirect International Journal of Plasticity journal homepage: www.elsevier.com/locate/ijplas
-
Upload
independent -
Category
Documents
-
view
2 -
download
0
Transcript of Evolution of subsequent yield surfaces and elastic constants with finite plastic deformation. Part...
International Journal of Plasticity 26 (2010) 1421–1431
Contents lists available at ScienceDirect
International Journal of Plasticity
journal homepage: www.elsevier .com/locate / i jp las
Evolution of subsequent yield surfaces and elastic constants with finiteplastic deformation. Part II: A very high work hardening aluminumalloy (annealed 1100 Al)
Akhtar S. Khan a,*, Amit Pandey a,1, Thomas Stoughton b
a Department of Mechanical Engineering, University of Maryland, Baltimore County, Baltimore, MD 21250, USAb General Motors R&D Center Warren, MI, USA
a r t i c l e i n f o
Article history:Received 31 May 2008Received in final revised form 26 July 2009Available online 3 August 2009
Keywords:Proportional and non-proportional loadingSubsequent yield surfacesKinematic and isotropic hardeningCross-effectElastic moduli
0749-6419/$ - see front matter � 2009 Published bdoi:10.1016/j.ijplas.2009.07.008
* Corresponding author. Tel.: +1 410 455 3301; faE-mail address: [email protected] (A.S. Khan).
1 Present address: Department of Mechanical Engi
a b s t r a c t
Results are presented on the evolution of subsequent yield surfaces with finite deformationin a very high work hardening annealed 1100 aluminum alloy. In Part I [Khan, A.S., Kazmi,R., Stoughton, T., Pandey, A., 2009a. Evolution of subsequent yield surfaces and elastic con-stants with finite plastic deformation. Part 1: a very low work hardening aluminum alloy(Al-6061–T6511) 25, 1611–1625.] of this paper, similar results are presented for a verylow work hardening aluminum alloy. Those results were very different from the presentones, and all the results were for proportional loading paths. The subsequent yield surfacesare determined in tension, free end torsion and combined tension–torsion proportional andnon-proportional loading paths, using 10 le deviation from linearity definition of yield.Yield surfaces are also determined after linear, bi-linear, and non-linear unloading pathsafter finite deformation under tension, free end torsion, and combined tension–torsionloading. The initial yield surface is closer to the von-Mises surface and the subsequent yieldsurfaces show distortion, expansion, positive cross-effect, and ‘‘nose” in the loading direc-tion. Additionally, the subsequent yield surfaces after non-proportional loading paths showshrinkage and compounded distortion. The yield surfaces after unloading depict stronganisotropy, positive cross-effect and exhibits different proportion of distortion in eachloading conditions. The Young’s and shear modulus decrease with plastic deformationand this decrease is much less than those reported in the published literature.
� 2009 Published by Elsevier Ltd.
1. Introduction
The experimental work on the subsequent yield surfaces had been performed by Phillips’s group (Phillips et al., 1972,1974; Phillips and Tang, 1972; Phillips and Ricciuti, 1976; Phillips and Moon, 1977; Phillips and Lee, 1979; Phillips andChong, 1979; Phillips and Lu, 1984) on pure annealed aluminum. However, most of the work was done for less than 2% plas-tic strain and the subsequent yield surfaces were mostly determined under non-proportional loading. A dead weight loadingmachine was used to apply the loads except by Phillips and Lu (1984) where MTS servo-hydraulic controlled machine andstrain gage were used. The yield surfaces were determined by using the proportional limit or less then 3 le deviation fromlinearity definitions of yield and were also known as small scale yield definitions. The subsequent yield surfaces were dis-torted and a ‘‘nose” developed in the loading direction. However, the yield surface based on less than 5 le definition of yield
y Elsevier Ltd.
x: +1 410 455 1052.
neering, Johns Hopkins University, Baltimore, MD 21218, USA.

1422 A.S. Khan et al. / International Journal of Plasticity 26 (2010) 1421–1431
may have significant error since the sensitivity of measuring instrument is at the best ±1 le. The subsequent yield surfaceswere also determined by Bertsch and Findley (1962) over thin-walled tubular specimen of Al 6061–T6 and Hecker (1972)over thin-walled tubular specimens of 1100 aluminum and OFHC copper using 10 le definition of yield under non-propor-tional loading paths. However, all the yield surfaces were reported for less than 1% plastic strain. Thus, in this case also therewere no published experimental results for the yield surfaces after finite deformation under non-proportional loading paths.
William and Svensson (1970, 1971) determined the subsequent yield surfaces for the effective proof strain range of 20–200 le; experiments using thin-walled tubes of annealed, Al 1100-F for more than 10% strain under proportional loadingpaths. Subsequent yield surfaces showed different proportions of translation, expansion, and distortion. A rounded nosewas observed in tension and torsion loading directions, while the yield surfaces were flat in the reverse or unloading direc-tion. Stout et al. (1985) used hollow tubes of 1100 aluminum (annealed at 343 �C for 1 h) to investigate the yield surfacesusing 5 le and back extrapolation yield definitions (also known as large scale yield definition) and the subsequent yield sur-faces were determined under tension (2%) and torsion (2%, 50%) loading. Yield surfaces based on 5 le definition showed dis-tortion, expansion, translation and a distinct nose in the loading direction, however, the yield points based on backextrapolation definition of yield were closer to von-Mises surface and Stout et al. (1985) explained this distinct behavioras the former is controlled purely by dislocation mechanism, and the latter is governed by texture formation. Hellinget al. (1986) also performed yield surface experiments on commercial pure 1100-O aluminum (annealed at 345 �C) for1 h and yield was defined by a 5 le offset following 1.2% and 28% von-Mises effective shear strain. However, no relaxationperiod was used after finite deformation to remove the strain rate or viscoplasticity effect from the forward loading whichmay affect unloading to determine subsequent yield surfaces. Also, new strain gages were not installed to probe the yieldsurfaces and therefore the probing could include significant error (Wu, 2003).
In the past few decades, many researchers (Edelman and Drucker, 1951; Baltov and Sawczuk, 1965; Shrivastava et al.,1973; Hosford 1979; Rees, 1982; Eisenberg and Yen 1984; Helling and Miller, 1987; Kowalsky et al., 1999; Suprun, 2006)have tried to model the translation, rotation, and distortion of subsequent yield surfaces. Most of these phenomenologicalmodels were based on modification of von-Mises yield criterion to include isotropic and kinematic hardening. However,these modifications failed to predict any observed distortion and rotation of yield surfaces. Recent papers on aluminumtubes by Korkolis and Kyriakides (2008a,b, 2009) include only the initial yield surfaces based on different levels of workhardening and will be discussed in the Part III of the paper by Khan et al. (2010).
Yang et al. (2004) performed microscopic and macroscopic measurements (using nano-indentation) and showed that theelastic moduli decreased with increase in plastic strain and this decrease was more than 20% after a deformation of 25% plas-tic strain. However, most of the experiments were performed under proportional loading and there is a need to study thevalues of modulus under non-proportional loading. Thus, the above literature search reveals that fundamental understand-ing of subsequent yield surfaces after finite multiaxial loading, especially for non-proportional loading, is missing.
The primary objective of this study is to determine the subsequent yield surfaces based on 10 le deviation from linearityunder proportional and non-proportional loading paths, and after unloading from finite deformation. This study gives com-prehensive experimental results on subsequent yield surfaces of a high work hardening alloy under proportional and non-proportional loading paths which was previously missing in the literature. The size of yield surfaces under non-proportionalloading decreases and no cross-effect is observed; these yield surfaces are completely different under proportional loadingwhere the size of the yield surfaces increases and shows positive cross-effect. These results, and those in Part 1 on low workhardening alloys (Khan et al., 2009), provide important information in the behavior of two categories of alloys under complexloading paths. These observations therefore will enhance the understanding towards constitutive modeling for finite plas-ticity. Also, all the yield surfaces in Part 1 and this paper are in tension–torsion stress space, while the yield surfaces in ten-sion–tension space using axial loading and internal pressure will be investigated in a later study.
2. Experimental procedure and specimen geometry
Specimens of Al 1100 were annealed for 2 h at 593 �C (1100 F) and then allowed to cool in the furnace. Hollow tubularaxial-torsion specimens were used with a gage length of 50.8 mm (2 in.), inside diameter of 12.67 mm (0.499 in.), and anoutside diameter of 15.52 mm (0.611 in.) in the test section. Experiments were conducted using an MTS servo hydraulic ax-ial-torsional material testing system and the axial and shear strains were recorded using high elongation, KFEL-2-120-C1,uniaxial and high elongation KFE-2-120-D32 biaxial gage. For subsequent yield surfaces the strains were recorded using highprecision stacked electrical strain rosettes, KFG-2-120-D17-11, manufactured by Kyowa Inc. Initial and the subsequent yieldsurfaces were determined using the 10 le deviation from linearity definition of yield.
Specimen B1 was used to find the initial yield surface, while B2, B3, and B4 were strained in tension, torsion and com-bined tension–torsion proportional loadings to probe the subsequent yield surfaces at various levels of strain. Yield surfaceswere determined at 2%, 8%, and 16% true tensile strains; 4%, 10%, and 20% shear strains; and 2%, 8%, and 16% von-Misesequivalent strains in combined tension–torsion loading for an equiangular path (45�) in the (r11–
p3r12) stress space. Yield
surfaces were also determined separately after one proportional (linear) and two non-proportional unloading paths(bi-linear and non-linear) to the zero stress. B5, B6, and B7 were strained to 16% true tensile strain. These specimens werethen relaxed for 1 h and unloaded along linear, bi-linear, and non-linear path and a new strain gage was mounted afterunloading to probe the yield surface. Similarly, B8, B9, and B10 were strained to 20% shear strain, and B11, B12, and B13 were

A.S. Khan et al. / International Journal of Plasticity 26 (2010) 1421–1431 1423
strained to 16% eq. strain and unloaded in linear (B8 and B11), bi-linear (B9 and B12) and non-linear (B10 and B13) pathsafter 1 h relaxation period and yield surfaces were determined.
The subsequent yield surfaces were also determined under non-proportional loading paths at different levels of finitedeformation. The specimen B14 was loaded in shear to 4% shear strain and then without unloading the shear stress, pulledin tension to 2%, 8%, and 16% tensile strain. Specimen B15 was loaded to 10% shear strain and then without unloading theshear stress, pulled in tension to 2% and 8% tensile strain. Similarly, specimen B16 and B17 were first strained to, respec-tively, 2% and 8% tensile strain followed by shear loading without unloading the tensile stress. B16 was used to probe thesubsequent yield surfaces at 4%, 10%, and 20% shear strain; B17 was used to probe at subsequent 4% and 10% shear strain.The specimens were relaxed each time for 1 h at each level of deformation and then probed normal to the loading directions(within the subsequent yield surface) to determine Young’s modulus (B16 and B17) and shear modulus (B14 and B15). Therelaxation period facilitated the bonding of new strain gage before unloading for accurate determination of elastic constants.The details of experimental methodology and probing paths can be found in Khan et al. (2009).
3. Experimental results and discussion
3.1. Initial yield surface
The comparison of initial yield points with von-Mises and Tresca criteria is shown in Fig. 1. Yield stress in compression,7.77 MPa, was slightly higher than in tension 7.26 MPa. Similarly, the values of yield stress obtained in torsion and reversetorsion were 6.78 MPa and 6.85 MPa, respectively. Additional points obtained after sequential probing were (6.09, 3.37 MPa),(�6.48, �3.53 MPa), (5.92, �3.53 MPa), and (�6.72, 3.37 MPa) and the experimental yield points lie between von-Mises andTresca criterion. The points were found to be closest to the von-Mises criterion. Similar, results were also reported by Phillipsand Das (1985) and Helling et al. (1986) for 1100-O aluminum.
3.2. Subsequent yield surfaces under proportional loading paths
The subsequent yield surfaces were determined for tensile, free end torsion, and combined tension–torsion proportionalloading paths at various levels of strain. Yield surfaces were determined at 2%, 8%, and 16% true tensile strain (Fig. 2). Spec-imen was first deformed to 2% tensile true plastic strain and relaxed for 1 h to (47.10, 0 MPa), the forward yield stress. Spec-imen was then unloaded until 10 le deviation from linearity was observed and the reverse yield stress (26.91, 0 MPa) wasrecorded and then probed perpendicular to loading direction to obtain an exact shape. Further straining was done to 8% and16% true tensile strain and the forward and reverse yield points obtained were (67.32, 0 MPa), (40.70, 0 MPa) and (72.97,0 MPa), and (37.44, 0 MPa), respectively. A similar probing sequence was used to determine the additional points on theyield surface at each level of strain. Subsequent yield surfaces showed a blunt nose in the loading direction and were flatin the reverse or unloading direction. The yield surface depicts kinematic hardening for smaller values of plastic strainbut showed strong isotropic hardening after finite deformation; as a result the size of the subsequent yield surfaces in-creased and showed a positive cross-effect. Results on the subsequent yield surfaces were also reported by Shiratori et al.(1973) on thin-walled tubular specimens of brass (a high work hardening material) with radial probing and effective proofstrain of 0.02% (a large scale definition of yield).
B3 was twisted to 4%, 10%, and 20% shear strain and the yield surfaces were determined at each level (Fig. 3). After 4%deformation the specimen was relaxed for 1 h to the forward yield stress (0, 47.89 MPa) and then unloaded until the (10/p
3) le deviation from linearity was observed to reverse yield point (0, 17.37 MPa). Yield surfaces were further probed in
Fig. 1. Comparison of Initial yield points (experimental), von-Mises, and Tresca yield criterion.

Fig. 2. Subsequent yield surfaces after tensile loading.
Fig. 3. Subsequent yield surfaces after torsional loading.
1424 A.S. Khan et al. / International Journal of Plasticity 26 (2010) 1421–1431
a sequential manner by Khan et al. (2009) perpendicular to the loading direction to find the yield points in other directions.Specimen was further advanced to 10% and 20% shear strain, and forward and reverse yield stresses recorded were (0,60.71 MPa), (0, 25.67 MPa) and (0, 66.06 MPa), and (0, 25.46 MPa), respectively. Subsequent yield surface showed distortion,expansion, positive cross-effect and nose in the loading direction. However, the yield surfaces were flat in the reverse loadingdirection. Subsequent yield surfaces also showed kinematic hardening for small plastic deformation but the rate of kinematichardening decreased with deformation and showed isotropic hardening. Experiments for yield surface determination wereperformed in torsion by Helling et al. (1986) for Al 1100 (O) and 70:30 brass and showed increased size and positive cross-effect with plastic deformation. Stout et al. (1985) obtained similar results on 1100-O aluminum in torsion for small plasticstrain (c = 0.02).
Subsequent yield surfaces were also determined in combined tension–torsion proportional loading at 2%, 8%, and 16%equivalent strain (Fig. 4). Specimen was first loaded to 2% equivalent strain, relaxed for 1 h to forward yield stress (27.86,
Fig. 4. Subsequent yield surfaces after combined tension–torsion loading.
A.S. Khan et al. / International Journal of Plasticity 26 (2010) 1421–1431 1425
26.55 MPa), unloaded to the reverse yield point (14.92, 14.29 MPa), and further probed in various directions for additionalyield points. Further equal-biaxial loading was done until 8% and finally to 16% equivalent strains, and probed in a sequentialmanner as explained in Khan et al. (2009) to get the exact shape of yield surfaces. Subsequent yield surfaces after combinedtension–torsion loading show kinematic hardening and a sharper nose in the loading direction as compared to subsequentyield surfaces in tension and torsional loading. This appears due to contraction in lateral direction in combined loading.However, the yield surfaces after finite deformation show isotropic hardening, positive cross-effect, and the size of the yieldsurfaces increases with plastic deformation.
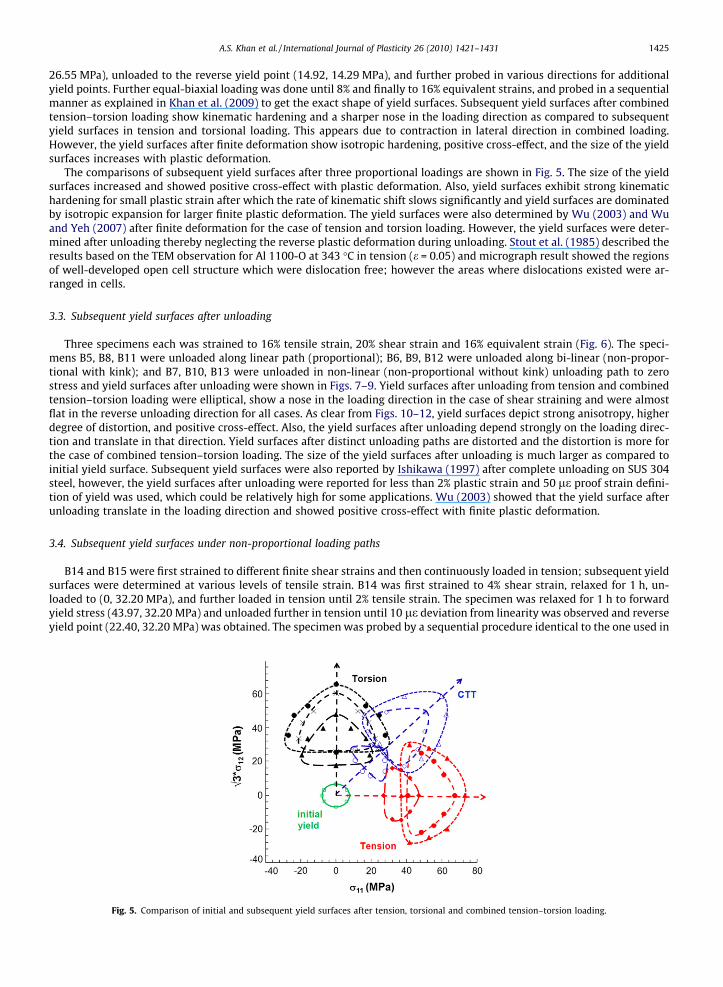
The comparisons of subsequent yield surfaces after three proportional loadings are shown in Fig. 5. The size of the yieldsurfaces increased and showed positive cross-effect with plastic deformation. Also, yield surfaces exhibit strong kinematichardening for small plastic strain after which the rate of kinematic shift slows significantly and yield surfaces are dominatedby isotropic expansion for larger finite plastic deformation. The yield surfaces were also determined by Wu (2003) and Wuand Yeh (2007) after finite deformation for the case of tension and torsion loading. However, the yield surfaces were deter-mined after unloading thereby neglecting the reverse plastic deformation during unloading. Stout et al. (1985) described theresults based on the TEM observation for Al 1100-O at 343 �C in tension (e = 0.05) and micrograph result showed the regionsof well-developed open cell structure which were dislocation free; however the areas where dislocations existed were ar-ranged in cells.
3.3. Subsequent yield surfaces after unloading
Three specimens each was strained to 16% tensile strain, 20% shear strain and 16% equivalent strain (Fig. 6). The speci-mens B5, B8, B11 were unloaded along linear path (proportional); B6, B9, B12 were unloaded along bi-linear (non-propor-tional with kink); and B7, B10, B13 were unloaded in non-linear (non-proportional without kink) unloading path to zerostress and yield surfaces after unloading were shown in Figs. 7–9. Yield surfaces after unloading from tension and combinedtension–torsion loading were elliptical, show a nose in the loading direction in the case of shear straining and were almostflat in the reverse unloading direction for all cases. As clear from Figs. 10–12, yield surfaces depict strong anisotropy, higherdegree of distortion, and positive cross-effect. Also, the yield surfaces after unloading depend strongly on the loading direc-tion and translate in that direction. Yield surfaces after distinct unloading paths are distorted and the distortion is more forthe case of combined tension–torsion loading. The size of the yield surfaces after unloading is much larger as compared toinitial yield surface. Subsequent yield surfaces were also reported by Ishikawa (1997) after complete unloading on SUS 304steel, however, the yield surfaces after unloading were reported for less than 2% plastic strain and 50 le proof strain defini-tion of yield was used, which could be relatively high for some applications. Wu (2003) showed that the yield surface afterunloading translate in the loading direction and showed positive cross-effect with finite plastic deformation.
3.4. Subsequent yield surfaces under non-proportional loading paths
B14 and B15 were first strained to different finite shear strains and then continuously loaded in tension; subsequent yieldsurfaces were determined at various levels of tensile strain. B14 was first strained to 4% shear strain, relaxed for 1 h, un-loaded to (0, 32.20 MPa), and further loaded in tension until 2% tensile strain. The specimen was relaxed for 1 h to forwardyield stress (43.97, 32.20 MPa) and unloaded further in tension until 10 le deviation from linearity was observed and reverseyield point (22.40, 32.20 MPa) was obtained. The specimen was probed by a sequential procedure identical to the one used in
Fig. 5. Comparison of initial and subsequent yield surfaces after tension, torsional and combined tension–torsion loading.

Fig. 6. The linear, bi-linear, and non-linear unloading paths after finite deformation from tension, torsional and combined tension–torsion loading. (Note: allunloading paths are within 0.2% offset yield surfaces.)
Fig. 7. The initial yield surface and yield surfaces after complete linear unloading from tension, torsion and combined tension–torsion loadings.
Fig. 8. The initial yield surface and yield surfaces after complete bi-linear unloading from tension, torsion and combined tension–torsion loadings.
1426 A.S. Khan et al. / International Journal of Plasticity 26 (2010) 1421–1431
the case of tensile proportional loading to obtain the exact shape of the yield surface. The specimen was next loaded to 8%tensile strain, relaxed for 1 h to the forward yield point (61.98, 32.20 MPa) and unloaded to reverse yield point (33.17,32.20 MPa). Finally the specimen was loaded to 16% tensile strain, and the forward and reverse yield stress recorded were(64.61, 32.20 MPa) and (33.27, 32.20 MPa). The yield surface was probed normal to the last loading direction to measure thecross-effect as shown in Fig. 13. Similarly, B15 was first strained to 10% shear strain, unloaded to (0, 44.68 MPa) and furtherloaded in tension. The yield surfaces were determined at 2% and 8% tensile strains and the forward and reverse yield stresses

Fig. 9. The initial yield surface and yield surfaces after complete non-linear unloading from tension, torsion and combined tension–torsion loadings.
Fig. 10. The initial yield surface and yield surfaces after complete linear, bi-linear and non-linear unloading from tensile loadings.
Fig. 11. The initial yield surface and yield surfaces after complete linear, bi-linear and non-linear unloading from torsional loadings.
A.S. Khan et al. / International Journal of Plasticity 26 (2010) 1421–1431 1427
were (41.18, 44.68 MPa), (56.44, 44.68 MPa) and (16.77, 44.68 MPa), (27.23, 44.68 MPa), respectively. The yield surface wasprobed perpendicular to the loading direction at each level of subsequent strain to obtain the exact shape of yield surface(Fig. 14).
Finally, the yield surfaces were determined after tension followed by torsion. Specimen B16 was first strained to 2% ten-sile strain, relaxed for 1 h and then unloaded to (37.85, 0 MPa) followed by free end torsional subsequent loading and thesubsequent yield surfaces was first determined at 4% shear strain. Specimen was first relaxed for 1 h to obtain the forwardyield stress (37.85, 47.09 MPa) and later unloaded until (10/
p3) le deviation from linearity was observed to reverse shear
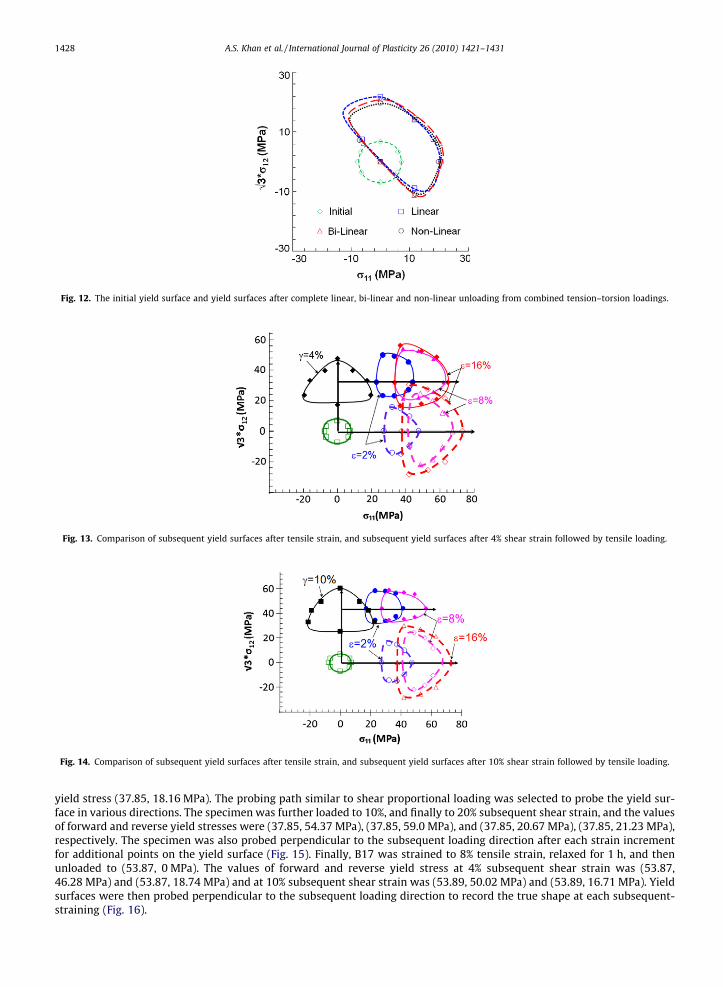
Fig. 12. The initial yield surface and yield surfaces after complete linear, bi-linear and non-linear unloading from combined tension–torsion loadings.
Fig. 13. Comparison of subsequent yield surfaces after tensile strain, and subsequent yield surfaces after 4% shear strain followed by tensile loading.
Fig. 14. Comparison of subsequent yield surfaces after tensile strain, and subsequent yield surfaces after 10% shear strain followed by tensile loading.
1428 A.S. Khan et al. / International Journal of Plasticity 26 (2010) 1421–1431
yield stress (37.85, 18.16 MPa). The probing path similar to shear proportional loading was selected to probe the yield sur-face in various directions. The specimen was further loaded to 10%, and finally to 20% subsequent shear strain, and the valuesof forward and reverse yield stresses were (37.85, 54.37 MPa), (37.85, 59.0 MPa), and (37.85, 20.67 MPa), (37.85, 21.23 MPa),respectively. The specimen was also probed perpendicular to the subsequent loading direction after each strain incrementfor additional points on the yield surface (Fig. 15). Finally, B17 was strained to 8% tensile strain, relaxed for 1 h, and thenunloaded to (53.87, 0 MPa). The values of forward and reverse yield stress at 4% subsequent shear strain was (53.87,46.28 MPa) and (53.87, 18.74 MPa) and at 10% subsequent shear strain was (53.89, 50.02 MPa) and (53.89, 16.71 MPa). Yieldsurfaces were then probed perpendicular to the subsequent loading direction to record the true shape at each subsequent-straining (Fig. 16).

Fig. 15. Comparison of subsequent yield surfaces after shear strain, and subsequent yield surfaces after 2% tensile strain followed by shear loading.
A.S. Khan et al. / International Journal of Plasticity 26 (2010) 1421–1431 1429
The subsequent yield surfaces under non-proportional loading are smaller as compared to yield surfaces under propor-tional loading. The subsequent yield surfaces are highly distorted and show mixed cross-effect with plastic deformation fol-lowing load path change, including nearly static (Fig. 13), negative, then turning static (Fig. 14), static then turning positive(Fig. 15), and mixed negative-positive (Fig. 16) cross-effects. Also, the rate of kinematic and isotropic hardening decreasedwith finite plastic deformation.
3.5. Variation of elastic modulus with finite deformation
Young’s and shear moduli were recorded at each level of strain within each subsequent yield surfaces. The average valueswithin each surface are shown in Figs. 17 and 18 as a function of plastic deformation. Each specimen was relaxed for 1 h afterstraining and the moduli were determined within the subsequent yield surface, with procedure discussed in Khan et al.(2009). The Young’s and shear modulus decrease with plastic deformation and the decrease is more in the case of non-pro-portional loading as compared to the proportional loading paths.
4. Conclusions
Subsequent yield surfaces for annealed Al 1100 were determined under tension, free end torsion, combined tension–tor-sion loading at various levels of straining. The initial yield surface was close to the von-Mises surface. However, subsequentyield surfaces were distorted, exhibited a positive cross-effect and showed a distinct nose in the loading direction. The yieldsurfaces depicted kinematic hardening for small plastic strain but the rate of kinematic hardening decreased and isotropichardening increased with finite plastic deformation. Yield surfaces obtained after linear, bi-linear, and non-linear unloadingpaths translated in the loading direction and showed positive cross-effect. Additionally, for the first time, yield surfaces wereinvestigated after finite plastic deformation under non-proportional loading paths and showed a completely different behav-ior as compared to yield surfaces after proportional loading. Subsequent yield surfaces were smaller, with a mixed but alsosmaller cross-effect, and the rate of kinematic hardening also decreased with finite deformation. The Young’s and shear mod-uli also decreased with plastic deformation and this decrease was more in the case of combined tension–torsional loading.
Fig. 16. Comparison of subsequent yield surfaces after shear strain, and subsequent yield surfaces after 8% tensile strain followed by shear loading.

Fig. 17. Variation of Young’s modulus with finite plastic deformation along different loading paths.
Fig. 18. Variation of shear modulus with finite plastic deformation along different loading paths.
1430 A.S. Khan et al. / International Journal of Plasticity 26 (2010) 1421–1431
The decrease in moduli was also observed after non-proportional loading. The results on the subsequent yield surfaces andyield surfaces after unloading in the Part 1 (Khan et al., 2009) of this study were substantially different than the present ones.Also, subsequent yield surfaces after non-proportional loading showed decrease in size, higher degree of distortion and de-crease in cross-effect with plastic deformation which was in contrast to the yield surfaces obtained under proportional load-ings. The experimental studies on both materials provided a complete set of results, missing in the literature for bothcategories of alloys after finite deformation. These experimental results will provide valuable information towards modeldevelopment for finite plastic deformation.
References
Baltov, A., Sawczuk, A., 1965. A rule of anisotropic hardening. Acta Mech. 2, 81–92.Bertsch, P.K., Findley., W.N., 1962. An experimental study of subsequent yield surfaces-corners, normality, Bauschinger and allied effects. In: Proceedings of
the Fourth National Congress of Applied Mechanics, pp. 893–907.Edelman, F., Drucker, D.C., 1951. Some extension of elementary plasticity theory. J. Franklin Inst. 6, 581–605.Eisenberg, M.A., Yen, C.-F., 1984. The anisotropic deformation of yield surfaces. J. Eng. Mater. Technol. 106, 355–360.Hecker, S.S., 1972. Experimental investigation of corners in the yield surface. Acta Mech. 13, 69–86.Helling, D.E., Miller, A.K., 1987. The incorporation of yield surface distortion into a unified constitutive model. Part 1: equation development. Acta Mech. 69,
9–23.Helling, D.E., Miller, A.K., Stout, M.G., 1986. An experimental investigation of the yield surfaces of 1100-0 aluminium, 70:30 brass and an overaged 2040
aluminium alloy after various prestrains. J. Eng. Mater. Technol. ASME 108, 313–320.Hosford, W.F., 1979. On yield surfaces of anisotropic cubic metals. In: Proceedings of the Seventh North American Metalworking Conference, SME, Dearborn,
MI, pp. 191–197.Ishikawa, H., 1997. Subsequent yield surface probed from its current center. Int. J. Plasticity 13, 533–549.Khan, A.S., Kazmi, R., Pandey, A., Stoughton, T., 2009. Evolution of subsequent yield surfaces and elastic constants with finite plastic deformation. Part-I: A
very low work hardening aluminum alloy (Al6061-T6511). Int. J. Plasticity 25, 1611–1625.Khan, A.S., Pandey, A., Stoughton, T., 2010. Evolution of subsequent yield surfaces and elastic constants with finite plastic deformation, part-III: Yield surface
in tension- tension stress space (Al 6061- T 6511 & annealed 1100 Al). Int. J. Plasticity 26, 1432–1441.Korkolis, Y.P., Kyriakides, S., 2008a. Inflation and burst of aluminum tubes. Part II: an advanced yield function including deformation-induced anisotropy.
Int. J. Plasticity 24, 1625–1637.Korkolis, Y.P., Kyriakides, S., 2008b. Inflation and burst of anisotropic aluminum tubes for hydroforming applications. Int. J. Plasticity 24, 509–543.Korkolis, Y.P., Kyriakides, S., 2009. Path-dependent failure of inflated aluminum tubes. Int. J. Plasticity 25, 2059–2080.Kowalsky, U., Ahrens, H., Dinkler, D., 1999. Distorted yield surfaces – modelling by higher order anisotropic hardening tensors. Comput. Mater. Sci. 16, 81–
88.Phillips, A., Chong, W.L., 1979. Yield surfaces and loading surfaces: experiments and recommendations. Int. J. Solids Struct. 15, 715–729.

A.S. Khan et al. / International Journal of Plasticity 26 (2010) 1421–1431 1431
Phillips, A., Das, P.K., 1985. Yield surfaces and loading surfaces of aluminum and brass: an experimental investigation at room and elevated temperatures.Int. J. Plasticity 1, 89–109.
Phillips, A., Lee, C.-W., 1979. Yield surfaces and loading surfaces: experiments and recommendations. Int. J. Solids Struct. 15, 715–729.Phillips, A., Lu, W.Y., 1984. The experimental investigation of yield surfaces and loading surfaces of pure aluminum with stress controlled and strain
controlled paths of loading. ASME J. Eng. Mater. Technol. 106, 349–354.Phillips, A., Moon, H., 1977. An experimental investigation concerning yield surfaces and loading surfaces. Acta Mech. 27, 91–101.Phillips, A., Ricciuti, M., 1976. Fundamental experiments in plasticity and creep of aluminum – extension of previous results. Int. J. Solids Struct. 12, 159–
171.Phillips, A., Tang, J.L., 1972. The effect of loading path on the yield surface at elevated temperatures. Int. J. Solids Struct. 8, 463–474.Phillips, A., Liu, K., Justusson, J.W., 1972. An experimental investigation of yield surfaces at elevated temperatures. Acta Mech. 14, 119–146.Phillips, A., Tang, J.L., Ricciuti, M., 1974. Some new observations on yield surfaces. Acta Mech. 20, 23–39.Rees, D.W.A., 1982. Yield functions that account for the effects of initial and subsequent plastic anisotropy. Acta Mech. 43, 223–241.Shiratori, E., Ikegami, K., Kaneko, K., 1973. The influence of the Bauschinger effect on the subsequent yield condition. Bull. JSME 16, 1482–1493.Shrivastava, H.P., Mroz, Z., Dubey, R.N., 1973. Yield criterion and the hardening rule for a plastic solid. ZAMM 10, 625–633.Stout, M.G., Martin, P.L., Helling, D.E., Canova, G.R., 1985. Multiaxial yield behavior of 1100 aluminum following various magnitudes of prestrain. Int. J.
Plasticity 1, 163–174.Suprun, A.N., 2006. A constitutive model with three plastic constants: the description of anisotropic work hardening. Int. J. Plasticity 7, 1217–1233.William, J.F., Svensson, N.L., 1970. Effect of tensile pre-strain on the yield locus of 1100-F aluminum. J. Strain Anal. 5, 128–139.William, J.F., Svensson, N.L., 1971. Effect of torsional pre-strain on the yield locus of 1100-F aluminum. J. Strain Anal. 6, 263–272.Wu, H.C., 2003. Effect of loading-path on the evolution of yield surface for anisotropic metals subjected to large pre-strain. Int. J. Plasticity 19, 1773–1800.Wu, H.C., Yeh, W.C., 2007. On stress rate and plasticity constitutive equations referred to a body-fixed coordinate system. Int. J. Plasticity 7, 803–826.Yang, M., Akiyama, Y., Sasaki, T., 2004. Evaluation of change in material properties due to plastic deformation. J. Mater. Process. Technol. 151, 232–236.