Exploring the gender differences in quality of life of indian dementia caregivers

Evidence of Associations between Cytokine Genes andSubjective Reports of Sleep Disturbance in OncologyPatients and Their Family CaregiversChristine Miaskowski1*, Bruce A. Cooper2, Anand Dhruva3, Laura B. Dunn4, Dale J. Langford1,
Janine K. Cataldo1, Christina R. Baggott1, John D. Merriman1, Marylin Dodd1, Kathryn Lee5,
Claudia West1, Steven M. Paul1, Bradley E. Aouizerat1
1 Department of Physiological Nursing, University of California San Francisco, San Francisco, California, United States of America, 2 Department of Community Health
Systems, University of California San Francisco, San Francisco, California, United States of America, 3 Department of Medicine, University of California San Francisco, San
Francisco, California, United States of America, 4 Department of Psychiatry, University of California San Francisco, San Francisco, California, United States of America,
5 Department of Family Health Care Nursing, University of California San Francisco, San Francisco, California, United States of America
Abstract
The purposes of this study were to identify distinct latent classes of individuals based on subjective reports of sleepdisturbance; to examine differences in demographic, clinical, and symptom characteristics between the latent classes; andto evaluate for variations in pro- and anti-inflammatory cytokine genes between the latent classes. Among 167 oncologyoutpatients with breast, prostate, lung, or brain cancer and 85 of their FCs, growth mixture modeling (GMM) was used toidentify latent classes of individuals based on General Sleep Disturbance Scale (GSDS) obtained prior to, during, and for fourmonths following completion of radiation therapy. Single nucleotide polymorphisms (SNPs) and haplotypes in candidatecytokine genes were interrogated for differences between the two latent classes. Multiple logistic regression was used toassess the effect of phenotypic and genotypic characteristics on GSDS group membership. Two latent classes wereidentified: lower sleep disturbance (88.5%) and higher sleep disturbance (11.5%). Participants who were younger and had alower Karnofsky Performance status score were more likely to be in the higher sleep disturbance class. Variation in twocytokine genes (i.e., IL6, NFKB) predicted latent class membership. Evidence was found for latent classes with distinct sleepdisturbance trajectories. Unique genetic markers in cytokine genes may partially explain the interindividual heterogeneitycharacterizing these trajectories.
Citation: Miaskowski C, Cooper BA, Dhruva A, Dunn LB, Langford DJ, et al. (2012) Evidence of Associations between Cytokine Genes and Subjective Reports ofSleep Disturbance in Oncology Patients and Their Family Caregivers. PLoS ONE 7(7): e40560. doi:10.1371/journal.pone.0040560
Editor: Jun Sun, Rush University Medical Center, United States of America
Received March 3, 2012; Accepted June 8, 2012; Published July 23, 2012
Copyright: � 2012 Miaskowski et al. This is an open-access article distributed under the terms of the Creative Commons Attribution License, which permitsunrestricted use, distribution, and reproduction in any medium, provided the original author and source are credited.
Funding: This research was supported by a grant from the National Institute of Nursing Research (NR04835) and partially supported by an University of CaliforniaSan Francisco(UCSF) Academic Senate grant to LBD and BEA. BEA was funded through the National Institutes of Health (NIH) Roadmap for Medical Research Grant(KL2 RR624130). CM is funded by the American Cancer Society (ACS) as a Clinical Research Professor. AD is funded through NIH Mentored Patient-OrientedResearch Career Development Award (K23 AT005340). DJL is supported by a Department of Defense Breast Cancer Research Program Postdoctoral Fellowship.JDM is supported by an NINR fellowship (F31 NR012604), an ACS Doctoral Degree Scholarship (DSCN-10-087), an Oncology Nursing Society Doctoral Scholarship,and a UCSF Nursing Alumni Association Scholarship. The funders had no role in the study design, data collection and analysis, decision to publish, or preparationof the manuscript.
Competing Interests: The authors have declared that no competing interests exist.
* E-mail: [email protected]
Introduction
Sleep disturbance is a significant problem for oncology patients
[1,2] and their family caregivers (FCs) [3–6]. Phenotypic
characterization of sleep disturbance has focused primarily on
the administration of subjective measures and the dichotomization
of samples based on clinically meaningful cutpoints. Findings from
primarily cross-sectional studies suggest that between 30% and
50% of patients [1,7,8] and FCs [5,9] report sleep disturbance.
Patients [8,10] and FCs [5,11] report problems with both the
initiation and the maintenance of sleep.
Newer statistical methods, like latent class analysis and growth
mixture modeling (GMM), may allow for the characterization of
subgroups of individuals with distinct types of sleep disturbance.
These approaches can be used to classify patients with chronic
medical conditions like cancer, as well as their FCs who experience
the stressors associated with caring for someone with a chronic
illness and who have chronic medical conditions themselves.
However, only two population-based studies were found that
characterized individuals into distinct subgroups based on self-
reported sleep disturbance [12,13]. In the first cross-sectional study
that evaluated individuals enrolled in a Midwest health plan [12],
the subgroups were named: distressed (33.2% who had a single
sleep complaint that occurred weekly and emotional distress),
transient (25.5% who had a variety of sleep-related symptoms that
occurred with different frequencies), difficulty maintaining sleep
(21.9% who had insomnia symptoms every night), and comorbid
with non-restorative sleep (19.4% who had sleep problems every
night and daytime dysfunction). The second study from the
Finnish Twin Cohort [13], identified three distinct subgroups of
individuals (i.e., good sleepers (48%), average sleepers (40%), poor
sleepers (12%)). These sleep disturbance subgroups showed a
PLoS ONE | www.plosone.org 1 July 2012 | Volume 7 | Issue 7 | e40560

moderate heritability estimate of 46% which suggests a role for
genetic factors in sleep disturbance. These findings suggest that
latent class methods can be used to identify distinct sleep
disturbance phenotypes. However, the studies’ cross-sectional
design did not allow for an evaluation of distinct subgroups of
individuals whose sleep disturbance might persist over a period of
months or years.
The relationships among sleep, circadian rhythms, and the
immune system were the subject of a number of recent reviews
[14–18]. Equally important, a growing body of evidence suggests
that sleep is genetically modulated (for reviews see Cirelli, 2011
[19] and Sehgal and Mignot, 2011 [20]). As noted by Sehgal and
Mignot [20], while environmental factors can impact sleep, its
genetic regulation is substantiated by the identification of
polymorphisms in specific sleep disorders and the existence of
familial sleep disorders. However, only a limited number of studies
have evaluated for associations between inflammatory cytokine
genes and sleep disturbance. In one study that evaluated the
association between polymorphisms in interleukin-6 (IL6) and
obstructive sleep apnea [21], IL6 (rs2069849) was associated with
a decreased risk for obstructive sleep apnea, after adjusting for
body mass index assuming an additive model. In addition, recent
work from our group found an association between a candidate
gene in IL6 (rs4719714) and self-reported sleep disturbance in
patients and their FCs at the initiation of the patients’ radiation
therapy (RT). Common allele homozygotes reported higher levels
of sleep disturbance (p = 0.003) than minor allele carriers [22].
Given the paucity of research on the association between
cytokine genes and sleep disturbance, the purposes of this study,
using GMM in the previously described sample of patients and
FCs [22], were to identify distinct latent classes of individuals
based on subjective reports of sleep disturbance from prior to the
initiation to four months after completion of RT and to examine
differences in demographic, clinical, and symptom characteristics
between the latent classes. In addition, variations in a number of
pro- and anti-inflammatory cytokine genes were evaluated
between the latent classes.
Methods
Participants and SettingsThis descriptive, correlational study is part of a larger,
longitudinal study that evaluated multiple symptoms in both
patients who underwent primary or adjuvant RT and their FCs
[3,8,9,22,23]. Patients and their FCs were recruited from two RT
departments located in a Comprehensive Cancer Center and a
community-based oncology program at the time of the patient’s
simulation visit.
Patients were eligible to participate if they: were $18 years of
age; were scheduled to receive primary or adjuvant RT for one of
four cancer diagnoses (i.e., breast, prostate, lung, brain); were able
to read, write, and understand English; gave written informed
consent; and had a Karnofsky Performance Status (KPS) score of
$60. Patients were excluded if they had: metastatic disease; more
than one cancer diagnosis; or a diagnosed sleep disorder. FCs were
eligible to participate if they were an adult ($18 years of age); were
able to read, write, and understand English; gave written informed
consent; had a KPS score of $60; were living with the patient; and
did not have a diagnosed sleep disorder.
Self-report InstrumentsThe demographic questionnaire obtained information on age,
gender, marital status, education, ethnicity, employment status,
and the presence of a number of co-morbid conditions. Medical
records were reviewed for disease and treatment information.
The Pittsburgh Sleep Quality Index (PSQI) consists of 19 items
designed to assess the quality of sleep in the past month. The
global PSQI score is the sum of the seven component scores (i.e.,
subjective sleep quality, sleep latency, sleep duration, habitual
sleep efficiency, sleep disturbances, use of sleeping medication,
daytime dysfunction). Each component score ranges from 0 to 3
and the global PSQI score ranges from 0 to 21. Higher global and
component scores indicate more severe complaints and a higher
level of sleep disturbance. A global PSQI score of .5 indicates a
significant level of sleep disturbance [24]. The PSQI has
established internal consistency, test-retest reliability, and con-
struct validity [24–26]. In this study, the Cronbach’s alpha for the
global PSQI score was 0.72 for patients and 0.68 for FCs.
The General Sleep Disturbance Scale (GSDS) consists of 21-
items designed to assess the quality of sleep in the past week. Each
item was rated on a 0 (never) to 7 (everyday) numeric rating scale
(NRS). The GSDS total score is the sum of the seven subscale
scores (i.e., quality of sleep, quantity of sleep, sleep onset latency,
mid-sleep awakenings, early awakenings, medications for sleep,
excessive daytime sleepiness) that can range from 0 (no distur-
bance) to 147 (extreme sleep disturbance). Each mean subscale
score can range from 0 to 7. Higher total and subscale scores
indicated higher levels of sleep disturbance. Subscale scores of $3
and a GSDS total score of $43 indicate a significant level of sleep
disturbance [4,8,9,11,27]. The GSDS has well-established validity
and reliability in shift workers, pregnant women, and patients with
cancer and HIV [28–30]. In the current study, the Cronbach’s
alpha for the GSDS total score was 0.84 for patients and 0.79 for
FCs.
The Lee Fatigue Scale (LFS) consists of 18 items designed to
assess physical fatigue and energy [31]. Each item was rated on a 0
to 10 NRS. Total fatigue and energy scores were calculated as the
mean of the 13 fatigue items and the 5 energy items, with higher
scores indicating greater fatigue severity and higher levels of
energy. Participants were asked to rate each item based on how
they felt ‘‘right now,’’ within 30 minutes of awakening (morning
fatigue, morning energy), and prior to going to bed (evening
fatigue, evening energy). The LFS has been used with healthy
individuals [31,32] and in patients with cancer and HIV [30,33–
35]. Cutoff scores of $3.2 and $5.6 indicated high levels of
morning and evening fatigue, respectively [4]. Cutoff scores of
#6.0 and #3.5 indicate low levels of morning and evening energy,
respectively. The LFS was chosen for this study because it is
relatively short, easy to administer, and has well established
validity and reliability. In this study, Cronbach’s alphas for
evening and morning fatigue at enrollment were 0.96 and 0.95 for
patients and 0.95 and 0.96 for FCs, respectively. Cronbach’s
alphas for evening and morning energy were 0.95 and 0.96 for
patients and 0.95 and 0.96 for FCs, respectively.
The Center for Epidemiological Studies-Depression scale (CES-
D) consists of 20 items selected to represent the major symptoms in
the clinical syndrome of depression. Scores can range from 0 to 60,
with scores of $16 indicating the need for individuals to seek
clinical evaluation for major depression. The CES-D has well
established concurrent and construct validity [36–38]. In the
current study, the Cronbach’s alpha for the CES-D was 0.88 for
patients and 0.84 for FCs.
The Spielberger State-Trait Anxiety Inventories (STAI-T and
STAI-S) consist of 20 items each that are rated from 1 to 4. The
scores for each scale are summed and can range from 20 to 80. A
higher score indicates greater anxiety. The STAI-T measures an
individual’s predisposition to anxiety determined by his/her
Cytokine Genes and Self-Reported Sleep Disturbance
PLoS ONE | www.plosone.org 2 July 2012 | Volume 7 | Issue 7 | e40560

personality and estimates how a person generally feels. The STAI-
S measures an individual’s transitory emotional response to a
stressful situation. It evaluates the emotional responses of worry,
nervousness, tension, and feelings of apprehension related to how
a person feels ‘‘right now’’ in a stressful situation. Cutoff scores of
$31.8 and $32.2 indicate high levels of trait and state anxiety,
respectively. The STAI-S and STAI-T inventories have well
established criterion and construct validity and internal consisten-
cy reliability coefficients [39–41]. In the current study, the
Cronbach’s alphas for the STAI-T and STAI-S were 0.92 and
0.95 for patients and 0.89 and 0.93 for FCs, respectively.
The Attentional Function Index (AFI) consists of 16-items
designed to measure attentional fatigue in patients with cancer.
Each item is rated on a 0 to 10 NRS. A mean AFI score was
calculated, with higher scores indicating greater capacity to direct
attention and, therefore, lower levels of attentional fatigue [42,43].
Based on a previously conducted analysis of the frequency
distributions of AFI scores, attentional fatigue can be grouped
into categories of functional status (i.e., patients who score ,5.0
functioning poorly and experiencing high levels of attentional
fatigue, patients who score 5.0 to 7.5 functioning moderately well
and experiencing moderate levels of attentional fatigue, patients
who score .7.5 functioning well and experiencing low levels of
attentional fatigue [44]. The AFI has established reliability and
validity [42]. In the current study, Cronbach’s alpha for the AFI
was 0.95 for both patients and FCs.
Occurrence of pain was evaluated using the Brief Pain
Inventory [45]. Participants who responded yes to the question
of having pain were asked to rate its intensity using 0 (no pain) to
10 (worst pain imaginable) NRS.
Objective Measure of Sleep DisturbanceObjective data on sleep-wake activity rhythms were obtained by
continuous noninvasive monitoring of activity over 48 hours using
a wrist motion sensor (Mini Motionlogger Actigraph, Ambulatory
Monitoring, Inc., Ardsley, NY) [46–48]. Seven sleep/wake and
one activity/rest variables were selected that were identified by a
National Cancer Institute sponsored conference [2], an expert
panel that recommended a standard set of research assessments in
insomnia [49], and recently published studies [50,51]. Wrist
actigraphy was validated with EEG measures of sleep and
awakenings on men and women with both healthy and disturbed
sleep patterns [47–49]. It provides continuous motion data using a
battery-operated wristwatch-size microprocessor that senses mo-
tion with a piezo-electric beam and detects movement in all three
axes. The accompanying Action 4 software (Ambulatory Moni-
toring Inc.) allows analysis of activity and nonactivity as well as
automatic scoring of sleep and wake episodes in minutes.
Actigraphy scores, calculated using specific algorithms correlate
with polysomnography in adults at greater than 90% [48].
Study ProceduresThe study was approved by the Committee on Human
Research at the University of California, San Francisco and at
the second site. Approximately one week prior to the start of RT
(i.e., simulation visit when the measurements for RT are made),
patients were invited to participate in the study. If the FC was
present, a research nurse explained the study protocol to both the
patient and FC, determined eligibility, and obtained written
informed consent. FCs who were not present were contacted by
phone to determine their interest in participation. These FCs
completed the enrollment procedures at home.
At the time of the simulation visit, participants completed the
self-report questionnaires. Participants completed the symptom
questionnaires at 4 weeks after the initiation of RT, at the end of
RT, and at 4, 8, 12, and 16 weeks after the completion of RT (i.e.,
7 assessments over 6 months) In addition, patients’ medical records
were reviewed for disease and treatment information.
At each of the seven assessments, participants completed the
LFS [31] before going to bed each night (i.e., evening fatigue,
evening energy) and upon arising each morning (i.e., morning
fatigue, morning energy) for 2 consecutive days. Participants wore
the wrist actigraph to monitor nocturnal sleep/rest and daytime
wake/activity continuously for two consecutive weekdays and
completed a two day diary. Participants were asked to use the
event marker on the wrist actigraph to indicate ‘‘lights out’’ and
‘‘lights on’’ time. Participants reported no difficulties wearing the
wrist actigraph. Because the actual time is important in the
calculation of the amount of sleep obtained in the amount of time
designated for sleep, having an additional source of information
about nap times, bed times, and wake times is important. This
information was recorded in a two day diary. Upon awakening,
the participants used the diary to indicate the number of
awakenings during the night.
Methods of Analysis for Clinical DataData were analyzed using SPSS Version 18 [52] and Mplus
Version 6.11 [53]. Descriptive statistics and frequency distribu-
tions were generated on the sample characteristics and symptom
severity scores. Independent sample t-tests and Chi-square
analyses were done to evaluate for differences in demographic,
clinical and genotypic characteristics between patients and FCs,
and between the GMM latent classes.
Actigraphy files in zero-crossing mode, with 30 second intervals,
were analyzed using the Cole-Kripke Algorithm in the Action 4
software (Ambulatory Monitoring Inc) by two of the researchers
(KL and CW). First, the file was scanned for missing data. Time
limits were set for the 48-hour period. The file was reviewed and
intervals were individually set for each day and night period using
in order of priority as decision guides: the event marker, diary
data, channel data, and cascading movement data.
GMM with robust maximum likelihood estimation was used to
identify latent classes (i.e., subgroups of participants) with distinct
sleep disturbance trajectories (i.e., total GSDS scores) over the 6
months of the study [54]. Because 65% of the participants were in
patient-caregiver dyads, models were estimated with ‘‘dyad’’ as a
clustering variable, to ensure that any dependency between the
GSDS scores for patients and FCs in the same dyad were
‘‘controlled for’’ in the GMM analysis.
The GMM methods are described in detail elsewhere [23]. In
brief, a single growth curve that represented the ‘‘average’’ change
trajectory was estimated for the total sample. Then the number of
latent growth classes that best fit the data was identified using
guidelines recommended by a number of experts [55–57].
First, a model with two latent classes was fit to the data, then a
model with three latent classes was fit. The process was repeated
until the model with a greater number of classes was not
supported. Model fit for the GMM was assessed statistically by
identifying the model with the lowest Bayesian Information
Criterion (BIC), and by testing the ‘‘K’’ versus ‘‘K-10 class models
to determine whether a model with K classes fit the data better
than a model with K-1 classes with the Vuong-Lo-Mendell-Rubin
likelihood ratio test (VLMR) [55,56].
The third index used to evaluate model fit was entropy (i.e., the
proportion of latent versus predicted class membership. It was
estimated for each solution with ..80 being preferred. Better
fitting models should produce higher entropy values, indicating
consistency between the latent and predicted class membership
Cytokine Genes and Self-Reported Sleep Disturbance
PLoS ONE | www.plosone.org 3 July 2012 | Volume 7 | Issue 7 | e40560

Table 1. Summary of single nucleotide polymorphisms analyzed for pro- and anti-inflammatory cytokine genes and the growthmixture model analysis for general sleep disturbance scale total score.
Gene SNP Position Chr MAF Alleles Chi Square p-value Model
IFNG1 rs2069728 66834051 12 .079 G.A 2.18 .335 A
IFNG1 rs2069727 66834490 12 .411 A.G 1.00 .608 A
IFNG1 rs2069718 66836429 12 .442 C.T 2.16 .340 A
IFNG1 rs1861493 66837463 12 .264 A.G 0.62 .733 A
IFNG1 rs1861494 66837676 12 .279 T.C 0.08 .961 A
IFNG1 rs2069709 66839970 12 .008 G.T FE 1.000 A
IFNG1 HapA3 n/a 0.62 .733
IFNG1 HapA5 n/a 1.00 .608
IFNGR1 rs9376268 137574444 6 .246 G.A 1.47 .479 A
IL1B rs1071676 106042060 2 .198 G.C 2.23 .328 A
IL1B rs1143643 106042929 2 .331 G.A 0.21 .902 A
IL1B rs1143642 106043180 2 .095 C.T 1.98 .371 A
IL1B rs1143634 106045017 2 .196 C.T 2.33 .312 A
IL1B rs1143633 106045094 2 .345 G.A 0.25 .883 A
IL1B rs1143630 106046282 2 .103 C.A 0.37 .831 A
IL1B rs3917356 106046990 2 .432 A.G 1.04 .594 A
IL1B rs1143629 106048145 2 .353 T.C 0.82 .663 A
IL1B rs1143627 106049014 2 .390 T.C 1.45 .485 A
IL1B rs16944 106049494 2 .380 G.A 1.94 .379 A
IL1B rs1143623 106050452 2 .248 G.C 2.15 .341 A
IL1B rs13032029 106055022 2 .428 C.T 1.12 .570 A
IL1B HapA1 n/a 3.87 .145
IL1B HapA3 n/a FE .191
IL1B HapA4 n/a 0.21 .899
IL1B HapA5 n/a 2.44 .296
IL1B HapB1 n/a 0.15 .928
IL1B HapB7 n/a 2.37 .306
IL1B HapB9 n/a 1.06 .588
IL1B HapB11 n/a 0.29 .863
IL1R1 rs949963 96533648 2 .213 G.A 2.39 .302 A
IL1R1 rs2228139 96545511 2 .066 C.G 2.29 .318 A
IL1R1 rs3917320 96556738 2 .068 A.C FE .238 A
IL1R1 rs2110726 96558145 2 .333 C.T 1.46 .483 A
IL1R1 rs3917332 96560387 2 .124 T.A 0.83 .659 A
IL1R2 rs4141134 96370336 2 .401 T.C 0.44 .805 A
IL1R2 rs11674595 96374804 2 .233 T.C 0.01 .998 A
IL1R2 rs7570441 96380807 2 .393 G.A 0.60 .740 A
IL1R2 HapA1 n/a 1.83 .400
IL1R2 HapA2 n/a 1.55 .460
IL1R2 HapA4 n/a 0.40 .818
IL2 rs1479923 119096993 4 .302 C.T 2.27 .322 A
IL2 rs2069776 119098582 4 .244 T.C 2.44 .295 A
IL2 rs2069772 119099739 4 .238 A.G 2.43 .297 A
IL2 rs2069777 119103043 4 .054 C.T FE 1.000 A
IL2 rs2069763 119104088 4 .287 T.G 3.95 .138 A
IL2 HapA1 n/a 1.16 .560
IL2 HapA2 n/a 2.58 .275
IL2 HapA3 n/a 2.42 .299
Cytokine Genes and Self-Reported Sleep Disturbance
PLoS ONE | www.plosone.org 4 July 2012 | Volume 7 | Issue 7 | e40560

Table 1. Cont.
Gene SNP Position Chr MAF Alleles Chi Square p-value Model
IL2 HapA5 n/a 2.27 .322
IL4 rs2243248 127200946 5 .101 T.G 2.83 .243 A
IL4 rs2243250 127201455 5 .260 C.T 1.16 .560 A
IL4 rs2070874 127202011 5 .219 C.T 0.01 .996 A
IL4 rs2227284 127205027 5 .399 C.A 0.64 .725 A
IL4 rs2227282 127205481 5 .401 C.G 0.55 .760 A
IL4 rs2243263 127205601 5 .124 G.C FE .817 A
IL4 rs2243266 127206091 5 .203 G.A 0.10 .950 A
IL4 rs2243267 127206188 5 .205 G.C 0.11 .947 A
IL4 rs2243274 127207134 5 .262 G.A 0.58 .748 A
IL4 HapA1 n/a 0.33 .847
IL4 HapA10 n/a 0.23 .891
IL6 rs4719714 22643793 7 .196 A.T 1.02 .600 A
IL6 rs2069827 22648536 7 .071 G.T 8.54 .014 A
IL6 rs1800796 22649326 7 .095 G.C 4.71 .095 A
IL6 rs1800795 22649725 7 .355 C.G 0.56 .755 A
IL6 rs2069835 22650951 7 .066 T.C FE .722 A
IL6 rs2066992 22651329 7 .091 G.T 2.97 .227 A
IL6 rs2069840 22651652 7 .308 C.G 3.49 .175 A
IL6 rs1554606 22651787 7 .405 T.G 3.38 .185 A
IL6 rs2069845 22653229 7 .405 G.A 3.38 .185 A
IL6 rs2069849 22654236 7 .039 C.T 7.68 .021 A
IL6 rs2069861 22654734 7 .083 C.T FE .790 A
IL6 rs35610689 22656903 7 .242 A.G FE .004 D
IL6 HapA4 n/a 3.43 .180
IL6 HapA6 n/a 0.80 .670
IL8 rs4073 70417508 4 .498 T.A 0.14 .932 A
IL8 rs2227306 70418539 4 .366 C.T 1.86 .394 A
IL8 rs2227543 70419394 4 .374 C.T 2.17 .337 A
IL8 HapA1 n/a 5.13 .077
IL8 HapA3 n/a 1.86 .394
IL8 HapA4 n/a 0.14 .932
IL10 rs3024505 177638230 1 .138 C.T 1.49 .476 A
IL10 rs3024498 177639855 1 .236 A.G 2.40 .302 A
IL10 rs3024496 177640190 1 .459 T.C 0.44 .802 A
IL10 rs1878672 177642039 1 .452 G.C 0.06 .969 A
IL10 rs3024492 177642438 1 .207 A.T 1.96 .375 A
IL10 rs1518111 177642971 1 .267 G.A 2.40 .302 A
IL10 rs1518110 177643187 1 .267 G.T 2.40 .302 A
IL10 rs3024491 177643372 1 .448 T.G 0.17 .919 A
IL10 HapA5 n/a 0.51 .775
IL10 HapA6 n/a 2.45 .294
IL10 HapA8 n/a 1.85 .397
IL10 HapA9 n/a 1.35 .510
IL13 rs1881457 127184713 5 .192 A.C 2.01 .366 A
IL13 rs1800925 127185113 5 .227 C.T 0.20 .903 A
IL13 rs2069743 127185579 5 .021 A.G FE .325 A
IL13 rs1295686 127188147 5 .252 G.A 0.17 .920 A
IL13 rs20541 127188268 5 .174 C.T 1.27 .530 A
Cytokine Genes and Self-Reported Sleep Disturbance
PLoS ONE | www.plosone.org 5 July 2012 | Volume 7 | Issue 7 | e40560

[53,58]. In addition to evaluating the fit indices, the best fitting
model was visually inspected by plotting observed against model-
predicted values to determine whether the predicted trajectories
followed the empiric trajectories for the classes, and to evaluate
whether the predicted plots ‘‘made sense’’ theoretically and
clinically [54].
Intercepts and linear and quadratic slopes for each class were
estimated for each model. Intercept variances were estimated for
each class and were allowed to differ across classes. Given the
Table 1. Cont.
Gene SNP Position Chr MAF Alleles Chi Square p-value Model
IL13 HapA1 n/a 0.10 .950
IL13 HapA4 n/a 1.11 .574
IL17A rs4711998 51881422 6 .293 G.A 0.58 .749 A
IL17A rs8193036 51881562 6 .255 T.C 4.32 .115 A
IL17A rs3819024 51881855 6 .374 A.G 0.63 .729 A
IL17A rs2275913 51882102 6 .345 G.A 2.01 .366 A
IL17A rs3804513 51884266 6 .027 A.T 0.62 .735 A
IL17A rs7747909 51885318 6 .225 G.A 2.49 .287 A
NFKB1 rs3774933 103645369 4 .444 T.C 0.00 .999 A
NFKB1 rs170731 103667933 4 .397 T.A 1.82 .404 A
NFKB1 rs17032779 103685279 4 .023 T.C FE 1.000 A
NFKB1 rs230510 103695201 4 .366 T.A 1.26 .533 A
NFKB1 rs230494 103706005 4 .477 A.G 0.62 .733 A
NFKB1 rs4648016 103708706 4 .017 C.T FE 1.000 A
NFKB1 rs4648018 103709236 4 .025 G.C FE .149 A
NFKB1 rs3774956 103727564 4 .479 C.T 0.52 .770 A
NFKB1 rs10489114 103730426 4 .025 A.G FE .149 A
NFKB1 rs4648068 103737343 4 .366 A.G 0.74 .692 A
NFKB1 rs4648095 103746914 4 .052 T.C FE .506 A
NFKB1 rs4648110 103752867 4 .205 T.A 2.23 .328 A
NFKB1 rs4648135 103755716 4 .060 A.G FE .120 A
NFKB1 rs4648141 103755947 4 .188 G.A 12.29 .002 A
NFKB1 rs1609798 103756488 4 .337 C.T 0.52 .773 A
NFKB1 HapA1 n/a 1.07 .586
NFKB1 HapA9 n/a 1.77 .414
NFKB2 rs12772374 104146901 10 .157 A.G 0.25 .881 A
NFKB2 rs7897947 104147701 10 .229 T.G FE .022 D
NFKB2 rs11574849 104149686 10 .085 G.A 0.76 .684 A
NFKB2 rs1056890 104152760 10 .317 C.T 0.38 .827 A
TNFA rs2857602 31533378 6 .360 T.C 2.35 .309 A
TNFA rs1800683 31540071 6 .388 G.A 0.51 .774 A
TNFA rs2239704 31540141 6 .370 G.T 1.95 .378 A
TNFA rs2229094 31540556 6 .256 T.C 0.70 .706 A
TNFA rs1041981 31540784 6 .388 C.A 0.51 .774 A
TNFA rs1799964 31542308 6 .202 T.C 3.52 .172 A
TNFA rs1800750 31542963 6 .019 G.A 0.18 .913 A
TNFA rs1800629 31543031 6 .157 G.A 2.27 .321 A
TNFA rs1800610 31543827 6 .105 C.T 2.57 .277 A
TNFA rs3093662 31544189 6 .072 A.G 1.08 .584 A
TNFA HapA1 n/a 0.74 .692
TNFA HapA5 n/a 1.77 .412
TNFA HapA8 n/a 2.68 .262
Abbreviations: A = Additive model, Chr = chromosome, D = Dominant model, Hap = haplotype, IFNG = interferon gamma, IL = interleukin, MAF – minor allelefrequency, n/a = not applicable, NFKB = nuclear factor kappa beta, R = Recessive model, SNP = single nucleotide polymorphism, TNFA = tumor necrosis factor alpha.doi:10.1371/journal.pone.0040560.t001
Cytokine Genes and Self-Reported Sleep Disturbance
PLoS ONE | www.plosone.org 6 July 2012 | Volume 7 | Issue 7 | e40560

relatively small sample size, the within-class quadratic slope
variance was fixed at zero, because the model could not be
estimated due to a non-positive definite covariance matrix.
Mixture models are known to produce solutions at local maxima,
so each model was fit with several hundred random starts to be
sure that the solution for the model with the maximum log
likelihood values was replicated [53]. Missing data for the sleep
disturbance scores were accommodated in MPlus 6.11 through the
use of Full Information Maximum Likelihood and the use of the
Expectation-Maximization algorithm. This method assumes that
any missing data are ignorable (i.e., missing at random) [59,60].
Adjustments were not made for missing data in comparisons of
the classes identified with the GMM. Therefore, the cohort for
each analysis was dependent on the largest set of available data
across groups. Differences in demographic and clinical character-
istics were considered statistically significant at the p,.05 level.
Methods of Analysis for Genomic DataGene Selection. Cytokines and their receptors are classes of
polypeptides that exercise a major influence on the inflammatory
process. These polypeptides are divided into pro- and anti-
inflammatory cytokines. Pro-inflammatory cytokines promote
systemic inflammation and include: interferon gamma 1 (IFNG1)
IFNG receptor 1 (IFNGR1), IL1R1, IL2, IL8, IL17A, nuclear
factor kappa beta (NFKB1), NFKB2, and TNFA. Anti-inflamma-
tory cytokines suppress the activity of pro-inflammatory cytokines
and include: IL1R2, IL4, IL10, and IL13. Of note, IFNG1, IL1B,
and IL6 possess pro- and anti-inflammatory functions [61].
Blood collection and genotyping. Genomic DNA was
extracted from archived buffy coats maintained by the UCSF
Genomic Markers of Symptoms Tissue Bank using the PURE-
Gene DNA Isolation System (Invitrogen, Carlsbad, CA). Of the
287 participants recruited, DNA could be recovered from the
archived buffy coats of 253 (i.e., 168 patients and 85 FCs). No
differences were found in any demographic and clinical charac-
teristics between participants who did and did not choose to
participate in the study or in those participants for whom DNA
could not be recovered from archived specimens.
Genotyping was performed blinded to clinical status and
positive and negative controls were included. DNA samples were
quantitated with a Nanodrop Spectrophotometer (ND-1000) and
normalized to a concentration of 50 ng/mL (diluted in 10 mM
Tris/1 mM EDTA). Samples were genotyped using the Gold-
Figure 1. Observed and estimated General Sleep Disturbance Scale (GSDS) trajectories for participants in each of the latent classes,as well as the mean GSDS scores for the total sample.doi:10.1371/journal.pone.0040560.g001
Table 2. Fit indices for general sleep disturbance scale gmmsolutions over seven assessments, with dyad as a clusteringvariable.
GMM LL AIC BIC Entropy VLMRc
1-Classa 26238.023 12508.047 12564.581 n/a n/a
2-Classb 26208.505 12463.011 12544.279 0.856 59.036**
3-Class 26193.223 12444.445 12546.914 0.811 30.565n.s.
*p,.05, p** ,.01, ***p,.001, n.s. = p..05.aRandom coefficients latent growth curve model with linear and quadraticcomponents; Chi2 = 108.81, 26 df, p,0.001, CFI = 0.921, RMSEA = 0.112.b2-class model was selected, based on its having the smallest BIC, the largestentropy, and a significant VLMR. Further, the VLMR is not significant for the 3-class model, and the 3-class model estimated a class with only 4% of the sample– a class size that is unlikely to be reliable.cThis value is the Chi2 statistic for the VLMR. When significant, the VLMR testprovides evidence that the K-class model fits the data better than the K-1-classmodel.Abbreviations: GMM = Growth mixture model; LL = log likelihood; AIC =Akaike Information Criteria; BIC = Bayesian Information Criterion; VLMR =Vuong-Lo-Mendell-Rubin likelihood ratio test; CFI = comparative fit index;RMSEA = root mean square error of approximation.doi:10.1371/journal.pone.0040560.t002
Cytokine Genes and Self-Reported Sleep Disturbance
PLoS ONE | www.plosone.org 7 July 2012 | Volume 7 | Issue 7 | e40560
enGate genotyping platform (Illumina, San Diego, CA) and
processed according to the standard protocol using GenomeStudio
(Illumina, San Diego, CA). Signal intensity profiles and resulting
genotype calls for each SNP were visually inspected by two blinded
reviewers. Disagreements were adjudicated by a third reviewer.
SNP Selection. A combination of tagging SNPs and literature
driven SNPs (i.e., SNPs reported as being associated with altered
function and/or symptoms) were selected for analysis. Tagging
SNPs were required to be common (defined as having a minor
allele frequency $.05) in public databases (e.g., HapMap). In
order to ensure robust genetic association analyses, quality control
filtering of SNPs was performed. SNPs with call rates of ,95% or
Hardy-Weinberg p-values of ,.001 were excluded.
As shown in Table 1, a total of 104 SNPs among the 15
candidate genes (IFNG1:6 SNPs, IFNGR1:1 SNP; IL1B: 12 SNPs;
IL1R1:5 SNPs; IL1R2:3 SNPs; IL2:5 SNPs; IL4:9 SNPs; IL6:12
SNPs; IL8:3 SNPs; IL10:8 SNPs; IL13:5 SNPs; IL17A: 6 SNPs;
NFKB1:15 SNPs; NFKB2:4 SNPs; TNFA: 10 SNPs) passed all
quality control filters and were included in the genetic association
analyses. Potential functional roles of SNPs associated with specific
symptoms were examined using PUPASuite 2.0 [62], a compre-
hensive search engine that tests a series of functional effects (i.e.,
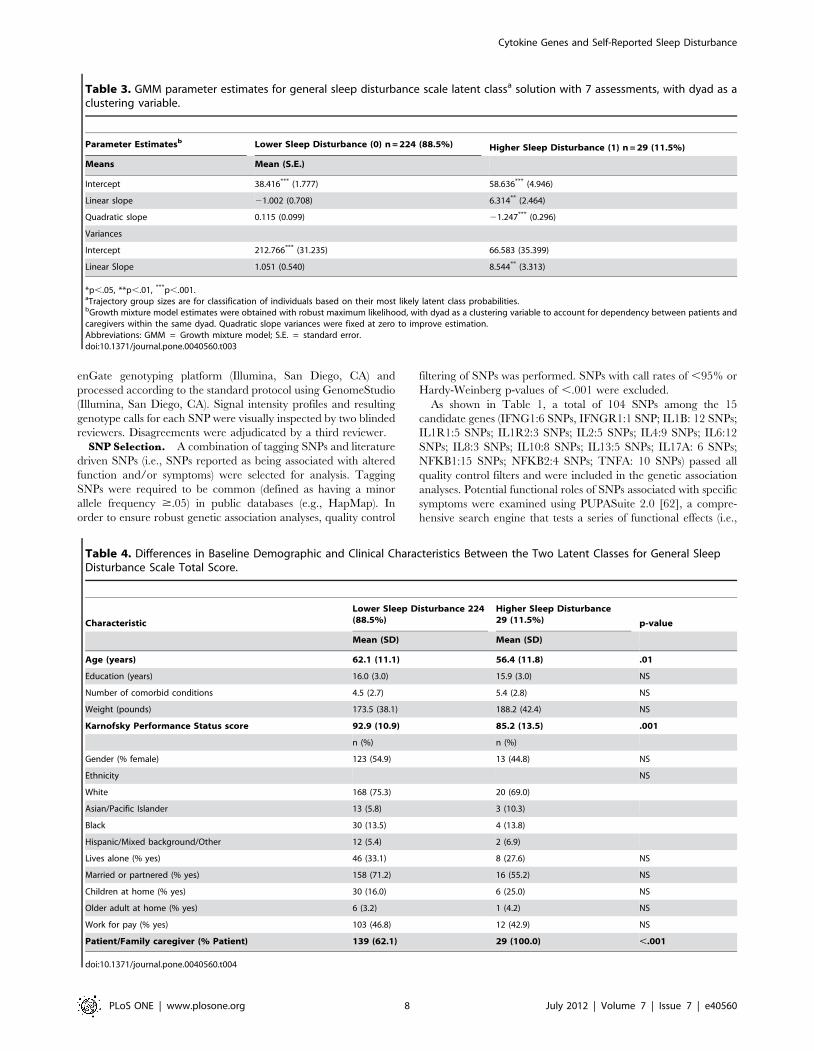
Table 3. GMM parameter estimates for general sleep disturbance scale latent classa solution with 7 assessments, with dyad as aclustering variable.
Parameter Estimatesb Lower Sleep Disturbance (0) n = 224 (88.5%) Higher Sleep Disturbance (1) n = 29 (11.5%)
Means Mean (S.E.)
Intercept 38.416*** (1.777) 58.636*** (4.946)
Linear slope 21.002 (0.708) 6.314** (2.464)
Quadratic slope 0.115 (0.099) 21.247*** (0.296)
Variances
Intercept 212.766*** (31.235) 66.583 (35.399)
Linear Slope 1.051 (0.540) 8.544** (3.313)
*p,.05, **p,.01, ***p,.001.aTrajectory group sizes are for classification of individuals based on their most likely latent class probabilities.bGrowth mixture model estimates were obtained with robust maximum likelihood, with dyad as a clustering variable to account for dependency between patients andcaregivers within the same dyad. Quadratic slope variances were fixed at zero to improve estimation.Abbreviations: GMM = Growth mixture model; S.E. = standard error.doi:10.1371/journal.pone.0040560.t003
Table 4. Differences in Baseline Demographic and Clinical Characteristics Between the Two Latent Classes for General SleepDisturbance Scale Total Score.
Characteristic
Lower Sleep Disturbance 224(88.5%)
Higher Sleep Disturbance29 (11.5%) p-value
Mean (SD) Mean (SD)
Age (years) 62.1 (11.1) 56.4 (11.8) .01
Education (years) 16.0 (3.0) 15.9 (3.0) NS
Number of comorbid conditions 4.5 (2.7) 5.4 (2.8) NS
Weight (pounds) 173.5 (38.1) 188.2 (42.4) NS
Karnofsky Performance Status score 92.9 (10.9) 85.2 (13.5) .001
n (%) n (%)
Gender (% female) 123 (54.9) 13 (44.8) NS
Ethnicity NS
White 168 (75.3) 20 (69.0)
Asian/Pacific Islander 13 (5.8) 3 (10.3)
Black 30 (13.5) 4 (13.8)
Hispanic/Mixed background/Other 12 (5.4) 2 (6.9)
Lives alone (% yes) 46 (33.1) 8 (27.6) NS
Married or partnered (% yes) 158 (71.2) 16 (55.2) NS
Children at home (% yes) 30 (16.0) 6 (25.0) NS
Older adult at home (% yes) 6 (3.2) 1 (4.2) NS
Work for pay (% yes) 103 (46.8) 12 (42.9) NS
Patient/Family caregiver (% Patient) 139 (62.1) 29 (100.0) ,.001
doi:10.1371/journal.pone.0040560.t004
Cytokine Genes and Self-Reported Sleep Disturbance
PLoS ONE | www.plosone.org 8 July 2012 | Volume 7 | Issue 7 | e40560

non-synonymous changes, altered transcription factor binding
sites, exonic splicing enhancing or silencing, splice site alterations,
microRNA target alterations).
Statistical Analyses. Allele and genotype frequencies were
determined by gene counting. Hardy-Weinberg equilibrium was
assessed by the Chi-square exact test. Measures of linkage
disequilibrium (i.e., D’ and r2) were computed from the
participants’ genotypes with Haploview 4.2. LD-based haplotype
block definition was based on the D’ confidence interval method
[63].
Table 5. Differences in Baseline Symptom Severity Scores Between the Two Latent Classes for General Sleep Disturbance ScaleTotal Score.
Characteristic
Lower Sleep Disturbance224 (88.5%)
Higher Sleep Disturbance 29(11.5%) Statistics
Mean (SD) Mean (SD)
Psychological Symptoms at Baseline
STAI-S 30.4 (10.9) 35.1 (9.2) .029
STAI-T 33.5 (9.9) 38.3 (9.0) .014
CES-D Total 8.0 (7.9) 14.9 (7.7) ,.001
Pittsburgh Sleep Quality Index (PSQI) Scores at Baseline
Subjective sleep quality 0.9 (0.7) 1.4 (0.7) ,.001
Sleep latency 0.9 (0.9) 1.4 (1.0) .008
Sleep duration 0.9 (0.9) 1.4 (1.0) .003
Habitual sleep efficiency 0.7 (1.0) 0.9 (1.0) NS
Sleep disturbance 1.3 (0.5) 1.8 (0.6) ,.001
Use of sleeping medication 0.6 (1.1) 0.9 (1.3) NS
Daytime dysfunction 0.7 (0.6) 1.2 (0.7) ,.001
PSQI Global score 5.9 (3.5) 8.9 (3.4) ,.001
General Sleep Disturbance Scale Scores at Baseline
Quality 2.3 (1.7) 3.8 (1.9) ,.001
Sleep onset latency 1.4 (2.0) 2.3 (2.0) .025
Quantity 4.3 (1.3) 5.1 (1.2) .001
Sleep medication 0.3 (0.6) 0.4 (0.6) NS
Mid-sleep awakenings 4.3 (2.6) 5.7 (1.9) .001
Early awakenings 2.1 (2.2) 3.7 (2.2) ,.001
Excessive daytime sleepiness 1.7 (1.3) 2.7 (1.3) ,.001
Total GSDS score 36.7 (17.7) 55.0 (17.8) ,.001
Actigraphy Parameters at Baseline
Sleep period time (minutes) 485.5 (75.2) 476.2 (72.1) NS
Total sleep time (minutes) 403.2 (79.6) 372.8 (106.5) NS
Sleep efficiency 83.1 (11.9) 77.7 (18.4) .037
Wake after sleep onset (% of TST) 13.3 (11.1) 18.4 (17.4) .037
Wake number 16.9 (8.8) 15.5 (8.9) NS
Wake duration (minutes) 3.7 (2.4) 7.2 (12.0) NS
Sleep onset latency (minutes) 13.6 (11.9) 23.7 (42.1) NS
% Daytime sleep 6.6 (10.8) 10.3 (20.0) NS
Fatigue and Energy Scores at Baseline
Evening fatigue 4.1 (2.1) 5.5 (1.3) ,.001
Morning fatigue 2.1 (1.9) 3.8 (1.8) ,.001
Evening energy 4.5 (1.8) 3.9 (1.8) NS
Morning energy 6.0 (2.0) 4.8 (1.8) .003
Attentional fatigue 7.3 (1.7) 6.3 (2.0) .005
n (%) n (%)
Pain (% yes) 93 (41.5) 28 (96.6) ,.001
Abbreviations: STAI-S = Spielberger State-Trait Anxiety Inventory – State subscale; STAI-T = Spielberger State-Trait Anxiety Inventory – Trait subscale; CES-D = Centerfor Epidemiological Studies – Depression scale; GSDS = General Sleep Disturbance Scale; TST = Total sleep time.doi:10.1371/journal.pone.0040560.t005
Cytokine Genes and Self-Reported Sleep Disturbance
PLoS ONE | www.plosone.org 9 July 2012 | Volume 7 | Issue 7 | e40560
For SNPs that were members of the same haploblock, haplotype
analyses were conducted in order to localize the association signal
within each gene and to determine if haplotypes improved the
strength of the association with the phenotype. Haplotypes were
constructed using the program PHASE version 2.1 [64]. In order
to improve the stability of haplotype inference, the haplotype
construction procedure was repeated five times using different seed
numbers with each cycle. Only haplotypes that were inferred with
probability estimates of $85 across the five iterations were
retained for downstream analyses. Only inferred haplotypes that
occurred with a frequency estimate of $15% were included in the
association analyses, assuming a dosage model (i.e., analogous to
the additive model).
For association tests, three genetic models were assessed for each
SNP: additive, dominant, and recessive. Barring trivial improve-
ments (i.e., delta ,10%), the genetic model that best fit the data,
by maximizing the significance of the p-value was selected for each
SNP. Logistic regression analysis that controlled for significant
covariates, as well as race/ethnicity, was used to evaluate the
association between genotype and pain group membership. Only
those genetic associations identified as significant from the
univariate analyses were evaluated in the multivariate analyses.
A backwards stepwise approach was used to create the most
parsimonious model. Except for race/ethnicity, only predictors
with a p-value of ,0.05 were retained in the final model. Genetic
model fit and both unadjusted and covariate-adjusted odds ratios
were estimated using the STATA software package, version 9.
Based on the recommendations of Rothman [65], adjustments
were not made for multiple testing. However, rigorous controls
were imposed on the analysis of the SNPs with p-values of ,.05.
As described above, each of these SNPs was evaluated using
logistic regression analyses that controlled for differences in
phenotypic characteristics, as well as potential confounding due
to population stratification. Only those SNPs that remained
significant were included in the final presentation of the results. In
addition, the actual number of independent tests is more
appropriately considered in relationship to the total number of
cytokine genes evaluated (n = 15), because the majority of the
SNPs within each gene locus were in linkage disequilibrium.
Therefore, the finding of two significant associations is unlikely to
be due solely to chance. Findings are reported for all of the SNPs
that were evaluated to have these data available in the literature
for subsequent comparisons.
Ancestry informative markers (AIMs) can be used as a tool to
minimize confounding due to population stratification in case-
control association studies [66–68]. Homogeneity in ancestry
among participants was verified by principal component analysis
(PCA) [69], using HelixTree (GoldenHelix, Bozeman, MT).
Briefly, the number of principal components (PCs) was sought
that distinguished the major racial/ethnic groups in the sample by
visual inspection of scatter plots of orthogonal PCs (i.e., PC 1
versus PC2, PC2 versus PC3). This procedure was repeated until
no discernible clustering of participants by their self-reported race/
ethnicity was possible (data not shown). The first three PCs were
selected to adjust for potential confounding due to population
substructure (i.e., race/ethnicity) by including them in all logistic
regression models (described in the preceding paragraph). One
hundred and six ancestry informative markers were included in
the analysis.
Results
Participant CharacteristicsThe majority of the participants were Caucasian (74.7%), well
educated (15.9 (63.0) years), and married/partnered (69.3%). The
mean age of the total sample was 61.5 (611.3) years. The average
participant had over four comorbid conditions (4.6 (62.7) and a
mean KPS score of 92.0 (611.5). Gender was evenly represented
within the total sample with 46.2% male and 53.8% female
participants. Patients made up 66.4% of the total sample.
Approximately 38% of the patients had breast cancer, 49% had
prostate cancer, 7% had brain cancer, and 6% had lung cancer.
The majority of the FCs (91%) was the patients’ spouses.
No significant differences were found between patients and FCs
in age (60.9 (611.6) years versus 62.5 (610.5) years), KPS score
(91.1 (611.9) versus 93.7 (610.6)), and number of comorbidities
(4.8 (62.6) versus 4.2 (62.9)). In addition, at the time of
enrollment, no significant differences were found between patients
and FCs in their ratings of worst pain (2.0 (63.2) versus 1.5
(63.1)), fatigue (4.2 (62.0) versus 4.5 (62.0)), sleep disturbance
(38.9 (619.6) versus 38.7 (616.7)), and depression (9.1 (68.7)
versus 8.3 (67.2)).
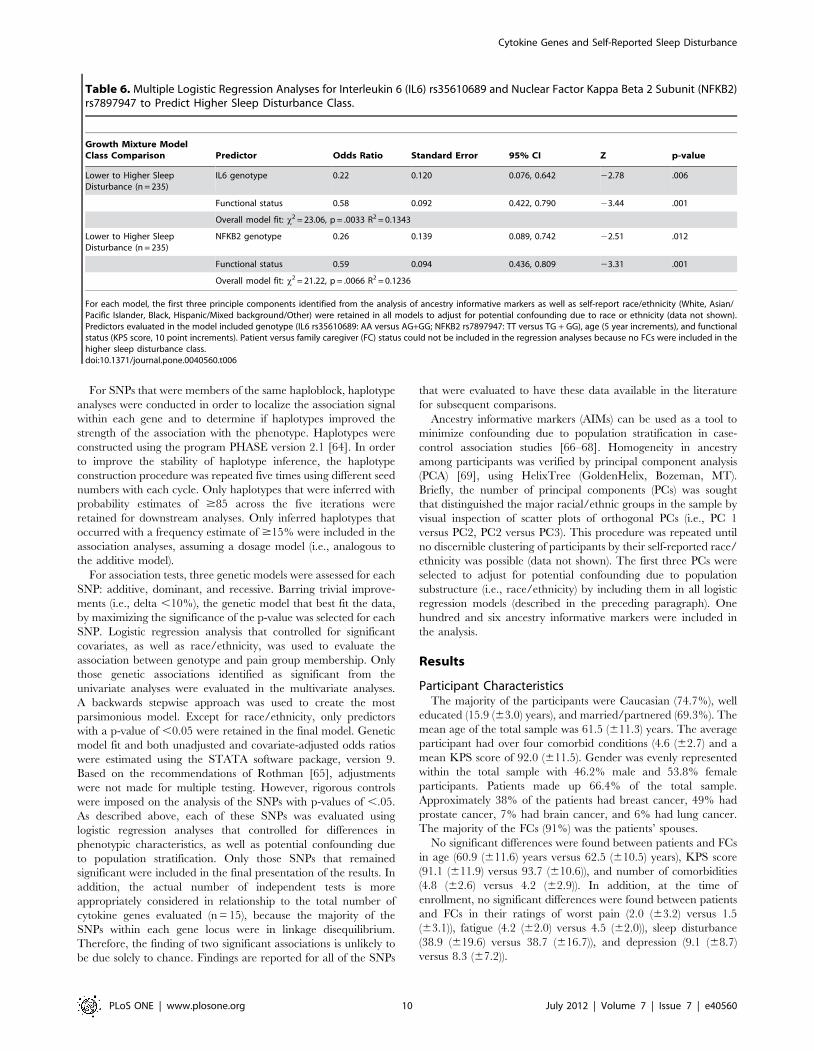
Table 6. Multiple Logistic Regression Analyses for Interleukin 6 (IL6) rs35610689 and Nuclear Factor Kappa Beta 2 Subunit (NFKB2)rs7897947 to Predict Higher Sleep Disturbance Class.
Growth Mixture ModelClass Comparison Predictor Odds Ratio Standard Error 95% CI Z p-value
Lower to Higher SleepDisturbance (n = 235)
IL6 genotype 0.22 0.120 0.076, 0.642 22.78 .006
Functional status 0.58 0.092 0.422, 0.790 23.44 .001
Overall model fit: x2 = 23.06, p = .0033 R2 = 0.1343
Lower to Higher SleepDisturbance (n = 235)
NFKB2 genotype 0.26 0.139 0.089, 0.742 22.51 .012
Functional status 0.59 0.094 0.436, 0.809 23.31 .001
Overall model fit: x2 = 21.22, p = .0066 R2 = 0.1236
For each model, the first three principle components identified from the analysis of ancestry informative markers as well as self-report race/ethnicity (White, Asian/Pacific Islander, Black, Hispanic/Mixed background/Other) were retained in all models to adjust for potential confounding due to race or ethnicity (data not shown).Predictors evaluated in the model included genotype (IL6 rs35610689: AA versus AG+GG; NFKB2 rs7897947: TT versus TG + GG), age (5 year increments), and functionalstatus (KPS score, 10 point increments). Patient versus family caregiver (FC) status could not be included in the regression analyses because no FCs were included in thehigher sleep disturbance class.doi:10.1371/journal.pone.0040560.t006
Cytokine Genes and Self-Reported Sleep Disturbance
PLoS ONE | www.plosone.org 10 July 2012 | Volume 7 | Issue 7 | e40560

Results of GMM AnalysisTwo distinct latent classes of GSDS trajectories were identified
using GMM (Figure 1). The fit indices for the various models are
shown in Table 2. A two-class model was selected because its BIC
was smaller than the one-class and three-class models. In addition,
each class in the two-class model had a reasonable size and
interpretability [55].
The parameter estimates for the two latent classes are listed in
Table 3. The largest percentage of participants was classified into
the lower sleep disturbance class (88.5%). These participants had
GSDS scores of 38.4 at enrollment, with a stable trajectory over
the course of the study. Participants in the higher sleep disturbance
class (11.5%) had a mean GSDS score of 58.6 that increased and
then decreased slightly over the course of the study. The terms
‘‘lower’’ and ‘‘higher’’ are used to describe these two latent classes
because the mean GSDS scores across the six months of the study
for participants in the lower class approached the clinically
meaningful cutoff of $43.
Examination of Possible Patient/FC Status Effects andDyadic Effects
No significant differences were found in patients’ (38.9 (619.6))
and FCs’ (38.7 (616.7), p = .904) mean GSDS scores at
enrollment. However, a significantly higher percentage of partic-
ipants in the higher sleep disturbance class were patients (100%)
than in the lower sleep disturbance class (62.1%, p,.001; Table 4).
After taking patient and FC dependency within dyads into account
in the GMM analyses, significant differences in linear and
quadratic slopes (both p,.001) were found between patients and
FCs for the two-class GMM solution. However, this difference was
due entirely to the strong positive trajectory for the smaller class.
Figure 2. Panel A illustrates differences between the latent classes in the percentages of participants who were homozygous for thecommon allele (AA) or heterozygous or homozygous for the minor allele (AG+GG) for rs35610689 in interleukin 6 (IL6). Panel Billustrates differences between the latent classes in the percentages of participants who were homozygous for the common allele (TT) orheterozygous or homozygous for the minor allele (TG+GG) for rs7897947 in nuclear factor kappa beta 2 (NFKB2).doi:10.1371/journal.pone.0040560.g002
Cytokine Genes and Self-Reported Sleep Disturbance
PLoS ONE | www.plosone.org 11 July 2012 | Volume 7 | Issue 7 | e40560

No differences were found in linear and quadratic slopes between
patients and FCs within the larger class. Intercepts did not differ
between patients and FCs.
Differences in Demographic and Clinical CharacteristicsAs summarized in Table 4, no differences were found between
the two latent classes in gender, ethnicity, education, employment
status, living arrangements, having children living at home, having
an older adult at home, number of comorbid conditions, and
weight. However, participants in the higher sleep disturbance class
were more likely to be younger (p = .01) and have a lower KPS
score (p = .001).
Differences in Symptom CharacteristicsAs summarized in Table 5, significant differences were found
between the two latent classes in the majority of the symptoms
assessed prior to the initiation of RT. For those symptom scores
with significant between group differences, participants in the
higher sleep disturbance class reported higher symptom severity
scores than participants in the lower sleep disturbance class.
Candidate Gene Analyses of the Two GMM ClassesAs summarized in Table 1, the minor allele frequency was
significantly different between the two latent classes for five SNPs:
IL6 rs2069827, IL6 rs2069849, IL6 rs35610689, NFKB1
rs4648141, and NFKB2 rs7897947. For IL6 rs2069827
(p = .014) and IL6 rs2069849 (p = .021), an additive model fit
the data best. For IL6 rs35610689 (p = .004), a dominant model fit
the data best. For NFKB1 rs4648141 (p = .002), an additive model
fit the data best. For NFKB2 rs7897947 (p = .022), a dominant
model fit the data best. No significant differences were found
between the latent classes for any of the haplotypes analyzed.
Regression Analyses of Candidate Genes and GMMLatent Classes
In order to better estimate the magnitude (i.e., odds ratio, OR)
and precision (95% confidence interval, CI) of genotype on sleep
disturbance class membership (i.e., lower sleep disturbance, higher
sleep disturbance), multivariable logistic regression analyses were
performed that included the following variables in the models:
genotype, age, functional status, and ethnicity (i.e., White, Black,
Asian/Pacific Islander, Hispanic/Mixed ethnic background/oth-
er); and three PCs to control for genetic background. Given the
fact that FCs were not represented in the higher sleep disturbance
class, this variable could not be evaluated in the regression
analyses.
The only genetic associations that remained significant in the
multivariable logistic regression analyses were for IL6 rs35610689
(Table 6, Figure 2A) and NFKB2 rs7897947 (Table 6, Figure 2B).
In the regression analysis for IL6 rs35610689, after controlling for
race/ethnicity, genotype and functional status were the only
variables retained in the final model (p = .0033). The overall model
explained 13.4% of the variance in GMM latent class member-
ship. Controlling for functional status and race/ethnicity, carrying
one or two doses of the minor allele (i.e., AG+GG) was associated
with a 78% decrease in the odds of belonging to the higher sleep
disturbance class (p = .006). Genotype uniquely explained 5.53%
of the variance in GMM latent class membership.
In the regression analysis for NFKB2 rs7898947, after
controlling for race/ethnicity, genotype and functional status were
the only variables retained in the final model (p = .0066). The
overall model explained 12.4% of the variance in GMM latent
class membership. Controlling for functional status and race/
ethnicity, carrying one or two doses of the minor allele (i.e.,
TG+GG) was associated with a 74% decrease in the odds of
belonging to the higher sleep disturbance class (p = .012).
Genotype uniquely explained 4.46% of the variance in GMM
latent class membership.
Discussion
This study is the first to identify distinct subgroups of oncology
patients and FCs based on changes in self-reported sleep
disturbance and to evaluate associations between these subgroups
and cytokine gene variations. While no differences in total GSDS
scores, prior to the initiation of RT, were found between patients
and FCs, the higher class was composed only of patients. In
addition, these individuals were significantly younger and reported
a lower functional status that was not only statistically significant
but clinically meaningful (effect size, d = 0.67) [70,71]. Of the 29
patients in the higher class, 44.8% had prostate cancer and 37.9%
had breast cancer.
Compared to the lower class, the mean total GSDS score of the
higher sleep disturbance class at enrollment represents not only a
statistically significant, but a clinically meaningful difference in
sleep disturbance score (d = 20.98). Not surprisingly, participants
in the higher class reported significantly higher scores on all of the
PSQI and GSDS subscales, except for use of sleep medications.
While specific studies on sleep medication use in oncology patients
and FCs were not identified, previous cross-sectional studies that
used either the PSQI or GSDS to evaluate sleep disturbance in
oncology patients [26,35,50,72–74] and their FCs [75] found
similar subscale and total scores, as well as the lack of use of sleep
medications. Reasons for the low rates of sleep medication use
may relate to under assessment or under-reporting of sleep
disturbance in both oncology patients and their FCs. Alternatively,
patients and FCs may choose not to take sleep medications
because of concerns about physical dependence or side effects.
An interesting finding related to the sleep disturbance pheno-
type identified in this study was that, except for sleep efficiency and
wake after sleep onset, no between class differences were found in
any of the objective sleep parameters. On average, participants in
both classes slept approximately 6 to 6.5 hours per night. While
significantly different, both classes of participants had sleep
efficiency scores below the desired 95% that characterizes a good
night’s sleep. In fact, an examination of both the subjective scores
and objective parameters suggest that both classes of participants
had significant amounts of sleep disturbance. For example,
participants in the lower class reported problems with sleep
quantity and mid-sleep awakenings on more than three days per
week. An average of 15 to 16 awakenings per night identified using
actigraphy provides additional evidence that all of these partici-
pants had problems with sleep maintenance.
Consistent with previous reports [50,51], participants in the
higher class reported higher levels of morning and evening fatigue,
lower levels of morning energy, and worse attentional fatigue at
the time of enrollment into the study. In addition, almost all of the
participants in the higher class reported the occurrence of pain,
while less than half of the participants in the lower class reported
pain. Finally, higher depression and anxiety scores were reported
by participants in the higher class. Taken together, these findings
suggest that participants with higher levels of sleep disturbance
need to be assessed for the presence of other concurrent
symptoms. Future studies are warranted that evaluate for changes
in the relationships among these symptoms over time. These types
of studies may identify the primary symptom that drives the
severity of the other symptoms and may suggest an underlying
Cytokine Genes and Self-Reported Sleep Disturbance
PLoS ONE | www.plosone.org 12 July 2012 | Volume 7 | Issue 7 | e40560

mechanism for one or more symptoms as well as more targeted
interventions.
While initial univariate analyses found between class differences
in a number of SNPs for IL6, NFKB1, and NFKB2, after
controlling for significant covariates and race/ethnicity, only two
SNPs explained a significant amount of the variance in latent class
membership. For both NFKB2 (rs7897947) and IL6 (rs35610689),
carriers of one or two doses of the minor allele was associated with
a decrease in the odds (i.e., 74%, 78%, respectively) of belonging
to the higher sleep disturbance class. Each SNP explained a
significant amount of the variance in GMM latent class
membership (i.e., 5.5% and 4.5%, respectively). Both of these
SNPs are located in introns. While the function of these
polymorphisms is unknown, they may be surrogates for unmea-
sured functional polymorphisms that are in linkage disequilibrium
with these SNPs.
NFKB is a generic name for an evolutionarily conserved
transcription factor system that contributes to the effective
mounting of an immune response as well as to the regulation of
cell proliferation, development, and apoptosis. The NFKB system
appears to be activated in stressful situations and in response to
tissue damage [76]. In addition, NFKB is involved in the
regulation of chemokine and cytokine genes. For example, work
by Libermann and Baltimore [77] determined through in vitro
studies that NFKB is an important mediator for the activation of
the IL6 gene by a variety of IL6 inducers.
While no studies were found that demonstrated an association
between NFKB and sleep disturbance, three studies have
identified associations between IL6 and sleep disturbance
[21,22,78]. In a study that compared patients with chronic low
back pain to age- and sex-matched controls [78], poorer sleep
quality was associated with higher levels of IL6 in the patients with
chronic low back pain. In another study [21], a synonymous SNP
within the IL6 coding region (rs2069849) was protective against
obstructive sleep apnea in a sample of African Americans and
produced qualitatively similar, albeit nonsignificant findings in a
replication cohort of European-Americans due to a relatively low
minor allele frequency. Interestingly, this same SNP (IL6
rs2069849, p = .014) was significant in the univariate analyses in
our GMM study that consisted primarily of Caucasian partici-
pants. Additional research is warranted to evaluate the relation-
ship between this SNP (IL6 rs2069849) and a variety of sleep
disturbances and sleep disorders.
It is interesting to note that the SNP in IL6 (rs4719714), which
was not significant in this study, was associated with higher levels
of sleep disturbance in this same sample of patients and FCs at the
time of the patients’ initiation of RT [22]. This finding suggests
that the methods used to characterize the sleep disturbance
phenotype influence the outcomes of candidate gene studies. The
functional significance of the NFKB2 (rs7897947) and IL6
(rs35610689) SNPs that were associated with a decreased odds
of belonging to the higher sleep disturbance class remain to be
determined. Given the relatively small sample size, neither
cumulative nor interaction effects between these two SNPs were
evaluated. Future studies are warranted to replicate these findings
and to evaluate for gene x gene as well as gene x environment
interactions.
Several study limitations need to be acknowledged. While the
sample size for the GMM analysis was adequate [56,57], larger
samples may identify additional latent classes. In addition, findings
from this study must be interpreted with caution until they are
replicated in future studies. Ideally future studies should be done
with sample sizes that are large enough to allow for confirmatory
analyses of both the number and trajectories of the latent classes,
as well as the phenotypic and genotypic characteristics that are
unique to each class. In terms of the genetic analyses, additional
studies with larger samples are needed to confirm the associations
found in this study. Future studies can evaluate additional cytokine
SNPs as well as serum levels of these cytokines to obtain more
information on the functional significance of these genetic
variations. In addition, future studies can examine the associations
between different sleep disturbance phenotypes or endopheno-
types (e.g., daytime sleepiness, total sleep time), using both
subjective and objective measures, and pro- and anti-inflammatory
cytokine genes.
Despite these limitations, findings from this study provide
preliminary evidence for distinct sleep disturbance phenotypes in
oncology patients and their FCs. Because the higher risk
phenotype was associated with higher levels of depression and
anxiety, as well as higher levels of physical and attentional fatigue,
clinicians need to assess for multiple co-occurring symptoms in
both oncology patients and their FCs. Finally, the candidate gene
associations found in this study suggest a role for inflammation in
the development of persistent levels of sleep disturbance.
Author Contributions
Conceived and designed the experiments: CM BAC AD LBD DJL JKC
CRB JDM MD KL CW SMP BEA. Performed the experiments: CM BAC
AD LBD DJL JKC CRB JDM MD KL CW SMP BEA. Analyzed the
data: CM BAC AD LBD DJL JKC CRB JDM MD KL CW SMP BEA.
Wrote the paper: CM BAC AD LBD DJL JKC CRB JDM MD KL CW
SMP BEA.
References
1. Berger AM (2009) Update on the state of the science: sleep-wake disturbances in
adult patients with cancer. Oncol Nurs Forum 36: E165–177.
2. Berger AM, Parker KP, Young-McCaughan S, Mallory GA, Barsevick AM, et
al. (2005) Sleep wake disturbances in people with cancer and their caregivers:
state of the science. Oncol Nurs Forum 32: E98–126.
3. Aouizerat BE, Dodd M, Lee K, West C, Paul SM, et al. (2009) Preliminary
evidence of a genetic association between tumor necrosis factor alpha and the
severity of sleep disturbance and morning fatigue. Biol Res Nurs 11: 27–41.
4. Fletcher BS, Paul SM, Dodd MJ, Schumacher K, West C, et al. (2008)
Prevalence, severity, and impact of symptoms on female family caregivers of
patients at the initiation of radiation therapy for prostate cancer. J Clin Oncol
26: 599–605.
5. Gibbins J, McCoubrie R, Kendrick AH, Senior-Smith G, Davies AN, et al.
(2009) Sleep- wake disturbances in patients with advanced cancer and their
family carers. J Pain Symptom Manage 38: 860–870.
6. Hearson B, McClement S (2007) Sleep disturbance in family caregivers of
patients with advanced cancer. Int J Palliat Nurs 13: 495–501.
7. Savard J, Villa J, Ivers H, Simard S, Morin CM (2009) Prevalence, natural
course, and risk factors of insomnia comorbid with cancer over a 2-month
period. J Clin Oncol. 27: 5233–5239.
8. Miaskowski C, Lee K, Dunn L, Dodd M, Aouizerat BE, et al. (2011) Sleep-wake
circadian activity rhythm parameters and fatigue in oncology patients before the
initiation of radiation therapy. Cancer Nurs 34: 255–268.
9. Carney S, Koetters T, Cho M, West C, Paul SM, et al.(2011) Differences in
sleep disturbance parameters between oncology outpatients and their family
caregivers. J Clin Oncol 29: 1001–1006.
10. Davidson JR, MacLean AW, Brundage MD, Schulze K (2002) Sleep
disturbance in cancer patients. Soc Sci Med 54: 1309–1321.
11. Dhruva A, Lee K, Paul SM, West C, Dunn L, et al. (2012) Sleep-wake circadian
activity rhythms and fatigue in family caregivers of oncology patients. Cancer
Nurs 35: 70–81.
12. Foley KA, Sarsour K, Kalsekar A, Walsh JK (2010) Subtypes of sleep
disturbance: associations among symptoms, comorbidities, treatment, and
medical costs. Behav Sleep Med 8: 90–104.
13. Hublin C, Partinen M, Koskenvuo M, Kaprio J (2011) Heritability and mortality
risk of insomnia-related symptoms: a genetic epidemiologic study in a
population-based twin cohort. Sleep 34: 957–964.
14. Imeri L, Opp MR (2009) How (and why) the immune system makes us sleep.
Nat Rev Neurosci 10: 199–210.
Cytokine Genes and Self-Reported Sleep Disturbance
PLoS ONE | www.plosone.org 13 July 2012 | Volume 7 | Issue 7 | e40560

15. Maurovich-Horvat E, Pollmacher TZ, Sonka K (2008) The effects of sleep and
sleep deprivation on metabolic, endocrine and immune parameters. Prague MedRep 109: 275–285.
16. Pollmacher T, Haack M, Schuld A, Reichenberg A, Yirmiya R (2002) Low
levels of circulating inflammatory cytokines–do they affect human brainfunctions? Brain Behav Immun 16: 525–532.
17. Mullington JM, Simpson NS, Meier-Ewert HK, Haack M (2010) Sleep loss andinflammation. Best Pract Res Clin Endocrinol Metab 24: 775–784.
18. Lange T, Dimitrov S, Born J (2010) Effects of sleep and circadian rhythm on the
human immune system. Ann N Y Acad Sci 1193: 48–59.19. Cirelli C (2009) The genetic and molecular regulation of sleep: from fruit flies to
humans. Nat Rev Neurosci 10: 549–560.20. Sehgal A, Mignot E (2011) Genetics of sleep and sleep disorders. Cell 146: 194–207.
21. Larkin EK, Patel SR, Zhu X, Tracy RP, Jenny NS, et al. (2010) Study of therelationship between the interleukin-6 gene and obstructive sleep apnea. Clin
Transl Sci 3: 337–339.
22. Miaskowski C, Dodd M, Lee K, West C, Paul SM, et al. (2010) Preliminaryevidence of an association between a functional interleukin-6 polymorphism and
fatigue and sleep disturbance in oncology patients and their family caregivers.J Pain Symptom Manage 40: 531–544.
23. Dunn LB, Aouizerat BE, Cooper BA, Dodd M, Lee K, et al. (2012) Trajectories
of anxiety in oncology patients and family caregivers during and after radiationtherapy. Eur J Oncol Nurs 16: 1–9.
24. Buysse DJ, Reynolds CF, 3rd, Monk TH, Berman SR, Kupfer DJ (1989) ThePittsburgh Sleep Quality Index: a new instrument for psychiatric practice and
research. Psychiatry Res 28: 193–213.25. Beck SL, Schwartz AL, Towsley G, Dudley W, Barsevick A (2004) Psychometric
evaluation of the Pittsburgh Sleep Quality Index in cancer patients. J Pain
Symptom Manage 27: 140–148.26. Carpenter JS, Andrykowski MA (1998) Psychometric evaluation of the
Pittsburgh Sleep Quality Index. J Psychosom Res 45: 5–13.27. Garrett K, Dhruva A, Koetters T, West C, Paul SM, et al. (2011) Differences in
sleep disturbance and fatigue between patients with breast and prostate cancer at
the initiation of radiation therapy. J Pain Symptom Manage 42: 239–250.28. Lee KA (1992) Self-reported sleep disturbances in employed women. Sleep15:
493–498.29. Lee KA, DeJoseph JF (1992) Sleep disturbances, vitality, and fatigue among a
select group of employed childbearing women. Birth 19: 208–213.30. Miaskowski C, Lee KA (1999) Pain, fatigue, and sleep disturbances in oncology
outpatients receiving radiation therapy for bone metastasis: a pilot study. J Pain
Symptom Manage 17: 320–332.31. Lee KA, Hicks G, Nino-Murcia G (1991) Validity and reliability of a scale to
assess fatigue. Psychiatry Res 36: 291–298.32. Gay CL, Lee KA, Lee SY (2004). Sleep patterns and fatigue in new mothers and
fathers. Biol Res Nurs 5: 311–318.
33. Lee KA, Portillo CJ, Miramontes H (1999) The fatigue experience for women withhuman immunodeficiency virus. J Obstet Gynecol Neonatal Nurs 28: 193–200.
34. Miaskowski C, Paul SM, Cooper BA, Lee K, Dodd M, et al. (2008) Trajectoriesof fatigue in men with prostate cancer before, during, and after radiation
therapy. J Pain Symptom Manage 35: 632–643.35. Miaskowski C, Cooper BA, Paul SM, Dodd M, Lee K, et al. (2006) Subgroups of
patients with cancer with different symptom experiences and quality-of-life
outcomes: a cluster analysis. Oncol Nurs Forum 33: E79–89.36. Radloff LS (1977) The CES-D Scale: A self-report depression scale for research
in the general population. Applied Psychological Measurement 1: 385–401.37. Sheehan TJ, Fifield J, Reisine S, Tennen H (1995) The measurement structure of
the Center for Epidemiologic Studies Depression Scale. J Pers Assess 64: 507–521.
38. Carpenter JS, Andrykowski MA, Wilson J, Hall LA, Rayens MK, et al. (1998)Psychometrics for two short forms of the Center for Epidemiologic Studies-
Depression Scale. Issues Ment Health Nurs 19: 481–494.39. Kennedy BL, Schwab JJ, Morris RL, Beldia G (2001) Assessment of state and
trait anxiety in subjects with anxiety and depressive disorders. Psychiatr Q 72:
263–276.40. Bieling PJ, Antony MM, Swinson RP (1998) The State-Trait Anxiety Inventory,
Trait version: structure and content re-examined. Behav Res Ther 36: 777–788.41. Spielberger CG, Gorsuch RL, Suchene R, Vagg PR, Jacobs GA. Manual for the
State- Anxiety (Form Y): Self Evaluation Questionnaire. Palo Alto, CA:Consulting Psychologists Press; 1983.
42. Cimprich B, Visovatti M, Ronis DL (2011) The Attentional Function Index–a
self-report cognitive measure. Psychooncology 20: 194–202.43. Cimprich B (1992) Attentional fatigue following breast cancer surgery. (1992)
Res Nurs Health 15: 199–207.44. Cimprich B, So H, Ronis DL, Trask C (2005) Pre-treatment factors related to
cognitive functioning in women newly diagnosed with breast cancer.
Psychooncology 14: 70–78.45. Daut RL, Cleeland CS, Flanery RC (1983) Development of the Wisconsin Brief
Pain Questionnaire to assess pain in cancer and other diseases. Pain 17: 197–210.
46. Berger AM, Wielgus KK, Young-McCaughan S, Fischer P, Farr L, et al. (2008)Methodological challenges when using actigraphy in research. J Pain Symptom
Manage 36: 191–199.
47. Morgenthaler T, Alessi C, Friedman L, Owens J, Kapur V, et al. (2007) Practiceparameters for the use of actigraphy in the assessment of sleep and sleep
disorders: an update for 2007. Sleep 30: 519–529.
48. Ancoli-Israel S, Cole R, Alessi C, Chambers M, Moorcroft W, et al. (2003) The
role of actigraphy in the study of sleep and circadian rhythms. Sleep 26: 342–
392.
49. Buysse DJ, Ancoli-Israel S, Edinger JD, Lichstein KL, Morin CM (2006)
Recommendations for a standard research assessment of insomnia. Sleep 29:
1155–1173.
50. Berger AM, Farr LA, Kuhn BR, Fischer P, Agrawal S (2007) Values of sleep/
wake, activity/rest, circadian rhythms, and fatigue prior to adjuvant breast
cancer chemotherapy. J Pain Symptom Manage 33: 398–409.
51. Berger AM, Wielgus K, Hertzog M, Fischer P, Farr L (2009) Patterns of
circadian activity rhythms and their relationships with fatigue and anxiety/
depression in women treated with breast cancer adjuvant chemotherapy.
Support Care Cancer.
52. SPSS. IBM SPSS for Windows (Version 19) (2010) Chicago, Illinois: SPSS, Inc.
53. Muthen LK, Muthen BO (1998–2010) Mplus User’s Guide (6th ed.). Los
Angeles, CA: Muthen & Muthen.
54. Muthen BO, Kaplan DW (2004) Latent variable analysis: Growth mixture
modeling and related techniques for longitudinal data. In: Kaplan D, editor. The
Sage Handbook of Quantitative Methodology for the Social Sciences. Newbury
Park, CA: Sage Publications. p. 345–368.
55. Jung T, Wickrama KAS (2008). An introduction to latent class growth analysis
and growth mixture modeling. Social and Personality Psychology Compass. 2:
302–317.
56. Nylund KL, Asparouhov T, Muthen BO (2007) Deciding on the number of
classes in latent class analysis and growth mixture modeling: A Monte Carlo
simulation study. Struct Equ Modeling 14: 535–569.
57. Tofighi D, Enders CK (2008). Identifying the correct number of classes in
growth mixture models. Charlotte, NC: Information Age Publishing.
58. Celeux G, Soromenho G (1996) An entropy criterion for assessing the number of
clusters in a mixture model. Journal of Classification 13: 195–212.
59. Muthen BO (2002) Beyond SEM: General latent variable modeling. Behavior-
metrika 29: 81–117.
60. Schafer JL, Graham JW (2002) Missing data: our view of the state of the art.
Psychol Methods 7: 147–77.
61. Seruga B, Zhang H, Bernstein LJ, Tannock IF (2008) Cytokines and their
relationship to the symptoms and outcome of cancer. Nat Rev Cancer 8: 887–
899.
62. Conde L, Vaquerizas JM, Dopazo H, Arbiza L, Reumers J, et al. (2006)
PupaSuite: finding functional single nucleotide polymorphisms for large-scale
genotyping purposes. Nucleic Acids Res 34: W621–625.
63. Gabriel SB, Schaffner SF, Nguyen H, Moore JM, Roy J, et al. (2002) The
structure of haplotype blocks in the human genome. Science 296: 2225–2229.
64. Stephens M, Smith NJ, Donnelly P (2001) A new statistical method for haplotype
reconstruction from population data. Am J Hum Genet 68: 978–989.
65. Rothman KJ (1990) No adjustments are needed for multiple comparisons.
Epidemiology. 1: 43–46.
66. Hoggart CJ, Parra EJ, Shriver MD, Bonilla C, Kittles RA, et al. (2003) Control
of confounding of genetic associations in stratified populations. Am J Hum
Genet 72: 1492–1504.
67. Halder I, Shriver M, Thomas M, Fernandez JR, Frudakis T (2008) A panel of
ancestry informative markers for estimating individual biogeographical ancestry
and admixture from four continents: utility and applications. Hum Mutat 29:
648–658.
68. Tian C, Gregersen PK, Seldin MF (2008) Accounting for ancestry: population
substructure and genome-wide association studies. Hum Mol Genet 17: R143–
150.
69. Price AL, Patterson NJ, Plenge RM, Weinblatt ME, Shadick NA, et al. (2006)
Principal components analysis corrects for stratification in genome-wide
association studies. Nat Genet 38: 904–909.
70. Osoba D (1999) Interpreting the meaningfulness of changes in health-related
quality of life scores: lessons from studies in adults. Int J Cancer Suppl 12: 132–
137.
71. Osoba D, Rodrigues G, Myles J, Zee B, Pater J (1998) Interpreting the
significance of changes in health-related quality-of-life scores. J Clin Oncol 16:
139–144.
72. Fortner BV, Stepanski EJ, Wang SC, Kasprowicz S, Durrence HH (2002). Sleep
and quality of life in breast cancer patients. J Pain Symptom Manage 24: 471–
480.
73. Chen ML, Yu CT, Yang CH (2008) Sleep disturbances and quality of life in lung
cancer patients undergoing chemotherapy. Lung Cancer 62: 391–400.
74. Pud D, Ben Ami S, Cooper BA, Aouizerat BE, Cohen D, et al. (2008) The
symptom experience of oncology outpatients has a different impact on quality-
of-life outcomes. J Pain Symptom Manage 35: 162–170.
75. Cho MH, Dodd MJ, Lee KA, Padilla G, Slaughter R (2006) Self-reported sleep
quality in family caregivers of gastric cancer patients who are receiving
chemotherapy in Korea. J Cancer Educ 21: S37–41.
76. Schmitz ML, Mattioli I, Buss H, Kracht M (2004) NF-kappaB: a multifaceted
transcription factor regulated at several levels. Chembiochem 5: 1348–1358.
77. Libermann TA, Baltimore D (1990) Activation of interleukin-6 gene expression
through the NF-kappa B transcription factor. Mol Cell Biol 10: 2327–2334.
78. Heffner KL, France CR, Trost Z, Ng HM, Pigeon WR (2011) Chronic low back
pain, sleep disturbance, and interleukin-6. Clin J Pain 27: 35–41.
Cytokine Genes and Self-Reported Sleep Disturbance
PLoS ONE | www.plosone.org 14 July 2012 | Volume 7 | Issue 7 | e40560
Copyright © 2022 FDOKUMEN