Evidence from rural maize farmer households in western Kenya
27
RESEARCH ARTICLE Women’s empowerment in agriculture and agricultural productivity: Evidence from rural maize farmer households in western Kenya Gracious M. Diiro 1 *, Greg Seymour 2 , Menale Kassie 1 , Geoffrey Muricho 1 , Beatrice Wambui Muriithi 1 1 International Center for Insect Physiology and Ecology (icipe), Nairobi, Kenya, 2 CGIAR Research Program on Policies, Institutions, and Markets – International Food Policy Research Institute, Washington, DC, United States of America * [email protected] Abstract This paper documents a positive relationship between maize productivity in western Kenya and women’s empowerment in agriculture, measured using indicators derived from the abbreviated version of the Women’s Empowerment in Agriculture Index. Applying a cross- sectional instrumental-variable regression method to a data set of 707 maize farm house- holds from western Kenya, we find that women’s empowerment in agriculture significantly increases maize productivity. Although all indicators of women’s empowerment significantly increase productivity, there is no significant association between the women’s workload (amount of time spent working) and maize productivity. Furthermore, the results show heter- ogenous effects with respect to women’s empowerment on maize productivity for farm plots managed jointly by a male and female and plots managed individually by only a male or female. More specifically, the results suggest that female- and male-managed plots experi- ence significant improvements in productivity when the women who tend them are empow- ered. These findings provide evidence that women’s empowerment contributes not only to reducing the gender gap in agricultural productivity, but also to improving, specifically, pro- ductivity from farms managed by women. Thus, rural development interventions in Kenya that aim to increase agricultural productivity—and, by extension, improve food security and reduce poverty—could achieve greater impact by integrating women’s empowerment into existing and future projects. 1. Introduction In many economies in sub-Saharan Africa (SSA), women provide most of the labour force for agricultural production [1, 2, 3]. In Kenya, for example, women make up between 42% and 65% of the agricultural labour force [4, 5], in addition to their traditional domestic responsibil- ities. Despite women’s important role in the agricultural sector, however, empirical evidence shows that they lag behind men with regard to agricultural productivity in SSA due to the PLOS ONE | https://doi.org/10.1371/journal.pone.0197995 May 31, 2018 1 / 27 a1111111111 a1111111111 a1111111111 a1111111111 a1111111111 OPEN ACCESS Citation: Diiro GM, Seymour G, Kassie M, Muricho G, Muriithi BW (2018) Women’s empowerment in agriculture and agricultural productivity: Evidence from rural maize farmer households in western Kenya. PLoS ONE 13(5): e0197995. https://doi.org/ 10.1371/journal.pone.0197995 Editor: Yacob Zereyesus, Kansas State University, UNITED STATES Received: July 3, 2017 Accepted: May 11, 2018 Published: May 31, 2018 Copyright: © 2018 Diiro et al. This is an open access article distributed under the terms of the Creative Commons Attribution License, which permits unrestricted use, distribution, and reproduction in any medium, provided the original author and source are credited. Data Availability Statement: All of the data underlying the findings of this study are within the paper and its Supporting Information file. Funding: We acknowledge core funding to the International Centre of Insect Physiology and Ecology (icipe) provided by UK’s Department for International Development (DFID), the Swedish International Development Cooperation Agency (Sida), the Swiss Agency for Development and Cooperation (SDC), the German Federal Ministry for Economic Cooperation and Development
-
Upload
khangminh22 -
Category
Documents
-
view
3 -
download
0
Transcript of Evidence from rural maize farmer households in western Kenya

RESEARCH ARTICLE
Women’s empowerment in agriculture and
agricultural productivity: Evidence from rural
maize farmer households in western Kenya
Gracious M. Diiro1*, Greg Seymour2, Menale Kassie1, Geoffrey Muricho1, Beatrice
Wambui Muriithi1
1 International Center for Insect Physiology and Ecology (icipe), Nairobi, Kenya, 2 CGIAR Research
Program on Policies, Institutions, and Markets – International Food Policy Research Institute, Washington,
DC, United States of America
Abstract
This paper documents a positive relationship between maize productivity in western Kenya
and women’s empowerment in agriculture, measured using indicators derived from the
abbreviated version of the Women’s Empowerment in Agriculture Index. Applying a cross-
sectional instrumental-variable regression method to a data set of 707 maize farm house-
holds from western Kenya, we find that women’s empowerment in agriculture significantly
increases maize productivity. Although all indicators of women’s empowerment significantly
increase productivity, there is no significant association between the women’s workload
(amount of time spent working) and maize productivity. Furthermore, the results show heter-
ogenous effects with respect to women’s empowerment on maize productivity for farm plots
managed jointly by a male and female and plots managed individually by only a male or
female. More specifically, the results suggest that female- and male-managed plots experi-
ence significant improvements in productivity when the women who tend them are empow-
ered. These findings provide evidence that women’s empowerment contributes not only to
reducing the gender gap in agricultural productivity, but also to improving, specifically, pro-
ductivity from farms managed by women. Thus, rural development interventions in Kenya
that aim to increase agricultural productivity—and, by extension, improve food security and
reduce poverty—could achieve greater impact by integrating women’s empowerment into
existing and future projects.
1. Introduction
In many economies in sub-Saharan Africa (SSA), women provide most of the labour force for
agricultural production [1, 2, 3]. In Kenya, for example, women make up between 42% and
65% of the agricultural labour force [4, 5], in addition to their traditional domestic responsibil-
ities. Despite women’s important role in the agricultural sector, however, empirical evidence
shows that they lag behind men with regard to agricultural productivity in SSA due to the
PLOS ONE | https://doi.org/10.1371/journal.pone.0197995 May 31, 2018 1 / 27
a1111111111
a1111111111
a1111111111
a1111111111
a1111111111
OPENACCESS
Citation: Diiro GM, Seymour G, Kassie M, Muricho
G, Muriithi BW (2018) Women’s empowerment in
agriculture and agricultural productivity: Evidence
from rural maize farmer households in western
Kenya. PLoS ONE 13(5): e0197995. https://doi.org/
10.1371/journal.pone.0197995
Editor: Yacob Zereyesus, Kansas State University,
UNITED STATES
Received: July 3, 2017
Accepted: May 11, 2018
Published: May 31, 2018
Copyright: © 2018 Diiro et al. This is an open
access article distributed under the terms of the
Creative Commons Attribution License, which
permits unrestricted use, distribution, and
reproduction in any medium, provided the original
author and source are credited.
Data Availability Statement: All of the data
underlying the findings of this study are within the
paper and its Supporting Information file.
Funding: We acknowledge core funding to the
International Centre of Insect Physiology and
Ecology (icipe) provided by UK’s Department for
International Development (DFID), the Swedish
International Development Cooperation Agency
(Sida), the Swiss Agency for Development and
Cooperation (SDC), the German Federal Ministry
for Economic Cooperation and Development

gender inequalities that persist in respect of access to, control over and utilisation of produc-
tive resources such as land, livestock, labour, education, extension and financial services, and
technology [4, 6, 7, 8, 9, 10, 11,12,13,14,15, 16]. Inequality in landholding is especially severe in
SSA. Cultural norms and traditions restrict women’s ability to inherit land [17, 18] and con-
tribute to widening gender gaps in the quality and size of owned farmland [19]. In Kenya, a
mere 0.5% of women have access to financial services [20] and only around 6% own land [21].
Limited land ownership by female farmers hinders their access to formal credit, since land is a
major form of collateral [22]. Other gender inequalities evident for women in Kenya’s agricul-
tural sector include limited access to labour and agricultural markets [23, 24] and less control
over revenue from agricultural production than men [25, 26]. In addition, women farmers in
Kenya spend more time in care and domestic work than their male counterparts [2, 24], which
can limit their access to productive resources such as extension and advisory services [27] and
participation in income-generating activities [24].
Reducing gender inequality is widely recognised around the world as contributing to
agricultural growth and the attainment of food and nutritional security [1, 5]. More specifi-
cally, many international development programmes, such as the United States Agency for
International Development (USAID) Feed the Future initiative, which also operates in
Kenya, perceive women’s empowerment as a key factor in closing gender gaps in agricultural
productivity [28, 29, 30, 31, 24, 6]. Research has also shown that empowering women can
lead to improvements in their status both inside and outside the household—including
greater control over household resources; better mental health; reduced time constraints;
and increased access to financial services, health care, skills development, income-earning
opportunities, information about markets and legal rights—all of which may, in turn, posi-
tively impact agricultural productivity, nutrition and food security [6, 32, 33, 34]. Hence,
promoting gender equality is a major focus of rural development policy that aims to achieve
sustained food security and poverty alleviation in agrarian economies, including those in
SSA [35, 36, 37]. With specific respect to SSA, therefore, understanding the role of women’s
empowerment in agriculture is important for policymakers and development partners inter-
ested in devising more effective interventions to increase agricultural productivity, enhance
household and national economic growth, achieve food security, improve nutrition, and
reduce poverty.
In this paper, using smallholder maize farmers in western Kenya as a case study, we exam-
ine the effects of women’s empowerment in agriculture on maize productivity at farm- and
plot-level, where women’s empowerment may have differential effects on such productivity
depending on whether a plot is managed jointly by a man and a woman, or individually by
either a man or a woman. We contribute to the existing literature on gender and agricultural
productivity by using a more comprehensive measure of women’s empowerment in the agri-
cultural sector compared to previous studies: the (abbreviated version of the) Women’s
Empowerment in Agriculture Index (WEAI) [28]. Whereas the original WEAI utilised ten
component indicators, the Abbreviated WEAI (A-WEAI) comprises only six. Like its prede-
cessor, the A-WEAI measures women’s empowerment in their roles and extent of engagement
across five agricultural domains (production, resources, income, leadership and time) based
on individual-level survey data [28, 38]. Each dichotomous indicator measures whether an
individual respondent has achieved adequacy, based on the definitions shown in Table 1, with
corresponding weights that ensure that each domain receives equal weight when the indicators
are aggregated together. We operationalise the A-WEAI in two ways. First, we determine a
woman’s aggregate achievement of empowerment (i.e., her overall empowerment score) across
the six weighted indicators (see Table 1 for indicator descriptions and weights). Second, we
consider a woman’s level of empowerment in terms of each individual A-WEAI indicator. A
Women’s empowerment in agriculture and agricultural productivity
PLOS ONE | https://doi.org/10.1371/journal.pone.0197995 May 31, 2018 2 / 27
(BMZ), and the Kenyan Government. The work on
push—pull technology is funded primarily by the
European Union, with additional support from the
Biovision Foundation and the UK Government’s
Department for International Development (DFID).
We also thank Emily Kimathi for producing study
area map and Sandie Fitchat for language editing.
The views expressed herein do not necessarily
reflect the official opinion of the donors or icipe.
Competing interests: The authors have declared
that no competing interests exist.

woman is defined as “empowered” if she has achieved adequacy in at least 80% of the weighted
indicators (equivalent to four out of the five domains) [28].
Although some empirical studies have used the WEAI to investigate the impact of women’s
empowerment on food security and nutrition-related outcomes [e.g. 6, 33, 34, 38, 39, 40, and
41], and have generally found that women’s empowerment has the potential to improve both
such outcomes, thus far only a single study [42] has used the WEAI to explore what effects
women’s empowerment may have on agricultural productivity. Other related studies have
mainly focused on whether and how farm productivity is affected when inputs are redistrib-
uted between women and men instead of only among men in households (e.g., [12, 43, 44, 45,
46]). However, the findings from such studies may be less useful for effective policy prescrip-
tion because they do not completely account for women’s roles or the extent of women’s
engagement in the agricultural sector—a limitation that the WEAI overcomes through differ-
entiating among the five domains listed above.
The key finding from our study is that women’s empowerment in Kenya agriculture can
spur increased maize productivity among smallholder farmer households. Furthermore,
whereas all women’s empowerment indicators (except workload) significantly increased
productivity, the number of production decisions indicators seem to have greatest effect on
productivity. The results further show that, female- and male- managed plots experienced sig-
nificant improvements in productivity when the women who tended them were more empow-
ered. These results suggest that future rural development interventions that aim to increase
agricultural productivity in Kenya could achieve greater impact by integrating women’s
empowerment into existing and future projects, e.g., by focusing on women’s access to credit,
asset accumulation and community leadership.
The conceptual model and estimation methods adopted in the study are presented in the
next section, which is followed by a description of the data and of selected characteristics of
the sample households. The fourth section presents and discusses the estimation results, while
the fifth and final section concludes the presentation of the study with a discussion of its policy
implications.
2. Conceptual model and estimation methods
2.1 Model specification
We conceptualise the relationship between women’s empowerment and agricultural produc-
tivity in terms of a collective model of intra-household bargaining in which households are
considered as a collection of discrete individuals, each with his/her own set of preferences,
Table 1. Description of domains and empowerment indicators in the abbreviated women’s empowerment in Agriculture Index.
Domain Indicator Definition of adequacy (= 1) Weight
Production Input in productive decisions Sole or joint participation in at least one decision related to food and cash-crop farming, livestock farming, and
fishery production
1/5
Resources Asset ownership Sole or joint ownership of at least one major household asset 2/15
Access to and decisions on
credit
Sole or joint control or participation in decision-making on credit from at least one source 1/15
Income Control over use of income Sole or joint control over income for at least one of food and cash-crop farming, livestock farming, and fishery
production
1/5
Leadership Group membership Active member in at least one formal or informal group 1/5
Time Workload Spent less than or equal to 10.5 hours on paid and unpaid work during the previous day 1/5
Source: [38]
https://doi.org/10.1371/journal.pone.0197995.t001
Women’s empowerment in agriculture and agricultural productivity
PLOS ONE | https://doi.org/10.1371/journal.pone.0197995 May 31, 2018 3 / 27

rather than as a single, monolithic decision-making unit [47, 48]. The chosen framework
explicitly allows for intra-household differences in preferences and heterogeneity in the impact
of bargaining power on household members’ ability to negotiate and allocate resources to
maximise their respective utilities [36]. Our selection of the collective model was based on
the large body of empirical literature (e.g. [49, 50, 51]) that has demonstrated the inaccurate
approximation of intra-household behaviour via the traditional unitary model [52]. For exam-
ple, studies have shown that the relative bargaining power of women and men within a house-
hold largely depends on their relative access to, control over and utilisation of resources [24].
Such relative power may also directly influence agricultural productivity in a household
through its effect on household members’ ability to allocate and organise productive resources
optimally [53, 54].
Within this framework, plot-level productivity gains from women’s empowerment might
be expected to differ, depending on which household member manages the plot in question.
While the productivity gains from women’s empowerment are expected to be strongest for
plots cultivated either solely or jointly by women, it is also possible that the productivity-
enhancing effects of women’s empowerment extend (“spill over”) to plots operated by others
within the household, e.g., via the sharing of information, pooling of resources, or positive
peer pressure. Indeed, a recent study [42] using WEAI data from Bangladesh found that
improvements in women’s empowerment were associated with higher levels of technical effi-
ciency on all plots cultivated by a household, regardless of whether a woman actively managed
the plot or not.
We examine the relationship between women’s empowerment and farm productivity
by extending the standard productivity or yield function to include a measure of women’s
empowerment as an additional input in the household maize production function, and we test
whether the impact of women’s empowerment on yields differs for plots managed jointly by
the man and the woman in a household, and individually by either of them. Thus, the maize
yield of household i from plot p is as specified in Eq 1:
Qip ¼ f ðWi;Xi;Kip; PipÞ ð1Þ
In this equation, Qip denotes the quantity of maize yield per acre produced by household ifrom plot p; Wi is a measure of women’s empowerment status in agriculture, based on the
A-WEAI; Xi is a vector of household- and community-level explanatory variables that influ-
ence production decisions; Kip denotes a vector of inputs used in maize production on plot p;
and Pip denotes plot-level attributes of plot p.
We acknowledge that women’s empowerment status is potentially endogenous to agricul-
tural productivity. For example, unobserved characteristics such as women’s leadership
or farm management skills could potentially affect both household production and their
empowerment status. Endogeneity may also arise from reverse causation between women’s
empowerment and farm productivity: on the one hand, women’s empowerment may increase
agricultural productivity by encouraging a more optimal allocation and organisation of pro-
ductive resources, while on the other, increased yields may enhance women’s share of farm
income, their contribution to household food security, or their status within the community.
For example, women from more food-secure households are likely to command more respect
in their communities and may be more likely to engage in community leadership activities
than their counterparts from less food-secure households. We therefore treat women’s
empowerment (Wi) as an endogenous variable in the maize yield equation (Qip) as specified in
Women’s empowerment in agriculture and agricultural productivity
PLOS ONE | https://doi.org/10.1371/journal.pone.0197995 May 31, 2018 4 / 27

the following system of equations:
Qip ¼ aþ cWi þ gKip þ lPip þ εip ð2Þ
Wi ¼ pVi þ dZi þ ui ð3Þ
where E(ui|Zi) = 0 and E(ui, εip) 6¼ 0
In Eq 3, V denotes a vector of the explanatory variables, while Z denotes a vector of the
instrumental variables. The Greek characters denote unknown parameters to be estimated,
where ψ captures the effect of women’s empowerment in agriculture on maize productivity.
The error terms are εip and ui. The other elements are defined as above.
We apply an instrumental variable (IV) method described later in this section to correct
for the potential endogeneity of women’s empowerment using the following six variables as
instruments: (1) diversity of associations in village (number of types of association), (2) differencein age between principal male and principal female in household (years), (3) difference in educa-tion between principal male and principal female in household (years), (4) whether the womanbrought assets into marriage (1 = yes, 0 = no), (5) years of residence in village (women only), and
(6) household composition (by age group) (see Table 2 for descriptive statistics). We instrument
for the overall empowerment score using all the variables except for diversity of associations in
the village. For each of the individual empowerment indicators, the specific variables used as
instruments vary. Differences in age and education and whether the woman brought assets
into her marriage were used as instruments for number of production, asset ownership,
income and group membership decisions indicators. Diversity of associations and differences
in age and education were used as instruments for number of credit decisions indicator. Dif-
ferences in age and education and household composition by age category were used as instru-
ments for the workload indicator.
Residing in a village with a high diversity of associations may help women to develop stron-
ger social networks, which might in turn influence their decision to actively participate in
such associations. For example, an earlier study [41], which looked at the impact of women’s
empowerment on food security in rural Bangladesh, used the number of informal credit
sources in a village as an instrumental variable in their analysis. To this same end, our study
used a questionnaire to capture what types of association—whether formal or informal—
Table 2. Instrumental variables.
Variable Mean Standard deviation
Diversity of associations in village (number of types of association) 5.84 2.28
Difference in age between principal male and principal female in household 6.79 8.39
Difference in education between principal male and principal female in household
(years)
0.36 4.1
Wife brought assets into marriage (1 = yes, 0 = no) 0.14 0.35
Household composition (by age group)
• % of household members aged below 5 0.10 0.13
• % of household members aged 5–9 0.12 0.13
• % of household members aged 10–14 0.16 0.15
• % of household members aged 15–19 0.15 0.15
• % of household members aged 20–44 0.24 0.19
• % of household members aged 45–60 0.13 0.17
• % of household members aged above 60 0.11 0.20
Number of observations 707
https://doi.org/10.1371/journal.pone.0197995.t002
Women’s empowerment in agriculture and agricultural productivity
PLOS ONE | https://doi.org/10.1371/journal.pone.0197995 May 31, 2018 5 / 27
existed in the respondent’s village of residence. These associations were found to comprise
informal credit groups, input supply groups, development groups, a marketing group, mutual
membership groups, a business association, a water association, a women’s group, civil groups,
and a religious group.
As other studies have also shown [50, 34], differences in age and education in respect of a
household’s principal decision-makers may reflect differences in human capital and, hence,
could indicate women’s relative bargaining position in the household. Similarly, assets brought
by a woman into her marriage may also be positively associated with her bargaining position
within the household [55, 56, 57]. In our study area, we noted the practice of relatives giving a
woman gifts prior to her marriage. Such gifts ranged from smaller items to larger assets such
as livestock and farming equipment.
We used the composition of the household by age group to instrument the workload indi-
cator. We grouped household members into one of five categories, as follows: aged less than 5
years, aged between 5 and 9, aged between 10 and 14, aged between 15 and 19, aged between
20 and 44, aged between 45 and 60, and aged above 60. The proportion household members in
each of these age categories served as an instrument to how much work and leisure time a
woman had in a household. Additional adults of prime working age or adolescent children in
a household, particularly other females, may decrease the domestic work burden of the princi-
pal woman in the household—if, for example, care-giving duties are shared among household
members—whereas each additional dependent (household members aged below 5 or above
60) might increase demand on the principal woman’s time.
The rest of the covariates included in the empirical model were drawn from the empirical
literatures on agricultural productivity and women’s empowerment in SSA. These covariates
fall into four broad categories: (1) household socio-economic characteristics, (2) agriculturalinputs and practices, (3) plot-level attributes, and (4) community-level variables. Householdsocio-economic characteristics constitute sex, age, education and livestock ownership. Agricul-tural inputs and practices constitute the quantity of fertiliser per acre, other input expenditure
per acre (e.g. seed and agrochemicals), labour input (in person-days/acre), use of yield-
enhancing practices (e.g. intercropping, crop rotation, and push—pull technology/PPT), a
dummy variable for farmer confidence in the quality of agricultural extension and advisory
service provision, and a dummy variable for perceived credit constraints in the household
(equal to 1 if a household needed credit but were unable to get it, and 0 otherwise). Push-pul
technology (PPT) is a cropping system in which cereals such as maize are intercropped with
perennial fodder legumes (Desmodium) that repel (‘push’) stemborers and suppress Striga spe-
cies (witchweed). The cereal crops are also surrounded by a border of perennial fodder grass
(e.g. Pennisetum purpureum/Napier grass or Brachiaria species) that attracts (‘pulls’) stem-
borers away from cereal plants [58]. Plot-level attributes constitute the proximity of the house-
hold to the farm plot, plot tenure, perceived soil depth (shallow, medium or deep), soil fertility
(low, medium or high), slope (gentle, medium or steep), and whether the plot is vulnerable to
insect pests and diseases. Community-level variables constitute the distance from the household
to the nearest input supply shop, output market and extension offices, and sub-region dum-
mies to control for location-specific effects such as culture and unobserved agroecological
attributes. Lastly, we also included a season dummy to capture the effects of seasonal weather
variation on maize productivity.
2.2 Estimation methods
We estimate two alternative specifications of the yield function. In the first, women’s empow-
erment is operationalised in aggregate, to understand the general maize productivity effect of
Women’s empowerment in agriculture and agricultural productivity
PLOS ONE | https://doi.org/10.1371/journal.pone.0197995 May 31, 2018 6 / 27

women’s empowerment. More specifically, following [28], we compute the female respon-
dent’s individual-level empowerment score, i.e., the weighted sum of her achievements across
the six component indicators of the A-WEAI. In the second specification, we estimate separate
yield equations for each of these six indicators. This allows us to identify the individual effect
each indicator has on improving agricultural productivity. Five of the component indicators
enter the yield equation as counts (the number of groups in which a woman is an active mem-
ber, the number of decisions a woman makes about credit, the number of decisions a woman
makes about production, the number of assets over which a woman has control, and the num-
ber of decisions a woman makes about household income). For workload, the sixth indicator,
we created a dummy variable, which takes a value of 1 if the woman spent less than or equal to
10.5 hours of working on the day prior to the survey interview, and 0 otherwise. In both speci-
fications, we estimate an additional yield function without including potentially endogenous
input variables to check for robustness of the results.
We estimate the yield equations using a control function (CF) approach, which is more
suitable for nonlinear models with endogenous variables [59] such as those in our case. As in
other IV methods, the CF approach involves a two-stage estimation procedure such as two-
stage least squares (2SLS) method, but it has the advantage of being able to estimate nonlinear
models with endogenous regressors. The 2SLS method, for example, which estimates the first
stage using the ordinary least square (OLS) method, cannot be used in our case because our
first stage involves nonlinear models; although we use 2SLS to test the validity and relevance of
our instruments as we are not aware of any other suitable IV diagnostic test method when the
first stage is a non-linear model. Thus, in our first stage, women’s empowerment is predicted
using the various instruments described in section 2.1 above, and the predicted values are
included as covariates in the second stage. Our approach resembles the estimation procedures
used in previous studies involving the WEAI [40, 41]. However, whereas these studies have
tended to treat the WEAI as continuously distributed and estimate the first stage using OLS,
we properly account for the bounded nature of the empowerment score and estimate the first
stage using a fractional response Probit model (FRPM) [60, 61]. Failing to treat the empower-
ment score as bounded—as previous studies have done—and estimating the first stage using
OLS may lead to inconsistent estimates and miss some potentially important nonlinearity. Fol-
lowing [62], therefore, we performed the regression specification error test (RESET) for func-
tional misspecification in the first stage, and reject the null hypothesis that the equation has a
linear functional form (F[3, 2432] = 2.96).
For the first-stage estimation of all the individual indicators of empowerment in agriculture
except workload, we follow a similar CF approach as above, which again is justified by the non-
linear nature of these models, except that we use count regression models. Specifically, the
input in productive decisions, asset ownership and control over use of income indicators are esti-
mated using Poisson regression. The group membership indicator is estimated using zero-
inflated Poisson because of excessive zeros. The indicator access to and decisions about credit is
estimated using a negative binomial model due to over-dispersion. For workload, the first-
stage regression is estimated using a Probit model. The yield equations are estimated using
OLS.
3. Description of the study area, data and sample household
characteristics
The data for this study come from western Kenya, where PPT was developed and tested, and
where it is now being promoted to increase maize productivity through controlling Striga spe-
cies (witchweed) and stemborers as well as improving soil fertility. Farmers in this region have
Women’s empowerment in agriculture and agricultural productivity
PLOS ONE | https://doi.org/10.1371/journal.pone.0197995 May 31, 2018 7 / 27

two growing seasons: a long rainy season (March—August) and a short one (September—
December). The household and individual survey data were collected by the International
Centre of Insect Physiology and Ecology (icipe) between July and August 2016 for the 2015/16
cropping seasons while farmers were harvesting and threshing maize planted in 2016/17. In
respect of harvesting and threshing, female invest substantially more labour than male in their
households [10].
Due to resource limitations we selected 9 of the 11 counties where PPT was being used by
farmers. The selected counties were Bungoma, Busia, Homa Bay, Kakamega, Kisumu, Migori,
Siaya, Trans Nzoia and Vihiga (Fig 1). Next, between 3 and 11 villages were randomly selected
in each county using the probability-proportional-to-size sampling method. Within each vil-
lage, between 2 and 21 households were randomly selected, also proportional to their size. In
total, 60 villages and 711 farmers operating on 4,494 plots were surveyed. Of the total plots
Fig 1. Study area and distribution of sample households.
https://doi.org/10.1371/journal.pone.0197995.g001
Women’s empowerment in agriculture and agricultural productivity
PLOS ONE | https://doi.org/10.1371/journal.pone.0197995 May 31, 2018 8 / 27

(4,346) cultivated by the households, 2,481 plot observations were planted with maize, which is
the focus of this study. After dropping outlier observations and observations that had missing
values for some variables, the usable sample amounted to 707 households and 2,248 maize
plots.
Separate questionnaires were designed for households and individuals. The survey tool was
administered using semi-structured interviews by trained enumerators who spoke and under-
stood the local languages. Respondents’ participation in the survey was voluntary. The ques-
tionnaire had an introductory statement that sought the respondent’s consent to participate in
the survey. While the household questionnaire was administered jointly to the principal male
and female adult decision-makers in the household, the individual questionnaire was adminis-
tered to the principal female decision-maker only, via a private interview conducted away
from the male adult decision-maker to avoid data/response contamination. While both ques-
tionnaires aimed to capture gender dynamics within the household, the individual question-
naire was aimed specifically at eliciting the data required to compute the A-WEAI score for
the adult female decision-maker. Due to budget constraints, the A-WEAI -oriented question-
naire was administered to women only, i.e., male adult decision-makers in a household were
not interviewed.
The household questionnaire administered to both spouses elicited information on, among
other things, household and individual demographic characteristics; crop and livestock pro-
duction and utilisation data (input data, consumption data, marketing, etc.); ownership of pro-
ductive assets (labour, land and livestock) by sex; farming practices such as PPT adoption; plot
characteristics and management; access to development services (extension, credit and mar-
kets); non-agricultural income-generating activities; and social capital and network variables
such as spouses’ membership of rural institutions. Table 3 offers definitions and summary sta-
tistics for all the variables used in the analysis.
4. Results and discussion
4.1 Descriptive statistics
The descriptive statistics show that, on average, women achieve adequacy in 64% of the
weighted indicators in the A-WEAI. Each indicator takes a value of 1 if a woman achieves ade-
quacy according to cut-offs defined by [28], and 0 otherwise. Per the 80% cut-off utilised in
[28], 65.9% of women in the sample would be considered disempowered, which is close to the
baseline WEAI reported by [63] for northern Kenya, where 68.4% of women in the area were
reported as being disempowered. With respect to the individual indicators that comprise the
A-WEAI, women were most likely to achieve adequacy in asset ownership, access to and deci-sions on credit, and control over use of income, and least likely to achieve adequacy in groupmembership and workload (see Fig 2). In households with both spouses present, the principal
female decision-maker is about seven years younger than her male counterpart, on average,
and has attained 0.36 fewer years of education.
Maize is the main staple food crop in western Kenya, providing both food and income to
rural households in the area. The crop contributes about 68% of daily per capita cereal con-
sumption, 35% of total dietary energy consumption and 32% of total protein consumption in
the country [64]. Households in the sample reported maize harvests of 1,123 kg per acre
(2.77MT/ha) on average. While western Kenya is part of a high potential maize production
belt, the most important factor contributing to better yields may be the adoption of PPT by
households in the study region. The average maize yield on PPT plots was 1,507 kg per acre
(3.72 MT/ha), compared with an average on non-PPT plots of 960 kg per acre (2.37 MT/ha).
Women’s empowerment in agriculture and agricultural productivity
PLOS ONE | https://doi.org/10.1371/journal.pone.0197995 May 31, 2018 9 / 27

Table 3. Description of variables and summary statistics.
Variables Mean Standard
deviation
Outcome variable
Maize yield (kg/acre) 1,123.33 872.31
Women’s empowerment indicators
Women’s overall empowerment score (based on aggregate weighted score) 0.63 0.19
Number of production decisions in which the woman participates (out of 4) 1.95 0.86
Number of assets over which the woman has control (out of 7) 2.46 1.54
Number of credit-related decisions in which the woman participates (out of 12) 2.99 2.65
Number of income decisions in which the woman participates (out of 9) 4.84 2.08
Number of formal and informal groups to which the woman belongs (out of 10) 1.309 2.17
Time adequacy (1 = woman worked less than or equal to 10.5 hours, 0 = worked
more than 10.5 hours)
0.27 0.45
Total workload (hours) 12.68 3.67
Domestic workload (hours) 7.01 4.62
Farm workload (hours) 3.81 2.77
Household socio-economic characteristics
Sex of household head (1 = male, 0 = female) 0.69 0.46
Age of man (years) 55.24 11.70
Age of woman (years) 48.45 13.01
Formal education of man (years) 7.99 4.75
Formal education of woman (years) 7.62 3.62
Livestock ownership (TLUs) 1.99 2.45
Agricultural inputs and practices
Fertiliser use (kg/acre) 61.75 150.13
Seeds and chemicals input (KSh/acre) 1,206.49 1678.02
Total labour input (person-days/acre) 83.56 91.37
Hired labour input (person-days/acre) 10.00 21.11
Plot intercropped (1 = Yes, 0 = No) 0.86 0.35
Crop rotation on plot (1 = Yes, 0 = No) 0.04 0.20
Push—pull technology used on plot (1 = yes, 0 = no) 0.30 0.46
Farmer has confidence in the skill of extension officers (1 = yes, 0 = no) 0.77 0.42
Credit-constrained household (1 = needed credit, but did not get it, 0 otherwise) 0.57 0.50
Plot-level attributes
Distance from residence to plot (walking minutes) 4.00 11.17
Shallow depth plot (1 = yes, 0 = no) 0.06 0.24
Medium depth plot (1 = yes, 0 = no) 0.45 0.50
Deep depth plot (1 = yes, 0 = no) 0.49 0.50
Low soil fertility plot (1 = yes, 0 = no) 0.07 0.25
Medium soil fertility plot (1 = yes, 0 = no) 0.53 0.50
High soil fertility plot (1 = yes, 0 = no) 0.40 0.49
Gentle slope plot (1 = yes, 0 = no) 0.50 0.50
Medium slope plot (1 = yes, 0 = no) 0.48 0.50
Steep slope plot (1 = yes, 0 = no) 0.02 0.13
Plot tenure (1 = owned, 0 = rented) 0.92 0.28
Plot affected by pests and diseases (1 = yes, 0 = no) 0.48 0.50
Community-level variables
Distance from residence to input supply shop (walking minutes) 51.49 43.36
Distance from residence to main market (walking minutes) 59.78 39.80
(Continued)
Women’s empowerment in agriculture and agricultural productivity
PLOS ONE | https://doi.org/10.1371/journal.pone.0197995 May 31, 2018 10 / 27

Strengthening this finding is the fact that the sample households’ PPT yield is close to the on-
farm yield 3.50 MT/ha reported by [58].
Our study further reveals that the probability of adoption PPT is higher for households
with empowered women (52%) compared with households with disempowered women (50%).
A stochastic dominance analysis also shows that the maize yield distribution of households
with empowered women in production decision appear to dominate that of households with
disempowered women (Fig 3). The vertical distance between the cumulative density function
of empowered and disempowered is significant at better than the 5% level. Although this should
be subjected to rigorous analysis, the result is in line with the existing empirical literature
where empowering women or closing gender gaps would lead to higher agricultural productiv-
ity [26, 43, 65].
The pathways for higher yields associated with households with empowered women could
be due to a combination of factors, including increased use of improved technologies such
as inorganic fertilisers, of agronomic practices such as PPT, and of pesticides and labour use.
For example, as illustrated in Figs 4 to 7, sample maize farming households with empowered
Table 3. (Continued)
Variables Mean Standard
deviation
Distance from residence to agricultural extension office (walking minutes) 70.43 53.84
Dummy for sub-region (1 = Luo region, 0 = Luhya region) 0.65 0.48
Other variables
Cropping season (1 = long rainy season, 0 = short rainy season) 0.53 0.50
Plot (and household) observations 2,436 (707)
Source: icipe survey data
Note: Farm workload includes time spent on: [crop farming activities, livestock production, fishing and marketing].
Domestic workload includes time spent on: [cooking, fetching water, collecting firewood, child care and any another
domestic work].
https://doi.org/10.1371/journal.pone.0197995.t003
Fig 2. Percentage of women registering inadequacy in terms of each A-WEAI indicator.
https://doi.org/10.1371/journal.pone.0197995.g002
Women’s empowerment in agriculture and agricultural productivity
PLOS ONE | https://doi.org/10.1371/journal.pone.0197995 May 31, 2018 11 / 27

Fig 3. Distribution of maize yield.
https://doi.org/10.1371/journal.pone.0197995.g003
Fig 4. Distribution of seeds and pesticides expenditure in maize farming.
https://doi.org/10.1371/journal.pone.0197995.g004
Women’s empowerment in agriculture and agricultural productivity
PLOS ONE | https://doi.org/10.1371/journal.pone.0197995 May 31, 2018 12 / 27

Fig 5. Distribution of seed planted in maize farming.
https://doi.org/10.1371/journal.pone.0197995.g005
Fig 6. Distribution of fertiliser application rates in maize farming.
https://doi.org/10.1371/journal.pone.0197995.g006
Women’s empowerment in agriculture and agricultural productivity
PLOS ONE | https://doi.org/10.1371/journal.pone.0197995 May 31, 2018 13 / 27

women appear to stochastically dominate those with disempowered women with respect to
seeds and pesticides expenditure (Fig 4), amount of seed planted (Fig 5), fertiliser application
rates (Fig 6), and labour allocation (Fig 7). Furthermore, adoption of PPT and improved maize
varieties is higher for households with empowered women (52% and 72%, respectively) com-
pared with those for disempowered women (46% and 68%, respectively).
4.2 Econometric results
Tables 4 and 5 present the results of the first-stage equations estimated using fractional
response, count and Probit regression models along with diagnostic tests for the relevance of
the IVs used in this study. Because our primary interest is on the impacts of empowerment,
the first-stage regression estimates are not discussed. However, it is worth mentioning that the
endogeneity test rejects the null hypothesis that overall women’s empowerment and the indi-
vidual indicators of women’s empowerment are exogenous except for workload indicator. We
also performed tests for under- and over-identification and reject the null hypothesis that the
outcome regression models are under-identified, i.e., the instruments are relevant or corre-
lated with endogenous regressors. However, we fail to reject the null hypothesis that the instru-
ments are valid instruments (overidentification test), or uncorrelated with error terms and
that the excluded instruments are correctly excluded from outcome equations.
4.3 Impact of women’s empowerment on maize yields
Table 6 presents estimates of the effect of women’s overall empowerment scores on maize
yield, as derived from the CF-FRPM approach as well as by using OLS and 2SLS estimation
methods for comparison purposes. Because we use the predicted values of the endogenous var-
iable in the second-stage estimation, we report bootstrapped standard errors for CF-FRPM to
Fig 7. Distribution of labour use in maize farming.
https://doi.org/10.1371/journal.pone.0197995.g007
Women’s empowerment in agriculture and agricultural productivity
PLOS ONE | https://doi.org/10.1371/journal.pone.0197995 May 31, 2018 14 / 27

improve the efficiency of our estimates. The results are consistent across the different regres-
sion models and show that an increase in women’s overall empowerment score significantly
improve maize yields, suggesting the importance of improving women’s empowerment in
Kenya agriculture to reduce food insecurity and poverty. Inputs (fertiliser, value of seed and
Table 4. First-stage results for women’s overall empowerment score and IV diagnostics.
Variables Coefficient
Difference in age between principal male and principal
female in household (years)
-0.00
(0.002)
Difference in education between principal male and
principal female in household (years)
-0.01���
(0.003)
Years of residence in village (women only) 0.00���
(0.001)
Wife brought assets into marriage (1 = yes, 0 = no)? 0.03
(0.024)
Proportion of household members below 5 years -0.08
(0.085)
Proportion of household members between 5 and 9
years
-0.01
(0.079)
Proportion of household members between 10 and 14
years
0.04
(0.081)
Proportion of household members between 15 and 19 0.12�
(0.065)
Proportion of household members between 20 and 44 -0.16��
(0.070)
Proportion of household members between 45 and 60 -0.09
(0.067)
Other covariates Yes
Sub-region dummy Yes
Constant 0.75���
(0.100)
Wald chi-square test 1291.07���
Observations 2,436
IV diagnostic tests
Endogeneity test, H0: exogenous 3.95��
Over-identification test (Hansen J statistics), H0:
instruments are valid
11.15
Weak identification test (Kleibergen-Paap rk Wald F
statistic)
119.06 (it is greater than critical value (30.53) for one
endogenous and 9 excluded instruments)
Anderson-Rubin Wald test, p-value (F statistics
version)
2.17��
Anderson-Rubin Wald test (χ2 version) 19.75 (0.020)��
Under-identification test (Kleibergen-Paap rk LM
statistic)
427.90���
Note: Robust standard errors in parentheses. The first stage is estimated using a fractional response probit model.
The IV diagnostic is based on 2SLS as we are not aware of any IV diagnostic test that could be used when the first
stage is nonlinear.
� p<0.1,
�� p<0.05,
��� p<0.01.
https://doi.org/10.1371/journal.pone.0197995.t004
Women’s empowerment in agriculture and agricultural productivity
PLOS ONE | https://doi.org/10.1371/journal.pone.0197995 May 31, 2018 15 / 27

pesticides) and agricultural practices (adoption of PPT, intercropping and rotation) are less
likely to correlate with errors of yield equation because many explanatory variables that influ-
ence the former variables are included. Also, the decision to use these variables (i.e. the input
and agricultural practice) occurred before the maize harvest period. However, results exclud-
ing these variables in the regression models are qualitatively similar to including them in those
models. For instance, an increase in women’s empowerment by 1% led to a 6.4% increase in
maize yield when we used CF-FRPM, and 16.8% when we used 2SLS. Other significant deter-
minants of maize yield in the study area include labour allocation, fertiliser application,
Table 5. First-stage results for individual indicators of women’s empowerment and IV diagnostics.
Variables Productive
decisions
Asset
ownership
Income
decisions
Credit
decisions
Group
membership
Workload
Difference in age between principal male and principal female
in household
-0.00 -0.01��� 0.00� -0.00 -0.07��� -0.02���
(0.001) (0.001) (0.001) (0.002) (0.002) (0.004)
Difference in education between principal male and principal
female in household (years)
-0.01��� -0.04��� -0.01��� -0.04��� -0.15��� 0.00
(0.002) (0.002) (0.002) (0.004) (0.003) (0.007)
Diversity of associations in village (Number of types of
association)
0.05��� 0.11���
(0.004) (0.008)
Wife brought assets into marriage? (1 = yes, 0 = no) 0.16��� 0.16��� 0.08���
(0.023) (0.033) (0.022)
Proportion of household members below 5 years -0.29
(0.312)
Proportion of household members between 5 and 9 years - - - - - -0.34
- - - - - (0.291)
Proportion of household members between 10 and 14 years - - - - - -0.11
- - - - - (0.267)
Proportion of household members between 15 and 19 years - - - - - 0.01
- - - - - (0.270)
Proportion of household members between 20 and 44 years - - - - - -0.51��
- - - - - (0.252)
Proportion of household members between 45 and 60 years - - - - - -0.75���
- - - - - (0.217)
Other covariates Yes Yes Yes Yes Yes Yes
County dummies Yes Yes Yes Yes Yes Yes
Constant 0.58��� 1.25��� 1.19��� -0.01 -0.01 1.31���
(0.111) (0.140) (0.105) (0.222) (0.222) (0.229)
Log likelihood -3525.218 -4144.233 -5121.1461 -5320.448 -3405.94 -1209.07
Observations 2,436 2,436 2,436 2,436 2,436 2,436
IV diagnostic tests
Endogeneity test, H0: exogenous 2.90� 0.68 4.74�� 30.18��� 4.05�� 1.64
Over-identification test (Hansen J statistics) 0.78 0.093 0.667 4.12 0.37 10.90
Weak identification test (Kleibergen-Paap Wald rk F statistic) 32.18 97.98 16.05 81.04 476.04 5.62
Under-identification test (Kleibergen-Paap rk LM statistic) 82.88��� 192.10��� 43.69��� 204.57��� 521.57��� 38.05���
Note: Robust standard errors in parentheses. The input in productive decisions and asset ownership indicators were estimated using Poisson regression. The groupleadership indicator was estimated using the zero-inflated Poisson because of excessive zeros, while access to and decisions on credit was estimated using a negative
binomial regression model due to over-dispersion. For workload we used the probit regression model. The IV diagnostic estimates are based on 2SLS.
� p<0.1,
�� p<0.05,
��� p<0.01.
https://doi.org/10.1371/journal.pone.0197995.t005
Women’s empowerment in agriculture and agricultural productivity
PLOS ONE | https://doi.org/10.1371/journal.pone.0197995 May 31, 2018 16 / 27

Table 6. Effects of women’s overall empowerment on maize yield (Dependent variable—Ln(Maize yield, kg/acre)).
Variables OLS 2SLS CF-FRPM
Women’s overall empowerment score 0.16� 0.38�� 0.13���
(0.083) (0.152) (0.045)
Ln(Labour use, person-days/acre) 0.15��� 0.15��� 0.15���
(0.014) (0.014) (0.015)
Ln(Seed and chemical use, KSh/acre) 0.03��� 0.03��� 0.03���
(0.004) (0.004) (0.004)
Ln(Fertiliser use, kg/acre) 0.04��� 0.04��� 0.04���
(0.004) (0.004) (0.005)
Push—pull technology on the plot 0.22��� 0.21��� 0.21���
(0.038) (0.038) (0.034)
Plot intercropped 0.50��� 0.51��� 0.51���
(0.041) (0.041) (0.040)
Crop rotation on plot -0.00 0.00 0.01
(0.017) (0.017) (0.016)
Ln(Distance from residence to plot) -0.19��� -0.20��� -0.20���
(0.032) (0.032) (0.029)
Plot affected by pests and diseases 0.19��� 0.18��� 0.18���
(0.030) (0.029) (0.029)
Cropping season -0.02��� -0.02��� -0.02���
(0.007) (0.007) (0.007)
Livestock ownership -0.09��� -0.09��� -0.09���
(0.031) (0.031) (0.030)
Sex of household head 0.02 0.02 0.02
(0.038) (0.038) (0.044)
Credit-constrained household -0.06��� -0.07��� -0.06���
(0.021) (0.021) (0.020)
Ln(Distance from residence to input supply shop) 0.06��� 0.06��� 0.06���
(0.020) (0.020) (0.022)
Farmer has confidence in the skill of extension officers 0.05� 0.05�� 0.05��
(0.024) (0.024) (0.024)
Ln(Distance from residence to agricultural extension office) -0.01 -0.01 -0.01
(0.058) (0.058) (0.053)
Ln(Distance from residence to main market) -0.00 -0.00 -0.00
(0.052) (0.052) (0.049)
Plot tenure -0.03 -0.04 -0.04
(0.031) (0.031) (0.028)
Medium slope plot -0.35��� -0.37��� -0.37���
(0.112) (0.111) (0.134)
Steep slope plot 0.01 0.01 0.01
(0.033) (0.033) (0.029)
Low soil fertility plot -0.12� -0.12� -0.12��
(0.063) (0.064) (0.055)
Medium soil fertility plot -0.02 -0.03 -0.03
(0.063) (0.063) (0.071)
Medium depth plot -0.07 -0.09 -0.09
(0.063) (0.064) (0.067)
(Continued)
Women’s empowerment in agriculture and agricultural productivity
PLOS ONE | https://doi.org/10.1371/journal.pone.0197995 May 31, 2018 17 / 27

expenditure on seed and pesticides, use of push—pull technology on a plot, intercropping, per-
ceived incidence of pests and diseases on a plot, distance to input supply shops and output
markets, sex of household head, and credit constraints (i.e., where a household needed but was
unable to get credit) (Table 6).
4.4 Dimensions of women’s empowerment that matter most in increasing
maize yields
Table 7 presents estimates of the effects of each individual indicator of women’s empowerment
on maize yields, estimated using a similar approach as in section 4.3 above (The results
reported in Tables 6 and 7 are robust to the exclusion of input variables from the yield equa-
tion). The results indicate that all six indicators of women’s empowerment except workload are
positively and significantly associated with maize yields. We note considerable heterogeneity
in the magnitude of each indicator’s effect on maize yields. Thus, while all indicators of wom-
en’s empowerment are important, number of production decisions indicator has greater
effect on improving agricultural productivity. If the number of production decisions made by
women increases by one-unit, maize productivity can increase by 32 percent (This is com-
puted based on 100 × eβ − 1, as we log-level regression specification). The same values for
income, group membership and assets indicators are 14, 15 and 13 percent, respectively.
Although not reported, qualitatively comparable results found using the two stages-least
square (2SLS). Except the workload indicator, all other indicators have a positive and signifi-
cant effects on maize yields.
Other factor influencing maize yields include labour, fertiliser and seed and chemical use,
use of PPT, intercropping, pest and disease occurrence, livestock ownership, credit constraints,
extension services, sex of household head, and distance to input supply shops and output
markets.
4.5 Effect of women’s empowerment on the productivity of female-
managed, male-managed and jointly-managed plots
Table 8 presents estimates, using the CF approach, of the effects of women’s empowerment
scores on maize yields according to whether plots were managed jointly by the principal
Table 6. (Continued)
Variables OLS 2SLS CF-FRPM
Deep depth plot -0.24��� -0.24��� -0.24���
(0.035) (0.035) (0.033)
County dummies 0.16� 0.38�� 0.13���
(0.083) (0.152) (0.045)
Constant 5.54��� 5.39��� 5.58���
(0.170) (0.191) (0.145)
R-squared 0.29 0.28 0.29
Wald Chi2/F test 53.02��� 52.59��� 2609.01���
Observations 2,436 2,436 2,436
Note: Bootstrapped errors for CF-FRPM and robust standard errors for OLS and 2SLS models in parentheses.
� p<0.1,
�� p<0.05,
��� p<0.01.
https://doi.org/10.1371/journal.pone.0197995.t006
Women’s empowerment in agriculture and agricultural productivity
PLOS ONE | https://doi.org/10.1371/journal.pone.0197995 May 31, 2018 18 / 27

Table 7. Effects of individual indicators of women’s empowerment on maize yield (Dependent variable—Ln(Maize yield, kg/acre)).
Variables Production
decisions
Asset
ownership
Income
decisions
Credit
decisions
Group
membership
Workload
Number of production decisions in which the woman
participates
0.28���
(0.087)
Number of assets over which the woman has control 0.12���
(0.027)
Number of income decisions in which the woman
participates
0.13���
(0.027)
Number of credit-related decisions in which the woman
participates
0.08���
(0.016)
Number of formal and informal groups to which the
woman belongs
0.14�
(0.079)
Time adequacy -0.08
(0.140)
Ln(Labour use, person-days/acre) 0.14��� 0.15��� 0.12��� 0.14��� 0.14��� 0.14���
(0.011) (0.016) (0.014) (0.011) (0.012) (0.015)
Ln(Seed and chemical use, KSh/acre) 0.02��� 0.03��� 0.02��� 0.03��� 0.03��� 0.03���
(0.005) (0.004) (0.004) (0.004) (0.005) (0.004)
Ln(Fertiliser use, kg/acre) 0.04��� 0.04��� 0.04��� 0.04��� 0.04��� 0.04���
(0.005) (0.004) (0.006) (0.004) (0.005) (0.006)
Push—pull technology on a plot 0.20��� 0.19��� 0.20��� 0.17��� 0.21��� 0.22���
(0.041) (0.043) (0.031) (0.038) (0.037) (0.039)
Plot intercropped 0.48��� 0.52��� 0.49��� 0.54��� 0.51��� 0.50���
(0.041) (0.033) (0.038) (0.041) (0.044) (0.040)
Crop rotation on plot 0.00 0.00 -0.02 0.01 0.00 -0.01
(0.021) (0.021) (0.020) (0.018) (0.017) (0.017)
Ln(Distance of from residence to plot) -0.25��� -0.22��� -0.24��� -0.21��� -0.20��� -0.19���
(0.042) (0.032) (0.026) (0.031) (0.031) (0.034)
Plot affected by pests and diseases 0.19��� 0.18��� 0.20��� 0.18��� 0.19��� 0.19���
(0.034) (0.037) (0.026) (0.033) (0.034) (0.033)
Cropping season -0.01� 0.00 -0.02��� -0.02��� -0.04��� -0.02���
(0.007) (0.011) (0.006) (0.007) (0.010) (0.006)
Livestock ownership -0.09��� -0.11��� -0.09��� -0.08�� -0.07� -0.09��
(0.028) (0.025) (0.029) (0.033) (0.039) (0.036)
Sex of household head 0.06 0.04 0.02 0.06�� -0.01 0.02
(0.047) (0.032) (0.036) (0.030) (0.044) (0.034)
Credit-constrained household -0.07��� -0.07��� -0.05�� -0.07��� -0.06�� -0.06���
(0.019) (0.019) (0.022) (0.019) (0.022) (0.020)
Farmer has confidence in the skill of extension officers 0.06��� 0.06��� 0.08��� 0.04� 0.05��� 0.06��
(0.020) (0.020) (0.018) (0.023) (0.020) (0.023)
Ln(Distance from residence to input shop) 0.07��� 0.07��� 0.05�� 0.06��� 0.06�� 0.04��
(0.022) (0.023) (0.023) (0.022) (0.026) (0.021)
Ln(Distance from residence to extension office) -0.04 -0.01 -0.03 -0.09 0.01 0.00
(0.058) (0.056) (0.063) (0.070) (0.055) (0.066)
Ln(Distance from residence to main market) -0.01 0.03 0.02 -0.04 -0.01 0.00
(0.056) (0.050) (0.057) (0.046) (0.053) (0.061)
Plot tenure -0.04 -0.01 -0.01 -0.04 -0.02 -0.02
(0.029) (0.031) (0.029) (0.029) (0.029) (0.032)
(Continued)
Women’s empowerment in agriculture and agricultural productivity
PLOS ONE | https://doi.org/10.1371/journal.pone.0197995 May 31, 2018 19 / 27

female and male decision-makers, or managed solely by either one of them. The plot manager
variables (female-managed plots, male-managed plots and jointly-managed plots) were created
based on two questions: “Who in the household makes decisions on crops to be planted, input
use and timing of crop activities?” and “Who in the household manages the plot?” The results
reveal considerable heterogeneity in the effects of women’s empowerment on maize yields
across the three types of plot management. More specifically, we find that the increased maize
yields due to higher empowerment scores for the women were statistically significant for
female-managed and male-managed plots.
In Table 9 we compare selected attributes of female-, male- and jointly-managed plots to
highlight some of the factors that may be critical to closing the gender gap in maize productiv-
ity. For example, female-managed plots tend to be less fertile and receive a lower intensity of
fertilisers relative to the other plot-manager categories. Most notably, however, stark differ-
ences exist in the quantity of labour supplied to female-managed plots, relative to male-man-
aged and jointly-managed ones: on average, female-managed plots receive roughly 32 fewer
person-days per acre of total labour compared with their male-managed counterparts, and
nearly 38 fewer person-days per acre than jointly-managed plots do.
Several possible explanations exist for this trend. Firstly, given the typical division of labour
within SSA households and the heavy domestic workload this places on women, women may
have less time than men to devote to cultivating their plots [2, 24]. Indeed, as reported earlier
(Fig 2), more than 70% of women in the sample fail to achieve adequacy in the workload indi-
cator, i.e., they spent more than 10.5 hours in paid and domestic work during the previous
day. Secondly, restrictions on women’s mobility—due partly to this heavy burden of labour
Table 7. (Continued)
Variables Production
decisions
Asset
ownership
Income
decisions
Credit
decisions
Group
membership
Workload
Medium slope plot -0.40��� -0.33��� -0.36��� -0.33�� -0.37��� -0.34���
(0.111) (0.102) (0.108) (0.130) (0.103) (0.107)
Steep slope plot 0.03 -0.02 0.01 -0.02 0.02 0.01
(0.032) (0.042) (0.027) (0.030) (0.032) (0.038)
Medium soil fertility plot -0.08 -0.10 -0.06 -0.11 -0.12� -0.11��
(0.067) (0.069) (0.076) (0.069) (0.066) (0.053)
Low soil fertility plot -0.09 -0.01 -0.13� -0.07 -0.05 -0.01
(0.063) (0.063) (0.070) (0.068) (0.061) (0.078)
Medium depth plot -0.10 -0.05 -0.11� -0.11� -0.08 -0.04
(0.070) (0.060) (0.059) (0.061) (0.057) (0.075)
Deep depth plot -0.19��� -0.18��� -0.29��� -0.19��� -0.23��� -0.23���
(0.039) (0.037) (0.037) (0.035) (0.036) (0.036)
Sub-region dummy 5.13��� 5.21��� 5.12��� 5.54��� 5.39��� 5.65���
Constant (0.230) (0.200) (0.164) (0.156) (0.201) (0.161)
0.14��� 0.15��� 0.12��� 0.14��� 0.14��� 0.14���
Wald chi-square test 4238.25��� 2144.91��� 2258.24��� 3903.21��� 1609.32��� 3424.67���
R-squared 0.290 0.292 0.293 0.294 0.287 0.286
Observations 2,436 2,436 2,436 2,436 2,436 2,436
Note: Bootstrapped standard errors in parentheses.
� p<0.1,
�� p<0.05,
��� p<0.01.
https://doi.org/10.1371/journal.pone.0197995.t007
Women’s empowerment in agriculture and agricultural productivity
PLOS ONE | https://doi.org/10.1371/journal.pone.0197995 May 31, 2018 20 / 27
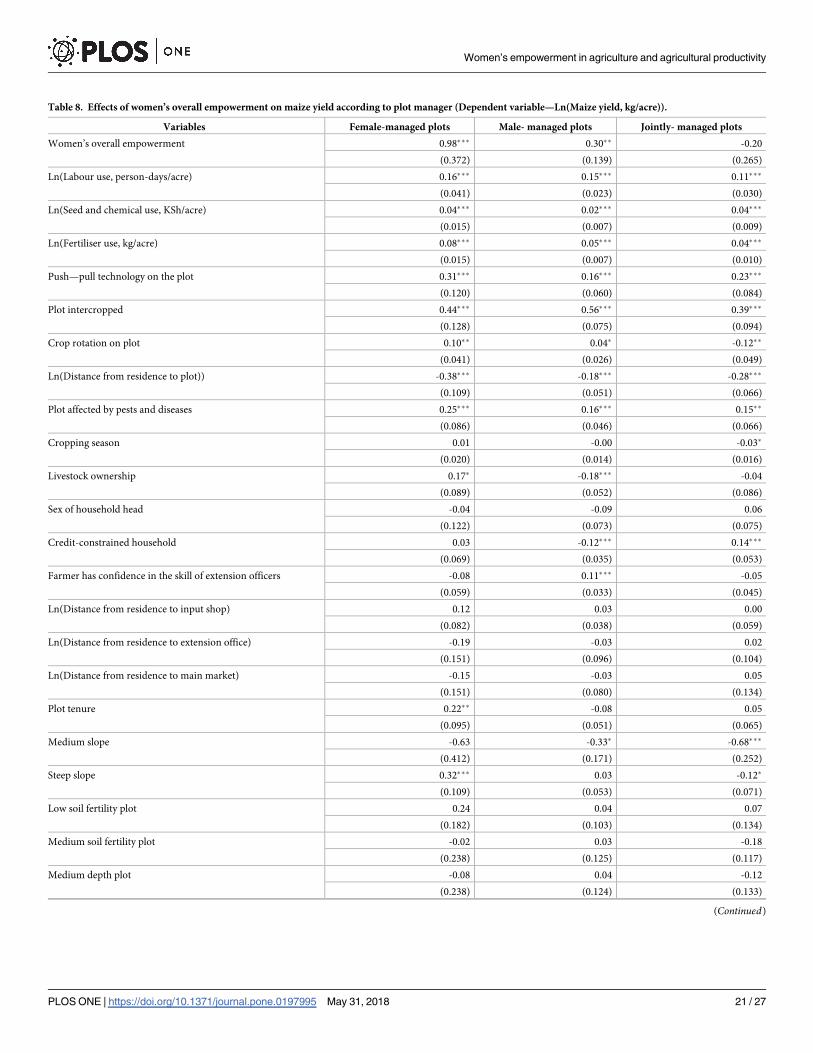
Table 8. Effects of women’s overall empowerment on maize yield according to plot manager (Dependent variable—Ln(Maize yield, kg/acre)).
Variables Female-managed plots Male- managed plots Jointly- managed plots
Women’s overall empowerment 0.98��� 0.30�� -0.20
(0.372) (0.139) (0.265)
Ln(Labour use, person-days/acre) 0.16��� 0.15��� 0.11���
(0.041) (0.023) (0.030)
Ln(Seed and chemical use, KSh/acre) 0.04��� 0.02��� 0.04���
(0.015) (0.007) (0.009)
Ln(Fertiliser use, kg/acre) 0.08��� 0.05��� 0.04���
(0.015) (0.007) (0.010)
Push—pull technology on the plot 0.31��� 0.16��� 0.23���
(0.120) (0.060) (0.084)
Plot intercropped 0.44��� 0.56��� 0.39���
(0.128) (0.075) (0.094)
Crop rotation on plot 0.10�� 0.04� -0.12��
(0.041) (0.026) (0.049)
Ln(Distance from residence to plot)) -0.38��� -0.18��� -0.28���
(0.109) (0.051) (0.066)
Plot affected by pests and diseases 0.25��� 0.16��� 0.15��
(0.086) (0.046) (0.066)
Cropping season 0.01 -0.00 -0.03�
(0.020) (0.014) (0.016)
Livestock ownership 0.17� -0.18��� -0.04
(0.089) (0.052) (0.086)
Sex of household head -0.04 -0.09 0.06
(0.122) (0.073) (0.075)
Credit-constrained household 0.03 -0.12��� 0.14���
(0.069) (0.035) (0.053)
Farmer has confidence in the skill of extension officers -0.08 0.11��� -0.05
(0.059) (0.033) (0.045)
Ln(Distance from residence to input shop) 0.12 0.03 0.00
(0.082) (0.038) (0.059)
Ln(Distance from residence to extension office) -0.19 -0.03 0.02
(0.151) (0.096) (0.104)
Ln(Distance from residence to main market) -0.15 -0.03 0.05
(0.151) (0.080) (0.134)
Plot tenure 0.22�� -0.08 0.05
(0.095) (0.051) (0.065)
Medium slope -0.63 -0.33� -0.68���
(0.412) (0.171) (0.252)
Steep slope 0.32��� 0.03 -0.12�
(0.109) (0.053) (0.071)
Low soil fertility plot 0.24 0.04 0.07
(0.182) (0.103) (0.134)
Medium soil fertility plot -0.02 0.03 -0.18
(0.238) (0.125) (0.117)
Medium depth plot -0.08 0.04 -0.12
(0.238) (0.124) (0.133)
(Continued)
Women’s empowerment in agriculture and agricultural productivity
PLOS ONE | https://doi.org/10.1371/journal.pone.0197995 May 31, 2018 21 / 27

and partly to prevailing gender norms—may not only prevent them from accessing traditional
markets to hire additional labour but could also make it more difficult for them to supervise
any workers they did manage to hire.
5. Conclusion and policy implications
Women’s empowerment is widely perceived to be a key factor in closing gender gaps in agri-
cultural productivity. In this paper, we explore the relationship between women’s empower-
ment in agriculture—measured using indicators derived from the A-WEAI—and maize
productivity, using smallholder maize farmers in western Kenya as a case study. Controlling
for potential endogeneity, we find that women’s empowerment leads to increased maize
Table 8. (Continued)
Variables Female-managed plots Male- managed plots Jointly- managed plots
Deep depth plot -0.29�� -0.37��� -0.14�
(0.115) (0.059) (0.075)
Sub-region dummy 4.64��� 5.66��� 5.93���
Constant (0.436) (0.281) (0.437)
R-squared 0.48 0.27 0.36
Observations 247 962 460
Note: Bootstrapped standard errors in parentheses.
� p<0.1,
�� p<0.05,
��� p<0.01.
https://doi.org/10.1371/journal.pone.0197995.t008
Table 9. Selected attributes of plots managed by females only, males only and jointly by males and females.
Variable Female-managed plots Male-managed plots Jointly-managed plots
Mean Standard deviation Mean Standard deviation Mean Standard deviation
Plot-level attributes
Size of plot
(acres)
0.606 0.616 0.585 0.716 0.753 0.802
High soil fertility plot
(1 = yes, 0 = no)
0.380 0.485 0.463 0.499 0.398 0.490
Medium soil fertility plot
(1 = yes, 0 = no)
0.514 0.500 0.481 0.500 0.533 0.499
Low soil fertility plot
(1 = yes, 0 = no)
0.109 0.313 0.056 0.230 0.070 0.255
Plot management practices
Grain legume intercrops
(1 = yes, 0 = no)
0.429 0.496 0.421 0.494 0.422 0.494
Fertilisers applied
(1 = yes, 0 = no)
0.765 0.425 0.791 0.407 0.767 0.423
Quantity of fertiliser used
(kg/acre)
56.44 67.97 59.06 69.02 56.03 36.019
Planted improved maize seed 0.648 0.479 0.626 0.484 0.670 0.471
Total labour use
(person-days/acre)
49.90 48.15 81.44 69.94 87.94 72.56
Head of household is male 0.850 0.358 0.619 0.486 0.998 0.047
Number of observations 247 962 460
https://doi.org/10.1371/journal.pone.0197995.t009
Women’s empowerment in agriculture and agricultural productivity
PLOS ONE | https://doi.org/10.1371/journal.pone.0197995 May 31, 2018 22 / 27

productivity, with the greatest gains derived from increases in women’s participation in deci-
sion-making on agricultural production.
Extending our analysis, we find evidence of heterogeneity in the effects of women’s empow-
erment on maize yields, namely that female- and male-managed plots experience significant
improvements in yield. The effects of women’s empowerment on maize yields are insignificant
for jointly-managed plots. Hence, our findings provide an important piece of evidence show-
ing that women’s empowerment may contribute to closing the gender productivity gap.
We contribute to the gender and agriculture literature on two fronts. First, we provide
direct evidence that women’s empowerment can contribute to closing the gender gap in agri-
cultural productivity that has been widely observed in SSA [12, 66], and more generally, that
improvements in women’s bargaining position may lead to more optimal allocations of the
household’s productive resources, evidenced by higher productivity. Second, we illustrate how
failing to correctly account for the bounded nature of the empowerment score may lead to
overestimating the true impact of women’s empowerment on agricultural productivity. Fur-
thermore, we demonstrate how to correct for this feature of the WEAI using various econo-
metric procedures.
Our results also offer encouragement with respect to the effectiveness of policies and
strategic interventions aimed at stimulating increased agricultural productivity in Kenya
through women’s empowerment. Although we find that having the power to make important
decisions about agricultural production to be the most important driver of maize productiv-
ity among the six indicators of women’s empowerment we tested, all except for the workloadindicator had a significant effect on maize productivity. This speaks to the wide range of
ways in which women’s empowerment impacts positively on agricultural productivity and
suggests a great scope of possible interventions, ranging from financial inclusion mecha-
nisms such as digital savings accounts, affordable mobile-money-based credit schemes and
asset-building mechanisms, to programmes facilitating the formation of strong community
associations for women.
In conclusion, while our study points towards women’s empowerment having a positive
effect on maize yield, the cross-sectional nature of our data does not support an examination
of the dynamic impacts associated with women’s empowerment and maize yield. Furthermore,
our data are not nationally representative and, thus, may not reflect women’s empowerment
status across Kenya. More research, using nationally representative and repeated data from
Kenya and elsewhere in SSA, is needed to fully understand the relationship between women’s
empowerment and maize yield.
Supporting information
S1 Genderdata.
(DTA)
Acknowledgments
We acknowledge core funding to the International Centre of Insect Physiology and Ecology
(icipe) provided by UK’s Department for International Development (DFID), the Swedish
International Development Cooperation Agency (Sida), the Swiss Agency for Development
and Cooperation (SDC), the German Federal Ministry for Economic Cooperation and Devel-
opment (BMZ), and the Kenyan Government. The work on push—pull technology is funded
primarily by the European Union, with additional support from the Biovision Foundation
and the UK Government’s Department for International Development (DFID). We also thank
Women’s empowerment in agriculture and agricultural productivity
PLOS ONE | https://doi.org/10.1371/journal.pone.0197995 May 31, 2018 23 / 27

Emily Kimathi for producing study area map and Sandie Fitchat for language editing. The
views expressed herein do not necessarily reflect the official opinion of the donors or icipe.
Author Contributions
Conceptualization: Gracious M. Diiro, Greg Seymour, Menale Kassie.
Data curation: Gracious M. Diiro, Menale Kassie, Geoffrey Muricho.
Formal analysis: Gracious M. Diiro.
Investigation: Gracious M. Diiro, Menale Kassie.
Methodology: Gracious M. Diiro, Menale Kassie.
Project administration: Gracious M. Diiro.
Software: Gracious M. Diiro.
Supervision: Menale Kassie.
Visualization: Gracious M. Diiro, Greg Seymour, Menale Kassie, Geoffrey Muricho, Beatrice
Wambui Muriithi.
Writing – original draft: Gracious M. Diiro.
Writing – review & editing: Gracious M. Diiro, Greg Seymour, Menale Kassie, Geoffrey Mur-
icho, Beatrice Wambui Muriithi.
References1. FAO/Food and Agriculture Organization. The state of food and agriculture 2010–2011. Women in agri-
culture: Closing the gender gap for development. Rome: FAO; 2011.
2. Folbre N. The care economy in Africa: Subsistence production and unpaid care. Journal of African
Economies 2013; 23(1):i128–i156.
3. Jacoby HG. 1995. The economics of polygyny in sub-Saharan Africa: Female productivity and the
demand for wives in Cote d’Ivoire. Journal of Political Economy 1995; 103 (5):938–71.
4. Ahearn MC, Tempelman D. Gender issues in agricultural and rural household well-being. Paper pre-
sented at the Third Global Conference on Agricultural and Rural Household Statistics, 24–25 May 2010,
Washington, DC.
5. World Bank. Levelling the field: Improving opportunities for women farmers in Africa. Washington, DC:
World Bank; 2014.
6. Zereyesus YA. Women’s empowerment in agriculture and household level health in northern Ghana: A
capability approach. Journal of International Development 2017; 29:899–918.
7. Aguilar A, Carranza E, Goldstein M, Kilic T, Oseni G. Decomposition of gender differentials in agricul-
tural productivity in Ethiopia. Agricultural Economics 2015; 46(3):311–34.
8. Doss C, Michael R, Morris L. How does gender affect the adoption of agricultural innovations? Agricul-
tural Economics 2002; 25(1):27–39.
9. Gilbert RA, Sakala WD, Benson TD. Gender analysis of a nationwide cropping system trial survey in
Malawi. African Studies Quarterly 2002; 6(1):223–43.
10. Kassie M, Ndiritu SW, Stage J. What determines gender inequality in household food security in
Kenya? Application of exogenous switching regression. World Development 2014; 56:153–71.
11. Kassie M, Stage J, Teklewold H, Erenstein O. Gendered food security in rural Malawi: Why is women’s
food security status lower? Food Security 2015; 7:1299–320.
12. Kilic T, Palacios-Lopez A, Goldstein M. Caught in a productivity trap: A distributional perspective on
gender differences in Malawian agriculture. World Development 2015; 70:416–63.
13. Oseni G, Corral P, Goldstein M, Winters PC. Explaining gender differentials in agricultural production in
Nigeria. Agricultural Economics 2015; 46(3):285–310.
14. Quisumbing AR, Meinzen-Dick R, Raney TL, Croppenstedt A, Behrman JA, Peterman A. (Eds). Closing
the knowledge gap on gender in agriculture. Springer; 2014:3–27.
Women’s empowerment in agriculture and agricultural productivity
PLOS ONE | https://doi.org/10.1371/journal.pone.0197995 May 31, 2018 24 / 27

15. Slavchevska V. Gender differences in agricultural productivity: The case of Tanzania. Agricultural Eco-
nomics 2015; 46(3):335–55.
16. Tiruneh A, Tesfaye T, Mwangi W, Verkuijl H. Gender differentials in agricultural production and deci-
sion-making among smallholders in Ada, Lume, and Gimbichu Woredas of the Central Highlands of
Ethiopia. El Batan: International Maize and Wheat Improvement Center (CIMMYT); 2001.
17. Kameri-Mbote P. The land has its owners! Gender issues in land tenure under customary law in Kenya.
IELRC Working Paper. 2005–9. http://www.ielrc.org/content/w0509.pdf.
18. Manda DK, Mwakubo S. Gender and economic development in Africa: An overview. Journal of African
Economies 2014; 23(1):i4–i17.
19. Odeny M. Improving Access to Land and strengthening Women’s land rights in Africa Annual World
Bank Conference on Land and Poverty, Washington, DC, April 8–11. 2013.
20. Ending Rural Hunger, 2016 Database.
21. FIDA/Federation of Women Lawyers Kenya. Women’s land and property rights in Kenya: Promoting
gender equality. Washington DC:Kenya and International Women’s Human Rights Clinic at George-
town University Law Center; 2009.
22. Ellis A, Manuel C, Blackden C M. Gender and Economic Growth in Uganda: Unleashing the Power of
Women. The International Bank for Reconstruction and Development/THE WORLD BANK 1818 H
Street, NWWashington, DC 20433 USA.IRE. 2005.
23. Kameri-Mbote P. Women, land rights and the environment: The Kenyan experience. Development
2006; 49(3):43–8.
24. Wekwete NN. Gender and economic empowerment in Africa: Evidence and policy. Journal of African
Economies 2013; 23(1):i87–i127.
25. Fischer E, Qaim M. Gender, agricultural commercialization, and collective action in Kenya. Food Secu-
rity 2012; 4(3):441–53.
26. Heyer A. The gender of wealth: Markets and power in central Kenya. Review of African Political Econ-
omy 2006; 107:67–80.
27. Farnworth CR, Colverson KE. Building a gender-transformative extension and advisory facilitation sys-
tem in sub-Saharan Africa. Journal of Gender, Agriculture and Food Security 2015; 1(1):20–39.
28. Alkire S, Meinzen-Dick R, Peterman A, Quisumbing AR, Seymour G, Vaz A. The Women’s Empower-
ment in Agriculture Index. World Development 2013; 52:71–91.
29. Doss C. The effects of intrahousehold property ownership on expenditure patterns in Ghana. Journal of
African Economies 2006; 15(1):149–80.
30. Duflo E, Udry C. Intrahousehold resource allocation in Cote d’Ivoire: Social norms, separate accounts,
and consumption choices. No. w10498. Cambridge, MA: National Bureau of Economic Research;
2004.
31. Seebens H. Intra-household bargaining, gender roles in agriculture and how to promote welfare
enhancing changes. ESA Working Paper No. 11–10. ESA Working Paper 11–10, Agricultural Develop-
ment Economics Division, Food and Agriculture Organization of the United Nations. 2011
32. Adato M, De la Brière B, Mindek D, Quisumbing A. The impact of PROGRESA on women’s status and
intrahousehold relations. Washington, DC: International Food Policy Research Institute; 2000.
33. Ross KL, Zereyesus YA, Shanoyan A, Amanor-Boadu V. 2015. The health effects of women’) empow-
erment: Recent evidence from northern Ghana. International Food and Agribusiness Management
Review 2015; 18(1):127–44.
34. Smith LC, Ramakrishnan U, Ndiaye A, Haddad L, Martorell R. The importance of women’s status for
child nutrition in developing countries. IFPRI Research Report 3. Washington, DC: International Food
Policy Research Institute; 2003.
35. Akpan NS. Women and rural development in Nigeria: Some critical issues for policy consideration.
Social Sciences 2015; 4(5):110–8.
36. Doss C. Collecting sex disaggregated data to improve development policies. Journal of African Econo-
mies 2013; 23(1):i62–i86.
37. Seguino S, Were M. Gender, development and economic growth in sub-Saharan Africa. Journal of Afri-
can Economies 2013; 23(1):i18–i61.
38. Malapit HJ, Sproule K, Kovarik C, Quisumbing A, Meinzen-Dick R, Pinkstaff C. The Abbreviated Wom-
en’s Empowerment in Agriculture Index (A-WEAI). IFPRI Discussion Paper. 1647. Washington, DC:
International Food Policy Research Institute.2017
39. Malapit HJL, Quisumbing AR. What dimensions of women’s empowerment in agriculture matter for
nutrition in Ghana? Food Policy 2015; 52:54–63.
Women’s empowerment in agriculture and agricultural productivity
PLOS ONE | https://doi.org/10.1371/journal.pone.0197995 May 31, 2018 25 / 27

40. Malapit HJL, Kadiyala S, Quisumbing AR, Cunningham K, Tyagi P. Women’s empowerment mitigates
the negative effects of low production diversity on maternal and child nutrition in Nepal. The Journal of
Development Studies 2015; 51(8):1097–123.
41. Sraboni E, Malapit HJ, Quisumbing A, Ahmed A. Women’s empowerment in agriculture: What role for
food security in Bangladesh? World Development 2014; 61:11–52.
42. Seymour G. Women’s empowerment in agriculture: Implications for technical efficiency in rural Bangla-
desh. Agricultural Economics 2017; advance online publication.
43. Karamba WR, Winters PC. Gender and agricultural productivity: Implications of the Farm Input Subsidy
Program in Malawi. Agricultural Economics 2015; 46:357–74.
44. Kilic T, Palacios-Lopez A, Goldstein M. Caught in a productivity trap: A distributional perspective on
gender differences in Malawian agriculture. World Development 2015; 70:416–63.
45. Peterman A, Behrman J, Quisumbing A. A review of empirical evidence on gender differences in non-
land agricultural inputs, technology, and services in developing countries. IFPRI Discussion Paper 975.
Washington, DC: International Food Policy Research Institute; 2010.
46. Udry C, Hoddinott J, Alderman H, Haddad L. Gender differentials in farm productivity: Implications for
household efficiency and agricultural policy. Food Policy 1995; 20(5):407–23.
47. Browning M, Chiappori PA. Efficient intra-household allocations: A general characterization and empiri-
cal tests. Econometrica 1998; 66(6):1241–78.
48. McElroy M, Horney MJ. Nash-bargained household decisions: Toward a generalization of the theory of
demand. International Economic Review 1981; 22:333–47.
49. Hoddinott J, Haddad LJ. Does female income share influence household expenditures? Evidence from
Cote d’Ivoire. Oxford Bulletin of Economics and Statistics 1995; 57(1):77–96.
50. Quisumbing AR, Maluccio JA. Resources at marriage and intrahousehold allocation: Evidence from
Bangladesh, Ethiopia, Indonesia, and South Africa. Oxford Bulletin of Economics and Statistics, 2003;
65(3):283–327.
51. Thomas D. Intra-household resource allocation: An inferential approach. Journal of Human Resources
1990; 25(4):635–64.
52. Becker GS. A theory of the allocation of time. The Economic Journal 1965; 75(299):493–517.
53. Houston JE, Huguley H. The role of nutrition and women’s empowerment in human capital develop-
ment. Journal of Food Distribution Research, 2014; 45(1):35–40
54. McPeak JG, Doss CR. Are household production decisions cooperative? Evidence on pastoral migra-
tion and milk sales from northern Kenya. American Journal of Agricultural Economics 2006; 88(3):525–
41.
55. Doss C. Women’s bargaining power in household economic decisions: Evidence from Ghana. Staff
Paper Series No. P96-11. Department of Applied Economics, College of Agricultural, Food, and Envi-
ronmental Sciences, University of Minnesota; 1996.
56. Quisumbing AR. Intergenerational transfers in Philippine rice villages: Gender differences in traditional
inheritance customs. Journal of Development Economics 1994; 43(2):167–95. PMID: 12318545
57. Thomas D, Contreras D, Frankenberg E. Child health and the distribution of household resources at
marriage [Mimeo]. Santa Monica, CA: RAND; 1997.
58. Khan ZR, Midega CA, Pittchar JO, Murage AW, Birkett MA, Bruce TJ, Pickett JA. Achieving food secu-
rity for one million sub-Saharan African poor through push—pull innovation by 2020. Philosophical
Transactions of the Royal Society of London B: Biological Sciences 2014; 369(1639).
59. Wooldridge J. Econometric analysis of cross section and panel data. Cambridge, MA: MIT Press;
2002.
60. Papke LE, Wooldridge JM. Econometric methods for fractional response variables with an application
to 401(k) plan participation rates. Journal of Applied Econometrics 1996; 11(6): 619–632.
61. Papke LE, Wooldridge JM. Panel data methods for fractional response variables with an application to
test pass rates. Journal of Econometrics 2008; 145(1–2):121–33.
62. Ramsey JB. Tests for specification errors in classical linear least squares regression analysis. Journal
of the Royal Statistical Society, Series B 1969; 31:350–71.
63. Malapit HJL, Sproule K, Kovarik C, Meinzen-Dick R, Quisumbing AR, Rama F, et al. Measuring prog-
ress toward empowerment—Women’s Empowerment in Agriculture Index: Baseline Report. Washing-
ton, DC/Oxford: United States Agency for International Development, International Food Policy
Research Institute, Poverty and Human Development Initiative; 2014.
64. FAO. Food Security Statistics. Rome, Italy: FAO, 2018 http://www.fao.org/economic/ess/ess-fs/en/
Women’s empowerment in agriculture and agricultural productivity
PLOS ONE | https://doi.org/10.1371/journal.pone.0197995 May 31, 2018 26 / 27

65. Quisumbing AR. Male—female differences in agricultural productivity: Methodological issues and
empirical evidence. World Development 1996; 24(10):1579–95.
66. Alene AD, Manyong VM, Omanya GO, Mignouna HD, Bokanga M, Odhiambo GD. Economic efficiency
and supply response of women as farm managers: Comparative evidence from western Kenya. World
Development 2008; 36(7)1247–60.
Women’s empowerment in agriculture and agricultural productivity
PLOS ONE | https://doi.org/10.1371/journal.pone.0197995 May 31, 2018 27 / 27