Microtubule-mediated Src Tyrosine Kinase Trafficking in Neuronal Growth Cones
Upload
independentCategory
view
4download
0
Evidence From Human Electroretinogram A and OffResponses That Color Processing Occurs in the Cones
W. Spileers,* F. Falcao-Reis,^ C. Hogg, and G. B. Arden
Purpose. To investigate two apparent anomalies of the human electroretinogram: the "on" and"off' components of the cone based PHI are unequally sized, and transitions from red togreen, which are electroretinographically silent, yield reverse transitions (green to red) inwhich a-waves develop.
Methods. Ganzfeld electroretinograms were obtained with intense 100 msec flickering flashesfrom red and green light-emitting diodes. Such stimuli light-adapt the retina, and the re-sponses are caused by the excitation of long and medium wavelength cones.
Results. In the 10-20 msec after the beginning of a Hash (black to green or black to red) thebeginning of rapid receptor-generated a-wave is seen. Ten to twenty milliseconds after the endof the flash, the beginning of a rapid positive-going off response, also derived from receptorscan be seen. If the retina is stimulated by the abrupt change from one wavelength of light toanother (eg, from "green" to "red"), at times > 20 msec after the change there are always slowchanges in potential (presumably caused by postsynaptic activity) regardless of the relativeintensities of red and green. However, if the two light intensities are adjusted appropriately,10-20 msec after the transition from green to red no electroretinographic a-wave (or offresponse) develops—the transition is "silent." When the transition reverses (changes backfrom red to green), an a-wave occurs. In the same way if a red-to-green transition is made silentby altering the relative light intensities, the green-to-red reversal evokes an a-wave. This occursfor numerous pairs of red and green intensities. Rod intrusion or minor electroretinogramcomponents do not explain this result. The relative red:green intensity in two color-anomaloussubjects is different to that in three normal subjects. The rule for a silent transition is that thedecrease in excitation in one cone type should be twice the increase in excitation in the secondcone type.
Conclusions. The most likely cause is a reduction in the amplitude of cone receptor potentials20-50 msec after the onset of the stimulus, caused by a sign-reversing feedback mechanismsuch as that described in amphibians. This implies that the chromatic signals for color visionrequired by theorists are partly generated in the cones. Invest Ophthalmol Vis Sci1993;34:2079-2091.
From the Electrodiagnostic Department, Moorfields Eye Hospital, and institute ofOphthalmology, London, United Kingdom, the * Department of Ophthalmology,UZ Sinl Rafael, KU Unmen, Leuven, Belgium, and the -[Department ofOphthalmology, Oporto Medical School, Oporto, Portugal.Supported in part by The National RP Society Fighting Blindness Inc.Submitted for publication: December 3, 1991; accepted July 16, 1992.Proprietary Interest Categoiy: NReprint requests: G. li. Arden, Electrodiagnoslic Department, Moorfields EyeHospital, City Road, London, ECIV2PD, UK.
An our previous report,1 a description was given of thehuman electroretinograms (ERG) evoked by a Ganz-feld stimulator, powered by light emitting diodes(LED). Such sources can produce prolonged intenseflashes, and the responses contain large a-waves andpositive-going rapid off responses. The latter are gen-erated as a result of the activity of cones: the evidence
Investigative Ophthalmology & Visual Science, May 1993, Vol. 34, No. 6Copyright © Association for Research in Vision and Ophthalmology 2079

2080 Investigative Ophthalmology & Visual Science, May 1993, Vol. 34, No. 6
for this rests (in humans) on the spectral effectivenessof various wavelengths in eliciting either flicker or offresponses,23 or, in the case of LED, which can only beused at two fixed wavelengths, in the separation ofcone from rod responses by progressively light-adapt-ing the retina by altering the flash duration, interflashinterval and intensity.1 The a-wave of the ERG can begenerated by both rods and cones, but prolongedflashes, delivered as a slow flicker, light-adapt the ret-ina so greatly that the a-waves also are evoked solelyfrom cones. Furthermore, the initial part of the a-waveand the off response is believed to be generated by thereceptors and not by postsynaptic activity. This wasdemonstrated in humans for rod a-waves45 and forcones has generally been accepted as a result of exper-iments on the primate with penetrating microelectrodesand current source density and principal componentanalysis,6"8 which confirmed earlier accounts9"11 ofthe common genesis of the a- and off responses. The invitro responses of single isolated primate cones havebeen described in detail elsewhere.12"13 The mem-brane current changes caused by light affect the inter-nal ionic composition and thus the transduction pro-cesses themselves. This feedback leads to complex re-sponse waveforms, but the entire process is linear inthat increments and decrements of light producechanges in outer limb dark current, which are oppo-site in sign, but similar in magnitude. Such experi-ments provide a basis for interpreting the human ERGa-wave and off responses.
Although in recordings from single cells or by ex-tracellular microelectrodes located within focally illu-minated light-adapted primate retina, the a-wave andoff response are nearly mirror images of one an-other.2"36"13 In the human corneal ERG it was foundin a previous paper1 that even for the earliest changescaused by light, both the amplitude and the rate ofchange of voltage of the a-waves was larger than thecorresponding values for the off responses. In generalterms, this observation implies either that there maybe additional components that contribute to the a- oroff response (or to both), or else that the cone recep-tor response declines during a prolonged stimulus.This problem is further investigated here, which how-ever is concerned not with prolonged flashes superim-posed on a dark background, but with the ERG evokedby the change from one wavelength of light to an-other, and the intensities under which these changesevoked no rapid voltage changes.
The responses of the eye to changes in the wave-length of stimulating light have been investigatedmany times, usually to measure spectral sensitivity. Ifthe b-wave is used as an index, the spectral sensitivitymay show complexities, which may reflect postsynapticinteractions.14"16 These are absent if the index is thea-wave, isolated by slow sinusoidal flicker.2 Such ex-
periments have been used as an evidence that the a-wave is evoked by receptors. In psychophysical experi-ments the method of "silent substitution" has beenemployed to analyze the effect of change in wave-length. The underlying idea is that when the wave-length of light falling on a photoreceptor is changedabruptly, the intensity may also be modified so that nochange in excitation occurs (see 17 for a review). Silentsubstitution occurs trivially if only one receptor type(eg, rods) is present, but is of interest when severaltypes of receptor are stimulated at one time. In almostall experimental work, complete silent substitutioncannot be realized. In experiments on the ERG, withintense flickering light, rod responses are reduced to apoint where they can be neglected even when theflicker has 100% contrast and a 50% duty cycle.l There-fore, when, as in the experiments below, color shiftsare the effective stimulus, the luminance contrast isstill less than in the study by Spileers1 and it is mostunlikely that rod-generated responses could be de-tected. Thus color shift ERG are generated by the dif-ferential excitation of the two common classes of cone,long wavelength and medium wavelength (LW andMW). In mass recordings from many photoreceptors,a condition may be obtained in which a change of wave-length and light intensity is arranged in such a way thatthe increase in the electrical response of one class ofcone matches the decreased electrical response in theother class so the transition is "silent.". However,there may still be responses in neurons further "up-stream," because no allowance has been made for sub-sequent chromatic data processing. Only two accountshave appeared in which the electroretinogram (ERG)has been used as an index in experiments on "silentsubstitution."1819 In both, it was found impossible toobtain a "color shift" without evoking some ERG (andthe current results confirm these findings), but at thetime of those experiments, the contribution of thephotoreceptors to the ERG was not fully understood.Accordingly, there have been no prior attempts to an-alyze cone receptor potentials in humans by silent sub-stitution. Our experiments are limited to the voltagechanges that occur in the 10-20 msec following achange in stimulus. Both logic and the experimentalresults just cited indicate that the earliest voltagechanges in the ERG we record can be ascribed withsome confidence to the cones themselves. The laterelectrical responses in the ERG reflect other stages inprocessing, and are more difficult to analyze: thus ourresults need not be related to work on flicker ERG athigher repetition rates.14"16'20 The simplest explana-tion of our findings is that soon after the onset of thecone receptor potential its amplitude is diminished byapproximately one half and this reduction continuesunchanged until after the offset of the stimulus. Be-fore such a conclusion can be accepted, it is necessary

Silent Substitution in Human ERG 2081
to demonstrate the possibility of making measure-ments on the small ERGs evoked by color shift, and toperform control experiments to demonstrate that rodcurrents or minor components of the ERG are notinfluencing the recordings, as described in Results.
METHODS
Photostimulator
For our experiments, we used the equipment de-scribed in detail elsewhere.1 The stimulator consistedof a segment cut from a plastic dome 4.5 inches indiameter, subtending over 160 degrees of visual angleand lined with 368 LED placed as closely together aspossible. The construction automatically ensured thatall the LEDs pointed toward the center of the dome,which could be made the anterior nodal point of thesubject's eye. This in practice ensured a "Ganzfeld"stimulus,1 and the LED, of a type chosen for maximumlight output (Stanley "superbright"), produced suffi-cient retinal illumination to strongly light-adapt thesubjects' eyes and to evoke very large ERG. The LEDwere connected in series-parallel configurations.They were driven by simple pulse generators. The lightintensity was continuously variable, controlled by a 10-turn potentiometer. The light intensity in the pupilplane, varied from 0 to 14,000 mW«m~2 for greenlight, (550 ± 5 nm light, and 85,000 mW • m"2 red, 660± 5 nm (to half power).
Calibrations and Calculation of Effective Light Inten-sities: A calibrated radiometer (Tektronix J16 [Tek-tronix, Beaverton, OR]) photodiode was placed in theposition the subject's pupil occupied during the ex-periments.1 To determine the rate of change of light,and the duration of brief pulses, a rapidly acting pho-todiode was placed in the position of the subject's pu-pil, and connected to an amplifier and oscilloscope(system band pass > 10 MHz). The light output toprolonged flashes was maintained without any initialtransient overshoot. When the intensities were ad-justed appropriately, transitions from green to redlight could be achieved without any transient changeof photocell output being visible. The flash intensitieswere calculated as previously described1 in terms ofquanta incident per unit area of retina. In brief, tocalculate the effectiveness of the LED light in stimulat-ing long wavelength and medium wavelength cones,we assumed that the relative spectral distribution oflight in the LED is as specified by the makers, and thatthe spectral variation of absorption of light in LW andMW cones is as described by other researchers.122122
(We have used both sets of data in the calculations, andbecause they are very similar, the choice of data setdoes not influence the result.) We further followSmith and Pokorny (1972 and 1975)21-22 and assume
TABLE i. Relative Quanta Absorbed by MWCand LWC for Equal Energy Outputs of Redand Green LEDs (No Significant Bleaching)
Green L
0.561
MWC
.ED
1
Red LED
0.0103
LWC
Green LED
1.00
Red LED
0.1543
that the relative peak-height of the Pokorny funda-mentals given (red:green = 2:1) represents the ratio inthe numbers of the LW and MW cones in the humanperiphery, and a similar correction can be applied tothe research by Baylor et al.12 Then the relative num-bers of quanta absorbed in LW and MW cones forequal energy outputs of the green and red LED can becalculated, as follows: a quantum correction is made tothe relative spectral energy output of the LED, and thevalue at each wavelength is multiplied by the relativeamplitude of the relative sensitivity of the appropriatecone mechanism at that wavelength. The resulting val-ues are totaled for wavelengths from 510 to 710 nm, atintervals of 10 nm. The result is shown in Table 1.Further details of the calculations are given in the Ap-pendix to the article by Spileers.1
Subjects: The experiments were performed onthree subjects without color vision abnormality, andalso on two subjects with deuteranomalous trichro-masy. The procedures were carried out in compliancewith the local ethical requirements, which include ob-taining informed consent and the tenets of the Decla-ration of Helsinki.
Recording Techniques: ERG were obtained with pu-pils dilated by tropicamide 1%. The corneal electrodewas a gold foil, and Ag-AgCl earth and reference elec-trodes were placed on the forehead and ipsilateral tem-ple. Recordings were made using a clinical evoked po-tential system (M60, Medelec, Woking, Surrey, UK).Between 100 and 200 responses were averaged toachieve a high signal to noise ratio. Responses wereelicited in pseudorandom, predefined sequences.
RESULTS
Figure 1 shows responses evoked by red-green andgreen-red transitions. The trace begins where a redlight step ends and a green light step begins. Onehundred milliseconds later, the colors reverse, and thered light reappears as the green is extinguished. Theonset of the highest green intensity, bottom trace,1100 mW«m"2, left side of record, evokes a cornea-negative on response, followed by a brief cornea-posi-tive deflection. In preliminary experiments the inten-sity of either the red or green epochs was still furtherreduced to make sure that the on responses shown in

2082 Investigative Ophthalmology & Visual Science, May 1993, Vol. 34, No. 6
1 Trigger 100msec 50msec
Red
Green
Intensity (mW/m 2)
Green Red
100 5650
195 5650
300 5650
1100 5650
50msec
FIGURE l. Responses to alternating red and green light stepsare shown for different intensities of green light. In the firsthalf of the trace, row 4, there is a downward, negative-goinga-wave showing that the increase in receptor potentialcaused by the green light stimulus is larger that the simulta-neous decrease in receptor response caused by the end ofthe red step. In row 1, the green light is weaker, so at thebeginning of the trace the positive off response to red can beseen. In the second half of the traces, the reverse transitionsoccur, causing (row 4) a positive-going off response, and(row 1) a negative a-wave. Note in row 2, there is electricalsilence soon after the red to green transition, and in row 3,there is silence (second half of trace) at the green to redtransition. The hatching shows the window in which measure-ments were made. Light intensity measurements made in thepupil plane.
Figure 1 progressively increased in amplitude to be-come waveforms such as those commonly observed forbright flashes on a zero background (see illustrationsin ') Thus, this part of the record in Figure 1 shows thewell-known a- and b-waves of the photopic ERG. Asstated before, this article is only concerned with theinitial changes, 10-20 msec after the stimuluschanges. This time interval is shown in the figures byhatching. In the upper trace, the intensity of the greenlight step has been reduced (100 niW-m"2) and theinitial response inverts (becomes cornea positive-go-ing). From the previous results1 we know this repre-sents an off response. The third trace with an interme-diate green light intensity (300 mW • m~2) shows a con-siderably smaller a-wave, and 195 mW-nf2 thechange in voltage between 10 and 20 msec after thetrigger is approximately zero.
At times >20, <110 msec after green-on, thereare no pairs of lights that when interchanged lead to avoltage null, but at such times complex activity, driven
by postsynaptic events, must certainly occur and analy-sis of that fraction of the ERG (which is what has beenattempted in experiments on flicker and the ERG) isbeyond the scope of this article.
At the end of the green step (after 100 msec) thered light is turned on, and the green is turned off.These changes both occur during a period too brief tobe measured precisely (see Methods). The top trace ofFigure 1 shows a prominent a-wave and b-wave (onresponse) associated with the green-to-red transition.Increasing the green intensity (second trace, green in-tensity 195 rnW-m"2) first decreases the a-wave andwith still further increase (bottom trace) the responseto the green-red transition becomes a prominent offresponse.
It can be seen that the time window chosen is ap-propriate for making measurements that describe anearly voltage null. For all these traces shown the aver-ager was triggered at the red-green transition, and wedid control experiments to prove the waveforms re-corded were unaffected by changing the trigger pointto the green-red transition.
Figure 2A and B shows a series of recordingswhere the intensity of either the red-light step or thegreen light was increased, while keeping the other stim-ulus constant. In Figure 2A, top trace, the red lightwas weakest (1900 mW • m~2). The transition from redto green at the beginning of the trace evokes an a-wave: the green light is stronger than the red, in termsof evoking a-waves. Increasing red intensity (lowesttrace) changes the response at the first transition to anoff response: now, the red is more effective than thegreen. The intermediate setting (center trace) presentsan almost silent (zero amplitude) ERG in the period10-20 msec. It is immediately obvious that at the re-verse transition (green to red) shown at the right of thecenter trace, a quite different response is seen: at thisintermediate setting of red light there is a prominenta-wave. A null can be achieved for the green to redtransition, if the relative light intensities are altered:this is shown in the upper row—the weakest red inten-sity causes a null. Thus, if the relative red and greenlight intensities are adjusted so that at a red-greentransition, the relative excitation of retinal mecha-nisms is unchanged, the relative excitations appear tohave altered 100 msec later, when the green-red tran-sition occurs.
Figure 2B shows responses to three differentgreen light intensities, with a different constant inten-sity of red. The top trace, with the strongest greenlight, produces an a- and b-wave at the red-to-greentransition, and an off response at the green-to-redtransition. For the weakest green light (lowest trace)the situation is reversed, as expected. In between, itappears that a green intensity of 745 mW • m~2 causesan a-wave at both transitions. Figures 1 and 2 show

Silent Substitution in Human ERG 2083
| Trigger 100msec 50msec
Red
Green
Intensity (mW/m
Green Red
120 1900
120 3724
120 14036
| Trigger 100msec
50msec
FIGURE 2. (A) Responses to alternating red and green light steps. The green light intensity isconstant, whereas the red light intensity increases from 1900 to 14036 mW- m~2. Note thatthe silent substitution in the first half of the trace occurs in the middle row. The green-redtransition however nulls in the upper row. (B) Responses to alternating red and green lightsteps. Now the red light intensity is kept constant, while the green light intensity changes.Again it is clear that it is impossible to obtain a silent ERG for both transitions for a single pairof intensities of red and green light. In the center row, there are a-waves at both transitions.Hatching indicates window for measurements.
Red
Green
Intensity(mW/m2)
Green Red
2339 9360
745 9360
232 9360
representative recordings, and provide evidence fromwhich the feasibility of making measurements to de-termine intensities at which "silent substitutions" oc-cur may be judged.
Minor components of the ERG, the proximal neg-ative response, and the m-wave23"25 are vitreous-nega-tive for both "on" and "off." The proximal negativeresponse amplitude is greatest when the stimulus islocalized on the retina. The small degree of inhomo-geneity of retinal illumination normally present in thestimulator might excite a proximal negative response,and account for records such as that seen in Figure 2B,middle row. The experiments represented in Figure 2were therefore repeated with additional diffusersplaced between the LED and the eye. These com-pletely removed any spatial inhomogeneity in the stim-ulus and reduced the absolute intensity. The relativeintensities of red and green were however unchanged.The relative intensities of red and green for silent sub-stitution remained the same, and it remained impossi-ble to obtain a zero voltage change in the 10-20 msecperiod after both transitions (not illustrated).
Experiments with a Rod-Suppressing Background:Red-to-green and green-to-red transitions will not beequivalent if green light preferentially evokes re-sponses with a rod contribution. The reason is that therod receptor potential has a rapid onset but a very slowreturn to the baseline, so off responses are entirelycone generated,3~6l9~n>16'26 and only rod a-waveswould be evoked by the green light. Such an occur-
rence might be thought to explain the asymmetry be-tween green-to-red and red-to-green seen in Figures 1and 2, despite the high light intensities used and the 5Hz rate of reversal. To analyze this point we used asteady rod-suppressing green background, on whichthe transitions were superimposed. The effect of thisbackground is shown in Figure 3A, for isolated flashes.In this experiment note that without a background,the 15 mW-m~2 intensity green light flash evokes aclear slow rod b-wave that is greatly reduced by thebackground. The higher level of green light (400mW* m"2), also evokes a large rod a- and b-wave. Thebackground reduces the amplitude, but leaves a small,fast ERG, characteristic of cone responses.1 Figure 3Bshows red-green transitions, with and without thesame background, and using both weaker andstronger green steps. With the dimmer green stimuli,the background changes the waveform of the re-sponses, but for higher intensities of flickering light,which themselves light-adapt rods and suppress scoto-pic activity, the background has no effect (eg, comparerow 4, Figure 3B, left and right columns). In summary,for higher intensities of flickering light, the ability toobtain "silent substitution" with a single combinationof red and green persists unchanged with a rod-sup-pressing background.
By carefully adjusting the relative intensity of thered and green stimulus it is possible to define a num-ber of conditions in which the transition from red togreen causes a zero change of voltage 10-20 msec

2084 Investigative Ophthalmology & Visual Science, May 1993, Vol. 34, No. 6
^ THE EFFECT OF BACKGROUND ON THE B-WAVE.
Green (ISmW/m2) Green (400mW/m2)
No background
Background
BTHE EFFECT OF BACKGROUND ON THE RED-GREEN TRANSITION.
No background BackgroundIntensity ( m f f / m 2 )
Red Green
3724 120
14036 120
5072 195
5072 387
5072 630
50msec
FIGURE 3. (A) The use of a steady green background removes the rod contribution to theb-wave, leaving a much smaller cone response. Results are shown for two intensities of greenflash (the lower intensity is calculated to be 1.5 log quanta absorbed/rod/flash; the higherintensity, 2.97 log quanta absorbed/rod/flash). The background intensity was equivalent to62 quantal absorptions/rod/sec, flash durations 1 msec. (B) Alternating steps of red andgreen light with and without a background of 73 scotopic Troland. Note that when greenstimulus step is 120 mW • m~2, the background changes the waveforms to a minor extent butsuch changes are in the relatively delayed portions of the response, outside the time windowsconsidered in this article. When the green intensity step is more intense, the effect of abackground is minimal, and does not alter the intensities at which there is electrical silence.R:C nulls occur near G = 195 mW • m~2 and G:R near G = 387 mW • m"2.
after the transition. A slight alteration in the intensityof one or both colored flashes produces a small a- oroff response in the initial portion of the trace. Table 2shows the settings for which silent substitution wasachieved at red:green and green:red transitions. Eachrow consists of a separate experiment in one of thethree normal subjects.
The results confirm that the red:green intensitiesare different for the two transitions. For R:G the ratiois 32.66 ± 12.38, and for G:R 14.19 ± 4.14.
The significance of the result becomes clearer ifthe relative excitation of the MW and LW cones areconsidered separately (see Methods). Table 3A and B,
shows the calculated absorptions at which transitionsfrom red to green, and vice versa, produced no changein the ERG trace, from 10-20 msec after the transi-tion.
There is a large range in the differences of excita-tion of long and medium wavelength cones. However,if the ratio of excitation before and after a transitionfrom red to green is considered, apart from one anom-alous result (starred in Table 3A) there is a fair degreeof consistency. It appears that the condition for novoltage change in the specified period is that LWcones absorptions decrease to one quarter and MWcones absorptions double. This occurs over a large
Silent Substitution in Human ERG 2085
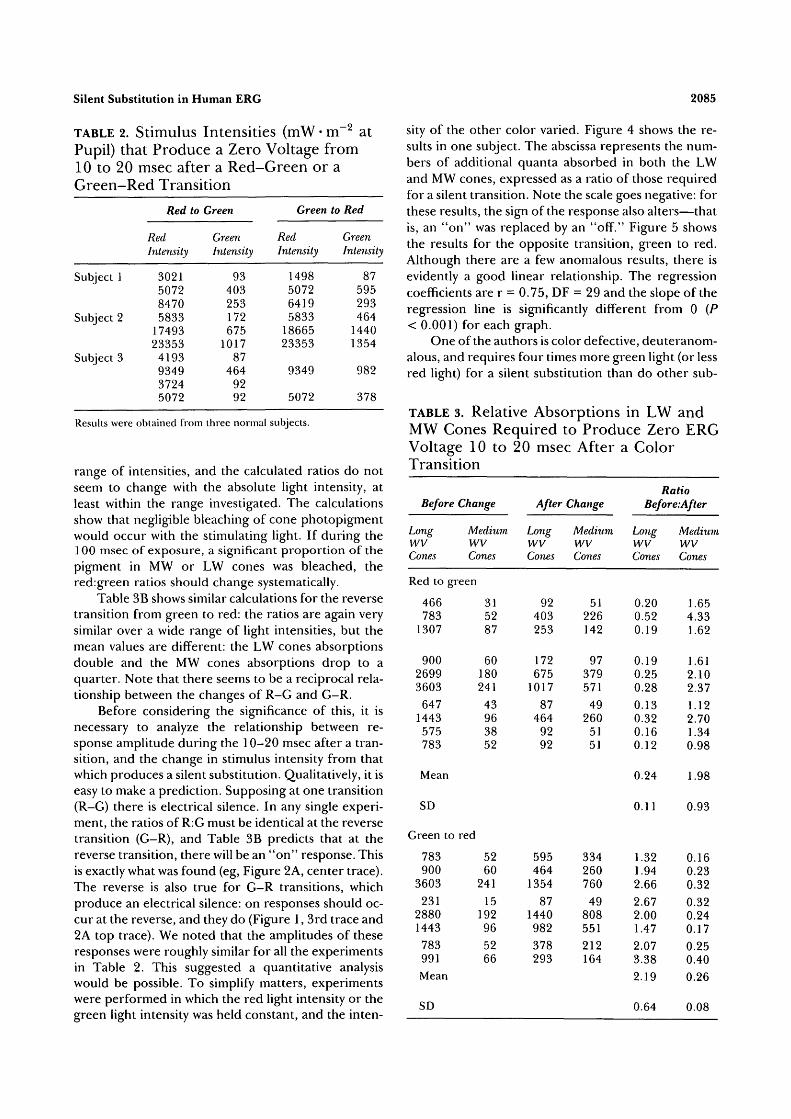
, - 2TABLE 2. Stimulus Intensities (mW • m * atPupil) that Produce a Zero Voltage from10 to 20 msec after a Red-Green or aGreen-Red Transition
Subject 1
Subject 2
Subject 3
Red to
RedIntensity
3021507284705833
1749323353
4193934937245072
Green
GreenIntensity
93403253172675
101787
4649292
Green
RedIntensity
1498507264195833
1866523353
9349
5072
to Red
GreenIntensity
87595293464
14401354
982
378
Results were obtained from three normal subjects.
range of intensities, and the calculated ratios do notseem to change with the absolute light intensity, atleast within the range investigated. The calculationsshow that negligible bleaching of cone photopigmentwould occur with the stimulating light. If during the100 msec of exposure, a significant proportion of thepigment in MW or LW cones was bleached, thered:green ratios should change systematically.
Table 3B shows similar calculations for the reversetransition from green to red: the ratios are again verysimilar over a wide range of light intensities, but themean values are different: the LW cones absorptionsdouble and the MW cones absorptions drop to aquarter. Note that there seems to be a reciprocal rela-tionship between the changes of R-G and G-R.
Before considering the significance of this, it isnecessary to analyze the relationship between re-sponse amplitude during the 10-20 msec after a tran-sition, and the change in stimulus intensity from thatwhich produces a silent substitution. Qualitatively, it iseasy to make a prediction. Supposing at one transition(R-G) there is electrical silence. In any single experi-ment, the ratios of R:G must be identical at the reversetransition (G-R), and Table 3B predicts that at thereverse transition, there will be an "on" response. Thisis exactly what was found (eg, Figure 2A, center trace).The reverse is also true for G-R transitions, whichproduce an electrical silence: on responses should oc-cur at the reverse, and they do (Figure 1, 3rd trace and2A top trace). We noted that the amplitudes of theseresponses were roughly similar for all the experimentsin Table 2. This suggested a quantitative analysiswould be possible. To simplify matters, experimentswere performed in which the red light intensity or thegreen light intensity was held constant, and the inten-
sity of the other color varied. Figure 4 shows the re-sults in one subject. The abscissa represents the num-bers of additional quanta absorbed in both the LWand MW cones, expressed as a ratio of those requiredfor a silent transition. Note the scale goes negative: forthese results, the sign of the response also alters—thatis, an "on" was replaced by an "off." Figure 5 showsthe results for the opposite transition, green to red.Although there are a few anomalous results, there isevidently a good linear relationship. The regressioncoefficients are r = 0.75, DF = 29 and the slope of theregression line is significantly different from 0 (P< 0.001) for each graph.
One of the authors is color defective, deuteranom-alous, and requires four times more green light (or lessred light) for a silent substitution than do other sub-
TABLE 3. Relative Absorptions in LW andMW Cones Required to Produce Zero ERGVoltage 10 to 20 msec After a ColorTransition
Before Change
LongWVCones
MediumWVCones
Red to green
466783
1307
90026993603
6471443
575783
315287
60180241
43963852
After Change
LongWVCones
92403253
172675
1017
87464
9292
MediumWVCones
51226142
97379571
49260
5151
RatioBefore.After
LongWVCones
0.200.520.19
0.190.250.280.130.320.160.12
MediumWVCones
1.654.331.62
1.612.102.371.122.701.340.98
Mean
SD
0.24
0.11
1.98
0.93
Green to783900
3603231
28801443783991Mean
SD
red
5260
24115
192965266
595464
135487
1440982378293
33426076049
808551212164
1.321.942.662.672.001.472.073.382.19
0.64
0.160.230.320.320.240.170.250.400.26
0.08

2086 Investigative Ophthalmology 8c Visual Science, May 1993, Vol. 34, No. 6
o<D(0
OCVI
62OCC
nUlQ~̂1-I jQ.5
GA
!
cc
UJCOzo0 .COUJcczo
UJCOzo0.COUJccLL.1 •
UJ
30
20 -
10 •
-10 -
-20
-
.'" D
D
• D ...
D D U
-0.5 0.5
OFF RESPONSE ON RESPONSE
1.5
FIGURE 4. Relation of ERG voltage 10-20 msec after a transition from green to red tochanges in light intensity. Duration of the steps = 1 0 0 msec. Ordinate: amplitude of ERGresponse; Abscissa: increments or decrements in green light intensity. The units are thedifference in the calculated quantal absorptions by the LW and MW cones at the transition,normalized to the absorptions in LW cones caused by the red flashes. The scale is negativewhen the green light is insufficiently intense to produce a silent substitution, and for all suchpoints, the ordinate value is also negative, indicating that a positive off response occurs. Theline is the best-fit, least-squares method. The results are from one subject, several experi-ments with different intensities of red light.
jects. This phenomenon has been previously reported(see 26 for a review). If this is allowed for, the samerelationship between additional quanta absorbed andERG voltage is seen for this subject, though, becausehe requires more green light, only off responses couldbe obtained within the limits of the instrumentation(Fig. 6A). However, the same type of relationship be-tween change in light intensity and ERG amplitudeoccurs (Fig. 6B). A second person with less severecolor defects gave similar responses to those shown inFigure 6, although in his case, some on responses
could be obtained. It is clear that the relationship be-tween the amplitude of on and off responses andchange in light intensity is similar and linear, over therange investigated: doubling the additional number ofquanta absorbed doubles the amplitude of the re-sponse.
Experiments with flashes of varying duration werecarried out, to discover whether the intensities atwhich voltage changes are zero (from 10-20 msecafter a transition) are affected by the flash duration.Figure 7 shows that alternating red-green and green-
UJCO
oa.toUJcc
o
UlCO
o0 .COU lccLi.
o
10
0
-10
-20
DC
-
-
•D r-ir ~ - c —
nD n
D
Ft]n
a • -D
D
•
-0.5
ON RESPONSE
0.5
OFF RESPONSE
FIGURE 5. Relation of ERG voltage after a transition from red to green (the reverse of Fig. 4,ie, measurements made 110-120 msec after the beginning of the trace). The ordinate andabscissa are similar.

Silent Substitution in Human ERG 2087
ANormal
RED-GREEN TRANSITIONS IN CONGENITAL RED-GREEN DEFECT.
Anomalous tr ichromat
r»d to g n u i gr»«n to r»d
Intensity (mf/m^)
Red Green
1900 120
3724 120
14036 120
I red to gretn gratn to nd
D CO
:> o10
-10 -
-20 -
-30 -
-40 -
-0.5
-
D
D
D • ___.
- ' " D'" •
D
D
D - ? & • • • • • • • " " " "
0.5 1.5
OFF RESPONSE ON RESPONSE
FIGURE 6. (A) Responses to alternating red and green light steps are shown for a normalsubject and an anomalous trichromat. The stimuli are as in previous Figs. 1-3. Note that forthe most intense red light, there is an "off" at the red-to-green transition for both observers,but when, top row, the red intensity is reduced, it is only in the normal that the "off" and"on" are seen at the opposite transitions. For the anomalous trichromat, the effectiveness ofthe weakest red light is still apparently greater than that of the green. (B) The results of ananomalous trichromat are calculated as in fig 4 for a red to green transition. Note that in thissubject only off responses could be recorded for the red-to-green transition with the red-green light intensities available.
red transitions of 50, 100, and 200 msec (with equalperiods of red and green light in each case) require thesame relative intensities to produce a "silent substitu-tion."
With flashes shorter than 50 msec, the b-waves ofone transition occur during the a- or off waves of thenext. The ERG waveform changes because each b-wave is terminated by the succeeding a-wave. In addi-tion the inflection on the a-wave which signals the be-ginning of the b-wave is delayed, so the time-to-peak ofthe a-wave increases. Therefore, analysis of the tracesbecomes problematic. It appears that the rules for si-lent substitution of the initial parts of the a- and rapidpositive-going off waves described above still hold: nopairs of light intensities ever cause a null of the fa-waves, though a range of intensities gives a minimumb-wave.
DISCUSSION
No experiment on the human ERG can provide con-clusive evidence of the source of generation of thevoltages recorded. However, in light-adapted eyes theratio of a-waves to off responses reaches a constantvalue for a range of different intensities and rates ofstimulation, a finding consistent with the hypothesisthat a single process is responsible for both waves.1
Microelectrode recordings from primate retinas, in-cluding current density analysis6 and principal compo-nent analysis8 also lead to such conclusions, and con-firm earlier reports that both waves originate in thecones.9"11 The first effect of light must be exerted onthe photoreceptors, and by confining measurementsto the earliest voltage changes in the ERG, it is possibleto assume that the results obtained refer to recep-

2088 Investigative Ophthalmology & Visual Science, May 1993, Vol. 34, No. 6
Green
aa>a.0)
Red
50msec
100msec
200msec
Green-s^Red
50msec
100msec
200msec
FIGURE 7. Alternating red and green light steps with differ-ent durations (50, 100, 200 msec). Top 3 transitions are forred to green. Between 10 and 20 msec after the transition,the maximum voltage change is 3 uV. The light intensitiesare red: 22883 mW-irT2 and green: 1017 mW-irT2 corre-sponding to a decrease in LW cones' relative absorptions of3531 to 1017, with a concurrent increase in MW cones' ab-sorptions of 236 to 571. The lower 3 traces are for the re-verse transitions, green to red, and the light intensities havebeen readjusted to obtain less than 4 uV in the 10-20 msecperiod after the flash. For green the intensity is 1500mW • m~2 and for red 17903 mW • m~2 corresponding to anincrease in LW cones' relative absorptions from 1500 to2762 and a corresponding decrease in MW cones from 842to 236 (these results are not in table 3). Note that the lateractivity varies with flash length, but that from 10-20 msec anapproximate null occurs at the same pairs of light intensities,for all step durations.
tor potentials, an approach already followed for therod ERG.4
The experiments described earlier demonstratethat the intensities at which a wavelength shift gives aninitially electrically silent transition differ from the in-tensities at which the reverse shift allows an electricalsilence. This asymmetry is unexpected and requiresexplanation.
LW and MW Cones Develop the ResponsesAnalyzed
There is no evidence that during the 10-20 msec afterthe stimulus some retinal cell other than receptors con-tributes to the ERG voltages investigated. Indeedthere appears to be a general rule, which is followedover a range of stimulus intensities, that silence occurs
when the reduction in one class of cone activity is ap-proximately twice that of the increase in the other classof cone. This result is similar to the differing ampli-tudes of on and off responses reported.1 The mostparsimonious and simplest explanation of such find-ings is that only one class of generators is involved. Ifother retinal cells contribute then the simple relation-ship demonstrated in this article implies that the volt-age/light intensity relationship of this second classwould be similar to that of the cones. Analysis of re-sponses of retinal neurons has demonstrated a varietyof different sensitivities and adaptive properties. (Fora recent review see 27).
The results exclude rod contributions. "Blue"(SW) cones' b-waves have been studied and are "rod-like"2728'29 very different to those shown in the fig-ures, but the waveform of the relatively infrequentlyencountered blue cone receptor potential is the sameas that of the other cone classes.1213 Any small contri-bution blue cones might make to a- and off responsessuch as those shown in Figures 1, 2, and 3, could notaccount for the findings on quantitative grounds.Thus in Figure 2A, the green to red transition towardthe end of the center trace causes a large on response,which must be due partly to long-wavelength cone ac-tivation. Reducing the red light intensity by less than50% as in the top trace will cause a trivial difference inthe direct light adaptation of SW cones, but it trans-forms the ERG (upper trace, left) at the red-greentransition. Therefore the change in the relative lightintensity must affect the ERG through its effect on themedium wavelength cones. Thus to a first approxima-tion, the result is due to altering the excitation of LWand MW cones.
If on and off responses develop at different rates,this would explain the results, but all evidence isagainst this suggestion. Thus, the 10-90% currentchange in single primate cells13 in response to a 1 secstep of light delivering 2350 photons urn"2 (13 Fig.3B) occurs at the rate of 73 pA/sec at "on" and 71.4 at"off," which is nearly identical.
The other explanation is that the amplitude of onand off responses are unequal. For this to be true forevery flash in a prolonged sequence, the receptor pho-toresponse would have to decline during the time(>20 msec and <50 msec) when the electrical activityof receptors is masked by the other ERG components.
Reduction in amplitude of a response may alsoimply a change in sensitivity. During intense step stim-uli,13 primate cone sensitivity may decrease, at firstrapidly, and then to a plateau level after about 1 sec.This form of light adaptation was only seen when in-tense flashes were given on a zero background and themagnitude of loss of sensitivity was dependent on lightintensity. In our experiments with red-green alterna-tion, the overall change in intensity for each receptor

Silent Substitution in Human ERG 2089
was less than in the article cited, none of the responsesapproached saturation, and the effects we observe arenot dependent on the absolute level of light. Schnapfet al13 (Fig. 8) found no changes in sensitivity in suchcircumstances in isolated single cones.
The linearity demonstrated in Figures 4, 5 and 6argues a simple relationship between response ampli-tude and light intensity, so our findings imply that 20msec after the beginning of a light step a decline in theamplitude of the cone photoresponse begins and afterabout 50 msec this decline reaches a new steady level.If the sensitivity is defined as /uV/photon, there is adecline in sensitivity. When the step of light termi-nates, sensitivity recovers after a similar delay. This isquite different to the sensitivity changes in single iso-lated cones previously described.13
A Model for Modifications of the ConePhotoresponses
Figure 8 is a diagram showing what we have observedand a possible explanation. Although it has been re-ported671910 that monkey cone receptor potentials aremaintained, others1113 have demonstrated a pro-nounced biphasic nature of the flash response, andhave shown that the step response can be predictedfrom this with the assumption of linear superposition,and these last findings are incorporated into Figure 8.
Red
light stimulus
Green
Isolated MW conereceptor potential
Change in currentdrive due to feedback
V/v Magnitude of theresulting 'a' wavecurrent
FIGURE 8. Explanation of results with red-green and green-red transitions. The changes in retinal illumination are indi-cated in the first row of the diagram. The hatched time-linesshow where silent substitution measurements were made.The waveform of the isolated green cone is shown, based onSchnapf et al.l3 Note the symmetrical overshoot at onset andoffset of the green light. The postulated delayed inhibitoryfeedback is indicated: the lower trace shows how the recep-tor potential is thereby modified, and the "on" and "off"responses become asymmetric.
The upper rows show the stimulus, the alternation ofred and green. The next row shows the changes inmembrane voltage or current of a MW cone duringthe "green" half of the red-green alternation. Thereis a net increase in hyperpolarization: note the re-sponse in the diagram never saturates. There is a peakto the response, due to the mechanism suggested by,13
a rapid loss in intracellular calcium. At the end of thelight step, the current change is in the reverse senseand temporarily goes beyond the dark level. Note,there is a delay of about 10 msec between the flashonset and offset and the beginning of the change inmembrane current. The hatching shows the periodduring which the experiments represented by Table 2took place, no changes in potential were seen.
The third row of Figure 8 shows the presumedtime course of the modification (reduction) in recep-tor response in our experiments. It occurs with a delayof approximately 20 msec, and is maximal by 50 msecafter the flash. At the end of the stimulus, the restora-tion is presumed to possess the same time course.When this process operates on the photoresponse, thechanges in membrane current are transformed asshown in the 4th row. The onset is scarcely changed,but the offset grows much smaller. The diagram showswhat happens to an MW cone, but at its "on" transi-tion, there will be a corresponding "off" for a LWcone. The argument for larger "on" response than"off" also holds for the LW cone. That is, at the timeof the increase of red light, the "on" of the LW conewill necessarily be bigger and the "off11 of the MWcone will necessarily be smaller: so silent substitutioncannot occur, unless the light intensities are read-justed. This explanation shows why the increase anddecrease of the light intensities required at the twotransitions is symmetrical for the two cone classes. Ifthe cones are operating in their linear range, the ratiobetween the two intensities of red and green lightwhich achieve silent substitution at one transitionshould be constant as the intensities alter. The inverseof the same ratio describes the light intensities re-quired at the other transition: the proposed mecha-nism operates equally on both cone classes, and theamplitude is approximately reduced by 50%.
The question as to the mechanisms involved can-not be directly investigated with the ERG but the sim-plest hypothesis is that feedback from H-cells3031 de-polarizes the inner portions of the cones and reducesthe radial longitudinal current. Such a feedback hashitherto been seen only in amphibian and reptilianretinas, but the anatomic substrate exists in hu-mans.3233 The delays in the feedback are such that onlythe falling phase of the cone impulse response is re-duced:30 thus, the measurements of the a-wave madein this article would be unaffected by the feedbackmechanism.

2090 Investigative Ophthalmology & Visual Science, May 1993, Vol. 34, No. 6
The Origin of 'Chromatic' Responses
When psychophysical responses, or ganglion cell dis-charges, or ERG b-waves are recorded with rapid red-green flicker, a ratio of red:green intensities is foundat which minimal responses can be seen. If the wave-lengths are changed, the spectral sensitivity of themechanism can be investigated.1415-29 For the b-waveand for ganglion cell discharges, such experimentsprovide evidence of chromatic processing. For thePHI component of the ERG in primate retina with astimulus consisting of slow temporal sinusoidal colorchange, the spectral sensitivity of PHI under these cir-cumstances is that of the luminosity function, V,anibda,but under such conditions the sharp transients wemeasure would be much reduced or absent. Table 3shows that for the rapid transients, the relationshipbetween intensity of the two wavelengths for silentsubstitution is more complex. Our work has been re-stricted to two colors only, but the interaction we havedetected is subtractive, rather than additive. Such sub-tractive interactions are a constant feature of theoriesof color vision.3435 Some indications of them havebeen seen in the b-wave of the ERG,15 even when sinu-soidal flicker is used. Our results suggest that subtrac-tion occurs in the receptor itself, and is a change in theradial longitudinal current generated by light. Becausethe current is maximal in darkness, the interactioncauses an increase in radial current. Horizontal cellfeedback is the most likely cause of this change, whichhas not been seen in experiments when a single cellwas isolated and illuminated. Our results also suggestthat the reason why color discrimination depends onabrupt spatial or temporal changes lies at least partlyin the cones themselves.
Key Words
human ERG, a-wave, off response, color mechanisms, silentsubstitution
Ackn owledgmen ts
WS received a European Exchange Scholarship of the RoyalSociety and a British Council Scholarship. FR received ascholarship from the Gulbenkian Foundation. The work wasfunded in part by The National RP society Fighting Blind-ness, Inc.
References
1. Spileers W, Falcao-Reis F, Hogg C, Argen GB. A newGanzfeld electroretinographic stimulator powered byred and green LEDs. Clin Vis Sci. 1993;8:21-39.
2. Baron WS, Boynton RM. Component analysis of thefoveal local electroretinogram elicited with sinusoidalflicker. Vision Res. 1979; 19:479-490.
3. Kawasaki K, TanabeJ, Wakabayashi K, Shirao Y. Chro-matic recordings of electroretinograms. In: Hecken-lively J, Arden GB, eds. Clinical Visual Electrophysiol-ogy. Chicago: Mosby; 1991:339-347.
4. Hood DC, Birch DG. The a-wave of the human electro-retinogram and rod receptor function. Invest Ophthal-mol Vis Sci. 1990;31:2070-2081.
5. Hood DC, Birch DG. A quantitative measure of theelectrical activity of human rod photoreceptors usingelectroretinography. Vis Neurosci. 1990;5:379-387.
6. Valeton JM, van Norren D. Light-adaptation of pri-mate cones: an analysis based on extracellular data.Vision Res. 1983;23:1539-1547.
7. Boynton RM, Whitten DN. Visual adaptation of mon-key cones: recordings of late receptor potentials.Science 1970; 170:1423-1426.
8. Heynen HGM, van Norren D. Origin of the electroret-inogram in the intact macaque eye: principal compo-nent analysis. Vision Res. 1985; 25:697-707.
9. Brown KT, Watanabe K, Murakami M. The early andlate receptor potentials of monkey cones and rods.Cold Spring Harb Symp Quant Biol. 1965; 30:457-482.
10. Brown KT. The electroretinogram, its componentsand their origins. Vision Res. 1968; 8:633-677.
11. Whitten DN, Brown KT. The time courses of late re-ceptor potentials from monkey cones and rods. VisionRes. 1973; 13:107-135.
12. Baylor DA, Nunn B, Schnapf JL. Spectral sensitivity ofcones of the monkey. J Physiol. 1987; 390:145-160..
13. Schnapf JL, Nunn BJ, Meister M and Baylor DA. Vi-sual transduction in cones of the monkey Macacafas-cicularis. J Physiol. 1990;427:681-7l 3.
14. Padmos P, van Norren D. Cone spectral sensitivityand chromatic adaptation as revealed by humanflicker electroretinography Vision Res. 1971; 11:27-42.
15. Mills SL, Sperling HG. Red/Green opponency in therhesus macaque ERG spectral sensitivity is reduced bybicucculine. Vis Neurosci. 1990;5:217-221.
16. Kawasaki K, Tsuchida Y, Jacobson JH. Positive andnegative deflections in the off" response of the electro-retinogram in man. Am J Ophthalmol. 1971; 72:367-375.
17. Estevez O, Spekreijse H. The "silent substitution"method in visual research. Vision Res. 1982; 22:681-691.
18. Ishihara M. Versuch einer Deutung der photoelektris-chen Schwankungen am Froschauge. PJlugers Arch gesPhysiol. 1906; 124:569-618.
19. Forbes A, Burleigh S, Neyland M. Electrical responsesto color shift in frog and turtle retina. J Neurophysiol.1955;18:517-535.
20. Copenhaver RM, Gunkel D. The spectral sensitivity ofcolor-defective subjects determined by electroretinog-raphy. Arch Ophthalmol. 1959;62:55-58.
21. Smith VC, PokornyJ. Spectral sensitivity of colorblindobservers and the cone pigments. Vision Res. 1972;12:2059-2071.
22. Smith VC, PokornyJ. Spectral sensitivity of the fovealcone photopigments between 400 and 500 nm. VisionRes. 1975; 15:161-1 71.
23. Burkhardt DA. Proximal negative response of the frogretina. J Neurophysiol. 1970; 33:405-423.
24. Ogden TE. The proximal negative response of the pri-mate retina. Vision Res. 1973; 13:797.

Silent Substitution in Human ERG 2091
25. Sieving PA, Frishman LJ, Steinberg RH. The M-waveof proximal retina in cat. J Neurophysiol 1986;56:1039-1047.
26. Kawasaki K, TanabeJ, Wakayabashi K, Shirao Y. Chro-matic recording of electroretinograms. In: Heckenli-vely J, Arden GB, eds. Principles and Practice of ClinicalElectrophysiology of Vision. Chicago: Mosby; 1991:339-447.
27. Falk G. Retinal Physiology. In: Heckenlively J, ArdenGB, eds. Principles and Practice of Clinical Electrophysiol-ogy of Vision. Chicago: Mosby; 1991:69-84.
28. Zrenner E, Gouras P. Blue sensitive cones of the catproduce a rodlike electroretinogram. Invest Ophthal-mol Vis Sci. 1979; 19:1076-1081.
29. Evers HU, Gouras P. Three cone mechanisms in theprimate ERG. Vision Res. 1986;26:245-254.
30. Baylor DA, Fuortes MGF, O'Bryan R. Receptive fieldsof single cells in the retina of the turtle. J Physiol.1971;214:265-294.
31. Wu SM. Input-output relations of the feedback syn-apse between horizontal cells and cones in the tigersalamander retina. J Neurophysiol. 1991; 65:1 197-1206.
32. Kolb H. The neural organisation of the human retina.In: Heckenlively J, Arden GB, eds. Principles and Prac-tice of Clinical Electrophysiology of Vision. Chicago:Mosby; 1991:25-52.
33. Kolb H, Linberg KA, Fisher SK. Neurons of the hu-man retina: a Golgi study. J Comp Neurol. 1992;318:147-187.
34. Wyszecki G, Stiles WS. Theories and models of colourvision; neural models. In: Color Science. Concepts and.Methods, Quantitative Data and Formulae. New York:Wiley; 1982:633-652.
35. Judd DB. Basic correlates of the visual stimulus. In:Stevens S, ed. Handbook of Experimental Psychology.New York: Wiley; 811-867.
Copyright © 2022 FDOKUMEN