Evidence for Small-Scale Mantle Convection From Seasat Altimeter Data
16
JOURNAL OF GEOPHYSICAL RESEARCH, VOL. 91, NO. B3, PAGES 3507-3520, MARCH 10, 1986 Evidence for Small-Scale Mantle Convection From Seasat Altimeter Data WILLIAM F. HAXBY AND JEFFREY K. WEISSEL Lamont-Doherty Geological Observatory of Columbia University, Palisades, New York Evidence for the early development of convective instability in the thermal boundary layer associated with cooling plates has been found from gravity anomalies and residual sea surfaceheights derived from Seasataltimeter data. Subtle lineated patterns trending in the direction of plate motion in the hot spot reference frame are observed over the younger portions of the fast-moving Pacific and Indo-Australian plates. In particular, for the eastcentralPacificOcean,the Seasat-derived data sets reveallineations w•th (1) wavelengths in the range 150-500 km (perhaps increasing with plate age), and (2) peak-to-trough amplitudes of 5-20 mGal for gravity anomalies.The lineated pattern over the Pacific plate, which first becomes discernable over seafloor5- to 10-m.y.-old west of the East Pacific Rise, is clearly oblique to the trends of the prominent Pacific-Farallon fracture zones. Onset of convective instability at such earlyages can be understood if young oceanic lithosphere is underlain by a layer havinga viscosity of about 10 x8 Pa s (10 •9 P), whichis about 3 orders of magnitude less than mantleviscosity inferred from postglacial rebound studies. Recent numerical studies of convection in fluids with a temperature- and pressure- dependentviscosity support an early onset time for convective instability and low-viscosity zonesin the upper mantle beneathyoung lithosphere. Such low-viscosity zonesmay correspond to similarly located regions of low shear wave velocities resolved through studies of surface waves. INTRODUCTION Although the Seasatmissionended prematurely after less than 4 months of operation,seasurface height variationsmea- suredalong the suborbitalpaths shownin Figure 1 promiseto enhance our geological understanding of the ocean basinsand their margins. Each data point, which is an average of radar altimeter measurements taken over 1 s (•7 km of ground track), is known with a precision of 0.1 m [Tapley et al., 1982]. Thus a 0.2-m geoidal high expected over a seamount 500 m high and 50 km wide lying in 4 km of water should be resolved adequately in data obtained along a satellite pass directly above such a seamount.The high sensitivity of sea surface height measurements and the uniform and relatively dense coverage of the oceans by Seasat ensure that important new information is available from remote regionsseldom visi- ted by research vessels. Given the Seasat data distribution (Figure 1), features large enoughto be important in tectonic studies of the oceanic crustand lithosphere shouldbe resolved well in all parts of the oceans, their resolution improvingwith increasing latitude. In order to take full advantage of the Seasat data set in tectonic studies, it is necessaryto combine the altimeter measurements taken along all the orbits and construct a .two- dimensional representationof the data. Dixon and Parke [1983] and Rapp [1983] have approached this problem by determining average sea surface heights at 0.5øx 0.5 ø and 1 ø x 1 ø grid intervals, respectively. Sandwell [1984] chose to grid sea surfaceslopes,using the conjugate sets of Seasat tracks (ascending and descending)independently, thereby avoiding the necessity of adjusting sea surface heightsalong crossing tracks to minimize crossover discrepancies. The pro- cedures for processing Seasat altimeterdata which led to the observations described in this paper were outlined briefly by Haxby et al. [1983]. The processing resulted in a grid of grav- ity anomaliesat approximately 0.1 ø intervals between66.5øS and 66.5øN latitude. The key elements in the processing are (1) the interpolation of sea surface slopes onto equally spaced tracks which parallel the satellite orbits, (2) computation of Copyright 1986 by the American Geophysical Union. Paper number 4B5365. 0148-0227/86/004B-5365505.00 gravity anomalies from the resultinggrids of seasurface slopes in the ascending and descending orbit directions, and (3) the display of the gridded gravity anomalies as color relief images by employing computer graphics techniques. The interpola- tion procedure took advantage of the fact that seafloor spreadingand plate tectonics processes result in a predomi- nance of long linear features such as ridges, fracture zones, and trenches. Therefore adjacent tracks were examined to de- termine whether a particular area was characterized by promi- nent linear trends, and the interpolation was guided by trends so defined. In determining gravity anomalies from the gridded sea sur- face slopes, two assumptions were made. First, we assumed that the seasurface slopes are good approximations to geopo- tential gradients. Errors will be introducedinto the recovered gravi,ty anomalies in areas where the oceanographic contri- bution tq sea surfaceheight variations is significant [e.g., Cheney,1982; Bernstein et al., 1982]. Second, we employed a flat earth approximation. In doing so, gravity anomaliesof long to intermediate wavelengths (> 1000 km) are inaccurately determined (see Dahlen [1982] and Sandwell [1982] for dis- cussion). In addition, thepotential for recovering information at short wavelengths(< 100 km), which is inherent in the along-track data, is compromised because parallel orbits may be as much as 1.8 ø (•--200 km) apart at the equator. However, a reasonfor computinggravity anomalies from the altimeter data is that research vessels routinely measurethis quantity, and therefore the recoveredgravity anomalies are subject to direct verification. Finally, the geographically gridded gravity anomalieswere resampled onto an equispaced grid in a Mercator projection of a sphericalearth where the grid interval is 12 samples per degree of longitude. In Plates1 and 2 we showcolor images of the recoveredgravity anomaliesin which color changes por- tray contour levels in the data,and shading is applied to simulate illumination of the data "surface" by an artificial sun [see Haxby et al., 1983]. (Plates 1 and 2 can be found in the separatecolor sectionin this issue.) The effect of shadingin these images is to highlight features whose trends are perpen- dicular to the illumination direction at the expense of features lineated parallel to the illumination direction. Also shown in Plate 1 is an image of DBDB5 bathymetric data, which are 5 arc min gridded depth values prepared from bathymetric 3507
Transcript of Evidence for Small-Scale Mantle Convection From Seasat Altimeter Data

JOURNAL OF GEOPHYSICAL RESEARCH, VOL. 91, NO. B3, PAGES 3507-3520, MARCH 10, 1986
Evidence for Small-Scale Mantle Convection From Seasat Altimeter Data
WILLIAM F. HAXBY AND JEFFREY K. WEISSEL
Lamont-Doherty Geological Observatory of Columbia University, Palisades, New York
Evidence for the early development of convective instability in the thermal boundary layer associated with cooling plates has been found from gravity anomalies and residual sea surface heights derived from Seasat altimeter data. Subtle lineated patterns trending in the direction of plate motion in the hot spot reference frame are observed over the younger portions of the fast-moving Pacific and Indo-Australian plates. In particular, for the east central Pacific Ocean, the Seasat-derived data sets reveal lineations w•th (1) wavelengths in the range 150-500 km (perhaps increasing with plate age), and (2) peak-to-trough amplitudes of 5-20 mGal for gravity anomalies. The lineated pattern over the Pacific plate, which first becomes discernable over seafloor 5- to 10-m.y.-old west of the East Pacific Rise, is clearly oblique to the trends of the prominent Pacific-Farallon fracture zones. Onset of convective instability at such early ages can be understood if young oceanic lithosphere is underlain by a layer having a viscosity of about 10 x8 Pa s (10 •9 P), which is about 3 orders of magnitude less than mantle viscosity inferred from postglacial rebound studies. Recent numerical studies of convection in fluids with a temperature- and pressure- dependent viscosity support an early onset time for convective instability and low-viscosity zones in the upper mantle beneath young lithosphere. Such low-viscosity zones may correspond to similarly located regions of low shear wave velocities resolved through studies of surface waves.
INTRODUCTION
Although the Seasat mission ended prematurely after less than 4 months of operation, sea surface height variations mea- sured along the suborbital paths shown in Figure 1 promise to enhance our geological understanding of the ocean basins and their margins. Each data point, which is an average of radar altimeter measurements taken over 1 s (•7 km of ground track), is known with a precision of 0.1 m [Tapley et al., 1982]. Thus a 0.2-m geoidal high expected over a seamount 500 m high and 50 km wide lying in 4 km of water should be resolved adequately in data obtained along a satellite pass directly above such a seamount. The high sensitivity of sea surface height measurements and the uniform and relatively dense coverage of the oceans by Seasat ensure that important new information is available from remote regions seldom visi- ted by research vessels. Given the Seasat data distribution (Figure 1), features large enough to be important in tectonic studies of the oceanic crust and lithosphere should be resolved well in all parts of the oceans, their resolution improving with increasing latitude.
In order to take full advantage of the Seasat data set in tectonic studies, it is necessary to combine the altimeter measurements taken along all the orbits and construct a .two- dimensional representation of the data. Dixon and Parke [1983] and Rapp [1983] have approached this problem by determining average sea surface heights at 0.5øx 0.5 ø and 1 ø x 1 ø grid intervals, respectively. Sandwell [1984] chose to grid sea surface slopes, using the conjugate sets of Seasat tracks (ascending and descending) independently, thereby avoiding the necessity of adjusting sea surface heights along crossing tracks to minimize crossover discrepancies. The pro- cedures for processing Seasat altimeter data which led to the observations described in this paper were outlined briefly by Haxby et al. [1983]. The processing resulted in a grid of grav- ity anomalies at approximately 0.1 ø intervals between 66.5øS and 66.5øN latitude. The key elements in the processing are (1) the interpolation of sea surface slopes onto equally spaced tracks which parallel the satellite orbits, (2) computation of
Copyright 1986 by the American Geophysical Union.
Paper number 4B5365. 0148-0227/86/004B-5365505.00
gravity anomalies from the resulting grids of sea surface slopes in the ascending and descending orbit directions, and (3) the display of the gridded gravity anomalies as color relief images by employing computer graphics techniques. The interpola- tion procedure took advantage of the fact that seafloor spreading and plate tectonics processes result in a predomi- nance of long linear features such as ridges, fracture zones, and trenches. Therefore adjacent tracks were examined to de- termine whether a particular area was characterized by promi- nent linear trends, and the interpolation was guided by trends so defined.
In determining gravity anomalies from the gridded sea sur- face slopes, two assumptions were made. First, we assumed that the sea surface slopes are good approximations to geopo- tential gradients. Errors will be introduced into the recovered gravi,ty anomalies in areas where the oceanographic contri- bution tq sea surface height variations is significant [e.g., Cheney, 1982; Bernstein et al., 1982]. Second, we employed a flat earth approximation. In doing so, gravity anomalies of long to intermediate wavelengths (> 1000 km) are inaccurately determined (see Dahlen [1982] and Sandwell [1982] for dis- cussion). In addition, the potential for recovering information at short wavelengths (< 100 km), which is inherent in the along-track data, is compromised because parallel orbits may be as much as 1.8 ø (•--200 km) apart at the equator. However, a reason for computing gravity anomalies from the altimeter data is that research vessels routinely measure this quantity, and therefore the recovered gravity anomalies are subject to direct verification.
Finally, the geographically gridded gravity anomalies were resampled onto an equispaced grid in a Mercator projection of a spherical earth where the grid interval is 12 samples per degree of longitude. In Plates 1 and 2 we show color images of the recovered gravity anomalies in which color changes por- tray contour levels in the data, and shading is applied to simulate illumination of the data "surface" by an artificial sun [see Haxby et al., 1983]. (Plates 1 and 2 can be found in the separate color section in this issue.) The effect of shading in these images is to highlight features whose trends are perpen- dicular to the illumination direction at the expense of features lineated parallel to the illumination direction. Also shown in Plate 1 is an image of DBDB5 bathymetric data, which are 5 arc min gridded depth values prepared from bathymetric
3507

3508 HAXBY AND WEISSEL: EVIDENCE FOR SMALL-SCALE MANTLE CONVECTION
Fig. 1. Trajectories of NASA's Seasat satellite over the oceans. Mercator projection of a spherical earth from 72øN to 66øS. Altimeter data from the enclosed areas constitute the basis for this study.
maps of the world oceans by scientists at the U.S. Naval Oceanographic Office, Bay St. Louis, Mississippi.
We anticipated that the imaged Seasat-derived gravity anomalies and gridded bathymetric data would have many applications in tectonic studies of the ocean basins. For exam- ple, we expected a better delineation of oceanic fracture zones, which are important recorders of past plate motion. Also, we expected that such images would be useful for the rapid identi- fication of new or mislocated seamounts and other bathy- metric features (see also Lainbeck and Coleman [-1982], Lazare- wicz and Schwank [1982], and Dixon et al. [1983]). As we pursued these (and other) studies using the imaged data sets, we were intrigued to find subtle gravity anomaly "fabrics" associated with younger parts of fast-moving oceanic plates (the Pacific and Indo-Australian plates in Plates 1 and 2) that cannot be easily attributed to fracture zones or to surface loads such as seamounts. Such fabrics, or lineated patterns, are best developed in the east central Pacific (Plate la) and consist of low-amplitude gravity anomaly undulations elon- gated in the direction of plate motion in a hot spot frame of reference (Figures 2-4).
The main purpose of this paper is to draw attention to these singular but subtle patterns of gravity undulations, placing significance on their association with the younger portions of fast-moving oceanic plates. We advance the explanation that these gravity features reflect the development, through insta- bility in the thermal boundary layer, of small-scale mantle convection which is organized into longitudinal rolls [Richter, 1973; Richter and Parsons, 1975] by shear imparted by fast- moving plates. We infer from the crustal age at which the lineated gravity patterns become discernable that small-scale convection becomes established within 5-10 m.y. after intia- tion of plate cooling. We also infer from the • 200-km wave- length components predominant in the gravity pattern at
these young ages that the convecting region is about 100 km thick beneath young oceanic lithosphere. Finally, we deter- mine, using a local Rayleigh number criterion for the stability of the upper thermal boundary layer, that the mean viscosity of the convecting region is about 3 orders of magnitude smaller than the mean mantle viscosity obtained through studies of postglacial rebound.
NEW INFORMATION FROM SEASAT ALTIMETER D^T^
We will focus on the pattern of small-amplitude undulations in the Seasat-derived gravity field found in the east central Pacific (Plate la), since the pattern is developed most clearly over that region and the interpretation of these features as a reflection of small-scale mantle convection is better supported. Below we discuss similar patterns observed over the Indo- Australian plate between the Indian Ocean triple junction and the Ninetyeast Ridge (Plate 2a), and over the Pacific plate from about 44 ø to 54øS in the vicinity of the Menard fracture zone (Plate 2b).
The lineated pattern of small-amplitude gravity undulations is mapped over the Pacific plate between the Clarion fracture zone in the north and the Tuamotu and Society island and seamount chains in the south (Plate 1 and Figure 2). The lineated pattern is associated with crust as young as 5 m.y. between the equator and about 25øS along the western flank of the East Pacific Rise (EPR), and with crust as old as Late Cretaceous between the Clipperton and Galapagos fracture zones. The gravity undulations are characterized by peak-to- trough amplitudes of 5-20 mGal, dominant wavelengths of 150-220 km (estimated visually), and clear WNW trends averaging N65øW across the Pacific plate (Plate 1). The average trend is close to the direction of the Pacific plate in the hot spot frame of reference [Minster and Jordan, 1978], to

HAXBY AND WEISSEL.' EVIDENCE FOR SMALL-SCALE MANTLE CONVECTION 3509
the trends of the Tuamotu, Society, and Austral seamount chains, and to the azimuth of motion between the Pacific and Nazca plates along the EPR (Figure 2). If the gravity undu- lations are associated with topographic relief, such relief is less than the 500-m bathymetric contour interval used in Plate lb and poorly mapped by ship surveys.
The key observation that supports our interpretation is that the lineated gravity pattern clearly crosses major fracture zones of the Pacific-Farallon spreading system which was active from the Late Mesozoic until the end of the Oligocene [Handschurnacher, 1976; Marnrnerickx et al., 1980]. Plate la shows that the undulation pattern intersects the trends of the Clipperton, Galapagos, and Marquesas fracture zones (located on Figure 2), which are prominent in the recovered gravity anomalies, at angles of about 25 ø . It is thus unlikely that the mapped undulations result from crustal generation processes at the ancient Pacific-Farallon spreading system. In addition, it is unlikely that the gravity undulations mapped across younger (Miocene) crust generated at the modern EPR are associated with regularly spaced fracture zones which have hitherto escaped detection. Recent Sea Beam studies of the EPR between 13 ø and 23øS show that long sections (50-200 km) of the rise crest are essentially constant in depth, with local depth maximums associated with overlapping spreading centers and small age-offset transform faults [Fox et al., 1983]. The largest transform offset is the Garret transform at 13øS, which is a 130-km right-lateral offset marked by teleseismicity (Plate 1 and Figure 2), representing a maximum age disconti- nuity in the lithosphere of less than 2 m.y. [Gallo et al., 1983]. An additional argument against a fracture zone origin for the gravity anomaly undulations over the post-Oligocene Pacific plate flank of the EPR is that undulations with similar wave- lengths and trends are not readily observed over the Nazca plate flank (Plate la).
Younger portions of the Indo-Australian plate (Plate 2a) and the southern part of the Pacific plate (Plate 2b) are also associated with small-amplitude gravity undulations, but their regional extent is limited and the interpretation of these fea- tures as a reflection of small-scale convection is not as con-
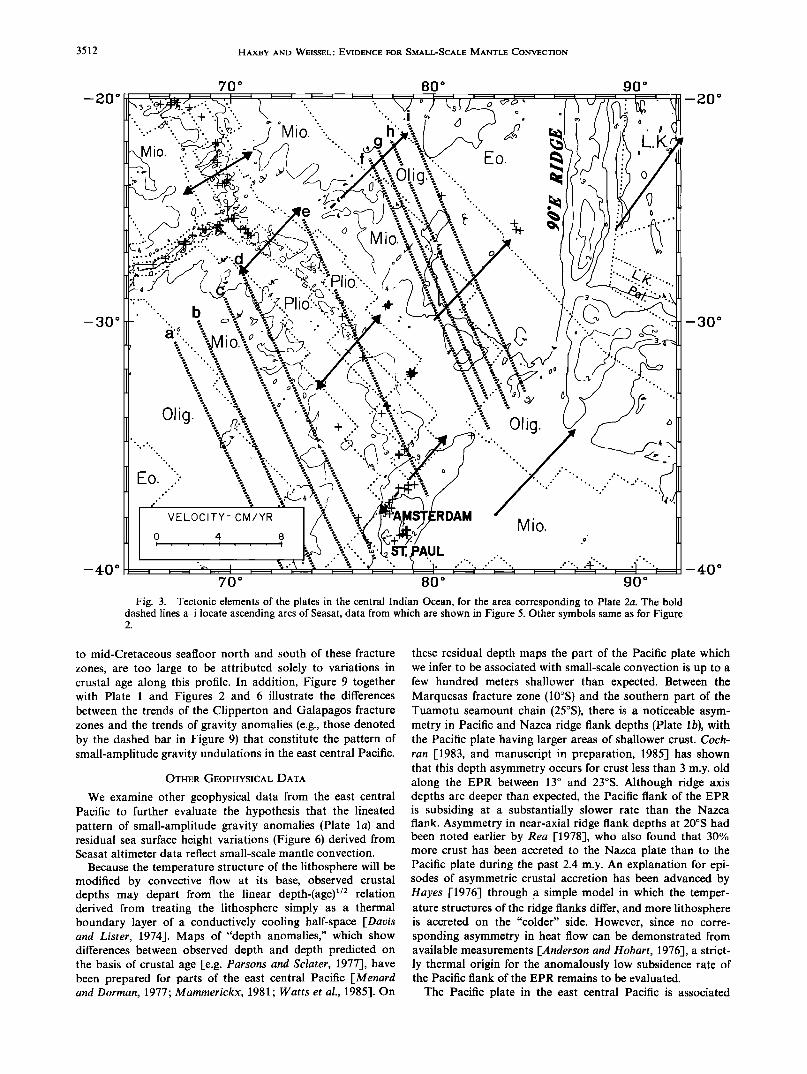
vincing compared to the pattern recognized over the east cen- tral Pacific (Plate 1). Between the Indian Ocean triple junction and the Ninetyeast Ridge, we find gravity undulations over the Indo-Australian plate with peak-to-trough amplitudes of about 20 mGal and dominant wavelengths of about 200 km, whereas gravity anomalies over the corresponding part of the Antarctic plate are narrower and resemble anomalies expected over fracture zones (Plate 2a). In order to demonstrate the difference between gravity signatures over the north and south flanks of the Southeast Indian Ridge (SEIR), we show profiles of residual sea surface heights along ascending tracks crossing similarly aged crust north and south of the ridge axis (Figure 5). Because of the obvious differences between signatures either side of the SEIR, it is difficult to attribute a fracture zone origin to both north and south flank anomalies. The small undulations trend in the direction of Indo-Australian
plate motion in the hot spot reference frame and are restricted to crust ranging in age from Late Miocene to early Oligocene (Figure 3).
Roughly sinusoidal travel time variations for shear waves traversing the central Indian basin further north were reported by Stark and Forsyth [1983]. Although Stark and Forsyth attribute the travel time variations to lithospheric temperature variations caused by a small-scale convection pattern also trending in the direction of absolute plate motion, the wave- lengths associated with the travel time anomalies are 3 times
larger than those associated with the gravity undulations to the south.
In the south Pacific area (Plate 2b) the gravity undulations are observed over the Pacific plate north and south of the Menard fracture zone (Figure 4). The lineated pattern is as- sociated with oceanic crust ranging in age from Pliocene to late Oligocene.
Although the small-scale gravity undulations in the central Indian Ocean (Plate 2a) and South Pacific Ocean (Plate 2b) are similar in amplitude and dominant wavelength to those in the east central Pacific (Plate la), the fact that they trend in the direction of nearby fracture zones means that fracture zone processes cannot be eliminated as a possible explanation for these features. However, because (1) the gravity undu- lations are better developed over the Indo-Australian plate compared to the Antarctic plate (Plate 2a and Figure 5), (2) the lineated pattern of undulations is more readily observed over the Pacific plate compared to the Nazca plate (Plate 1), and (3) the undulation pattern in the east central Pacific crosses the Pacific-Farallon fracture zones, we prefer the alter- native explanation for these gravity undulation patterns that involves small-scale mantle convection organized into longi- tudinal rolls parallel to plate motion by shear imparted by fast moving plates.
To verify that the small-amplitude gravity undulations in the east central Pacific (Plate la) are real and not artifacts of the data processing techniques employed in the gravity anom- aly recovery, we reexamined the original along-orbit sea sur- face height data. In Figure 6 we display residual sea surface heights plotted normal to descending orbits (Figure 6a), ascending orbits (Figure 6b), and a composite plot using both sets of residual sea surface heights (Figure 6c). The residuals were computed by bandpass filtering the altimeter data so that components with wavelengths between 500 and 40 km are passed without attenuation and components with wavelengths longer than 1000 km and shorter than 24 km are eliminated. It is easy to recognize the small-amplitude, WNW trending residual sea surface height variations in the data along de- scending orbits (Figure 6a). However, the fact that the same pattern can be discerned in the data along ascending orbits (Figure 6b), where the track orientation is unsuited for the detection of such features, provides additional assurance of their existence.
One potentially important observation to emerge from the composite plot of residual sea surface heights (Figure 6c) is that the dominant wavelengths of the undulations appear to increase with plate age from • 200 km over young seafloor to • 500 km over older seafloor north and northwest of the Mar-
quesas Islands. A similar effect may be present in the imaged gravity anomalies (Plate l a) but it is harder to discern.
We expiored, in a more quantitative manner, the possibility that predominant wavelengths in the undulations increase with plate age, by conducting an analysis of coherence be- tween data on descending orbits in areas A and B of Figure 7. Area A contains crust ranging in age from Cretaceous to early Tertiary, whereas area B contains Oligocene and Miocene sea- floor (Figure 7). Analyzing spatial coherence is rendered diffi- cult in the case of Seasat data because Seasat orbits are non-
uniformly spaced. We attempted to overcome this problem by restricting the analysis to data along pairs of orbits that are between 1 ø and 1.5 ø apart. Such discrimination yields 18 pairs of orbits for area A and 20 pairs for area B, which should be sufficient for numerical stability. In addition, we utilized along-track sea surface slopes (deflections of vertical) rather than the residual sea surface heights (e.g., Figure 6a), in order

3510 HAXBY AND WEISSEL: EVIDENCE FOR SMALL-SCALE MANTLE CONVECTION

HAXBY AND WEISSEL: EVIDENCE FOR SMALL-SCALE MANTLE CONVECTION 3511
to "prewhiten" the spectra of the data. As is often the case in such analyses, the results of the spatial coherence calculations (Figure 8) do not allow a straightforward interpretation. For the younger area (area B, Figure 7), moderate coherence (>0.5) and a stable (near-zero) phase difference relationship persist down to wavelengths in the 200-170 km range. These are the wavelengths that we estimate visually as being pre- dominant in the small-amplitude gravity undulations, es- pecially over younger seafloor (Plate la). For the older area (area A, Figure 7), very high coherence is observed down to wavelengths slightly less than 500 km (Figure 8), which might indicate predominance of longer-wavelength components in the undulations over older seafloor. However, a band of mod- erately coherent energy occurs for wavelengths near 125 km (Figure 8a), perhaps reflecting the strong gravity signature of the Pacific-Farallon fracture zones in area A. The approxi- mately linear increase in phase difference for wavelengths less than 200 km (Figure 8a) is consistent with this explanation.
An increase in wavelength with plate age of the components dominant in the lineated patterns of gravity anomalies and residual sea surface heights might be explained in either of two ways. First, the average convection cell dimensions may actu- ally increase with plate age due to changes in viscosity struc- ture of the upper mantle as the plate thickens with age (dis- cussed in more detail below). Second, convection cell dimen- sions remain the same, but increasing lithospheric rigidity with plate age acts as a low pass filter to buoyancy forces and normal stresses arising from small-scale convection [e.g., Buck, 1984-]. We might summarize the coherence analysis (Figure 8) as providing some support for the idea that predominant wavelengths in lineated patterns of gravity anomalies and re- sidual sea surface heights increase with plate age, as suggested from visual inspection of the residual sea surface heights shown in Figure 6.
Although few ship surveys in the east Central Pacific in- clude both gravity and bathymetry measurements, we com- pared gravity anomalies derived from Seasat altimeter data with gravity and bathymetric data from four ship tracks over Late Cretaceous and early Tertiary seafloor (Figure 7) which cross the small-amplitude undulations at high angles. The original, unfiltered surface ship data are shown on the right- hand side of Figure 9, while on the left, the same data filtered to pass wavelengths between 1000 and 180 km without attenu- ation are compared with Seasat-derived gravity anomalies re- covered along the ship track. The shipboard data and the recovered Seasat gravity anomalies have been projected on to profiles with an azimuth of N20øE. Note that the original (unfiltered) gravity and bathymetric data are plotted with re- duced vertical scales compared to the filtered shipboard data and the Seasat-derived gravity anomalies.
Generally good agreement is found between the Seasat- derived gravity anomalies and the filtered surface ship gravity data (Figure 9). Where large discrepancies exist, these can gen- erally be traced to errors or gaps in the marine gravity data (see circles with asterisks on profiles P7008 and Cll10). More- over, gravity anomalies (particularly Seasat-derived gravity anomalies) and topographic variations in the wavelength range 1000-180 km show a good visual correlation on all profiles. Longer-wavelength components (•> 1000 km) in grav- ity and bathymetry also appear to be correlated, a feature noted previously by McKenzie et al. [1980-] and Watts et al. [1985•. For example, long-wavelength depth variations ob- served along the unfiltered Hudson profile, which crosses Late Cretaceous seafloor between the Clipperton and Galapagos fracture zones (CFZ and GFZ in Figure 9) and probable Early
3512 HAXBY AND WEISSEL.' EVIDENCE FOR SMALL-SCALE MANTLE CONVECTION
-20 ø
-30 ø
-40 ø
70 o 80 ø 90 ø
]•N,,o..:. -c.,• W:..•) / / "'. f :!/%- •-• Eo • •h • / ,' •' ß '. z • . •b• ß ".•'• • •".. ' • / k ['
'-. • •:':" •z .'"""'-• m••)'X t':tt• A, •'"'.... •/,, 3• ') • .... ' ¸
..... • . •., . .::• '.-• '..• • •....%. -... ,•'-..••L• _......• ; oN-•¾ .:., . '...•:• ... • .•,, ), '...• ..._
[.......... / "". X '•'. '••• "X•.• ::. •:. '"... ... ' '::. '""-..Z...."-.......... ;[ [ ....-' "'""' VELOCITY-C•'/YR • •'• /•AMSTERDAM • " ' • • ' • Mio. 0 4 8 ' '•' '"• '•
• .'--•".. -•_'•.: S• •PAU L .. ..' . •: • '•• •-••-, .• •. •. ..• ...-'• •.......•.... •....•
70 ø 80 ø 90 ø
Fig. 3. Tectonic elements of the plates in the central Indian Ocean, for the area corresponding to Plate 2a. The bold dashed lines a-i locate ascending arcs of Seasat, data from which are shown in Figure 5. Other symbols same as for Figure 2.
-20 ø
-30 ø
-40 ø
to mid-Cretaceous seafloor north and south of these fracture
zones, are too large to be attributed solely to variations in crustal age along this profile. In addition, Figure 9 together with Plate 1 and Figures 2 and 6 illustrate the differences between the trends of the Clipperton and Galapagos fracture zones and the trends of gravity anomalies (e.g., those denoted by the dashed bar in Figure 9) that constitute the pattern of small-amplitude gravity undulations in the east central Pacific.
OTHER GEOPHYSICAL DATA
We examine other geophysical data from the east central Pacific to further evaluate the hypothesis that the lineated pattern of small-amplitude gravity anomalies (Plate la) and residual sea surface height variations (Figure 6) derived from Seasat altimeter data reflect small-scale mantle convection.
Because the temperature structure of the lithosphere will be modified by convective flow at its base, observed crustal depths may depart from the linear depth-(age) •/2 relation derived from treating the lithosphere simply as a thermal boundary layer of a conductively cooling half-space [Davis and Lister, 1974]. Maps of "depth anomalies," which show differences between observed depth and depth predicted on the basis of crustal age [e.g. Parsons and Sclater, 1977], have been prepared for parts of the east central Pacific [Menard and Dorman, 1977; Mammerickx, 1981; Watts et al., 1985-]. On
these residual depth maps the part of the Pacific plate which we infer to be associated with small-scale convection is up to a few hundred meters shallower than expected. Between the Marquesas fracture zone (10øS) and the southern part of the Tuamotu seamount chain (25øS), there is a noticeable asym- metry in Pacific and Nazca ridge flank depths (Plate lb), with the Pacific plate having larger areas of shallower crust. Coch- ran [-1983, and manuscript in preparation, 1985] has shown that this depth asymmetry occurs for crust less than 3 m.y. old along the EPR between 13 ø and 23øS. Although ridge axis depths are deeper than expected, the Pacific flank of the EPR is subsiding at a substantially slower rate than the Nazca flank. Asymmetry in near-axial ridge flank depths at 20øS had been noted earlier by Rea [1978], who also found that 30% more crust has been accreted to the Nazca plate than to the Pacific plate during the past 2.4 m.y. An explanation for epi- sodes of asymmetric crustal accretion has been advanced by Hayes [1976] through .a simple model in which the temper- ature structures of the ridge flanks differ, and more lithosphere is accreted on the "colder" side. However, since no corre- sponding asymmetry in heat flow can be demonstrated from available measurements [Anderson and Hobart, 1976], a strict- ly thermal origin for the anomalously low subsidence rate of the Pacific flank of the EPR remains to be evaluated.
The Pacific plate in the east central Pacific is associated

HAXBY AND WEISSEL' EVIDENCE FOR SMALL-SCALE MANTLE CONVECTION 3513
-140 ø
-50 ø
-130 ø
o.
+
,
VELOCITY- CM/YR
0 4 8
..... ...
-110 ø -120 ø ß .
...; ;;' : ß o ;
.... ....:':"' ..":' ß
.....-'" o. . .,.""/
....., ...
..
o
ß
ß
, .
ß
ß .
ß o
ß ß •, ß
o.
-140 ø -130 ø -120 ø -110 ø
Fig. 4. Tectonic elements of the plates in the South Pacific, for the area corresponding to Plate 2b. Symbols same as for Figure 2.
--50 ø
with a significant amount of shallow intraplate seismicity which has generally occurred in clusters or as swarm activity [Okal et al., 1980]. Several of these events possess strike-slip focal mechanisms with T axes lying in the NE-SW quadrants and P axes lying in the NW-SE quadrants (Figure 2). The direction of maximum compressive stress determined from well bore breakouts at Deep Sea Drilling Project site 597C (18.8øS, 129.7øW) is in good agreement with the orientation of P axes from the intraplate earthquakes [Newmark et al., 1984]. Okal [1984] suggests that if the fracture zones of the Pacific-Farallon spreading system (Figure 2) represent zones of weakness, the earthquake focal mechanisms may be ex- plained by slip on these zones produced by "ridge-push" body forces in the direction of current Pacific-Nazca plate motion. Because of the similarity between the trends of the small- ampli{ude gravity undulations and the azimuths of the P axes from the focal mechanisms, we can probably eliminate an ex- planation for the undulations involving intraplate compres- sion normal to their trends. However, in the central Indian Oceah, lateral compression has deformed the lithosphere into undulations giving rise to gravity b. nomalies similar in wave- length but much larger in amplitude compared to the gravity features in the Pacific [Weissel et al., 1980; Geller et al., 1983; Weissel and Haxby, 1984]. Intraplate seismicity in the central Indian Ocean is characterized mainly by thrust events with P axes normal to the trends of the lithospheric deformation and associated gravity anomalies [Weissel et al., 1980; Wiens and Stein, 1983]. Therefore the crustal undulations and associated gravity anomalies in the central Indian Ocean likely result from intraplate compression, but a similar origin for the
meters
2
1
0
,km SE NW • 2•o •oo Fig. 5. Residual sea surface height profiles from the ascending
arcs a-i in Figure 3. Residuals were computed by subtracting the GEMIOB geoid expanded to degree and order 12 from the along- track altimeter dataß Profiles a-d are from the Antarctic plate, profiles f-i are from the Indo-Australian plate. Note the "quiet" nature of profile e which coincides roughly with the SEIR ridge crest (Figure 3).

3514 HAXBY AND WEISSEL' EVIDENCE FOR SMALL-SCALE MANTLE CONVECTION
. .•-..•-•-:L1 o •-
Fig. 6a
-I. 10 ø .-100 ' ß -; :•,':..;' ,.,½..-,7 ..,. ,..- ........ ,,,,... '
ß ., •,• - .•;•,, ::; ,'>-'.-,; ß % ',,•,. ,., f, ,•., /.• '..-5.-:- . g • ' ":"•;" ,• '. ;.,•."; .y
'?":•'i.
l0 . H
--1. 0
.... 20 •
Fig. 6b
Fig. 6. Residual sea surface heights plotted normal to (a) descending satellite tracks, (b) ascending satellite tracks, and (c) both sets of tracks. Residuals are displayed using the trackline set to the modal value of residuals along each track.

HAXBY AND WEISSEL' EVIDENCE FOR SMALL-SCALE MANTLE CONVECTION 3515
Fig. 6c
Z0. •
-2
smaller gravity undulations of the east central Pacific is incon- sistent with the observed seismicity.
A normal faulting mechanism was obtained rOkal, 1984] for an event near 20øS, 126øW just north of a swarm of earth- quakes in Miocene lithosphere east of the Austral fracture zone (Plate 1 and Figure 2). For this event, the T axis lies in the NE-SW quadrants at about 45 ø to the trends of the small- amplitude gravity undulations. An interesting association has been noted between young (<30 m.y. old) lithosphere and earthquakes having normal faulting mechanisms with T axes highly oblique to the local direction of relative plate motion [Bergman et al., 1984; Bergman and Solomon, 1984; Wiens and Stein, 1984]. Bergman and Solomon [1984] suggest that these events can be attributed to release of thermoelastic stresses
arising through the relatively rapid cooling of young oceanic lithosphere. However, such earthquakes might also be ex- pected in areas of the plates subjected to dynamic and thermal effects of small-scale mantle convection of the kind we have
described above (Plates 1 and 2 and Figure 5).
IMPLICATIONS FOR CONVECTION IN THE MANTLE
There seems little doubt that thermal convection occurs
within the earth, but there is still debate about the spatial scales and three-dimensional form of convection in the earth's
interior. Plate motions imply the existence of large-scale con- vecting systems in which material is circulated through the mantle from trenches toward ridges and the oceanic litho- sphere constitutes the cold and mechanically strong upper boundary layer of such systems. Kinematic models, consistent with global plate motions, have been developed to examine the plan form and sectional form of the return flow through the mantle rChase, 1979; Hager and O'Connell, 1979; Parmen- tier and Oliver, 1979]. Controversy surrounds whether the return flow is confined to the upper mantle above the 670-km seismic discontinuity [McKenzie et al., 1974; Richter and Mc- Kenzie, 1978-] or can occur over the entire mantle thickness
[e.g. Davies, 1977; Elsasser et al., 1979; Peltier, 1981a]. It seems likely however, that the depth extent of the large-scale circulation required by plate motions is strongly dependent on the radial distribution of viscosity in the mantle [Davies, 1977; Richter and McKenzie, 1978; Ha•7er and O'Connell, 1979].
Convection at spatial scales smaller than plate dimensions can result from the development of instabilities in the thermal boundary layers of the large-scale flow. A hot lower boundary layer and a cold upper boundary layer are characteristic of convection driven mainly by heating from below, while for convection resulting mainly from heat sources within the fluid, the hot lower boundary layer is absent [-see McKenzie et al., 1974]. Yuen and Peltier [1980] have argued that the hot lower boundary layer, which lies at the base of the mantle in their view, is particularly unstable owing to the strong temperature dependence of viscosity. They suggest that plumes, which sep- arate from the lower boundary layer and rise rapidly due to their buoyancy and low viscosity, provide an explanation for midplate topographic swells and volcanism.
Convective instability in the upper thermal boundary layer has been advocated to explain why ocean depths are system- atically less than depths predicted from the linear depth-(age) •/2 relation at plate ages greater than about 80 m.y. [Parsons and McKenzie, 1978; Houseman and McKenzie, 1982]. It is proposed that heat advected to the base of the plates by small-scale convection prevents ocean depths from reaching those predicted from conductive cooling of a half- space [Parker and Oldenburg, 1973; Davis and Lister, 1974]. However, Yuen et al. [1981] question this explanation on the grounds that the analytic models of Parsons and McKenzie [1978] ignored the large temperature dependence of viscosity which would tend to stabilize the cold upper boundary layer against breakdown into small-scale convection. Jarvis and Pel- tier [1980] suggest that a uniform distribution of radiogenic heat sources in the mantle provides a better explanation for the observed flattening of ocean depth with age.

3516 HAXBY AND WEISSEL: EVIDENCE FOR SMALL-SCALE MANTLE CONVECTION
-160 ø
20ø •
10 ø
0 ø
-10 ø
-20 ø
- 150 ø -140 ø - 130 ø - 120 ø -110 ø
j '. . .. : 1 i ;, " ß ß
:. :. : . [ ß
.[ .......... ß .... . : ß
[ :. -./ :.. .. j\ :: r i ". : '.
-160 ø -150 ø -140 ø -130 ø -120 ø
i :Pal.: :. : : .' /• ' I i L.K. • •. :. : : .' .: j __20 o
:. : . .: . . . .: : .... ß '-"" ; : '" " ß Plio. J ß . ....... . . : .' : ....
ß '.. ! :, :. _ ß ! !' _ j -110 ø
Fig. 7. Index map showing locations of surface ship gravity and bathymetry data (annotated bold lines) which are compared with Seasat-derived gravity anomalies in Figure 9. Along-track sea surface slopes from the descending Seasat arcs (solid lines) in the two areas A and B enclosed by dashed lines, were used in the coherence analysis shown in Figure 8. The dotted lines outline crustal age provinces as for Figure 2.
Nonetheless, the patterns of small-amplitude gravity and sea surface height undulations over seafloor as young as ,-, 5 m.y. discussed in this paper (Plates 1-3 and Figure 6) point to the development of convective instability in the upper bound- ary layer at ages much earlier than indicated from previous boundary layer stability analyses using constant viscosity fluids [Parsons and McKenzie, 1978; Houseman and Mc- Kenzie, 1982]. If convection occurs in approximately unit aspect ratio cells, then the dominant wavelengths of the undu- lations at their initial appearance over young crust require the thickness of the convecting layer to be about 100 km. Recent numerical studies by Buck [1984] utilizing a fluid with a pressure- and temperature-dependent viscosity reveal that small-scale convection develops within 5-10 m.y. of the start of plate cooling, producing gravity anomalies similar in wave- lengths and amplitudes to those we have reported in this paper. The temperature and pressure dependence of viscosity gives rise, in effect, to a zone of low viscosity below young oceanic lithosphere [Buck, 1984; Yuen and Fleitout, 1984]. The recent numerical modeling results support the earlier suggestion of Yuen et al. [1981] that a layer of pronounced low viscosity is required to destabilize the cold upper bound- ary layer of the large-scale circulation system.
We estimate the average viscosity of the convecting region
by utilizing the observations presented in this paper and the numerical experiments of Houseman and McKenzie [1982] on instabilities in the upper boundary layer. Although Houseman and McKenzie focused on the possibility of convective insta- bilities at larger spatial scales (,-, 600 km) and onset times than we observe, their results appropriately rescaled are applicable to the present discussion. Houseman and McKenzie found that a layer of constant viscosity overlain by a rigid conduc- ting lid and cooled from above becomes unstable when a criti- cal Rayleigh number for the boundary layer is reached. The Rayleigh number Ra of the boundary layer is given by
Ra = g•A Tr53/tcv (1)
where g is the gravitational acceleration, • is the coefficient of thermal expansion, •: is the thermal diffusivity, v is the kin- ematic viscosity, and AT is the temperature difference across the thermal boundary layer whose upper boundary is pre- scribed (corresponding to the thickness d of the conducting lid) and whose lower boundary is defined as an isotherm (where T• is the initial temperature of the boundary layer), and r5 is the thickness of the boundary layer. For a conductively cooling half-space,
r5 = 2(tot) 1/2 erf- 1 (y)- d (2)

HAXBY AND WEISSEL' EVIDENCE FOR SMALL-SCALE MANTLE CONVECTION 3517
o z
ß
ß
ß
ß
, e• I I I I ß I ß ß
/.0 '4
0.8•
• 0.•
o 0.4•
0.2 •
0.0 '
and
o
o
oo o
o Ooo ø o o o
o
o o øøo o o o o o
oo o o
o
o
o o øo
øo o o
o o o oo
o
o o o o
oo o o o
o
o oo oo o o o o
oo
o o o o oo o o o o o
o o o o o o o oøø o
i I i i I t i i i I 2'0 /b do
' 560 ' iro ' -' ' /g5 ' /6o '( ' 560 ' W•VELENGTH (KM) W•VELENGTH (KM)
Fig. 8. Results from the spatial coherence and phase difference analysis of sea surface slopes along descending tracks from the two areas A and B in Figure 7. The results are plotted as a function of wave number k and wavelength NAx/k, where N is the number of data samples used (equal to 512 in this analysis) and Ax is the data sampling interval (equal to 10 km).
(3) AT = T•{7 -- err [d/2(tct)•/2]}
The thickness of the thermal boundary layer (as defined above) increases with plate age. If the locally defined Rayleigh number (1) exceeds a critical value, the boundary layer be- comes unstable, and small-scale flow develops [Parsons and McKenzie, 1978' Houseman and McKenzie, 1982]. For 7 = 0.999, Houseman and McKenzie [1982] found a critical Rayleigh number of 1.8 x 10⁴ for the no-slip boundary con- ditions that we believe are appropriate for our analysis. By eliminating d from (2) and (3) and rearranging (1), we may find the kinematic viscosity v necessary for the onset of small-scale convection at time t. We assume AT = 400øC and T• = 1350øC, thus allowing the upper part of the thermally defined plate (between 0 and 950 ø) to correspond to the rigid lid, while the lower part corresponds to the thermal boundary layer.
Taking g= 10m s-2, •=3.5 x 10-so C-•, to=8 x 10 -? m 2 s-l, then for small-scale convection to be established in 5 m.y., the kinematic viscosity of the boundary layer is 4 x 10 •4 m 2 s-1. The value of v corresponds to a viscosity of 10 •8 Pa s (10 •9 P), which is about 3 orders of magnitude smaller than the value for mean mantle viscosity determined from postgla- cial rebound studies [e.g., Peltier, 1981b]. A similar value of the average viscosity required for convection to be active 5 m.y. after the start of plate cooling has been obtained from variable viscosity calculations [Jaupart, 1981; Buck, 1984], but the temperature drop across the thermal boundary layer in those calculations was found to be less than 300øC.
Several lines of evidence support the occurrence of a layer of low viscosity beneath young lithosphere. First, theoretical studies of convection at high Rayleigh numbers (such as whole mantle convection) yield a temperature distribution with depth that features a zone beneath the upper boundary layer where temperatures are higher than for the core of the convec- tion cell. The zone of elevated temperatures is thin and pro- nounced beneath young lithosphere but diminishes and thick-
o o o
o
o o
50 k
ens with lithospheric age. It follows that when large-scale con- vection occurs, temperature profiles through young litho- sphere into the mantle will differ from the familiar error func- tion form of the temperature-depth relation which describes the conductive cooling of a half-space. If viscosity depends exponentially on temperature in the mantle, a 200 ø temper- ature overshoot above the cell core temperature reduces vis- cosity in the zone below the upper boundary layer by 2-3 orders of magnitude relative to the viscosity of the bulk of the mantle [Yuen et al., 1981]. However, if viscosity depends on pressure as well as temperature, the pressure dependence may give rise to a narrow layer of pronounced low viscosity at shallow depths beneath young oceanic lithosphere [Buck, 1984; Yuen and Fleitout, 1984; Jaupart and Parsons, 1985].
Additional support for the existence of a low-viscosity layer in the upper mantle beneath young oceanic lithosphere comes from analyses of seismic surface wave data. Forsyth [1977], for example, used Rayleigh wave data to delineate a low shear wave velocity zone about 100 km thick beneath young (< 40 m.y.) lithosphere that tends to become less pronounced at greater ages. Wielandt and Knopoff [1982] found unusually low velocities down to about 200 km, with minimum velocities at depths < 100 km, from phase dispersion of Rayleigh waves along a path coinciding mainly with Miocene lithosphere west of the EPR. More recent analyses, based on a global inversion of surface wave data, have disclosed that low shear wave ve- locities are characteristic of the EPR and other spreading sys- tems and that these low velocities extend to appreciable depths in the upper mantle [Nakanishi and Anderson, 1983; Woodhouse and Dziewonski, 1984]. While we note that zones defined by low shear wave velocities and low viscosity may not be equivalent, both parameters are reduced by increasing temperature and also by the presence of a significant amount of partial melt.
CONCLUSIONS
Seasat altimeter data have provided the first evidence that unusual and subtle lineated patterns of gravity anomalies and

3518 HAXBY AND WEISSEL' EVIDENCE FOR SMALL-SCALE MANTLE CONVECTION
f l 1tE RED UNFII_TER ED < •oo o 20ø>
SCALE
SEASAT t GFZ t CFZ GRAVITY
HUDSON :
(31005
SEASAT
GRAVITY
TOPOGRAPHY
i GFZ MGALS
! METERS
lOOO I
MGALS
METERS
500
P7008
SEASAT
GRAVITY
½111o
Fig. 9. Comparison of filtered shipboard gravity and bathymetry profiles with Seasat-derived gravity anomalies recov- ered along the ship tracks (left-hand side). The shiptracks are located in Figure 7. The original, unfiltered surface ship data are plotted with reduced vertical scales (right-hand side). Circles with asterisks denote likely errors in the shipboard gravity data. Dotted lines locate the intersection of fracture zones with the shipboard profiles.
sea surface height variations occur over younger portions of fast-moving oceanic plates. Color relief images of marine grav- ity anomalies computed from Seasat measurements (Plates 1 and 2) and displays of filtered along-track sea surface heights
(Figure 6) both clearly show a pattern of lineated undulations over young portions of the Pacific and Indo-Australian plates. We suggest that these lineated patterns reflect the unex- pectedly early development of convective instability in the

HAXBY AND WEISSEL: EVIDENCE FOR SMALL-SCALE MANTLE CONVECTION 3519
boundary layer associated with cooling plates. Such convec- tive flow is organized into cells elongated parallel to plate motion due to shear imparted by fast moving plates. This interpretation is strongly supported by the observation that the lineated patterns trend in the direction of plate motion relative to the deep mantle and, in the case of the east central Pacific (Plate 1), the pattern clearly crosses the trends of major fracture zones. The altimeter data further suggest that small- scale convection develops within 5-10 m.y. of the start of plate cooling, and the wavelengths of the associated gravity anoma- lies suggest convection in a layer about 100 km thick beneath young seafloor. From the observed onset time we determine that the mean viscosity in the convecting layer is about 3 orders of magnitude lower than the mean viscosity of the mantle. Such a layer of low viscosity beneath young seafloor is consistent with a similarly located layer of low shear wave velocities determined from surface wave studies. Clearly, the unexpectedly early development of small-scale convection has important implications for the way in which we interpret em- pirical depth-age and geoid-age relations over the oceans.
Acknowledgments. The work reported in this paper was supported by the Office of Naval Research contracts N00014-80-C-0098 and N00014-84-C-0132 and National Science Foundation grants OCE 82- 02454 (J.K.W.) and OCE 82-08927 (W.F.H.). We thank Roger Buck and Barry Parsons for sharing their views on small-scale convection with us. The manuscript was critically reviewed by David Sandwell, Bob Detrick, and Tony Watts. Lamont-Doherty Geological Observa- tory contribution 3920.
REFERENCES
Anderson, R. N., and M. A. Hobart, The relation between heat flow, sediment thickness, and age in the eastern Pacific, J. Geophys. Res., 81, 2968-2989, 1976.
Bergman, E. A., and S.C. Solomon, Source mechanisms of earth- quakes near mid-ocean ridges from body waveform inversion: Im- plications for the early evolution of oceanic lithosphere, J. Geophys. Res., 89, 11415-11441, 1984.
Bergman, E. A., J. L. Nabelek, and S.C. Solomon, An extensive region of off-ridge normal-faulting earthquakes in the southern Indian Ocean, J. Geophys. Res., 89, 2425-2443, 1984.
Bernstein, R. L., G. H. Born, and R. H. Whritner, Seasat altimeter determination of ocean current variability, J. Geophys. Res., 87, 3261-3268, 1982.
Buck, W. R., Small-scale convection and the evolution of the litho- sphere, Ph.D. thesis, Mass. Inst. of Technol., Cambridge, 1984.
Chase, C. G., Asthenospheric counterflow, a kinematic model, Geo- phys. J. R. Astron. Soc., 56, 1-18, 1979.
Cheney, R. E., Comparison data for Seasat altimetry in the western North Atlantic, J. Geophys. Res., 87, 3247-3253, 1982.
Cochran, J. R., Regional variations in depth-age and gravity-age re- lationships across mid-ocean ridges (abstract), Eos Trans. AGU, 64, 310, 1983.
Dahlen, F. A., Isostatic geoid anomalies on a sphere, J. Geophys. Res., 87, 3943-3948, 1982.
Davies, G. F., Whole-mantle convection and plate tectonics, Geophys. d. R. Astron. Soc., 49, 459-486, 1977.
Davis, E. E., and C. R. B. Lister, Fundamentals of ridge crest topogra- phy, Earth Planet. Sci. Lett., 21, 405-413, 1974.
Dixon, T. H., and M. E. Parke, Bathymetry estimates in the southern ocean from Seasat altimetry, Nature, 304, 406-409, 1983.
Dixon, T. H., M. Naraghi, M. K. McNutt, and S. M. Smith, Bathy- metric prediction from Seasat altimeter data, J. Geophys. Res., 88, 1563-1571, 1983.
Elsasser, W. H., P. Olson, and B. D. Marsh, The depth of mantle convection, J. Geophys. Res., 84, 147-155, 1979.
Forsyth, D. W., The evolution of the upper mantle beneath mid-ocean ridges, Tectonophysics, 38, 89-118, 1977.
Fox, P. J., J. Madsen, D. McCormick, and K. C. McDonald, The along-strike properties of the axis of the East Pacific Rise between 13 ø and 23øS: Implications for plate accretion, Eos Trans. AGU, 64, 855, 1983.
Gallo, D. G., P. J. Fox, P. Lonsdale, and J. Madsen, The morpho- tectonic expression of the world's fastest-slipping plate boundary: The Garret transform, Eos Trans. AGU, 64, 855, 1983.
Geller, C. A., J. K. Weissel, and R. N. Anderson, Heat transfer and intraplate deformation in the central Indian Ocean, J. Geophys. Res., 88, 1018-1032, 1983.
Hager, B. H., and R. J. O'Connell, Kinematic models of large-scale flow in the earth's mantle, J. Geophys. Res., 84, 1031-1048, 1979.
Handschumacher, D. W., Post-Eocene plate tectonics of the eastern Pacific, in The Geophysics of the Pacific Ocean Basin and Its Mar- gins, Geophys. Monogr. Set., vol. 19, edited by G. D. Sutton, M. H. Manghanani, and R. Moberly, pp. 177-202, AGU, Washington, D. C., 1976.
Haxby, W. F., G. D. Karner, J. L. LaBrecque, and J. K. Weissel, Digital images of combined oceanic and continental data sets and their use in tectonic studies, Eos Trans. AGU, 64, 995-1004, 1983.
Hayes, D. E., Nature and implications of asymmetric sea-floor spreading, Geol. Soc. Am. Bull., 87, 994-1002, 1976.
Houseman, G., and D. P. McKenzie, Numerical experiments on the onset of convective instability in the earth's mantle, Geophys. J. R. Astron. Soc., 68, 133-164, 1982.
Jarvis, G. T., and W. R. Peltier, Oceanic bathymetry profiles flattened by radiogenic heating in a convecting mantle, Nature, 285, 649-651, 1980.
Jaupart, C., On the mechanisms of heat loss beneath continents and oceans, Ph.D. thesis, 215 pp., Mass. Inst. of Technol., Cambridge, 1981.
Jaupart, C., and B. Parsons, Convective instabilities in a variable viscosity fluid cooled from above, Phys. Earth Planet. Inter., 39, 14-32, 1985.
Lambeck, K., and R. G. Coleman, A search for seamounts in the southern Cook and Austral region, Geophys. Res. Lett., 9, 389-394, 1982.
Larson, R. L., W. C. Pitman, X. Golovchenko, S.C. Cande, J. F. Dewey, W. F. Haxby, and J. L. LaBrecque, The bedrock geology of the world (map), W. H. Freeman, New York, 1985.
Lazarewicz, A. R., and D.C. Schwank, Detection of uncharted sea- mounts using satellite altimeter data, Geophys. Res. Lett., 9, 385- 389, 1982.
Mammerickx, J., Depth anomalies in the Pacific: Active, fossil and precursor, Earth Planet. Sci. Lett., 53, 147-157, 1981.
Mammerickx, J., E. Herron, and L. Dorman, Evidence for two fossil spreading centers in the southeast Pacific, Geol. Soc. Am. Bull., 91, 263-271, 1980.
McKenzie, D. P., J. M. Roberts, and N. O. Weiss, Convection in the earth's mantle: Towards a numerical simulation, J. Fluid Mech., 62, 465-538, 1974.
McKenzie, D., A. Watts, B. Parsons, and M. Roufosse, Planform of mantle convection beneath the Pacific Ocean, Nature, 288, 442- 446, 1980.
Menard, H. W., and L. M. Dorman, Dependence of depth anomalies upon latitude and plate motion, J. Geophys. Res., 82, 5329-5335, 1977.
Minster, J. B., and T. H. Jordan, Present-day plate motions, J. Geo- phys. Res., 83, 5331-5354, 1978.
Nakanishi, I., and D. L. Anderson, Measurement of mantle wave velocities and inversion for lateral heterogeneity and anisotropy, 1, Analysis of great circle phase velocities, J. Geophys. Res., 88, 10267- 10286, 1983.
Newmark, R. L., M.D. Zoback, and R. N. Anderson, Orientation of in situ stresses in oceanic crust, Nature, 311,424-428, 1984.
Okal, E. A., Intraplate seismicity of the southern part of the Pacific plate, J. Geophys. Res., 89, 10053-10071, 1984.
Okal, E. A., J. Talandier, K. A. Sverdrup, and T. H. Jordan, Seismici- ty and tectonic stress in the south central Pacific, J. Geophys. Res., 85, 6479-6495, 1980.
Parker, R. L., and D. W. Oldenburg, Thermal models of ocean ridges, Nature Phys. Sci., 242, 137-139, 1973.
Parmentier, E. M., and J. E. Oliver, A study of shallow global mantle flow due to accretion and subduction of lithospheric plates, Geo- phys. J. R. Astron. Soc., 57, 1-21, 1979.
Parsons, B., and D. McKenzie, Mantle convection and the thermal structure of the plates, J. Geophys. Res., 83, 4485-4496, 1978.
Parsons, B., and J. G. Sclater, An analysis of the variation of ocean floor bathymetry and heat flow with age, J. Geophys. Res., 82, 803-827, 1977.
Peltier, W. R., Surface plates and thermal plumes: Separate scales of mantle convective circulation, in Evolution of the Earth, Geodyn. Ser., vol. 5, edited by R. J. O'Connell and W. S. Fyfe, pp. 229-248, AGU, Washington, D.C., 1981a.
Peltier, W. R., Ice age dynamics, Annu. Rev. Earth Planet. Sci., 9, 199-225, 1981b.

3520 HAXBY AND WEISSEL.' EVIDENCE FOR SMALL-SCALE MANTLE CONVECTION
Rapp, R. H., The determination of geoid undulations and gravity anomalies from Seasat altimeter data, J. Geophys. Res., 88, 1552- 1562, 1983.
Rea, D. K., Asymmetric sea-floor spreading and a non transform axis offset: The East Pacific Rise 20øS survey area, Geol. Soc. Am. Bull., 89, 836-844, 1978.
Richter, F. M., Convection and the large scale circulation of the mantle, J. Geophys. Res., 78, 8735-8745, 1973.
Richter, F., and D. McKenzie, Simple models of mantle convection, J. Geophys., 44, 441-471, 1978.
Richter, F. M., and B. Parsons, On the interaction of two scales of convection in the mantle, J. Geophys. Res., 80, 2529-2541, 1975.
Sandwell, D. T., Thermal isostasy: Response of a moving lithosphere to a distributed heat source, J. Geophys. Res., 87, 1001-1014, 1982.
Sandwell, D. T., A detailed view of the South Pacific geoid from satellite altimetry, J. Geophys. Res., 89, 1089-1104, 1984.
Stark, M., and D. W. Forsyth, The geoid, small-scale convection, and differential travel time anomalies of shear waves in the central
Indian Ocean, J. Geophys. Res., 88, 2273-2288, 1983. Tapley, B. D., G. H. Born, and M. E. Parke, The Seasat altimeter data
and its accuracy assessment, J. Geophys. Res., 87, 3179-3188, 1982. Watts, A. B., D. P. McKenzie, B. Parsons, and M. Roufosse, The
relationship between gravity and bathymetry in the Pacific Ocean, Geophys. J. R. Astron. Soc., 83, 263-298, 1985.
Weissel, J. K., and W. F. Haxby, A tectonic tour of the Indian Ocean via the Seasat satellite (abstract), Eos Trans. AGU, 64, 185, 1984.
Weissel, J. K., R. N. Anderson, and C. A. Geller, Deformation of the Indo-Australian plate, Nature, 287, 284-291, 1980.
Wielandt, E., and L. Knopoff, Dispersion of very long-period Ray- leigh waves along the East Pacific Rise: Evidence for S wave veloci- ty anomalies down to 450-km depth, J. Geophys. Res., 87, 8631- 8641, 1982.
Wiens, D. A., and S. Stein, Age dependence of oceanic intraplate seismicity and implications for lithospheric evolution, J. Geophys. Res., 88, 6455-6468, 1983.
Wiens, D. A., and S. Stein, Intraplate seismicity and stresses in young oceanic lithosphere, J. Geophys. Res., 89, 11442-11464, 1984.
Woodhouse, J. H., and A.M. Dziewonski, Mapping the upper mantle: Three-dimensional modeling of earth structure by inver- sion of seismic waveforms, J. Geophys. Res., 89, 5953-5986, 1984.
Yuen, D. A., and L. Fleitout, Stability of the oceanic lithosphere with variable viscosity: An initial-value approach, Phys. Earth Planet. Inter., 34, 173-185, 1984.
Yuen, D. A., and W. R. Peltier, Mantle plumes and the stability of the D" layer, Geophys. Res. Lett., 7, 625-628, 1980.
Yuen, D. A., W. R. Peltier, and G. Schubert, On the existence of a second scale of convection in the upper mantle, Geophys. d. R. Astron. Soc., 65, 171-190, 1981.
W. F. Haxby and J. K. Weissel, Lamont-Doherty Geological Ob- servatory, Palisades, NY 10964.
(Received November 26, 1984; revised October 4, 1985;
accepted October 11, 1985.)

HAXBY AND WEISSEL' EVIDENCE FOR SMALL-SCALE MANTLE CONVECTION 3899
lO*
O ø
- 60' -- 50' - 40' -t30' - *' -- t' - 00'
+ + + + + + + +
+ + + + + + + + + +
+ + + + +
+ + + + -I, + + + +
.:: + + + + +
--10' ' + + + + + + + + +
+ + + + +
+ + + + ß -• +
+ + + + -• +
-- e + + + + + + +
40
o
o
15
1o
5
1
-1
-5
-lO
-20
-30
-160' -150'
0" +
+ + +
-140' -130' -120' -110' -100'
+ + + + + + +
100 + + + + + + + + + +
,. + + + + + + + + + + + +
•,..,
+ + + -• + + + + + + +
+ + .•, + + + + + + + + +
-100 + 4- + + + + + + + +
+ - + + + + + + + +
-20' + + 9 + + + + + +
500
1ooo
1500
2500
3500
4500
+ + + + + + ,,. + •- 500
- e + + + + + + + + + + +
Plate 1 [Haxby and Weissel]. (a) Color relief image in Mercator projection of gravity anomalies derived from Seasat altimeter data over the east central Pacific (see Figure 1 for location). Fifteen colors are used to contour the data as shown by the bar scale on the right. In addition, 256 shade variations for each color are used to simulate illumination of the data set by a light source to the NNE. Small white crosses occur every 5 ø of latitude and longitude. Small red squares with yellow centers are earthquake epicenters from the U.S. Geological Survey PDE file (depth 0-70 km, r% > 4.5) for events that occurred between 1961 and 1981. (b) Color relief image in Mercator projection of DBDB5 digital depth data from the east central Pacific. Fifteen colors are used to contour the data at 500-m intervals as shown by the bar scale on the right. Illumination is from the NNE and the remaining symbols are the same as for Plate la.

3900 HAXBY AND WEISSEL.' EVIDENCE FOR SMALL-SCALE MANTLE CONVECTION