Evidence for Human Lung Stem Cells suppl
76
Supplementary Appendix This appendix has been provided by the authors to give readers additional information about their work. Supplement to: Kajstura J, Rota M, Hall SR, et al. Evidence for human lung stem cells. N Engl J Med 2011;364:1795- 806.
Transcript of Evidence for Human Lung Stem Cells suppl

Supplementary Appendix
This appendix has been provided by the authors to give readers additional information about their work.
Supplement to: Kajstura J, Rota M, Hall SR, et al. Evidence for human lung stem cells. N Engl J Med 2011;364:1795-806.

Legends to Supplementary Figures
Figure 1. Culture of hLSCs. In vitro expansion of sorted c-kit-positive cells over time
(green).
Figure 2. hLSC Phenotype. Panel A: Bivariate distribution plots of CD34-positive
human bone marrow cells after collagenase treatment, and human lung cells negative for
c-kit. SSC: side scatter. Panel B: Bivariate distribution plots of c-kit-positive cells
negative for hematopoietic cell lineages (CD34, CD45, CD133, cocktail of bone marrow
lineage markers), mesenchymal stromal cell antigens (CD44, CD90, CD105), and mast
cell epitopes (CD45, tryptase, CD6, CD29, CD49d, CD49e). Panel C: The c-kit-positive
cells are largely negative for markers of lung cells (TTF1, p63, CK5, pan-CK, SPC, Ets1,
GATA6, vWf, α-SMA). Panel D: hLSC clones in Terasaki plates. Clones generated by c-
kit positive lineage-negative cells continue to express the stem cell marker. Cloning
efficiency is shown in individual cases and as mean ± SD. Panel E: Bivariate distribution
plots of c-kit and epitopes specific for lung cell classes document the undifferentiated
phenotype of clonal hLSCs.
Figure 3. Expression of c-kit and Lineage Markers in hLSCs. Panel A: qRT-PCR and
immunoprecipitation/Western blotting of clonal hLSCs, hCSCs, and bone marrow cells
(BM). C-kit protein was detected at 145 and 120 kDa. The mature form of the receptor
capable of binding to stem cell factor has a molecular weight of 145 kDa. Panel B:
Nucleotide sequences obtained in sense and anti-sense directions confirmed that the
amplified PCR products corresponded to the expected c-kit human gene. Panel C: qRT-
PCR of transcripts for TTF1, p63, CK5, SPC, CC10, and CFTR. Representative curves

2
and PCR products are shown. Human β2microglobulin (B2M) was used as housekeeping
gene.
Figure 4. Differentiation of hLSCs. Panel A: Bivariate distribution plots of clonal
lineage negative c-kit-positive hLSCs following exposure to dexamethasone; hLSCs
expressed markers of epithelial cells (TTF1, p63, pan-CK, CK5, SPC), ECs (Ets1, vWf),
and SMCs (GATA6, α-SMA). Panel B: Differentiating clonal c-kit-positive cells express
TTF1 (white), SPC (magenta), pan-CK (red), Ets1 (yellow), vWf (bright blue), GATA6
(white), and α-SMA (yellow). Panel C: Quantitative data collected by FACS and
immunolabeling. Values are shown as mean ± SD. Panel D: hLSCs do not acquire the
myocyte lineage, and hCSCs do not form lung epithelial cells.
Figure 5. hLSCs and Pluripotency Genes. Panel A: Immunolabeling of NANOG
(white), OCT3/4 (yellow), SOX2 (magenta), and KLF4 (bright blue) in undifferentiated
clonal c-kit-positive hLSCs (green). Panel B: Nucleotide sequences obtained in sense and
anti-sense directions confirmed that the amplified PCR products corresponded to the
expected human genes.
Figure 6. Division of Clonal hLSC. Panel A: Dividing hLSC in which chromosomes are
organized in telophase (left panel); α-adaptin is uniformly distributed in the dividing stem
cell (central panel, blue), documenting symmetric division. Right panel, merge. Panel B:
Dividing hLSC in which chromosomes are organized in telophase (left panel); α-adaptin
is not uniformly distributed in the dividing stem cell (central panel, blue), demonstrating
asymmetric division. The absence of TTF1 in one of the daughter cells and the presence
of TTF1 (arrow) in the other suggests the formation of a daughter stem cell and an early
committed epithelial cell. Panel C: Dividing hLSC in which chromosomes are organized

3
in telophase (left panel); α-adaptin is not uniformly distributed in the dividing stem cell
(central panel, blue), documenting asymmetric division. The absence of Ets1 in one of the
daughter cells and the presence of Ets1 in the other (arrow) suggests the formation of a
daughter stem cell and an early committed EC.
Figure 7. Cryoinjured Lesion of the Lung. Panel A: Mouse lung one day following
cryoinjury. Illustration of a single injection of clonal c-kit-EGFP-positive hLSCs mixed
with 1% rhodamine-labeled microspheres (RM) delivered in proximity to the cryoinjured
region of the lung (CI). Panel B: Shortly after cryoinjury, epithelial cells are positive for
TdT labeling of nuclei (white) and show residual labeling for pan-CK (red). Panel C: At
14 days after cryoinjury, fibroblasts (procoll, magenta) replace the damaged parenchyma.
A few apoptotic nuclei, positive for TdT (white), are also present.
Figure 8. Division of Clonal hLSCs In Vivo. Panels A-C: Symmetric (arrows) and
asymmetric (arrowheads) division of clonal EGFP-positive hLSCs (green) 2 days after
injection in proximity to the injured lung; α-adaptin (magenta) is uniformly distributed in
the dividing cells (arrows) or is restricted to one of the two daughter cells (arrowheads).
TTF1, GATA6, or Ets1 is expressed in the committed hLSCs (asterisks). Nuclei, DAPI
(white). Panel D: Data are shown as mean ± SD. C, clonal: NC, non-clonal.
Figure 9. hLSCs and Lung Regeneration. Ten days after non-clonal-hLSC delivery, the
cryoinjured (CI) region is partially replaced by EGFP-positive (upper left, green), Alu-
positive (upper central, white), and pan-CK-positive (upper right, red) human alveoli,
which are shown at higher magnification in the insets. Recipient mouse epithelial cells,
positive for pan-CK but EGFP-negative, are present at the periphery of the regenerated
tissue. The yellow dotted line defines this boundary. The regenerated lung contains

4
EGFP-positive vascular profiles (lower panels); they are included in the small rectangles
at low magnification and are then shown at higher magnification in the insets. ECs are
positive for EGFP (left, green), Alu (central: white, arrowheads), and vWf (right,
magenta).
Figure 10. hLSCs Generate Alveoli In Vivo. Clonal (upper panel) and non-clonal
(lower panel) hLSCs formed alveoli expressing EGFP (green) and pro-SPC (red) or SPC
(red).
Figure 11. hLSCs Generate Bronchioles In Vivo. Panel A: EGFP-positive (upper left)
pan-CK-positive (upper right) human bronchiole. A thin layer of SMCs, positive for α-
SMA (bright blue), is also present (upper right). Alu sequences (lower left, white dots).
Lower right, merge. Panel B: Cluster of EGFP-positive hLSCs (upper left) in the initial
stages of epithelial cell organization (open arrows), adjacent to a recipient mouse
bronchiole (asterisks), which is EGFP-negative (upper left). Both structures are pan-CK-
positive (upper right) and α-SMA-negative (lower left). Lower right, merge. Panel C:
EGFP-positive hLSCs (upper left) in the initial stages of epithelial cell organization (open
arrows) and a newly-formed, well-developed EGFP-positive human bronchiole (arrows)
are adjacent to a recipient EGFP-negative mouse bronchiole (asterisks). These structures
are pan-CK-positive (upper right) and α-SMA-negative (lower left). A recipient mouse
vessel (v), which is EGFP-negative and α-SMA-positive, is present in the same field.
Lower right, merge. Inset, Note the cytoplasmic localization of α-SMA and pan-CK.
Panel D: Newly-formed, EGFP-positive human bronchiole (arrows) is adjacent to a
recipient EGFP-negative (upper left) mouse bronchiole (asterisks). Both structures are
pan-CK-positive (upper right) and α-SMA-negative (lower left). Lower right, merge.

5
Figure 12. hLSCs Generate Pulmonary Vessels. Panel A: Examples of newly-formed
human pulmonary arterioles. In all cases, the vessel wall is composed of EGFP-positive
(left, green) SMCs, expressing α-SMA (central, red), and ECs, expressing vWf (central,
bright blue). Right, merge. In the lower right panel the localization of Alu is shown
(white dots).
Figure 13. Lung Regeneration. Lung regeneration by clonal (C) and non-clonal (NC)
hLSCs.
Figure 14. Spectral Analysis. Panels A-J: Emission spectra from native EGFP (A), and
immunolabeled EGFP (B), pan-CK (C), pro-SPC (D), SPC (E), CC10 (F), AP-5 (G), Alu
(H), α-SMA (I), and vWf (J). The signals from EGFP and all other labels are represented
by green lines, while tissue autofluorescence is illustrated by the blue lines. Note the
difference in the intensity of the signals at wavelengths reflecting maximum fluorescence
in each case. Following normalization for the intensity of the signals for each label, all
emission spectra were essentially superimposable. In contrast, the emission spectra for
tissue autofluorescence had a different shape and were easily distinguishable from the
specific signals of native EGFP and immunolabeled proteins.
Figure 15. Human HSCs and hCSCs. Panel A: Four EGFP-positive (green, arrows)
undifferentiated hCSCs are seen 10 days after cryoinjury and cell implantation. Panel B:
Three Alu-positive human HSCs (white nuclear dots, arrows) are seen in the damaged
lung.
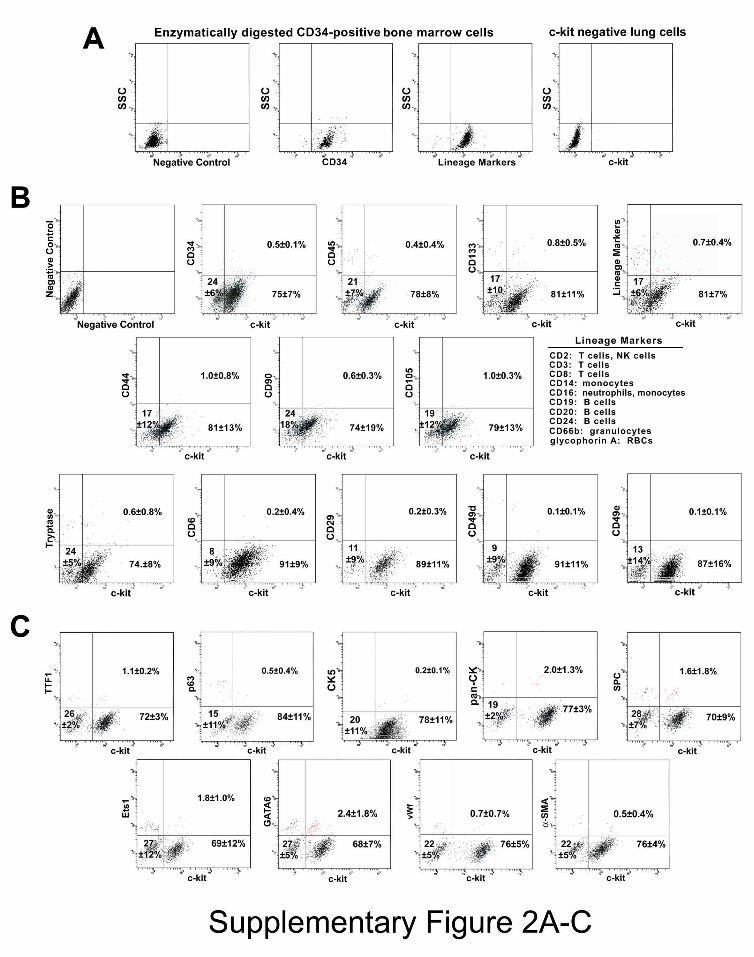
Figure 16. Expression of Human Genes and Lung Regeneration. Panel A: Transcripts
of human epithelial cell genes (TTF1, TP63, CFTR, Krt18, CC10, SFTPC, AQP5, T1α),
EC genes (ETS1, PECAM1), and SMC gene (TGFBR1). β2-microglobulin (B2M) and β-

6
actin (ACTB) were used as housekeeping genes. ACTB primers identify β-actin in both
mouse and human lungs. Additionally, mouse and human lung were used as negative and
positive controls, respectively. Panel B: Nucleotide sequences obtained in sense and anti-
sense directions confirmed that the amplified PCR products corresponded to the expected
human genes.
Figure 17. Absence of Evidence for Cell Fusion. Panels A-E: Bronchiolar epithelial
cells are EGFP-positive (A) and pan-CK-positive (B). In the lower region of this field,
alveoli are EGFP-negative and correspond to the recipient mouse lung. Panel C: merge.
The two areas included in the rectangles (C) are shown at higher magnification (D and
E). Regenerated, EGFP-positive, pan-CK-positive bronchiolar epithelial cells carry only
human X-chromosomes (D: hX-Chr, white dots). Alveolar epithelial cells from the
recipient mouse lung are EGFP-negative and carry only mouse X-chromosomes (E: mX-
Chr, magenta dots).
Figure 18. Absence of Evidence for Cell Fusion. Panels A-C: The epithelial cells of
newly formed alveoli are EGFP-positive (A) and pan-CK-positive (B). Panel C: merge.
The area included in the rectangle is shown at higher magnification in the lower panels.
EGFP-positive pan-CK-positive alveolar epithelial cells carry only human X-
chromosomes (hX-Chr, white dots).
Figure 19. Absence of Evidence for Cell Fusion. Panels A-C: Regenerated vessel
composed of EGFP-positive (A) ECs (B: vWf, bright blue) and SMCs (B: α-SMA, red).
Panel C: merge. The area included in the rectangle is shown at higher magnification in
the lower panels. EGFP-positive vWf-positive and EGFP-positive α-SMA-positive
vascular cells carry only human X-chromosomes (hX-Chr, white dots). Mouse X-

7
chromosomes (mX-Chr, magenta dots) are located outside the wall of the regenerated
vessel.
Figure 20. Scheme of Ex Vivo Experiments by Two-Photon Microscopy. As shown in
the left part of the scheme, airways were perfused continuously with an oxygenated
Tyrode solution containing rhodamine-labeled dextran, which has a MW of 70,000 Da
and red fluorescence. Pre-existing mouse alveoli and regenerated human alveoli were
identified by the absence and presence of EGFP labeling, respectively. In this
preparation, structures positive for EGFP but negative for rhodamine reflected newly
formed vessels. In a complementary protocol shown in the right part of the scheme, the
pulmonary artery was perfused in an identical manner and pre-existing mouse vessels and
regenerated human vessels were identified by the absence and presence of EGFP labeling
of the vessel wall, respectively. In this preparation, structures positive for EGFP but
negative for rhodamine reflected newly formed alveoli. Two examples are provided in
the lower two panels to illustrate the appearance of alveoli (left) and distal pulmonary
vessels (right) in a normal intact mouse lung.
Figure 21. Integration of Regenerated Lung Structures. Panels A and B: Airways
were perfused with rhodamine-labeled dextran. The red structures (A, left) correspond to
individual alveoli (a) which are EGFP-positive (A, central). Right, merge. Structures
positive for EGFP (A, central) but negative for rhodamine (A, left) reflect newly formed
vessels (v). The area in the rectangle (A) is shown at higher magnification (B). Two
alveoli and several vessels are in close proximity. Panels C and D: The pulmonary
vasculature was perfused with rhodamine-labeled dextran. The red structures (C, left)
correspond to distal pulmonary vessels (v) which are EGFP-positive (C, central). Right,

8
merge. Structures positive for EGFP (C, central) but negative for rhodamine (C, left)
correspond to newly formed alveoli (a). The areas in rectangles (C) are shown at higher
magnification (D). Two vessels and several alveoli are in close proximity.
Figure 22. Localization of hLSCs in Bronchioles. Panel A: Bronchiole, ~1.2 mm in
diameter, with epithelial cells, positive for pan-CK, and SMCs, positive for α-SMA.
Cartilage is also seen (bright blue). The basal cells of the epithelial lining express p63 in
their nuclei (white). Several c-kit-positive cells (green) are present within the bronchiolar
wall and its proximity. The 4 areas included in the rectangles are shown sequentially at
higher magnification in the subsequent panels. In all cases, the basal epithelium also
contains c-kit-positive cells which express p63 in their nuclei (white) and cytokeratin 5
(CK5, magenta; arrows) in their cytoplasm (see insets). The basal epithelium contains
also c-kit-positive cells negative for p63 and CK5 (asterisks). Panel B: Bronchiole
composed of pan-CK-positive epithelial cells (red). C-kit-positive cells are present within
the bronchiolar wall and its proximity. The 3 areas included in the rectangles are shown
sequentially at higher magnification in the lower panels. C-kit-positive cells (green) are
connected by E-cadh (white, arrows) to bronchiolar epithelial cells (Area 1), SMCs (α-
SMA, yellow; Area 2), and fibroblasts (procoll, bright blue; Area 3).
Figure 23. hLSCs and Fetal Lung. Three examples of fetal lungs with scattered c-kit-
positive cells (green, arrows), negative for a combination of transcription factors (TFs)
typical of lung cells ascertained simultaneously (TFs: TTF1, p63, Ets1, GATA6; yellow).
Insets: c-kit-positive cells are connected by E-cadh (white; arrowheads) to epithelial cells
of non-expanded alveoli.

9
Figure 24. hLSCs and Committed Cells. Panel A: An epithelial progenitor located in
the alveolar wall (pan-CK, red) is shown at higher magnification in the inset; this
progenitor cell retains the stem cell antigen c-kit (green) and expresses the epithelial
transcription factor TTF1 (white, arrow). Panel B: An epithelial precursor within the
alveolar wall is shown at higher magnification in the inset. This cell is positive for c-kit
and pro-SPC (white, arrow). Panel C: Another epithelial precursor positive for c-kit and
pan-CK (arrow) is apparent in the bronchiolar epithelium. Panel D: Endothelial and SMC
progenitors located in the arteriolar wall are illustrated at higher magnification in the
insets. These progenitor cells are c-kit-positive and express Ets1 (magenta) or GATA6
(white). von Willebrand factor (vWf), bright blue; α-smooth muscle actin (α-SMA),
yellow.
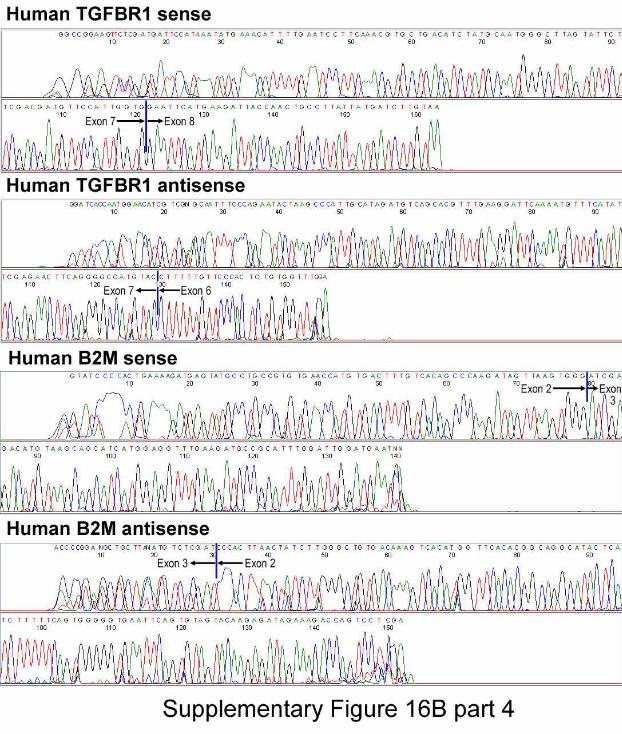
Figure 25. Quantitative Analysis of hLSCs in the Adult Lung. Panel A: Number and
distribution of adult hLSCs. Results are shown as means ± SD. *P<0.05 vs. bronchioles
(Bro). Alv, alveoli; Epith, epithelial cells; CT, connective tissue. Panel B: Distribution of
hLSCs in alveoli and bronchioles of different size.
Figure 26. Embryonic-Fetal Lung. Panel A: Embryonic-fetal lungs with scattered c-kit-
positive cells (green, arrows), positive for NANOG (white), OCT3/4 (yellow), SOX2
(magenta), and KLF4 (bright blue). Collapsed lung tissue is labeled by pan-CK (red).
Panels B: c-kit-positive cells (green, arrows) express TTF1 (white), p63 (yellow), Ets1
(magenta), and GATA6 (bright blue). Collapsed lung tissue is labeled by pan-CK (red).
Panel C: Number of embryonic-fetal hLSCs in the 9 samples examined. Gestational age
is indicated in weeks.


10
METHODS
Human Lungs
The protocol employed to obtain discarded lung tissue was approved by the Partners
Human Research Committee and the New England Organ Bank. Informed consent was
obtained for research purposes of unused lung donor tissue samples. We studied 12
normal human lungs obtained from donor organs not employed for transplantation. Nine
embryonic-fetal lungs were also studied. In the latter samples, the cause of death was
acute trauma in one case, true knot of the umbilical cord in another instance, premature
rupture of the chorioamniotic membrane in 2 cases, and voluntary pregnancy termination
in 5 cases. Tissue sections from these embryonic-fetal lungs were obtained from the
Department of Pathology, University of Parma Medical School, Parma, Italy.
Adult donor lungs were harvested by the transplant team and later declined for
transplantation. Thus, the patients had 1) no known history of lung disease, 2) a chest x-
ray without evidence of abnormalities, and 3) normal gas exchange (ratio of partial
pressure of oxygen, PaO2, to fractional concentration of oxygen, FiO2, greater than 300).
Moreover, all donors underwent bronchoscopy with bronchoalveolar lavage to assess
lung injury or infection. These criteria excluded that the donor lungs had apparent
pathologies. The majority of the harvested human lungs declined for transplantation were
due to focal injury (focal aspiration in a single lung with the contralateral lung used for a
transplant), anatomical variations of one of the lungs not allowing it to be transplanted, or
lack of an appropriate recipient for one of the lungs with the contralateral lung being used

11
for transplant. During the harvesting procedure, the lungs were likely exposed to 100%
oxygen for 1-2 hours while the donor was in the operating room. Additional information
on the donor lungs, such as age, gender, and smoking history, was not available.
Lung samples were fixed in formalin and embedded in paraffin. These specimens
were used to identify putative stem cell niches and putative human lung stem cells
(hLSCs). The localization of these primitive cells in the distal airway was determined by
immunolabeling with antibodies against the stem cell antigen c-kit.1-4 Epithelial cells
were labeled by TTF1, p63, pan-CK, CK-5, pro-SPC, SPC, CC10, and AQ-5; aggrecan
was employed to label cartilage. ECs and vascular and non-vascular SMCs were detected
with anti-vWf and anti-α-SMA, respectively. Fibroblasts were identified by procollagen.
hLSCs were labeled with Oct3/4, Nanog, Sox2, and Klf4 antibodies. Adherens junctions
between hLSCs and epithelial cells, SMCs, and fibroblasts were defined by the
expression of E-cadherin (E-cadh). The presence of mast cells was assessed by the
surface antigens CD6, CD29, CD45, CD49d, and CD49e, and the hydrolytic enzyme
tryptase.1-4 A complete list of antibodies and the modality of labeling for these epitopes
are listed in Table 1 in the Supplementary Appendix.
Morphometric Analysis of hLSCs
Following the identification of hLSCs, the number of these primitive cells per mm2 of
alveolar parenchyma and bronchioles was determined, utilizing methodologies
commonly employed in our laboratory.5,6 Subsequently, the number of hLSCs per mm2 of
bronchiolar epithelial cells, SMCs, and peri-bronchiolar fibroblasts was evaluated.
Similarly, the frequency of epithelial, SMC, and fibroblast nuclei in bronchioles and
adjacent connective tissue was assessed. The diameter of hLSCs was next measured by

12
confocal microscopy; 20-30 hLSC profiles were sampled in each lung. From the
distribution of hLSC diameters, the average hLSC volume and the number of hLSCs per
cm3 of lung tissue were obtained.7,8 An identical protocol was employed for the
quantitative analysis of hLSCs in the embryonic-fetal lung. As the specific gravity of the
human lung9 is 0.11g/cm3, the number of hLSCs per unit mass was derived. The diameter
of bronchioles was acquired by measuring the perimeter of each profile to compute the
average diameter.
hLSCs
For the isolation of lung stem cells from fresh tissue, we obtained 8 samples from the
Brigham and Women’s Hospital Thoracic Surgery Tissue Bank. The tissue bank provides
fresh tissue to investigators with IRB approval (protocol number 2008P000241). The
lung tissue is obtained from patients sent to surgery for diagnosis of an abnormal focal
lung process. The most normal appearing lung tissue from the periphery of the sample
was provided for the harvest of cells. In two cases, the preserved structure was confirmed
by histology and the absence of malignant-appearing cells documented.
The size of the specimens varied from 1-2 cm3. For the isolation of hLSCs,
fragments were enzymatically dissociated employing a protocol developed in our
laboratory. By this methodology, tissue fragments were enzymatically dissociated in a
solution containing collagenase to obtain a single cell suspension. Cells were expanded
and, after FACS sorting, cell phenotype was defined by immunocytochemistry.1-4
Putative hLSCs were then cultured in F12 medium (Gibco) supplemented with 10% FBS
(Gibco).3,4 At P2-P3, cells were characterized by FACS and immunolabeling to detect
lineage negative hLSCs.3,4

13
FACS Analysis
This protocol included c-kit-positive hLSCs, c-kit negative lung cells, and CD34-positive
human bone marrow cells (Lonza Inc.). C-kit-negative lung cells reflected the fraction of
cells not recognized by immunomagnetic beads conjugated with the c-kit antibody.
Additionally, CD34-positive human bone marrow cells were exposed to collagenase, 1
mg/ml, for 20 min at 37°C, to determine whether enzymatic digestion removed the
specific surface epitopes. In all cases, cells were fixed in 4% paraformaldehyde for 15
min at room temperature and analyzed by FACS. C-kit-negative lung cells and CD34-
positive human bone marrow cells treated by collagenase were tested for c-kit expression
and for specific hematopoietic markers, respectively. C-kit-positive cells were tested for
markers of hematopoietic cell lineages, mesenchymal stromal cells, mast cells, and
transcription factors and cytoplasmic proteins typical of pulmonary cell classes. The
antibodies used in this assay are listed in Table 1 in the Supplementary Appendix. This
analysis was performed by FACSAria (Becton Dickinson). Cellular debris and aggregates
were gated out based on forward scatter and side scatter. Gating on the signal of the
nuclear stain DAPI was employed to exclude additional artifacts. Isotype-matched
negative controls were utilized to define the threshold for each specific signal and
establish the appropriate gate for positive cells.1-4,10 Data were analyzed with the
instrument software.
Immunocytochemistry of Isolated hLSCs
For immunolabeling, hLSCs were fixed in 4% paraformaldehyde for 15 min at room
temperature. When possible, primary antibodies were directly labeled with fluorochromes
(Molecular Probes) to avoid cross-reactivity.3,4,11,12 Antibodies for immunocytochemistry

14
are listed in Table 1 in the Supplementary Appendix. Omission of the primary antibody
and isotype-matched irrelevant antibodies were employed as negative controls. C-kit-
negative lung cells (see above) were utilized to document the specificity of c-kit staining.
Cloning Assay and Clonal Cell Differentiation
FACS-sorted lineage-negative c-kit-positive cells were deposited in single wells of
Terasaki plates or plated at limiting dilution, 1 cell/20 mm2. In each culture dish, doublets
of cells were excluded by microscopic examination. After 3-4 weeks, clones of identical
cells were obtained.1-4 Clones were collected directly from the Terasaki plates or by
cloning cylinders and expanded in F12 medium.3,4 Differentiation of clonal cells was
induced by MEM containing 10% FBS and 10-8 M dexamethasone.1-4 Cell phenotypes
were defined by FACS analysis, qRT-PCR, Western blotting and immunocytochemistry.
The inability of hLSCs to give rise to cardiac cell lineages and human cardiac stem cells
to differentiate into pulmonary cells was established by FACS.
hLSC Division
Symmetric and asymmetric division3,4,8 of hLSCs was determined by immunolabeling
mitotic cells with α-adaptin antibody. Mitotic chromosomes were identified by staining
with propidium iodide. To establish the fate of daughter cells, antibodies for markers of
commitment to epithelial, endothelial and smooth muscle cells were employed: they
included TTF1, Ets1, and GATA6, respectively.
Lentiviral Infection
hLSCs were infected with a lentivirus carrying EGFP in the presence of 8 μg/ml
polybrene.3,4,10 After overnight incubation at 37°C, fresh medium was added. Five days

15
later, the efficiency of infection was established by measuring the fraction of hLSCs
showing native EGFP fluorescence. Efficiency of infection was 80±5 (n=7).
Lung Injury and Regeneration
Under ketamine (120 mg/kg bw) and xylazine (0.5 mg/kg bw) anesthesia,3,11,12 C57Bl/6
female mice immunosuppressed with cyclosporine A (5 mg/kg/day) were mechanically
ventilated, the chest opened, and a cryoinjury, ~2-3 mm3 in volume, was induced in the
left lung with a stainless steel probe pre-cooled in liquid nitrogen. The area of damage
was identified by the pale color of the affected tissue. Shortly thereafter, 6 needle
injections of clonal or non-clonal hLSCs, previously infected with a lentivirus carrying
EGFP,3,4,10,13 were administered in the region adjacent to the damaged parenchyma. Each
injection consisted of ~20,000 cells mixed with 1% rhodamine-labeled polystyrene
microspheres. This protocol allowed the direct visualization of the site of injection and
the accuracy of cell delivery.3,4,12,13 . In separate groups of animals, similar injections of
human HSCs, hCSCs, and c-kit-negative human lung cells were performed. The chest
was closed and the animals were allowed to recover. Injured mice not injected with
hLSCs were used as controls. BrdU, 50 mg/kg body weight, was delivered i.p. twice a
day to define the response of the mouse lung after injury. Animals were sacrificed at 12
hours, and 2 and 10-14 days following surgery by i.p. administration of sodium
pentobarbital, 75 mg/kg bw. The lung was perfused through the trachea with PBS for 1
minute and with 10% phosphate-buffered formalin for 15 min.14 Perfusion pressure was
kept at 20 mmHg. Subsequently, the lung was excised, immersed in formalin for 24
hours, and embedded in paraffin.
Serial Transplantation of hLSCs

16
Ten-fourteen days after cryoinjury and hLSC implantation, regenerated lungs were
excised and subjected to enzymatic digestion to obtain a single cell suspension. EGFP-
positive c-kit-positive hLSCs were sorted by FACS and injected immediately in new
recipient immunosuppressed mice following a protocol identical to that described above.
Animals were sacrificed ten days later; the lung was excised, immersed in formalin for 24
hours, and embedded in paraffin.
Immunohistochemistry and In Situ Hybridization
Antibodies were used to detect human pulmonary structures within the recipient mouse
lung (Table 1 in the Supplementary Appendix). Human cells were detected by EGFP
localization and by in situ hybridization with a probe against the human-specific Alu
repeat sequences.3,4 Human X-chromosome and mouse X-chromosome were also
identified.3,4 Images were assembled with Adobe Photoshop 7.0 software according to the
standard protocol detailed in the Nature guidelines for digital images. Processing
included the assignment of pseudo-colors and changes in brightness. It was applied
uniformly across the entire image and was used exclusively to equalize the appearance of
multiple panels in a single figure.
Spectral Analysis
This methodology was performed with a Zeiss LSM510 Meta confocal microscope
(Zeiss) utilizing the meta detector and the lambda acquisition mode. Lung sections were
stained with DAPI only and the native fluorescence of EGFP was examined. Formalin-
fixed tissue exhibits some autofluorescence due to cross-linking of proteins by the
aldehyde groups of the fixative. The spectral properties of EGFP and formalin cross-
linked cellular proteins are different. Intrinsic EGFP fluorescence was excited at 488 nm

17
with an argon laser and its fluorescence intensity was recorded generating a lambda stack
ranging from 492 to 748 nm at 10.7 nm intervals. The lens and corresponding numerical
aperture were 60X and 1.4, respectively.
For each region of interest, a graph plotting mean pixel intensity and the emission
wavelength of the lambda stack was generated. To compare the shape of each curve
obtained from EGFP-positive and EGFP-negative structures, the values of emission
spectra were normalized by dividing the intensity of each wavelength by the peak signal.
The spectrum obtained from EGFP-positive cells exhibited a major peak at ~525 nm,
with a smaller peak at ~560 nm. In contrast, the spectrum of autofluorescence was more
uniformly spread across the range of wavelengths and did not show a clearly defined
peak of emission.10,15-17 In an identical manner, we analyzed immunolabeled EGFP-
positive structures, including epithelial cells and SMCs.
Two-Photon Microscopy
Ten-fourteen days after lung cryoinjury and implantation of EGFP-positive clonal or non-
clonal hLSCs, the lungs together with the trachea and the heart were excised. Normal
mouse lungs were employed to define the pattern of rhodamine labeling of alveoli and
pulmonary vessels (Fig. 20 in the Supplementary Appendix). The preparation was placed
in a bath mounted on the stage of a two-photon microscope (Bio-Rad Radiance 2100MP).
Subsequently, the lungs were continuously perfused at a pressure of 20 mmHg through
the trachea or pulmonary artery with PBS containing rhodamine-labeled dextran, which
has a MW of 70 kDa and red fluorescence. This molecule does not cross the endothelial
or epithelial barrier, allowing the visualization of the pulmonary vasculature or the
respiratory tree, respectively. Rhodamine is covalently bound to dextran and has inherent

18
red fluorescence so that these two distinct pulmonary compartments could be detected by
two-photon microscopy. Mouse recipient pulmonary structures were by necessity EGFP-
negative while the regenerated distal airways and vessels were EGFP-positive,
constituting the progeny of the injected hLSCs (Fig. 20 in the Supplementary Appendix).
All experiments were performed at 37°C. The microscope was positioned to view
the area of injury and the adjacent parenchyma. EGFP and rhodamine were excited at 900
nm with a mode-locked Ti:Sapphire femtosecond laser (Tsunami, Spectra-Physics) and
the corresponding images were acquired at emission wavelengths of 525 and 600 nm,
respectively.13,18-21 Collagen was visualized by second harmonic generation, which is the
product of two-photon excitation and periodic structure of collagen. Thus, the red
fluorescence of rhodamine-labeled dextran, the green fluorescence of EGFP, and the blue
fluorescence of collagen were detected directly in the injured lung.
When the trachea was perfused with rhodamine-labeled dextran, the newly-
formed airway structures were both EGFP-positive (green) and rhodamine-positive (red);
however, with this approach, the regenerated pulmonary vasculature was EGFP-positive
(green) and rhodamine-negative (non-red). Conversely, when the pulmonary artery was
perfused with rhodamine-labeled dextran, the newly-formed vessels were both EGFP-
positive (green) and rhodamine-positive (red) while the regenerated airways were EGFP-
positive (green) and rhodamine-negative (non-red).
Quantitative RT-PCR
Total RNA was extracted with TRIzol from clonal hLSCs for the detection of transcripts
for c-kit, the stemness genes Oct3/4, Nanog, Sox2 and Klf4, and epithelial lineage genes.
CD34 human bone marrow cells and Kazumi lymphoma cells were used as positive

19
controls for c-kit expression. Additionally, RNA was obtained from the mouse lung 1-2
weeks after cryoinjury and injection of clonal and non-clonal hLSCs. cDNA was
generated from 2 μg of total RNA incubated with oligo(dT)15 primer for 2 hours at 37°C.
RT-PCR was performed on 7300 Real Time PCR Systems (Applied Biosystems) using
1/20th of the cDNA per reaction.21-23 Cycling conditions were as follows: 95°C for 10
minutes followed by 35 cycles of amplification (95°C denaturation for 15 seconds, and
60°C combined annealing/extension for 1 minute). Human-specific primers (see below)
were designed with the Vector NTI software (Invitrogen). Quantified values were
normalized against the input determined by the housekeeping human gene β2
microglobulin. Human lung total RNA (Applied Biosystems) and RNA extracted from an
untreated mouse lung were used as positive and negative controls, respectively.
PCR products were run on 2% agarose/1x TBE gel and DNA bands with the
expected molecular size were obtained. DNA was extracted with QIAquick Gel
Extraction Kit (Qiagen), eluted in 30 μl of 10 mM Tris buffer (pH 8.5) and amplified by
Platinum Blue PCR Supermix in the presence of the same forward and reverse primers
used for real-time RT-PCR. PCR reaction was carried out in an Eppendorf
Mastercycler.21-23 Cycling conditions were as follows: 94°C for 2 minutes, followed by
20 cycles of amplification (94°C denaturation for 15 seconds, 60°C annealing for 30
seconds, 72°C elongation for 15 seconds) with a final incubation at 72°C for 2 minutes.
After purification using QIAquick PCR Purification kit, samples were submitted to the
DNA Sequencing Facility at Dana-Farber/Harvard Cancer Center to obtain the DNA
sequence. The human origin of the transcripts was confirmed by employing BLAST
searches.

20
Mouse ACTB (β-actin; amplicon size: 126 bp) [cross-react with Human]
Forward: 5’- AGAAGGAGATTACTGCTCTGGCTC -3’
Reverse: 5’- ACATCTGCTGGAAGGTGGACA -3’
B2M (β2 microglobulin; amplicon size: 176 bp)
Forward: 5’- CAAGGACTGGTCTTTCTATCTCTTG -3’
Reverse: 5’- ATTCATCCAATCCAAATGCG -3’
c-kit (amplicon size:146 bp)
Forward: 5’- GCACCTGCTGAAATGTATGACATAAT -3’
Reverse: 5’- CTGCAGTTTGCTAAGTTGGAGTAAAT -3’
OCT3/4 (amplicon size: 165 bp)
Forward: 5’- AGGAGAAGCTGGAGCAAAA - 3’
Reverse: 5’ - GGCTGAATACCTTCCCAAA - 3’
NANOG (amplicon size: 133 bp)
Forward: 5’- GGTCCCGGTCAAGAAACAGA - 3’
Reverse: 5’ - GAGGTTCAGGATGTTGGAGA - 3’
SOX2 (amplicon size: 155 bp)
F: CCAGCTCGCAGACCTACA
R: CCTGGAGTGGGAGGAAGA
KLF4 (amplicon size: 144 bp)
Forward: 5’ - GACTTCCCCCAGTGCTTC - 3’
Reverse: 5’ - CGTTGAACTCCTCGGTCTC - 3’
TP63 (amplicon size: 185 bp)
Forward: 5’- AAAGCAGCAAGTTTCGGACAGTAC - 3’

21
Reverse: 5’ - CCAGGGACTCTTTGATCTTCAACAG - 3’
KRT5 (cytokeratin 5; amplicon size: 162 bp)
Forward: 5’- AGGGCGAGGAATGCAGACTC - 3’
Reverse: 5’ - TGCTACCTCCGGCAAGACCT - 3’
TTF1 (Nkx2-1; amplicon size: 116 bp)
Forward: 5’- CATGAGGAACAGCGCCTCTG -3’
Reverse: 5’- CGCCCATGCCGCTCATG -3’
SCGB1A1 (Clara cells 10 kDa secretory protein; amplicon size: 191 bp)
Forward: 5’- TCACCCTCACCCTGGTCACA -3’
Reverse: 5’- GGTGTCCACCAGCTTCTTCAGC -3’
SFTPC (surfactant protein C; amplicon size: 161 bp)
Forward: 5’- CACTGGCCTCGTGGTGTATG -3’
Reverse: 5’- CCTGCAGAGAGCATTCCATC -3’
CFTR (cystic fibrosis transmembrane conductance regulator; amplicon size: 159 bp)
Forward: 5’- GAAGCAATGCTGGAATGCCAAC -3’
Reverse: 5’- CTTGCTTGAGTTCCGGTGGG -3’
KRT18 (keratin 18; amplicon size: 164 bp)
Forward: 5’- CTGGAAGATGGCGAGGACTTTAATC -3’
Reverse: 5’- GGTACCCTGCTTCTGCTGG -3’
T1α (podoplanin; amplicon size: 175 bp)
Forward: 5’- CAGTCCACGCGCAAGAACAAAG -3’
Reverse: 5’- GCACCAATGAAGCCGATGGC -3’
AQP5 (aquaporin 5; amplicon size: 198 bp)

22
Forward: 5’- GTCCATTGGCCTGTCTGTCACC -3’
Reverse: 5’- GAGTTGGGGAAGAGCAGGTAGAAG -3’
ETS1 (v-ets erythroblastosis virus E26 oncogene homolog 1; amplicon size: 186 bp)
Forward: 5’- GCTATCAAACAAGAAGTCGTCACC -3’
Reverse: 5’- GAAGCTGTCATAGGAGGGAACA -3’
PECAM1 (CD31; amplicon size: 194 bp)
Forward: 5’- TAAAGAGCCTCTGAACTCAGACG -3’
Reverse: 5’- CATCTGGCCTTGCTGTCTAAG -3’
TGFBR1 (TGF β receptor 1; amplicon size: 191 bp)
Forward: 5’- CAAACCACAGAGTGGGAACA -3’
Reverse: 5’- TACAAGATCATAATAAGGCAGTTGG -3’
Immunoprecipitation and Western Blotting
Protein lysates of hLSCs before and after exposure to dexamethasone were obtained
using RIPA buffer (Sigma) and protease inhibitors. Equivalents of 20-50 μg of proteins
were separated on 8-12% SDS-PAGE, transferred onto PVDF membranes (Bio-Rad) and
subjected to Western blotting with Oct3/4 (rabbit polyclonal, Novus Biologicals), Nanog
(rabbit polyclonal, Abnova), Sox2 (mouse monoclonal, Abcam), and Klf4 (mouse
monoclonal, Abcam) antibodies diluted 1:100 in TBST overnight at 4ºC. HRP-
conjugated anti-IgG were used as secondary antibodies. Proteins were detected by
chemiluminescence (SuperSignal West Femto Maximum Sensitivity Substrate, Thermo
Scientific) and optical density was measured. Loading conditions were determined by the
expression of GAPDH (Millipore) and/or by Ponceau S (Sigma) staining of the
membrane after transfer.19,22,23 For c-kit expression, 50-100 μg of proteins were

23
immunoprecipitated with c-kit antibody (mouse monoclonal, Serotec) and subjected to
Western blotting with c-kit antibody (rabbit polyclonal, Cell Signaling; #3074). CD34-
positive bone marrow cells and Kazumi lymphoma cells were used as positive controls.
The mature form of the c-kit receptor, capable of binding stem cell factor, corresponds to
a 145 kDa band. The lower molecular weight form of c-kit at 120 kDa was also found.
Statistical Analysis
The number of animals in each study and the magnitude of sampling employed in each in
vitro and in vivo determination are listed in Table 2 in the Supplementary Appendix. In
all cases, results are presented as mean±SD. Statistical significance was determined by
the analysis of variance and Bonferroni method or Student’s t test; P<0.05 was
considered significant.24
References
1. Beltrami AP, Barlucchi L, Torella D, Baker M, Limana F, Chimenti S, Kasahara H,
Rota M, Musso E, Urbanek K, Leri A, Kajstura J, Nadal-Ginard B, Anversa P. Adult
cardiac stem cells are multipotent and support myocardial regeneration. Cell
2003;114:763-76.
2. Linke A, Müller P, Nurzynska D, Casarsa C, Torella D, Nascimbene A, Castaldo C,
Cascapera S, Böhm M, Quaini F, Urbanek K, Leri A, Hintze TH, Kajstura J, Anversa P.
Stem cells in the dog heart are self-renewing, clonogenic, and multipotent and regenerate
infarcted myocardium, improving cardiac function. Proc Natl Acad Sci USA
2005;102:8966-71.
3. Bearzi C, Rota M, Hosoda T, Tillmanns J, Nascimbene A, De Angelis A, Yasuzawa-
Amano S, Trofimova I, Siggins RW, LeCapitaine N, Cascapera S, Beltrami AP,

24
D'Alessandro DA, Zias E, Quaini F, Urbanek K, Michler RE, Bolli R, Kajstura J, Leri A,
Anversa P. Human cardiac stem cells. Proc Natl Acad Sci USA 2007;104:14068-73.
4. Bearzi C, Leri A, Lo Monaco F, Rota M, Gonzalez A, Hosoda T, Pepe M, Qanud K,
Ojaimi C, Bardelli S, D'Amario D, D'Alessandro DA, Michler RE, Dimmeler S, Zeiher
AM, Urbanek K, Hintze TH, Kajstura J, Anversa P. Identification of a coronary vascular
progenitor cell in the human heart. Proc Natl Acad Sci USA 2009;106:15885-90.
5. Loud AV, Anversa P. Morphometric analysis of biologic processes. Lab Invest 1984;
50:250-61.
6. Anversa P, Olivetti G (2002) in Handbook of Physiology, eds. Page E, Fozzard H,
Solaro R. (Oxford University Press, New York) Section 2, Vol. 1, pp 75-144.
7. Urbanek K, Quaini F, Tasca G, Torella D, Castaldo C, Nadal-Ginard B, Leri A,
Kajstura J, Quaini E, Anversa P. Intense myocyte formation from cardiac stem cells in
human cardiac hypertrophy. Proc Natl Acad Sci USA 2003;100:10440-5.
8. Urbanek K, Torella D, Sheikh F, De Angelis A, Nurzynska D, Silvestri F, Beltrami
CA, Bussani R, Beltrami AP, Quaini F, Bolli R, Leri A, Kajstura J, Anversa P.
Myocardial regeneration by activation of multipotent cardiac stem cells in ischemic heart
failure. Proc Natl Acad Sci USA 2005;12:8692-7.
9. Nelson MD, Haykowsky MJ, Mayne JR, Jones RL, Petersen SR. Effects of self-
contained breathing apparatus on ventricular function during strenuous exercise. J Appl
Physiol 2009;106:395-402.
10. Hosoda T, D'Amario D, Cabral-Da-Silva MC, Zheng H, Padin-Iruegas ME, Ogorek
B, Ferreira-Martins J, Yasuzawa-Amano S, Amano K, Ide-Iwata N, Cheng W, Rota M,

25
Urbanek K, Kajstura J, Anversa P, Leri A. Clonality of mouse and human
cardiomyogenesis in vivo. Proc Natl Acad Sci USA 2009;106:17169-74.
11. Urbanek K, Cesselli D, Rota M, Nascimbene A, De Angelis A, Hosoda T, Bearzi C,
Boni A, Bolli R, Kajstura J, Anversa P, Leri A. Stem cell niches in the adult mouse heart.
Proc Natl Acad Sci USA 2006;103:9226-31.
12. Rota M, Kajstura J, Hosoda T, Bearzi C, Vitale S, Esposito G, Iaffaldano G, Padin-
Iruegas ME, Gonzalez A, Rizzi R, Small N, Muraski J, Alvarez R, Chen X, Urbanek K,
Bolli R, Houser SR, Leri A, Sussman MA, Anversa P. Bone marrow cells adopt the
cardiomyogenic fate in vivo. Proc Natl Acad Sci USA 2007;104:17783-8.
13. Tillmanns J, Rota M, Hosoda T, Misao Y, Esposito G, Gonzalez A, Vitale S, Parolin
C, Yasuzawa-Amano S, Muraski J, De Angelis A, LeCapitaine N, Siggins RW, Loredo
M, Bearzi C, Bolli R, Urbanek K, Leri A, Kajstura J, Anversa P. Formation of large
coronary arteries by cardiac progenitor cells. Proc Natl Acad Sci USA 2008;105:1668-73.
14. Song Y, Coleman L, Shi J, Beppu H, Sato K, Walsh K, Loscalzo J, Zhang YY.
Inflammation, endothelial injury, and persistent pulmonary hypertension in heterozygous
BMPR2-mutant mice. Am J Physiol 2008;295:H677-90.
15. D'Alessandro DA, Kajstura J, Hosoda T, Gatti A, Bello R, Mosna F, Bardelli S,
Zheng H, D'Amario D, Padin-Iruegas ME, Carvalho AB, Rota M, Zembala MO, Stern D,
Rimoldi O, Urbanek K, Michler RE, Leri A, Anversa P. Progenitor cells from the
explanted heart generate immunocompatible myocardium within the transplanted donor
heart. Circ Res 2009;105:1128-40.
16. Kajstura J, Urbanek K, Perl S, Hosoda T, Zheng H, Ogórek B, Ferreira-Martins J,
Goichberg P, Rondon-Clavo C, Sanada F, D'Amario D, Rota M, Del Monte F, Orlic D,

26
Tisdale J, Leri A, Anversa P. Cardiomyogenesis in the adult human heart. Circ Res
2010;107:305-15.
17. Kajstura J, Gurusamy N, Ogórek B, Goichberg P, Clavo-Rondon C, Hosoda T,
D’Amario D, Bardelli S, Beltrami AP, Cesselli D, Bussani R, del Monte F, Quaini F,
Rota M, Beltrami CA, Buchholz BA, Leri A, Anversa P. Myocyte turnover in the aging
human heart. Circ Res In press, 2010.
18. Dawn B, Stein AB, Urbanek K, Rota M, Whang B, Rastaldo R, Torella D, Tang XL,
Rezazadeh A, Kajstura J, Leri A, Hunt G, Varma J, Prabhu SD, Anversa P, Bolli R.
Cardiac stem cells delivered intravascularly traverse the vessel barrier, regenerate
infarcted myocardium, and improve cardiac function. Proc Natl Acad Sci USA
2005;102:3766-71.
19. Urbanek K, Rota M, Cascapera S, Bearzi C, Nascimbene A, De Angelis A, Hosoda T,
Chimenti S, Baker M, Limana F, Nurzynska D, Torella D, Rotatori F, Rastaldo R, Musso
E, Quaini F, Leri A, Kajstura J, Anversa P. Cardiac stem cells possess growth factor-
receptor systems that after activation regenerate the infarcted myocardium, improving
ventricular function and long-term survival. Circ Res 2005;97:663-73.
20. Rota M, Padin-Iruegas ME, Misao Y, De Angelis A, Maestroni S, Ferreira-Martins J,
Fiumana E, Rastaldo R, Arcarese ML, Mitchell TS, Boni A, Bolli R, Urbanek K, Hosoda
T, Anversa P, Leri A, Kajstura J. Local activation or implantation of cardiac progenitor
cells rescues scarred infarcted myocardium improving cardiac function. Circ Res
2008;103:107-16.
21. Gonzalez A, Rota M, Nurzynska D, Misao Y, Tillmanns J, Ojaimi C, Padin-Iruegas
ME, Müller P, Esposito G, Bearzi C, Vitale S, Dawn B, Sanganalmath SK, Baker M,

27
Hintze TH, Bolli R, Urbanek K, Hosoda T, Anversa P, Kajstura J, Leri A. Activation of
cardiac progenitor cells reverses the failing heart senescent phenotype and prolongs
lifespan. Circ Res 2008;102:597-606.
22. Boni A, Urbanek K, Nascimbene A, Hosoda T, Zheng H, Delucchi F, Amano K,
Gonzalez A, Vitale S, Ojaimi C, Rizzi R, Bolli R, Yutzey KE, Rota M, Kajstura J,
Anversa P, Leri A. Notch1 regulates the fate of cardiac progenitor cells. Proc Natl Acad
Sci USA 2008;105:15529-34.
23. Urbanek K, Cabral-da-Silva MC, Ide-Iwata N, Maestroni S, Delucchi F, Zheng H,
Ferreira-Martins J, Ogórek B, D'Amario D, Bauer M, Zerbini G, Rota M, Hosoda T, Liao
R, Anversa P, Kajstura J, Leri A. Inhibition of notch1-dependent cardiomyogenesis leads
to a dilated myopathy in the neonatal heart. Circ Res 2010;107:429-41.
24. Berenson ML, Levine DM, Rindskopf D (1988) in Applied Statistics (Prentice Hall,
Englewood Cliffs) pp 362-418.

28
Table 1. Antibodies and Probes
_________________________________________________________________________________
Epitope Manufacturer Host Animal Labeling
___________________________________________________________________________________
Cytoplasmic markers
EGFP Molecular Probes rabbit polyclonal direct indirect FITC, TRITC
Pan-cytokeratin Sigma mouse monoclonal direct indirect TRITC, Cy5
Cytokeratin 5 Epitomics rabbit monoclonal indirect TRITC, Cy5
pro-SPC Abcam rabbit polyclonal indirect FITC, TRITC, Cy5
SPC Sigma rabbit polyclonal indirect TRITC, Cy5
*CC10 Abcam rabbit polyclonal indirect FITC, TRITC, Cy5
α-SMA Sigma mouse monoclonal direct indirect TRITC, Cy5
vWf DAKO rabbit polyclonal indirect TRITC, Cy5
Tryptase Abcam mouse monoclonal indirect TRITC, Cy5
Procollagen Santa Cruz goat polyclonal indirect TRITC, Cy5
Aggrecan Santa Cruz rabbit polyclonal indirect Cy5

29
α-adaptin Abcam mouse monoclonal indirect Cy5
Nuclear markers
TTF1 Abcam rabbit polyclonal indirect FITC, TRITC
p63 Abcam rabbit polyclonal indirect FITC, Cy5
Ets1 Abcam rabbit polyclonal indirect FITC, TRITC
GATA6 Abcam rabbit polyclonal indirect FITC, TRITC
SOX2 Abcam mouse monoclonal indirect TRITC, Cy5
OCT3/4 Abcam rabbit polyclonal indirect TRITC, Cy5
KLF4 Abcam rabbit polyclonal indirect TRITC, Cy5
NANOG Abcam rabbit polyclonal indirect TRITC, Cy5
Alu Biogenex N/A direct, indirect Cy5
Human X-chromosome Vysis N/A direct FITC
Mouse X-chromosome Cambio N/A direct Cy3
BrdU Roche mouse monoclonal indirect TRITC, Cy5
Membrane markers
c-kit DAKO rabbit polyclonal indirect FITC, TRITC, Cy5

30
E-cadherin Sigma rabbit polyclonal direct indirect TRITC,
Aquaporin-5 Abcam rabbit polyclonal indirect TRITC, Cy5
CD6 Abcam mouse monoclonal indirect Cy5
CD29 Abcam mouse monoclonal indirect Cy5
CD34 Becton Dickinson mouse monoclonal direct, indirect Cy5
CD44 Becton Dickinson mouse monoclonal direct, indirect Cy5
CD45 Becton Dickinson mouse monoclonal direct, indirect Cy5
CD49d Abcam rat monoclonal indirect Cy5
CD49e Abcam mouse monoclonal indirect Cy5
CD90 Becton Dickinson mouse monoclonal direct, indirect Cy5
CD105 Becton Dickinson mouse monoclonal direct, indirect Cy5
CD133 Abcam mouse monoclonal indirect Cy5
Lineage markers Becton Dickinson mouse monoclonal indirect Cy5
_____________________________________________________________________________________

31
*CC10: This antibody was carefully selected because the
antibody from Santa Cruz results in a nuclear localization of
Clara cells which is not consistent with the secretory
property of this protein. The specificity of the Abcam
antibody is shown here in Clara cells at high magnification.
Arrows point to secretory vesicles. Specificity was
confirmed by spectral analysis.

32
Table 2. Magnitude of sampling and n Values
_____________________________________________________________________________
Parameter n value Aggregate sample size Sample size
(mean ± SD)
___________________________________________________________________________
Adult human lung specimens
Sample 1 98 mm2
Sample 2 124 mm2
Sample 3 75 mm2
Sample 4 112 mm2
Sample 5 84 mm2
Sample 6 55 mm2
Sample 7 66 mm2
Sample 8 104 mm2
Sample 9 126 mm2
Sample 10 226 mm2
Sample 11 238 mm2
Sample 12 174 mm2
All Samples 12 1,484 mm2 124±57 mm2
Bronchioles 12 508a 42±24a
c-kit positive hLSCs 12 454b 38±15b
Embryonic-fetal human lung specimens
Sample 1 27 mm2

33
Sample 2 49 mm2
Sample 3 37 mm2
Sample 4 29 mm2
Sample 5 38 mm2
Sample 6 62 mm2
Sample 7 30 mm2
Sample 8 29 mm2
Sample 9 32 mm2
All Samples 9 332 mm2 37±11 mm2
c-kit positive hLSCs 9 230b 26±24b
hLSC Clones
Limiting dilution 5 410c 82±14c
Single cell deposition 5 80c 16±8c
Immunophenotype of isolated hLSCs
Immunocytochemistry
Undifferentiated clonal hLSCs 4 16,774d 3,355±336d
Differentiated clonal hLSCs 4 6,415d 1,283±219d
FACS of hLSCs
Hematopoietic markers 4 21,946d 5,487±510d
Mast cell markers 4 44,998d 11,250±2,030d
Mesenchymal cell markers 4 16,007d 4,002±465d
Undifferentiated non-clonal hLSCs 4 93,388d 23,347±4,986d
Undifferentiated clonal hLSCs 4 165,600d 41,400±6,551d

34
Differentiated clonal hLSCs 4 82,065d 20,516±2,530d
Pluripotency gene products 4 6,260d 1,565±289d
c-kit negative lung cells 4 12,433d 3,108±1,259d
bone marrow cells 3 19,376d 6,459±845d
hCSCs 4 16,078d 4,020±556d
Untreated injured lungs
4 6.3 mm2 1.6±0.4 mm2
Pulmonary repair
Clonal hLSCs, 12 hours-2 days 4 396 mm2 99±22 mm2
Clonal hLSCs, 10-14 days 7 785 mm2 112±31 mm2
Non-clonal hLSCs, 10-14 days 14 1,221 mm2 87±26 mm2
HSCs, 10 days 6 129 mm2 22±8 mm2
hCSCs 6 114 mm2 19±7 mm2
c-kit negative human lung cells 6 109 mm2 18±6 mm2
Isolation of hLSCs from regenerated lung 17 N/A N/A
Serial transplantation of clonal hLSCs 8 362 mm2 46±13 mm2
Two-photon microscopy
Airway-perfused 5 8.1 mm3 1.6±0.6 mm3
Vasculature-perfused 5 9.8 mm3 2.0±0.9 mm3
Control mouse lung 3 4.6 mm3 1.5±0.3 mm3 _____________________________________________________________________________
a Number of bronchioles counted; b Number hLSCs identified; c Number of clones formed;
d Number of cells assessed; d, days; N/A, not applicable.