EVERY HOME COUNTS - Vista Land
132
Las Piñas Business Center National Road,Talon Las Piñas City, Philippines Tel: +63 2 874 5758 Fax: +63 2 872 4697 EVERY HOME COUNTS Untitled-1 1 6/11/12 2:10:48 PM
-
Upload
khangminh22 -
Category
Documents
-
view
0 -
download
0
Transcript of EVERY HOME COUNTS - Vista Land

�L�a�s��P�i�ñ�a�s��B�u�s�i�n�e�s�s��C�e�n�t�e�r�N�a�t�i�o�n�a�l��R�o�a�d�,��T�a�l�o�n�L�a�s��P�i�ñ�a�s��C�i�t�y�,��P�h�i�l�i�p�p�i�n�e�s�T�e�l�:���+�6�3��2��8�7�4��5�7�5�8�F�a�x�:��+�6�3��2��8�7�2��4�6�9�7
EVERY HOME COUNTS
Untitled-1 1 6/11/12 2:10:48 PM
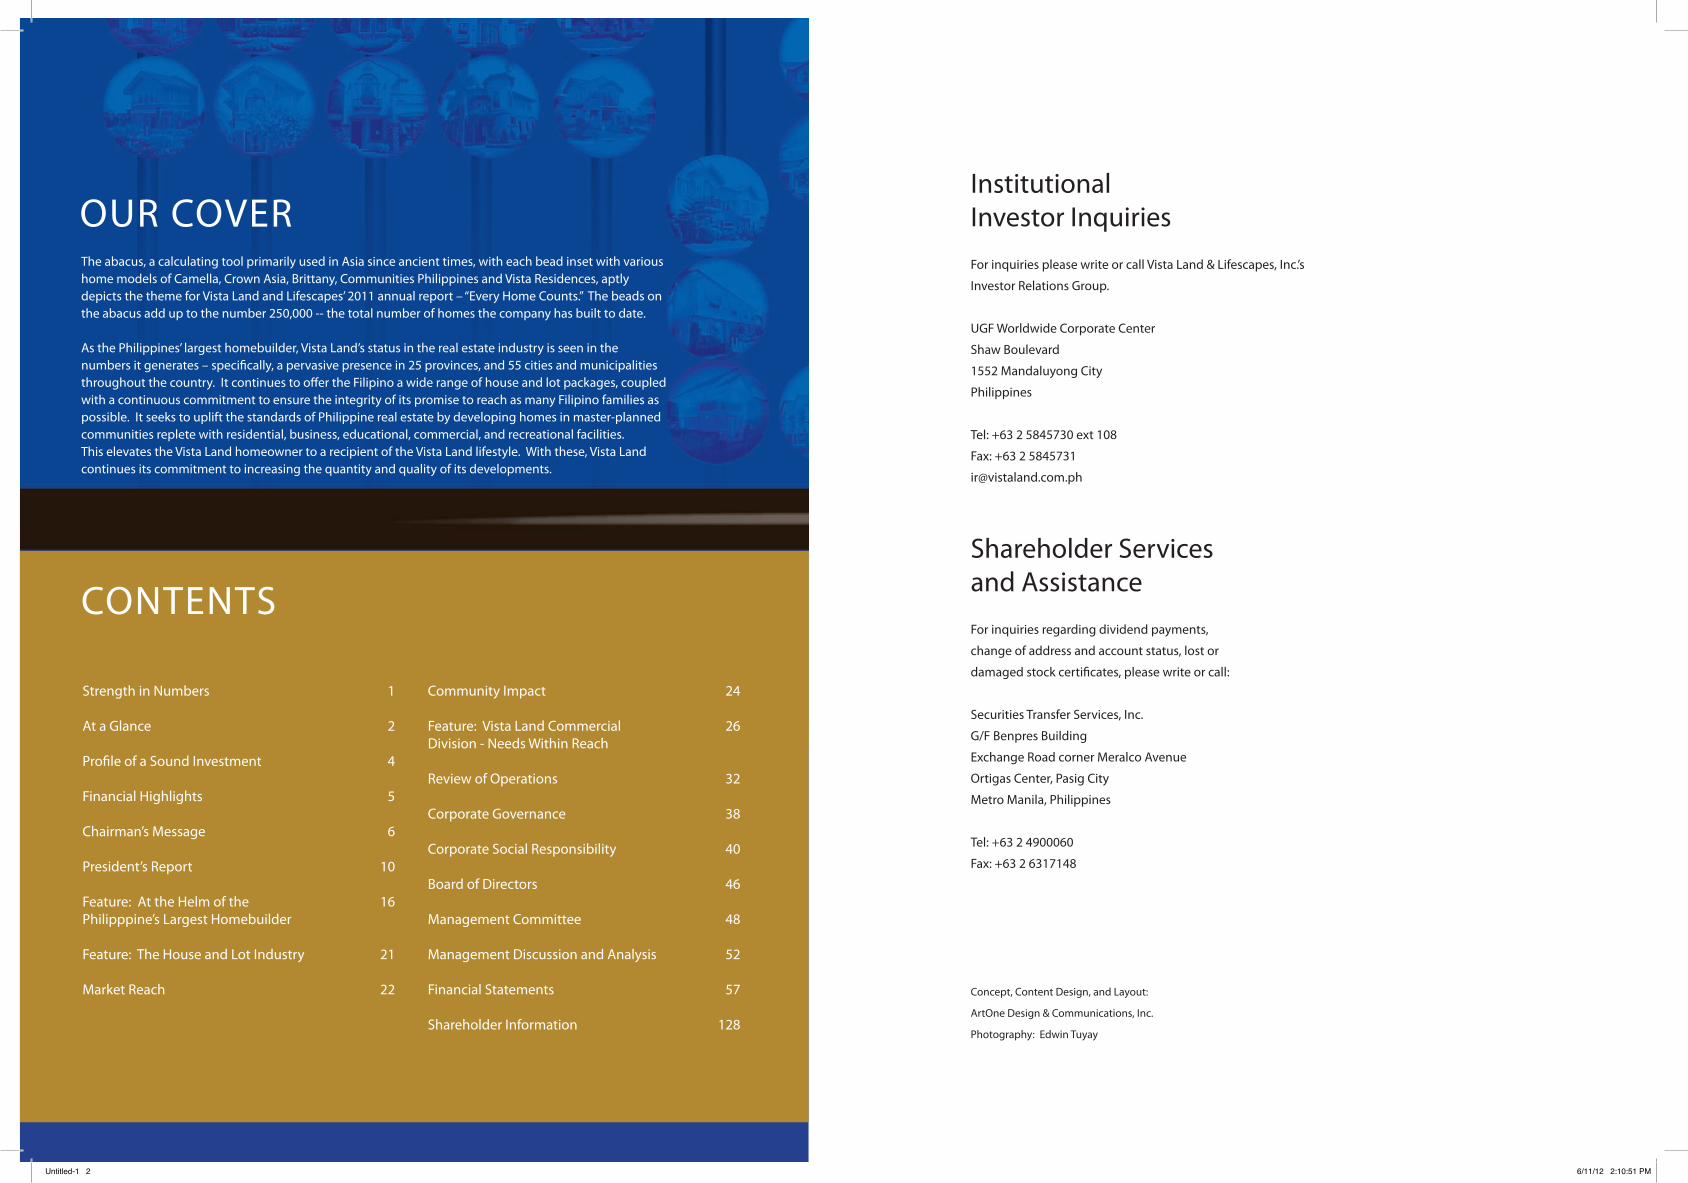
The abacus, a calculating tool primarily used in Asia since ancient times, with each bead inset with various home models of Camella, Crown Asia, Brittany, Communities Philippines and Vista Residences, aptly depicts the theme for Vista Land and Lifescapes’ 2011 annual report – “Every Home Counts.” The beads on the abacus add up to the number 250,000 -- the total number of homes the company has built to date.
As the Philippines’ largest homebuilder, Vista Land’s status in the real estate industry is seen in the numbers it generates – speci�cally, a pervasive presence in 25 provinces, and 55 cities and municipalities throughout the country. It continues to o�er the Filipino a wide range of house and lot packages, coupled with a continuous commitment to ensure the integrity of its promise to reach as many Filipino families as possible. It seeks to uplift the standards of Philippine real estate by developing homes in master-planned communities replete with residential, business, educational, commercial, and recreational facilities. This elevates the Vista Land homeowner to a recipient of the Vista Land lifestyle. With these, Vista Land continues its commitment to increasing the quantity and quality of its developments.
CONTENTS
Strength in Numbers 1
At a Glance 2
Pro�le of a Sound Investment 4
Financial Highlights 5
Chairman’s Message 6
President’s Report 10
Feature: At the Helm of the Philipppine’s Largest Homebuilder
16
Feature: The House and Lot Industry 21
Market Reach 22
Community Impact 24
Feature: Vista Land Commercial Division - Needs Within Reach
26
Review of Operations 32
Corporate Governance 38
Corporate Social Responsibility 40
Board of Directors 46
Management Committee 48
Management Discussion and Analysis 52
Financial Statements 57
Shareholder Information 128
OUR COVERInstitutional Investor Inquiries
For inquiries please write or call Vista Land & Lifescapes, Inc.’s
Investor Relations Group.
UGF Worldwide Corporate Center
Shaw Boulevard
1552 Mandaluyong City
Philippines
Tel: +63 2 5845730 ext 108
Fax: +63 2 5845731
Shareholder Servicesand Assistance
For inquiries regarding dividend payments,
change of address and account status, lost or
damaged stock certi�cates, please write or call:
Securities Transfer Services, Inc.
G/F Benpres Building
Exchange Road corner Meralco Avenue
Ortigas Center, Pasig City
Metro Manila, Philippines
Tel: +63 2 4900060
Fax: +63 2 6317148
Concept, Content Design, and Layout:
ArtOne Design & Communications, Inc.
Photography: Edwin Tuyay
Untitled-1 2 6/11/12 2:10:51 PM

The abacus, a calculating tool primarily used in Asia since ancient times, with each bead inset with various home models of Camella, Crown Asia, Brittany, Communities Philippines and Vista Residences, aptly depicts the theme for Vista Land and Lifescapes’ 2011 annual report – “Every Home Counts.” The beads on the abacus add up to the number 250,000 -- the total number of homes the company has built to date.
As the Philippines’ largest homebuilder, Vista Land’s status in the real estate industry is seen in the numbers it generates – specifically, a pervasive presence in 25 provinces, and 55 cities and municipalities throughout the country. It continues to offer the Filipino a wide range of house and lot packages, coupled with a continuous commitment to ensure the integrity of its promise to reach as many Filipino families as possible. It seeks to uplift the standards of Philippine real estate by developing homes in master-planned communities replete with residential, business, educational, commercial, and recreational facilities. This elevates the Vista Land homeowner to a recipient of the Vista Land lifestyle. With these, Vista Land continues its commitment to increasing the quantity and quality of its developments.
CONTENTS
Strength in Numbers 1
At a Glance 2
Profile of a Sound Investment 4
Financial Highlights 5
Chairman’s Message 6
President’s Report 10
Feature: At the Helm of the Philipppine’s Largest Homebuilder
16
Feature: The House and Lot Industry 21
Market Reach 22
Community Impact 24
Feature: Vista Land Commercial Division - Needs Within Reach
26
Review of Operations 32
Corporate Governance 38
Corporate Social Responsibility 40
Board of Directors 46
Management Committee 48
Management Discussion and Analysis 52
Financial Statements 57
Shareholder Information 128
OUR COVER

Vista LandA N N U A L R E P O R T11
VISTA LAND ANNUAL REPORT 2011 1
Vista LandA N N U A L R E P O R T112
Over Two Hundred Fifty Thousand (250,000) homes in 25 provinces, 55 cities and municipalities + five (5) subsidiaries = one company, Vista Land and Lifescapes, Inc. For over 3 decades, the company has continuously renewed its commitment to the Filipino family by delivering the fundamental need of shelter. This commitment is reflected in the growing number of Filipinos who now call a Vista Land house their home.
As an index of community improvement, Vista Land commits to develop about ten percent (10%) of land in its masterplanned communities for commercial purposes. For its horizontal developments, it brings in an average of 600 new families to a new neighbourhood. In 2011, the company launched 23 projects valued at PHP21 billion or over 17,000 house and condominium units combined.
The Vista Land family is committed to defining – and redefining – the term “community,” as it strives to deliver responsive residential structures and amenities to the Filipino.
SN
trength inumbers

2 VISTA LAND
Develops luxury homes in masterplanned communities, catering to the high-end market segment in Mega Manila
Established: 1993
2011No. of Ongoing projects 18
Area of Ongoing projects (hectares) 106.3
2011No. of Ongoing projects 28
Area of Ongoing projects (hectares)
141.7
Marfori (Sucat, Muntinlupa)La Posada (Daang Hari, Alabang)Crosswinds (Tagaytay City)Portofino South
(Daang Hari, Alabang)Georgia Club (Sta. Rosa, Laguna)Amore (Daang Hari, Alabang)Augusta (Sta. Rosa, Laguna)Portofino Courtyards
(Daang Hari, Alabang)
Marina Heights (Sucat, Muntinlupa) Brescia (Commonwealth, Quezon City) Ponticelli (Daang Hari, Alabang) Citta Italia (Bacoor, Cavite) Amalfi (Dasmariñas, Cavite) Valenza (Sta. Rosa, Laguna) Carmel (Bacoor, Cavite) Fortezza (Cabuyao, Laguna)
Caters to the upper middle market housing segment in Mega Manila
Established: 1995
PR
OJE
CT
PO
RTF
OLI
OD
IVIS
ION
AL
INFO
RM
ATIO
N(in
Php
Milli
ons,
exc
ept N
o. o
f Pro
j Lau
nche
d)FE
ATS
(as
of D
ec. 3
1)
2011 %Change
Real Estate Revenues
1,667.7 15%
Gross Profit 876.8 19%
EBIT 442.3 27%
2011 %Change
Real Estate Revenues
2,183.9 459%
Gross Profit 1.157.9 547%
EBIT 665.6 81%
General Santos
Cagayan
METRO MANILA:Alabang, Las Piñas, Taguig, Quezon City, Caloocan, Valenzuela, Pasig
Camarines Sur
CaviteLaguna
Bulacan
Isabela
Pangasinan
Tarlac
Nueva Ecija
Leyte
Butuan
Pampanga
Batangas
Quezon
Iloilo
Bacolod
Negros Oriental
Cebu
Cagayan De Oro
Davao
Ilocos Norte
BataanRizal
A t a Glance
Launched 23 projects with an estimated total value of
21 billion
Vista Land AR 11_FA.indd 2 6/11/12 10:00 AM

Vista LandA N N U A L R E P O R T11
VISTA LAND ANNUAL REPORT 2011 3
Marina Heights (Sucat, Muntinlupa) Brescia (Commonwealth, Quezon City) Ponticelli (Daang Hari, Alabang) Citta Italia (Bacoor, Cavite) Amalfi (Dasmariñas, Cavite) Valenza (Sta. Rosa, Laguna) Carmel (Bacoor, Cavite) Fortezza (Cabuyao, Laguna)
2011No. of Ongoing projects 19
Area of Ongoing projects (hectares) 4.0
Wil Tower (Eugenio Lopez Drive, Quezon City)
Avant at the Fort (Bonifacio Global City) Pinecrest (New Manila, Quezon City) KL Mosaic (Legazpi Village, Makati City) Trevi Towers (Pasong Tamo, Makati City) Crown Tower (Sampaloc, Manila) Symphony Tower
(South Triangle, Quezon City)Mosaic (Legazpi Village, Makati City)
Builds vertical developments in Mega Manila
Acquired: 2009
2011 %Change
Real Estate Revenues
980.9 26%
Gross Profit 518.2 51%
EBIT 281.4 84%
2011No. of Ongoing projects 31
Area of Ongoing projects (hectares)
258.3
Lessandra Heights (Daang Hari, Alabang) Camella La Vecina at Dos Rios (Cabuyao, Laguna) Cerritos Heights (Daang Hari, Alabang) Cerritos East (Pasig) Camella Molino (Bacoor, Cavite) Grenville Residences (Taguig City) Nova Romania (Caloocan City) Pristina (Imus, Cavite)
Servicing the middle-income housing segment in the Mega Manila area.
Established: 1977
2011 %Change
Real Estate Revenues
4,419.0 26%
Gross Profit 2,232.7 24%
EBIT 1,268.3 10%
2011No. of Ongoing projects 87
Area of Ongoing projects (hectares)
753.5
Camella Dumaguete (Dumaguete, Negros Oriental)
Camella Northpoint (Davao City) Provence (Malolos, Bulacan) Camella Sto. Tomas (Sto. Tomas, Batangas) Camella General Santos (General Santos) Camella Naga (Naga City) Camella Tugegarao (Tuguegarao, Cagayan) Prominenza (Baliuag, Bulacan)
Offers residential properties outside the Mega Manila area in the low-cost, affordable and middle market segments primarily under the “Camella” and “Lessandra” brands.
Established: 1991
2011 %Change
Real Estate Revenues
4,262.0 4%
Gross Profit 2,116.5 4%
EBIT 1,075.2 -3%
COMMUNITIESP H I L I P P I N E S

4 VISTA LAND
MArkeT reAch
coMMuNITy IMpAcT
Vista Land has built more houses than any other property developer and enjoys a 42% market share across all developments. In the house and lot market segment, it outsells the competition by a wide margin. Its vertical development arm, Vista Residences, increased its presence from 1 condominium unit in 2004 to 19 ongoing developments in 2011.
On ensuring the wellness of the Filipino family, the Camella brand’s advertising campaign two years ago, which shows a child (referred to as “bulilit”) relaxing in her new and spacious Camella home, has personified Vista Land in the eyes of Filipinos. Maximizing the use of space, each Vista Land home provides not merely shelter but a respite from the demands of modern living. Vista Land’s continuous commitment to delivering fundamental – as well as sought after amenities – to the homebuyer is unwavering. Year after year, Vista Land typically reserves about 10% to 15% of the total land area of its projects for commercial establishments and infrastructure that allow the union and collaboration of families and friends in their respective communities.
From Brittany’s exquisite structures to Lessandra’s homeowner activities, the formation of homes and communities has become Vista Land’s commitment to the Filipino home buyer. Its impact has extended beyond bricks and mortar – but has expanded to include the Filipino value of “family” -- which includes not only the immediate members, but friends and neighbours who form part of the community.
P rofile of aS ound Investment
Vista Land Summary
Number of Projects
%
Mega Manila 95 52%
Luzon 37 20%
Visayas 35 19%
Mindanao 16 9%
183 100%
EditedVista Land AR 11_FA.indd 4 6/11/12 10:04 AM
Vista LandA N N U A L R E P O R T11
VISTA LAND ANNUAL REPORT 2011 5
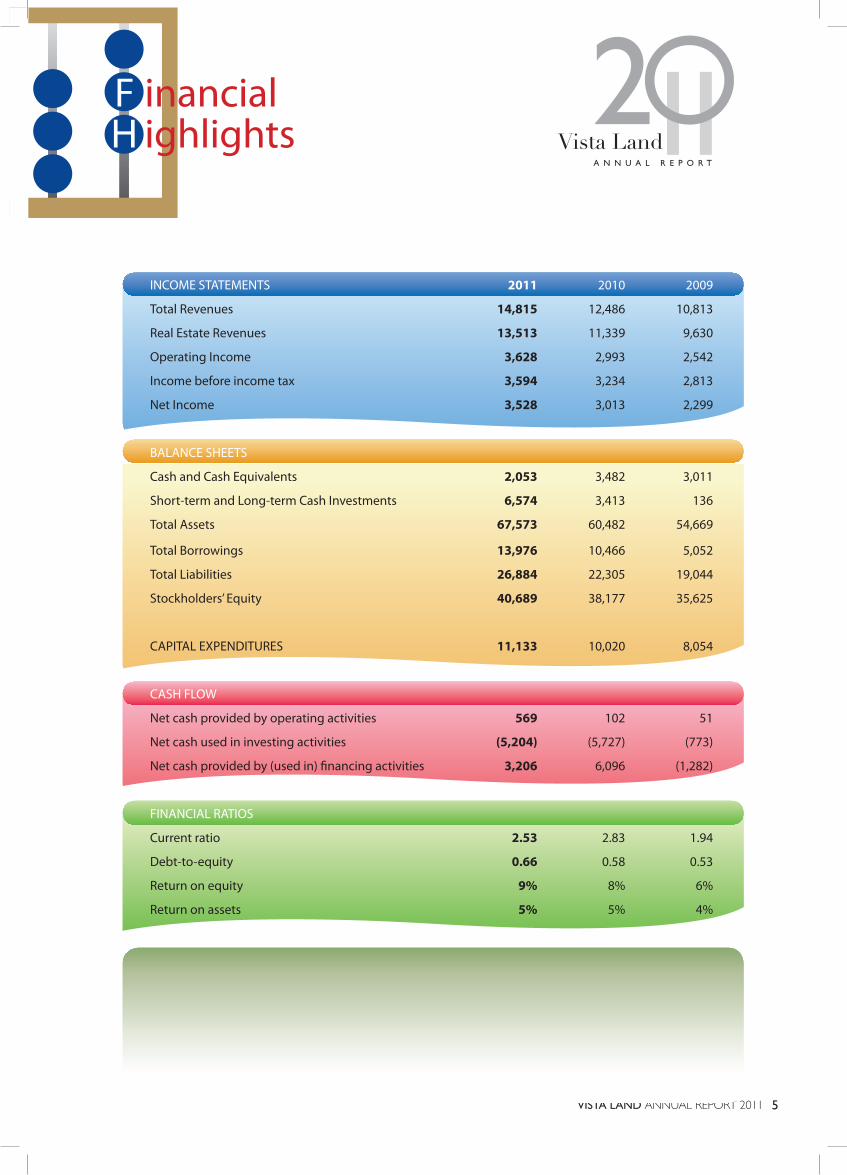
INCOME STATEMENTS 2011 2010 2009
Total Revenues 14,815 12,486 10,813
Real Estate Revenues 13,513 11,339 9,630
Operating Income 3,628 2,993 2,542
Income before income tax 3,594 3,234 2,813
Net Income 3,528 3,013 2,299
BALANCE SHEETS
Cash and Cash Equivalents 2,053 3,482 3,011
Short-term and Long-term Cash Investments 6,574 3,413 136
Total Assets 67,573 60,482 54,669
Total Borrowings 13,976 10,466 5,052
Total Liabilities 26,884 22,305 19,044
Stockholders’ Equity 40,689 38,177 35,625
CAPITAL EXPENDITURES 11,133 10,020 8,054
CASH FLOW
Net cash provided by operating activities 569 102 51
Net cash used in investing activities (5,204) (5,727) (773)
Net cash provided by (used in) financing activities 3,206 6,096 (1,282)
FINANCIAL RATIOS
Current ratio 2.53 2.83 1.94
Debt-to-equity 0.66 0.58 0.53
Return on equity 9% 8% 6%
Return on assets 5% 5% 4%
F inancialH ighlights

6 VISTA LAND
Vista Land, I am happy to report, has successfully maintained its leadership position in the Philippine housing industry. In 2011, we once again sold more houses than any other property developer in the country, expanding our presence to more provinces than any other real estate company. This was achieved against a backdrop of intensifying competition from other major developers who have begun to enter certain segments of the real estate industry which they had hitherto ignored.
Management understands that the company is likely to continue to face stiffer competition in the coming years, and we are therefore closely monitoring industry developments and periodically reviewing our strategies. Given our track record and ability to execute plans within a relatively short time frame, we believe that we are well-equipped to meet competitive and other challenges as they arise. Thus far, we are confident that the basic strategy we have adopted – to continue our aggressive nationwide expansion program with a primary focus on the mid to lower-end price segment of the housing market – is appropriate. We take great pride in occupying the top spot in housing, and we have no intention of relinquishing our claim of being the number one homebuilder in the country.
We have continued to ensure that we meet the needs of our buyers by constructing and designing houses that are among the best the market has to offer, and maintaining the highest standards throughout the lifecycle of all our projects. The cover of our annual report states that “Every Home Counts.” We at Vista Land take this statement seriously. Every house, whether offered by our high-end Brittany brand, or coming from our mid-market Crown Asia,
Dear Fellow Shareholders,
C hairman’sM essage

Vista LandA N N U A L R E P O R T11
or one from the more affordable
Camella, is of equal importance
to the company. As such, our
“Camella” brand, which was
introduced over three
decades ago, is still the
most preferred in housing
in the Philippines.
Vista LandA N N U A L R E P O R T11
“Every house, whether offered by our high-end Brittany brand, or coming from our mid-market Crown Asia, or one from the more affordable Camella, is of equal importance to the company.”
Chairman
Marcelino C. Mendoza
EditedVista Land AR 11_FA.indd 7 6/9/12 4:57 PM

8 VISTA LAND
We are building communities nationwide. In many of our subdivisions, we
have begun to move forward with the development of commercial areas in
order to improve the range of retail services available to existing residents
and to enhance the value of their properties. In the coming years, only a few
provinces would not have felt the presence of Vista Land. Our President and
Chief Executive Officer will provide more details on this in his message.
Last year, I outlined some of the positive factors that are helping to propel
our industry. Those same factors continue to underpin the strong growth
in the real estate sector and have helped Vista Land deliver another year of
record performance in reservation sales, revenues, and earnings.
Business confidence remains robust, notwithstanding a slower than
expected GDP growth rate in 2011. Seeing the glass half-full, the business
community has largely accepted government underspending and some
extraneous factors – such as the weakness in Europe, the tragic aftermath
of the earthquake and tsunami in Japan, and the uprisings in the Middle
East – as some of the main causes for the relatively lacklustre performance,
and 2012 is generally expected to be much better in terms of GDP growth.
Fortunately, the economic fundamentals continue to be strong with a
stable currency, benign inflation, low interest rates, and a high level of gross
international reserves (supported by record remittance inflows coming from
Overseas Filipino Workers). The government expects a credit rating upgrade
in the medium term, but perhaps as a further sign of optimism, the market
has effectively priced the Philippines at a superior credit rating than that
officially provided by international credit rating agencies.
C hairman’sM essage
EditedVista Land AR 11_FA.indd 8 6/9/12 4:58 PM
–
,

Vista LandA N N U A L R E P O R T11
VISTA LAND ANNUAL REPORT 2011 9
Amidst the economic difficulties still being faced by Europe, the continuing political challenges in the Middle East, and the unresolved problems in the United States, it is indeed fortuitous for us to be situated in Asia. Although no country or region can be truly insulated from global events, most analysts are highly optimistic in their outlook for the Asian region. This overall positive sentiment extends to the Philippines and its real estate sector. We are therefore confident that 2012 will be another record year for the company in terms of operational and financial performance.
To all our stakeholders and supporters who continue to believe in us, I would like to thank you once again for helping us maintain our dominant position in the housing industry.
MARCELINO C. MENDOZAChairman
“ We are therefore confident that
2012 will be another record
year for the company in terms
of operational and financial
performance.”

10 VISTA LAND
We began 2011 full of confidence about the outlook for the country and for the real estate industry. The new administration, for its first full year in office, had set an official GDP growth target of about 5% to 6%. Although GDP growth came in at a modest 3.7%, business confidence remains strong and unfazed by what most consider a temporary setback in an otherwise bullish trend. We at Vista Land share this optimism, and, for our sector at least, we believe the outlook and prospects for the next few years are very promising.
I am pleased to report that we had an excellent year. We exceeded our internal targets, achieving the highest levels of reservation sales, revenues, and net income in the company’s history. Reservation sales reached almost PHP 9 billion during the fourth quarter of 2011 alone, continuing a quarterly upward trend that started in the first quarter of 2010 and bringing the total reservation sales for the year to over PHP 30 billion, 23% higher than the previous year. This should provide some comfort and visibility for revenue growth in the medium term as we deliver on our commitments to customers in a timely manner. Revenues reached PHP13.5 billion, while net income grew to PHP3.5 billion, resulting in earnings per share of 42 centavos – about 17% up from the previous year. Our gross profit margin remained solid, improving slightly from 50% to 51%. For 2012, we fully expect to do even better.
We had an aggressive project pipeline for the year and successfully launched 23 residential projects. Seventeen of the twenty-three projects were subdivisions in the low and affordable market segments, while six were condominium developments – four in Metro Manila, one in Cebu and one in Davao. The aggregate value of these projects was approximately PHP21 billion.
Already in more provinces than any other property developer in the Philippines, we entered seven new areas, namely, Laoag (Ilocos Norte), Cabanatuan (Nueva Ecija), Balanga (Bataan), Tayabas (Quezon), Carcar and Talamban (Cebu), Butuan (Agusan del Norte) and Tagum (Davao). This brought our presence countrywide to a total of 25 provinces and 55 cities and municipalities around the country. In this respect, we firmly believe “Camella” is in a league of its own and can claim to be a truly national brand, having evolved more than three decades ago from a mass housing developer
P resident’sR eport
Dear Fellow Shareholders,

Vista LandA N N U A L R E P O R T11
focused solely in Metro Manila, to becoming the most preferred nationwide developer in the affordable and low cost segment of the market.
Given our aggressive expansion program, we have deemed it necessary to increase our company’s headcount to efficiently manage the growth in our business. Thus, the number of employees in our organization increased from 610 to 751. Most were assigned to
President and Chief Executive Officer
Manuel Paolo A. Villar
Vista LandA N N U A L R E P O R T11
“We exceeded our internal targets, achieving the highest levels of reservation sales, revenues, and net income in the company’s history.”

12 VISTA LAND
the marketing group, while others were distributed in areas involving operations, administration, and technical services.
At the beginning of the year, we announced a capital expenditure budget of about PHP11 billion. To partially cover our funding requirements, we carefully considered various options, including tapping the dollar bond market once again. Since the international bond markets continued to be receptive to Philippine companies, we decided to follow up our successful US$100 million bond, completed in 2010, with a US$75 million issue under exactly the same terms and conditions as the initial offering. We also continued our financing activities on the domestic front, raising approximately PHP4 billion through bilateral loans from local banks and the selling of in-house receivables.
Our interaction with the banks is, of course, not limited simply to a debtor/creditor relationship. Beyond cash management, hedging options, and other peripheral businesses, we often forge partnerships with banks in order to provide mortgage financing to prospective customers and ensure that these tie-ups are integrated in our marketing of specific projects. As we move forward in building stronger relationships with the financial community, we hope not just to raise the company’s profile but also to diversify our sources of funding and reduce our cost of capital.
We have shored up liquidity, ending the year with more than PHP8.6 billion in
REAL ESTATE REVENUEReal Estate Revenue up by 19%(in PhP Billion)
2010 2011
Brittany 15%
Crown Asia 45%
Camella 26%
Communities Philippines 4%
Vista Residences 26%
11.3
13.5
P resident’sR eport
4.08 4.26
3.514.42
0.78 0.98
1.51
2.181.46
1.67
EditedVista Land AR 11_FA.indd 12 6/9/12 4:59 PM

Vista LandA N N U A L R E P O R T11
VISTA LAND ANNUAL REPORT 2011 13
REVENUE DISTRIBUTION
cash including cash investments. Our total asset base grew to about PHP67.6 billion, and we have maintained a strong balance sheet, as shown by our financial ratios. Our current ratio is more than 2.5X, while our interest bearing debt, excluding obligations arising from receivables sold with recourse, was about PHP11.5 billion, bringing our debt to equity ratio to 28%. Our net debt to equity ratio therefore stood at a conservative 7%. Non-performing accounts remained at about 4%, in line with our expectations and well within levels seen by other players in the industry. Return on equity, while not quite at levels we are satisfied with, improved slightly to just under 9%.
On top of the regular annual cash dividend amounting to 20% of the previous year’s net income, our performance allowed us to declare a special cash dividend of 10%, bringing the total absolute payout to 10.5 centavos per share, or 30% of previous year’s earnings. Depending on the circumstances, we hope to be able to reward shareholders with a similar special dividend payment in the coming year.
Notwithstanding the continuing difficulties in Europe and the potential slowdown in China, the macroeconomic backdrop in the Philippines is supportive of growth in the real estate industry. Our flagship projects – Evia in Muntinlupa, The Lakefront in Sucat, Sta. Elena in Sta. Rosa, Crosswinds in Tagaytay, and Savannah in Iloilo are well under way, and, with a land bank of more than 1,800 hectares, we are prepared to capitalize on opportunities as they arise. We are well aware of concerns of a potential oversupply in the high rise market segment and have therefore calibrated our condominium project pipeline to prepare for
2010
2011
Brittany
Crown Asia
Camella
Communities Philippines
Vista Residences
13%
7%
7%
13%
31%
36%
33%32%
16%12%
EditedVista Land AR 11_FA.indd 13 6/9/12 4:59 PM

14 VISTA LAND
such a possibility. As such, vertical projects are expected to account for less than 10% of total revenues in 2012 and remain a relatively small proportion of total revenues, compared to our horizontal developments, for the next few years. With a population of close to 100 million and a median age of less than 24 years, the country’s demographics bode well for the long term strength of the housing industry.
We fully recognize the importance of our investors – big and small – and we continue to prioritize investor relations activities by attending various forums both here and overseas, holding quarterly analyst briefings, one-on-one meetings, and arranging property tours. I am pleased to see that most of the major brokerage houses now cover our stock, and many have noted that we have achieved or exceeded every annual sales, revenue, and net income guidance figure disclosed by our company. We will continue to focus on investor relations and managing expectations of our investors, particularly those who view competition in the real estate industry as a sprint rather than a marathon.
When I took over the helm of the company in 2011, it was with great pride, optimism, and trepidation. The pride and optimism stemmed from the obvious – the Board of Directors and principal shareholders had the confidence to entrust me with leading the company through whatever challenges we may face in the future. The trepidation – from my personal goal that the company must
Reservation SalesReservation Sales up by 23%(in PhP Billion)
2010 2011
24.8
30.5
P resident’sR eport

Vista LandA N N U A L R E P O R T11
VISTA LAND ANNUAL REPORT 2011 15
5%
5%
38%
38%
“We will continue to focus on
investor relations and managing
expectations of our investors,
particularly those who view
competition in the real estate industry
as a sprint rather than a marathon.”
MANUEL PAOLO A. VILLARPresident and Chief Executive Officer
always overcome all hurdles. While I cannot ensure that we will always end up choosing the optimal path, I can guarantee that under my stewardship, we will harness every available resource to execute our ambitious plans with energy and prudence. As CEO, I will certainly try to ensure that we build on the numerous accomplishments and pioneering vision of our company’s founder, my father.
In closing, on behalf of my colleagues at Vista Land, I would like to thank our former CEO, Ms. Benjamarie Therese Serrano for ably steering the company, particularly through the most recent turbulent times. ‘”Jing”, as we fondly refer to her, has been instrumental in formulating and ensuring the success of many of our major projects, particularly “Crosswinds” in Tagaytay city, and “Evia” in Muntinlupa. We all owe Jing an immense debt of gratitude for her personal dedication, for her untiring service, and for her friendship. We will continue to rely on her wisdom as she remains a director of the company, and we wish her all the best as she pursues fresh challenges within the Villar Group.
To all our shareholders, customers, brokers, suppliers, service providers, employees and other stakeholders – thank you for your continued support. I look forward to the coming years as we work together to maximize the full potential of Vista Land.
EditedVista Land AR 11_FA.indd 15 6/9/12 4:52 PM

16 VISTA LAND
F eature
EditedVista Land AR 11_FA.indd 16 6/9/12 5:13 PM

Vista LandA N N U A L R E P O R T11
VISTA LAND ANNUAL REPORT 2011 17
At the Helm of the Philippines’ Largest Homebuilder
An honor and a challenge – this is how Manuel Paolo A. Villar
describes his new responsibility as Vista Land’s Chief Executive
Officer (CEO). Appointed last July 2011, Paolo, as he is fondly
called, is fully cognizant of his role as the leader of a leader in the
Philippine housing industry.
Vista Land’s current position as the Philippines’ largest homebuilder
was achieved through a consistent and unwavering business
strategy aimed at providing the best value for the Filipino
homebuyer. Paolo acknowledges that Vista Land shall continue
to provide value to all its stakeholders. With a firm foothold in the
Philippine real estate market, it continuously challenges itself to
ensure that it remains on top. Paolo mentions milestones in which
he participated as significant events for the company – a public
offering in 2007 and a dollar bond issuance -- which was positively
viewed by the market and showed a strong vote of confidence
in the company. Paolo also added that the brand equity of Vista
Land’s Camella is another major milestone. Camella is considered a
“super brand” -- one that resonates with the Filipino people. He
adds that Camella is the most preferred housing brand of the
Filipino consumer.
Manuel Paolo A. Villar
EditedVista Land AR 11_FA.indd 17 6/9/12 4:51 PM

18 VISTA LAND
Paolo as CEO
Under Paolo’s leadership, Vista Land shall continue to be in the business of building more homes in more places throughout the Philippines. He believes that providing the best value for the buyer’s money is the pivotal strategy.
“To see a Vista Land home wherever a Filipino may be in the Philippines” is Paolo’s vision. More than maintaining its record of being the largest homebuilder, Paolo seeks to challenge the company by increasing the number of homes built to 350,000 within the next 10 years. Vista Land has already reached Mindanao, with 16 developments therein – and will continue to expand in other areas. Paolo states, “Over 7,500 homes were built in 2011. I am confident that in 10 years, Vista Land will build 100,000 or more homes.” Next year, he is targeting an increase of 15% in total housing units to be constructed.
Paolo emphasizes, though, that quantity is not the only goal but quality as well. Paolo wants Vista Land’s architects and engineers to come up with revolutionary house designs that maximize quality and the use of space at the most affordable possible cost. Their suppliers, considered by the company as its strategic partners, shall be a major factor in delivering this objective by ensuring the quality of goods and services delivered at the best prices.
“Over 7,500 homes were built in 2011. I am confident that in 10 years, Vista Land will build 100,000 or more homes.”
F eature
Vista Land AR 11_FA.indd 18 6/9/12 4:29 PM

Vista LandA N N U A L R E P O R T11
VISTA LAND ANNUAL REPORT 2011 19
Caring customer service, Paolo adds, is part of the Vista Land experience. “We have to care, in the sense that we have to instill a lot of energy and discipline among our Vista Land people. Being able to deliver customer care every day – all the time – requires discipline and passion,” he says. Paolo notes that except for houses in high-end subdivisions, customer service in general has been taken for granted in local middle-class developments. Albeit accepted by the market, mediocre customer service should be an alien concept for Vista Land. The level of service should be high for all market segments, be it mass housing, middle-class, or luxury developments.
Breaking into the vertical market with quality condominium developments at affordable prices in key areas in the city is also part of Paolo’s plan for Vista Land through Vista Residences and Camella Condo Homes. These brands provide the Vista Land buyer with an affordable home in key urban areas where land prices are higher than the provincial areas. Again, the value and quality Vista Land is known for is present in a Vista Residences and Camella Condo Homes unit.
Finally, Paolo believes that Vista Land’s success is based on simple things done well such as beautiful and high quality, affordable homes consistently delivered to buyers.

20 VISTA LAND
As of 2011, the number of houses Vista Land has built has enabled it to become the prime mover in the Philippine real estate industry. The industry continues to have a stronghold in the Overseas Filipino Worker (OFW). With remittances having reached US$20 billion in 2011, the purchasing power of the OFW market continues to be robust. Seafarers’ remittances alone have grown to 14%. OFWs account for 55% to 60% of Vista Land’s total sales. These are primarily to end-users. According to the Philippine Overseas and Employment Administration (POEA), an additional 58,000 job openings abroad have been approved for 2012. Thus, stability in the OFW market is expected.
Besides the OFW market, the business process outsourcing (BPO) industry continues to contribute to housing. The BPO industry has grown 21% in 2011 and continues to be one of the drivers of Philippine economic growth. It now employs over 638,000 Filipino employees and contributes over US$11 billion to the local economy. The young workers in this industry are expected to purchase homes and are considered a primary market for the Vista Land developments.
The House and Lot Industry
F eature
Vista LandA N N U A L R E P O R T11
VISTA LAND ANNUAL REPORT 2011 21
Vista LandA N N U A L R E P O R T11
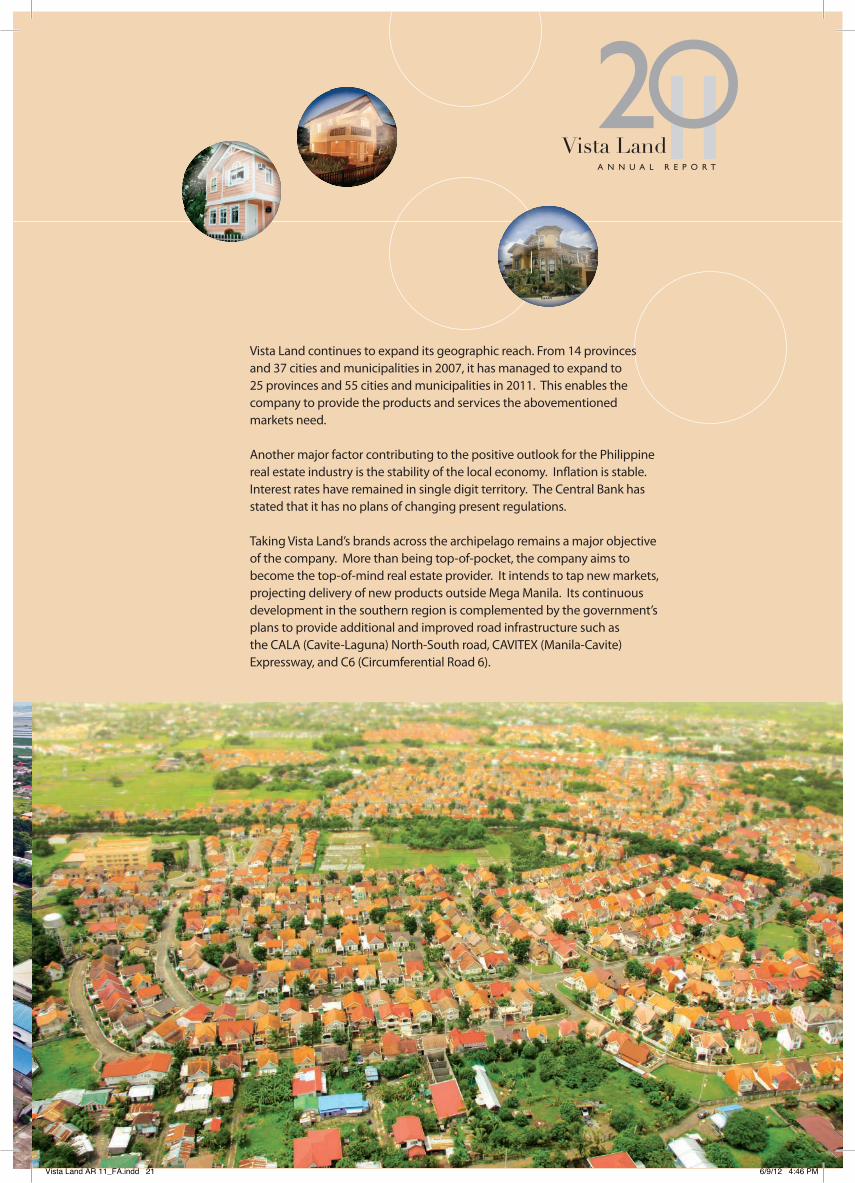
Vista Land continues to expand its geographic reach. From 14 provinces and 37 cities and municipalities in 2007, it has managed to expand to 25 provinces and 55 cities and municipalities in 2011. This enables the company to provide the products and services the abovementioned markets need.
Another major factor contributing to the positive outlook for the Philippine real estate industry is the stability of the local economy. Inflation is stable. Interest rates have remained in single digit territory. The Central Bank has stated that it has no plans of changing present regulations.
Taking Vista Land’s brands across the archipelago remains a major objective of the company. More than being top-of-pocket, the company aims to become the top-of-mind real estate provider. It intends to tap new markets, projecting delivery of new products outside Mega Manila. Its continuous development in the southern region is complemented by the government’s plans to provide additional and improved road infrastructure such as the CALA (Cavite-Laguna) North-South road, CAVITEX (Manila-Cavite) Expressway, and C6 (Circumferential Road 6).
Vista Land AR 11_FA.indd 21 6/9/12 4:46 PM

22 VISTA LAND
25O,OOO5525
Cities &Municipalities
Provinces
MarketR each
The Country’s Largest Homebuilder.Housing the Philippines since 1977

Vista LandA N N U A L R E P O R T11
VISTA LAND ANNUAL REPORT 2011 23
Vista Land has expanded to over 180 developments in 5 years. Over 250,000 houses and condominium units have been built since 1977. Of the horizontal developments, Camella and Communities Philippines build an average of 60 units per hectare while Crown Asia builds 55 units per hectare. Brittany builds 40 units per hectare.
From 2007 to 2011, Communities Philippines accounted for 40% of the total Vista Land developments. Camella has 38% of the developments. The balance is distributed at 13%, 6% and 4% among Crown Asia, Brittany and Vista Residences, respectively.
As of the end of 2011, Vista Land was present in 25 provinces, 55 cities and municipalities around the country. For 2012, Vista Land, through its subsidiary, Communities Philippines, will continue to open projects in new areas making it the real estate company with the widest geographic reach.
Total Homes Built, Total Geographical Reach25O,OOO
HousesBuilt

Vista Land continuously provides infrastructure and facilities that encourage the growth and wellness of their residents such as (Clockwise from top) Schools, Tree lined roads, Tree Nurseries, and Clubhouse and Recreational areas.
C ommunityI mpact
24 VISTA LAND

Vista LandA N N U A L R E P O R T11
VISTA LAND ANNUAL REPORT 2011 25
The impact of Vista Land on the Philippine housing industry has gone beyond building houses and condominiums – it has gone further by establishing community infrastructure by constructing buildings and leasing land to anchor tenants. Vista Land developments have commercial and recreational facilities for the use of its residents. Several communities have schools and tutorial centers. Areas in the masterplanned cities are earmarked for offices and business process outsourcing companies – which will enable Vista Land stakeholders to live, work and play in the developments. The concept of a self-sustaining environment in the Vista Land communities has received positive feedback from the homeowners and stakeholders. As a result, the company will continue this strategy in existing and future developments.
Vista Land’s commitment to the environment can be seen in the communities, with over 1,000,000 trees planted. The company maintains tree nurseries to ensure that proper care is given the trees to be planted. Employees and residents are taught how to take care of these trees, which contribute to the beauty and cleanliness of each development.
Families and Social Groups Serviced
Families can enjoy the friendly and nurturing atmosphere that is seen in Vista Land communities.
EditedVista Land AR 11_FA.indd 25 6/11/12 9:53 AM

26 VISTA LAND
One of the key strategies in developing a Vista Land community was given renewed focus in 2011. From the masterplanned community of Evia to the residential areas of Lessandra, village centers have been established to serve the needs of residents. Led by Vista Land’s Commercial Division, headed by Ms. Ma. Leni Damasco-Luya, each Vista Land development is now conceptualized to be a self-sustaining community where essential goods and services are available to residents within a walking distance.
In the smaller developments, the village center has a mini-mart where residents can purchase their basic necessities. The Finds Convenience Store provides residents with supermarket goods. Some stores are open 24 hours for the residents’ convenience. The center may also include a bakeshop, barbershop or salon, an automated teller machine (ATM), a pet shop, a water station, and a laundry shop. According to Leni, village centers are established as a commercial section with a Gross Floor Area (GFA) of 5,000 square meters (sqm.).
For a commercial area that is double or triple in size (i.e. 10,000 to 15,000 sqm.), a community mall is established. Besides the basic amenities mentioned above, it will include a supermarket, a hardware store, a bank, and the complete roster of other services that the residents need.
Needs Within ReachVista Land Commercial Division:
“Vista Land’s community centers have something in store for children, their parents and their grandparents.”
Ms. Ma. Leni DaMasCO-LuyaVista Land’s Commercial Division Head
F eature
EditedVista Land AR 11_FA.indd 26 6/11/12 10:03 AM

Vista LandA N N U A L R E P O R T11
VISTA LAND ANNUAL REPORT 2011 27
Needs Within Reach
Finds convenience store provides
the residents with supermarket goods readily available to
the community.
Entertainment can be experienced in various
lifestyle centers as seen in Ponte Via
Vista LandA N N U A L R E P O R T11

For masterplanned cities, commerce and recreation revolves around the lifestyle centers. According to Leni, “A prime example of a lifestyle center is Ponte Via in Evia, one of Vista Land’s masterplanned communities. Ponte Via will have food stations for a snack lane, a laundry shop, tutorial centers, a nail salon and spa, a Bayad center (payment center for bills), an internet shop, a furniture and appliances shop, a basic hardware store, retail shops for clothes and accessories, a telecommunication center, a quick service restaurant, and a terminal hub for public utility vehicles. The company is also considering a pet shop and some clinics for Ponte Via. Wellness shops, such as gyms, spas, drugstores, diagnostic clinics, and cosmetic clinics, shall also be made available for the residents. Mobility will also be provided through a shuttle service.”
Vista Land prioritizes its residents’ convenience. With the foregoing centers, the residents can purchase their needs as they please – be it daily or weekly. They can visit the local grocery store more often as the village and lifestyle centers are designed for this purpose. Beyond the residents’ daily requirements, Leni adds that these centers have become a venue for bonding with family and friends. For instance, at the Lakefront Boardwalk, musical performances are held every weekend. Through the residents’ participation, the centers have evolved to eating and events destinations.
Cutting Across Family Requirements
Vista Land’s community centers have something in store for children, their parents and their grandparents. Kids will be entertained with art and baking lessons through the Kids at Art and Junior Chef programs during weekends.
F eature
EditedVista Land AR 11_FA.indd 28 6/9/12 5:02 PM

Vista LandA N N U A L R E P O R T11
VISTA LAND ANNUAL REPORT 2011 29
In line with the company’s vision
of a self-sustaining community, Vista Land aims to give
their residents modern conveniences
within reach such as (Clockwise)
PUREGOLD, the Boardwalk, workout
and activity areas.
For the adults, aerobics, zumba and yoga classes are held at the centers. For the seniors, Vista Land plans to establish coffee shops and teashops -- to enable them to relax and bond with their friends and neighbors.
Vista Land actively responds to their homeowners’ existing and anticipated requirements. Other activities are being developed to encourage wider community participation. In addition, the company will address the residents’ spiritual needs. Areas will be allocated for the establishment of churches and other places of worship and meditation.
Strategic Partners in Delivering a Community of Excellence
From its small beginnings in Tindahan ni Aling Puring established in Starmall, Las Piñas, the warehouse club of PureGold has entered into a partnership with Vista Land through Presidio, a Camella mid-rise community in Lakefront -- a masterplanned community spanning Muntinlupa and Parañque. In 2012, the partnership with PureGold shall continue with the establishment of stores in Rizal and Central Luzon, and with the launch of PureGold Jr. in Camella Antipolo and Camella San Fernando.

30 VISTA LAND
More than Marketing
Vista Land’s commercial and lifestyle centers are poised to become a platform for green living. Waste segregation and composting activities will be done in the developments. These activities produce fertilizers which are used for the landscaping requirements of the communities.
Entrepreneurship is a distinct by-product of the centers. Small scale businesses established by residents, particularly OFW families, provide an additional source of income for them. Food kiosks in the village centers have become popular venues for families and individuals who have culinary specialties other residents want to sample. Encouraging the entrepreneurial path has also resulted in the conduct of livelihood training activities in the centers, such as pastillas making, cake decorating, and balloon-twisting. These activities create bonding moments for families and neighbours -- teaching residents, including children, of the value of making a living while enjoying themselves.
Community centers will be a platform for residents to start small scale businesses and livelihood projects while complying with efficient and economic environmental standards.
F eature
EditedVista Land AR 11_FA.indd 30 6/9/12 4:53 PM

Vista LandA N N U A L R E P O R T11
VISTA LAND ANNUAL REPORT 2011 31
A Perception of Increased Value
“The more locators, the better for me,” appears to be the prevailing sentiment of most Vista Land residents. Leni explains, “The commercialization of a portion of a Vista Land community is something that is appreciated by residents because this results in the increase in value to their own property.”
Residents of Vista Land developments are secure in the thought that they live in a protected and well-planned area. Having the feeling of being in “a secluded place far from the rigors of city life” is common. Capitalizing on this view, certain Vista Land developments, particularly the masterplanned cities, are earmarked to become information technology and business process outsourcing hubs. The concept of a self-contained community where office, residential and recreational facilities converge will become a reality through the proper implementation of Vista Land’s business strategy.
EditedVista Land AR 11_FA.indd 31 6/9/12 5:04 PM

32 VISTA LAND
Market: High-end
Price: Above Php 9M
Offering: House & Lot; Leisure (Mega Manila)
Real Estate Revenues (in Php Million): • Php 1,455.5 (2010)• Php1,667.7 (2011)
Revenue Distribution: • 13% (2010)• 12% (2011)
With 328 luxury homes built in 2011, Brittany’s artfully designed homes and estates speak of luxury and affluence. Its classic architecture and today’s modern conveniences have been merged in one brand to exude good taste. The Alessandro Model House has a lot area of 470 sqm and a floor area of 260 sqm. Another Italian-themed model home, Michelangelo, has a lot area of 870 sqm and a floor area of 625 sqm. The Georgia Club development has an American South-theme, with Ashley, having a lot area of 242 sqm and a floor area of 240 sqm, as one of its most popular model homes. Crosswinds in Tagaytay has the Swiss-themed Duetto Tresor model home, with a lot area of 100 sqm and a floor area of 152 sqm. Each package comes with a Php 9 million and above price tag. Brittany has generated sales of Php 1.67 billion in 2011, a 15% increase from 2010.
R eview ofO perations

Vista LandA N N U A L R E P O R T11
VISTA LAND ANNUAL REPORT 2011 33
Aiming at professionals and their families, Crown Asia’s product offerings to the middle market housing segment in Mega Manila is pegged at Php 3.5 million to Php 9.0 million – a competitive offering for the Filipino’s aspiration for a higher standard of living.
Crown Asia’s strategic location enables it to have proximity to educational, commercial and recreational complexes. Its enchanting developments include the La Marea project in San Pedro, Laguna, the Valenza subdivision in Sta. Rosa, and Ponticelli in Alabang. The most popular model homes are the Italian-themed Lalique, with a lot area of 156 sqm and a floor area of 110 sqm, and Lladro, with a lot area of 195 sqm. and a floor area of 192 sqm.
Its other developments include Cottonwoods (Bayugo-Buliran, Antipolo), Maia Alta (Brgy. Dalig, Antipolo), Mia Vita (Brgy. Dalig, Antipolo), Mille Luce (Brgy. San Roque, Antipolo), Woodberry (Bayugo-Buliran, Antipolo), Amalfi (Dasmariñas, Cavite), Amici (Daang Hari, Alabang), Carmel (Bacoor, Cavite), Citta Italia (Cavite), Fortezza (Cabuyao, Laguna), Marina Heights (Sucat, Parañaque), Ponticelli (Daang Hari, Alabang), Valenza (Bayugo-Buliran, Antipolo), and Brescia (Commonwealth, Quezon City).
Market: High-end
Price: Above Php 9M
Offering: House & Lot; Leisure (Mega Manila)
Real Estate Revenues (in Php Million): • Php 1,455.5 (2010)• Php1,667.7 (2011)
Revenue Distribution: • 13% (2010)• 12% (2011)
Market: Middle-income
Price: P3.5M to P9M
Offering: House & Lot (Mega Manila)
Real Estate Revenues (in Php Million): • Php 1,508.0 (2010)• Php2,183.9 (2011)
Revenue Distribution: • 13% (2010)• 16% (2011)

34 VISTA LAND
Vista Land’s establishment of the Camella brand in the 1970s has enabled its founder to fulfill his vision of building an affordable home for the Filipino family. The acceptance by the Filipino buying public of a Camella home has made it a trusted and preferred brand. In fact, a Camella development in a city, town or province is widely considered to be an indicator of progress. Vista Land’s strategy is to continue to build Camella developments throughout the country.
Its value-for-money proposition meets the requirements of its target market. By providing affordable homes with prices ranging from Php 800 thousand to Php 3.5 million, Camella enables the Filipino to own a living space with ample areas for dining, sleeping and recreation. These single-family residences can be found in secure communities in key areas of the country. Its most popular model homes are the Carmela and Drina, with lot areas of 88 sqm and 99 sqm, and floor areas of 64 sqm and 81 sqm, respectively. Camella homes are not only aesthetically-pleasing, as Camella engineers have ensured that houses are built following the natural contours of the land. These houses include the Dorina Uphill model home, with a lot area of 108 sqm and a floor area of 81 sqm, and the Carmina Downhill model home, with a lot area of 96 sqm and a floor area of 64 sqm.
Camella’s developments can be found all over the Philippines. These include La Montagna Estates (Teresa, Rizal), Cerritos East (Pasig City), Gran Europa (Lumbia, Cagayan de Oro), El Paseo (Novaliches, Quezon City), Grande Vita (Bignay Road, Valenzuela), Nova Romania (Novaliches, Quezon City), Siena Villas (Caloocan City), Tierra del Sueño (San Jose del Monte, Bulacan), Bella Vista (Gen. Trias, Cavite), Cerritos (Daang Hari, Alabang), Colina (San Pedro, Laguna), Lessandra (Bacoor / Dasmariñas, Cavite), Merida (BF Resort, Las Piñas), Siena Villas (Bacoor, Cavite), Terrassa (Imus, Cavite), Tierra del Fuego (Gen. Trias, Cavite), Andalusia (San Fernando, Pampanga), Azienda Milan (Talisay City, Cebu), Bacolod (Bacolod, Negros Occidental), Batangas (Sto. Tomas,
R eview ofO perations
Market: Low cost & affordable
Price: P3.5M - below
Offering: House & Lot (Mega Manila)
Real Estate Revenues (in Php Million): • Php 3,513.7 (2010)• Php4,419.0 (2011)
Revenue Distribution: • 31% (2010)• 33% (2011)

Vista LandA N N U A L R E P O R T11
VISTA LAND ANNUAL REPORT 2011 35
Batangas), General Santos (San Isidro, General Santos), Isabela (Santiago, Isabela), Leyte (Palo, Leyte), Naga (Naga City, Camarines Sur), Ormoc (Ormoc City, Leyte), Pasadena (Cebu City, Cebu), Plantacion (Lipa City, Batangas), Positano (Maa, Davao), Prominenza (Baliuag, Bulacan), Provence (Malolos, Bulacan), Riverdale (Talamban, Cebu), Savannah (Oton, Iloilo), Solariega (Talomo, Davao), Sorrento (Mexico, Pampanga), Sta. Barbara (Kauswagan, Cagayan de Oro), Toscana (Bago Galera, Davao), Vittoria (Lapu-Lapu City, Cebu).
Communities Philippines, with its vision of building world-class homes under the Camella brand, anchors the strategic expansion of Vista Land in the provincial areas.
Its developments include Camella Northpoint (Davao City), Provence (Malolos, Bulacan), Camella Sto. Tomas (Sto. Tomas, Batangas), Positano (Davao City), Camella General Santos (General Santos), Camella Naga (Naga City), Camella Tuguegarao (Tuguegarao, Cagayan), and Prominenza (Baliuag, Bulacan).
Camella’s townhouse modules, Lessandra, continue to expand in the various islands of the Philippines. It has the distinction of being the most affordable house and lot package in the Vista Land product line. Innovative space-saving features and clean, no-nonsense designs have made Lessandra homes a consistent bestseller. Its most popular model home, Rina, has an Italian-theme with a lot area of 63 sqm and a floor area of 40 sqm. Lessandra has developments in the peripheries of Metro Manila, specifically Cavite, Bulacan, and Batangas. Lessandra communities have also been built in Bicol, Cebu, Iloilo, Bacolod, Davao and Cagayan de Oro. Plans are underway for more Lessandra communities in 2012.
COMMUNITIESP H I L I P P I N E S
Market: Low cost & affordable
Price: P3.5M - below
Offering: House & Lot (Mega Manila)
Real Estate Revenues (in Php Million): • Php 3,513.7 (2010)• Php4,419.0 (2011)
Revenue Distribution: • 31% (2010)• 33% (2011)
Market: All price points; Camella brand
Offering: House & Lot (Outside Mega Manila)
Real Estate Revenues (in Php Million): • Php 4,082.5 (2010)• Php4,262.0 (2011)
Revenue Distribution: • 36% (2010)• 32% (2011)

36 VISTA LAND
In 2004, Vista Land ventured into its initial vertical development with the launch of Marfori Towers, a residential condominium in Muntinlupa City. After four years, this initiative has resulted in 19 condominium projects in varying degrees of development.
The acquisition of Vista Residences enabled Vista Land to complete its product offerings and become a player in the high-rise, multi-level, property development arena. Its three-decade experience in creating homes has been applied to each Vista Residences building -- with efficient space planning within an aesthetically-pleasing environment. A strong positive response by the market has enabled Vista Residences to become a major condominium developer within a short span of time.
In 2011, Vista Land, capitalizing on the popularity of the “Camella” brand, introduced Camella Condo Homes (CCH). With CCH developments towering in key areas of the
R eview ofO perations

Vista LandA N N U A L R E P O R T11
VISTA LAND ANNUAL REPORT 2011 37
metropolis, such as Taft in Manila and Katipunan in Quezon City, urban residents will continue to experience the housing expertise Vista Land is known for.
Vista Residences’ current developments include the following: Mosaic (Greenbelt, Makati City), KL Mosaic (Legazpi Village, Makati City), Salcedo Square (Salcedo Village, Makati City), Laureano de Trevi (Chino Roces, Makati City), Avant (The Fort, Taguig City), Pacific Residences Tower (Taguig City), Pacific Residences Tower (Taguig Tower), Symphony Tower (South Triangle, Quezon City), Pine Crest (New Manila, Quezon City), Madison Place (Cubao, Quezon City), Wil Tower Mall (Eugenio Lopez Drive, Quezon City), The Currency (Ortigas, Pasig City), and Crown Tower (Sampaloc, Manila).
Market: Low to High-end
Price: P1.9M to P16M
Offering: Vertical projects (Mega Manila)
Real Estate Revenues (in Php Million):• Php 778.8 (2010)• Php980.9 (2011)
Revenue Distribution: • 7% (2010)• 7% (2011)

38 VISTA LAND
Board of Directors
The Board of Directors (the “Board”) shall be primarily responsible for the governance of the Corporation. In addition to setting the policies for the accomplishment of the corporate objectives, it shall provide an independent check on Management. The term “Management” as used herein shall refer to the body given the authority by the Board to implement the policies it has laid down in the conduct of the business of the Corporation.
Composition
The Board shall be composed of at least five (5), but not more than fifteen (15), members who are elected by the stockholders; and at least two (2) independent directors or such number of independent directors that constitute twenty percent (20%) of the members of the Board, whichever is lesser, but in no case less than two (2).
The membership of the Board may be a combination of executive and non-executive directors (which include independent directors) in order that no director or small group of directors can dominate the decision making process.
The non-executive directors should possess such qualifications and stature that would enable them to participate effectively in the deliberations of the Board.
Chairman
The Chairman of the Board, President, and Chief Executive Officer have been separated to foster an appropriate balance of power, increased accountability, and better capacity for independent decision making by the Board.
Board Performance
The Board holds regular meetings. To assist the directors in the discharge of their duties, each director is given access to the Corporate Secretary and Assistant Corporate Secretary, who serve as counsel to the board of directors and at the same time communicate with the Board, management, the company’s shareholders, and the investing public.
In 2011, the Board held 8 meetings. Below is a record of attendance of the directors at these meetings and at the AGM:
C orporateG overnance

Vista LandA N N U A L R E P O R T11
VISTA LAND ANNUAL REPORT 2011 39
Director’s NanmeJan
25
Mar
29
Apr
29
May
4
May
17
Jun
15
Jul
22
sep
13
Marcelino C. Mendoza P P P P P P P P
Benjamarie Therese N. Serrano P P P P P P P -
Cynthia J. Javarez P P P P P P P P
Maribeth C. Tolentino P P P P P P P P
Manuel Paolo A. Villar P P P P P P P P
Ruben O. Fruto P P P P P P P P
Marilou O. Adea P P P P P P P P
Board Committee
To assist the Board in complying with the principles of good corporate governance, the Board created three committees.
Nomination Committee There are three directors that comprise the Nomination Committee, one of which is an independent director: Marcelino C. Mendoza (Chairman), Maribeth C. Tolentino, and Ruben O. Fruto (Independent Director). This committee reviews and evaluates the qualifications of all persons nominated to the Board and other appointments that require Board approval, and to assess the effectiveness of the Board’s processes and procedures in the election or replacement of directors.
Compensation and Remuneration Committee Three directors comprise the Compensation and Remuneration Committee, one of whom is an independent director: Benjamarie Therese N. Serrano (Chairman), Manuel Paolo A. Villar, and Marilou O. Adea (Independent Director). This committee establishes the formal and transparent procedure for developing a policy on executive remunerations, and fixing remuneration packages of corporate officers and directors. It also provides oversight over remuneration of senior management and other key personnel, ensuring that compensation is consistent with the corporation’s culture, strategy, and control environment.
Audit Committee The Audit Committee has three members, two of which are independent directors: Marilou O. Adea (Independent Director), Ruben O. Fruto
(Independent Director), and Cynthia J. Javarez. This committee assists the Board in performing an oversight responsibility for the financial reporting process, system of internal control, audit process, and monitoring of compliance with applicable laws, rules, and regulations. It also provides oversight over Management’s activities in managing credit, market, liquidity, operational, legal, and other risks of the corporation. This includes a regular receipt from Management of information on risk exposures and risk management activities. Management
Management is primarily responsible for the day-to-day operations and business of the company. The annual compensation of the chairman / CEO and the top eight senior executives of the company are set out in the Definitive Information Statement distributed to shareholders.
Compliance Monitoring
The Compliance Officer is responsible for monitoring compliance by the company with the provisions and requirements of good corporate governance.
On June 2010, the Board of Directors amended its Manual of Corporate Governance in compliance with the Revised Code of Corporate Governance issued by the Securities and Exchange Commission.
Website
Up-to-date information on the company’s corporate structure, products and services, results of business operations, financial statements, career opportunities and other relevant information on the company may be found at its official website www.vistaland.com.ph.

40 VISTA LAND
Vista Land’s corporate social responsibility efforts are tied with its belief in
enriching communities where it operates and, considering the company’s
extensive geographic reach, consequently contributing to a positive
environmental impact for the entire country.
In line with this thrust, 2011 saw the launch of Vista Land’s GreenViron
program, which strategically aligns the company’s key businesses
with the Villar Foundation’s expertise in environmental and
livelihood programs. A composite of two words, “GreenViron”
SC
ocialorporate
R esponsibility

Vista LandA N N U A L R E P O R T11
VISTA LAND ANNUAL REPORT 2011 41
is a call to action aimed towards making all Vista Land communities “green.” The company’s
partnership with the Villar Foundation, which has won three international awards in five years,
shows its commitment to this calling.
GreenViron’s theme of caring for the environment and the community rests on the view
that every Vista Land stakeholder has a role in taking care of the communities where they
live and work. The strong sense of ownership and the empowerment of the employees and
stakeholders have enabled Vista Land to successfully launch GreenViron shortly after
Earth Day, 2011.

42 VISTA LAND
This campaign for sustainability spans 10 communities in
87 property projects. All Vista Land companies – Camella,
Brittany, Crown Asia, Vista Residences and Communities
Philippines, simultaneously launched the GreenViron
program in its communities nationwide. About 10,000
trees were planted in the different Vista Land communities.
These new seedlings were added to the company’s
previously planted 1 Million trees in its properties.
GreenViron has targeted an additional 100,000 trees to be
planted in 2011. Various tree varieties have been planted
– from pine trees to African tulips and Molave trees – to
provide present and future residents with a pleasant
landscape and a healthy environment.
SC
ocialorporate
R esponsibility

Vista LandA N N U A L R E P O R T11
VISTA LAND ANNUAL REPORT 2011 43
Aside from tree-planting, GreenViron’s four-
point strategy also includes coconut coir, waste
segregation and vermi-culture.
• VistaLandiscommittedtoplantingone million trees in five years and creating ‘green zones’ across the country. This activity is the company’s way of contributing to the reduction of air pollution.
• Oncoconutcoirpreparation,VistaLandiscommitted to providing an environmental solution for soil erosion and creating livelihood programs for to indigent communities within the local government unitswhereaVistaLandcommunitymaybe located. Coco coir is used to contain soil instead of more expensive commercial alternatives.
• Biodegradablewaste(food,garden,paper, organic, cloth, and wet waste) from VistaLand’spropertiesarecollectedandrecycled into fertilizers. This minimizes the total cost of purchasing commercial fertilizers. Non-biodegradable waste (plastics)andotherrecyclablematerials(glass,metals)willbecleanedforreuse or sold.
Above: The GreenViron print ad as shown in different broadsheets serves as the launch of GreenViron highlighting the projects and policies to be implemented within the company.
EditedVista Land AR 11_FA.indd 43 6/11/12 9:52 AM

44 VISTA LAND
It is envisaged that vermi-culture will be introduced in
Vista Land communities supervised by representatives
from the Villar Foundation. Earthworm farms will be
placed in several properties and the by-products shall
be used as organic fertilizers through composted garden
waste. The natural fertilizers shall be used for the Vista
Land communities’ gardens and landscaped areas.
During the GreenViron launch, former Vista Land
President and CEO Ms. Benjamarie Serrano led 400
participants in a tree planting activity in Evia, the Vista
Land master-planned community in Daang Hari. In
Lakefront, Marketing Head Romeo Sabater led 250
The different GreenViron posters are a testament to Vista Land’s commitment towards raising awareness and caring for the environment.
SC
ocialorporate
R esponsibility

Vista LandA N N U A L R E P O R T11
VISTA LAND ANNUAL REPORT 2011 45
participants, together with other officers – Red Rosales,
Marketing Head for vertical development (Makati
group), and Beth Kalaw, Marketing Head for the vertical
development (Quezon City group) in the same activity.
Camella Luzon Operations Head Dante Julongbayan
led the Antipolo activity. Ailene Sarmiento, General
Manager (GM) of Camella Bulacan, led the Malolos,
Bulacan GreenViron activity. In Brittany’s Crosswinds,
the Managing Director, Camille Villar oversaw the launch
of GreenViron in Tagaytay.
Camella Naga’s 50 employees planted 50 pili trees led
by its GM Natanette Pardito. Participants from the other
provinces include GM Lili Donasco (Savannah, Iloilo),
Riverdale GM Myra Gilig and Azienda GM Jasmin Alviola
(Riverdale Cebu), Camella Cagayan de Oro GM Emelia
Lustado (Gran Europa), and Camella Regions Planning
Head Arch. Art Secuya (Toscana, Davao City). A mass
and a motorcade were included as part of GreenViron’s
festivities. The foregoing activities embody Vista
Land’s unwavering commitment to the success of the
GreenViron program across all its communities and the
solid response of its stakeholders to ensure its success.

46 VISTA LAND
Marcelino C. MendozaDirector, Chairman
Manuel Paolo A. VillarDirector, President and Chief Executive Officer
Cynthia J. JavarezDirector & Controller
Mr. Mendoza, 57, is the Chief Operating Officer of MGS Corporation. He was President of Camella Homes, Inc. from 2001 to 2003, and Chief Operating Officer of Communities Philippines, Inc. from 1992 to 1995. He has a Masters Degree in Business Administration (Ateneo de Manila University) and a Certificate in Advance Course in Successful Communities from the Harvard University Graduate School of Design. Mr. Mendoza is a member of the Phi Kappa Phi International Honor Society. Well respected in the Philippine real estate industry, Mr. Mendoza has served as President and Chairman of the Board (1996 to 1998) and Board Adviser (1999 to present) of the Subdivision and Housing Developers Association (SHDA).
Mr. Villar, 35, graduated from the Wharton School of the University of Pennsylvania, Philadelphia, USA with a Bachelor of Science in Economics and Bachelor of Applied Science in 1999. He was a consultant for McKinsey & Co. in the United States from 1999 to 2001. He joined Crown Asia in 2001 as Head of Corporate Planning. He was elected President and Chief Executive Officer of Vista Land and Lifescapes, Inc. in July 2011.
Ms. Javarez, 48, graduated from the University of the East with a degree in Bachelor of Science in Business Administration major in Accounting. She is a Certified Public Accountant. She took a Management Development Program at the Asian Institute of Management. She is currently the Controller of Vista Land and Head of the Tax and Audit group after holding various other positions in the MB Villar Group of Companies since 1985.
B oard ofD irectors

Vista LandA N N U A L R E P O R T11
VISTA LAND ANNUAL REPORT 2011 47
Cynthia J. JavarezDirector & Controller
Marilou O. AdeaIndependent Director
Maribeth C. TolentinoDirector and President, Vista Residences
Gemma M. santosCorporate Secretary
Ruben O. FrutoIndependent Director
Ms. Adea, 60, is currently the Court Appointed Rehabilitation Receiver of Anna-Lynns, Inc. and Manuela Corporation. Ms. Adea served previously as Project Director for Site Acquisition of Digital Telecommunications Phils. Inc. from 2000 to 2002, Executive Director for FBO Management Network, Inc. from 1989 to 2000 and BF Homes Inc. in Receivership from 1988 to 1994 and Vice President for Finance & Administration for L&H Resources Management Corporation from 1986 to 1988. Ms. Adea holds a Degree in Bachelor of Science in Business Administration Major in Marketing Management from the University of the Philippines.
Ms. Tolentino, 46, is currently the President of Vista Residences, Inc. She is also the President of the following subsidiary corporations: Palmera Homes, Inc., Household Development Corporation, Eastridge Estates, Inc. and Ridgewood Estates, Inc. Ms. Tolentino was previously the General Manager of Golden Haven Memorial Park, Inc. from 1999 to 2005. She holds a Bachelor of Science degree in Business Administration Major in Accounting, Magna cum Laude, from the University of the East, Manila. Ms. Tolentino is a Certified Public Accountant.
Ms. Santos, 49, graduated cum laude with the degree of Bachelor of Arts, Major in History from the University of the Philippines in 1981, and with the degree of Bachelor of Laws also from the University of the Philippines in 1985. She is a practicing lawyer and Senior Partner of Picazo Buyco Tan Fider & Santos Law Offices and Corporate Secretary of various Philippine companies, including public company Maybank ATR Kim Eng Financial Corporation and Assistant Corporate Secretary of public company Metro Pacific Investments Corporation.
Mr. Fruto, 73, graduated with the degree of Bachelor of Laws from the Ateneo de Manila University in 1961. He was formerly a partner in the law firm of Feria, Feria, Lugtu & La O’ and the Oben, Fruto & Ventura Law Office. In February 1987 he was the Chief Legal Counsel and Senior Vice President of the Development Bank of the Philippines. He was the Undersecretary of Finance from March 1990 to May 15, 1991. Presently aside from engaging in private law practice specializing in corporate and civil litigation, he is also General Counsel of Wallem Philippines Shipping, Inc. and Wallem Maritime Services, Inc.; Vice-Chairman of Toyota Balintawak, Inc.; Director and Vice-President of China Shipping Manila Agency, Inc. and Director and Treasurer of Padre Burgos Realty, Inc. He is also a Consultant and the designated Corporate Secretary of the Subic Bay Metropolitan Authority.

ManagementC ommittee
From Left to Right:Manuel Paolo A. Villar, President & Chief Executive OfficerCynthia J. Javarez, ControllerRicardo B. Tan, Jr., Chief Financial OfficerMaribeth C. Tolentino, President, - Vista ResidencesJerylle Luz C. Quismundo, President - Communities PhilippinesCamille Lydia A. Villar, Managing Director - BritannyMary Lee s. sadiasa, Managing Director - Crown Asia

Vista LandA N N U A L R E P O R T11
VISTA LAND ANNUAL REPORT 2011 49

ManagementC ommittee
From Left to Right:Ric A. Pallesco, Managing Director - Camella HomesDante M. Julongbayan, Managing Director - Communities Philippines, North LuzonRizalito J. Rosales, Managing Director - Vista Residences, Makati/ManilaElizabeth M. Kalaw, Managing Director - Vista Residences, Pasig/Quezon CityMa. Leni Damasco-Luya, Managing Director - Vista CommercialEdgardo G. santos, Vice President for Sales, Camella HomesMa. Nalen s.J. Rosero-Galang, Chief Legal Counsel

Vista LandA N N U A L R E P O R T11
VISTA LAND ANNUAL REPORT 2011 51

52 VISTA LAND
DM
iscussion andanagement
A nalysis
REVIEW OF yEAR END 2011 Vs yEAR END 2010
REsULTs OF OPERATIONs
Revenues
Real EstateThe Company recorded revenue from real estate sales amounting to 13,513.4 million in the year ended December 31, 2011, an increase of 19% from 11,338.5 million in same period last year. This was primarily attributable to the increase in the overall completion rate of sold inventories of its business units particularly of Crown Asia, Camella, Vista Residences, and Brittany. The Company uses the Percentage of completion method of revenue recognition where revenue is recognized in reference to the stages of development of the properties. • RealestaterevenueofCrownAsiaincreasedby45%
to 2,183.9 million in the year ended December 31, 2011 from 1,508.0 million in the year ended December 31, 2010 This was primarily attributable to the increase in the overall completion of Crown Asia’s sold inventories. Crown Asia is Vista Land’s business unit for the middle income segment of the market
• RealestaterevenueofCamellaHomesincreasedby26% to 4,419.0 million in the year ended December 31, 2011 from 3,513.7 million for the year ended December 31, 2010. This was primarily attributable to the increase in the overall completion of Camella’s sold inventories. Camella Homes caters to the low & affordable segment of the market.
• RealestaterevenuefromVistaResidencesfortheyear ended December 31, 2011 increased by 26% to
80.9 million in the year ended December 31, 2011 from 778.8 million in the same period last year. The increase in revenue was primarily attributable to the increase in the overall completion of sold inventories
• RealestaterevenueofBrittanyincreasedby15%to 1,667.7 million in the year ended December 31,
2011 from P=1,455.5 million in the same period last year. This was primarily attributable to the increase in the overall completion of Brittany’s sold inventories. Brittany caters to the high-end segment of the market.
• RealestaterevenueofCommunitiesPhilippinesincreased to 4,262.0 million in the year ended December 31, 2011, an increase of 4% from 4,082.5 million in the year ended December 31, 2010. This increase was principally due to the increased completion of sold inventories of the year of the Company’s various projects from various areas outside Mega Manila.
Interest incomeInterest income increased by 10% from P777.1 million in the year ended December 31, 2010 to 853.1 million in the year ended December 31, 2011 due to increase in interest income from short-term and long-term cash investments during the year.
Foreign exchange gainUnrealized foreign exchange gain of P62.0 million in the year ended December 31, 2011 was due to the appreciation of the reporting currency for the period.
MiscellaneousMiscellaneous income increased by 5% from 367.5 million in the year ended December 31, 2010 to 386.2 million in the year ended December 31, 2011 due to increase in real estate sales deposit forfeitures.
Costs and Expenses
Cost and expenses increased by 21% to 11,221.1 million in the year ended December 31, 2011 from 9,251.9 million in the year ended December 31, 2010. Costs and expenses as a percentage of real estate revenue increased from 82% in the year ended December 31, 2010 to 83% in the year ended December 31, 2011. The 21% increase in the account was primarily attributable to the following:
• Costofrealestatesalesincreasedby17%from 5,656.3 million in the year ended December 31,
2010 to 6,611.3 million in the year ended December 31, 2011 primarily due to the increase in the overall recorded sales of Vista Land’s business units.
• Operatingexpensesincreasedby22%from 2,689.5 million in the year ended December 31, 2010 to
3,274.3 million in the year ended December 31, 2011 primarily due to the following:

Vista LandA N N U A L R E P O R T11
VISTA LAND ANNUAL REPORT 2011 53
o an increase in advertising and promotions expenses to 764.6 million in the year ended December 31, 2011 from 628.5 million in the year ended December 31, 2010 due to marketing activities implemented by the Company during the period.
o an increase in commissions from 662.4 million in the year ended December 31, 2010 to 898.6 million in the year ended December 31, 2011 resulting from increase in sales of the Company during the period.
o an increase in salaries, wages and employee benefits from 325.8 million in the year ended December 31, 2010 to 409.0 million in the year ended December 31, 2011 resulting from increase in total number of employees.
• Interestandfinancingchargesincreasedby82%from 730.2 million in the year ended December 31, 2010 to P1,329.2 million in the year ended December 31, 2011 due to increase in interest bearing payables during the year.
Equity in net loss of an associate
The equity in net loss of an associate amounting to 6.2 million in the year ended December 31, 2011 was due to the results of operations of an associate.
Provision for Income Tax
Provision for income tax decreased by 70% from 220.7 million in the year ended December 31, 2010 to 65.9 million in the year ended December 31, 2011 primarily due to tax-exempt income and reversal of expired minimum corporate income tax (MCIT) and net operating loss carryover (NOLCO).
Net Income
As a result of the foregoing, the Company’s net income increased by 17% to 3,528.0 million in the year ended December 31, 2011 from 3,013.0 million in the year ended December 31, 2010.
For the year ended December 31, 2011, there were no seasonal aspects that had a material effect on the financial
condition or results of operations of the Company. Neither were there any trends, events or uncertainties that have had or that are reasonably expected to have a material impact on the net sales or revenues or income from continuing operations. The Company is not aware of events that will cause a material change in the relationship between the costs and revenues.
There are no significant elements of income or loss that did not arise from the Company’s continuing operations.
FINANCIAL CONDITION
As of December 31, 2011 vs. December 31, 2010
Total assets as of December 31, 2011 were 67,572.6 million compared to 60,481.3 million as of December 31, 2010, or a 12% increase. This was due to the following:
• Cashandcashequivalentsincludingshorttermandlong-term cash investments increased by 1,731.2 million from 6,894.9 million as of December 31, 2010 to 8,626.1 million as of December 31, 2011 primarily due to the proceeds from issuance of notes payable in the first half of 2011.
• Receivablesincreasedby10%from 19,073.6 million to 21,069.3 million due to the revenue recognized during for the period.
• Realestateinventoriesincreasedby19%from 12,498.6 million to 14,901.4 million due opening
of new projects during the period.
• Investmentpropertiesamountingto 2,291.7 million as of December 31, 2011 pertains to land, building and building improvements reclassified from real estate for sale and development and property & equipment as these are intended to be developed for commercial and retails purposes and subsequently leased out to third parties.
• Landandimprovementsdecreasedby9%from 18,042.1 million to 16,348.1 million due to
opening of new projects and reclassification to investment properties during the period.

54 VISTA LAND
• Propertyandequipmentincreasedby50%from 118.9 million to 178.8 million due to acquisitions
made during the year.
• Interestsinjointventuresdecreasedby13%from 1,887.7 million as of December 31, 2010 to 1,645.3 as of December 31, 2011 due primarily to
settlements made during the period.
• Otherassetsincreasedby48%from 1,201.4 million as of December 31, 2010 to P=1,778.6 million as of December 31, 2011 due primarily to increase in creditable withholding taxes.
Total liabilities as of December 31, 2011 were 26,884.1 million compared to 22,304.8 million as of December 31, 2010, or a 21% increase. This was due to the following:
• Accountsandotherpayablesincreasedby23%from4,710.2 million as of December 31, 2010 to 5,775.6
million as of December 31, 2011 due to accruals made during the period.
• Payabletorelatedpartiesdecreasedby53%from385.7 million as of December 31, 2010 to 182.8
million as of December 31, 2011 due to settlements made during the period.
• Incometaxpayabledecreasedby17%from 63.0 million as of December 31, 2010 to 52.3 million as of December 31, 2011 primarily due to lower taxable income for the year.
• Interestbearingbankloansandloanspayable(representing the sold portion of the Company’s installment contracts receivables with recourse), increased by 6% from 6,207.8 million as of December 31, 2010 to 6,581.8 million as of December 31, 2011 due to availment of additional loans during the year.
• Liabilitiesforpurchasedlandincreasedby38%from1,111.6 million as of December 31, 2010 to 1,537.3 million as of December 31, 2011 due to
land acquisitions on account during the period.
• Notespayableincreasedby74%from 4,257.9 million as of December 31, 2010 to 7,393.8 million as of December 31, 2011 due to the US $75.0 million
notes issued by the Company in the first half of 2011. The total notes issued by the Company amounted to US $175.0 million with a carrying amount of 7,393.8 million as of December 31, 2011
• Deferredtaxliabilities–netdecreasedby12%from2,284.6 million as of December 31, 2010 to 2,012.9
million as of December 31, 2011 due to reversal of previously recorded deferred tax liabilities.
Total stockholder’s equity net increased by 7% to 40,688.5 million as of December 31, 2011 from 38,176.5 million as of December 31, 2010 due to the net
income recorded for the year ended December 31, 2011.
Considered as the top five key performance indicators of the Company as shown below:
Key Performance Indicators 12/31/2011 12/31/2010Current ratio (a) 2.53:1 2.83:1Debt-to-equity ratio (b) 0.66:1 0.58:1Interest expense/Income before Interest expense (c)
27.0% 18.4%
Return on assets (d) 5.2% 5.0%
Return on equity (e) 8.7% 7.9%
Notes:(a) Current Ratio: This ratio is obtained by dividing
the Current Assets of the Company by its Current liabilities. This ratio is used as a test of the Company’s liquidity.
(b) Debt-to-equity ratio: This ratio is obtained by dividing the Company’s Total Liabilities by its Total Equity. The ratio reveals the proportion of debt and equity a company is using to finance its business. It also measures a company’s borrowing capacity.
(c) Interest expense/Income before interest expense: This ratio is obtained by dividing interest expense for the period by its income before interest expense. This ratio shows whether a company is earning enough profits before interest to pay its interest cost comfortably
(d) Return on assets: This ratio is obtained by dividing the Company’s net income by its total assets. This measures the Company’s earnings in relation to all of the resources it had at its disposal.
DM
iscussion andanagement
A nalysis

Vista LandA N N U A L R E P O R T11
VISTA LAND ANNUAL REPORT 2011 55
(e) Return on equity: This ratio is obtained by dividing the Company’s net income by its total equity. This measures the rate of return on the ownership interest of the Company’s stockholders.
Because there are various calculation methods for the performance indicators above, the Company’s presentation of such may not be comparable to similarly titled measures used by other companies.
Current ratio as of December 31, 2011 decreased from that of December 31, 2010 due to the increase in accounts and other payables and current portion of bank loans and liabilities for purchased land.
Debt-to-equity ratio increased due to the increase in the total liabilities brought by the issuance of notes payable during the year.
Interest expense as a percentage of income before interest expense increased in the year ended December 31, 2011 compared to the ratio for the year ended December 31, 2010 due to an increase in interest bearing liabilities for the year.
Return on asset improved for December 31, 2011 compared to that on December 31, 2010 due primarily to the higher net income and increase in long-term cash investments and other assets.
Return on equity increased due to a higher net income reported for the year ended December 31, 2011.
Material Changes to the Company’s Balance Sheet as of December 31, 2011 compared to December 31, 2010 (increase/decrease of 5% or more)
Cash and cash equivalents including short term and long-term cash investments increased by 25% from
6,894.9 million as of December 31, 2010 to 8,626.1 million as of December 31, 2011 primarily
due to the proceeds from issuance of notes payable in the first half of 2011.
Receivables increased by 10% from 19,073.6 million to 21,069.3 million due to the revenue recognized during for the period.
Real estate inventories increased by 19% from 12,498.6 million to 14,901.4 million due opening
of new projects during the period.
Investment properties amounting to 2,291.7 million as of December 31, 2011 pertains to land, building and building improvements reclassified from real estate for sale and development and property & equipment as these are intended to be developed for commercial and retails purposes and subsequently leased out to third parties.
Land and improvements decreased by 9% from 18,042.1 million to 16,348.1 million due to
opening of new projects and reclassification to investment properties during the period.
Property and equipment increased by 50% from 118.9 million to 178.8 million due to acquisitions
made during the year.
Interests in joint ventures decreased by 13% from 1,887.7 million as of December 31, 2010 to 1,645.3 as of December 31, 2011 due primarily to
settlements made during the period.
Other assets increased by 48% from 1,201.4 million as of December 31, 2010 to 1,778.6 million as of December 31, 2011 due primarily to increase in creditable withholding taxes.
Accounts and other payables increased by 23% from 4,710.2 million as of December 31, 2010 to
5,775.6 million as of December 31, 2011 due to accruals made during the period.
Payable to related parties decreased by 53% from 385.7 million as of December 31, 2010 to 182.8
million as of December 31, 2011 due to settlements made during the period.
Income tax payable decreased by 17% from 63.0 million as of December 31, 2010 to 52.3 million as of December 31, 2011 primarily due to lower taxable income for the year.
Interest bearing bank loans and loans payable (representing the sold portion of the Company’s installment contracts receivables with recourse), increased by 6% from 6,207.8 million as of December 31, 2010 to 6,581.8 million as of December 31, 2011 due to availment of additional loans during the year.

56 VISTA LAND
Liabilities for purchased land increased by 38% from 1,111.6 million as of December 31, 2010 to 1,537.3 million as of December 31, 2011 due to
land acquisitions on account during the period.
Notes payable increased by 74% from 4,257.9 million as of December 31, 2010 to 7,393.8 million as of December 31, 2011 due to the US $75.0 million notes issued by the Company in the first half of 2011. The total notes issued by the Company amounted to US $175.0 million with a carrying amount of 7,393.8 million as of December 31, 2011
Deferred tax liabilities – net decreased by 12% from 2,284.6 million as of December 31, 2010 to 2,012.9 million as of December 31, 2011 due to reversal of previously recorded deferred tax liabilities.
Total stockholder’s equity net increased by 7% to 40,688.5 million as of December 31, 2011 from 38,176.5 million as of December 31, 2010 due
to the net income recorded for the year ended December 31, 2011.
Material Changes to the Company’s Statement of income for the year ended December 31, 2011 compared to the year ended December 31, 2010 (increase/decrease of 5% or more)
Revenue from real estate sales increased by 19% to 13,513.4 million in the year ended December 31, 2011 from 11,338.5 million as of December 31, 2010 primarily to the increase in the overall completion rate of sold inventories of the Company’s business units.
Interest income increased by 10% from 777.1 million in the year ended December 31, 2010 to
853.1 million in the year ended December 31, 2011 due to increase in interest income from short-term and long-term cash investments during the year.
Foreign exchange gain of 62.0 million in the year ended December 31, 2011 was due to the appreciation of the reporting currency for the period.
Miscellaneous income increased by 5% from 367.5 million in the year ended December 31, 2010
to P=386.2 million in the year ended December 31, 2011 due to increase in real estate sales deposit forfeitures.
Cost of real estate sales increased by 17% from 5,656.3 million in the year ended December
31, 2010 to 6,611.3 million in the year ended December 31, 2011 primarily due to the increase in the overall recorded sales of Vista Land’s business units.
Operating expenses increased by 22% from 2,689.5 million in the year ended December 31, 2010 to
3.274.3 million in the year ended December 31, 2011 primarily due to the increase in commissions due to increase in sale for the period and advertising and promotions expenses due to marketing activities, and salaries, wages and employee benefits resulting from increase in total number of employees.
Interest and financing charges increased by 82% from 730.2 million in the year ended December 31, 2010 to 1,329.2 million in the year ended December 31, 2011 due to increase in interest bearing payables during the year.
The equity in net loss of an associate amounting to 6.2 million in the year ended December 31, 2011
was due to the results of operations of an associate.
Provision for income tax decreased by 70% from 220.7 million in the year ended December 31,
2010 to 65.9 million in the year ended December 31, 2011 primarily due to tax-exempt income and reversal of expired minimum corporate income tax (MCIT) and net operating loss carryover (NOLCO).
There are no other material changes in the Company’s financial position (changes of 5% or more) and condition that will warrant a more detailed discussion. Further, there are no material events and uncertainties known to management that would impact or change reported financial information and condition on the Company.
DM
iscussion andanagement
A nalysis

Vista LandA N N U A L R E P O R T11
VISTA LAND ANNUAL REPORT 2011 57
The management of Vista Land & Lifescapes, Inc. and its subsidiaries is responsible for all information and representations contained in the consolidated balance sheets as of December 31, 2011 and 2010 and the consolidated statements of income, consolidated statements of changes in equity and consolidated statements of cash flows for each of the three years in the period ended December 31, 2011 and the summary of significant accounting polices and other explanatory notes. The consolidated financial statements have been prepared in accordance with the Philippine Financial Reporting Standards and reflect amounts that are based on the best estimates and informed judgment of management with an appropriate consideration to materiality.
In this regard, management maintains a system of accounting and reporting which provides for the necessary internal controls to ensure that transactions are properly authorized and recorded, assets are safeguarded against unauthorized use or disposition and liabilities are recognized. The management likewise discloses to the Company’s audit committee and its external auditor: (i) all significant deficiencies in the design or operation of internal controls that could adversely affect its ability to record, process, and report financial data; (ii) material weaknesses in the internal controls; and (iii) any fraud that involves management or other employees who exercise significant roles in internal controls.
The Board of Directors reviews the financial statements before such statements are approved and submitted to the stockholders of the Company.
SyCip, Gorres, Velayo & Co., the independent auditors appointed by the stockholders, has audited the consolidated financial statements of the Company in accordance with Philippine Standards on Auditing and has expressed their opinion on the fairness of presentation upon completion of such audit in its report to the Board of Directors and stockholders.
MARCELINO C. MENDOZAChairman, Board of Directors
MANUEL PAOLO A. VILLAR RICARDO B. TAN, JR.President and Chief Executive Officer Chief Financial Officer
STATEMENT OF MANAGEMENT’S RESPONSIBILITYFOR FINANCIAL STATEMENTS

INDEPENDENT AUDITORS’ REPORT The Stockholders and the Board of Directors Vista Land & Lifescapes, Inc. 3rd Level Starmall Las Piñas CV Starr Avenue, Pamplona, Las Piñas City We have audited the accompanying consolidated financial statements of Vista Land & Lifescapes, Inc. and its subsidiaries, which comprise the consolidated statements of financial position as at December 31, 2011 and 2010, and the consolidated statements of comprehensive income, statements of changes in equity and statements of cash flows for each of the three years in the period ended December 31, 2011, and a summary of significant accounting policies and other explanatory information. Management’s Responsibility for the Consolidated Financial Statements Management is responsible for the preparation and fair presentation of these consolidated financial statements in accordance with Philippine Financial Reporting Standards, and for such internal control as management determines is necessary to enable the preparation of consolidated financial statements that are free from material misstatement, whether due to fraud or error. Auditors’ Responsibility Our responsibility is to express an opinion on these consolidated financial statements based on our audits. We conducted our audits in accordance with Philippine Standards on Auditing. Those standards require that we comply with ethical requirements and plan and perform the audit to obtain reasonable assurance about whether the consolidated financial statements are free from material misstatement. An audit involves performing procedures to obtain audit evidence about the amounts and disclosures in the consolidated financial statements. The procedures selected depend on the auditor’s judgment, including the assessment of the risks of material misstatement of the consolidated financial statements, whether due to fraud or error. In making those risk assessments, the auditor considers internal control relevant to the entity’s preparation and fair presentation of the consolidated financial statements in order to design audit procedures that are appropriate in the circumstances, but not for the purpose of expressing an opinion on the effectiveness of the entity’s internal control. An audit also includes evaluating the appropriateness of accounting policies used and the reasonableness of accounting estimates made by management, as well as evaluating the overall presentation of the consolidated financial statements. We believe that the audit evidence we have obtained is sufficient and appropriate to provide a basis for our audit opinion.
SyCip Gorres Velayo & Co. 6760 Ayala Avenue 1226 Makati City Philippines
Phone: (632) 891 0307 Fax: (632) 819 0872 www.sgv.com.ph BOA/PRC Reg. No. 0001, January 25, 2010, valid until December 31, 2012 SEC Accreditation No. 0012-FR-2 (Group A), February 4, 2010, valid until February 3, 2013
Untitled-1 1Untitled-1 1 6/11/12 9:47 AM6/11/12 9:47 AM
ANNUALREPORT2011
Opinion In our opinion, the consolidated financial statements present fairly, in all material respects, the financial position of Vista Land & Lifescapes, Inc. and its subsidiaries as at December 31, 2011 and 2010 and their financial performance and their cash flows for each of the three years in the period ended December 31, 2011 in accordance with Philippine Financial Reporting Standards. SYCIP GORRES VELAYO & CO. Jessie D. Cabaluna Partner CPA Certificate No. 36317 SEC Accreditation No. 0069-AR-2 (Group A), February 11, 2010, valid until February 10, 2013 Tax Identification No. 102-082-365 BIR Accreditation No. 08-001998-10-2009, June 1, 2009, valid until May 31, 2012 PTR No. 3174583, January 2, 2012, Makati City March 28, 2012
Untitled-1 2Untitled-1 2 6/11/12 9:47 AM6/11/12 9:47 AM

60 VISTA LAND
VISTA LAND & LIFESCAPES, INC. AND SUBSIDIARIES CONSOLIDATED STATEMENTS OF FINANCIAL POSITION December 31 2011 2010
ASSETS
Current Assets Cash and cash equivalents (Notes 6 and 31) P=2,052,566,048 P=3,481,807,245 Short-term cash investments (Notes 7 and 31) 1,597,723,506 1,659,460,317 Receivables (Notes 8 and 31) 12,246,512,442 10,820,489,625 Real estate inventories (Note 9) 14,901,418,372 12,498,609,224 Other current assets (Note 10) 1,415,007,286 817,437,828 Total Current Assets 32,213,227,654 29,277,804,239
Noncurrent Assets Noncurrent receivables (Notes 8 and 31) 8,822,808,812 8,253,105,474 Available-for-sale financial assets (Notes 7 and 31) 41,309,183 41,309,183 Long-term cash investments (Note 7) 4,975,840,000 1,753,600,000 Investment properties (Note 13) 2,291,697,514 − Land and improvements (Note 11) 16,348,091,788 18,042,079,632 Investment in an associate (Note 12) 689,915,634 696,088,196 Property and equipment (Note 14) 178,808,544 118,926,920 Interests in joint ventures (Note 15) 1,645,263,459 1,887,659,705 Deferred tax assets - net (Note 28) 2,028,374 26,682,801 Other noncurrent assets (Note 16) 363,577,781 384,068,429 Total Noncurrent Assets 35,359,341,089 31,203,520,340 P=67,572,568,743 P=60,481,324,579
LIABILITIES AND EQUITY
Current Liabilities Accounts and other payables (Notes 17 and 31) P=5,775,618,879 P=4,710,020,235 Customers’ advances and deposits (Note 18) 3,188,090,048 3,096,357,352 Payable to related parties (Note 29) 182,802,367 385,749,210 Income tax payable 52,258,595 63,038,703 Current portion of: Bank loans (Notes 19 and 31) 1,730,351,181 398,831,528 Loans payables (Notes 19 and 31) 738,198,961 696,481,387 Liabilities for purchased land (Notes 20 and 31) 1,079,456,553 987,723,685 Total Current Liabilities 12,746,776,584 10,338,202,100
(Forward)
VISTA LAND & LIFESCAPES, INC. AND SUBSIDIARIESCONSOLIDATED STATEMENTS OF FINANCIAL POSITION
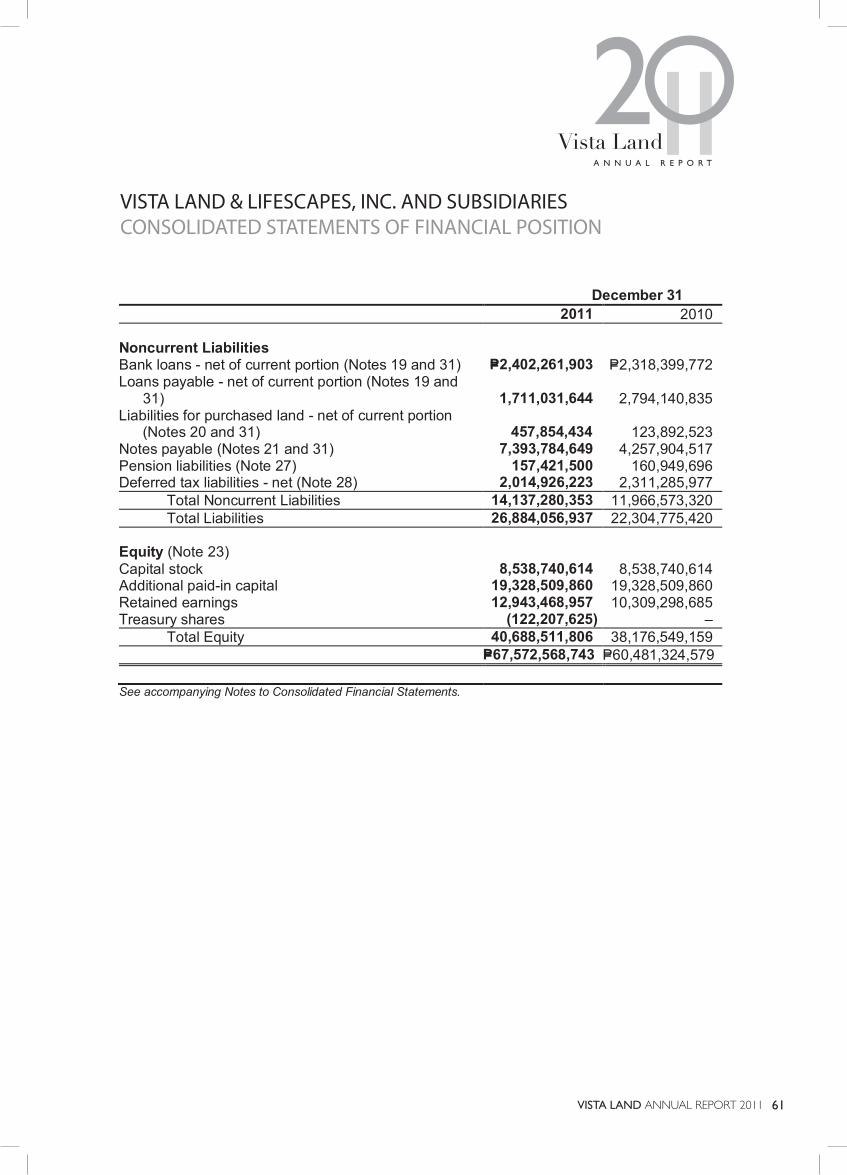
Vista LandA N N U A L R E P O R T11
VISTA LAND ANNUAL REPORT 2011 61
- 2 - December 31 2011 2010
Noncurrent Liabilities Bank loans - net of current portion (Notes 19 and 31) P=2,402,261,903 P=2,318,399,772 Loans payable - net of current portion (Notes 19 and
31) 1,711,031,644 2,794,140,835 Liabilities for purchased land - net of current portion
(Notes 20 and 31) 457,854,434 123,892,523 Notes payable (Notes 21 and 31) 7,393,784,649 4,257,904,517 Pension liabilities (Note 27) 157,421,500 160,949,696 Deferred tax liabilities - net (Note 28) 2,014,926,223 2,311,285,977 Total Noncurrent Liabilities 14,137,280,353 11,966,573,320 Total Liabilities 26,884,056,937 22,304,775,420
Equity (Note 23) Capital stock 8,538,740,614 8,538,740,614 Additional paid-in capital 19,328,509,860 19,328,509,860 Retained earnings 12,943,468,957 10,309,298,685 Treasury shares (122,207,625) – Total Equity 40,688,511,806 38,176,549,159 P=67,572,568,743 P=60,481,324,579 See accompanying Notes to Consolidated Financial Statements.
VISTA LAND & LIFESCAPES, INC. AND SUBSIDIARIESCONSOLIDATED STATEMENTS OF FINANCIAL POSITION

62 VISTA LAND
VISTA LAND & LIFESCAPES, INC. AND SUBSIDIARIES CONSOLIDATED STATEMENTS OF COMPREHENSIVE INCOME Years Ended December 31 2011 2010 2009
REVENUE Real estate P=13,513,424,829 P=11,338,533,300 P=9,629,663,010 Interest income (Note 24) 853,112,707 777,122,025 857,296,120 Miscellaneous income (Note 25) 386,246,298 367,482,455 279,747,532 14,752,783,834 12,483,137,780 10,766,706,662
COSTS AND EXPENSES Costs of real estate sales (Note 9) 6,611,347,721 5,656,325,105 5,003,984,152 Operating expenses (Note 26) 3,274,324,674 2,689,509,894 2,083,572,435 Interest and other financing charges (Note 24) 1,329,209,765 730,233,810 592,982,136 11,214,882,160 9,076,068,809 7,680,538,723
OTHER INCOME (EXPENSES) Foreign exchange gains (losses) - net
(Notes 21 and 22) 62,017,881 (15,883,820) (611,212) Dividend income 151,342 25,099 194,340 Equity in net income (loss) of an associate (Note 12) (6,172,562) 2,414,451 45,943,472 Loss on settlement of loans (Note 22) − (115,867,546) (318,810,422) Loss on writedown of available-for-sale financial assets (Note 7) − (44,038,378) – 55,996,661 (173,350,194) (273,283,822)
INCOME BEFORE INCOME TAX 3,593,898,335 3,233,718,777 2,812,884,117
PROVISION FOR INCOME TAX (Note 28) 65,914,308 220,745,680 513,475,947
NET INCOME 3,527,984,027 3,012,973,097 2,299,408,170
OTHER COMPREHENSIVE INCOME Change on fair value of available-for-sale
financial assets transferred to profit or loss (Note 7) − − (472,619)
TOTAL COMPREHENSIVE INCOME P=3,527,984,027 P=3,012,973,097 P=2,298,935,551
Basic/Diluted Earnings Per Share (Note 30) P=0.418 P=0.356 P=0.278 See accompanying Notes to Consolidated Financial Statements.
VISTA LAND & LIFESCAPES, INC. AND SUBSIDIARIESCONSOLIDATED STATEMENTS OF COMPREHENSIVE INCOME

VISTA LAND ANNUAL REPORT 2011 63
*SGVMC116984*
VIST
A L
AN
D &
LIF
ESC
APE
S, IN
C. A
ND
SU
BSI
DIA
RIE
S C
ON
SOLI
DA
TED
STA
TEM
ENTS
OF
CH
AN
GES
IN E
QU
ITY
A
ttrib
utab
le to
Equ
ity H
olde
rs o
f Vis
ta L
and
& L
ifesc
apes
, Inc
.
Cap
ital
Stoc
k (N
ote
23)
Add
ition
al
Paid
-in
Cap
ital
Ret
aine
d Ea
rnin
gs
Trea
sury
Sh
ares
(N
ote
23)
Unr
ealiz
ed
Gai
n on
A
vaila
ble-
for-
Sale
Fi
nanc
ial A
sset
s To
tal
Non
-con
trol
ling
Inte
rest
s To
tal E
quity
Bal
ance
s as
of J
anua
ry 1
, 201
1 P=8
,538
,740
,614
P=1
9,32
8,50
9,86
0 P=1
0,30
9,29
8,68
5 P=–
P=–
P=3
8,17
6,54
9,15
9 P=–
P=3
8,17
6,54
9,15
9 N
et in
com
e –
– 3,
527,
984,
027
– –
3,52
7,98
4,02
7 –
3,52
7,98
4,02
7 O
ther
com
preh
ensi
ve in
com
e –
– –
– –
– –
– To
tal c
ompr
ehen
sive
inco
me
– –
3,52
7,98
4,02
7 –
– 3,
527,
984,
027
– 3,
527,
984,
027
Acq
uisi
tion
of tr
easu
ry s
hare
s
(Not
e 23
) –
– –
(122
,207
,625
) –
(122
,207
,625
) –
(122
,207
,625
) C
ash
divi
dend
s (N
ote
23)
– –
(893
,813
,755
) –
– (8
93,8
13,7
55)
– (8
93,8
13,7
55)
Bal
ance
s as
of D
ecem
ber 3
1, 2
011
P=8,5
38,7
40,6
14
P=19,
328,
509,
860
P=12,
943,
468,
957
(P=12
2,20
7,62
5)
P=–
P=40,
688,
511,
806
P=–
P=40,
688,
511,
806
Bal
ance
s as
of J
anua
ry 1
, 201
0 P=
8,53
8,74
0,61
4 P=
19,3
28,5
09,8
60
P=7,
757,
417,
581
P=–
P=–
P=35
,624
,668
,055
P=
– P=
35,6
24,6
68,0
55
Net
inco
me
– –
3,01
2,97
3,09
7 –
– 3,
012,
973,
097
– 3,
012,
973,
097
Oth
er c
ompr
ehen
sive
inco
me
– –
– –
– –
– –
Tota
l com
preh
ensi
ve in
com
e –
– 3,
012,
973,
097
– –
3,01
2,97
3,09
7 –
3,01
2,97
3,09
7 C
ash
divi
dend
s (N
ote
23)
– –
(461
,091
,993
) –
– (4
61,0
91,9
93)
– (4
61,0
91,9
93)
Bal
ance
s as
of D
ecem
ber 3
1, 2
010
P=8,5
38,7
40,6
14
P=19
,328
,509
,860
P=
10,3
09,2
98,6
85
P=–
P=–
P=38
,176
,549
,159
P=
– P=
38,1
76,5
49,1
59
Bal
ance
s as
of J
anua
ry 1
, 200
9 P=8
,538
,740
,614
P=
19,3
05,2
75,6
68
P=5,7
39,7
87,8
52
(P=61
6,88
5,47
6)
P=47
2,61
9 P=
32,9
67,3
91,2
77
P=49
,197
,027
P=
33,0
16,5
88,3
04
Net
inco
me
− −
2,29
9,40
8,17
0 −
− 2,
299,
408,
170
− 2,
299,
408,
170
Oth
er c
ompr
ehen
sive
inco
me
− −
− −
(472
,619
) (4
72,6
19)
− (4
72,6
19)
Tota
l com
preh
ensi
ve in
com
e −
− 2,
299,
408,
170
− (4
72,6
19)
2,29
8,93
5,55
1 −
2,29
8,93
5,55
1 A
cqui
sitio
n of
trea
sury
sha
res
(Not
e 23
) −
− −
(20,
493,
492)
−
(20,
493,
492)
−
(20,
493,
492)
Is
suan
ce o
f tre
asur
y sh
ares
(N
otes
4 a
nd 2
3)
− 23
,234
,192
−
637,
378,
968
− 66
0,61
3,16
0 −
66
0,61
3,16
0 M
ovem
ent o
f min
ority
inte
rest
s −
− −
− −
− (4
9,19
7,02
7)
(49,
197,
027)
C
ash
divi
dend
s (N
ote
23)
− −
(281
,778
,441
) −
− (2
81,7
78,4
41)
− (2
81,7
78,4
41)
Bal
ance
s as
of D
ecem
ber 3
1, 2
009
P=8,5
38,7
40,6
14
P=19
,328
,509
,860
P=7
,757
,417
,581
P=−
P=−
P=35
,624
,668
,055
P=−
P=35
,624
,668
,055
See
acc
ompa
nyin
g N
otes
to C
onso
lidat
ed F
inan
cial
Sta
tem
ents
.
VIST
A L
AN
D &
LIF
ESCA
PES,
INC.
AN
D S
UBS
IDIA
RIES
CON
SOLI
DAT
ED S
TATE
MEN
TS O
F CH
AN
GES
IN E
QU
ITY

64 VISTA LAND
*SGVMC116984*
VISTA LAND & LIFESCAPES, INC. AND SUBSIDIARIES CONSOLIDATED STATEMENTS OF CASH FLOWS Years Ended December 31 2011 2010 2009 CASH FLOWS FROM OPERATING ACTIVITIES Income before income tax P=3,593,898,335 P=3,233,718,777 P=2,812,884,117 Adjustments for: Interest and other financing charges (Note 24) 1,329,209,765 730,233,810 592,982,136 Depreciation and amortization (Notes 14, 16 and 26) 101,754,628 105,038,232 95,162,392 Unrealized foreign exchange losses (gains) (Notes 21 and 22) 26,032,480 (12,987,946) 611,212 Equity in net loss (income) of an associate (Note 12) 6,172,562 (2,414,451) (45,943,472) Dividend income (151,342) (25,099) (194,340) Interest income (Note 24) (853,112,707) (777,122,025) (857,296,120) Loss on writedown of available-for-sale financial assets (Note 7) – 44,038,378 – Loss on retirement of property and equipment (Note 14) – 9,808,757 9,321,027 Loss on settlement of loans (Note 22) – 115,867,546 318,810,422 Provision for impairment losses on receivables (Note 26) – – 11,079,149 Operating income before working capital changes 4,203,803,721 3,446,155,979 2,937,416,523 Decrease (increase) in: Receivables (2,901,036,254) (2,314,303,288) 653,212,250 Real estate inventories (624,056,536) 394,793,224 (2,303,668,974) Other current assets (481,989,703) 402,668,520 (605,527,974) Increase (decrease) in: Accounts and other payables 867,804,894 (347,573,362) 1,135,585,267 Customers’ advances and deposits 91,732,696 (447,884,044) (989,636,127) Liabilities for purchased land 425,694,779 (748,590,927) (784,195,512) Pension liabilities (Note 27) (3,528,196) 28,495,666 139,474,569 Net cash flows provided by operations 1,578,425,401 413,761,768 182,660,022 Interest received 728,371,061 696,203,540 772,612,479 Dividend received 151,342 25,099 194,340 Income tax paid (348,399,743) (354,213,345) (303,150,182) Interest paid (1,389,515,290) (653,995,035) (600,961,254) Net cash flows provided by operating activities 569,032,771 101,782,027 51,355,405 CASH FLOWS FROM INVESTING ACTIVITIES Additions to land and improvements (Note 11) (1,711,144,426) (1,979,300,917) (671,360,292) Increase in long-term cash investments (Note 7) (3,180,345,000) (1,755,200,000) – Decrease (increase) of short-term cash investments (Note 7) 61,736,811 (1,517,197,748) (105,962,569) Net contribution to joint venture partners (90,603,754) (336,738,086) – Net collection from joint venture partners – – 98,004,187
(Forward)
VISTA LAND & LIFESCAPES, INC. AND SUBSIDIARIESCONSOLIDATED STATEMENTS OF CASH FLOWS

Vista LandA N N U A L R E P O R T11
VISTA LAND ANNUAL REPORT 2011 65
VISTA LAND & LIFESCAPES, INC. AND SUBSIDIARIESCONSOLIDATED STATEMENTS OF CASH FLOWS
- 2 - Years Ended December 31 2011 2010 2009 Acquisition of: Property and equipment (Note 14) (P=159,128,801) (P=103,997,159) (P=53,853,349) System development costs (Note 16) (38,425,168) (4,311,633) (24,446,840) Investment properties (13,889,125) – – Increase in other noncurrent assets (72,006,792) (32,761,001) (40,686,192) Net cash acquired with the acquisition of a subsidiary (Note 4) – – 14,838,024 Proceeds from disposal of available-for-sale financial assets – 2,097,428 10,688,999 Net cash flows used in investing activities (5,203,806,255) (5,727,409,116) (772,778,032)
CASH FLOWS FROM FINANCING ACTIVITIES Proceeds from: Bank loans 1,625,395,010 2,373,907,731 270,000,000 Loans payable 1,545,664,338 2,640,462,431 1,502,453,791 Notes payable 3,067,952,652 4,265,368,820 – Payments of: Long-term notes – (72,842,349) (1,297,948,801) Bank loans (210,013,226) (107,322,564) (42,947,793) Loans payable (1,604,498,264) (1,944,584,255) (979,425,567) Decrease in payable to related parties (202,946,843) (597,927,625) (383,133,506) Payment of dividends declared (Note 23) (893,813,755) (461,091,993) (281,778,441) Acquisition of treasury shares (Note 23) (122,207,625) – (20,493,492) Payments to noncontrolling interests (Note 23) – – (49,197,027) Net cash flows provided by (used in) financing activities 3,205,532,287 6,095,970,196 (1,282,470,836)
NET INCREASE (DECREASE) IN CASH AND CASH EQUIVALENTS (1,429,241,197) 470,343,107 (2,003,893,463)
EFFECT OF CHANGE IN EXCHANGE RATES ON CASH AND CASH EQUIVALENTS – 823,643 –
CASH AND CASH EQUIVALENTS AT BEGINNING OF YEAR 3,481,807,245 3,010,640,495 5,014,533,958
CASH AND CASH EQUIVALENTS AT END OF YEAR (Note 6) P=2,052,566,048 P=3,481,807,245 P=3,010,640,495 See accompanying Notes to Consolidated Financial Statements.

66 VISTA LAND
VISTA LAND & LIFESCAPES, INC. AND SUBSIDIARIESNOTES TO CONSOLIDATED FINANCIAL STATEMENTS
*SGVMC116984*
VISTA LAND & LIFESCAPES, INC. AND SUBSIDIARIES NOTES TO CONSOLIDATED FINANCIAL STATEMENTS 1. Corporate Information
Vista Land & Lifescapes, Inc. (the Parent Company) was incorporated in the Republic of the Philippines and registered with the Securities and Exchange Commission (SEC) on February 28, 2007. The Parent Company’s registered office address and principal place of business is at 3rd Level Starmall Las Piñas, CV Starr Avenue, Pamplona, Las Piñas City. The Parent Company is a publicly-listed investment holding company which is 58.11% owned by Fine Properties, Inc, 25.16% owned by PCD Nominee Corporation (foreign), 9.11% owned by Polar Property Holdings, Inc. and the rest by the public.
The Parent Company is the holding company of the Vista Group (the Group) which is engaged in the development of residential subdivisions and construction of housing and condominium units. The Group offers a range of products from socialized and affordable housing to middle income and high-end subdivision house and lots and condominium projects.
The consolidated financial statements of the Group as of December 31, 2011 and 2010 and for the years ended December 31, 2011 and 2010 were authorized for issue by the Board of Directors (BOD) on March 28, 2012.
2. Basis of Preparation and Summary of Significant Accounting Policies
Basis of Preparation The accompanying consolidated financial statements of the Group have been prepared on a historical cost basis. The consolidated financial statements are presented in Philippine Peso (P=) which is the functional and presentation currency of the Parent Company, and all amounts are rounded to the nearest Philippine Peso unless otherwise indicated.
Statement of Compliance The consolidated financial statements of the Group have been prepared in compliance with Philippine Financial Reporting Standards (PFRS).
Basis of Consolidation The consolidated financial statements comprise the financial statements of the Group as of December 31, 2011 and 2010 and for each of the three years in the period ended December 31, 2011.
Subsidiaries are fully consolidated from the date of acquisition, being the date on which the Group obtains control, and continue to be consolidated until the date when such control ceases. The financial statements of the subsidiaries are prepared for the same reporting period as the Parent Company, using consistent accounting policies. All intra-group balances, transactions, unrealized gains and losses resulting from intra-group transactions and dividends are eliminated in full.
Non-controlling interests represent the portion of profit or loss and net assets in subsidiaries not wholly-owned and are presented separately in the consolidated statements of comprehensive income, consolidated statements of changes in equity and

Vista LandA N N U A L R E P O R T11
VISTA LAND ANNUAL REPORT 2011 67
3
consolidated statements of financial position, separately from the Parent Company’s equity.
Losses within a subsidiary are attributed to the non-controlling interests even if that results in a deficit balance.
A change in the ownership interest of a subsidiary, without a loss of control, is accounted for as an equity transaction. If the Group loses control over a subsidiary, it:
Derecognizes the assets (including goodwill) and liabilities of the subsidiary Derecognizes the carrying amount of any non-controlling interest Derecognizes the cumulative translation differences recorded in equity Recognizes the fair value of the consideration received Recognizes the fair value of any investment retained Recognizes any surplus or deficit in profit or loss Reclassifies the parent’s share of components previously recognized in other
comprehensive income to profit or loss or retained earnings, as appropriate.
The consolidated financial statements comprise the financial statements of the Parent Company and the following subsidiaries:
Percentage of Ownership 2011 2010 Brittany Corporation (Brittany) 100.00% 100.00% Crown Asia Properties, Inc. (CAPI) 100.00 100.00 Vista Residences, Inc. (VRI) 100.00 100.00 Camella Homes, Inc. (CHI) 100.00 100.00 Household Development Corp. 100.00 100.00 Mandalay Resources Corp. 100.00 100.00 C&P International Limited 100.00 100.00 Communities Philippines, Inc. (CPI) 100.00 100.00 Communities Batangas, Inc. 100.00 100.00 Communities Bulacan, Inc. 100.00 100.00 Communities Cagayan, Inc. 100.00 100.00 Communities Cebu, Inc. 100.00 100.00 Communities Davao, Inc. 100.00 100.00 Communities General Santos, Inc. 100.00 100.00 Communities Iloilo, Inc. 100.00 100.00 Communities Isabela, Inc. 100.00 100.00 Communities Leyte, Inc. 100.00 100.00 Communities Naga, Inc. 100.00 100.00 Communities Negros Occidental, Inc. 100.00 100.00 Communities Pampanga, Inc. 100.00 100.00 Communities Pangasinan, Inc. 100.00 100.00 Communities Tarlac, Inc. 100.00 100.00 Communities Zamboanga, Inc. 100.00 100.00 Communities Ilocos, Inc. 100.00 100.00 Communities Bohol, Inc. * 100.00 – Communities Quezon, Inc. * 100.00 – Communities Palawan, Inc. * 100.00 –
*incorporated in 2011

68 VISTA LAND
- 3 -
Adoption of New and Amended Accounting Standards and Philippine Interpretations The accounting policies adopted in the preparation of the Group’s consolidated financial statements are consistent with those of the previous financial years except for the adoption of the following new and amended PFRS and Philippine Interpretations which became effective beginning January 1, 2011. Except as otherwise stated, the adoption of these new and amended Standards and Philippine Interpretations did not have any impact on the consolidated financial statements.
Philippine Accounting Standard (PAS) 24 (Amendment), Related Party Disclosures PAS 24 clarifies the definitions of a related party. The new definitions emphasize a symmetrical view of related party relationships and clarify the circumstances in which persons and key management personnel affect related party relationships of an entity. In addition, the amendment introduces an exemption from the general related party disclosure requirements for transactions with government and entities that are controlled, jointly controlled or significantly influenced by the same government as the reporting entity.
PAS 32 (Amendment), Financial Instruments: Presentation - Classification of Rights Issues The amendment alters the definition of a financial liability in PAS 32 to enable entities to classify rights issues and certain options or warrants as equity instruments. The Amendment is applicable if the rights are given pro rata to all of the existing owners of the same class of an entity’s non-derivative equity instruments, to acquire a fixed number of the entity’s own equity instruments for a fixed amount in any currency.
Philippine Interpretation IFRIC 14 (Amendment), Prepayments of a Minimum Funding Requirement The amendment removes an unintended consequence when an entity is subject to minimum funding requirements and makes an early payment of contributions to cover such requirements. The amendment permits a prepayment of future service cost by the entity to be recognized as a pension asset.
Philippine Interpretation IFRIC 19, Extinguishing Financial Liabilities with Equity Instruments The Philippine Interpretation clarifies that equity instruments issued to a creditor to extinguish a financial liability qualify as consideration paid. The equity instruments issued are measured at their fair value. In case that this cannot be reliably measured, the instruments are measured at the fair value of the liability extinguished. Any gain or loss is recognized immediately in profit or loss.
Improvements to PFRS (issued 2010) The omnibus amendments to PFRSs issued in May 2010 were issued primarily with a view to removing inconsistencies and clarifying wordings. The amendments are effective for annual periods beginning January 1, 2011, except as otherwise stated. The adoption of the following amendments resulted in changes to accounting policies but did not have impact on the financial position or performance of the Group.
PFRS 3, Business Combinations
This amendment clarifies that the amendments to PFRS 7, Financial Instruments: Disclosures, PAS 32 and PAS 39 that eliminate the exemption for contingent consideration, do not apply to contingent consideration that arose from business combinations whose acquisition dates precede the application of PFRS 3 (as revised in 2008).
VISTA LAND & LIFESCAPES, INC. AND SUBSIDIARIESNOTES TO CONSOLIDATED FINANCIAL STATEMENTS

Vista LandA N N U A L R E P O R T11
VISTA LAND ANNUAL REPORT 2011 69
- 4 -
It also limits the scope of the measurement choices that only the components of non-controlling interest that are present ownership interests that entitle their holders to a proportionate share of the entity’s net assets, in the event of liquidation, shall be measured either at fair value or at the present ownership instruments’ proportionate share of the acquiree’s identifiable net assets. Other components of non-controlling interest are measured at their acquisition date fair value, unless another measurement basis is required by another PFRS.
The amendment also requires an entity (in a business combination) to account for the replacement of the acquiree’s share-based payment transactions (whether obliged or voluntarily), i.e., split between consideration and post-combination expenses. However, if the entity replaces the acquiree’s awards that expire as a consequence of the business combination, these are recognized as post-combination expenses. It further specifies the accounting for share-based payment transactions that the acquirer does not exchange for its own awards: if vested - they are part of non-controlling interest and measured at their market- based measure; if unvested - they are measured at market-based value as if granted at acquisition date, and allocated between non-controlling interest and post-combination expense.
PFRS 7, Financial Instruments: Disclosures
This amendment emphasizes the interaction between quantitative and qualitative disclosures and the nature and extent of risks associated with financial instruments. The amendments to quantitative and credit risk disclosures are as follows: a. Clarify that only financial asset whose carrying amounts do not reflect the
maximum exposure to credit risk need to provide further disclosure of the amount that represents the maximum exposure to such risk.
b. Requires, for all financial assets, to disclose the financial effect of collateral held as security and other credit enhancements regarding the amount that best represents the maximum exposure to credit risk (e.g., a description of the extent to which collateral mitigates credit risk).
c. Remove the disclosure of the collateral held as security, other credit enhancements and an estimate of their fair value for financial assets that are past due but not impaired, and financial assets that are individually determined to be impaired.
d. Remove the requirement to specifically disclose financial assets renegotiated to avoid becoming past due or impaired.
e. Clarify that the additional disclosure required for financial assets obtained by taking possession of collateral or other credit enhancements are only applicable to assets still held at the reporting date.
PAS 1, Presentation of Financial Statements
This amendment clarifies that an entity will present an analysis of other comprehensive income for each component of equity, either in the statement of changes in equity or in the notes to the financial statements.
PAS 27, Consolidated and Separate Financial Statements
This amendment clarifies that the consequential amendments from PAS 27 made to PAS 21, The Effect of Changes in Foreign Exchange Rates, PAS 28, Investments in Associates and PAS 31, Interests in Joint Ventures apply prospectively for annual periods beginning on or after July 1, 2009 or earlier when PAS 27 is applied earlier.

70 VISTA LAND
- 5 -
PAS 34, Interim Financial Reporting
This amendment provides guidance to illustrate how to apply disclosure principles in PAS 34 and add disclosure requirements around: a) The circumstances likely to affect fair values of financial instruments and their
classification; b) Transfers of financial instruments between different levels of the fair value
hierarchy; c) Changes in classification of financial assets; and d) Changes in contingent liabilities and assets.
Philippine Interpretation IFRIC 13, Customer Loyalty Programmes
This Philippine Interpretation clarifies that when the fair value of award credits is measured based on the value of the awards for which they could be redeemed, the amount of discounts or incentives otherwise granted to customers not participating in the award credit scheme, is to be taken into account.
Future Changes in Accounting Policies The Group will adopt the following new and amended Standards and Philippine Interpretations enumerated below when these become effective. Except as otherwise indicated, the Group does not expect the adoption of these new and amended PFRS and Philippine Interpretations to have significant impact on the consolidated financial statements.
Philippine Interpretation IFRIC 15, Agreements for the Construction of Real Estate This Philippine Interpretation covers accounting for revenue and associated expenses by entities that undertake the construction of real estate directly or through subcontractors. The Philippine Interpretation requires that revenue on construction of real estate be recognized only upon completion, except when such contract qualifies as construction contract to be accounted for under PAS 11, Construction Contracts, or involves rendering of services in which case revenue is recognized based on stage of completion. Contracts involving provision of services with the construction materials and where the risks and reward of ownership are transferred to the buyer on a continuous basis will also be accounted for based on stage of completion. The SEC and the Financial Reporting Standards Council (FRSC) have deferred the effectivity of this interpretation until the final Revenue standard is issued by International Accounting Standards Board (IASB) and an evaluation of the requirements of the final Revenue standard against the practices of the Philippine real estate industry is completed.
The adoption of this Philippine Interpretation may significantly affect the determination of the revenue from real estate sales and the corresponding costs, and the related trade receivables, deferred tax liabilities and retained earnings accounts. The Group is in the process of quantifying the adoption of this Philippine Interpretation.
Effective 2012 PAS 12, Income Taxes (Amendment) - Deferred Tax: Recovery of Underlying Assets The amendment clarified the determination of deferred tax on investment property measured at fair value. The amendment introduces a rebuttable presumption that deferred tax on investment property measured using the fair value model in PAS 40, Investment Properties, should be determined on the basis that its carrying amount will be recovered through sale. Furthermore, it introduces the requirement that deferred tax on non-depreciable assets that are measured using the revaluation model in PAS 16 always be measured on a sale basis of the asset.
VISTA LAND & LIFESCAPES, INC. AND SUBSIDIARIESNOTES TO CONSOLIDATED FINANCIAL STATEMENTS
Vista LandA N N U A L R E P O R T11
VISTA LAND ANNUAL REPORT 2011 71
- 6 -
PFRS 7, Financial Instruments: Disclosures - Enhanced Derecognition Disclosure Requirements The amendment requires additional disclosure about financial assets that have been transferred but not derecognized to enable the user of the consolidated financial statements to understand the relationship with those assets that have not been derecognized and their associated liabilities. In addition, the amendment requires disclosures about continuing involvement in derecognized assets to enable the user to evaluate the nature of, and risks associated with, the entity’s continuing involvement in those derecognized assets.
Effective 2013 PAS 1, Financial Statement Presentation - Presentation of Items of Other Comprehensive Income The amendments to PAS 1 change the grouping of items presented in other comprehensive income (OCI). Items that could be reclassified (or “recycled”) to profit or loss at a future point in time (for example, upon derecognition or settlement) would be presented separately from items that will never be reclassified. The amendment affects presentation only and has therefore no impact on the Group’s financial position or performance.
PAS 19, Employee Benefits (Amendment) Amendments to PAS 19 range from fundamental changes such as removing the corridor mechanism and the concept of expected returns on plan assets to simple clarifications and re- wording. The Group is currently assessing the impact of the amendment to PAS 19.
PFRS 7, Financial instruments: Disclosures - Offsetting Financial Assets and Financial Liabilities These amendments require an entity to disclose information about rights of set-off and related arrangements (such as collateral agreements). The new disclosures are required for all recognized financial instruments that are set off in accordance with PAS 32. These disclosures also apply to recognized financial instruments that are subject to an enforceable master netting arrangement or‘similar agreement’, irrespective of whether they are set-off in accordance with PAS 32. The amendments require entities to disclose, in a tabular format unless another format is more appropriate, the following minimum quantitative information. This is presented separately for financial assets and financial liabilities recognized at the end of the reporting period:
a) The gross amounts of those recognized financial assets and recognized financial liabilities; b) The amounts that are set off in accordance with the criteria in PAS 32 when
determining the net amounts presented in the statement of financial position; c) The net amounts presented in the statement of financial position; d) The amounts subject to an enforceable master netting arrangement or similar
agreement that are not otherwise included in (b) above, including: i. Amounts related to recognized financial instruments that do not meet some or all
of the offsetting criteria in PAS 32; and ii. Amounts related to financial collateral (including cash collateral); and
e) The net amount after deducting the amounts in (c) from the amounts in (d) above.

72 VISTA LAND
- 7 -
PFRS 10, Consolidated Financial Statements PFRS 10 replaces the portion of PAS 27, Consolidated and Separate Financial Statements, which addresses the accounting for consolidated financial statements. It also includes the issues raised in SIC-12, Consolidation - Special Purpose Entities. PFRS 10 establishes a single control model that applies to all entities including special purpose entities. The changes introduced by PFRS 10 will require management to exercise significant judgment to determine which entities are controlled, and therefore, are required to be consolidated by a parent, compared with the requirements that were in PAS 27.
PFRS 11, Joint Arrangements PFRS 11 replaces PAS 31, Interests in Joint Ventures and SIC-13, Jointly-controlled Entities - Non-monetary Contributions by Venturers. This Standard eliminates proportionate consolidation of jointly controlled entities, instead, jointly controlled entities, if classified as joint ventures (a newly defined term), must be accounted for using the equity method. Additionally, jointly controlled assets and operations are joint operations under PFRS 11, and the accounting for those arrangements will generally be consistent with today’s accounting. That is, the entity will continue to recognize its relative share of assets, liabilities, revenues and expenses.
PFRS 12, Disclosures of Interests with Other Entities This standard includes all of the disclosures that were previously in PAS 27 related to consolidated financial statements, as well as all of the disclosures that were previously included in PAS 31 and PAS 28. These disclosures relate to an entity’s interests in subsidiaries, joint arrangements, associates and structured entities. A number of new disclosures are also required.
PFRS 13, Fair Value Measurement This standard does not change when an entity is required to use fair value but, rather, provides guidance on how to measure fair value under PFRS when fair value is required or permitted by PFRS. This standard was intended to reduce complexity, improve consistency in application when measuring fair value and enhance disclosures. PFRS 13 is effective for annual periods beginning on or after January 1, 2013 and should be applied prospectively.
Revised PAS 27, Separate Financial Statements This standard has been revised as a result of issuance of PFRS 10, 11, and 12. The revised standard provides the accounting and disclosure requirements for investment in subsidiaries, joint ventures and associates when an entity prepares separate financial statements and requires an entity preparing separate financial statements to account for those investments at cost or in accordance with PFRS 9. This Standard is issued concurrently with PFRS 10 and together, the two PFRSs will supersede PAS 27 (as amended in 2008). Revised PAS 27 is effective for annual periods beginning on or after January 1, 2013. Earlier application is permitted provided that PFRS 10, 11, 12 and PAS 28 (as amended in 2011) are applied simultaneously and with additional disclosure of the fact.
Revised PAS 28, Investment in Associates and Joint Ventures This standard has been revised as a result of issuance of PFRS 10, 11, and 12. The revised standard prescribes the accounting for investments in associates and joint ventures. Equity method is defined in the revised standard as a method of accounting whereby the investment is initially recognized at cost and adjusted thereafter for the post-
VISTA LAND & LIFESCAPES, INC. AND SUBSIDIARIESNOTES TO CONSOLIDATED FINANCIAL STATEMENTS

Vista LandA N N U A L R E P O R T11
VISTA LAND ANNUAL REPORT 2011 73
- 8 -
acquisition change in the investor’s share of net assets of the investee. The profit or loss of the investor includes its share of the profit or loss of the investee and the other comprehensive income of the investor includes its share of other comprehensive income of the investee. The revised standard is to be applied by all entities that are investors with joint control of, or significant influence or owns 20% to 50% interest over, an investee. This standard supersedes PAS 28 (as revised in 2003). Revised PAS 28 is effective for annual periods beginning on or after January 1, 2013. Earlier application is permitted provided that PFRS 10, 11, 12 and PAS 27 (as amended in 2011) are applied simultaneously and with additional disclosure of the fact.
Effective 2014 PAS 32, Financial Instruments: Presentation - Offsetting Financial Assets and Financial Liabilities These amendments to PAS 32 clarify the meaning of “currently has a legally enforceable right to set-off” and also clarify the application of the PAS 32 offsetting criteria to settlement systems (such as central clearing house systems) which apply gross settlement mechanisms that are not simultaneous. While the amendment is expected not to have any impact on the net assets of the Group, any changes in offsetting is expected to impact leverage ratios and regulatory capital requirements.
Effective 2015 PFRS 9, Financial Instruments: Classification and Measurement PFRS 9 as issued reflects the first phase on the replacement of PAS 39 and applies to classification and measurement of financial assets and financial liabilities as defined in PAS 39. In subsequent phases, hedge accounting, impairment and derecognition of financial assets will be addressed with the completion of this project expected on the first half of 2012. The adoption of the first phase of PFRS 9 will have an effect on the classification and measurement of the Group’s financial assets, but will potentially have no impact on classification and measurements of financial liabilities. The Group will quantify the effect in conjunction with the other phases, when issued, to present a comprehensive picture.
The Group has decided not to early adopt either PFRS 9 (2009) or PFRS 9 (2010) for its 2011 annual financial reporting. The Group shall conduct in early 2012 another impact evaluation using outstanding balances of financial statements as of December 31, 2011. The Group’s decision whether to early adopt either PFRS 9 (2009) of PFRS 9 (2010) for its 2012 financial reporting shall be disclosed in its interim financial statements as of March 31, 2012.
Cash and Cash Equivalents Cash includes cash on hand and in banks. Cash equivalents are short-term, highly liquid investments that are readily convertible to known amounts of cash with original maturities of three months or less from dates of placement and that are subject to an insignificant risk of changes in value.
Short-term and Long-term Cash Investments
Short-term cash investments consist of money market placements made for varying periods of more than three (3) months and up to nine (9) months while long-term cash investments consist of money market placements made for varying periods of more than one (1) year. These investments earn interest at the respective short-term and long-term investment rates.

74 VISTA LAND
- 9 -
Financial Instruments Date of recognition The Group recognizes a financial asset or a financial liability in the consolidated statement of financial position when it becomes a party to the contractual provisions of the instrument. Purchases or sales of financial assets that require delivery of assets within the time frame established by regulation or convention in the marketplace are recognized on the trade date, which is the date when the Group commits to purchase or sell the asset.
Initial recognition of financial instruments All financial assets and financial liabilities are initially recognized at fair value. Except for financial assets and liabilities at fair value through profit or loss (FVPL), the initial measurement of financial assets and liabilities include transaction costs. The Group classifies its financial assets in the following categories: financial assets at FVPL, held-to-maturity (HTM) financial assets, AFS financial assets, and loans and receivables. The Group classifies its financial liabilities as financial liabilities at FVPL or other financial liabilities. The classification depends on the purpose for which the investments were acquired and whether these are quoted in an active market. The financial assets of the Group are of the nature of loans and receivable and AFS financial assets, while its financial liabilities are of the nature of other financial liabilities. Management determines the classification at initial recognition and re-evaluates such designation, where allowed and appropriate, at every reporting date.
Financial instruments are classified as liability or equity in accordance with the substance of the contractual arrangement. Interest, dividends, gains and losses relating to a financial instrument or a component that is a financial liability, are reported as expense or income. Distributions to holders of financial instruments classified as equity are charged directly to equity, net of any related income tax benefits.
Determination of fair value The fair value for financial instruments traded in active markets at the reporting date is based on its quoted market price or dealer price quotations (bid price for long positions and ask price for short positions), without any deduction for transaction costs. When current bid and ask prices are not available, the price of the most recent transaction provides evidence of the current fair value as long as there has not been a significant change in economic circumstances since the time of the transaction.
For all other financial instruments not listed in an active market, the fair value is determined by using appropriate valuation techniques. Valuation techniques include net present value techniques, comparison to similar instruments for which market observable prices exist, option pricing models, and other relevant valuation models.
“Day 1”difference Where the transaction price in a non-active market is different from the fair value from other observable current market transactions in the same instrument or based on a valuation technique whose variables include only data from observable market, the Group recognizes the difference between the transaction price and fair value (a “Day 1” difference) in profit or loss under “Interest income” and “Interest and other financing charges” accounts unless it qualifies for recognition as some other type of asset or liability. In cases where fair value is determined using data which is not observable, the difference between the transaction price and model value is only recognized in profit or
VISTA LAND & LIFESCAPES, INC. AND SUBSIDIARIESNOTES TO CONSOLIDATED FINANCIAL STATEMENTS

Vista LandA N N U A L R E P O R T11
VISTA LAND ANNUAL REPORT 2011 75
- 10 -
loss when the inputs become observable or when the instrument is derecognized. For each transaction, the Group determines the appropriate method of recognizing the ‘Day 1’ profit amount.
Loans and receivables Loans and receivables are nonderivative financial assets with fixed or determinable payments that are not quoted in an active market. They are not entered into with the intention of immediate or short-term resale and are not classified as financial assets held-for-trading, designated as AFS or as financial assets at FVPL. Receivables are recognized initially at fair value, which normally pertains to the billable amount. After initial measurement, loans and receivables are subsequently measured at amortized cost using the effective interest rate method, less allowance for impairment losses. Amortized cost is calculated by taking into account any discount or premium on acquisition and fees that are an integral part of the effective interest rate. The amortization, if any, is included in profit or loss. The losses arising from impairment of receivables are recognized in profit or loss. These financial assets are included in current assets if maturity is within 12 months from the reporting date. Otherwise, these are classified as noncurrent assets.
This accounting policy applies primarily to the Group’s cash and cash equivalents, short-term investments, long-term cash investments and receivables except for receivable from contractors and receivable from brokers.
AFS financial assets AFS financial assets are nonderivative financial assets that are designated as such or do not qualify to be classified or designated as financial assets at FVPL, HTM investments or loans and receivables. These are purchased and held indefinitely, and may be sold in response to liquidity requirements or changes in market conditions.
After initial measurement, AFS financial assets are measured at fair value. The unrealized gains and losses arising from the fair valuation of AFS financial assets are excluded from reported earnings and are reported in OCI.
When the investment is disposed of, the cumulative gain or loss previously recognized in OCI is recognized as miscellaneous income in profit or loss. Where the Group holds more than one investment in the same security these are deemed to be disposed of on a first-in first-out basis. Interest earned on holding AFS financial assets are reported as interest income using the effective interest rate. Dividends earned on holding AFS financial assets are recognized in profit or loss as part of miscellaneous income when the right to receive payment has been established. The losses arising from impairment of such investments are recognized as provisions for impairment losses in profit or loss.
When the fair value of AFS equity financial assets cannot be measured reliably because of lack of reliable estimates of future cash flows and discount rates necessary to calculate the fair value of unquoted equity instruments, these investments are carried at cost, less any impairment losses.
As of December 31, 2011 and 2010, AFS financial assets comprise of unquoted equity securities.
Other financial liabilities Other financial liabilities are initially recognized at the fair value of the consideration received less directly attributable transaction costs.

76 VISTA LAND
- 11 -
After initial recognition, other financial liabilities are subsequently measured at amortized cost using the effective interest method. Amortized cost is calculated by taking into account any discount or premium on the issue and fees that are an integral part of the effective interest rate. Gains and losses are recognized in profit or loss when the liabilities are derecognized, as well as through the amortization process. Any effects of restatement of foreign currency-denominated liabilities are recognized in profit or loss.
This accounting policy applies primarily to the Group’s bank loans, loans payable, accounts and other payables, liabilities for purchased land, payable to related parties, long-term notes, notes payable and other liabilities that meet the above definition (other than liabilities covered by other accounting standards, such as pension liability, income tax payable and deferred tax liabilities).
Derecognition of Financial Assets and Financial Liabilities Financial asset A financial asset (or, where applicable, a part of a group of financial assets) is derecognized where: (a) the rights to receive cash flows from the assets have expired; (b) the Group retains the right to receive cash flows from the asset, but has assumed an obligation to pay them in full without material delay to a third-party under a “pass-through” arrangement; or (c) the Group has transferred its right to receive cash flows from the asset and either: (i) has transferred substantially all the risks and rewards of the asset, or (ii) has neither transferred nor retained the risks and rewards of the asset but has transferred control of the asset.
Where the Group has transferred its rights to receive cash flows from an asset or has entered into a pass-through arrangement, and has neither transferred nor retained substantially all the risks and rewards of the asset nor transferred control of the asset, the asset is recognized to the extent of the Group’s continuing involvement in the asset. Continuing involvement that takes the form of a guarantee over the transferred asset is measured at the lower of the original carrying amount of the asset and the maximum amount of consideration that the Group could be required to repay.
Financial liability A financial liability is derecognized when the obligation under the liability is discharged or cancelled or has expired. Where an existing financial liability is replaced by another from the same lender on substantially different terms, or the terms of an existing liability are substantially modified, such an exchange or modification is treated as a derecognition of the original liability and the recognition of a new liability, and the difference in the respective carrying amounts is recognized in profit or loss.
Impairment of Financial Assets The Group assesses at each reporting date whether there is objective evidence that a financial asset or group of financial assets is impaired. A financial asset or a group of financial assets is deemed to be impaired if, and only if, there is objective evidence of impairment as a result of one or more events that has occurred after the initial recognition of the asset (an incurred ‘loss event’) and that loss event (or events) has an impact on the estimated future cash flows of the financial asset or the group of financial assets that can be reliably estimated. Evidence of impairment may include indications that the borrower or a group of borrowers is experiencing significant financial difficulty, default or delinquency in interest or principal payments, and where observable data indicate that there is measurable decrease in the estimated future cash flows, such as changes in arrears or economic conditions that correlate with defaults.
VISTA LAND & LIFESCAPES, INC. AND SUBSIDIARIESNOTES TO CONSOLIDATED FINANCIAL STATEMENTS

Vista LandA N N U A L R E P O R T11
VISTA LAND ANNUAL REPORT 2011 77
- 12 -
Loans and receivables For loans and receivables carried at amortized cost, the Group first assesses whether an objective evidence of impairment exists individually for financial assets that are individually significant. If there is objective evidence that an impairment loss has been incurred, the amount of the loss is measured as the difference between the assets’ carrying amount and the present value of the estimated future cash flows (excluding future credit losses that have not been incurred). If it is determined that no objective evidence of impairment exists for an individually assessed financial asset, the asset, together with the other assets that are not individually significant and were thus not individually assessed for impairment, is included in a group of financial assets with similar credit risk characteristics and that group of financial assets is collectively assessed for impairment. Assets that are individually assessed for impairment and for which an impairment loss is or continues to be recognized are not included in a collective assessment of impairment.
For the purpose of a collective evaluation of impairment, financial assets are grouped on the basis of credit risk characteristics such as selling price of the lots and residential houses, past-due status and term.
Future cash flows in a group of financial assets that are collectively evaluated for impairment are estimated on the basis of historical loss experience for assets with credit risk characteristics similar to those in the group. Historical loss experience is adjusted on the basis of current observable data to reflect the effects of current conditions that did not affect the period on which the historical loss experience is based and to remove the effects of conditions in the historical period that do not exist currently. The methodology and assumptions used for estimating future cash flows are reviewed regularly by the Group to reduce any differences between loss estimates and actual loss experience.
The carrying amount of the asset is reduced through the use of an allowance account and the amount of loss is charged to profit or loss. Loans, together with the associated allowance accounts, are written off when there is no realistic prospect of future recovery and all collateral has been realized. If, in a subsequent year, the amount of the estimated impairment loss decreases because of an event occurring after the impairment was recognized, the previously recognized impairment loss is reversed. Any subsequent reversal of an impairment loss is recognized in profit or loss, to the extent that the carrying value of the asset does not exceed its amortized cost at the reversal date.
AFS financial assets carried at fair value In case of equity investments classified as AFS financial assets, impairment indicators would include a significant or prolonged decline in the fair value of the investments below their corresponding cost. Where there is evidence of impairment, the cumulative loss - measured as the difference between the acquisition cost and the current fair value, less any impairment loss on that financial asset previously recognized in OCI is removed from OCI and recognized in profit or loss. Impairment losses on equity investments are not reversed through profit and loss. Increases in fair value after impairment are recognized directly in OCI.

78 VISTA LAND
- 13 -
AFS financial assets carried at cost If there is an objective evidence that an impairment loss on an unquoted equity instrument that is not carried at fair value because its fair value cannot be reliably measured, the amount of the loss is measured as the difference between the carrying amount and the present value of estimated future cash flows discounted at the current market rate of return for a similar financial asset.
Offsetting Financial Instruments Financial assets and financial liabilities are offset and the net amount reported in the consolidated statement of financial position if, and only if, there is a currently enforceable legal right to offset the recognized amounts and there is an intention to settle on a net basis, or to realize the asset and settle the liability simultaneously.
Real Estate Inventories Real estate inventories consist of subdivision land, residential houses and lots and condominium units for sale and development. These are properties acquired or being constructed for sale in the ordinary course of business rather than to be held for rental or capital appreciation. These are held as inventory and are measured at the lower of cost and net realizable value (NRV).
Cost includes: Acquisition cost of subdivision land Amounts paid to contractors for construction and development of subdivision land
and residential and condominium units Capitalized borrowing costs, planning and design costs, cost of site preparation,
professional fees for legal services, property transfer taxes, construction overheads and other related costs.
Nonrefundable commissions paid to sales or marketing agents on the sale of real estate units are expensed when paid.
NRV is the estimated selling price in the ordinary course of the business, based on market prices at the reporting date, less costs to complete and the estimated costs of sale.
The cost of inventory recognized in profit or loss on disposal is determined with reference to the specific costs incurred on the property sold and an allocation of any non-specific costs based on the relative size of the property sold.
Land and Improvements
Land and improvements consists of properties for future developments and are carried at the lower of cost or NRV. NRV is the estimated selling price in the ordinary course of business, less cost to complete and costs of sale. Costs include cost incurred for development and improvements of the properties. Upon start of development, the related cost of the land is transferred to real estate inventories.
Prepaid Expenses Prepaid expenses are carried at cost less the amortized portion. These typically comprise prepayments for marketing fees, taxes and licenses, rentals and insurance.
VISTA LAND & LIFESCAPES, INC. AND SUBSIDIARIESNOTES TO CONSOLIDATED FINANCIAL STATEMENTS

Vista LandA N N U A L R E P O R T11
VISTA LAND ANNUAL REPORT 2011 79
- 14 -
Creditable Withholding Tax This pertains to the tax withheld at source by the Group’s customer and is creditable against the income tax liability of the Group.
Construction materials Construction materials are valued at the lower of cost or NRV. Cost is determined using the moving average method. NRV is the replacement cost.
Value-Added Tax (VAT)
The input value-added tax pertains to the 12% indirect tax paid by the Group in the course of the Group’s trade or business on local purchase of goods or services.
Output VAT pertains to the 12% tax due on the local sale of goods or services by the
Group.
If at the end of any taxable month, the output VAT exceeds the input VAT, the outstanding balance is included under “Accounts and other payables” account. If the input VAT exceeds the output VAT, the excess shall be carried over to the succeeding months and included under “Other current asset” account.
Investment in an Associate The investment in an associate is accounted for under the equity method of accounting. An associate is an entity in which the Group has significant influence and which is neither a subsidiary nor a joint venture.
An investment in an associate is accounted for using the equity method from the day it becomes an associate. On acquisition of investment, the excess of the cost of investment over the investor’s share in the net fair value of the investee’s identifiable assets, liabilities and contingent liabilities is included in the carrying amount of the investment and not amortized. Any excess of the investor’s share of the net fair value of the associate’s identifiable assets, liabilities and contingent liabilities over the cost of the investment is excluded from the carrying amount of the investment, and is instead included as income in the determination of the share in the earnings of the investees.
Under the equity method, the investment in an associate is carried in the consolidated statement of financial position at cost plus post-acquisition changes in the Group’s share in the net assets of the associate, less any impairment in values. The profit or loss reflects the share of the results of the operations of the investee companies reflected as “Equity in net income (loss) of an associate”. The Group’s share of post-acquisition movements in the investee’s equity reserves is recognized directly in equity. Profits and losses resulting from transactions between the Group and the investee company are eliminated to the extent of the interest in the investee company and for unrealized losses to the extent that there is no evidence of impairment of the asset transferred. Dividends received are treated as a reduction of the carrying value of the investment.
The reporting date of the investee company and the Group is identical and its accounting policies conform to those used by the Group for like transactions and events in similar circumstances.

80 VISTA LAND
- 15 -
Beginning January 1, 2010, upon loss of significant influence over the associate, the Group measures and recognizes any retaining investment at its fair value. Any difference between the carrying amount of the associate upon loss of significant influence and the fair value of the retained investment and proceeds from disposal is recognized in profit or loss.
The Group has a reciprocal holding in Polar Property Holdings, Inc. (PPHI). The Group takes up its share on its associate’s profit excluding the equity income arising on the reciprocal holding. An adjustment is also made to reduce the Group’s equity balance and its investment in an associate by its effective percentage of ownership on its own shares.
Investment Properties Investment properties comprise completed property and property under construction or re-development that are held to earn rentals, and are not occupied by the companies in the Group. Investment properties, except for land, are carried at cost less accumulated depreciation and amortization and any impairment in value. Land is carried at cost less any impairment in value.
Expenditures incurred after the investment property has been put in operation, such as repairs and maintenance costs, are normally charged against income in the period in which the costs are incurred.
Construction-in-progress are carried at cost and transferred to the related investment property account when the construction and related activities to prepare the property for its intended use are complete, and the property is ready for occupation.
Depreciation and amortization are computed using the straight-line method over the estimated useful lives of the assets, regardless of utilization. The estimated useful lives and the depreciation and amortization method are reviewed periodically to ensure that the period and method of depreciation and amortization are consistent with the expected pattern of economic benefits from items of investment properties.
The estimated useful lives of buildings is 20 years.
Investment properties are derecognized when either they have been disposed of or when the investment property is permanently withdrawn from use and no future economic benefit is expected from its disposal. Any gain or loss on the retirement or disposal of an investment property is recognized in profit or loss in the year of retirement or disposal.
Transfers are made to investment property when there is a change in use, evidenced by ending of owner-occupation, commencement of an operating lease to another party or ending of construction or development. Transfers are made from investment property when, and only when, there is a change in use, evidenced by commencement of owner-occupation or commencement of development with a view to sale. Transfers between investment property, owner-occupied property and inventories do not change the carrying amount of the property transferred and they do not change the cost of the property for measurement or for disclosure purposes.
VISTA LAND & LIFESCAPES, INC. AND SUBSIDIARIESNOTES TO CONSOLIDATED FINANCIAL STATEMENTS

Vista LandA N N U A L R E P O R T11
VISTA LAND ANNUAL REPORT 2011 81
- 16 -
Property and Equipment Property and equipment are carried at cost less accumulated depreciation and amortization and any impairment in value.
The initial cost of property and equipment consists of its purchase price, including import duties, taxes and any directly attributable costs of bringing the asset to its working condition and location for its intended use. Expenditures incurred after the property and equipment have been put into operation, such as repairs and maintenance are normally charged against operations in the period in which the costs are incurred. All other repair and maintenance costs are recognized in profit or loss as incurred.
Depreciation and amortization of property and equipment commences once the property and equipment are available for use and computed using the straight-line basis over the estimated useful life of property and equipment as follows:
Years Building and building improvements 20 Transportation equipment 2 to 5 Office furniture, fixtures and equipment 2 to 5 Construction equipment 2 to 5 Other fixed assets 1 to 5
Building improvements are amortized on a straight-line basis over the term of the lease or the estimated useful life of the asset, whichever is shorter.
The useful lives and depreciation and amortization method are reviewed annually to ensure that the period and method of depreciation and amortization are consistent with the expected pattern of economic benefits from items of property and equipment.
When property and equipment are retired or otherwise disposed of, the cost of the related accumulated depreciation and amortization and accumulated provision for impairment losses, if any, are removed from the accounts and any resulting gain or loss is credited to or charged against current operations.
Fully depreciated and amortized property and equipment are retained in the accounts until they are no longer in use and no further depreciation and amortization is charged against current operations.
Interests in Joint Ventures The Group has interests in joint ventures that are classified as jointly controlled operations. A jointly controlled operation involves the use of assets and other resources of the Group and other venturers rather than the establishment of a corporation, partnership or other entity. The Group accounts for the assets it controls and the liabilities it incurs, the expenses it incurs and the share of net income that it earns from the sale of real estate inventories by the joint venture.
Systems Development Costs Costs associated with developing or maintaining computer software programs are recognized as expense as incurred. Costs that are directly associated with identifiable and unique software controlled by the Group and will generate economic benefits exceeding costs beyond one year, are recognized as intangible assets to be measured at cost less accumulated amortization and provision for impairment losses, if any.
82 VISTA LAND
System development costs recognized as assets are amortized using the straight-line method over their useful lives, but not exceeding a period of three years. Where an indication of impairment exists, the carrying amount of computer system development costs is assessed and written down immediately to its recoverable amount.
Impairment of Nonfinancial Assets This accounting policy relates to property and equipment, investment properties, investment in an associate, interests in joint ventures, model house accessories and systems development costs.
The Group assesses as at reporting date whether there is an indication that nonfinancial assets may be impaired. If any such indication exists, or when annual impairment testing for an asset is required, the Group makes an estimate of the asset’s recoverable amount. An asset’s recoverable amount is calculated as the higher of the asset’s or cash-generating unit’s fair value less costs to sell and its value in use and is determined for an individual asset, unless the asset does not generate cash inflows that are largely independent of those assets or groups of assets. Where the carrying amount of an asset exceeds its recoverable amount, the asset is considered impaired and is written down to its recoverable amount. In assessing value in use, the estimated future cash flows are discounted to their present value using a pre-tax discount rate that reflects current market assessment of the time value of money and the risks specific to the asset. Impairment losses of continuing operations are recognized in profit or loss in those expense categories consistent with the function of the impaired asset.
An assessment is made at each reporting date as to whether there is an indication that previously recognized impairment losses may no longer exist or may have decreased. If such indication exists, the recoverable amount is estimated. A previously recognized impairment loss is reversed only if there has been a change in the estimates used to determine the asset’s recoverable amount since the last impairment loss was recognized. If that is the case, the carrying amount of the asset is increased to its recoverable amount. That increased amount cannot exceed the carrying amount that would have been determined, net of depreciation and amortization, had no impairment loss been recognized for the asset in prior years. Such reversal is recognized in profit or loss unless the asset is carried at revalued amount, in which case the reversal is treated as revaluation increase in the other comprehensive income. After such reversal, the depreciation and amortization charge is adjusted in future periods to allocate the asset’s revised carrying amount, less any residual value, on a systematic basis over its remaining useful life.
The following criteria are also applied in assessing impairment of specific assets:
Investment in an associate After application of the equity method, the Group determines whether it is necessary to recognize any additional impairment loss with respect to the Group’s net investment in the investee companies. The Group determines at each reporting date whether there is any objective evidence that the investment in an associate is impaired. If this is the case, the Group calculates the amount of impairment as being the difference between the recoverable amount and the carrying value of the investee company and recognizes the difference in profit or loss.
VISTA LAND & LIFESCAPES, INC. AND SUBSIDIARIESNOTES TO CONSOLIDATED FINANCIAL STATEMENTS

Vista LandA N N U A L R E P O R T11
VISTA LAND ANNUAL REPORT 2011 83
- 18 -
Equity When the shares are sold at premium, the difference between the proceeds at the par value is credited to “Additional paid-in capital” account. Direct costs incurred related to equity issuance are chargeable to “Additional paid-in capital” account. If additional paid-in capital is not sufficient, the excess is charged against retained earnings. When the Group issues more than one class of stock, a separate account is maintained for each class of stock and the number of shares issued.
Retained earnings represent accumulated earnings of the Group less dividends declared.
Own equity instruments which are reacquired (treasury shares) are recognized at cost and deducted from equity. No gain or loss is recognized in profit or loss on the purchase, sale, issue or cancellation of the Group’s own equity instruments. Any difference between the carrying amount and the consideration, if reissued, is recognized in additional paid-in capital. Voting rights related to treasury shares are nullified for the Group and no dividends are allocated to them respectively. When the shares are retired, the capital stock account is reduced by its par value and the excess of cost over par value upon retirement is debited to additional paid-in capital to the extent of the specific or average additional paid-in capital when the shares were issued and to retained earnings for the remaining balance.
Revenue and Cost Recognition Revenue is recognized to the extent that it is probable that the economic benefits will flow to the Group and the revenue can be reliably measured.
Real estate revenue For real estate sales, the Group assesses whether it is probable that the economic benefits will flow to the Group when the sales prices are collectible. Collectibility of the sales price is demonstrated by the buyer’s commitment to pay, which in turn is supported by substantial initial and continuing investments that give the buyer a stake in the property sufficient that the risk of loss through default motivates the buyer to honor its obligation to the seller. Collectibility is also assessed by considering factors such as the credit standing of the buyer, age and location of the property.
Revenue from sales of completed real estate projects is accounted for using the full accrual method. In accordance with Philippine Interpretations Committee, Q&A 2006-01, the percentage-of-completion method is used to recognize income from sales of projects where the Group has material obligations under the sales contract to complete the project after the property is sold, the equitable interest has been transferred to the buyer, construction is beyond preliminary stage (i.e., engineering, design work, construction contracts execution, site clearance and preparation, excavation and the building foundation are finished, and the costs incurred or to be incurred can be measured reliably). Under this method, revenue is recognized as the related obligations are fulfilled, measured principally on the basis of the estimated completion of a physical proportion of the contract work.
Any excess of collections over the recognized receivables are included in the “Customers’ advances and deposits” account in the liabilities section of the consolidated statement of financial position.
84 VISTA LAND
- 19 -
When a sale of real estate does not meet the requirements for revenue recognition, the sale is accounted for under the deposit method. Under this method, revenue is not recognized, and the receivable from the buyer is not recorded. The real estate inventories continue to be reported on the consolidated statement of financial position as “Real estate inventories” and the related liability as deposits under “Customers’ advances and deposits”.
Cost of real estate sales is recognized consistent with the revenue recognition method applied. Cost of subdivision land and condominium units sold before the completion of the development is determined on the basis of the acquisition cost of the land plus its full development costs, which include estimated costs for future development works, as determined by the Group’s in-house technical staff.
Interest income Interest is recognized as it accrues (using the effective interest method i.e, the rate that exactly discounts estimated future cash receipts through the expected life of the financial instrument to the net carrying amount of the financial asset).
Dividend income Dividend income is recognized when the Group’s right to receive payment is established.
Pension Cost Pension cost is actuarially determined using the projected unit credit method. This method reflects services rendered by employees up to the date of valuation and incorporates assumptions concerning employees’ projected salaries. Actuarial valuations are conducted with sufficient regularity, with option to accelerate when significant changes to underlying assumptions occur. Pension cost includes current service cost, interest cost, expected return on any plan assets, actuarial gains and losses and the effect of any curtailments or settlements.
The net pension liability recognized in the consolidated statement of financial position in respect of the defined benefit pension plan is the present value of the defined benefit obligation at the reporting date less the fair value of the plan assets, together with adjustments for unrecognized actuarial gains or losses and past service costs that shall be recognized in later periods. The defined benefit obligation is calculated by an independent actuary using the projected unit credit method. The present value of the defined benefit obligation is determined using risk-free interest rate of government bonds that have terms to maturity approximating to the terms of the related pension liability or applying a single weighted average discount rate that reflects the estimated timing and amount of benefit payments.
The actuarial gains and losses arising from experience adjustments and changes in actuarial assumptions are immediately charged to or credited to profit or loss.
Past service cost, if any, is recognized immediately in profit or loss, unless the changes to the pension plan are conditional on the employees remaining in service for a specified period of time (the vesting period). In this case, the past service cost is amortized on a straight-line basis over the vesting period.
VISTA LAND & LIFESCAPES, INC. AND SUBSIDIARIESNOTES TO CONSOLIDATED FINANCIAL STATEMENTS

Vista LandA N N U A L R E P O R T11
VISTA LAND ANNUAL REPORT 2011 85
- 20 -
Income Tax Current tax Current tax assets and liabilities for the current and prior periods are measured at the amount expected to be recovered from or paid to the taxation authorities. The tax rates and tax laws used to compute the amount are those that are enacted or substantively enacted by the reporting date.
Deferred tax Deferred income tax is provided using the liability method on temporary differences, with certain exceptions, at the reporting date between the tax bases of assets and liabilities and their carrying amounts for financial reporting purposes.
Deferred tax liabilities are recognized for all taxable temporary differences, with certain exceptions. Deferred tax assets are recognized for all deductible temporary differences, carryforward benefit of unused tax credits from excess of minimum corporate income tax (MCIT) over the regular corporate income tax and unused net operating loss carryover (NOLCO), to the extent that it is probable that taxable income will be available against which the deductible temporary differences and carryforward benefits of unused tax credits from MCIT and NOLCO can be utilized.
The carrying amount of deferred tax assets is reviewed at each reporting date and reduced to the extent that it is no longer probable that sufficient taxable income will be available to allow the deferred tax assets to be utilized. Unrecognized deferred tax assets are reassessed at each reporting date and are recognized to the extent that it has become probable that future taxable income will allow the deferred tax asset to be recovered.
Deferred tax assets and liabilities are measured at the tax rate that is expected to apply in the period when the asset is realized or the liability is settled, based on tax rates and tax laws that have been enacted or substantively enacted at the reporting date.
Deferred tax assets and deferred tax liabilities are offset if a legally enforceable right exists to set off current tax assets against current tax liabilities, and the deferred taxes relate to the same taxable entity and the same taxation authority.
Commissions The Group recognizes commissions when services are rendered by the broker. The commission expense is accrued upon receipt of down payment from the buyer comprising a substantial portion of the contract price and the capacity to pay and credit worthiness of buyers have been reasonably established for sales under the deferred cash payment arrangement.
Borrowing Costs Borrowing costs directly attributable to the acquisition or construction of an asset that necessarily takes a substantial period of time to get ready for its intended use or sale are capitalized as part of the cost of the respective assets (included in “Real estate inventories” account in the consolidated statement of financial position). All other borrowing costs are expensed in the period in which they occur. Borrowing costs consist of interest and other costs that an entity incurs in connection with the borrowing of funds.

86 VISTA LAND
- 21 -
The interest capitalized is calculated using the Group’s weighted average cost of borrowings after adjusting for borrowings associated with specific developments. Where borrowings are associated with specific developments, the amounts capitalized is the gross interest incurred on those borrowings less any investment income arising on their temporary investment.
Interest is capitalized from the commencement of the development work until the date of practical completion. The capitalization of finance costs is suspended if there are prolonged periods when development activity is interrupted. Interest is also capitalized on the purchase cost of a site of property acquired specifically for redevelopment but only where activities necessary to prepare the asset for redevelopment are in progress.
Basic and Diluted Earnings Per Share (EPS) EPS is computed by dividing net income for the year attributable to common stockholders by the weighted average number of common shares issued and outstanding during the year adjusted for any subsequent stock dividends declared. Diluted EPS is computed by dividing net income for the year by the weighted average number of common shares issued and outstanding during the year after giving effect to assumed conversion of potential common shares. The calculation of diluted EPS does not assume conversion, exercise, or other issue of potential common shares that would have an antidilutive effect on earnings per share.
As of December 31, 2011 and 2010, the Group has no dilutive potential common shares.
Segment Reporting The Group’s operating businesses are organized and managed separately according to the nature of the products and services provided, with each segment representing a strategic business unit that offers different products and serves different markets. Financial information on operating segments is presented in Note 5 to the consolidated financial statements.
Contingencies Contingent liabilities are not recognized in the consolidated financial statements. These are disclosed unless the possibility of an outflow of resources embodying economic benefits is remote. Contingent assets are not recognized in the consolidated financial statements but disclosed when an inflow of economic benefits is probable.
Events After the Reporting Date Post year-end events that provide additional information about the Group’s position at the reporting date (adjusting events) are reflected in the consolidated financial statements. Post year-end events that are not adjusting events are disclosed in the consolidated financial statements when material.
3. Significant Accounting Judgments and Estimates
The preparation of accompanying consolidated financial statements in compliance with PFRS requires management to make estimates and assumptions that affect the amounts reported in the consolidated financial statements and accompanying notes. The estimates and assumptions used in the consolidated financial statements are based upon
VISTA LAND & LIFESCAPES, INC. AND SUBSIDIARIESNOTES TO CONSOLIDATED FINANCIAL STATEMENTS

Vista LandA N N U A L R E P O R T11
VISTA LAND ANNUAL REPORT 2011 87
- 22 -
management’s evaluation of relevant facts and circumstances as at the date of the consolidated financial statements. Actual results could differ from such estimates.
Estimates and judgments are continually evaluated and are based on historical experience and other factors, including expectations of future events that are believed to be reasonable under the circumstances.
Judgments In the process of applying the Group’s accounting policies, management has made the following judgments, apart from those involving estimations, which have the most significant effect on the amounts recognized in the consolidated financial statements:
Revenue and cost recognition Selecting an appropriate revenue recognition method for a particular real estate sale transaction requires certain judgments based on, among others:
Buyer’s commitment on the sale which may be ascertained through the significance
of the buyer’s initial investment; and Stage of completion of the project.
Collectibility of the sales price For real estate sales, in determining whether the sales prices are collectible, the Group considers that initial and continuing investments by the buyer of about 5% would demonstrate the buyer’s commitment to pay.
Distinction between real estate inventories and land and improvements The Group determines whether a property will be classified as Real estate inventories or Land and improvements. In making this judgment, the Group considers whether the property will be sold in the normal operating cycle (Real estate inventories) or whether it will be retained as part of the Group’s strategic landbanking activities for development or sale in the medium or long-term (Land and improvements). Land and improvements that are to be developed in the subsequent year are classified as part of the current assets.
Operating lease commitments - the Group as lessee The Group has entered into contract of lease for some of the office space it occupies. The Group has determined that all significant risks and benefits of ownership on these properties will be retained by the lessor. In determining significant risks and benefits of ownership, the Group considered, among others, the significance of the lease term as compared with the estimated useful life of the related asset. The Group accordingly accounted for these as operating leases.
Operating lease commitments - Group as lessor
The Group has entered into commercial property leases on its investment property portfolio. The Group has determined that it retains all significant risks and rewards of ownership of these properties as the Group considered among others the length of the lease term as compared with the estimated useful life of the assets.
88 VISTA LAND
- 23 -
Classification of property as investment property or real estate inventories The Group determines whether a property is classified as investment property or inventory property as follows:
Investment property comprises land and buildings (principally offices, commercial and
retail property) which are not occupied substantially for use by, or in the operations of, the Group, nor for sale in the ordinary course of business, but are held primarily to earn rental income and capital appreciation.
Inventory comprises property that is held for sale in the ordinary course of business.
Principally, this is residential and commercial property that the Group develops and intends to sell before or on completion of construction.
Distinction between investment properties and land and improvement The Group determines a property as investment property if such is not intended for sale in the ordinary course of business, but are held primarily to earn rental income and capital appreciation. Land and improvement comprises property that is retained as part of the Group’s strategic landbanking activities for development or sale in the medium or long-term.
Distinction between investment properties and owner-occupied properties The Group determines whether a property qualifies as an investment property. In making its judgment, the Group considers whether the property generates cash flows largely independent of the other assets held by an entity. Owner-occupied properties generate cash flows that are attributable not only to property but also to the other assets used in the production or supply process.
Some properties comprise a portion that is held to earn rentals or for capital appreciation and another portion that is held for use in the production or supply of goods or services or for administrative purposes. If these portions cannot be sold separately, the property is accounted for as an investment property only if an insignificant portion is held for use in the production or supply of goods or services or for administrative purposes. Judgment is applied in determining whether ancillary services are so significant that a property does not qualify as investment property. The Group considers each property separately in making its judgment.
Impairment of AFS financial assets carried at cost The Group follows the guidance of PAS 39 in determining when an asset is impaired. This determination requires significant judgment. In making this judgment, the Group evaluates, among other factors, the duration and extent to which the fair value of an investment is less than its cost; the financial health of and near-term business outlook of the investee, including factors such as industry and sector performance, changes in technology and operational and financing cash flow.
Contingencies The Group is currently involved in various legal proceedings. The estimate of probable costs for the resolution of these claims has been developed in consultation with outside counsel handling the defense in these matters and is based upon an analysis of potential results. The Group currently does not believe that these proceedings will have a material effect on the Group’s financial position (see Note 33).
VISTA LAND & LIFESCAPES, INC. AND SUBSIDIARIESNOTES TO CONSOLIDATED FINANCIAL STATEMENTS

Vista LandA N N U A L R E P O R T11
VISTA LAND ANNUAL REPORT 2011 89
- 24 -
Management’s Use of Estimates The key assumptions concerning the future and other key sources of estimation uncertainty at the reporting date , that have a significant risk of causing a material adjustment to the carrying amounts of assets and liabilities within the next financial year are discussed below.
Revenue and cost recognition The Group’s revenue recognition policies require management to make use of estimates and assumptions that may affect the reported amounts of revenue and costs. The Group’s revenue from real estate is recognized based on the percentage of completion measured principally on the basis of the actual costs incurred to date over the estimated total costs of the project.
The related balances from real estate transactions follow:
2011 2010 2009 Real estate sales P=13,513,424,829 P=11,338,533,300 P=9,629,663,010 Costs of real estate sales (Note 9) 6,611,347,721 5,656,325,105 5,003,984,152
Estimating allowance for impairment losses on receivables The Group maintains allowances for impairment losses based on the results of the individual and collective assessments under PAS 39. For both individual and collective assessment, the Group is required to obtain the present value of estimated cash flows using the receivable’s original effective interest rate. The estimated cash flows considers the management’s estimate of proceeds from the disposal of the collateral less cost to repair, cost to sell and return of deposit due to the defaulting party. The cost to repair and cost to sell are based on historical experience. The methodology and assumptions used for the individual and collective assessments are based on management’s judgments and estimates made for the year. Therefore, the amount and timing of recorded expense for any period would differ depending on the judgments and estimates made for the year.
The balance of the Group’s receivables, net of allowance for impairment loss, amounted to P=21,069.32 million and P=19,073.60 million as of December 31, 2011and 2010 (see Note 8).
Evaluation of net realizable value of real estate inventories and land and improvements Real estate inventories and land and improvements are valued at the lower of cost or NRV. This requires the Group to make an estimate of the real estate for sale inventories and land and improvements’ estimated selling price in the ordinary course of business, cost of completion and costs necessary to make a sale to determine the NRV. The Group adjusts the cost of its real estate inventories and land and improvements to NRV based on its assessment of the recoverability of these assets. In determining the recoverability of these assets, management considers whether these assets are damaged, if their selling prices have declined and management’s plan in discontinuing the real estate projects. Estimated selling price is derived from publicly available market data and historical experience, while estimated selling costs are basically commission expense based on historical experience. Management would also obtain the services of an independent appraiser to determine the fair value of undeveloped land based on the latest selling prices of the properties of the same characteristics of the land and improvements.

90 VISTA LAND
- 25 -
Real estate inventories amounted to P=14,901.42 million and P=12,498.61 million as of December 31, 2011 and 2010, respectively (see Note 9). Land and improvements amounted to P=16,348.09 million and P=18,042.08 million as of December 31, 2011 and 2010, respectively (see Note 11).
Evaluation of impairment The Group reviews investment in an associate, interest in joint ventures, investment properties, property and equipment and system development costs for impairment of value. This includes considering certain indications of impairment such as significant changes in asset usage, significant decline in assets’ market value, obsolescence or physical damage of an asset, significant underperformance relative to expected historical or projected future operating results and significant negative industry or economic trends.
The Group estimates the recoverable amount as the higher of the fair value les cost to sell and value in use. In determining the present value of estimated future cash flows expected to be generated from the continued use of the assets, the Group is required to make estimates and assumptions that may affect investment in an associate, interests in joint venture, investment properties, property and equipment and system development cost.
The fair value less costs to sell calculation is based on available data from binding sales transactions in an arm’s length transaction of similar assets or observable market prices less incremental costs for disposing of the asset. The value in use calculation is based on a discounted cash flow model. The cash flows are derived from the budget for the next five years and do not include restructuring activities that the Group is not yet committed to or significant future investments that will enhance the asset’s performance of the cash generating unit being tested. The recoverable amount is most sensitive to the discount rate used for the discounted cash flow model as well as the expected future cash inflows and the growth rate used for extrapolation purposes.
Based on management assessment as of December 31, 2011 and 2010, no indicators of impairment exist for investment in associate, interests in joint ventures, investment properties, property and equipment, and systems development costs.
The aggregate carrying values of investment in an associate, interests in joint venture, investment properties, property and equipment and system development costs amounted to P=4,844.90 million and P=2,718.81 million as of December 31, 2011 and 2010, respectively (see Notes 12, 14, and 16).
Estimating useful lives of property and equipment, investment properties and systems development costs The Group estimates the useful lives of property and equipment, investment properties and systems development cost based on the period over which the assets are expected to be available for use. The estimated useful lives of property and equipment, investment properties and system development cost are reviewed at least annually and are updated if expectations differ from previous estimates due to physical wear and tear and technical or commercial obsolescence on the use of these property and equipment. It is possible that future results of operations could be materially affected by changes in these estimates brought about by changes in factors mentioned above.
VISTA LAND & LIFESCAPES, INC. AND SUBSIDIARIESNOTES TO CONSOLIDATED FINANCIAL STATEMENTS

Vista LandA N N U A L R E P O R T11
VISTA LAND ANNUAL REPORT 2011 91
- 26 -
The aggregate carrying value of property and equipment, investment properties and system development cost amounted to P=2,509.72 million and P=135.06 million as of December 31, 2011 and 2010, respectively (see Notes 13, 14 and 16).
Recognizing deferred tax assets The Group reviews the carrying amounts of deferred income taxes at each reporting date and reduces deferred tax assets to the extent that it is no longer probable that sufficient taxable income will be available to allow all or part of the deferred tax assets to be utilized. However, there is no assurance that the Group will generate sufficient taxable income to allow all or part of deferred tax assets to be utilized. The Group looks at its projected performance in assessing the sufficiency of future taxable income.
As of December 31, 2011 and 2010, the Group has unrecognized deferred tax assets amounting to P=1,328.24 million and P=1,569.62 million, respectively (see Note 28).
Estimating pension obligation and other retirement benefits The determination of the Group’s pension liabilities is dependent on selection of certain assumptions used by actuaries in calculating such amounts. Those assumptions are described in Note 27 and include among others, discount rates, expected returns on plan assets and rates of salary increase. While the Group believes that the assumptions are reasonable and appropriate, significant differences in actual experience or significant changes in assumptions may materially affect retirement obligations. See Note 27 to the consolidated financial statements for the related balances.
Fair value of financial instruments Where the fair values of financial assets and financial liabilities recorded in the consolidated statement of financial position cannot be derived from active markets, they are determined using internal valuation techniques using generally accepted market valuation models. The inputs to these models are taken from observable markets where possible, but where this is not feasible estimates are used in establishing fair values. These estimates may include considerations of liquidity, volatility, and correlation. Certain financial assets and liabilities were initially recorded at its fair value by using the discounted cash flow methodology. See Note 31 to the consolidated financial statements for the related balances.
4. Business Combinations
Acquisition of VRI On October 29, 2009, the Parent Company acquired from Polar Property Holdings, Inc. (PPHI) and various shareholders, 100% ownership of VRI for a total consideration of P=661.61 million. The Parent Company accounted for the acquisition using the purchase method.
The Group acquired VRI to consolidate the development and selling of all vertical and high-rise condominium projects of the Group under a new brand name “Vista Residences”. The brand consolidation is intended to have a clearer and stronger market identity of the Group’s vertical development projects. Moreover, the acquisition of VRI is part of the Group’s strategic focus to broaden its real estate portfolio and increase its revenue base. The Group indirectly acquired four mixed residential and commercial

92 VISTA LAND
- 27 -
condominium projects of VRI namely, the Symphony Tower 1, Presidio Complex, Madison Place Tower and Crown Tower. Accordingly, VRI’s financial statements are consolidated on a line-by-line basis with that of the Group as of December 31, 2009.
The net assets recognized in the December 31, 2009 financial statements were based on a provisional assessment of fair value as the Group had sought an independent valuation for the assets owned by VRI.
The accounting for business combination was done provisionally for the assets acquired and liabilities assumed as of to December 31, 2009.
Following is a summary of the fair value of the identifiable assets and liabilities assumed of VRI as at the date of acquisition:
Assets Cash and cash equivalents P=15,838,024 Receivables 644,357,268 Real estate inventories and development 500,032,234 Property and equipment - net 6,266,266 Due from related parties 75,134,517 Deferred tax assets 23,330,697 Prepayments and other assets 181,357,628 1,446,316,634 Liabilities Bank loans 268,158,856 Accounts and other payables 286,113,295 Customers’ advances and deposits 213,628,981 Income tax payable 282,942 Pension liabilities 16,519,400 784,703,474 Total identifiable net assets at fair value 661,613,160 Goodwill arising on acquisition – Purchase consideration transferred P=661,613,160
Receivables were valued at its carrying amount as of date of acquisition. None of the receivables have been impaired and it is expected that the full contractual amount can be collected.
Cost of the acquisition follows:
Cash paid P=1,000,000 Treasury shares issued 660,613,160 P=661,613,160
The Parent Company issued 320,686,000 treasury shares as consideration for the 100.00% interest in VRI. The fair value of the shares is the published price of the shares of the Parent Company at the acquisition date.
VISTA LAND & LIFESCAPES, INC. AND SUBSIDIARIESNOTES TO CONSOLIDATED FINANCIAL STATEMENTS

Vista LandA N N U A L R E P O R T11
VISTA LAND ANNUAL REPORT 2011 93
- 28 -
Analysis of net cash acquired from the business combination follows:
Net cash acquired with the acquisition of a subsidiary P=15,838,024 Cash paid to minority holders of VRI (1,000,000) Net cash flow on the acquisition P=14,838,024
From the date of acquisition, VRI has contributed P=518.18 million of revenue and P=105.82 million to the income before income tax of the Group. If the combination had taken place at the beginning of 2009, consolidated revenue would have been P=11,412.62 million and the net income for the Group would have been P=2,405.22 million.
In 2010, the Parent Company finalized its purchased price allocation and there were no significant difference between the fair values of the assets acquired and liabilities assumed compared with the provisional amounts recognized.
5. Segment Information
For management purposes, the Group’s operating segments are organized and managed separately according to the nature of the products provided, with each segment representing a strategic business unit that offers different products and serves different markets. The Group has three reportable operating segments as follows:
Horizontal Projects This segment pertains to the housing market segment of the Group. It caters on the development and sale of residential lots and units.
Vertical Projects This segment caters on the development and sale of residential high-rise condominium projects across the Philippines. Vertical home projects involve dealing with longer gestation periods and has requirements that are different from those of horizontal homes.
Others
This segment pertains to activities from holding companies and others.
In 2011, the Group’s management changed the presentation of its reportable segments by presenting the balances pertaining to the parent company and intermediate holding companies separately from Horizontal Projects. Accordingly, the segment information presented in prior year was restated to conform with the current year presentation.
The Group’s management believes that this presentation would be more useful to the users of the consolidated financial statements.
Management monitors the operating results of its business units separately for the purpose of making decisions about resource allocation and performance assessment. Segment performance is evaluated based on segment operating income or loss before income tax. Segment operating income or loss before income tax is based on the same accounting policies as consolidated operating income or loss. The Group has no intersegment revenues. No operating segments have been aggregated to form the above reportable operating business segments. The chief operating decision-maker (CODM) has been identified as the chief executive officer. The CODM reviews the Group’s internal reports in order to assess performance of the Group.

94 VISTA LAND
- 29 -
The financial information about the operations of these business segments is summarized below:
December 31, 2011
Horizontal
Vertical
Others Intersegment Adjustments Consolidated
(Amounts in thousands) Real Estate Revenue P=11,462,925 P=2,051,192 P=– (P=692) P=13,513,425 Costs and Operating Expenses 8,261,414 1,538,484 163,878 (78,104) 9,885,672 Segment Income (Loss) Before
Income Tax 3,201,511 512,708 (163,878) 77,412 3,627,753 Interest income (Note 24) 613,799 19,515 218,060 1,739 853,113 Equity in net income of an associate
(Note 12) – – 27,706 (33,879) (6,173) Dividend income – – 1,639,761 (1,639,610) 151 Interest and other financing charge
(Note 24) (167,978) (234,097) (952,194) 25,059 (1,329,210) Foreign exchange gain (Notes 21 and 22) 63 – 61,955 – 62,018 Miscellaneous income (Note 25) 272,329 29,654 96,158 (11,895) 386,246 Income before income tax 3,919,724 327,780 927,568 (1,581,174) 3,593,898 Provision for income tax (Note 28) (124,293) 95,100 30,179 64,928 65,914 Net Income P=4,044,017 P=232,680 P=897,389 (P=1,646,102) P=3,527,984 Other Information Segment assets P=75,979,608 P=7,542,978 P=34,338,593 (P=51,021,863) P=66,839,316 AFS financial assets (Note 7) – – 41,309 – 41,309 Investment in an associate (Note 12) – – 749,598 (59,682) 689,916 Deferred tax assets - net (Note 28) 2,028 – – – 2,028 Total Assets P=75,981,636 P=7,542,978 P=35,129,500 (P=51,081,545) P=67,572,569 Segment liabilities P=18,356,881 P=2,904,447 P=3,417,071 P=7,930 P=24,686,329 Payable to related parties (Note 29) 12,943,213 1,127,446 8,236,301 (22,124,158) 182,802 Deferred tax liabilities - net (Note 28) 924,589 257,756 829,033 3,548 2,014,926 Total Liabilities P=32,224,683 P=4,289,649 P=12,482,405 (P=22,112,680) P=26,884,057 Capital expenditures P=7,558,793 P=3,574,764 P=– P=– P=11,133,557 Depreciation and amortization (Notes 14 and 16) 93,265 8,490 – – 101,755
December 31, 2010
Horizontal Vertical Others Intersegment Adjustments Consolidated
(Amounts in thousands) Real Estate Revenue P=9,633,030 P=1,705,503 P=– P=– P=11,338,533 Costs and Operating Expenses 6,831,245 1,389,404 187,669 (18,445) 8,389,873 Segment Income (Loss) Before
Income Tax 2,801,785 316,099 (187,669) 18,445 2,948,660 Interest income (Note 23) 707,917 39,077 30,128 – 777,122 Equity in net income of an associate (Note 11) – –
28,218 (25,803) 2,415
Dividend income – – 1,258,575 (1,258,550) 25 Miscellaneous income (Note 24) 261,717 75,437 53,849 (23,520) 367,483 Interest and other financing charge (Note 23) (443,897) (181,564)
(104,773) – (730,234)
Loss on debt settlement (Note 21) – – (115,868) – (115,868) Foreign exchange loss (Notes 20 and 21) 163 – (16,047) – (15,884) Income before income tax 3,327,685 249,049 946,413 (1,289,428) 3,233,719 Provision for income tax (Note 27) 146,664 20,787 (5,438) 58,733 220,746 Net Income P=3,181,021 P=228,262 P=951,851 (P=1,348,161) P=3,012,972 Other Information Segment assets P=48,669,408 P=5,782,110 P=35,774,508 (P=30,508,781) P=59,717,245 AFS financial assets (Note 6) – – 16,990,806 (16,949,497) 41,309 Investment in an associate (Note 11) – – 721,892 (25,804) 696,088 Deferred tax assets - net (Note 27) 18,425 – 6,735 1,523 26,683 Total Assets P=48,687,833 P=5,782,110 P=53,493,941 (P=47,482,559) P=60,481,325
(Forward)
VISTA LAND & LIFESCAPES, INC. AND SUBSIDIARIESNOTES TO CONSOLIDATED FINANCIAL STATEMENTS
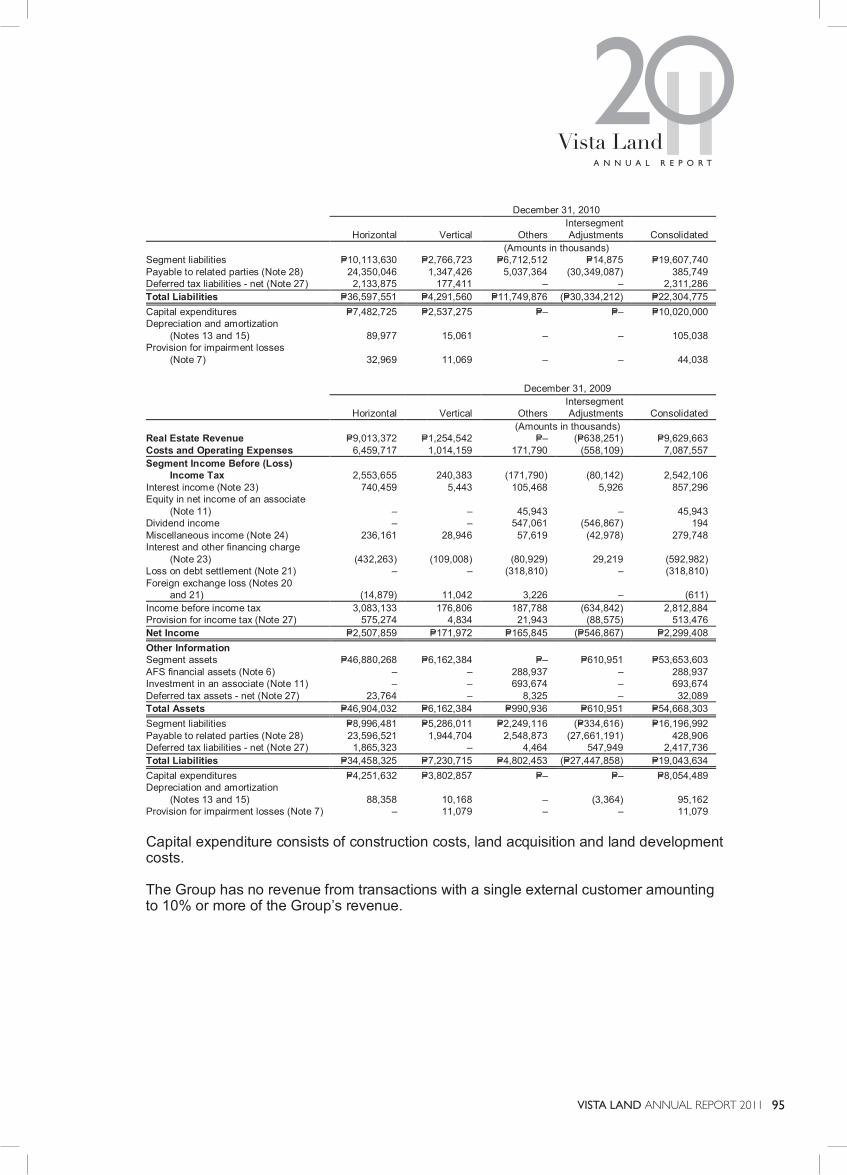
Vista LandA N N U A L R E P O R T11
VISTA LAND ANNUAL REPORT 2011 95
- 30 -
December 31, 2010
Horizontal Vertical Others Intersegment Adjustments Consolidated
(Amounts in thousands) Segment liabilities P=10,113,630 P=2,766,723 P=6,712,512 P=14,875 P=19,607,740 Payable to related parties (Note 28) 24,350,046 1,347,426 5,037,364 (30,349,087) 385,749 Deferred tax liabilities - net (Note 27) 2,133,875 177,411 – – 2,311,286 Total Liabilities P=36,597,551 P=4,291,560 P=11,749,876 (P=30,334,212) P=22,304,775 Capital expenditures P=7,482,725 P=2,537,275 P=– P=– P=10,020,000 Depreciation and amortization (Notes 13 and 15) 89,977 15,061
– – 105,038
Provision for impairment losses (Note 7) 32,969 11,069 – – 44,038
December 31, 2009
Horizontal Vertical Others Intersegment Adjustments Consolidated
(Amounts in thousands) Real Estate Revenue P=9,013,372 P=1,254,542 P=– (P=638,251) P=9,629,663 Costs and Operating Expenses 6,459,717 1,014,159 171,790 (558,109) 7,087,557 Segment Income Before (Loss)
Income Tax 2,553,655 240,383 (171,790) (80,142) 2,542,106 Interest income (Note 23) 740,459 5,443 105,468 5,926 857,296 Equity in net income of an associate (Note 11) – – 45,943 – 45,943 Dividend income – – 547,061 (546,867) 194 Miscellaneous income (Note 24) 236,161 28,946 57,619 (42,978) 279,748 Interest and other financing charge
(Note 23) (432,263) (109,008) (80,929) 29,219 (592,982) Loss on debt settlement (Note 21) – – (318,810) – (318,810) Foreign exchange loss (Notes 20 and 21) (14,879) 11,042 3,226 – (611) Income before income tax 3,083,133 176,806 187,788 (634,842) 2,812,884 Provision for income tax (Note 27) 575,274 4,834 21,943 (88,575) 513,476 Net Income P=2,507,859 P=171,972 P=165,845 (P=546,867) P=2,299,408 Other Information Segment assets P=46,880,268 P=6,162,384 P=– P=610,951 P=53,653,603 AFS financial assets (Note 6) – – 288,937 – 288,937 Investment in an associate (Note 11) – – 693,674 – 693,674 Deferred tax assets - net (Note 27) 23,764 – 8,325 – 32,089 Total Assets P=46,904,032 P=6,162,384 P=990,936 P=610,951 P=54,668,303 Segment liabilities P=8,996,481 P=5,286,011 P=2,249,116 (P=334,616) P=16,196,992 Payable to related parties (Note 28) 23,596,521 1,944,704 2,548,873 (27,661,191) 428,906 Deferred tax liabilities - net (Note 27) 1,865,323 – 4,464 547,949 2,417,736 Total Liabilities P=34,458,325 P=7,230,715 P=4,802,453 (P=27,447,858) P=19,043,634 Capital expenditures P=4,251,632 P=3,802,857 P=– P=– P=8,054,489 Depreciation and amortization (Notes 13 and 15) 88,358 10,168 – (3,364) 95,162 Provision for impairment losses (Note 7) – 11,079 – – 11,079
Capital expenditure consists of construction costs, land acquisition and land development costs.
The Group has no revenue from transactions with a single external customer amounting to 10% or more of the Group’s revenue.

96 VISTA LAND
- 31 -
6. Cash and Cash Equivalents
This account consists of:
2011 2010 Cash on hand P=13,230,967 P=10,776,387 Cash in banks 1,735,297,555 2,169,396,307 Cash equivalents 304,037,526 1,301,634,551 P=2,052,566,048 P=3,481,807,245
Cash in banks earns interest at the prevailing bank deposit rates. Cash equivalents are short-term, highly liquid investments that are made for varying periods of up to three months depending on the immediate cash requirements of the Group and earn interest ranging from 1.00% to 4.00% in 2011 and 1.60% to 4.06% in 2010.
7. Investments
Short-term cash investments Short-term cash investments consist of money market placements with maturities of more than three months up to one year and earn interest at the respective short-term investment rates, as follows:
2011 2010
Philippine Peso 1.75% to 4.00% 0.75% to 6.50%
US Dollar 1.75% to 4.00% –
Long-term cash investments Long-term cash investments consist of money market placements made for varying periods of more than one (1) year. These investments earn interest at the respective long-term investment rates, as follows:
2011 2010 Philippine Peso 4.63% to 6.50% – US Dollar 1.75% to 4.00% 1.75% to 4.00%
The investment is used as collateral to secure the bank loans of the Parent Company (see Note 19).
Available-for-sale financial assets This account pertains to unlisted preferred shares in a public utility company which the Group will continue to carry as part of the infrastructure that it provides for its real estate development projects and other operations. These are carried at cost less impairment, if any.
VISTA LAND & LIFESCAPES, INC. AND SUBSIDIARIESNOTES TO CONSOLIDATED FINANCIAL STATEMENTS

Vista LandA N N U A L R E P O R T11
VISTA LAND ANNUAL REPORT 2011 97
- 32 -
Movements in the net unrealized gain (loss) on AFS financial assets follow:
2010 2009 Balance at beginning of year P=− P=472,619 Fair value changes during the year (44,038,378) (472,619) Loss on writedown transferred to profit or loss 44,038,378 − Balance at end of year P=− P=−
In 2011, there are no movements in the fair value of AFS financial assets.
In 2010, the Group wrote-off available-for-sale financial assets amounting to P=44.04 million since the Group determined that they will not be able to recover such investments from the counterparty.
8. Receivables
This account consists of:
2011 2010 Installment contracts receivable P=18,087,331,761 P=16,140,816,767 Accrued interest receivable 124,741,646 51,408,905 Accounts receivable: Contractors 1,372,013,997 1,433,459,774 Buyers 616,153,492 777,852,445 Brokers 142,868,382 82,362,666 Others 1,040,543,070 902,025,636 21,383,652,348 19,387,926,193 Less allowance for impairment losses (314,331,094) (314,331,094) 21,069,321,254 19,073,595,099 Less noncurrent portion 8,822,808,812 8,253,105,474
P=12,246,512,442 P=10,820,489,625 Installment contracts receivable
Installment contracts receivable consist of accounts collectible in equal monthly installments with various terms up to a maximum of fifteen years. The corresponding titles to the subdivision or condominium units sold under this arrangement are transferred to the buyers only upon full payment of the contract price. The installment contracts receivable are interest-bearing except for those that are with installment schemes within two years. Interest rates on installment contracts receivables range from 16.00% to 19.00%.
Receivable from contractors Receivable from contractors are recouped every progress billing payment date depending on the percentage of accomplishment.
Receivable from buyers
Receivables from buyers pertain to sale of real estate units owned by joint venture partners that were sold by the Group by virtue of a marketing agreement between the Group and the joint venture partners. These sales do not form part of the Group's revenue and collections from buyers are remitted to the joint venture partners net of any marketing fees agreed by the parties.

98 VISTA LAND
- 33 -
Receivable from brokers
Receivable from brokers are recouped every progress billing depending on the collection milestone and submission of necessary buyer’s documents.
Others Other receivables consist mainly of receivables from various individuals and private entities and other nontrade receivables. These are due and demandable.
Receivables amounting to P=314.33 million as of December 31, 2011 and 2010 were impaired and fully provided for.
There was no movement in the allowance for impairment loss on receivables in 2011. Movements in the allowance for impairment losses on receivables as of December 31, 2010 follow:
Installment Contracts
Receivable Accounts
Receivable Total At January 1 P=99,352,184 P=225,621,569 P=324,973,753 Write off – (10,642,659) (10,642,659) At December 31 P=99,352,184 P=214,978,910 P=314,331,094
The impairment losses above pertain to individually impaired accounts. These are presented at gross amounts before directly deducting impairment allowance. No impairment losses resulted from performing collective impairment test.
In 2011 and 2010, installment contracts receivables with a total nominal amount of P=1,915.92 million and P=1,144.65 million, respectively, were recorded at amortized cost amounting to P=1,856.08 million and P=1,089.69 million, respectively. These are installment contracts receivables that are to be collected in 2 years which are noninterest-bearing. The fair value upon initial recognition is derived using discounted cash flow model using the discount rates ranging from 1.05% to 8.52% for those recognized in 2011 and 1.31% to 8.22% for those recognized in 2010. Interest income recognized from these receivables amounted to P=68.56 million, P=77.65 million and P=84.68 million in 2011, 2010 and 2009, respectively. The unamortized discount amounted to P=57.71 million and P=66.43 million as of December 31, 2011 and 2010, respectively.
Movement in unamortized discount arising from noninterest-bearing receivables is as follows:
2011 2010 Balance at beginning of year P=66,426,352 P=89,118,030 Additions 59,844,419 54,960,161 Accretion (Note 24) (68,564,387) (77,651,839) Balance at end of year P=57,706,384 P=66,426,352
In 2011 and 2010, the Group entered into various purchase agreements with financial institutions whereby the Group sold its installment contracts receivables on a with recourse basis. The purchase agreements provide that the Group should substitute defaulted contracts to sell with other contracts to sell of equivalent value. The Group still retains the sold receivables in the installment contracts receivables account and records
VISTA LAND & LIFESCAPES, INC. AND SUBSIDIARIESNOTES TO CONSOLIDATED FINANCIAL STATEMENTS

Vista LandA N N U A L R E P O R T11
VISTA LAND ANNUAL REPORT 2011 99
- 34 -
the proceeds from these sales as loans payable (see Note 19). The carrying value of installment contracts receivables sold and the corresponding set-up of loans payable amounted to P=2,421.04 million and P=3,567.77 million in 2011 and 2010, respectively.
In 2011 and 2010, the Group entered into agreement with various financial institutions whereby the Group sold their installment contracts receivables on a without recourse basis at discount rate of 10.00% to 12.00%. The carrying value of sold receivables amounted to P=1.03 billion in 2011 and P=1.42 billion in 2010. Proceeds received from the purchasing financial institutions and discount on sold receivables recorded by the Group amounted to P=982.56 million and P=47.49 million in 2011, respectively, and P=1.37 billion and P=46.57 million in 2010, respectively. The discount has been included under “Interest and other financing charges” account in profit or loss.
The carrying value of receivables that has been converted from a “with recourse basis” to “without recourse basis” amounted to P=1,030.05 million and P=1,419.97 million in 2011 and 2010, respectively.
9. Real Estate Inventories This account consists of:
2011 2010 Subdivision land for sale and development P=16,024,591,049 P=14,091,236,267 Less reserve for land development costs 5,924,414,238 5,764,316,116 10,100,176,811 8,326,920,151 Residential house units for sale and development 1,685,794,676 1,492,295,854 Condominium units for sale and development 3,115,446,885 2,679,393,219 4,801,241,561 4,171,689,073 P=14,901,418,372 P=12,498,609,224
Subdivision land for sale and development represents real estate subdivision projects in which the Group has been granted license to sell by the Housing and Land Use Regulatory Board of the Philippines and raw land inventories.
As of December 31, 2011 and 2010, subdivision land for sale and development of Brittany and CAPI with an aggregate carrying value of P=492.51 million and P=580.81 million, respectively, were mortgaged to secure the bank loans of the Parent Company (see Note 19).
Real estate inventories recognized as cost of sales amounted to P=6.61 billion in 2011, P=5.66 billion in 2010 and P=5.00 billion in 2009, and are included as cost of real estate sales as part of costs and expenses in the consolidated statements of income.
Borrowing cost capitalized in 2011 and 2010 amounted to P=305.59 million and P=60.51 million, respectively.

100 VISTA LAND
- 35 -
10. Other Current Assets
This account consists of:
2011 2010 Prepaid expenses P=694,956,074 P=600,802,781 Creditable withholding taxes 451,414,826 63,447,262 Deposits for real estate purchases (Note 16) 115,579,755 – Input value-added tax (VAT) 96,172,981 95,689,217 Construction materials and others 56,883,650 57,498,568 P=1,415,007,286 P=817,437,828
Prepaid expenses mainly include prepayments for marketing fees, taxes and licenses, rentals and insurance.
The Group will be able to apply the creditable withholding taxes against income tax payable.
The value-added input tax is applied against value-added output tax. The remaining balance is recoverable in future periods.
11. Land and Improvements
The rollforward analysis of this account follows:
2011 2010 Balance at beginning of year P=18,042,079,632 P=16,925,967,816 Additions 1,711,144,426 1,979,300,917 Transfers (3,405,132,270) (863,189,101) Balance at end of year P=16,348,091,788 P=18,042,079,632
Transfers pertain to land to be developed for sale and included under “Real estate inventories” account.
Further analysis of land and improvements follows:
2011 2010 At NRV P=8,666,701,802 P=9,911,205,984 At cost 7,681,389,986 8,130,873,648 P=16,348,091,788 P=18,042,079,632
The cost of land and improvements carried at NRV amounted to P=9.68 billion and P=10.92 billion as of December 31, 2011 and 2010, respectively. The Group recorded no provision for impairment in 2011, 2010 and 2009.
VISTA LAND & LIFESCAPES, INC. AND SUBSIDIARIESNOTES TO CONSOLIDATED FINANCIAL STATEMENTS

Vista LandA N N U A L R E P O R T11
VISTA LAND ANNUAL REPORT 2011 101
- 36 -
12. Investment in an Associate
This account consists of:
2011 2010 Acquisition cost P=491,621,724 P=491,621,724 Accumulated equity in net earnings Balance at beginning of year 204,466,472 202,052,021 Equity in net income (loss) (6,172,562) 2,414,451 Balance at end of year 198,293,910 204,466,472 P=689,915,634 P=696,088,196
Investment in an associate represents HDC’s 10.05% equity in PPHI. The investment is accounted for under the equity method as Althorp Holdings Inc.’s 11.55% voting rights in PPHI was assigned to HDC. As of December 31, 2011 and 2010 PPHI holds 777.50 million common shares of the Parent Company.
Summarized financial information of the associate follows (in millions):
2011 2010 Total assets P=7,076 P=6,099 Total liabilities 794 105 Total equity P=6,282 P=5,994
2011 2010 2009 Total revenue P=342 P=259 P=1,045 Total costs of real estate sales and expenses 66 19 588 Net income P=276 P=240 P=457
Based on the quoted price of PPHI shares, the fair value of HDC’s investments in PPHI amounted to P=1.25 billion and P=2.70 billion as of December 31, 2011 and 2010, respectively.
13. Investment properties
Movement in this account follows:
Land
Building and Building
Improvements
Construction
in Progress Total Transfers from:
Real estate inventories P=2,177,489,374 P=87,483,610 P=– P=2,264,972,984 Property and equipment – 13,770,261 – 13,770,261
Additions – – 13,889,125 13,889,125 Total 2,177,489,374 101,253,871 13,889,125 2,292,632,370 Depreciation and amortization (Note 26) – 934,856
– 934,856
Net Book Value P=2,177,489,374 P=100,319,015 P=13,889,125 P=2,291,697,514
In 2011, real estate inventories with book value amounting to P=2,264.97 million and property and equipment with book value amounting to P=13.77 million (see Note 14) were

102 VISTA LAND
- 37 -
reclassified to investment properties as these are intended to be developed for commercial and retail purposes and to be subsequently leased out to third parties.
The fair value of the land amounted to P=3,549.46 million as of December 31, 2011. This based on the most recent selling price of similar property. Building and building improvements and construction in progress approximates their fair values as these are newly constructed fixed assets.
14. Property and Equipment
The rollforward analyses of this account follow:
December 31, 2011
Building and Building
Improvements Transportation
Equipment
Office Furniture,
Fixtures and Equipment
Construction Equipment
Other Fixed Assets Total
Cost Balance at beginning of year P=37,348,341 P=169,530,254 P=142,327,624 P=44,304,998 P=67,486,915 P=460,998,132 Additions 29,730,627 59,161,714 33,010,417 2,699,749 34,526,294 159,128,801 Transfers to investment properties (Note 13) (15,498,012) − − − − (15,498,012) Balance at end of year 51,580,956 228,691,968 175,338,041 47,004,747 102,013,209 604,628,921 Accumulated Depreciation and Amortization Balance at beginning of year 13,915,957 122,172,690 118,984,980 39,966,624 47,030,961 342,071,212 Depreciation and amortization (Note 26) 13,113,288 30,001,376 22,151,893 904,584 19,305,775 85,476,916 Transfers to investment properties (Note 13) (1,727,751) − − − − (1,727,751) Balance at end of year 25,301,494 152,174,066 141,136,873 40,871,208 66,336,736 425,820,377 Net Book Value P=26,279,462 P=76,517,902 P=34,201,168 P=6,133,539 P=35,676,473 P=178,808,544
December 31, 2010
Building and Building
Improvements Transportation
Equipment
Office Furniture,
Fixtures and Equipment
Construction Equipment
Other Fixed Assets Total
Cost Balance at beginning of year P=1,331,721 P=137,001,036 P=127,177,085 P=41,333,201 P=71,032,101 P=377,875,144 Additions 37,017,810 32,664,218 15,150,539 2,971,797 16,192,795 103,997,159 Retirements/disposals (1,001,190) (135,000) – – (19,737,981) (20,874,171) Balance at end of year 37,348,341 169,530,254 142,327,624 44,304,998 67,486,915 460,998,132 Accumulated Depreciation and Amortization Balance at beginning of year 128,294 94,200,283 101,373,566 38,456,815 51,525,173 285,684,131 Depreciation and amortization (Note 26) 13,883,884 28,072,407 17,611,414 1,509,809 6,374,981 67,452,495 Retirements/disposals (96,221) (100,000) – – (10,869,193) (11,065,414) Balance at end of year 13,915,957 122,172,690 118,984,980 39,966,624 47,030,961 342,071,212 Net Book Value P=23,432,384 P=47,357,564 P=23,342,644 P=4,338,374 P=20,455,954 P=118,926,920
The Group’s transportation equipment with a carrying value of P=52.59 million and P=19.52 million as of December 31, 2011 and 2010, respectively, were pledged as collateral under chattel mortgage to secure the banks loans of the Group with various financial institutions (see Note 19).
VISTA LAND & LIFESCAPES, INC. AND SUBSIDIARIESNOTES TO CONSOLIDATED FINANCIAL STATEMENTS

Vista LandA N N U A L R E P O R T11
VISTA LAND ANNUAL REPORT 2011 103
- 38 -
15. Interests in Joint Ventures
Interests in joint ventures pertain to deposits, cash advances and other charges in connection with the land development agreements (LDA) entered into by the Group with individuals, corporate entities and certain related parties for the development of real estate projects. The LDA provides, among others, the following: a) the Group will undertake the improvement, subdivision and development of the real estate project within a certain period as prescribed by the LDA, subject to certain conditions to be fulfilled by the real estate property owner; and b) the parties shall divide among themselves all saleable inventory of the real estate project in accordance with the ratio mutually agreed.
Total interest of the Group for these LDA’s amounted to P=1,645.26 million and P=1,887.66 million as of December 31, 2011 and 2010, respectively.
16. Other Noncurrent Assets
This account consists of:
2011 2010 Model house accessories - net P=105,357,921 P=92,280,249 Deposits for real estate purchases 3,989,068 119,568,823 Systems development costs - net of accumulated amortization 39,212,517 16,130,205 Deposits and others 215,018,275 156,089,152 P=363,577,781 P=384,068,429
Deposits for real estate purchases substantially represent the Group’s payments to real estate property owners for the acquisition of certain real estate properties. Although the terms of the agreements provided that the deeds of absolute sale for the subject properties are to be executed only upon fulfillment by both parties of certain undertakings and conditions, including the payment by the Group of the full contract prices of the real estate properties, the Group already has physical possession of the original transfer certificates of title of the said properties. In 2011, deposits for real estate purchases amounting to P=115.58 million is reclassified to Other current assets as the agreed undertakings and conditions of a certain land acquisition was fulfilled in 2012.
Deposits and others include deposits to utility companies which will either be recouped against future billings or refunded upon completion of the real estate projects. Such deposits are necessary for the construction and development of real estate projects of the Group.
The rollforward analyses of development costs follow:
2011 2010 Balance at beginning of year P=16,130,205 P=49,404,309 Additions 38,425,168 4,311,633 Amortization (15,342,856) (37,585,737) Balance at end of year P=39,212,517 P=16,130,205

104 VISTA LAND
- 39 -
Amortization of system development costs amounting to P=15.34 million, P=37.59 million and P=41.75 million in 2011, 2010 and 2009, respectively is included in the “Depreciation and amortization” account under “Operating expenses” in profit or loss (see Note 26).
17. Accounts and Other Payables
This account consists of:
2011 2010 Accounts payable - contractors P=2,199,234,197 P=1,794,040,987 Accrued expenses 1,386,532,678 702,963,500 Retentions payable 686,998,838 704,825,564 Accounts payable - suppliers 418,748,340 228,434,484 Deferred output tax 398,283,737 536,190,440 Commissions payable 304,043,559 237,126,404 Accounts payable - buyers 130,331,765 135,419,667 Accounts payable - others 251,445,765 371,019,189 P=5,775,618,879 P=4,710,020,235
Accounts payable - contractor pertains to contractors’ billings for services related to the development of various projects of the Group. These are expected to be settled within a year after the reporting date.
Accounts payable, accrued expenses, retentions payable and commissions payable are noninterest-bearing and are expected to be settled within a year after the reporting date.
Accrued expenses consist mainly of accruals for project cost estimate, interest, light and power, marketing costs, professional fees, postal and communication, supplies, repairs and maintenance, transportation and travel, security, and insurance.
Retentions payable pertains to 10% retention from the contractors’ progress billings which will be later released after the completion of contractors’ project. The 10% retention serves as a security from the contractor should there be defects in the project.
Commissions payable pertain to fees paid to brokers for services rendered.
Accounts payable - buyer pertain to refunds related to the cancellation of contract to sell agreement in which a reasonable refund is required by the Maceda Law and excess of payments for accounts settled by bank financing.
Others include amounts pertaining to other non-trade liabilities.
VISTA LAND & LIFESCAPES, INC. AND SUBSIDIARIESNOTES TO CONSOLIDATED FINANCIAL STATEMENTS

Vista LandA N N U A L R E P O R T11
VISTA LAND ANNUAL REPORT 2011 105
- 40 -
18. Customers’ Advances and Deposits
This account consists of customers’ downpayments, reservation fees and excess of collections over the recognized receivables based on percentage of completion.
The Group requires buyers of residential houses and lots to pay a minimum percentage of the total selling price before the two parties enter into a sale transaction. In relation to this, the customers’ advances and deposits represent payment from buyers which have not reached the minimum required percentage. When the level of required payment is reached by the buyer, a sale is recognized and these deposits and downpayments will be applied against the related installment contracts receivable.
19. Bank Loans and Loans Payable
Bank Loans
Bank loans pertain to the borrowings of the Group from various local financial institutions. Further analysis is provided below:
2011 2010 Parent company P=3,714,758,400 P=2,268,305,400 Subsidiaries 417,854,684 448,925,900 4,132,613,084 2,717,231,300 Less current portion 1,730,351,181 398,831,528 P=2,402,261,903 P=2,318,399,772
On various dates in 2011, the Parent Company obtained P=1,500.00 million peso-denominated bank loans from a local bank which bear fixed interest rate of 5.50% and secured by a holdout on the US dollar deposits amounting to US$73.50 million (see Note 7).
The Parent Company obtained a peso-denominated bank loan from a local bank amounting to P=270.00 million which bears fixed interest rate of 7.50% and will mature on November 18, 2010. The loan is secured by a real estate mortgage over certain properties of CAPI with a carrying value amounting to P=450.00 million. On November 11, 2011, the Parent Company renewed the term loan with the local bank with interest at 6.00% and will mature on June 15, 2012.
On July 30, 2010, the Parent Company obtained a peso-denominated bank loan from a local bank amounting to P=207.34 million which bear fixed interest rate of 8.39% and will mature on July 30, 2013. The loan is secured by real estate mortgage of certain properties of Brittany and CAPI with a carrying value amounting to P=207.90 million and P=296.20 million in 2011 and 2010, respectively (see Note 9). As of December 31, 2011, the balance of the loan is P=145.53 million.
On November 2, 2010, the Parent Company obtained a peso-denominated bank loan from a local bank amounting to P=199.23 million which bear fixed interest rate of 7.83% and will mature on October 31, 2013. The loan is secured by real estate mortgage of certain properties of Brittany and CAPI with a book value amounting to P=284.61 million (see Note 9).

106 VISTA LAND
- 41 -
On December 9, 2010, the Parent Company obtained a peso-denominated bank loan from a local bank amounting to P=1,600.00 million which bear fixed interest rate of 6.50% and will mature on December 6, 2015. The loan is secured by a hold-out on the US dollar deposits amounting to US$40.00 million (see Note 7).
The bank loans of the Parent Company and certain subsidiaries provide for certain restrictions and requirements with respect to, among others, payment of dividends, incurrence of additional liabilities, investment and guaranties, mergers or consolidations or other material changes in their ownership, corporate set-up or management, acquisition of treasury stock, disposition and mortgage of assets and maintenance of financial ratios at certain levels. These restrictions and requirements were complied with by the Group as of December 31, 2011 and 2010.
Banks loans amounting to P=25.97 million and P=10.67 million as of December 31, 2011 and 2010, respectively, were secured by a chattel mortgage on the Group’s transportation equipment (see Note 14).
Loans Payable Loans payable pertain to sold “Installment contracts receivable” of Subsidiaries as discussed in Note 8 to the consolidated financial statements. These loans bear fixed interest rates ranging from 7.00% to 12.00% in 2011, 9.50% to 13.00% in 2010 and 5.00% to 14.00% in 2009, payable on equal monthly installments over a maximum period of 3 to 15 years depending on the terms of the installment contracts receivables.
20. Liabilities for Purchased Land
Liabilities for purchased land are payables to various real estate property sellers. Under the terms of the agreements executed by the Group covering the purchase of certain real estate properties, the titles of the subject properties shall be transferred to the Group only upon full payment of the real estate loans.
On various dates in 2011 and 2010 the Group acquired certain land properties which are payable over a period of one to three years. Such liabilities for purchased land with a nominal amount of P=1,139.85 million were initially recorded at fair value resulting to a discount of P=206.37 million. The fair value is derived using the discounted cash flow model using the discount rate ranging from 6.29% to 10.00% with effective interest rate ranging from 5.92% to 9.84%. The unamortized discount amounted to P=18.01 million and P=19.54 million as of December 31, 2011 and 2010, respectively.
Accretion of P=16.32 million, P=11.57 million and P=60.16 million is recorded as interest expense in 2011, 2010 and 2009, respectively (see Note 24).
VISTA LAND & LIFESCAPES, INC. AND SUBSIDIARIESNOTES TO CONSOLIDATED FINANCIAL STATEMENTS

Vista LandA N N U A L R E P O R T11
VISTA LAND ANNUAL REPORT 2011 107
- 42 -
21. Notes Payable
On September 30, 2010, the Parent Company issued US$100.00 million notes (the Notes) with a term of five years from the issue date. The interest rate is 8.25% per annum payable semi-annually in arrears on March 30 and September 30 of each year commencing on March 30, 2011.
On March 30, 2011, an additional note, with the same terms and conditions with the above notes, were issued by the Parent Company amounting to US$75.00 million.
The Notes are unconditionally and irrevocably guaranteed by the subsidiaries of the Parent Company. Other pertinent provisions of the Notes follow:
Redemption at the option of noteholders The Parent Company will, at the option of any noteholder, redeem such Note on September 30, 2013 at its principal amount.
Redemption at the option of the issuer At any time prior to September 30, 2013, the Parent Company may redeem up to 35% of the aggregate principal amount of the Notes originally issued at a redemption price equal to 108.25% of the principal amount, plus accrued and unpaid interest, if any, to the date of redemption with the net cash proceeds of an equity offering; provided that: (i) at least 65% of the aggregate principal amount of Notes originally issued remains outstanding immediately after the occurrence of such redemption and (ii) the redemption occurs within 60 days of the date of the closing of such equity offering.
Covenants The Notes provide for the Parent Company and Subsidiaries to observe certain covenants including, among others, incurrence of additional debt; grant of security interest; payment of dividends; mergers, acquisitions and disposals; and certain other covenants. These were complied with by the Group as of December 31, 2011 and 2010.
22. Long-term Notes
The Long-Term Notes (LTN) is payable over 15 years, was initially recorded at present value of P=1.29 billion (US$26.52 million) with discount amounting to P=982.00 million (US$20.25 million). The LTN was translated to Philippine peso using the USD/Peso foreign exchange rate as of December 31 and January 1, 2009 of P=46.20 and P=47.52 to US$1.00, respectively. This resulted to a foreign exchange gain of P=1.89 million in 2010 and foreign exchange loss of P=0.61 million in 2009 which are presented in profit or loss.
Interest rates for LTNs range from 1.00% to 5.00% over certain contractual periods with effective interest rate of 8.59%.
The total amount of interest expense recognized in 2011, 2010 and 2009 pertaining to accretion of LTNs amounted to nil, P=16.32 million and P=62.72 million, respectively (see Note 24).

108 VISTA LAND
- 43 -
In 2009, the Group settled LTNs amounting to P=1,019.77 million (US$28.53 million) which resulted to a loss amounting to P=318.81 million presented under “Loss on settlement of loans” in profit or loss pertaining to the unamortized discount of the settled amount.
In 2010, the LTNs were fully settled which resulted to a loss amounting to
P=115.87 million. 23. Equity
Capital Stock The details of the Parent Company’s capital stock follow:
2011 2010 2009 Common Authorized shares 11,000,000,000 11,000,000,000 12,000,000,000 Par value per share P=1.00 P=1.00 P=1.00 Issued shares 8,538,740,614 8,538,740,614 8,538,740,614 Treasury shares 39,643,000 – – Preferred Authorized shares 10,000,000,000 10,000,000,000 – Par value per share P=0.10 P=0.10 P=– Issued shares – – –
On August 13, 2010, the BOD approved the reclassification of 1.0 billion unissued common shares with a par value of P=1.00 per share into 10.0 billion new preferred shares with a par value of P=0.10 per share and the amendment of the Parent Company’s Articles of Incorporation to reflect the reclassification of the unissued common shares into new preferred shares. On September 27, 2010, the Parent Company’s stockholders ratified the reclassification.
On November 24, 2010, the SEC approved the amendments to the Parent Company’s Articles of Incorporation embodying the reclassification of the unissued common shares to new preferred shares.
The new preferred shares are voting, cumulative, non-paticipating, non-convertible and non-redeemable. The BOD may determine the dividend rate which shall in no case be more than 10% per annum.
On July 26, 2007, the Parent Company launched its follow-on offer where a total of 8,538,740,614 common shares were offered at an offering price of P=6.85 per share. The registration statement was approved on June 25, 2007. The Parent Company has 1,074 existing certified shareholders as of December 31, 2011.
VISTA LAND & LIFESCAPES, INC. AND SUBSIDIARIESNOTES TO CONSOLIDATED FINANCIAL STATEMENTS
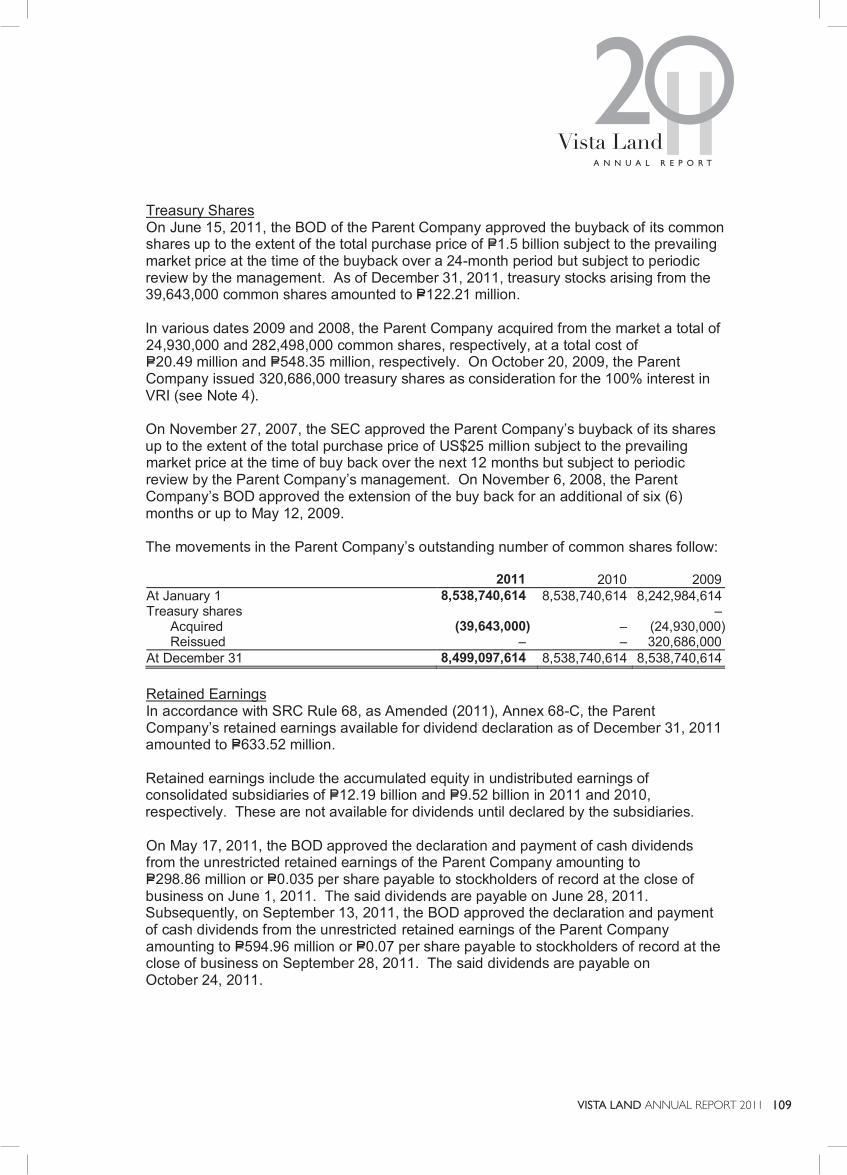
Vista LandA N N U A L R E P O R T11
VISTA LAND ANNUAL REPORT 2011 109
- 44 -
Treasury Shares On June 15, 2011, the BOD of the Parent Company approved the buyback of its common shares up to the extent of the total purchase price of P=1.5 billion subject to the prevailing market price at the time of the buyback over a 24-month period but subject to periodic review by the management. As of December 31, 2011, treasury stocks arising from the 39,643,000 common shares amounted to P=122.21 million.
In various dates 2009 and 2008, the Parent Company acquired from the market a total of 24,930,000 and 282,498,000 common shares, respectively, at a total cost of P=20.49 million and P=548.35 million, respectively. On October 20, 2009, the Parent Company issued 320,686,000 treasury shares as consideration for the 100% interest in VRI (see Note 4).
On November 27, 2007, the SEC approved the Parent Company’s buyback of its shares up to the extent of the total purchase price of US$25 million subject to the prevailing market price at the time of buy back over the next 12 months but subject to periodic review by the Parent Company’s management. On November 6, 2008, the Parent Company’s BOD approved the extension of the buy back for an additional of six (6) months or up to May 12, 2009.
The movements in the Parent Company’s outstanding number of common shares follow:
2011 2010 2009 At January 1 8,538,740,614 8,538,740,614 8,242,984,614 Treasury shares – Acquired (39,643,000) – (24,930,000) Reissued – – 320,686,000 At December 31 8,499,097,614 8,538,740,614 8,538,740,614
Retained Earnings In accordance with SRC Rule 68, as Amended (2011), Annex 68-C, the Parent Company’s retained earnings available for dividend declaration as of December 31, 2011 amounted to P=633.52 million.
Retained earnings include the accumulated equity in undistributed earnings of consolidated subsidiaries of P=12.19 billion and P=9.52 billion in 2011 and 2010, respectively. These are not available for dividends until declared by the subsidiaries.
On May 17, 2011, the BOD approved the declaration and payment of cash dividends from the unrestricted retained earnings of the Parent Company amounting to P=298.86 million or P=0.035 per share payable to stockholders of record at the close of business on June 1, 2011. The said dividends are payable on June 28, 2011. Subsequently, on September 13, 2011, the BOD approved the declaration and payment of cash dividends from the unrestricted retained earnings of the Parent Company amounting to P=594.96 million or P=0.07 per share payable to stockholders of record at the close of business on September 28, 2011. The said dividends are payable on October 24, 2011.

110 VISTA LAND
- 45 -
On September 15, 2010, the BOD approved the declaration and payment of cash dividends from the unrestricted retained earnings of the Parent Company amounting to P=461.09 million or P=0.054 per share payable to stockholders of record at the close of business on September 30, 2010. The said dividends are payable on October 26, 2010.
On November 23, 2009, the BOD approved the cash dividend declaration and payment from the unrestricted retained earnings of the Parent Company of P=281.78 million or P=0.033 per share payable to stockholders of record as of December 8, 2009. The said dividends are payable on December 29, 2009.
Capital Management The primary objective of the Group’s capital management policy is to ensure that debt and equity capital are mobilized efficiently to support business objectives and maximize shareholder value. The Group establishes the appropriate capital structure for each business line that properly reflects its premier credit rating and allows it the financial flexibility, while providing it sufficient cushion to absorb cyclical industry risks.
The Group considers debt as a stable source of funding. The Group lengthened the maturity profile of its debt portfolio and makes it a point to spread out its debt maturities by not having a significant percentage of its total debt maturing in a single year.
The Group manages its capital structure and makes adjustments to it, in the light of changes in economic conditions. It monitors capital using leverage ratios on both a gross debt and net debt basis. As of December 31, 2011 and 2010, the Group had the following ratios:
2011 2010 Current ratio 253% 283% Debt-to-equity ratio 66% 58%
Current Ratio: Obtained by dividing the total current assets by total current liabilities. Debt-to-equity ratio: Obtained by dividing the total liabilities by total equity.
The Group is not subject to externally imposed capital requirements. No changes were made in the objectives, policies or processes for managing capital during the years ended December 31, 2011 and 2010.
The Group considers as capital the equity attributable to equity holders of the Group.
The following table shows the component of the Parent Company’s equity as of December 31, 2011 and 2010:
2011 2010 Total paid-up capital P=27,867,250,474 P=27,867,250,474 Retained earnings 12,943,468,957 10,309,298,685 Treasury shares (122,207,625) – P=40,688,511,806 P=38,176,549,159
VISTA LAND & LIFESCAPES, INC. AND SUBSIDIARIESNOTES TO CONSOLIDATED FINANCIAL STATEMENTS

Vista LandA N N U A L R E P O R T11
VISTA LAND ANNUAL REPORT 2011 111
- 46 -
Financial risk assessment The Group’s financial condition and operating results would not be materially affected by the current changes in liquidity, credit, interest, currency and market conditions.
Credit risks continue to be managed through defined credit policies and continuing monitoring of exposure to credit risks. The Group’s base of counterparties remains diverse. As such, it is not exposed to large concentration of credit risk.
Exposure to changes in interest rates is reduced by regularly availing of short-term loans as it relates to its sold installment contracts receivables in order to cushion the impact of potential increase in loan interest rates.
Exposure to foreign currency holdings are as follows:
2011 2010
Cash and cash equivalents US$2,834,762 US$5,226,653 Short-term cash investments 35,000,000 35,000,000 Long-term cash investments 113,500,000 40,000,000 Notes payable 168,653,847 97,123,734
Liquidity risk is addressed with long-term funding already locked in, while funds are placed on a short term placement.
24. Interest Income and Other Financing Charges
Below are the details of interest income:
2011 2010 2009 Installment contracts receivable P=560,416,037 P=662,124,505 P=655,250,626 Cash, short-term and long-term cash investments 224,132,283 37,345,681 117,361,853 Accretion of unamortized discount (Note
8) 68,564,387 77,651,839 84,683,641 P=853,112,707 P=777,122,025 P=857,296,120
Interest and other financing charges consist of:
2011 2010 2009 Interest expense on:
Bank loans (Note19) P=871,166,749 P=584,561,898 P=478,078,475 Notes payable (Note 21) 747,312,940 178,295,579 – Long term notes (Note 22) – 16,317,745 62,721,408 1,618,479,689 779,175,222 540,799,883
Less amounts capitalized (Note 9) 305,593,326 60,507,791 7,979,118 Add accretion of unamortized discount (Note 20) 16,323,402 11,566,379 60,161,371 P=1,329,209,765 P=730,233,810 P=592,982,136
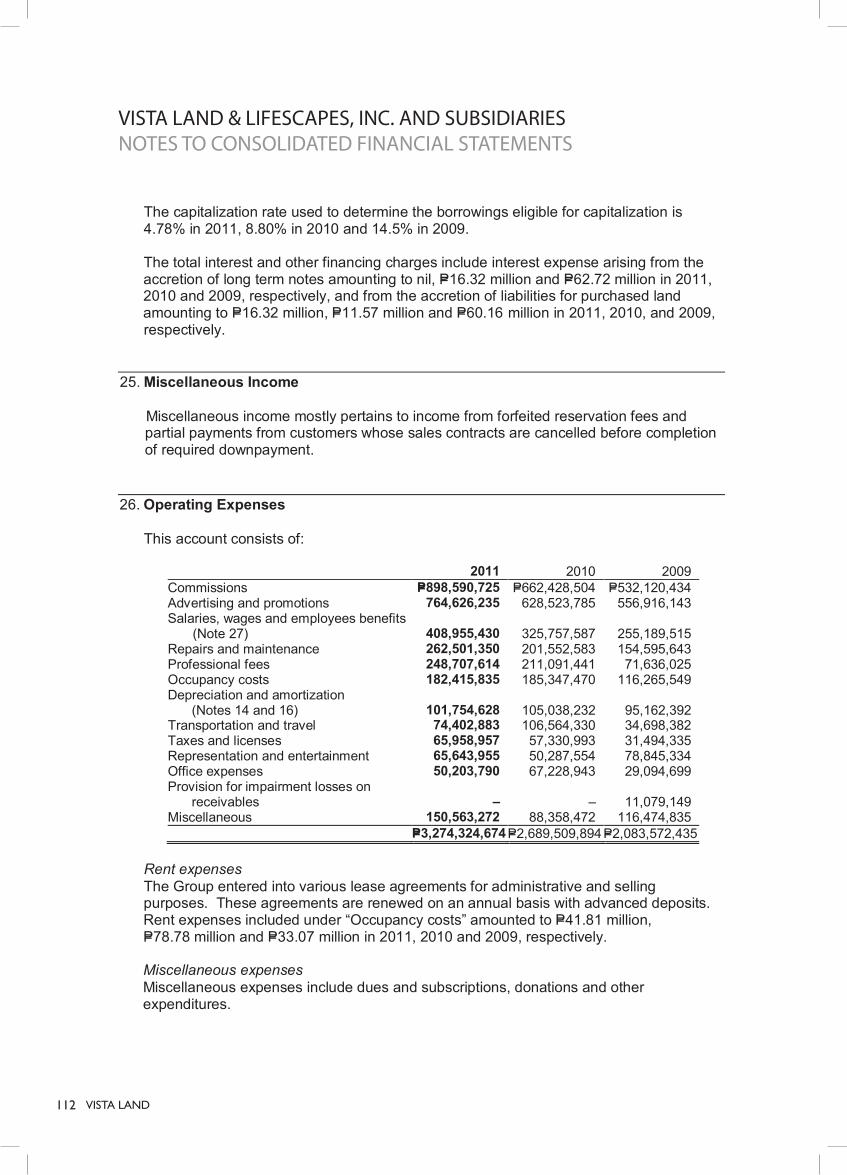
112 VISTA LAND
- 47 -
The capitalization rate used to determine the borrowings eligible for capitalization is 4.78% in 2011, 8.80% in 2010 and 14.5% in 2009.
The total interest and other financing charges include interest expense arising from the accretion of long term notes amounting to nil, P=16.32 million and P=62.72 million in 2011, 2010 and 2009, respectively, and from the accretion of liabilities for purchased land amounting to P=16.32 million, P=11.57 million and P=60.16 million in 2011, 2010, and 2009, respectively.
25. Miscellaneous Income
Miscellaneous income mostly pertains to income from forfeited reservation fees and partial payments from customers whose sales contracts are cancelled before completion of required downpayment.
26. Operating Expenses
This account consists of:
2011 2010 2009 Commissions P=898,590,725 P=662,428,504 P=532,120,434 Advertising and promotions 764,626,235 628,523,785 556,916,143 Salaries, wages and employees benefits
(Note 27) 408,955,430 325,757,587 255,189,515 Repairs and maintenance 262,501,350 201,552,583 154,595,643 Professional fees 248,707,614 211,091,441 71,636,025 Occupancy costs 182,415,835 185,347,470 116,265,549 Depreciation and amortization (Notes 14 and 16) 101,754,628 105,038,232 95,162,392 Transportation and travel 74,402,883 106,564,330 34,698,382 Taxes and licenses 65,958,957 57,330,993 31,494,335 Representation and entertainment 65,643,955 50,287,554 78,845,334 Office expenses 50,203,790 67,228,943 29,094,699 Provision for impairment losses on receivables – – 11,079,149 Miscellaneous 150,563,272 88,358,472 116,474,835 P=3,274,324,674 P=2,689,509,894 P=2,083,572,435
Rent expenses
The Group entered into various lease agreements for administrative and selling purposes. These agreements are renewed on an annual basis with advanced deposits. Rent expenses included under “Occupancy costs” amounted to P=41.81 million, P=78.78 million and P=33.07 million in 2011, 2010 and 2009, respectively.
Miscellaneous expenses
Miscellaneous expenses include dues and subscriptions, donations and other expenditures.
VISTA LAND & LIFESCAPES, INC. AND SUBSIDIARIESNOTES TO CONSOLIDATED FINANCIAL STATEMENTS

Vista LandA N N U A L R E P O R T11
VISTA LAND ANNUAL REPORT 2011 113
- 48 -
27. Retirement Plan
The Group has noncontributory defined benefit pension plan covering substantially all of its regular employees. The benefits are based on current salaries and years of service and compensation on the last year of employment.
The principal actuarial assumptions used to determine the pension benefits with respect to the discount rate, salary increases and return on plan assets were based on historical and projected normal rates.
The components of pension cost (included in “Salaries, wages and employees benefits” under Operating expenses) in profit or loss are as follows (see Note 26):
2011 2010 2009 Current service cost P=41,421,300 P=27,841,800 P=7,842,200 Interest cost on benefit obligation 22,062,900 16,864,401 4,300,000 Expected return on plan assets (3,597,700) – – Net actuarial losses (gains) immediately recognized (10,433,896) 37,007,700 116,433,600 Total pension expense P=49,452,604 P=81,713,901 P=128,575,800
Funded status and amounts recognized in the consolidated statement of financial position for the pension plan follow:
2011 2010 Defined benefit obligation P=286,591,400 P=232,154,800 Plan assets (129,169,900) (71,205,104) Liability recognized in the consolidated statement of
financial position P=157,421,500 P=160,949,696 Actual return on plan assets P=4,983,996 P=–
Changes in the combined present value of the combined defined benefit obligation are as follows:
2011 2010 Balance at beginning of year P=232,154,800 P=150,440,899 Current service cost 41,421,300 27,841,800 Interest cost on benefit obligation 22,062,900 16,864,401 Actuarial loss (gain) (9,047,600) 37,007,700 Balance at end of year P=286,591,400 P=232,154,800
Changes in the fair value of the combined plan assets are as follows:
2011 2010 Balance at January 1 P=71,205,104 P=17,986,869 Expected return on plan assets 3,597,700 – Contributions by employer 52,980,800 53,218,235 Actuarial gain 1,386,296 – Balance at December 31 P=129,169,900 P=71,205,104

114 VISTA LAND
- 49 -
The movements in the combined net pension liabilities follow:
2011 2010 Balance at beginning of year P=160,949,696 P=132,454,030 Pension expense 49,452,604 81,713,901 Actual contribution (52,980,800) (53,218,235) Balance at end of year P=157,421,500 P=160,949,696
The assumptions used to determine the pension benefits for the Group are as follows:
2011 2010 Discount rates 9.52% 7.24-9.52% Salary increase rate 11.00% 11.00% Expected rate of return on plan assets 5.00% 5.00%
The plan assets of the Group consists of savings and time deposit accounts with a certain local bank amounting to P=124.19 million and P=71.21 million as of December 31, 2011 and 2010, respectively.
The overall expected rate of return on assets is determined based on the market prices prevailing on that date, applicable to the period over which the obligation is to be settled.
Amounts for the current and previous annual periods are as follows:
2011 2010 2009 2008 2007 Defined benefit obligation P=286,591,400 P=232,154,800 P=150,440,899 P=14,776,999 P=100,044,935 Plan assets (129,169,900) (71,205,104) (17,986,869) – – Excess P=157,421,500 P=160,949,696 P=132,454,030 P=14,776,999 P=100,044,935
Gains (losses) on experience adjustments are as follows:
2011 2010 2009 2008 2007 Defined benefit obligation (P=43,004,100) P=27,762,700 P=1,526,400 P=2,245,300 P=33,714,009 Plan assets 1,386,296 – – – –
The Group expects to contribute P=70.69 million to its retirement fund in 2012. 28. Income Tax
Provision for income tax consists of:
2011 2010 2009 Current: RCIT/MCIT P=319,599,409 P=315,090,215 P=247,963,063 Final 18,020,227 6,699,961 25,691,629 Deferred (271,705,328) (101,044,496) 239,821,255 P=65,914,308 P=220,745,680 P=513,475,947
VISTA LAND & LIFESCAPES, INC. AND SUBSIDIARIESNOTES TO CONSOLIDATED FINANCIAL STATEMENTS
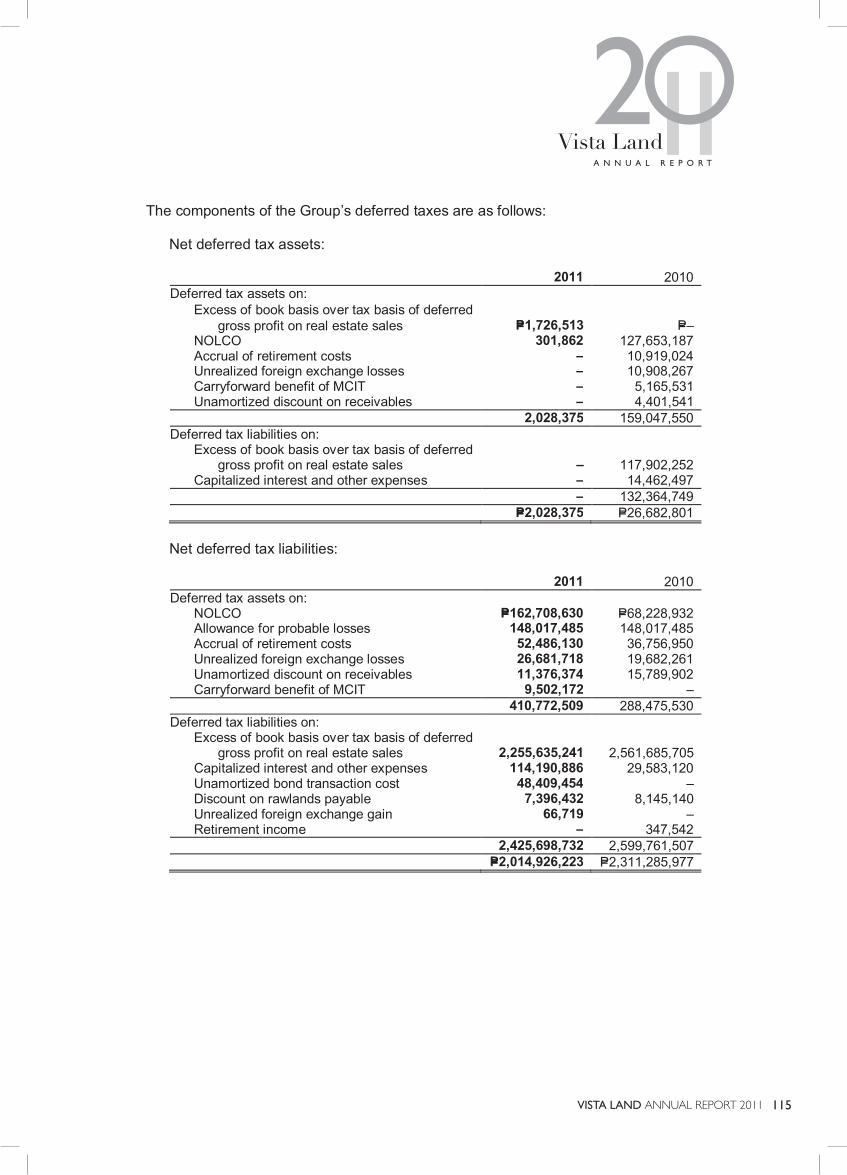
Vista LandA N N U A L R E P O R T11
VISTA LAND ANNUAL REPORT 2011 115
- 50 -
The components of the Group’s deferred taxes are as follows:
Net deferred tax assets:
2011 2010 Deferred tax assets on: Excess of book basis over tax basis of deferred gross profit on real estate sales P=1,726,513 P=– NOLCO 301,862 127,653,187 Accrual of retirement costs – 10,919,024 Unrealized foreign exchange losses – 10,908,267 Carryforward benefit of MCIT – 5,165,531 Unamortized discount on receivables – 4,401,541 2,028,375 159,047,550 Deferred tax liabilities on: Excess of book basis over tax basis of deferred gross profit on real estate sales – 117,902,252 Capitalized interest and other expenses – 14,462,497 – 132,364,749 P=2,028,375 P=26,682,801
Net deferred tax liabilities:
2011 2010 Deferred tax assets on: NOLCO P=162,708,630 P=68,228,932 Allowance for probable losses 148,017,485 148,017,485 Accrual of retirement costs 52,486,130 36,756,950 Unrealized foreign exchange losses 26,681,718 19,682,261 Unamortized discount on receivables 11,376,374 15,789,902 Carryforward benefit of MCIT 9,502,172 – 410,772,509 288,475,530 Deferred tax liabilities on: Excess of book basis over tax basis of deferred gross profit on real estate sales 2,255,635,241 2,561,685,705 Capitalized interest and other expenses 114,190,886 29,583,120 Unamortized bond transaction cost 48,409,454 – Discount on rawlands payable 7,396,432 8,145,140 Unrealized foreign exchange gain 66,719 – Retirement income – 347,542 2,425,698,732 2,599,761,507 P=2,014,926,223 P=2,311,285,977

116 VISTA LAND
- 51 -
As of December 31, 2011 and 2010, the Group has deductible temporary differences, NOLCO and MCIT that are available for offset against future taxable income for which no deferred tax assets have been recognized as follows:
2011 2010 NOLCO P=1,528,485,141 P=672,935,346 Allowance for obsolescence on undeveloped land 839,183,299 839,183,299 Unrealized foreign exchange loss 67,974,187 16,047,290 Accrual of retirement cost 25,794,846 40,186,710 MCIT 2,408,694 978,940 Unamortized discount on receivables – 290,139
Deferred tax assets are recognized only to the extent that taxable income will be available against which the deferred tax assets can be used. The subsidiaries will recognize a previously unrecognized deferred tax asset to the extent that it has become probable that future taxable income will allow the deferred tax asset to be recovered.
As of December 31, 2011, the details of the unused tax credits from the excess of the MCIT over RCIT and NOLCO, which are available for offset against future income tax payable and taxable income, respectively, over a period of three (3) years from the year of inception, follow:
NOLCO
Inception Year Amount Used/Expired Balance Expiry Year 2008 P=73,794,155 (P=73,794,155) P=– 2011 2009 355,123,730 (66,556,471) 288,567,259 2012 2010 835,044,687 – 835,044,687 2013 2011 948,241,501 – 948,241,501 2014 P=2,212,204,073 (P=140,350,626) P=2,071,853,447
MCIT
Inception Year Amount Used/Expired Balance Expiry Year 2008 P=1,973,621 (P=1,973,621) P=– 2011 2009 1,919,014 – 1,919,014 2012 2010 2,202,884 – 2,202,884 2013 2011 7,788,968 – 7,788,968 2014 P=13,884,487 (P=1,973,621) P=11,910,866
VISTA LAND & LIFESCAPES, INC. AND SUBSIDIARIESNOTES TO CONSOLIDATED FINANCIAL STATEMENTS

Vista LandA N N U A L R E P O R T11
VISTA LAND ANNUAL REPORT 2011 117
- 52 -
The reconciliation of the provision for income tax computed at the statutory income tax rate to the provision for income tax shown in profit or loss follows:
2011 2010 2009 Provision for income tax computed at the statutory income tax rate 30.00% 30.00% 30.00% Additions to (reductions in) income tax resulting from: Nondeductible interest and other expenses 4.80% 0.06% 1.09% Change in unrecognized deferred tax assets 0.82% 3.03% 4.09% Tax-exempt income (25.03%) (16.46%) (13.45%) Expired MCIT and NOLCO (2.26%) 0.00% – Interest income already subjected to final tax (1.06%) (0.10%) (2.98%) Equity in net loss (income) of an associate 0.05% (0.02%) (0.49%) Others (5.49%) (9.68%) – Provision for income tax 1.83% 6.83% 18.26%
Board of Investments (BOI) Incentives On various dates in 2011, the BOI issued in favor of certain subsidiaries in the Group a Certificate of Registration as a New Developer of Mass Housing Project for its 13 real estate projects in accordance with the Omnibus Investment Code of 1987. Pursuant thereto, the projects has been granted an Income Tax Holiday for a period of three years commencing from 2011 until 2014.
29. Related Party Transactions
Parties are considered to be related if one party has the ability, directly or indirectly, to control the other party in making financial and operating decisions or the parties are subject to common control or common significant influence (referred to herein as “affiliates”). Related parties may be individuals or corporate entities.
The Group in their regular conduct of business has entered into transactions with
affiliates and other related parties principally consisting of advances and reimbursement of expenses and purchase and sale of real estate properties. The Group’s policy is to settle its intercompany receivables and payables on a net basis.
The consolidated statement of financial position include the following amounts resulting from the foregoing transactions which represent amounts receivable (payable) to related parties as of December 31, 2011 and 2010:
2011 2010 Corporate shareholders (P=403,915,224) (P=472,312,762) Other affiliates 221,112,857 86,563,552 (P=182,802,367) (P=385,749,210)

118 VISTA LAND
- 53 -
Outstanding balances at year-end are unsecured, interest free and settlement occurs in
cash. As of December 31, 2011 and 2010, the Parent Company has not made any provision for impairment loss relating to amounts owed by related parties. This assessment is undertaken each financial year by examining the financial position of the related party and the market in which the related party operates.
There are balances and transactions within the Group, principally consisting of dividends,
advances, reimbursement of expenses and management income, which are eliminated in full.
Except as stated in Notes 19 and 21 to the consolidated financial statements, there have
been no guarantees provided or received for any related party receivables or payables. The compensation of key management personnel by benefit type follows:
2011 2010 2009 Short-term employee benefits P=75,680,388 P=68,100,110 P=61,840,600 Post-employment benefits 12,080,609 10,746,910 9,656,000 P=87,760,997 P=78,847,020 P=71,496,600
30. Earnings Per Share
The following table presents information necessary to compute the EPS:
2011 2010 2009 Basic and Diluted Earnings Per Share a) Net income attributable to equity
holders of Parent P=3,527,984,027 P=3,012,973,097 P=2,299,408,170 b) Weighted average common shares 8,447,852,961 8,461,038,074 8,276,175,614 c) Earnings per share (a/b) P=0.418 P=0.356 P=0.278
In 2011, the acquired treasury shares and reciprocal holdings attributable to PPHI’s ownership in the Parent Company are deducted from the total outstanding shares in computing for the weighted average number of outstanding common shares (see Notes 1 and 23). In 2010 and 2009, the reciprocal holdings attributable to PPHI’s ownership in the Parent Company is deducted from the total outstanding shares in computing for the weighted average number of outstanding common shares.
There were no dilutive potential common shares for the year ended December 31, 2011, 2010 and 2009.
VISTA LAND & LIFESCAPES, INC. AND SUBSIDIARIESNOTES TO CONSOLIDATED FINANCIAL STATEMENTS
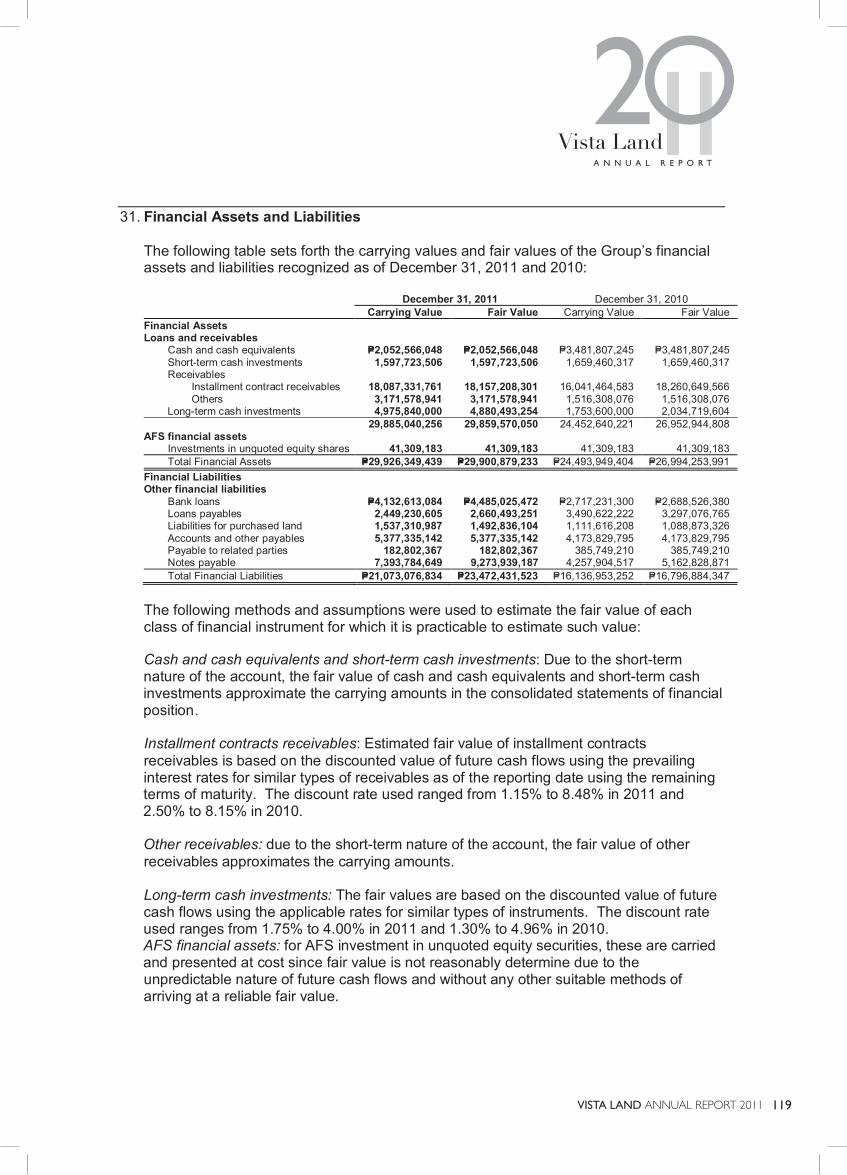
Vista LandA N N U A L R E P O R T11
VISTA LAND ANNUAL REPORT 2011 119
- 54 -
31. Financial Assets and Liabilities
The following table sets forth the carrying values and fair values of the Group’s financial assets and liabilities recognized as of December 31, 2011 and 2010:
December 31, 2011 December 31, 2010 Carrying Value Fair Value Carrying Value Fair Value Financial Assets Loans and receivables Cash and cash equivalents P=2,052,566,048 P=2,052,566,048 P=3,481,807,245 P=3,481,807,245 Short-term cash investments 1,597,723,506 1,597,723,506 1,659,460,317 1,659,460,317 Receivables Installment contract receivables 18,087,331,761 18,157,208,301 16,041,464,583 18,260,649,566 Others 3,171,578,941 3,171,578,941 1,516,308,076 1,516,308,076 Long-term cash investments 4,975,840,000 4,880,493,254 1,753,600,000 2,034,719,604 29,885,040,256 29,859,570,050 24,452,640,221 26,952,944,808 AFS financial assets Investments in unquoted equity shares 41,309,183 41,309,183 41,309,183 41,309,183
Total Financial Assets P=29,926,349,439 P=29,900,879,233 P=24,493,949,404 P=26,994,253,991 Financial Liabilities Other financial liabilities Bank loans P=4,132,613,084 P=4,485,025,472 P=2,717,231,300 P=2,688,526,380 Loans payables 2,449,230,605 2,660,493,251 3,490,622,222 3,297,076,765 Liabilities for purchased land 1,537,310,987 1,492,836,104 1,111,616,208 1,088,873,326 Accounts and other payables 5,377,335,142 5,377,335,142 4,173,829,795 4,173,829,795 Payable to related parties 182,802,367 182,802,367 385,749,210 385,749,210 Notes payable 7,393,784,649 9,273,939,187 4,257,904,517 5,162,828,871
Total Financial Liabilities P=21,073,076,834 P=23,472,431,523 P=16,136,953,252 P=16,796,884,347
The following methods and assumptions were used to estimate the fair value of each class of financial instrument for which it is practicable to estimate such value:
Cash and cash equivalents and short-term cash investments: Due to the short-term nature of the account, the fair value of cash and cash equivalents and short-term cash investments approximate the carrying amounts in the consolidated statements of financial position.
Installment contracts receivables: Estimated fair value of installment contracts receivables is based on the discounted value of future cash flows using the prevailing interest rates for similar types of receivables as of the reporting date using the remaining terms of maturity. The discount rate used ranged from 1.15% to 8.48% in 2011 and 2.50% to 8.15% in 2010.
Other receivables: due to the short-term nature of the account, the fair value of other receivables approximates the carrying amounts.
Long-term cash investments: The fair values are based on the discounted value of future cash flows using the applicable rates for similar types of instruments. The discount rate used ranges from 1.75% to 4.00% in 2011 and 1.30% to 4.96% in 2010. AFS financial assets: for AFS investment in unquoted equity securities, these are carried and presented at cost since fair value is not reasonably determine due to the unpredictable nature of future cash flows and without any other suitable methods of arriving at a reliable fair value.

120 VISTA LAND
- 55 -
The AFS financial assets carried at cost are preferred shares of a utility company issued to the Group as a consequence of its subscription to the electricity services of the said utility company needed for the Group’s residential units. The said preferred shares have no active market and the Group does not intend to dispose these because these are directly related to the continuity of its business.
Payable to related parties: due to the short-term nature of the account, carrying amounts approximate their fair values.
Accounts and other payables: fair values of accounts and other payables approximate their carrying amounts in the consolidated statement of financial position due to the short-term nature of the transactions.
Bank loans, loans payable, notes payable and liabilities for purchased land: estimated fair values of bank loans and liabilities for purchased land are based on the discounted value of future cash flows using the applicable rates for similar types of loans. Interest rates used in discounting cash flows ranges from 5.50% to 13.00% in 2011 and 6.50% to 15.50% in 2010 using the remaining terms to maturity.
The Group uses the following three-level hierarchy for determining and disclosing the fair value of financial instruments by valuation technique:
Level 1: quoted (unadjusted) prices in active markets for identical assets or liabilities; Level 2:other valuation techniques involving inputs other than quoted prices included in
Level 1 that are observable for the asset or liability, either directly or indirectly; and
Level 3: other valuation techniques involving inputs for the asset or liability that are not based on observable market data (unobservable inputs).
The Group has no financial instruments measured at fair value as of December 31, 2011 and 2010.
Financial Risk Management Objectives and Policies Financial risk The Group’s principal financial liabilities comprise of bank loans, loans payable, notes payable, accounts and other payables and liabilities for purchased land. The main purpose of the Group’s financial liabilities is to raise financing for the Group’s operations. The Group has various financial assets such as installment contracts receivables, cash and cash equivalents and short-term and long-term cash investments, which arise directly from its operations. The main risks arising from the use of financial instruments are interest rate risk, foreign currency risk, credit risk and liquidity risk.
The BOD reviews and approves with policies for managing each of these risks. The Group monitors market price risk arising from all financial instruments and regularly report financial management activities and the results of these activities to the BOD.
The Group’s risk management policies are summarized below. The exposure to risk and how they arise, as well as the Group’s objectives, policies and processes for managing the risk and the methods used to measure the risk did not change from prior years.
VISTA LAND & LIFESCAPES, INC. AND SUBSIDIARIESNOTES TO CONSOLIDATED FINANCIAL STATEMENTS
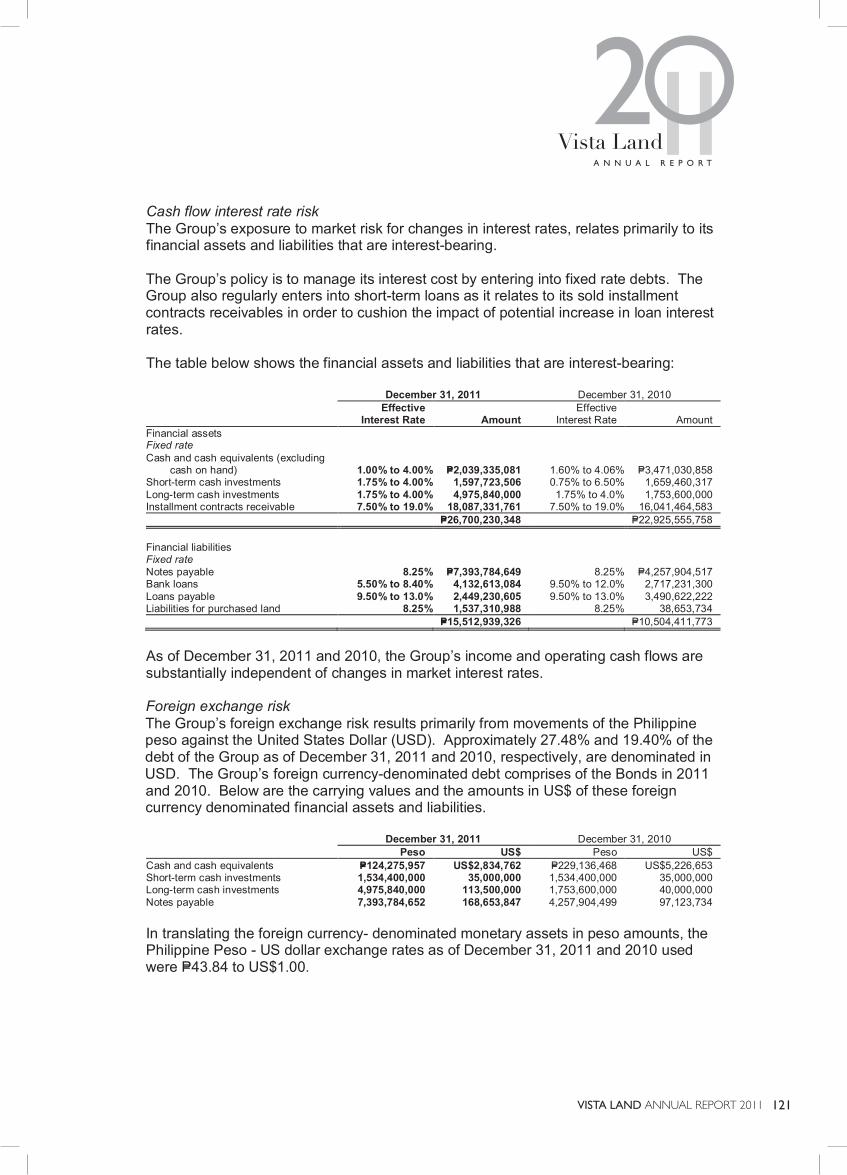
Vista LandA N N U A L R E P O R T11
VISTA LAND ANNUAL REPORT 2011 121
- 56 -
Cash flow interest rate risk The Group’s exposure to market risk for changes in interest rates, relates primarily to its financial assets and liabilities that are interest-bearing.
The Group’s policy is to manage its interest cost by entering into fixed rate debts. The Group also regularly enters into short-term loans as it relates to its sold installment contracts receivables in order to cushion the impact of potential increase in loan interest rates.
The table below shows the financial assets and liabilities that are interest-bearing:
December 31, 2011 December 31, 2010
Effective
Interest Rate Amount Effective
Interest Rate Amount Financial assets Fixed rate Cash and cash equivalents (excluding cash on hand) 1.00% to 4.00% P=2,039,335,081 1.60% to 4.06% P=3,471,030,858 Short-term cash investments 1.75% to 4.00% 1,597,723,506 0.75% to 6.50% 1,659,460,317 Long-term cash investments 1.75% to 4.00% 4,975,840,000 1.75% to 4.0% 1,753,600,000 Installment contracts receivable 7.50% to 19.0% 18,087,331,761 7.50% to 19.0% 16,041,464,583 P=26,700,230,348 P=22,925,555,758 Financial liabilities Fixed rate Notes payable 8.25% P=7,393,784,649 8.25% P=4,257,904,517 Bank loans 5.50% to 8.40% 4,132,613,084 9.50% to 12.0% 2,717,231,300 Loans payable 9.50% to 13.0% 2,449,230,605 9.50% to 13.0% 3,490,622,222 Liabilities for purchased land 8.25% 1,537,310,988 8.25% 38,653,734 P=15,512,939,326 P=10,504,411,773
As of December 31, 2011 and 2010, the Group’s income and operating cash flows are substantially independent of changes in market interest rates.
Foreign exchange risk The Group’s foreign exchange risk results primarily from movements of the Philippine peso against the United States Dollar (USD). Approximately 27.48% and 19.40% of the debt of the Group as of December 31, 2011 and 2010, respectively, are denominated in USD. The Group’s foreign currency-denominated debt comprises of the Bonds in 2011 and 2010. Below are the carrying values and the amounts in US$ of these foreign currency denominated financial assets and liabilities.
December 31, 2011 December 31, 2010 Peso US$ Peso US$ Cash and cash equivalents P=124,275,957 US$2,834,762 P=229,136,468 US$5,226,653 Short-term cash investments 1,534,400,000 35,000,000 1,534,400,000 35,000,000 Long-term cash investments 4,975,840,000 113,500,000 1,753,600,000 40,000,000 Notes payable 7,393,784,652 168,653,847 4,257,904,499 97,123,734
In translating the foreign currency- denominated monetary assets in peso amounts, the Philippine Peso - US dollar exchange rates as of December 31, 2011 and 2010 used were P=43.84 to US$1.00.
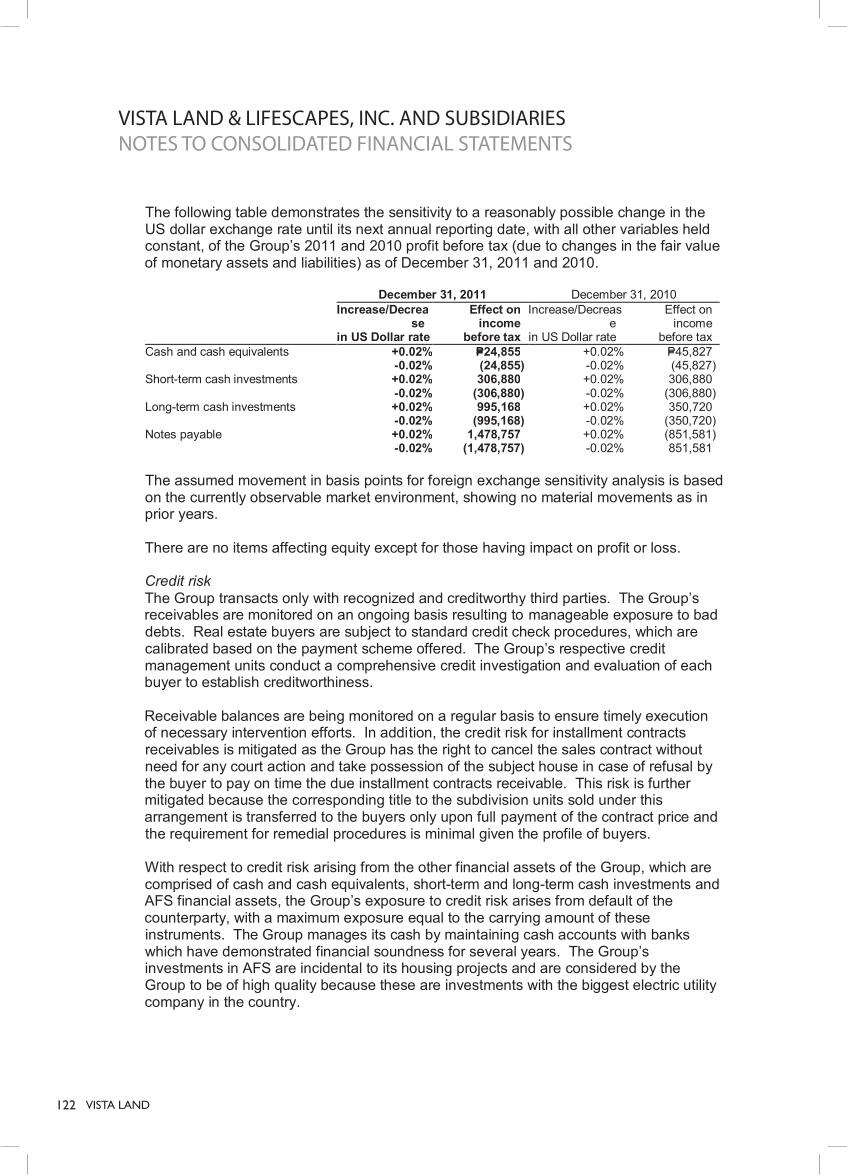
122 VISTA LAND
- 57 -
The following table demonstrates the sensitivity to a reasonably possible change in the US dollar exchange rate until its next annual reporting date, with all other variables held constant, of the Group’s 2011 and 2010 profit before tax (due to changes in the fair value of monetary assets and liabilities) as of December 31, 2011 and 2010.
December 31, 2011 December 31, 2010
Increase/Decrease
in US Dollar rate
Effect on income
before tax
Increase/Decrease
in US Dollar rate
Effect on income
before tax Cash and cash equivalents +0.02% P=24,855 +0.02% P=45,827 -0.02% (24,855) -0.02% (45,827) Short-term cash investments +0.02% 306,880 +0.02% 306,880 -0.02% (306,880) -0.02% (306,880) Long-term cash investments +0.02% 995,168 +0.02% 350,720 -0.02% (995,168) -0.02% (350,720) Notes payable +0.02% 1,478,757 +0.02% (851,581) -0.02% (1,478,757) -0.02% 851,581
The assumed movement in basis points for foreign exchange sensitivity analysis is based on the currently observable market environment, showing no material movements as in prior years.
There are no items affecting equity except for those having impact on profit or loss.
Credit risk The Group transacts only with recognized and creditworthy third parties. The Group’s receivables are monitored on an ongoing basis resulting to manageable exposure to bad debts. Real estate buyers are subject to standard credit check procedures, which are calibrated based on the payment scheme offered. The Group’s respective credit management units conduct a comprehensive credit investigation and evaluation of each buyer to establish creditworthiness.
Receivable balances are being monitored on a regular basis to ensure timely execution of necessary intervention efforts. In addition, the credit risk for installment contracts receivables is mitigated as the Group has the right to cancel the sales contract without need for any court action and take possession of the subject house in case of refusal by the buyer to pay on time the due installment contracts receivable. This risk is further mitigated because the corresponding title to the subdivision units sold under this arrangement is transferred to the buyers only upon full payment of the contract price and the requirement for remedial procedures is minimal given the profile of buyers.
With respect to credit risk arising from the other financial assets of the Group, which are comprised of cash and cash equivalents, short-term and long-term cash investments and AFS financial assets, the Group’s exposure to credit risk arises from default of the counterparty, with a maximum exposure equal to the carrying amount of these instruments. The Group manages its cash by maintaining cash accounts with banks which have demonstrated financial soundness for several years. The Group’s investments in AFS are incidental to its housing projects and are considered by the Group to be of high quality because these are investments with the biggest electric utility company in the country.
VISTA LAND & LIFESCAPES, INC. AND SUBSIDIARIESNOTES TO CONSOLIDATED FINANCIAL STATEMENTS

Vista LandA N N U A L R E P O R T11
VISTA LAND ANNUAL REPORT 2011 123
- 58 -
The table below shows the comparative summary of maximum credit risk exposure on financial assets as of December 31, 2011 and 2010:
2011 2010 Loans and Receivables Cash and cash equivalents (excluding cash on
hand) P=2,039,335,081 P=3,471,030,858 Short-term cash investments 1,597,723,506 1,659,460,317 Receivables Installment contracts receivables 18,087,331,761 16,140,816,767 Others 2,981,989,493 1,731,286,986 Long-term cash investments 4,975,840,000 1,753,600,000
29,682,219,841 24,756,194,928 AFS Financial Assets Investments in unquoted equity shares 41,309,183 41,309,183
P=29,723,529,024 P=24,797,504,111
Given the Group’s diverse base of counterparties, it is not exposed to large concentrations of credit risk.
As of December 31, 2011 and 2010, the aging analyses of past due but not impaired receivables, presented per class are as follows:
December 31, 2011
Neither Past Total of Past Impaired Due Nor Past Due But Not Impaired Due But Not Financial Impaired <30 days 30-60 days 60-90 days >90 days Impaired Assets Total Installment contract receivables P=16,749,821,024 P=748,338,307 P=291,903,690 P=35,921,964 P=161,994,592 P=1,238,158,553 P=99,352,184 P=18,087,331,761 Other receivables 2,743,972,989 7,593,493 3,458,914 758,807 11,226,380 23,037,594 214,978,910 2,981,989,493 Total P=19,493,794,013 P=755,931,800 P=295,362,604 P=36,680,771 P=173,220,972 P=1,261,196,147 P=314,331,094 P=21,069,321,254
December 31, 2010
Neither Past Total of Past Impaired Due Nor Past Due But Not Impaired Due But Not Financial Impaired <30 days 30-60 days 60-90 days >90 days Impaired Assets Total Installment contract receivables P=15,470,729,536 P=127,298,650 P=79,490,473 P=51,557,707 P=312,388,217 P=570,735,047 P=99,352,184 P=16,140,816,767 Other receivables 1,172,844,158 18,231,704 24,277,837 40,898,314 260,056,063 343,463,918 214,978,910 1,731,286,986 Total P=16,643,573,694 P=145,530,354 P=103,768,310 P=92,456,021 P=572,444,280 P=914,198,965 P=314,331,094 P=17,872,103,753
Those accounts that are considered neither past due nor impaired are receivables without any default in payments and those accounts wherein the management has assessed that recoverability is high.

124 VISTA LAND
- 59
-
*SGVMC116984*
The
tabl
es b
elow
sho
w th
e cr
edit
qual
ity o
f the
Gro
up’s
fina
ncia
l ass
ets
as o
f Dec
embe
r 31,
201
1 an
d 20
10, g
ross
of a
llow
ance
for
impa
irmen
t los
ses:
D
ecem
ber 3
1, 2
011
Nei
ther
pas
t due
nor
impa
ired
Pa
st d
ue b
ut
H
igh
grad
e M
ediu
m g
rade
Lo
w g
rade
To
tal
not i
mpa
ired
Impa
ired
Tota
l C
ash
and
cash
equ
ival
ents
(exc
ludi
ng c
ash
on h
and)
P=2
,039
,335
,081
P=–
P=–
P=2
,039
,335
,081
P=–
P=–
P=2
,039
,335
,081
S
hort-
term
cas
h in
vest
men
ts
1,59
7,72
3,50
6 –
– 1,
597,
723,
506
– –
1,59
7,72
3,50
6 R
ecei
vabl
es
Inst
allm
ent c
ontra
cts
rece
ivab
le
16,7
49,8
21,0
24
– –
16,7
49,8
21,0
24
1,23
8,15
8,55
3 99
,352
,184
18
,087
,331
,761
Oth
ers
2,49
0,19
0,77
9 25
3,78
2,21
0 –
2,74
3,97
2,98
9 23
,037
,594
21
4,97
8,91
0 2,
981,
989,
493
Long
-term
cas
h in
vest
men
ts
4,97
5,84
0,00
0 –
– 4,
975,
840,
000
– –
4,97
5,84
0,00
0 To
tal l
oans
and
rece
ivab
les
27,8
52,9
10,3
90
253,
782,
210
– 28
,106
,692
,600
1,
261,
196,
147
314,
331,
094
29,6
82,2
19,8
41
AFS
fina
ncia
l ass
ets
41,3
09,1
83
– –
41,3
09,1
83
– –
41,3
09,1
83
P=2
7,89
4,21
9,57
3 P=2
53,7
82,2
10
P=– P=
28,1
48,0
01,7
83 P=
1,26
1,19
6,14
7 P=3
14,3
31,0
94
P=29,
723,
529,
024
Dec
embe
r 31,
201
0
N
eith
er p
ast d
ue n
or im
paire
d
Pas
t due
but
Hig
h gr
ade
Med
ium
gra
de
Low
gra
de
Tota
l no
t im
paire
d Im
paire
d To
tal
Cas
h an
d ca
sh e
quiv
alen
ts
(e
xclu
ding
cas
h on
han
d)
P=3,4
71,0
30,8
58
P=–
P=–
P=3,4
71,0
30,8
58
P=–
P=–
P=3,4
71,0
30,8
58
Sho
rt-te
rm c
ash
inve
stm
ents
1,
659,
460,
317
– –
1,65
9,46
0,31
7 –
– 1,
659,
460,
317
Rec
eiva
bles
In
stal
lmen
t con
tract
s re
ceiv
able
15
,422
,924
,704
47
,804
,832
–
15,4
70,7
29,5
36
570,
735,
047
99,3
52,1
84
16,1
40,8
16,7
67
O
ther
s 1,
172,
844,
158
– –
1,17
2,84
4,15
8 34
3,46
3,91
8 21
4,97
8,91
0 1,
731,
286,
986
Long
-term
cas
h in
vest
men
ts
1,75
3,60
0,00
0 –
– 1,
753,
600,
000
– –
1,75
3,60
0,00
0 To
tal l
oans
and
rece
ivab
les
23,4
79,8
60,0
37
47,8
04,8
32
23
,527
,664
,869
91
4,19
8,96
5 31
4,33
1,09
4 24
,756
,194
,928
A
FS fi
nanc
ial a
sset
s 41
,309
,183
–
– 41
,309
,183
–
– 41
,309
,183
P=23,
521,
169,
220
P=47,
804,
832
P=– P=
23,5
68,9
74,0
52
P=914
,198
,965
P=3
14,3
31,0
94
P=24,
797,
504,
111
VIST
A L
AN
D &
LIF
ESCA
PES,
INC.
AN
D S
UBS
IDIA
RIES
NO
TES
TO C
ON
SOLI
DAT
ED F
INA
NCI
AL
STAT
EMEN
TS

Vista LandA N N U A L R E P O R T11
VISTA LAND ANNUAL REPORT 2011 125
- 60 -
*SGVMC116984*
High grade cash and cash equivalents and short-term and long-term cash investments are money market placements and working cash fund placed, invested or deposited in local banks belonging to the top ten banks in the Philippines in terms of resources and profitability.
The Group’s high-grade receivables pertain to receivables from related parties and third parties which, based on experience, are highly collectible or collectible on demand, and of which exposure to bad debt is not significant. Installment contract receivables under bank-financing are assessed to be high grade since accounts under bank-financing undergone credit evaluation performed by two parties, the Group and the respective bank, thus credit evaluation underwent a more stringent criteria resulting to higher probability of having good quality receivables.
Medium grade accounts are active accounts with minimal to regular instances of payment default, due to ordinary/common collection issues. These accounts are typically not impaired as the counterparties generally respond to credit actions and update their payments accordingly.
Low grade accounts are accounts which have probability of impairment based on historical trend.
Based on the Group’s experience, its loans and receivables are highly collectible or collectible on demand. The receivables are collateralized by the corresponding real estate properties. In few cases of buyer defaults, the Group can repossess the collateralized properties and held it for sale in the ordinary course of business at the prevailing market price. The total of repossessed properties included in the “Real estate inventories” account in the consolidated statement of financial position amounted to P=589.79 million and P=506.72 million as of December 31, 2011 and 2010, respectively. The Group performs certain repair activities on the said repossessed assets in order to put their condition at a marketable state. Costs incurred in bringing the repossessed assets to its marketable state are included in their carrying amounts.
The Group did not accrue any interest income on impaired financial assets.
Liquidity Risk The Group monitors its cash flow position, debt maturity profile and overall liquidity position in assessing its exposure to liquidity risk. The Group maintains a level of cash deemed sufficient to finance its cash requirements. Operating expenses and working capital requirements are sufficiently funded through cash collections. The Group’s loan maturity profile is regularly reviewed to ensure availability of funding through adequate credit facilities with banks and other financial institutions.
The extent and nature of exposures to liquidity risk and how they arise as well as the Group’s objectives, policies and processes for managing the risk and the methods used to measure the risk are the same for 2011 and 2010.
Maturity Profile of Financial Assets and Liabilities The tables below summarize the maturity profile of the Group’s financial assets and liabilities as of December 31, 2011 and 2010 based on undiscounted contractual payments, including interest receivable and payable.

126 VISTA LAND
- 61 -
*SGVMC116984*
December 31, 2011 On Demand
1 to 3 Months
3 to 12 Months
1 to 5 Years Total
Financial Assets Loans and receivables Cash and cash equivalents P=2,052,566,048 P=– P=– P=– P=2,052,566,048 Short-term cash investments – 63,323,506 657,600,000 876,800,000 1,597,723,506 Receivables Installment contracts receivables 290,331,858 591,072,811 8,383,118,280 8,822,808,812 18,087,331,761 Others 2,844,587,003 6,158,816 131,243,674 – 2,981,989,493 Long-term cash investment – – – 4,975,840,000 4,975,840,000 Total undiscounted financial assets P=5,187,484,909 P=660,555,133 P=9,171,961,954 P=14,675,448,812 P=29,695,450,808 Financial Liabilities Financial liabilities at amortized cost Bank loans P=– P=256,330 P=768,989 P=4,131,587,766 P=4,132,613,085Loans payable 2,064,304 78,099,540 187,724,488 2,181,342,273 2,449,230,605Liabilities for purchased land 328,428,909 730,971,087 405,368,404 72,542,588 1,537,310,988Accounts payable and other payables 39,632,677 68,710,408 128,444,770 5,538,831,024 5,775,618,879Payable to related parties 182,802,367 – – – 182,802,367Notes payable – 5,184,896 13,785,809 7,578,890,910 7,597,861,615Total undiscounted financial liabilities P=552,928,257 P=883,222,261 P=736,092,460 P=19,503,194,561 P=21,675,437,539
December 31, 2010 On Demand
1 to 3 Months
3 to 12 Months
1 to 5 Years Total
Financial Assets Loans and receivables Cash and cash equivalents P=3,441,929,900 P=39,877,345 P=– P=– P=3,481,807,245 Short-term cash investments – 1,659,460,317 – – 1,659,460,317 Receivables Installment contracts receivables 778,760,658 1,385,896,901 3,918,524,149 14,133,134,534 20,216,316,242 Others 1,718,537,842 – 12,749,144 1,731,286,986 Long-term cash investment – – – 2,082,219,836 2,082,219,836 Total undiscounted financial assets P=5,939,228,400 P=3,085,234,563 P=3,931,273,293 P=16,215,354,370 P=29,171,090,626 Financial Liabilities Financial liabilities at amortized cost Bank loans P=48,424,275 P=206,973,448 P=452,862,513 P=2,213,860,533 P=2,922,120,769Loans payable – – 1,567,999,602 2,899,071,372 4,467,070,974Accounts payable and other payables 1,194,706,696 251,026,223 1,939,315,389 788,781,487 4,173,829,795Liabilities for purchased land 346,995,529 116,757,527 374,084,680 294,866,975 1,132,704,711Payable to related parties 385,749,210 – – – 385,749,210Notes payable – 180,103,442 183,088,582 5,795,784,853 6,158,976,877Total undiscounted financial liabilities P=1,975,875,710 P=754,860,640 P=4,517,350,766 P=11,992,365,220 P=19,240,452,336
32. Notes to Consolidated Statements of Cash Flows
The Group’s noncash investing and financing activities pertain to the following:
a) Transfer of real estate inventories in 2011 and 2010 amounting to nil and P=174.01 million, respectively, by a certain related party to the Group which resulted to decrease in available-for-sale financial assets and increase in real estate inventories;
b) Conversion of sold receivables from a “with recourse basis” to “without recourse basis” with total carrying value of P=1,030.05 million and P=1,419.97 million in 2011 and 2010, respectively;
c) Offsetting of long term notes with a due to related party account as payments of long term notes was made by a certain related party amounting to P=554.77 million in 2010;
d) Transfers from land and improvements amounting to real estate inventories amounting to nil, P=863.19 million and P=199.03 million in 2011, 2010 and 2009, respectively; and
VISTA LAND & LIFESCAPES, INC. AND SUBSIDIARIESNOTES TO CONSOLIDATED FINANCIAL STATEMENTS

Vista LandA N N U A L R E P O R T11
VISTA LAND ANNUAL REPORT 2011 127
- 62 -
*SGVMC116984*
e) Purchase of interest from a joint venture partner in exchange for advances to joint
venture partners amounting to P=333.00 million in 2011. 33. Contingencies
The Group has various contingent liabilities from legal cases arising from the ordinary course of business which are either pending decision by the courts or are currently being contested by the Group, the outcome of which are not presently determinable.
In the opinion of the management and its legal counsel, the eventual liability under these lawsuits or claims, if any, will not have a material or adverse effect in the Group’s financial position and results of operations.

128 VISTA LAND
VISTA LAND & LIFESCAPES, INC.
CAMELLA HOMES, INC.
BRITTANy CORPORATION
CROWN ASIA PROPERTIES, INC.
COMMUNITIES PHILIPPINES, INC.
VISTA RESIDENCES, INC.
Registered Address:3rd Level Starmall Las PiñasC.V. Starr Avenue, Pamplona,1746 Las Piñas City,Philippines
Office Address:UGF Worldwide Corporate CenterShaw Boulevard,1552 Mandaluyong CityPhilippines
Tel +63 2 5845308/05Fax +63 2 5845731
www.vistaland.com.ph
South-based Communities3rd Level Metropolis MallAlabang, Muntinlupa CityPhilippines
Tel +63 2 7721096Fax +63 2 7721093
North-based CommunitiesUGF Worldwide Corporate CenterShaw Boulevard,1552 Mandaluyong CityPhilippines
Tel +63 2 5313486 ext 101Fax +63 2 5341377 ext 102
East-based CommunitiesUGF Worldwide Corporate CenterShaw Boulevard,1552 Mandaluyong CityPhilippines
Tel +63 2 5313486 ext 101 +63 2 5841176Fax +63 2 5341377 ext 102 +63 2 5841178
www.camella.com.ph
2nd Floor, The Marfori TowerLakefront, East Service Road,Sucat, 1770 Muntinlupa City,Philippines
Tel +63 2 7949988 to 94Fax +63 2 7949995
www.brittany.com.ph
2nd Floor The Wharf at LakefrontKm. 20 East Service Road, Sucat1770 Muntinlupa CityPhilippines
Tel +63 2 8661582Fax +63 2 8371408
www.crownasia.com.ph
UGF Worldwide Corporate CenterShaw Boulevard,1552 Mandaluyong CityPhilippines
Tel +63 2 5313486 ext 107Fax +63 2 5341377 ext 103
www.camella.com.ph
UGF Worldwide Corporate CenterShaw Boulevard,1552 Mandaluyong CityPhilippines
Tel +63 2 5841176 +63 2 5841183Fax +63 2 5841178
www.vistaresidences.com.ph
S hareho derI nformation
l

Institutional Investor Inquiries
For inquiries please write or call Vista Land & Lifescapes, Inc.’s
Investor Relations Group.
UGF Worldwide Corporate Center
Shaw Boulevard
1552 Mandaluyong City
Philippines
Tel: +63 2 5845730 ext 108
Fax: +63 2 5845731
Shareholder Servicesand Assistance
For inquiries regarding dividend payments,
change of address and account status, lost or
damaged stock certificates, please write or call:
Securities Transfer Services, Inc.
G/F Benpres Building
Exchange Road corner Meralco Avenue
Ortigas Center, Pasig City
Metro Manila, Philippines
Tel: +63 2 4900060
Fax: +63 2 6317148
Concept, Content Design and Layout:
ArtOne Design & Communications, Inc.
Photography: Edwin Tuyay