Evaluation of three different regional climate change scenarios for the application of a water...
8
Adv. Geosci., 27, 57–64, 2010 www.adv-geosci.net/27/57/2010/ doi:10.5194/adgeo-27-57-2010 © Author(s) 2010. CC Attribution 3.0 License. Advances in Geosciences Evaluation of three different regional climate change scenarios for the application of a water balance model in a mesoscale catchment in Northeast Germany M. Wegehenkel 1 , U. Heinrich 2 , H. Jochheim 1 , K. C. Kersebaum 1 , and B. R ¨ ober 2 1 Leibniz-Cetre for Agricultural Landscape Research (ZALF) e.V., Institute of Landscape Systems Analysis, M¨ uncheberg, Germany 2 Leibniz-Cetre for Agricultural Landscape Research (ZALF) e.V., Department of Landscape Information Systems, M¨ uncheberg, Germany Received: 14 January 2010 – Revised: 21 May 2010 – Accepted: 30 May 2010 – Published: 27 August 2010 Abstract. Future climate changes might have some impacts on catchment hydrology. An assessment of such impacts on e.g. ground water recharge is required to derive adaptation strategies for future water resources management. The main objective of our study was an analysis of three different re- gional climate change scenarios for a catchment with an area of 2415 km 2 located in the Northeastern German lowlands. These data sets consist of the STAR-scenario with a time pe- riod 1951–2055, the WettReg-scenario covering the period 1961–2100 and the grid based REMO-scenario for the time span 1950–2100. All three data sets are based on the SRES scenario A1B of the IPCC. In our analysis, we compared the meteorological data for the control period obtained from the regional climate change scenarios with corresponding data measured at meteorological stations in the catchment. The results of this analysis indicated, that there are high differ- ences between the different regional climate change scenar- ios regarding the temporal dynamics and the amount of pre- cipitation. In addition, we applied a water balance model using input data obtained from the different climate change scenarios and analyzed the impact of these different input data on the model output groundwater recharge. The results of our study indicated, that these regional climate change sce- narios due to the uncertainties in the projections of precipi- tation show only a limited suitability for hydrologic impact analysis used for the establishment of future concrete water management procedures in their present state. Correspondence to: M. Wegehenkel ([email protected]) 1 Introduction Future climate changes may lead to changes of the hydro- logical conditions of a catchment such as long-term wa- ter availability, ground water recharge or drought periods. Therefore, a reliable estimation of the impacts of climate change on catchment hydrology is required to develop adap- tation strategies in water resources management. Such stud- ies were carried out in different river basins across Europe using hydrological models and regional climate change sce- narios (e.g. Caballero et al., 2007; de Witt et al., 2007; Hat- termann et al., 2008). In the last decade, a large amount of such regional climate change scenarios using different global and regional climate models depending on different IPCC- SRES-emission scenarios were developed (e.g. Deque et al., 2007). However, the results of different regional climate change scenarios for even one IPCC-SRES scenario such as A1B showed uncertainties depending on the selected re- gional as well as global climate model (e.g. Deque et al., 2007; Minville et al., 2008). This indicates, that regional climate projections should be evaluated regarding their suit- ability for hydrological impact analysis (e.g. Bronstert et al., 2007). The primary goal of our study was a comparison of three different regional climate change projections for the purpose of a model based hydrological impact analysis in a mesoscale catchment located in the Northeastern German lowlands. We applied a water balance model using meteorological input data obtained from these different climate change projections in that catchment and carried out a first preliminary analysis of the impact of these different meteorological input data on some model outputs such as ground water recharge. Published by Copernicus Publications on behalf of the European Geosciences Union.
Transcript of Evaluation of three different regional climate change scenarios for the application of a water...

Adv. Geosci., 27, 57–64, 2010www.adv-geosci.net/27/57/2010/doi:10.5194/adgeo-27-57-2010© Author(s) 2010. CC Attribution 3.0 License.
Advances inGeosciences
Evaluation of three different regional climate change scenarios forthe application of a water balance model in a mesoscale catchmentin Northeast Germany
M. Wegehenkel1, U. Heinrich2, H. Jochheim1, K. C. Kersebaum1, and B. Rober2
1Leibniz-Cetre for Agricultural Landscape Research (ZALF) e.V., Institute of Landscape Systems Analysis,Muncheberg, Germany2Leibniz-Cetre for Agricultural Landscape Research (ZALF) e.V., Department of Landscape Information Systems,Muncheberg, Germany
Received: 14 January 2010 – Revised: 21 May 2010 – Accepted: 30 May 2010 – Published: 27 August 2010
Abstract. Future climate changes might have some impactson catchment hydrology. An assessment of such impacts one.g. ground water recharge is required to derive adaptationstrategies for future water resources management. The mainobjective of our study was an analysis of three different re-gional climate change scenarios for a catchment with an areaof 2415 km2 located in the Northeastern German lowlands.These data sets consist of the STAR-scenario with a time pe-riod 1951–2055, the WettReg-scenario covering the period1961–2100 and the grid based REMO-scenario for the timespan 1950–2100. All three data sets are based on the SRESscenario A1B of the IPCC. In our analysis, we compared themeteorological data for the control period obtained from theregional climate change scenarios with corresponding datameasured at meteorological stations in the catchment. Theresults of this analysis indicated, that there are high differ-ences between the different regional climate change scenar-ios regarding the temporal dynamics and the amount of pre-cipitation. In addition, we applied a water balance modelusing input data obtained from the different climate changescenarios and analyzed the impact of these different inputdata on the model output groundwater recharge. The resultsof our study indicated, that these regional climate change sce-narios due to the uncertainties in the projections of precipi-tation show only a limited suitability for hydrologic impactanalysis used for the establishment of future concrete watermanagement procedures in their present state.
Correspondence to:M. Wegehenkel([email protected])
1 Introduction
Future climate changes may lead to changes of the hydro-logical conditions of a catchment such as long-term wa-ter availability, ground water recharge or drought periods.Therefore, a reliable estimation of the impacts of climatechange on catchment hydrology is required to develop adap-tation strategies in water resources management. Such stud-ies were carried out in different river basins across Europeusing hydrological models and regional climate change sce-narios (e.g. Caballero et al., 2007; de Witt et al., 2007; Hat-termann et al., 2008). In the last decade, a large amount ofsuch regional climate change scenarios using different globaland regional climate models depending on different IPCC-SRES-emission scenarios were developed (e.g. Deque et al.,2007). However, the results of different regional climatechange scenarios for even one IPCC-SRES scenario suchas A1B showed uncertainties depending on the selected re-gional as well as global climate model (e.g. Deque et al.,2007; Minville et al., 2008). This indicates, that regionalclimate projections should be evaluated regarding their suit-ability for hydrological impact analysis (e.g. Bronstert et al.,2007).
The primary goal of our study was a comparison of threedifferent regional climate change projections for the purposeof a model based hydrological impact analysis in a mesoscalecatchment located in the Northeastern German lowlands. Weapplied a water balance model using meteorological inputdata obtained from these different climate change projectionsin that catchment and carried out a first preliminary analysisof the impact of these different meteorological input data onsome model outputs such as ground water recharge.
Published by Copernicus Publications on behalf of the European Geosciences Union.

58 M. Wegehenkel et al.: Evaluation of climate change scenarios
Fig. 1. Location of the Ucker catchment in NE-Germany (fromWegehenkel et al., 2006).
2 Material and methods
2.1 Database
The location of the Ucker catchment with an area of2415 km2 is shown in Fig. 1. The actual land cover consistsof 5% settlements, 4% water bodies, 13% meadows, 3% wet-lands, 22% forests, and 53% arable land. The areas locatedin the north of the Ucker catchment are covered with sandysoils with low soil water storage capacity. In the southernand western parts, loamy soils with higher soil water storagecapacity are located. In the flat river plains, wetlands andpeat soils with shallow groundwater tables dominate. Thecomparison of the actual mean annual rate of precipitationfor Germany at 789 mm y−1 with that for our catchment atabout 510 mm y−1 for the time period 1961–1990 indicatesthat this catchment is located in one of the driest regions inGermany (Deutscher Wetterdienst, 1999).
In our study, we used three different regional climatechange projections, all based on the IPCC-SRES scenarioA1B. A detailed description of these scenarios can be ob-tained from Nakicenovic et al. (2000). The first regional sce-nario is based on the application of the statistical regionaldownscaling model STAR developed by the Potsdam Insti-tute of Climate Research (Gerstengarbe et al., 2003; Wernerand Gerstengarbe, 1997). The STAR-model resamples cli-
mate data observed at meteorological stations by cluster ana-lysis using statistics such as seasonality, anomalies, inter-annual variability and trends of observed air temperaturesas an input (Werner and Gerstengarbe, 1997). Projectionsof future climate conditions are constructed by STAR usingthe projected trend of future temperatures derived from themodel ECHAM4 as main input (Gerstengarbe et al., 2003).The STAR time series 1951–2055 consist of daily rates ofprecipitation, minimum, maximum, and mean air tempera-ture, water saturation deficit of air, wind speed and global ra-diation for meteorological stations and are splitted in the ref-erence or control period 1951–2000 and the climate changeperiod 2001–2055 with an increase of 1.4◦C of the mean an-nual temperature and a mean decrease of 8% in the annualprecipitation rates (Gerstengarbe et al., 2003). More detailsabout the STAR-model can be obtained from Gerstengarbeet al. (2003) and Werner and Gerstengarbe (1997).
The second climate change projection is theso called WettReg-approach (WetterlagenbasierteRegionalisierungsmethode = weather-type based region-alization method). WettReg is a combination of a statisticalwith an analogous down scaling approach and uses statisticalrelationships between large-scale atmospheric circulationpatterns and local climate as well as characteristics ofregional climate for different weather types (Enke et al.,2005; Spekat et al., 2007). This approach classifies observedweather types into typical temperature and precipitationregimes for the control period defined from 1961 to 2000.Future climate conditions are derived from correspondingtemperature and precipitation regimes obtained from theresults of the global climate model ECHAM5/MPI-OM(Jungclaus et al., 2006; Spekat et al., 2007). The time seriesfor meteorological stations according to WettReg consist ofmeteorological input data with a daily time step similar tothe STAR-scenario. In contrast to STAR, WettReg is dividedin the reference period 1961–2000 and the climate changeperiod 2001–2100. There exist ten realizations according toten different weather regimes (Spekat et al., 2007). Fromthese ten realizations, three different precipitation regimes(dry, middle and moist) were evaluated (Spekat et al., 2007).More details about the WettReg-dataset can be obtainedfrom Spekat et al. (2007).
The third climate change projection is based on calcu-lations of the dynamic regional climate model RegionalModel (= REMO) of the Max-Planck-Institute for Meteorol-ogy, Hamburg, Germany (e.g. Jacob et al., 2007, 2008, sec-ond delivery corrected for horizontal shift). The grid basedmodel REMO has a spatial resolution of 0.088◦ approx.10×10 km. Large-scale boundary conditions and forcing in-puts are obtained from the global climate model ECHAM5(Jacob et al., 2007). Similar to WettReg and STAR, we usedmeteorological data from REMO-Grids with a daily timestep, provided by the Max-Planck-Institute for Meteorology,Hamburg, Germany within the research-project NEWAL-NET (Ende, 2009).
Adv. Geosci., 27, 57–64, 2010 www.adv-geosci.net/27/57/2010/

M. Wegehenkel et al.: Evaluation of climate change scenarios 59
The other spatial data set for the model simulations con-sists of a land cover map, a soil map, a river net map and adigital elevation model. More information about the spatialdata base can be obtained from e.g. Wegehenkel et al. (2006)and Wegehenkel and Kersebaum (2009).
2.2 Simulation model
The hydrological model THESEUSused in our study is cou-pled to a Geographical Information System and needs threedigital maps regarding hydrotopes, subbasins and river net(Wegehenkel et al., 2006). Hydrotopes are the elementaryspatial modelling units each with an assumed hydrologicaluniform behaviour resulting from the overlay of the landcover map, the soil and subbasins map as well as the digitalelevation model. Therefore, the database of each hydrotopeconsists of information about soil type, groundwater table,land cover, corresponding subbasin and mean elevation. Theriver net map contains information about the cross profiles ofthe river sections, elevation of the river nodes and referenceto the corresponding downstream river section.
For each hydrotope in the catchment, water balance is cal-culated based on daily time steps. Snowmelt is simulated bya degree-day approach. Potential reference evapotranspira-tion (PET) is calculated as a function of global radiation, sa-turation deficit of air and wind speed according to Wendlinget al. (1991). The partitioning of PET in transpiration, in-terception and evaporation is simulated using simple vege-tation type specific seasonal time courses for rooting depth,plant height and soil cover. Interception is calculated by amodified linear storage approach. Actual evapotranspirationis determined by PET, soil cover and by a root density func-tion, which establishes water extraction by evapotranspira-tion from soil layers.
Infiltration into the topsoil layer and runoff genera-tion is calculated by a modified approach according toHoltan (1961). Actual water content and water fluxes of eachsoil layer are calculated using a capacity approach with non-linear storage routing according to Glugla (1969). The waterflux across the lower boundary of the soil profile is defined asgroundwater recharge. In the presence of groundwater in thesoil profile, capillary rise is calculated depending on soil tex-ture, bulk density, and distance from the soil layer to ground-water table and soil water content in the layer using tabulardata published in AG Boden (2005).
For each modelling time step, surface runoff is routedby a fast linear storage and groundwater recharge is routedby a slow linear storage for base flow for each subbasin.Due to the low amount of steep slopes in the catch-ment, interflow is neglected. The discharge of each sub-basin comprised of the outflows of these two storages isassigned to the corresponding river section of the sub-basin. The stream flow through the river net is simu-lated by a linear storage cascade of all river sections down
Table 1. Types of weather stations in the Ucker catchment.
No Name TypeWettreg TypeSTAR TypeDWD MD
1 Ahlbeck Precipitation – Precipitation2 Altentreptow Precipitation – Climate3 Angermuende Climate Climate Climate4 Bredereiche Precipitation – Precipitation5 Carpin-Serran Precipitation Climate Climate6 Friedrichswalde Precipitation Climate Climate7 Fuerstenberg Precipitation – Precipitation8 Goeritz Precipitation Climate Precipitation9 Grambow Precipitation Climate Precipitation10 Neuglobsow Climate Climate Precipitation11 Penkun Precipitation Climate Climate12 Penzlin Precipitation Climate Precipitation13 Prenzlau Precipitation Climate Precipitation14 Ratheburg Precipitation – Precipitation15 Uckermuende Climate Climate Climate
to the catchment outlet. A more detailed description of thedatabase and the model can be obtained from e.g. Wege-henkel et al. (2006).
2.3 Analysis and evaluation of regional climatechange projections
In addition to the STAR- (= STAR) and REMO-scenario(= REMO), we selected the data sets with the prede-fined dry (= WRdry) and the middle precipitation regime(= WR middle) from the WettReg-data set. Due to the dif-ferent time periods of the scenarios, we defined a commoncontrol period 1961–2000 for all climate change projectionsfor an evaluation of the presentation of the current climateconditions by STAR, REMO and WettReg. Weather stationsare usually classified as climate stations measuring e.g. pre-cipitation, global radiation, wind speed and air humidity oras precipitation stations observing only rainfall. A compar-ison of the classification of the 15 weather stations for theUcker catchment used in the climate change projections Wet-tReg and STAR with that obtained from the German WeatherService (= DWD) showed some discrepancies (Table 1). Incontrast to the classification obtained from DWD, the STAR-scenario defined all stations as climate stations (Table 1).The WettReg-scenario classified only three climate stationsin contrast to six climate stations according to DWD (Ta-ble 1). Only two stations, Angermuende and Uckermuende,were defined identically as climate stations by DWD, STARand WettReg (Table 1). This low amount of identical climatestations hampers a sufficient comparison of e.g. tempera-ture or air humidity measured at the weather stations withcorresponding ones obtained from the STAR- and WettReg-dataset. Therefore, we focused in our evaluation of the cli-mate change scenarios only on precipitation. This evalu-ation consists of the comparison of precipitation rates ob-tained from the climate change projections with correspond-ing ones measured at 15 meteorological stations located in-side and outside of the catchment (Fig. 2). The precipitation
www.adv-geosci.net/27/57/2010/ Adv. Geosci., 27, 57–64, 2010

60 M. Wegehenkel et al.: Evaluation of climate change scenarios
Fig. 2. Station network for STAR and WettReg as well as REMO-Grids for the Ucker catchment.
rates obtained from the stations and from the scenarios wereused without any additional modification. In the case of thegrid based REMO-data set, we simply compared the precip-itation rates measured at the station with the correspondingmean rates calculated from rainfall rates obtained from thegrid with the station located inside and the eight surround-ing REMO-grids (Fig. 2). This procedure is recommendedby the providers of the REMO-data set (UBA-MPI, 2008).For the analysis, we compared cumulative times series, cu-mulative frequency distributions, differences in annual ratesand spatial rainfall distributions obtained from the differentregional climate data sets.
2.4 Model set up
The spatial distribution of meteorological input data for themodelling units hydrotopes was interpolated from stationsfor STAR and WettReg using an inverse-distance procedureincluded in the model. For the REMO-data, we simply usedthe time series of the corresponding grid with the station lo-cated inside and treated these grid-based time series similarlike station data with the same interpolation method as STARand WettReg (Fig. 2).
For forested areas, we assumed the existence of adult for-est stands for the total simulation period. Initial soil watercontents for the simulation runs were set equal to field ca-pacity. In a former study, the model was calibrated usingmeasured discharge rates and observed meteorological inputdata from the period 1989–2003. Within this calibration,only two model parameters, which influences the determi-nation of runoff and baseflow and, therefore, mainly impactschannel discharge, were modified to match the measured dis-charge rates with an acceptable precision (Wegehenkel et al.,2006; Wegehenkel and Kersebaum, 2009). The other datasuch as soil hydraulic properties were not changed.
In the recent study, this so calibrated model was appliedusing the meteorological data provided by the climate changeprojections without any further correction. The model simu-lation was carried out continuously for 90 years ranging from1 January 1961 to 31 December 2050 with a daily time step.Due to the different time spans of the climate change peri-ods such as 2001–2055 for STAR and 2001–2100 for Wet-tReg and REMO, we defined the climate change period forthe analysis of the model outputs 2011–2050 with a durationof 40 years. This equals the duration of the control period1961–2000 and enables the direct comparison of cumulativefrequency curves and cumulative rainfall.
3 Results and discussion
3.1 Comparison of climate scenarios with station data
The comparison of cumulative daily rainfall obtained fromDWD-station data with those according to the STAR-,WettReg- and REMO-scenario for the common control pe-riod 1961–2000 indicated an overestimation of rainfall by theREMO-approach in contrast with the other data sets. A com-parison of measured cumulative daily rainfall from six se-lected stations with corresponding scenario data is presentedin Fig. 3. In comparison with the station data, REMO over-estimates cumulative daily rainfall in an order of magnitudeof 16–41% of cumulative station rainfall (Fig. 3). Only incase of the station Altentreptow, located Northeast outsideof the catchment (Fig. 2), cumulative rainfall obtained fromall climate change scenarios were higher than cumulativerainfall according to the station data (Fig. 3). For the otherstations such as Angermuende, Friedrichswalde, Penkun orUckermuende, cumulative daily rainfall obtained from theWettRegdry-scenario is mainly higher than those obtainedfrom WettRegmiddle, STAR and station data. Wettregdryoverestimates cumulative rainfall in an order of magnitude
Adv. Geosci., 27, 57–64, 2010 www.adv-geosci.net/27/57/2010/

M. Wegehenkel et al.: Evaluation of climate change scenarios 61
Fig. 3. Comparison of cumulative daily rainfall (= Prc) in mm forsix selected stations obtained from weather station (= station) andthe climate change scenarios REMO (= REMO), STAR (= STAR),WettRegdry (= WR dry) and WettRegmiddle (= WRm) for thecontrol period 1961–2000.
up to 12% of that calculated from the station data. In con-trast, cumulative rainfall obtained from the WettRegmiddle-scenario is lower than those obtained from STAR, Wet-tRegdry and station data. This underestimation of cumu-lative rainfall by WettRegmiddle is an order of magnitudeof up to 16% of the station data (Fig. 3). Please note thatwe used the original denomination of the WettReg-datasetalthough our results might indicate a contradiction betweenWettRegdry with more rainfall and WettRegmiddle witha lower amount of precipitation. However, for all stationsin the Ucker catchment, cumulative daily rainfall data ob-tained from the STAR-scenario showed the best fit to the sta-tion data with differences<2% of cumulative station rainfall(Fig. 3).
The comparison of cumulative frequency graphs of dailystation rainfall with corresponding ones obtained from theclimate change scenarios indicated also differences betweenthe REMO-scenario and the station data as well as the otherclimate change scenarios especially regarding maximum andthe amount days without rainfall (Fig. 4). In contrast toREMO-, WettReg- and STAR-scenario were mainly similarwith the station data (Fig. 4). However, similar to cumulativedaily rainfall, the STAR-scenario showed the best fit to thestation data.
Fig. 4. Cumulative frequency curve and maximum (= Max) of dailyprecipitation rates (= Prc) of the control period 1961–2000 mea-sured at the weather stations Ueckermunde and Carpin-Serrahn incomprison with corresponding curves obtained from the climatechange scenarios REMO, STAR, Wettregdry (= Wr dry) and Wet-tRegmiddle (= WRm).
These findings were also indicated by the differences be-tween annual rates of precipitation measured at the sta-tions and corresponding annual rates obtained from the cli-mate change scenarios for the control period 1961–2000(Fig. 5). In comparison with the station data, the REMO sce-nario showed mainly an overestimation of annual rates upto 611 mm y−1 corresponding to 162% of the station data(annual rate station minus annual rate REMO means neg-ative data in Fig. 5). Especially in the year 1982, mea-sured annual rainfall rates ranged within 308–551 mm y−1 incontrast to REMO with annual rates of precipitation within723–1004 mm y−1. Annual rainfall rates obtained from Wet-tRegdry and WettRegmiddle showed over- and underesti-mation in an order of magnitude of 0–528 mm y−1 corre-sponding to 0–136% of the station data (Fig. 5). Mainlyonly minor differences between annual rates obtained fromthe STAR-Scenario and those obtained from the stationscould be observed (Fig. 5). However, these observed differ-ences in our study should not be used as an indicator of thequality of the climate projections and, therefore, should beinterpreted more as an additional measure of the uncertainties
www.adv-geosci.net/27/57/2010/ Adv. Geosci., 27, 57–64, 2010
62 M. Wegehenkel et al.: Evaluation of climate change scenarios
Fig. 5. Differences between annual rates of precipitation mea-sured at the weather stations Carpin-Serrahn, Altentreptow, Anger-muende and Uckermuende and corresponding rates obained fromthe climate change scenarions REMO (= Station – REMO), STAR(= Station – STAR), WettRegdry (= Station – WRdry) and Wet-tRegmiddle (= Station – WRm) for the control period 1961–2000.
of precipitation rates simulated by different climate changeprojections. The good fit of the STAR-model to the sta-tion data might be mainly due to the use of observed datafor the generation of the times series for the control period(Gerstengarbe et al., 2003). In contrast, REMO uses outputsof the global climate model ECHAM5 for the generation ofthe time series (Jacob et al., 2007, 2008). Furthermore, thisgood fit does not mean, that the future climate projection ob-tained from the STAR-method is the most reliable scenariofor the application for hydrologic impact analysis. In a pa-per published by Bronstert et al. (2007), STAR, WettRegand REMO were also evaluated for their suitability for hy-drological impact studies comparing simulated and observedprecipitations for the control period in a region located inSouth Germany covering the federal states of Bavaria andBaden-Wuerttemberg with a total area of 106 000 km2. Inthat study, the WettReg-method showed differences betweenobserved and simulated precipitation of about 20 mm y−1,which corresponds to 2% of the observed rainfall. How-
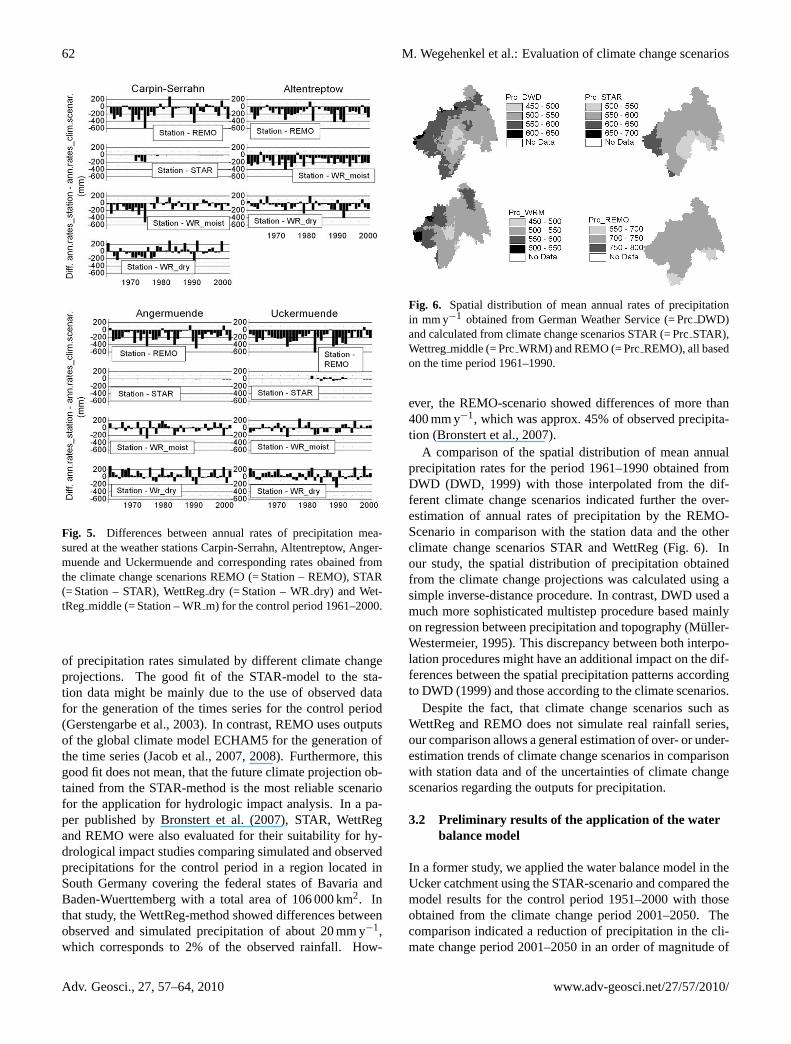
Fig. 6. Spatial distribution of mean annual rates of precipitationin mm y−1 obtained from German Weather Service (= PrcDWD)and calculated from climate change scenarios STAR (= PrcSTAR),Wettregmiddle (= PrcWRM) and REMO (= PrcREMO), all basedon the time period 1961–1990.
ever, the REMO-scenario showed differences of more than400 mm y−1, which was approx. 45% of observed precipita-tion (Bronstert et al., 2007).
A comparison of the spatial distribution of mean annualprecipitation rates for the period 1961–1990 obtained fromDWD (DWD, 1999) with those interpolated from the dif-ferent climate change scenarios indicated further the over-estimation of annual rates of precipitation by the REMO-Scenario in comparison with the station data and the otherclimate change scenarios STAR and WettReg (Fig. 6). Inour study, the spatial distribution of precipitation obtainedfrom the climate change projections was calculated using asimple inverse-distance procedure. In contrast, DWD used amuch more sophisticated multistep procedure based mainlyon regression between precipitation and topography (Muller-Westermeier, 1995). This discrepancy between both interpo-lation procedures might have an additional impact on the dif-ferences between the spatial precipitation patterns accordingto DWD (1999) and those according to the climate scenarios.
Despite the fact, that climate change scenarios such asWettReg and REMO does not simulate real rainfall series,our comparison allows a general estimation of over- or under-estimation trends of climate change scenarios in comparisonwith station data and of the uncertainties of climate changescenarios regarding the outputs for precipitation.
3.2 Preliminary results of the application of the waterbalance model
In a former study, we applied the water balance model in theUcker catchment using the STAR-scenario and compared themodel results for the control period 1951–2000 with thoseobtained from the climate change period 2001–2050. Thecomparison indicated a reduction of precipitation in the cli-mate change period 2001–2050 in an order of magnitude of
Adv. Geosci., 27, 57–64, 2010 www.adv-geosci.net/27/57/2010/

M. Wegehenkel et al.: Evaluation of climate change scenarios 63
Fig. 7. Comparison of cumulative rates of daily precipitation(= Prc cum) and simulated groundwater recharge (= GWRcum) forthe control period 1961–2000 and the defined climate change pe-riod 2011–2050 at the selected hydrotope with arable land/sandysoil, simulated using the climate change scenarios WettRegdry(= WR dry), STAR and REMO.
2–10% of the control period 1951–2000 and a decrease ofgroundwater recharge in an order of magnitude of 1–94%for the climate change period 2001–2050 (Wegehenkel andKersebaum, 2009).
In the recent study, we carried out a first application of thewater balance model using the scenarios WettRegdry, STARand REMO and comparing some preliminary model resultsfor the new defined control period 1961–2000 with those forthe new defined climate change period 2011–2050. The sce-nario WettRegdry indicated a reduction of precipitation inthe climate change period 2011–2050 by up to 3% of thecontrol period 1961–2000. However, the REMO-scenarioshowed an increase of precipitation in the climate changeperiod 2011–2050 in order of 1–12% of the control period1961–2000 leading to a simulated mean relative increase ofgroundwater recharge of 19% for the Ucker catchment. Anexample of the impact of the different climate change sce-narios is presented in Figs. 7 and 8. For a first preliminaryanalysis, we randomly selected a hydrotope with arable landlocated on a poor soil with sand contents above 90% and afield capacity of 11 Vol% and a hydrotope with coniferousforests located at the same soil. A comparison of cumulativedaily rainfall and simulated groundwater recharge for bothhydrotopes in the Ucker catchment illustrated that the useof WettRegdry and STAR led to a reduction of simulatedgroundwater recharge in the climate change period 2011–2050 in an order of magnitude of 7–30% of the control pe-riod (Figs. 7 and 8). Due to the increase of precipitation,the results obtained from the model application using theREMO-scenario indicated an increase of simulated ground-water recharge within 1690–1780 mm on both hydrotopes inthe climate change period in comparison with the control pe-riod 1961–2000 (Figs. 7 and 8). This increase corresponds to16–20% of the control period.
Fig. 8. Comparison of cumulative rates of daily precipitation(= Prc cum) and simulated groundwater recharge (= GWRcum) forthe control period 1961–2000 and the defined climate change period2011–2050 at the selected hydrotope with coniferous forest/sandysoil, simulated using the climate change scenarios WettRegdry(= WR dry), STAR and REMO.
4 Conclusions
Due to these uncertainties at the present state of the climateprojections, the results of our study are preliminary and adefinition of some confidence intervals is difficult. How-ever, such a definition of confidence intervals is essential forthe acceptance of the results of such impact studies by lo-cal stakeholders regarding adaptation strategies in water re-sources management. Taking into account our results fromthe evaluation of the three different regional climate changescenarios, there are large differences between the climatechange scenarios regarding the temporal dynamics and theamount of precipitation. These differences led to contradic-tory modelling results regarding groundwater recharge espe-cially between the model outputs based on the use of theREMO-scenario and those based on the STAR- and the Wet-tRegdry-scenario. However, there are some limitations inour analysis such as no Bias-correction of REMO data andthe limited compatibility between meteorological time seriesobtained from grids and station based time series. However,despite these limitations, these uncertainties hamper, e.g. therecommendation of concrete water resource management op-tions based on hydrological impact analysis using model out-puts calculated with input data obtained from regional cli-mate change projections in their present state.
Acknowledgements.The work was founded from the GermanyFederal Ministry of Consumer Protection, Food and Agricultureand the Ministry of Agriculture, Environmental Protection andLandscape Planning, Brandenburg. We have to thank Germany’sMeteorological Service and F. W. Gerstengarbe from the PotsdamInstitute of Climate Impact Research for providing meteorologicaldata and the STAR-Scenario. The WettReg-data set was providedby CEC Potsdam and the REMO-data set was provided by the
www.adv-geosci.net/27/57/2010/ Adv. Geosci., 27, 57–64, 2010

64 M. Wegehenkel et al.: Evaluation of climate change scenarios
Max-Planck-Institute of Meteorology (MPI-M) Hamburg, both incooperation with the Federal Environment Agency (UBA) Dessauwithin the project Newal-Net founded by the Federal Ministryof Education and Research under the Contract-No. 0330562A.The digital elevation model DEM25 was provided by the FederalAgencies Landesvermessungsamt Brandenburg and Landesver-messungsamt Mecklenburg-Vorpommern (LvermA BB + MV, GB-A03/1).
Edited by: A. Wahren, F. Tavares Wahren, and K.-H. FegerReviewed by: two anonymous referees
References
AG Boden: Bodenkundliche Kartieranleitung, Bundesanstaltfur Geowissenschaften und Rohstoffe und den GeologischenLandesamtern in der Bundesrepublik Deutschland, Hannover,5. Aufl, 438 pp., 2005 (in German).
Bronstert, A., Kolokotronis, V., Schwandt, D., and Straub, H.:Comparison and evaluation of regional climate impact analysis:General scheme and application example, Int. J. Climatol., 27,1579–1594, 2007.
Caballero, Y., Voirin-Morel, S., Habets, F., Noilhan, J., LeMoigne,P., Lehenaff, A., and Boone, A.: Hydrological sensitivity ofthe Adour-Garonne river basin to climate change, Water Resour.Res., 43, W07448. doi:10.1029/2005WR004192, 2007.
Deutscher Wetterdienst: Digitaler Klimaatlas BundesrepublikDeutschland Teil 1 Lufttemperatur, Niederschlagshohe, Sonnen-scheindauer, Offenbach am Main, 1999 (in German).
Deque, M., Rowel, D. P., Luthi, D., Giorgi, F., Christensen, J. H.,Rockel, B., Jacob, D., Kjellstrom, E., de Castro, M., and van denHurh, B.: An intercomparison of regional climate simulations forEurope: assessing uncertainties in model projections, ClimaticChange, 81, 53–70, 2007.
De Witt, M. J. M., Van den Hurk, B., Warmerdam, P. M. M., Torfs,P. J. J. F., Roulin, E., and van Deursen, W. P. A.: Impact of cli-mate change on low-flows in the river Meuse, Climatic Change,82, 351–372, 2007.
Ende, H. P.: Klimaplastische Walder fur Regionen mit Zukunft –der Forschungsverbund NEWAL-NET, Forst und Holz, 64(10),11–13, 2009 (in German).
Enke, W., Deutschlander, T., Schneider, F., and Kuchler, W.: Re-sults of five regional climate studies applying a weather patternbased downscaling method to ECHAM4 climate simulation, Me-teorol. Z., 14, 247–257, 2005.
Gerstengarbe, F. W., Badeck, F., Hattermann, F., Krysanova, V.,Lahmer, W., Lasch, P., Stock, M., Suckow, F., Wechsung, F.,and Werner P. C.: Studie zur klimatischen Entwicklung im LandBrandenburg bis 2055 und deren Auswirkungen auf den Wasser-haushalt, die Forst- und Landwirtschaft sowie die Ableitung er-ster Perspektiven, Potsdam, PIK-Report No. 83, 96 pp., 2003 (inGerman).
Glugla, G.: Berechnungsverfahren zur Ermittlung des aktuellenWassergehaltes und des Gravitationsabflusses, Albrecht-Thaer-Archiv, 13, 371–376, 1969 (in German).
Hattermann, F., Post, J., Krysanova, V., Conradt, T., and Wech-sung, F.: Assessment of Water Availability in a Central-EuropeanRiver Basin (Elbe) under Climate Change, Adv. Clim. ChangeRes. Suppl., 4, 42–50, 2008.
Holtan, H. N.: A concept for infiltration estimates in watershed en-gineering, US Dept. ARS, Washington D.C., 41–51, 1961.
Jacob, D. L., Barring, O. B., Christensen, J. H. , Christensen,S., Hagemann, S., Hirschi, M., Kjellstrom, E., Lenderink, B.,Rockle, C., Schar, S. I., Seneviratne, S., Somot, A., van Ulden,A., and van den Hurk, B.: An intercomparison of regional cli-mate models for Europe: Design of the Experiments and modelperformance, PRUDENCE, Special Issue, Climatic Change,Vol. 81, Supplement 1, 2007.
Jacob, D., Gottel, H., Kotlarski, S., Lorenz, P., and Sieck, K.: Kli-maauswirkungen und Anpassungen in Deutschland- Phase 1: Er-stellung regionale Klimaszenarien fur Deutschland, Techn. Re-port UBA, 154 pp., 2008 (in German).
Jungclaus, J. H., Botzet, M., Haak, H., Keenlyside, N., Luo, J. J.,Latif, M., Marotzke, J., Mikolajewicz, U., and Roeckner, E.:Ocean circulation and tropical variability in the coupled modelECHAM5/MPI-OM, J. Climate, 19, 3952–3972, 2006.
Minville, M., Brisette, F., and Leconte, R.: Uncertainty of the im-pact of climate change on the hydrology of a nordic watershed,J. Hydrol., 358, 70–83, 2008.
Muller-Westermaier, G.: Numerisches Verfahren zur Erstellung kli-matologischer Karten, Berichte des Deutschen Wetterdienstes,Nr. 193, Offenbach, 1995 (in German).
Nakicenovic, N., Alcamo, J., Davis, G., DeVries, B., Fenhann, J.,Gaffin, S., Gregory, K., Gruebler, A., Jung, T. Y., Kram, T., LaRovere, E. L., Michaelis, L., Mori, S., Morita, T. Pepper, W.,Pitcher, H., Price, L., Riahi, K., Roehrl, A., Rogner, H. H.,Sankovski, A., Schlesinger, M., Shukla, P., Smith, S., Swart,R., VanRooijen, S., Victor, N., and Dadi, Z.: Special Report onEmissions Scenarios: A Special Report of Working Group IIIof the Intergovernmental Panel on Climate Change, CambridgeUniversity Press, Cambridge, 600 pp., 2000.
Spekat, A., Enke, W., and Kreienkamp, F.: Neuentwicklung von re-gional aufgelosten Wetterlagen fur Deutschland und Bereitstel-lung regionaler Klimaszenarios auf der Basis von globalen Kli-masimulationen mit den Regionalisierungsmodell WETTREGauf Basis von globalen Klimasimulationen mit ECHAM5/MPI-OM T63L31 2010 bis 2100 fur die SRES-Szenarios B1, A1B,und A2, Techn. Report UBA, 149 pp., 2007 (in German).
UBA-MPI: Hinweise fur REMO-Datennutzer, available at:http://www.mpimet.mpg.de/file-admin/staff/pfeifersusanne/REMO\UBA/REMO-UBA-Hinweise.pdf(last access: 20 De-cember 2009), 2008.
Wegehenkel, M., Heinrich, U., Uhlemann, S., Dunger, V., andMatschullat, J.: The impact of different spatial land cover datasets on the outputs of a hydrological model: a modelling exer-cise in the Ucker catchment, North-East Germany, Phys. Chem.Earth, 31, 1075–108, 2006.
Wegehenkel, M. and Kersebaum, K. C.: An assessment of theimpact of climate change on evapotranspiration, groundwaterrecharge and low flow conditions in a mesoscale catchment inNortheast Germany, J. Plant Nutr. Soil Sci., 172, 737–744, 2009.
Werner, P. C. and Gerstengarbe, F. W.: Proposal for the develop-ment of climate scenarios, Clim. Res., 8, 171–182, 1997.
Wendling, U. H., Schellin, G., and Thoma, M.: Bereitstellungvon taglichen Informationen zum Wasserhaushalt des Bodens furdie Zwecke der agrarmeteorologischen Beratung, Z. Metereol.,41(6), 1–16, 1991.
Adv. Geosci., 27, 57–64, 2010 www.adv-geosci.net/27/57/2010/