EVALUATION OF THE STATUS AND CONSTRAINTS TO SHEEP PRODUCTION IN KALULUMA EPA, KASUNGU ADD
70
EVALUATION OF THE STATUS AND CONSTRAINTS TO SHEEP PRODUCTION IN KALULUMA EPA, KASUNGU ADD. STANFORD MUYILA (ANIMAL SCIENCE OPTION) A PROJECT REPORT SUBMITTED TO THE FACULTY OF AGRICULTURE IN PARTIAL FULFILMENT OF THE REQUIREMENTS FOR A BACHELOR OF SCIENCE DEGREE IN AGRICULTURE UNIVERSITY OF MALAWI BUNDA COLLEGE DEPARTMENT OF ANIMAL SCIENCE P.O. BOX 219 LILONGWE May 2007
Transcript of EVALUATION OF THE STATUS AND CONSTRAINTS TO SHEEP PRODUCTION IN KALULUMA EPA, KASUNGU ADD

EVALUATION OF THE STATUS AND CONSTRAINTS TO SHEEP
PRODUCTION IN KALULUMA EPA, KASUNGU ADD.
STANFORD MUYILA
(ANIMAL SCIENCE OPTION)
A PROJECT REPORT SUBMITTED TO THE FACULTY OF AGRICULTURE IN
PARTIAL FULFILMENT OF THE REQUIREMENTS FOR A BACHELOR OF
SCIENCE DEGREE IN AGRICULTURE
UNIVERSITY OF MALAWI
BUNDA COLLEGE
DEPARTMENT OF ANIMAL SCIENCE
P.O. BOX 219
LILONGWE
May 2007

i
APPROVAL
Supervisor
Name: Ass. Prof. A.C.L. Safalaoh
Signature:………………………………Date:………/………./2007
Head, Animal Science Department
Name: T.N.P. Gondwe (PhD)
Signature:………………………………Date:………/……..…/2007
Dean, Faculty of Agriculture
Name: Ass. Prof Dr M.W. Mfitilodze (PhD)
Signature:……………………………....Date…………/………/2007

ii
DEDICATION
To Dexter Muyila who laid a foundation for my education.
To Davis Muyila who nurtured it.

iii
ACKNOWLEDGEMENTS
The assistance, encouragement, direction and positive criticism offered by my
supervisor Mr. A.C.L. Safalaoh has lead to this finished report. I therefore, sincerely
appreciate the commitment and commendable input in shaping this project report.
Furthermore, I appreciate the assistance of Dr. T.N. Gondwe especially in the initial
development of the research proposal and questionnaires. He greatly contributed in
shaping the future of my project work.
I recognise and apprecaite the support rendered by the Department of Animal Science
especially by allowing us access to the Animal Science Masters Computer Centre. This
helped us out of the competition for computers in undergraduate computer centre.
Lastly but not least, let me thank my roommate, Lazarus Mbemba, and all my classmates
(Wina, Jass, Sharty, Chimercy, Makaka) for the wonderful experience we have gone
through together.

iv
Abstract
A study was conducted to evaluate the status and constraints to sheep production in
Kaluluma EPA of Kasungu ADD. The study involved administration of a questionnaire
to 30 randomly selected sheep farmers, 10 non-sheep farmers, 5 butcher-men in
Kaluluma EPA and 5 meat processors and retail outlets based in Lilongwe. The
questionnaire sought information on management practises employed by sheep farmers,
marketing of sheep, perception to sheep production by farmers and non-sheep farmers
and constraints met by farmers and meat processors. The study also involved
identification of possible solutions.
Up to 43% of farmers raising sheep had large polygamous families. An average income
for 43% of the farmers was between K80, 000.00-K120, 000.00 per annum. Most (70%)
of farmers were engaged in different agricultural activities combining both livestock
keeping (goats, sheep, cattle, pigs, guinea pigs and ducks) and growing a variety of
crops (tobacco, maize, ground nuts, cassava and sweet potatoes). The average flock sizes
were found to be 5.433±4.469 SD for sheep and 7.077±5.321SD for goats.
Most farmers (97.7%) herd their sheep throughout the year without providing any
supplementary feed or drinking water. Ewes and rams are left to mate indiscriminately
All farmers provide housing for the sheep using locally available low cost materials. The
major types of houses identified were pole with thatch (60%) and pole without thatch
(20%). Other types included mud and brick houses (khola).
There was no disease or parasite control programme to protect sheep (i.e. vaccination or
dipping) followed by farmers. Livestock extension services are generally poor. Farmers
that experienced mortalities in their flock did not report the mortalities to the veterinary
officials in the area signifying a weak linkage between farmers and the veterinary
officials.

v
Major constraints in sheep production were identified as lack of effective advisory and
veterinary service (36.67%), high predation (33%) especially for lamb, high mortality
and high disease incidence (23.33%), and low prolificacy (20 %).
Meat processors and retail outlets in Lilongwe indicated low availability and low
demand for mutton as major constraints. Prices of lamb and mutton were generally high
with the average price of K632.71 per Kg.
The study has shown that sheep may have a potential in the livestock sector but more
studies are required on a wider scale. Solutions to identified problems have been
proposed.

vi
TABLE OF CONTENTS
Page
APPROVAL .................................................................................................................................................I
DEDICATION ............................................................................................................................................ II
ACKNOWLEDGEMENTS ..................................................................................................................... III
ABSTRACT ............................................................................................................................................... IV
TABLE OF CONTENTS .......................................................................................................................... VI
LIST OF TABLES ................................................................................................................................. VIII
CHAPTER 1 ................................................................................................................................................ 1
1 INTRODUCTION ............................................................................................................................. 1
1.1 BACKGROUND INFORMATION ..................................................................................................... 1
1.2 LIVESTOCK PRODUCTION ............................................................................................................ 1
1.3 JUSTIFICATION ............................................................................................................................ 4
1.4 OBJECTIVES ................................................................................................................................ 5
1.4.1 Main Objective ...................................................................................................................... 5
1.4.2 Specific Objectives: ............................................................................................................... 5
CHAPTER 2 ................................................................................................................................................ 6
2 LITERATURE REVIEW ................................................................................................................. 6
2.1 MANAGEMENT PRACTICES FOR SHEEP ........................................................................................ 6
2.1.1 Housing ................................................................................................................................. 6
2.1.2 Breeding ................................................................................................................................ 6
2.1.3 Feeding .................................................................................................................................. 7
2.1.4 Productivity ........................................................................................................................... 7
2.1.5 Farmers’ Perceptions to Sheep Keeping ................................................................................ 8
2.2 CONSTRAINTS ............................................................................................................................. 8
CHAPTER 3 ................................................................................................................................................ 9
3 MATERIALS AND METHODS ...................................................................................................... 9
3.1 STUDY AREA .............................................................................................................................. 9
3.1.1 Location ................................................................................................................................. 9
3.1.2 Climate .................................................................................................................................. 9
3.1.3 Soils ....................................................................................................................................... 9
3.1.4 Vegetation ............................................................................................................................. 9

vii
page
3.1.5 Agricultural systems .............................................................................................................. 9
3.1.6 Sheep Status ........................................................................................................................ 11
3.2 DATA COLLECTION AND ANALYSIS .......................................................................................... 12
3.2.1 Primary data ........................................................................................................................ 12
3.2.2 Secondary data .................................................................................................................... 12
3.2.3 Data Analysis ...................................................................................................................... 12
CHAPTER 4 .............................................................................................................................................. 13
4 RESULTS AND DISCUSSION ...................................................................................................... 13
4.1 FARMER AND NON-SHEEP FARMER DEMOGRAPHY..................................................................... 13
4.2 SHEEP MANAGEMENT PRACTICES ............................................................................................. 18
4.2.1 Acquisition of original breeding stock and utilisation of sheep .......................................... 18
4.2.2 Flock Sizes and Composition .............................................................................................. 19
4.2.3 Housing ............................................................................................................................... 20
4.2.4 Breeding systems ................................................................................................................. 20
4.2.5 Feeding Systems .................................................................................................................. 21
4.2.6 Perceptions towards sheep keeping ..................................................................................... 23
4.2.7 Marketing of sheep .............................................................................................................. 27
4.2.8 Constraints met by sheep farmers in Kaluluma EPA .......................................................... 30
4.3 URBAN MUTTON CONSUMPTION .............................................................................................. 34
4.4 PROPOSED SOLUTIONS TO SOME OF THE IDENTIFIED CONSTRAINTS ......................................... 36
4.4.1 Improving farmers’ livestock management skills ................................................................ 36
4.4.2 Improving the marketing systems ....................................................................................... 37
4.4.3 Out competing importation.................................................................................................. 37
CHAPTER 5 .............................................................................................................................................. 38
5 CONCLUSION ................................................................................................................................ 38
6 LITERATURE CITED ................................................................................................................... 39
APPENDICES ........................................................................................................................................... 44
APPENDIX I .......................................................................................................................................... 45
APPENDIX II ......................................................................................................................................... 56

viii
LIST OF TABLES
Page
Table 1: 2007 Malawi livestock and meat production figures ........................................... 2
Table 2: Sheep population in Kasungu RDP by EPA ..................................................... 11
Table 3: Demographic characteristics of Sheep and Non-sheep farmers in Kaluluma EPA
........................................................................................................................... 14
Table 4: Livestock ownership by sheep and non-sheep farmers in Kaluluma EPA ........ 16
Table 5: Land allocation to various crops by sheep and non-sheep farmers in Kaluluma
EPA ................................................................................................................... 16
Table 6: Livestock status in Kasungu RDP ..................................................................... 17
Table 7: Religion of sheep farmers .................................................................................. 17
Table 8: Method of acquisition of initial breeding stock ................................................. 18
Table 9: Farmers’ ways of utilizing sheep ....................................................................... 19
Table 10: Sheep flock age structure in Kaluluma ............................................................ 19
Table 11: Types of sheep housing in Kaluluma E.P.A .................................................... 20
Table 12: Reasons for not supplementing the sheep ........................................................ 22
Table 13: Range of farm gate prices for livestock in 2005 and 2006 in Kasungu. .......... 25
Table 14 Occasions for domestic mutton consumption by sheep farmers ...................... 26
Table 15 Preference of mutton in relation to other familiar red meats by sheep farmers in
Kaluluma EPA .................................................................................................. 26
Table 16: Constraints to sheep production in Kaluluma EPA ......................................... 31
Table 17: Methods of sheep disposal in Kaluluma EPA................................................. 32
Table 18: Farmers perceived constraints with increased level of production .................. 33
Table 19: Farmer suggested solutions to constraints ....................................................... 33
Table 20: Mutton prices for various cuts in selected Lilongwe retail outlets. ................. 34
ix
LIST OF FIGURES
Page
Figure 1: Map of Malawi showing ADDs and location of Kaluluma EPA ..................... 10
Figure 2: Household sizes of sheep farmers in Kaluluma EPA ....................................... 13
Figure 3: Numbers of lambings (in 2005) by month as reported by sheep farmers in
Kaluluma EPA .................................................................................................. 21
Figure 4: Equipments used to give supplementary feed to sheep .................................... 23
Figure 5: Preference to keeping livestock species based on perceived profitability........ 25
Figure 6: Trends in sheep-meat prices in Kaluluma EPA ................................................ 29
Figure 7: Trends in sheep-meat prices sold by Shoprite from 2005-2007 ....................... 35

x
LIST OF ACRONYMS USED IN THIS REPORT
ADD Agricultural Development Division
BSDA The British Sheep Diary Association
DAHLD Department of Animal Health and Livestock Development
DFID Department for International Development
EPA Extension Planning Area
FAO Food and Agriculture Organization
FEWSNET Famine Early Warning Systems Network
GDP Gross Domestic Product
GOM Government of Malawi
HB Halaal Butchery
JCE Junior Certificate of Education
MGDLP Malawi Germany Livestock Development Programme
MOAFS Ministry of Agriculture and Food Security
MSCE Malawi School Certificate of Education
NPF Nando Perreti Founadtion
PRB Population Reference Bureau
RDP Rural Development Project
SD Standard Deviation
SPSS Statistical Package for Social Scientists
SNF Solids Not Fat

1
CHAPTER 1
1 INTRODUCTION
1.1 Background Information
Malawi is a small, elongated country covering an area of 118,500 km2
of which about
24% is covered by water. Part of the 76%, that is dry land, is marginal (mountainous,
rocky or too infertile). Despite its size, Malawi is one of the most densely populated
countries in the Sub-Saharan Africa. The current population is 12.8million (PRB, 2006)
and it is projected to reach 23.8 million by mid-2025 at the population growth rate of
2.6% per annum. Unfortunately, food production including livestock production is not
growing at the same pace therefore by 2010 Malawi is expected to face massive deficits
in the supply of animal protein (GOM, 2005). Unless production increases, the country
will have to continue to import substantial amounts of livestock products, which could
be a drain on foreign. Currently 2.16% of total meat and 0.05% of small ruminants
meat consumed in Malawi is imported (FAO, 2005). Meat consumption still remains
low at 4.5Kg/capita/year since 1982 (FAO, 2005). It is estimated that 22% of the Malawi
population does not meet their nutritional requirements and Malnutrition is common,
especially kwashiorkor (protein deficiency) and Pellagra (vitamin B group deficiency).
In Malawi 45% of all under–five-year old children suffer from moderate to severe
stunting (DFID, 2007; NPF, 2007).
1.2 Livestock Production
Livestock constitutes a small sub-sector in the overall agricultural economy in Malawi,
contributing about 9.9 % to the agricultural GDP but it involves over 50% of the
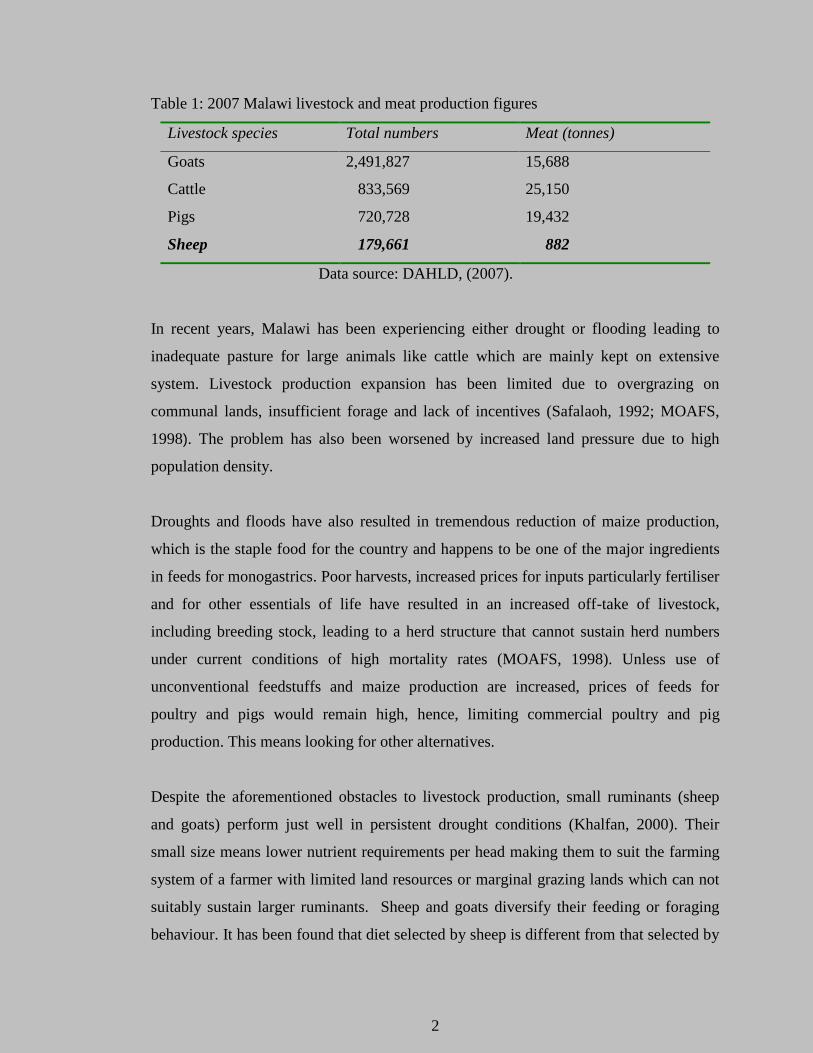
estimated 3 million smallholder families, (FAO, 2005). Table 1 shows Malawi livestock
and meat production figures for 2007.
2
Table 1: 2007 Malawi livestock and meat production figures
Livestock species Total numbers Meat (tonnes)
Goats 2,491,827 15,688
Cattle 833,569 25,150
Pigs 720,728 19,432
Sheep 179,661 882
Data source: DAHLD, (2007).
In recent years, Malawi has been experiencing either drought or flooding leading to
inadequate pasture for large animals like cattle which are mainly kept on extensive
system. Livestock production expansion has been limited due to overgrazing on
communal lands, insufficient forage and lack of incentives (Safalaoh, 1992; MOAFS,
1998). The problem has also been worsened by increased land pressure due to high
population density.
Droughts and floods have also resulted in tremendous reduction of maize production,
which is the staple food for the country and happens to be one of the major ingredients
in feeds for monogastrics. Poor harvests, increased prices for inputs particularly fertiliser
and for other essentials of life have resulted in an increased off-take of livestock,
including breeding stock, leading to a herd structure that cannot sustain herd numbers
under current conditions of high mortality rates (MOAFS, 1998). Unless use of
unconventional feedstuffs and maize production are increased, prices of feeds for
poultry and pigs would remain high, hence, limiting commercial poultry and pig
production. This means looking for other alternatives.
Despite the aforementioned obstacles to livestock production, small ruminants (sheep
and goats) perform just well in persistent drought conditions (Khalfan, 2000). Their
small size means lower nutrient requirements per head making them to suit the farming
system of a farmer with limited land resources or marginal grazing lands which can not
suitably sustain larger ruminants. Sheep and goats diversify their feeding or foraging
behaviour. It has been found that diet selected by sheep is different from that selected by

3
goats, cattle and wild animals such as kangaroos so that competition for feed between
species is less than within animals of the same species (Gatenby, 1986). Like cattle,
sheep are grazers; like goats, they also consume woody browse (tree forage and shrubs)
and forbs/herbaceous-plants (Wells et al, 2000). Integrating sheep into a farming
operation can contribute to the economic and environmental sustainability of the whole
farm. Sheep will enhance the farm's biological diversity, and may fit economic and
biological niches that would otherwise go unfilled.
The relatively small investment required, and the gradually increasing size of the flock,
make sheep production a good choice for the beginning small-scale or part-time farmer.
For the established farmer seeking to diversify, sheep offer a number of benefits (Wells
et al, 2000). Small sizes also allow small yields of meat per head which are well suited
to the daily needs of subsistence families with limited ability to preserve surplus food
products (Mithi, 1991).
Additionally, the small size the of sheep and goats makes them reach sexual maturity
early. Added to this, is the fact that sheep and goats have short generation intervals
which when coupled with good management two parturitions per year or three
parturitions in two years is made possible. This leads to rapid build up of heard numbers
resulting in lower costs per animal and more rapid cash flow making sheep and goats
less risky investments and likely to be affordable by poor farmers. Several other
advantages of sheep exist.
Advantages of keeping sheep over goats
There are several advantages of sheep over goats including the following:
Sheep are more docile and hence easier to look after than goats.
Lambs grow faster than kids and also attain higher live weights suggesting that it
would be more efficient to rear lambs than kids for meat production, especially
during the first four weeks (Rey et al, 1994).
Sheep can be kept to provide milk, skin, lamb, mutton or wool, these are altogether
different enterprises for the farmer, and whichever suits the local environment can be
4
selected therefore offering greater flexibility. Devendra (1982) reported that wool
from tropical breeds of sheep is coarse, therefore suitable for carpet manufacture;
this would be the birth of another potentially important industry. It was also reported
that skins from sheep are greater in value than that from goats. Mtimuni (2006,
Personal communication) reported that clothes made from wool are of very high
quality and fetch higher prices.
Milk from sheep has more solids per unit volume than either cow’s milk or goat’s
milk, (Janda, 1996; BSDA, 2007) and also contains more fat (6-7.5%), solids-not-fat
(SNF), proteins and total ash. The milk provides twice as much yield of cheese than
cow’s milk and also provides some relief to sufferers who can not tolerate cow’s
milk proteins (BSDA, 2007).
Sheep (especially hair sheep) are more resistant to gastro intestinal parasitism than
goats (Miller and Zajac, 2005; Wildeus and Zajac, 2005).
Albeit these advantages, sheep are also disadvantageous in that
Since they are docile, they can be easily stolen
They are associated with religious taboos (Banda, 1992).
Despite their advantages, sheep production is relatively low compared to goats and little
is known about the status of sheep and constraints faced by sheep farmers in Malawi.
1.3 Justification
The population of Malawi is increasing at a high rate and there is need for increased
meat production to meet the demand. Increased production will ensure that importation
is reduced, eliminated or possibly lead to exportation of meat so as to get foreign
exchange that is essential for the growth of any economy.
Past national projects such as Malawi German Livestock Development Programme
(MGLDP) that ran from 1983 to 1994 aimed at improving production of livestock
including sheep. However, since it phased out sheep production has been dormant or
declining and little is known about its status to-date. Therefore, there is a need to carry
out a study to evaluate the role and status of sheep production in order to identify the

5
reasons why the sector is not improving. The study will also document management
practices followed by farmers in sheep production to identify areas that need
intervention. The information obtained is also expected to initiate development of a
research and development agenda for sheep production in Malawi.
1.4 Objectives
1.4.1 Main Objective
The main objective of the study was to evaluate the status and constraints to sheep
production in Malawi.
1.4.2 Specific Objectives:
1) To assess sheep production management systems and practices followed by
farmers in Kaluluma EPA.
2) To determine marketing systems of sheep and sheep products in Kaluluma
EPA and Lilongwe City.
3) To identify and document farmers perception towards sheep production
4) To identify constraints met by the farmers in relation to sheep production
5) To seek solutions to identified constraints.

6
CHAPTER 2
2 LITERATURE REVIEW
2.1 Management Practices for Sheep
2.1.1 Housing
Losada et al (1996) studying on sheep in Xochimilco (Southeast of Mexico City) found
that housing conforms largely (79%) to the use of a pen to care for the animals during
the night in the producer’s backyard whereas a minor proportion (21%) house them
actually in their own home or in the field. Only nine percent housed the sheep in a type
of shed in the corral. In Malawi special housing is constructed for all livestock species
except for cattle, which are kept in unprotected kraals made of wood and wire mesh
(Mutsuyo et al, 2006)
It is important to provide proper housing to sheep. This is particularly important to
pregnant ewes and lambs because heat or cold stress affect birth weights and
survivability of lambs (Early et al, 1991; Falck et al, 2002).
2.1.2 Breeding
Indigenous breeds of livestock are known to be hardy and survive harsh conditions such
as low quality feeds and local diseases (Mutsuyo et al, 2006). However, local breeds
also tend to be low producing. Unfortunately there has been no deliberate effort to
purposely select and preserve high producing local breed of sheep. Some breeds have
been identified that can improve the local sheep in terms of birth weights, pre-weaning
average daily weight gains, weaning weight and earlier attainment of slaughter weight of
25±5kg (Piringu, 1990) which should be attained within 5 weeks for profitability.
It has been recommended that there is need to choose a most promising lambing season
to ensure that lambing take place at the time of lush grazing so that ewes are in good
condition to supply lambs with sufficient milk i.e. towards the end of dry season
(Piringu, 1990). However, sheep are left to breed freely i.e. rams run with ewes freely
such that breeding is not controlled (Mutsuyo et al, 2006) as such lambing has been
reported to occur throughout the year (Mithi, 1991).
7
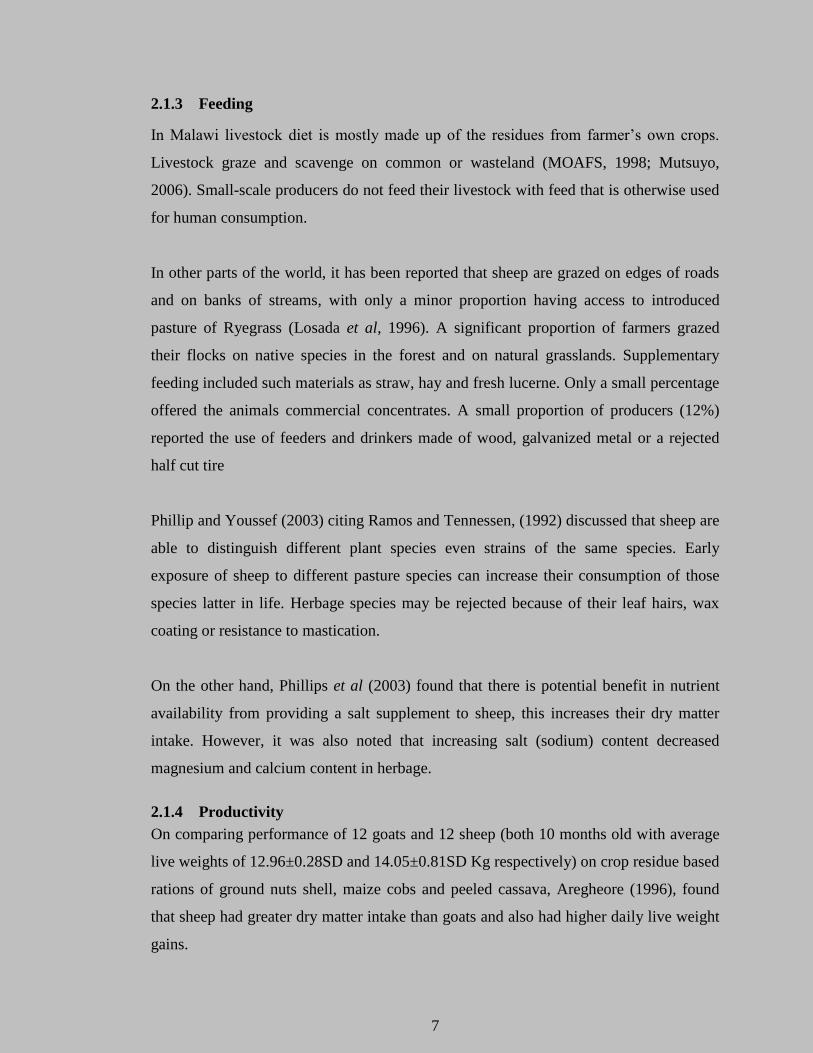
2.1.3 Feeding
In Malawi livestock diet is mostly made up of the residues from farmer’s own crops.
Livestock graze and scavenge on common or wasteland (MOAFS, 1998; Mutsuyo,
2006). Small-scale producers do not feed their livestock with feed that is otherwise used
for human consumption.
In other parts of the world, it has been reported that sheep are grazed on edges of roads
and on banks of streams, with only a minor proportion having access to introduced
pasture of Ryegrass (Losada et al, 1996). A significant proportion of farmers grazed
their flocks on native species in the forest and on natural grasslands. Supplementary
feeding included such materials as straw, hay and fresh lucerne. Only a small percentage
offered the animals commercial concentrates. A small proportion of producers (12%)
reported the use of feeders and drinkers made of wood, galvanized metal or a rejected
half cut tire
Phillip and Youssef (2003) citing Ramos and Tennessen, (1992) discussed that sheep are
able to distinguish different plant species even strains of the same species. Early
exposure of sheep to different pasture species can increase their consumption of those
species latter in life. Herbage species may be rejected because of their leaf hairs, wax
coating or resistance to mastication.
On the other hand, Phillips et al (2003) found that there is potential benefit in nutrient
availability from providing a salt supplement to sheep, this increases their dry matter
intake. However, it was also noted that increasing salt (sodium) content decreased
magnesium and calcium content in herbage.
2.1.4 Productivity
On comparing performance of 12 goats and 12 sheep (both 10 months old with average
live weights of 12.96±0.28SD and 14.05±0.81SD Kg respectively) on crop residue based
rations of ground nuts shell, maize cobs and peeled cassava, Aregheore (1996), found
that sheep had greater dry matter intake than goats and also had higher daily live weight
gains.

8
2.1.5 Farmers’ Perceptions to Sheep Keeping
Mithi (1991) on assessing farmers’ perspectives (in Chamama EPA of Kasungu ADD)
to lamb fattening scheme found that farmers were satisfied with the fattening scheme
because
Sheep allowed good additional income
Source of manure
Local resources required
Low labour demand
Takes shorter time to get results than crop enterprises
Farmers kept sheep mainly because
It provided cash income
Paying of casual labours
Slaughtering during funerals
2.2 Constraints
The major constraints to sheep production in the tropics identified so far are:
Diseases and parasites, lack of organized marking system, unfavourable environment
due to poor housing and feeding, use of animals with low genetic potential and theft
(Winrock International, 1983; Mithi, 1991; Mutsuyo et al, 2006). Mithi (1991) identified
problems met by farmers to lamb fattening in Lower Shire ADD as limited lamb supply,
shortages of maize bran, insufficient groundnuts tops and death of lambs.

9
CHAPTER 3
3 MATERIALS AND METHODS
3.1 Study Area
3.1.1 Location
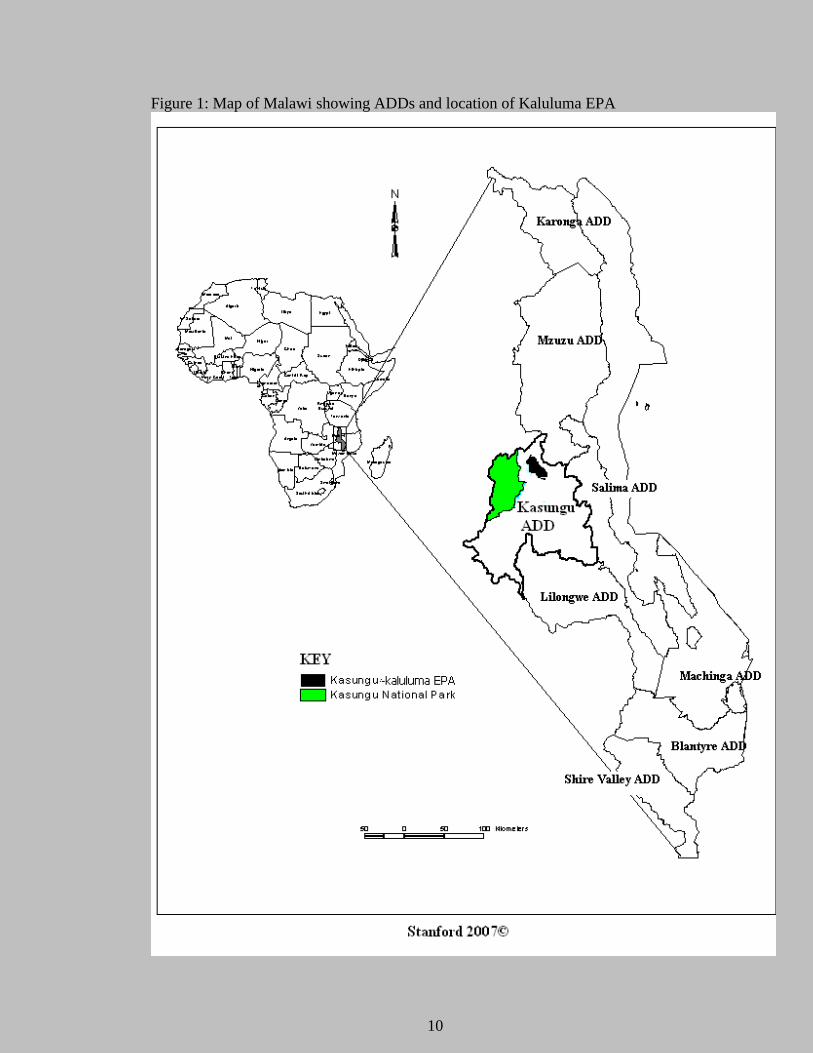
The study was carried out in Kaluluma Extension Planning Area (EPA) of Kasungu
Rural Development Program (RDP) in Kasungu Agricultural Development Division
(ADD) between June and August 2006 (see figure1 for location of Kaluluma EPA).
The area is in Central Region of Malawi and was chosen because it has the highest
numbers of sheep per farmers in Kasungu RDP and was comparatively more accessible
to the researcher in terms of location and language spoken.
3.1.2 Climate
Kasungu is on the altitude ranging from 975-1341m above sea level and it experiences
three types of seasons: cool-dry-season (May-August), hot-dry season (Sept-Nov) and
hot-wet season (Dec-April). Annual rainfall ranges from 762-1006 mm per annum of
which 90% fall between November to April and highest temperature is experienced in
October to November (25-32 ºC) while the lowest in June to July (10-15ºC).
3.1.3 Soils
Soils that are common are ferruginous, dark red to reddish brown in colour and have a
sandy clay loam as topsoil over a sandy clay or clay subsoil. These developed from basic
rocks to intermediate composition resulting in weakly to moderate acidic soils pH (5-6).
3.1.4 Vegetation
The vegetation in Kasungu is characterised as open canopy (savannah) woodland, and
the tree species being Brachystegia, Julbernadia and Isoberlinia spp. Much has been
cleared for tobacco, maize and groundnuts cultivation.
3.1.5 Agricultural systems
Smallholder farmers primarily grow maize, groundnuts, tobacco, sweet potatoes,
cassava, pumpkins and beans while estate owners grow burley and fire cured tobacco
(Chilongo, 2005).
10
Figure 1: Map of Malawi showing ADDs and location of Kaluluma EPA
11
In Kasungu, there is significant livestock production of cattle, sheep, goats and poultry.
Except for poultry, the rest are grazed in ground water seepage areas.
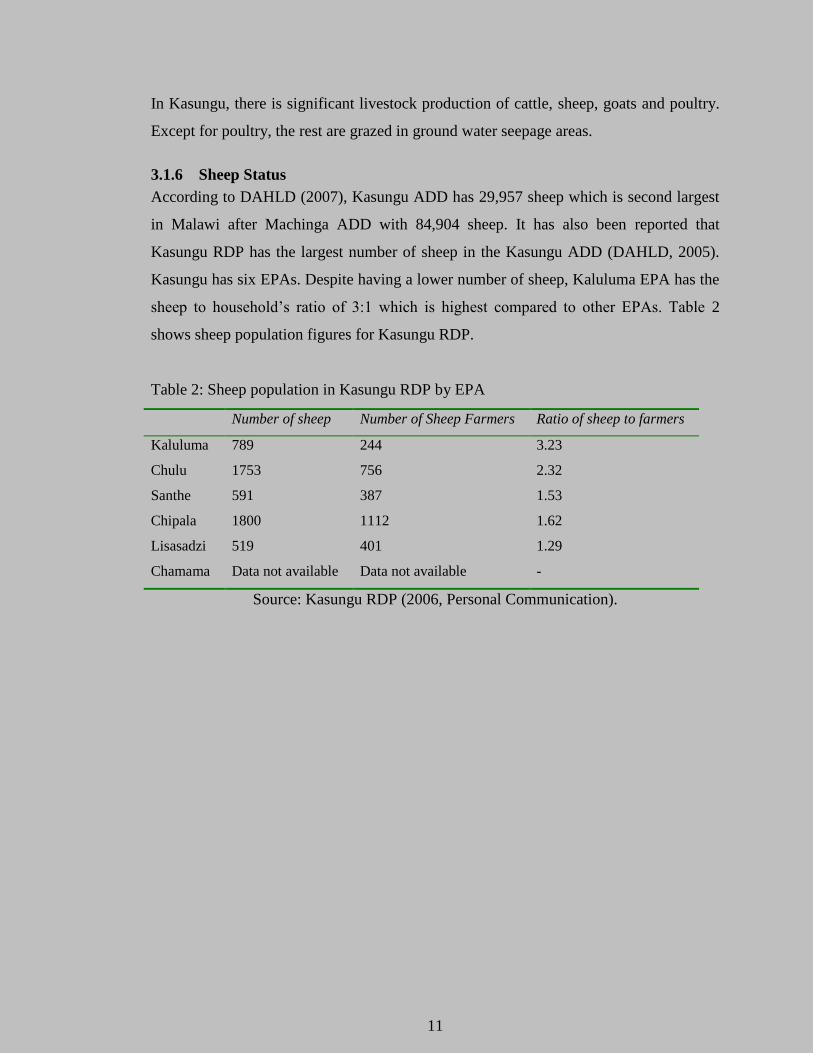
3.1.6 Sheep Status
According to DAHLD (2007), Kasungu ADD has 29,957 sheep which is second largest
in Malawi after Machinga ADD with 84,904 sheep. It has also been reported that
Kasungu RDP has the largest number of sheep in the Kasungu ADD (DAHLD, 2005).
Kasungu has six EPAs. Despite having a lower number of sheep, Kaluluma EPA has the
sheep to household’s ratio of 3:1 which is highest compared to other EPAs. Table 2
shows sheep population figures for Kasungu RDP.
Table 2: Sheep population in Kasungu RDP by EPA
Source: Kasungu RDP (2006, Personal Communication).
Number of sheep Number of Sheep Farmers Ratio of sheep to farmers
Kaluluma 789 244 3.23
Chulu 1753 756 2.32
Santhe 591 387 1.53
Chipala 1800 1112 1.62
Lisasadzi 519 401 1.29
Chamama Data not available Data not available -

12
3.2 Data Collection and Analysis
3.2.1 Primary data
Primary data was collected through a survey. A total of 40 farmers (30 sheep farmers
and 10 non-sheep farmers) were randomly selected and administered with a
questionnaire. Additional information was also collected from 5 butcher-men and 5 meat
processors and retail outlets in order to assess marketing of sheep and sheep products.
For the farmers, data was collected using a structured questionnaire that sought
information on management practices used by farmers, constraints met in sheep
production, farmers’ perception to sheep farming and marketing of sheep and sheep
products in Kaluluma. More data on marketing of sheep and sheep products was
collected from retail outlets and meat processors including butcher men and retail outlets
selling livestock products by use of questionnaires. The retail outlets were Shoprite,
Butchery King (Halaal), Talu Halaal Butchery, Flatlands Halaal Butchery and 7-eleven
Butchery.
3.2.2 Secondary data
Secondary data was collected from all related texts, journal articles and other published
documents such as livestock census reports and documents from the Department of
Animal Health and Livestock Development (DAHLD) and from the Internet.
3.2.3 Data Analysis
Data was analysed using SPSS 11 and 12 for windows and Ms Excel. Frequencies were
used compute percentage distributions for non-categorical variables where as
Descriptive Statistics were used to compute means and Standard Deviations (SD) for the
various parameters.
13
CHAPTER 4
4 RESULTS AND DISCUSSION
4.1 Farmer and non-sheep farmer demography
Demographic data of respondents is shown on Table 3. Of the total number of
households keeping sheep interviewed it was found that 96.7% were male headed.
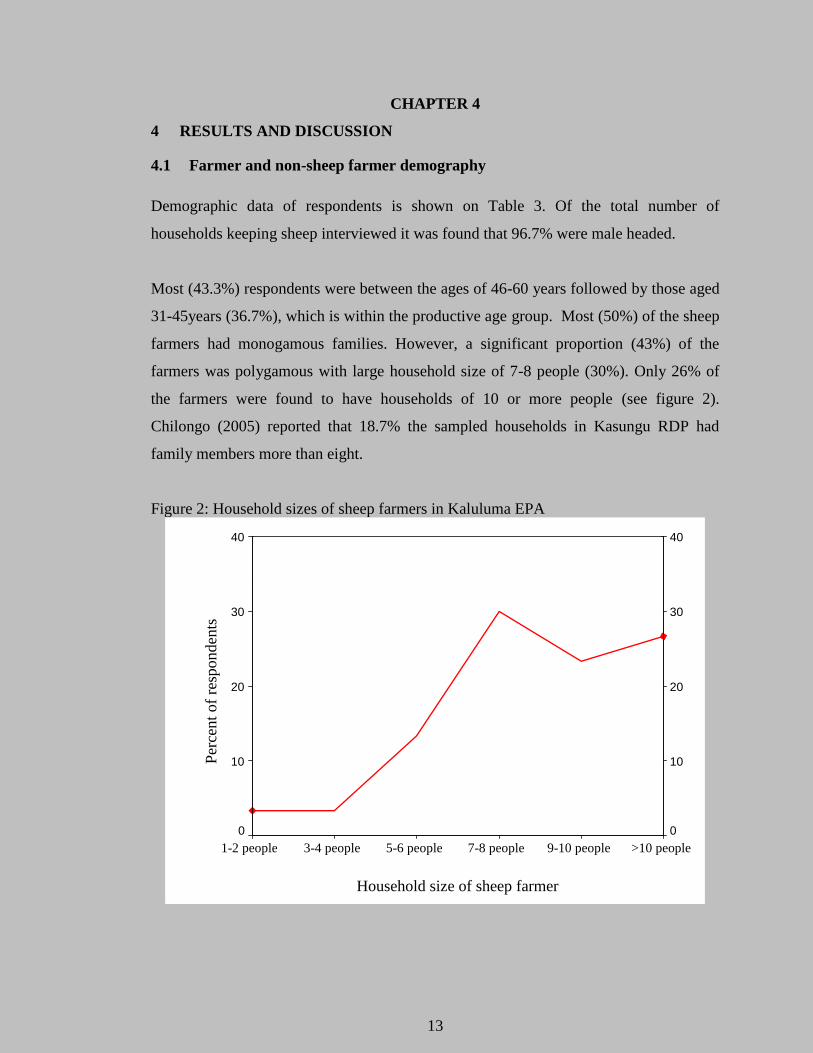
Most (43.3%) respondents were between the ages of 46-60 years followed by those aged
31-45years (36.7%), which is within the productive age group. Most (50%) of the sheep
farmers had monogamous families. However, a significant proportion (43%) of the
farmers was polygamous with large household size of 7-8 people (30%). Only 26% of
the farmers were found to have households of 10 or more people (see figure 2).
Chilongo (2005) reported that 18.7% the sampled households in Kasungu RDP had
family members more than eight.
Figure 2: Household sizes of sheep farmers in Kaluluma EPA
Household size of sheep farmer
>10 people 9-10 people 7-8 people 5-6 people 3-4 people 1-2 people
Per
cent
of
resp
onden
ts
40
30
20
10
0
40
30
20
10
0
14
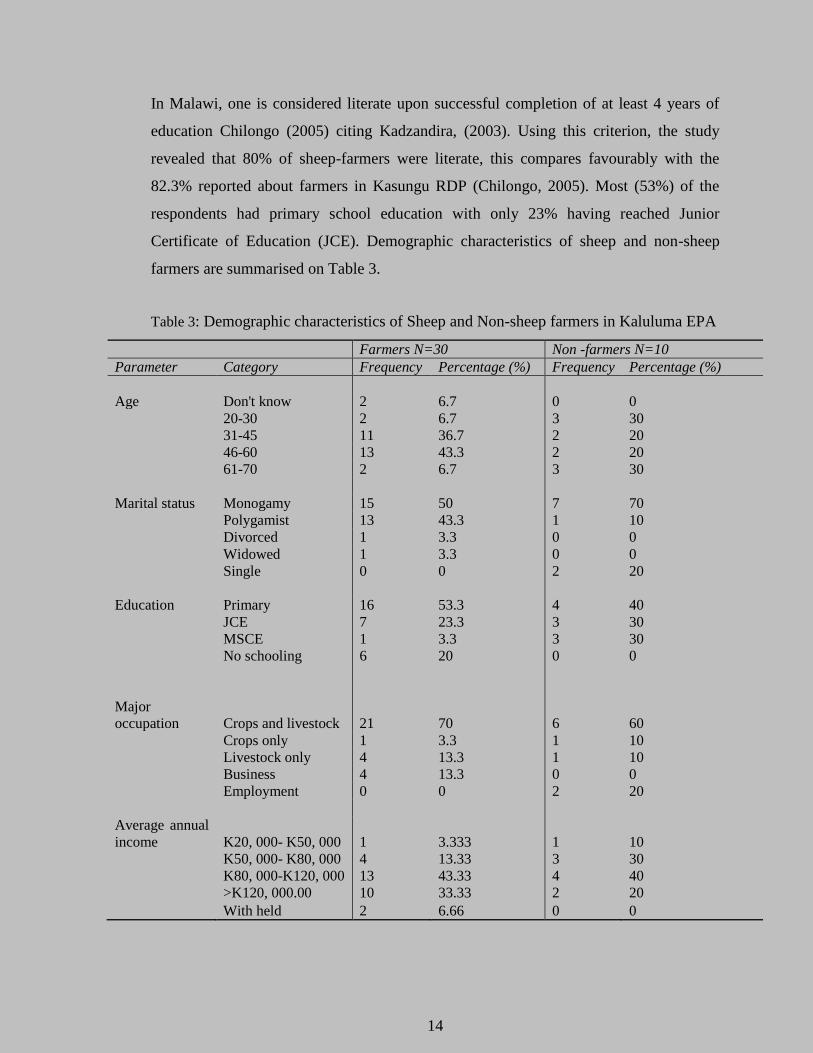
In Malawi, one is considered literate upon successful completion of at least 4 years of
education Chilongo (2005) citing Kadzandira, (2003). Using this criterion, the study
revealed that 80% of sheep-farmers were literate, this compares favourably with the
82.3% reported about farmers in Kasungu RDP (Chilongo, 2005). Most (53%) of the
respondents had primary school education with only 23% having reached Junior
Certificate of Education (JCE). Demographic characteristics of sheep and non-sheep
farmers are summarised on Table 3.
Table 3: Demographic characteristics of Sheep and Non-sheep farmers in Kaluluma EPA
Farmers N=30 Non -farmers N=10
Parameter Category Frequency Percentage (%) Frequency Percentage (%)
Age Don't know 2 6.7 0 0
20-30 2 6.7 3 30
31-45 11 36.7 2 20
46-60 13 43.3 2 20
61-70 2 6.7 3 30
Marital status Monogamy 15 50 7 70
Polygamist 13 43.3 1 10
Divorced 1 3.3 0 0
Widowed 1 3.3 0 0
Single 0 0 2 20
Education Primary 16 53.3 4 40
JCE 7 23.3 3 30
MSCE 1 3.3 3 30
No schooling 6 20 0 0
Major
occupation Crops and livestock 21 70 6 60
Crops only 1 3.3 1 10
Livestock only 4 13.3 1 10
Business 4 13.3 0 0
Employment 0 0 2 20
Average annual
income K20, 000- K50, 000 1 3.333 1 10
K50, 000- K80, 000 4 13.33 3 30
K80, 000-K120, 000 13 43.33 4 40
>K120, 000.00 10 33.33 2 20
With held 2 6.66 0 0

15
The major occupation that is source of income for both sheep and non-sheep farmers
was farming (both crop and livestock). Average land holding sizes for sheep farmers
were 10.233±6.92SD, this is higher than 6.75±4.404SD for non-sheep farmers. The
bigger land sizes enable sheep farmers to grow a variety of crops more that non-sheep
farmers and they also tend to keep a wider range of livestock species (see Tables 4 and
5). Chilongo (2005) on assessing marketing systems in Kasungu RDP also reported that
there are very few (1.7%) farmers that keep sheep, the majority were found to keep
chickens and goats (see Table 6). On the other hand, sheep farmers have been reported
to have higher incomes than non sheep farmers (Mithi, 1991). In this study however,
incomes for sheep farmers and non sheep farmers were largely the same (see Table 3)
with the majority having an annual income ranging from K80, 000.00-K120, 000.00.
Most sheep farmers got their income from sales of various crop and livestock products.
Livestock sales contribute 5-15% of incomes of both poor and rich farmers in Kasungu-
Lilongwe plain (Earl et al, 1996).
A significant proportion (30%) of non-sheep farmers were aged (over 60 years) and
relied on remittances from employed children which is taken as part of their annual
income (Earl et al, 1996). Employment (as a labourer) and remittances have been
reported to contribute up to 50-60% to the annual incomes of the poor in Kasungu (Earl
et al, 1996). Only 20% of non-sheep farmers were employees.

16
Table 4: Livestock ownership by sheep and non-sheep farmers in Kaluluma EPA
Table 5: Land allocation by sheep and non-sheep farmers in Kaluluma EPA
Sheep farmers N=30 Non-sheep farmers N=10
Use Percentage (%) Mean ±SD. Percentage (%) Mean ±SD
Hectares/farmer 100 10.233±6.92 100 6.75±4.404
Maize 100 2.931±1.516 100 2.50±2.027
Tobacco 73 2.136±1.037 20 0.75±0.353
Groundnuts 46.67 1.250±0.826 70 0.857±0.377
Cassava 36.67 1.523±0.826 20 1
Common beans 10.00 1.333±1.443 0
Sweet potatoes 13.33 0.375±0.144 10 1
Millet 3.33 0.5 0
Fallow 76.667 3.370±2.515 0
Sheep Farmers N=30 Non-sheep Farmers N=10
Species Frequency (%) Mean ±SD Frequency (%) Mean ±SD
Sheep 100 5.433±4.469 0
Goats 86 7.077±5.321 70 6.857±6.517
Cattle 63.7 7.263±6.054 30 4.333±4.932
Pigs 63.7 3.79±1.653 40 3.75±3.095
Chicken 60 21.50±56.132 90 10.00±5.809
Rabbit 13.3 4.50±4.123 40 4.25±3.304
Doves 10 13.67±9.609 0
Guinea pigs 3.3% 0
Guinea Fowl 0 20 8.5±7.778

17
Table 6: Livestock status in Kasungu RDP
Livestock Frequency Percentage (%)
Chickens 105 87.5
Goats 68 56.7
Pigs 38 31.7
Cattle 16 13.3
Sheep 2 1.7
Source: Chilongo (2005)
All farmers were religious. They belonged to various religious affiliations such as
Catholic, Presbyterian, Community Christ and Assemblies of God. The majority (73%)
were Catholics (see Table 7). However, both sheep farmers and non-farmers did not
report to be influenced by their religious affiliations to keep sheep or not, nor were any
religious taboos reported to be associated with sheep farming. Banda (1992), however,
reported religious taboos to be affecting both production and utilization of sheep
especially in people originating from areas along the Lake.
Table 7: Religion of sheep farmers
Religious Affiliation Percent of respondents
Catholic 73.3
Last Church of God 16.8
Community Christ 3.3
Presbyterian 3.3
Assemblies of God 3.3
18
4.2 Sheep Management Practices
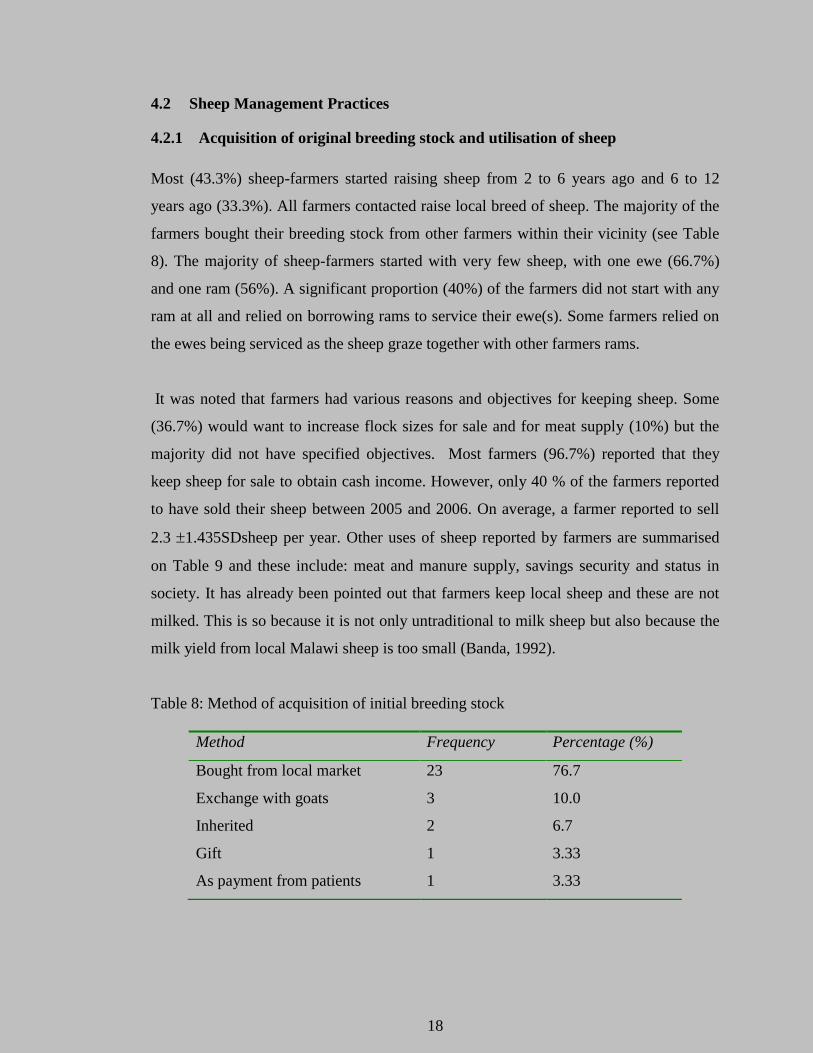
4.2.1 Acquisition of original breeding stock and utilisation of sheep
Most (43.3%) sheep-farmers started raising sheep from 2 to 6 years ago and 6 to 12
years ago (33.3%). All farmers contacted raise local breed of sheep. The majority of the
farmers bought their breeding stock from other farmers within their vicinity (see Table
8). The majority of sheep-farmers started with very few sheep, with one ewe (66.7%)
and one ram (56%). A significant proportion (40%) of the farmers did not start with any
ram at all and relied on borrowing rams to service their ewe(s). Some farmers relied on
the ewes being serviced as the sheep graze together with other farmers rams.
It was noted that farmers had various reasons and objectives for keeping sheep. Some
(36.7%) would want to increase flock sizes for sale and for meat supply (10%) but the
majority did not have specified objectives. Most farmers (96.7%) reported that they
keep sheep for sale to obtain cash income. However, only 40 % of the farmers reported
to have sold their sheep between 2005 and 2006. On average, a farmer reported to sell
2.3 1.435SDsheep per year. Other uses of sheep reported by farmers are summarised
on Table 9 and these include: meat and manure supply, savings security and status in
society. It has already been pointed out that farmers keep local sheep and these are not
milked. This is so because it is not only untraditional to milk sheep but also because the
milk yield from local Malawi sheep is too small (Banda, 1992).
Table 8: Method of acquisition of initial breeding stock
Method Frequency Percentage (%)
Bought from local market 23 76.7
Exchange with goats 3 10.0
Inherited 2 6.7
Gift 1 3.33
As payment from patients 1 3.33

19
Table 9: Farmers’ ways of utilizing sheep
Method Percent of respondents
Sales for cash income 96.7
Meat supply 90
Source of manure 60
Savings security 50
Status in society 3.3
4.2.2 Flock Sizes and Composition
Average flock size per farmers was found to be 5.433±4.469SD. It was found that there
were more female sheep than male sheep (2.47 times) and that even more female lambs
were born compared to male lambs (see Table 10 for a summary of flock structures).
From Table 10, it is noted that there are more old ewes (≥4 years old) than other age
groups. Farmers sell old ewes and rams to butcher-men and they do not sell lambs.
Therefore the lower numbers of lambs might be attributed to high mortality rates or low
fertility. These two factors have been reported as one of the major constraints to sheep
production met by sheep farmers in the area (see Table 16).
Table 10: Sheep flock age structure in Kaluluma
Female Sheep Male Sheep Combined
Age (years) 1 ≤ 2- 3 ≥4 1 ≤ 2- 3 ≥4
Total 24 39 53 19 14 14 163
Mean 1.5 2.167 2.12 1.2 1.231 1.077 5.433
SD ±0.816 ±2.203 ±1.509 ±0.414 ±0.599 ±0.277 ±4.469
Total 116 47 163

20
4.2.3 Housing
Most farmers realise the importance of providing housing for sheep. There are different
types of houses used, however the most common one was pole with thatch (60%) and
raised khola without thatch (20%), (see Table 11). It was also noted that rams ewes and
lambs are housed together all the time except where farmers have raised khola then
lambs are housed in a separate house (usually a kitchen or a vacant old house) until they
gain strength to climb the ladder.
Table 11: Types of sheep housing in Kaluluma E.P.A
Type of house Frequency Percentage (%)
Pole with thatch/roof 18 60
Pole without thatch 6 20
Brick khola 3 10
Mud khola 2 6.7
Farmer house/ kitchen 1 3.3
4.2.4 Breeding systems
All farmers contacted in this study kept local breed of sheep. Most (83.33%) farmers
leave sheep to mate indiscriminately except where a farmer do not have sufficient rams
in which case a ram is borrowed to stay for a few days in order to service the farmer’s
ewes. This was reported to be done during the crop-growing season (starting from
November) where chances of the ewes of a farmer without a ram meeting a ram during
grazing were slim. It was found that sheep farmers are sparsely scattered through out the
EPA, each farmer with a small flock size with an average of 5.433±4.469SD sheep (see
Tables 4 and 10) Having few sheep-farmers that in turn keep small flock sizes coupled
with uncontrolled breeding, it is inevitable that part of the constraints reported by
farmers (see Table 16) such as low fertility and high mortality are effects of inbreeding
worsened by poor nutrition and poor parasite and disease control. No farmer reported to
be castrating unwanted rams. Basic management practices like tail docking, animal
identification and recording are inexistent.

21
No lambing was reported to occur between June and August (see Figure3) and most
lambings were found to occur between October and January and then in May. This
partially agrees with the data reported by Mithi (1991) where most lambings were
reported between November and December. Lambing through out the year was
attributed to the fact that rams and ewes run together through out. It was found that only
17.25% of the total population of sheep were twin born and only 10% of the ewes were
reported to have had lambed twice in 2005.
Figure 3: Numbers of lambings (in 2005) by month as reported by sheep farmers in
Kaluluma EPA
It was noted that no farmer deliberately sets a breeding age for their ewes or rams (from
birth, rams run with ewes all the time), nor do they deliberately wean their lambs. Sheep
breed and wean naturally.
4.2.5 Feeding Systems
All farmers let sheep to graze throughout the year. For those that keep sheep and other
ruminants (see Table 4 for livestock ownership patterns), they herd them together.
During rainy season sheep are herded and only 3.3 % tether them after herding. Few
farmers (33.3%) give supplementary feed to sheep before or after grazing (herding or
scavenging). In dry season farmers keeping small ruminants alone leave them to
scavenge around the homes while those combining with cattle continue herding.
Freedom to scavenge is restricted if the farmer or their neighbour has perennial crops
0
4
8
12
Jan Mar May Jul Sep Nov
Month
Per
centa
ge
(%)

22
such as cassava (see Table 5 for cropping systems) in which case they are compelled to
keep an eye on the scavenging sheep. Farmers have relatively big sects of lands (under
customary land tenure title), which is not restricted to others so it was found that
(26.7%) graze their sheep with their neighbours.
Almost all farmers (97.7%) do not deliberately give drinking water to sheep. During dry
season farmers take their livestock to natural water sources (dambo or river). Small-
ruminants are able to access water by themselves as they scavenge around the homes.
During wet season, livestock drink as they graze.
Supplementation
Most farmers (66.7%) do not supplement their sheep for various reasons. However the
most common one (40%) was that it is their way of raising sheep (traditionally), so it
was not deemed necessary for them to give extra feed to the animals even when they had
some potential feed sources (see Table 12). Other reasons were feed scarcity and lack of
labour.
Table 12: Reasons for not supplementing the sheep
The commonly used (80%) supplementary feed was madeya (Maize bran). Other
supplements were: Napier grass (3.3%), banana leaves obtained from their plantations
(3.3%) and crop residues (3.3%). Very few farmers (3.3%) reported to add salt to the
supplement. On average, the amount of supplement given per flock (average flock size
of 5.433± 4.469SD) was 3.5kg ±1.93SD. Madeya mostly (66.7%) come from domestic
wastes after milling and from neighbours/relatives. Very few (3.3%) farmers own a
maize mill and collect madeya from there. The rest reported to buy madeya. Some
Reason Percent of respondents
Not deemed necessary 40.0
Feed scarcity 26.7
Labour 10.0
23
farmers preserve Napier grass and these are used for various domestic purposes apart
from feeding livestock.
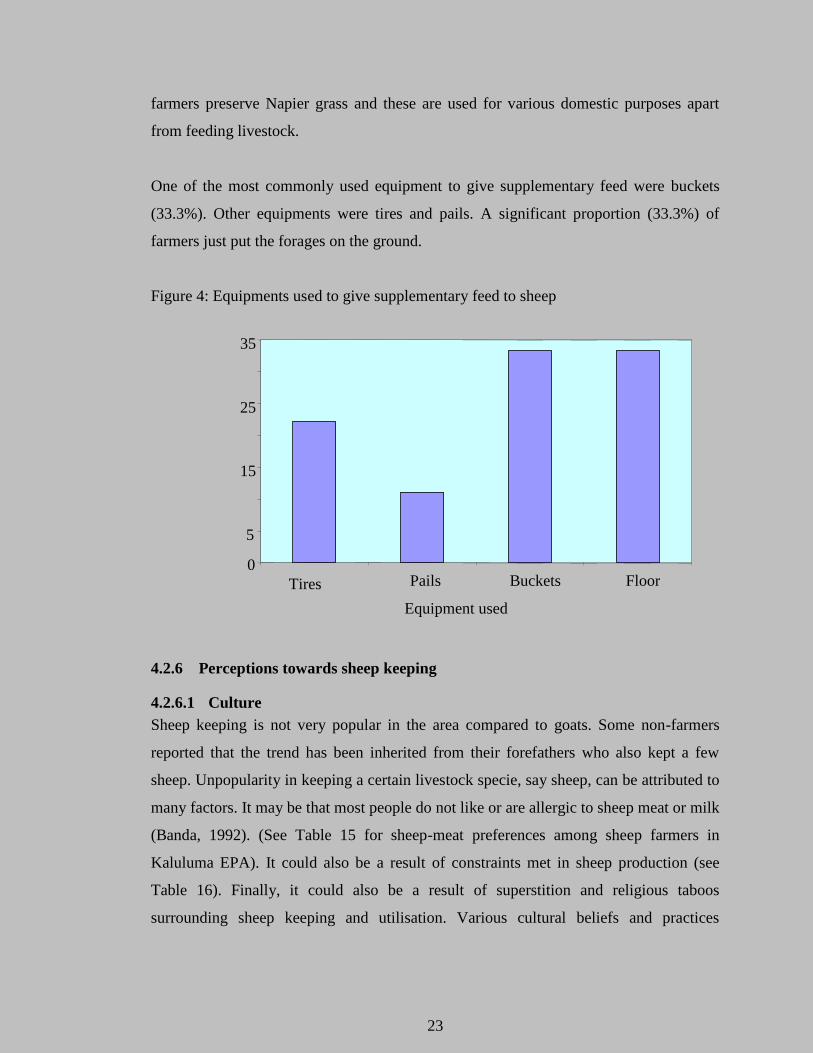
One of the most commonly used equipment to give supplementary feed were buckets
(33.3%). Other equipments were tires and pails. A significant proportion (33.3%) of
farmers just put the forages on the ground.
Figure 4: Equipments used to give supplementary feed to sheep
4.2.6 Perceptions towards sheep keeping
4.2.6.1 Culture
Sheep keeping is not very popular in the area compared to goats. Some non-farmers
reported that the trend has been inherited from their forefathers who also kept a few
sheep. Unpopularity in keeping a certain livestock specie, say sheep, can be attributed to
many factors. It may be that most people do not like or are allergic to sheep meat or milk
(Banda, 1992). (See Table 15 for sheep-meat preferences among sheep farmers in
Kaluluma EPA). It could also be a result of constraints met in sheep production (see
Table 16). Finally, it could also be a result of superstition and religious taboos
surrounding sheep keeping and utilisation. Various cultural beliefs and practices
5
15
25
35
Tires Pails Buckets Floor
Equipment used
Per
centa
ge
of
resp
onden
ts
0

24
concerning sheep that were being followed in Kaluluma EPA have been identified.
These might have affected progress in development of sheep production in the area.
Slaughtering procedure
Before slaughtering, tell the animal in advance (a day before) that it will die the
day to come.
While slaughtering, block the anus with a maize cob to avoid farting that would
be a symbol of bad luck.
Lightning
It was believed that lightning has a ram that can fight against ordinary rams. This
made herding uncomfortable during rainy season as herd-boys feared lightning
strike.
Medicine
The fats obtained after slaughtering sheep are used together with other
substances to make medicine.
It has been reported that consumption of mutton or sheep milk is a religious taboo
(Banda, 1992) especially among the people originating the shores of Lake Malawi. Not
only that, the author continued to report that consumption of milk was unheard of since
the farmers believed that intensity of sneezing make their milk psychologically
unhygienic. However, in the current study no religion-based taboo was reported.
4.2.6.2 Sheep keeping preference in relation to other ruminants
Most farmers would like to keep cattle, then goats or sheep (see figure 5). Farmers’
explanations as to why there were few sheep farmers were that, breeding stock (for both
local or improved breed) is scarce (50%), lack of interest in sheep keeping (33.3%) and
that they are difficult to rear/graze (6.7%)-this is so because normally farmers rely on
herding livestock which is laborious.
Given a choice, most sheep farmers would like to keep cattle because their size means
greater returns after sale. Farm gate prices for sheep in Kasungu are slightly greater than
that of goats (see Table 13). However it is generally perceived that goats are better

25
because of greater prolificacy and resistance to diseases. When data was being collected
(in August 2006), the farm-gate prices for small-ruminants (especially sheep) had just
been badly reduced due to hunger as a result of poor rains.
Figure 5: Preference to keeping livestock species based on perceived profitability
Table 13: Range of farm gate prices for livestock in 2005 and 2006 in Kasungu.
Livestock specie Prices in 2005 (MK) Prices in 2006 (MK)
Cattle 15,000-25,000 9,000-15,000
Goats 1,500-2,500 800-1,200
Sheep 1,800-3,800 700-1,000
Pigs 2,500-4,000 800-1,500
Chicken 150-250 75-150
Source: FEWSNET/Malawi, 2006.
0
5
10
15
20
25
30
35
Cattle Sheep Goats
Livestock species
First Second Third
Per
centa
ge
of
resp
onden
ts
26
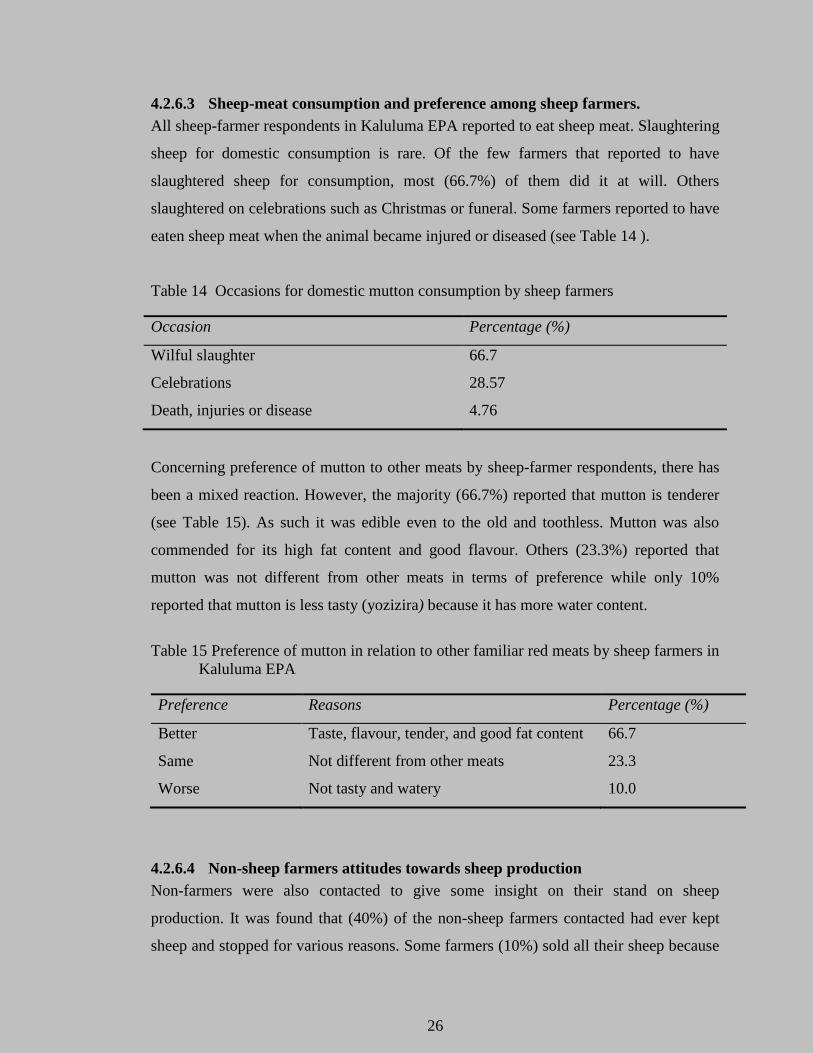
4.2.6.3 Sheep-meat consumption and preference among sheep farmers.
All sheep-farmer respondents in Kaluluma EPA reported to eat sheep meat. Slaughtering
sheep for domestic consumption is rare. Of the few farmers that reported to have
slaughtered sheep for consumption, most (66.7%) of them did it at will. Others
slaughtered on celebrations such as Christmas or funeral. Some farmers reported to have
eaten sheep meat when the animal became injured or diseased (see Table 14 ).
Table 14 Occasions for domestic mutton consumption by sheep farmers
Occasion Percentage (%)
Wilful slaughter 66.7
Celebrations 28.57
Death, injuries or disease 4.76
Concerning preference of mutton to other meats by sheep-farmer respondents, there has
been a mixed reaction. However, the majority (66.7%) reported that mutton is tenderer
(see Table 15). As such it was edible even to the old and toothless. Mutton was also
commended for its high fat content and good flavour. Others (23.3%) reported that
mutton was not different from other meats in terms of preference while only 10%
reported that mutton is less tasty (yozizira) because it has more water content.
Table 15 Preference of mutton in relation to other familiar red meats by sheep farmers in
Kaluluma EPA
Preference Reasons Percentage (%)
Better Taste, flavour, tender, and good fat content 66.7
Same Not different from other meats 23.3
Worse Not tasty and watery 10.0
4.2.6.4 Non-sheep farmers attitudes towards sheep production
Non-farmers were also contacted to give some insight on their stand on sheep
production. It was found that (40%) of the non-sheep farmers contacted had ever kept
sheep and stopped for various reasons. Some farmers (10%) sold all their sheep because

27
they had to attend to emergencies (payment for school fees). Others (10%) saw their
flock being wiped out by diseases where as 10% reported to have lost their sheep due to
mismanagement in the absence of the household head. Most of them (80%) would want
to restart sheep keeping mainly for supply of meat and cash income. The reasons why
they had not yet started by the time the survey was being conducted (June-August 2006)
were:
Lack of source of breeding stock
Lack of capital to buy breeding stock
Non-sheep farmers that were not interested in keeping sheep reported dislike for the
meat. Some (10%) reported that sheep-meat has bad odour and is watery. The rest
reported that sheep meat is not tasty and described it as ‘nyama yake ndi yozizira’.
From non-farmer’s point of view, the problems sheep farmers face that discourage them
from becoming sheep-farmers themselves include:
Sheep are not prolific and are difficult to rear
They are too susceptible to diseases.
Lack of market because of low demand and
Inadequate grazing space
4.2.7 Marketing of sheep
Most farmers (70%) sell live sheep to butcher-men who become responsible for the fate
of the sheep. A few slaughter and sell the carcass locally. Farmers are discouraged from
slaughtering sheep by themselves mostly because they are not sure of the market. Mostly
farmers (83.3%) will sell rams and no lambs were reported to be sold because they
would seek lower prices. Selling rams more than ewes may imply that farmers realise
the importance of keeping only selected rams (though they do not control breeding).
Sheep are sold at a negotiated price considering body condition of the animal which is
assessed visually. If pricing basing on live weight is established it might motivate some
farmers to embark on fattening the sheep with simple supplementation prior to selling so
that the sheep can gain weight and fetch higher prices. Visual assessment combined with
the upper say of butcher-men in the establishment of the selling price of sheep results in

28
low farm-gate prices as such 29.2% of the farmers (that sold sheep) reported
dissatisfaction with the prices (see Table 13 for prices of livestock ).
Enquiring on the willingness of butcher-men in Kaluluma EPA to from contracts with
farmers it was found that most were not willing. Butcher-men wanted to keep profits
they make known to themselves alone. This implied that good profits are made (in
butchering) at the expense of farmers.
On average, a butcher-man slaughter(s) any of the following livestock per week: one
cattle, a pig or 3 goats (including sheep or not depending on availability). In general,
butcher-men tend to specialise in the livestock they slaughter i.e. pig, small ruminants or
cattle slaughtering. The prices for various meats vary with demand as follows:
Beef K250/kg
Goat K220 to K250/kg
Mutton K220 to K250/kg
Pork K220 to K250/kg
There is no grading or packaging of carcass and local consumers normally do not have
preference to specific cuts as long as the quantity and price offers offered are
satisfactory. Figure 6 shows average sheep-meat prices from 2000 to 2006.

29
Figure 6: Trends in sheep-meat prices in Kaluluma EPA
There has been a steady rise in the sheep meat prices except in 2002 where the lower
prices were reported and this was attributed to hunger due to drought that hit Kasungu
including Kaluluma EPA.
Middlemen (who mostly are butcher-men themselves) are generally condemned for
exploiting farmers. They offer too low farm gate prices as compared to retail prices of
the sale product (Anonymous, 1998). However, they too have their side of story.
Butcher-men dealing in sheep-meat reported to face two main problems; low demand
and partial carcass condemnation that reduce the size of saleable carcass.
Low demand of mutton
It has been reported elsewhere that Malawians prefer beef and chicken to other types of
meat (Phoya et al, 1985; Anonymous, 1998; Mutsuyo et al, 2006). Mutton was among
the least preferred type of meat. However, it was also pointed out that preference for
mutton increased with increasing income. As such, it was concluded that low demand
for sheep meat was mainly because of too high retail prices that made it unaffordable to
many Malawians. Sheep-meat was reported to fetch high prices because only a small
0
50
100
150
200
250
Year
Kw
ach
a/K
g
2000 2001 2002 2003 2004 2005 2006
30
quantity of the meat is available on the market. Most of the high quality mutton was
reported to be imported. It was thus recommended that sheep production should be
promoted to cut on importation. However, because of the perceived low demand for
sheep meat there is no development project aimed at promoting sheep production
(Mutsuyo et al, 2006). For example, Banda (1992) reported that milk from sheep was
just as acceptable as milk from goats and cattle, but since then projects underway only
focus on promoting goat’s milk. The author believes that lack of implementation of
recommendations is one of the constraints that need to be addressed.
Carcass condemnation
The liver was reported to be condemned most of the times. This may be because of liver
fluke damage since most of the grazing spaces are dambos or around dambos. Butcher-
men complained that trimming of the carcass reduces the saleable portion and thus
reducing returns.
4.2.8 Constraints met by sheep farmers in Kaluluma EPA
Many sheep-farmers (76.7%) would want to expand sheep production but the major
constraints they face are insufficient veterinary services and insufficient source of
breeding stock (see Table 16). In Malawi agricultural extension is mainly done by Field
Officers (FO) because Veterinary Officers (VO) are too few (MOAFS, 1998). However,
there is a high ratio of Field Officers to farmers. Shortage of FOs in the country has
been a result of prolonged closure of Natural Recourses College (NRC) which was the
main training institution (Mutsuyo et al, 2006). Worse still, training of FOs at NRC
mainly focused on crop production as such they have limited knowledge in livestock
management (MOAFS, 1998). Such being the case, extension services are biased
towards crop production. In Kaluluma EPA, there are various projects aimed at
improving crop production. These included: compost manure making, dam construction
and setting up of small scale irrigation structures. Since implementation of these projects
involved the participation of the FOs little time was left for extension in livestock
management.
31
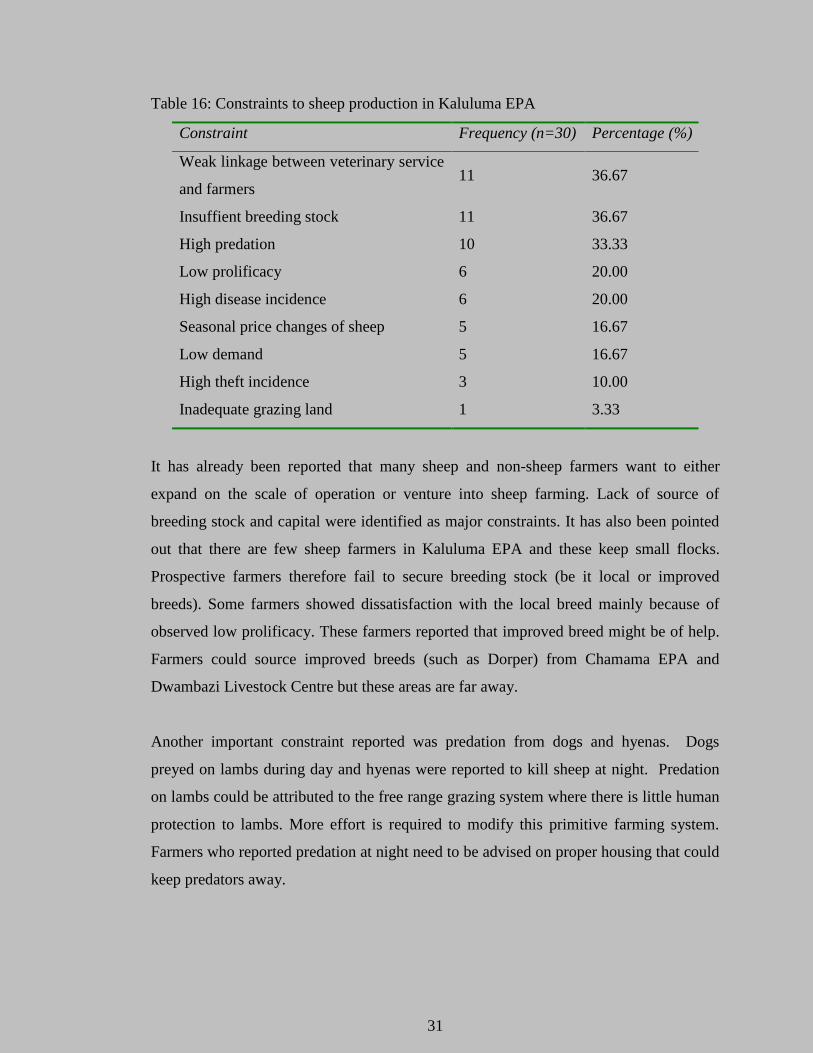
Table 16: Constraints to sheep production in Kaluluma EPA
Constraint Frequency (n=30) Percentage (%)
Weak linkage between veterinary service
and farmers 11 36.67
Insuffient breeding stock 11 36.67
High predation 10 33.33
Low prolificacy 6 20.00
High disease incidence 6 20.00
Seasonal price changes of sheep 5 16.67
Low demand 5 16.67
High theft incidence 3 10.00
Inadequate grazing land 1 3.33
It has already been reported that many sheep and non-sheep farmers want to either
expand on the scale of operation or venture into sheep farming. Lack of source of
breeding stock and capital were identified as major constraints. It has also been pointed
out that there are few sheep farmers in Kaluluma EPA and these keep small flocks.
Prospective farmers therefore fail to secure breeding stock (be it local or improved
breeds). Some farmers showed dissatisfaction with the local breed mainly because of
observed low prolificacy. These farmers reported that improved breed might be of help.
Farmers could source improved breeds (such as Dorper) from Chamama EPA and
Dwambazi Livestock Centre but these areas are far away.
Another important constraint reported was predation from dogs and hyenas. Dogs
preyed on lambs during day and hyenas were reported to kill sheep at night. Predation
on lambs could be attributed to the free range grazing system where there is little human
protection to lambs. More effort is required to modify this primitive farming system.
Farmers who reported predation at night need to be advised on proper housing that could
keep predators away.

32
There were various ways in which flock sizes got reduced from the khola between 2005
and 2006. Most sheep (27.4%) were sold to the butcher-men. Home consumption and
losses from diseases were other important factors. Parasites and diseases contributed up
to 14.5% of the loses. Most diseases and parasites that caused deaths went unidentified,
as the mortalities were not reported to the veterinary personnel. However, farmers
described the conditions of the animals that died which would be attributed to
helminthes and bloat.
Table 17: Methods of sheep disposal in Kaluluma EPA
Method of disposal Count Percentage of total disposed
Sold to the butcher 17 27.4
Slaughtered for home use 14 22.6
Died of diseased/parasite 9 14.5
Slaughtered for sale 7 11.3
Preyed on 5 8.1
Killed by accident 5 8.1
Reported missing 4 6.5
Sold to the neighbours 1 1.6
Total 62 100.00
Farmers also reported potential constraints with increase in the scale of operation
(improved breeds and increased livestock numbers). The major constraint (40%) would
be feed limitation (see Table 18). This was reported so because the major sources of feed
are dambos that are increasingly being cultivated. Other potential constraints identified
were limitation in management skills and marketing. Farmers have rudimentary
knowledge in livestock management which can not support increased scale of
production. In this case training of farmers in would be inevitable.

33
Table 18: Farmers perceived constraints with increased level of production
Constraint Percentage (%)
Feed limitation 40
Marketing constraints 23
Housing 20
Sufficient management skill 16
To increase livestock production, farmers demanded assistance summarised in Table 19.
Most farmers demanded source of improved breeds, breeding stock and improved link
with veterinary or advisory services. Farmers urged that it is worthwhile for them to
improve on their management skills only when they have an improved breed. Local
breeds were reported not to be small and relatively not prolific and hence not justifying
improvement in management.
Table 19: Farmer suggested solutions to constraints
Solution Frequency Percentage (%)
Improved Breeds 16 53
Improves link with Veterinary services 13 43.3
Access to breeding stock 9 30
Loan 8 26
34
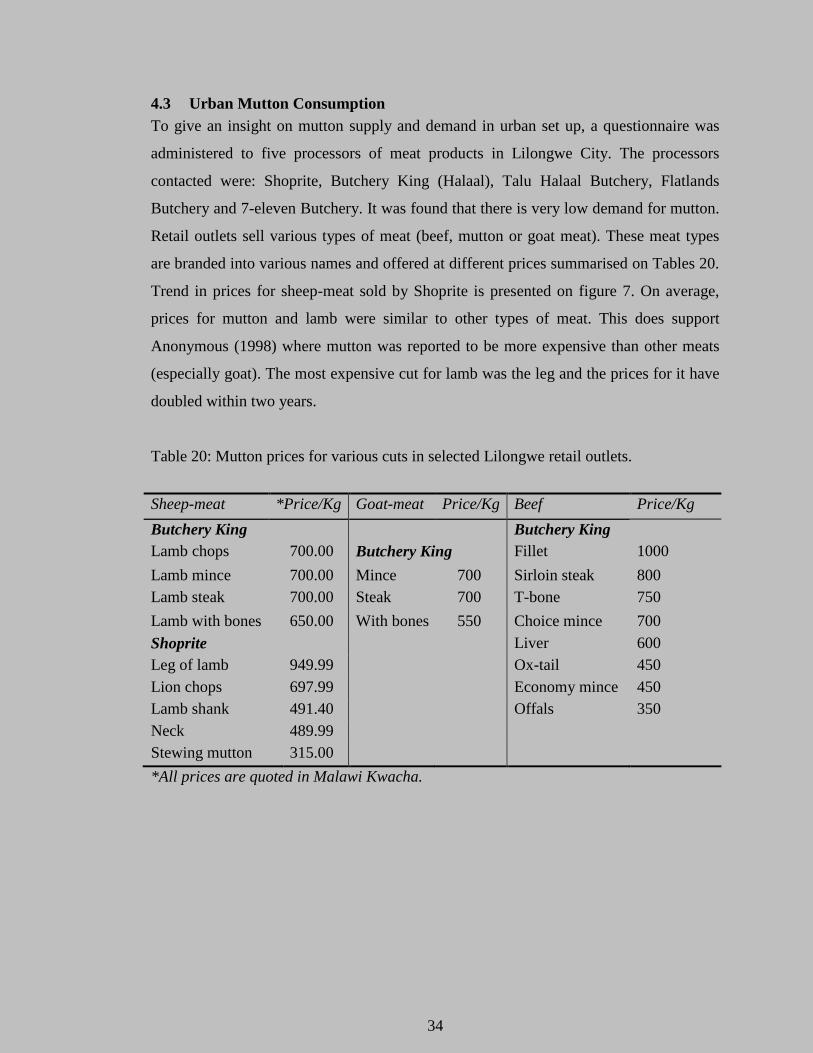
4.3 Urban Mutton Consumption
To give an insight on mutton supply and demand in urban set up, a questionnaire was
administered to five processors of meat products in Lilongwe City. The processors
contacted were: Shoprite, Butchery King (Halaal), Talu Halaal Butchery, Flatlands
Butchery and 7-eleven Butchery. It was found that there is very low demand for mutton.
Retail outlets sell various types of meat (beef, mutton or goat meat). These meat types
are branded into various names and offered at different prices summarised on Tables 20.
Trend in prices for sheep-meat sold by Shoprite is presented on figure 7. On average,
prices for mutton and lamb were similar to other types of meat. This does support
Anonymous (1998) where mutton was reported to be more expensive than other meats
(especially goat). The most expensive cut for lamb was the leg and the prices for it have
doubled within two years.
Table 20: Mutton prices for various cuts in selected Lilongwe retail outlets.
Sheep-meat *Price/Kg Goat-meat Price/Kg Beef Price/Kg
Butchery King Butchery King
Lamb chops 700.00 Butchery King Fillet 1000
Lamb mince 700.00 Mince 700 Sirloin steak 800
Lamb steak 700.00 Steak 700 T-bone 750
Lamb with bones 650.00 With bones 550 Choice mince 700
Shoprite Liver 600
Leg of lamb 949.99 Ox-tail 450
Lion chops 697.99 Economy mince 450
Lamb shank 491.40 Offals 350
Neck 489.99
Stewing mutton 315.00
*All prices are quoted in Malawi Kwacha.

35
Figure 7: Trends in sheep-meat prices sold by Shoprite from 2005-2007
Comparing prices for sheep meat in Kaluluma EPA provided on page 28 with the prices
in Lilongwe huge differences can be observed. In part, the difference can be attributed to
high transport costs. Some retail outlets (Flatlands Halaal Butchery) reported to incur
high transport costs (from suppliers that are mostly based in lower shire). Again these
transportation fees are constantly pushed upwards. There are only a few suppliers and
these were reported to supply only half the demanded load and hence increasing on per
unit transport costs (which is charged per load). Meat suppliers have also been reported
to sustain constant increase in prices (i.e. between December 2006 and February 2007
major price adjustments occurred three times).
Another factor that could explain the differences in sheep meat prices was importation.
Shoprite reported that 10% of the mutton sold in its retail outlets comes from South
Africa (the rest is sourced from within Malawi). Imported mutton is of higher quality so
it is sold at a higher price. The high price also ensures recovery of transport costs and
0
100
200
300
400
500
600
700
800
900
1000P
rice
/kg
in
MK
2005 2006 2007
Stewing mutton Lamb shanks Neck Lion chops Leg of lamb

36
taxes incurred during transit. This information concurs with the report made a long time
ago Phoya et al (1982) where it was reported that high quality mutton is imported and
sold at higher prices. Mutton production is low and the importation signifies that there is
demand in Malawi that need to be exploited. If quality mutton could be produced
locally it would have a competitive advantage as it would be sold at lower prices (and
hence be accessible to many. It has been reported that abundant crop residues
(especially maize stover) is being wasted. These are burnt, destroyed by termites and
trampled by grazing animals (MOAFS, 1998). These crop residues could be used in
small holder lamb fattening schemes. Mithi (1991) reported that the enterprise is
worthwhile.
4.4 Proposed Solutions to Some of the Identified Constraints
Various constraints that affect sheep farmers and other stakeholders that deal in sheep
and sheep products have been identified. The solutions include:
4.4.1 Improving farmers’ livestock management skills
Most sheep-farmers have rudimentary knowledge in livestock husbandry. Therefore they
need training in such areas as housing, feeding, breeding and parasite and disease
control. However the excise should start with training of the extension personnel and
village livestock technicians that would facilitate the training of farmers. Mutsuyo et al
(2006) has documented details on this subject.
4.4.1.1 Breeding
Farmers leave sheep to breed freely. However, when farmers are able to control
breeding, it creates an opportunity for improving the genetic potential of their flock
(through crossbreeding) without quickly diluting the resultant hybrid vigour through
inbreeding. A proper breeding system need to be identified and promoted.
Government should facilitate establishment of stud breeders to help prospective
farmers easily access improved sheep.
4.4.1.2 Feeding
Encouraging farmers to supplement their sheep using locally available feedstuffs
such ground nut haulms and providing drinking water.

37
Training farmers in feed conservation measures such as hay making to ensure that
quality feed is available to the sheep through out the year.
For the farmers that want to intensify sheep production, training them to formulate
feed on-farm would be very appropriate
4.4.1.3 Housing
Training in construction of cheap (using locally available materials) but strong sheep
houses can help reduce predation.
4.4.1.4 Parasite and disease Control
Link between the farmers and veterinary personnel should be strengthened
Formation of farmers groups and drug boxes should be facilitated.
Farmers should be encouraged to practice the very basics of disease control such as
avoidance of grazing in dambo lands during wet season. There may be value in
strategic deworming and dipping.
4.4.2 Improving the marketing systems
Farmers should be organised to groups, to monitor sale of sheep and other livestock for
the benefit of all farmers. This can also enable them to supply to meat processors (i.e.
Talu Halaal Butchery) that indicated willingness to form contracts with farmers.
4.4.3 Out competing importation
The industry should strive to compete effectively with the imported products. This can
be achieved through:
Increased numbers of quality stock.
Diversification of the production systems to include specialized enterprises i.e.
weaner stock, feedlot and breeder stock production.
Diversification and the development of markets for other small ruminant
products such as sheep cheese.
Application of feeding systems that employ resources, which optimize biomass
production from a small unit of land.
Adoption of a business approach to small ruminant production.
38
CHAPTER 5
5 CONCLUSION
Farmers in Kaluluma EPA practice extensive system of production where sheep are
grazed without or with very little supplementation and are left to breed indiscriminately.
Farmers keep small flocks (average flock size was 5). These farmers are willing to
increase their flock sizes to increase their incomes but they face management-based
constraints. Other constraints faced include; weak link with veterinary services, poor
genetic potential and low farm gate prices. The proposed solutions are; training in
management skills, establishment of stud breeders and organizing farmers into business
oriented groups.
39
6 LITERATURE CITED
Anonymous. 1998. Improved Integration of SmallRuminants with a View to Economical
and Ecologically Sustainable Production in Smallholder Crop-livestock Systems
in Southern Africa. Centre for International Agricultural Development and
Institute of Animal sciences, Scientific Progress Report
http://www.ilri.org/InfoServ/Webpub/Fulldocs/AnGenResCD/docs/eurep-
98/chapter4.htm#P3_0 (23 March 2007)
Aregheore, M. 1996. Voluntary intake and nutrient digestibility of crop-residue based
rations by goats and sheep. Small Ruminant Research. 22:7-12
Banda, J.W. 1992. Comparison of Consumer Attitude Towards and Acceptance of Goat,
Sheep and Cow Milk in Malawi. FAO, Italy
http://www.fao.org/Wairdocs/ILRI/x5520B/x5520b0b.htm (6 May 2007).
BSDA. 2007. Facts About Sheep’s Milk. The British Sheep Dairy Association (BSDA),
http://www.sheepdairying.com/Milk.htm (11 May 2007).
Chilongo, T. 2005. An Assessment of Small-holder Farmers Access to Produce Markets
in Malawi: A case study of Kasungu RDP.
http://www.ide.go.jp/English/Publish/Ars/pdf/11_cap6.pdf (4 May 2007)
DAHLD.2007. Agriculture and Livestock Production Estimates, Department of Animal
Health and Livestock Development (DAHLD), Ministry of Agriculture and Food
Security. Lilongwe. Malawi
DFID. 2007. Malawi Fact-sheet, January 2007. DFID, Malawi.
http://www.dfid.gov.uk/pubs/files/malawi-factsheet-jan07.pdf (23 March 2007)
Devendra, C. and G.B. Mc Leroy. 1982. Goat and Sheep Production in the Tropics.
Longman scientific and technical, Essex, England.
Earl J., Moseley W., and Majid N.1996. Risk Map Final Report: Malawi. Save the
Children Fund. UK.
Early R.J, Mc Bridge B.W, Vatnick and Bell A.W. 1991. Chronic heat stress and
prenatal development in sheep II placental cellularity and metabolism. Journal of
Animal Science 69:3610-1616

40
Falck S.J., Carstens G.E., and Waldron D.F. 2002. Effects of prenatal shearing of ewes
on birth weight and neonatal survivability of lambs. Sheep and Goat Research
Journal, 17: 14-20.
FAO .2005. Livestock Information, Sector Analysis and Policy Branch, FAO/Algal.
Rome.http://www.fao.org/ag/againfo/resources/en/publications/sector_briefs/lsb_MWI.
pdf (21 March 2007)
FEWSNET/Malawi, 2006. MALAWI, Food Security Update, February 2006, Lilongwe,
Malawi. http://www.fews.net/centers/files/Malawi_200601en.pdf (21 Mar 2007)
GOM.2005. Support to NEPAD-CAADP Implementation, Bankable Investment Project
Profile: Livestock and Fishery Development Project. Lilongwe, Malawi
ftp://ftp.fao.org/docrep/fao/008/ae750e/ae750e00.pdf11 May 2007)
Gatenby R.1986. Sheep Production in the Tropics and Sub-Tropics. Longman, London.
UK
Government of Malawi .1999. Review of Agricultural Policies and Strategies. Ministry
of Agriculture and Food Security, Lilongwe. Malawi.
Janda J.M. 1996.Comparative aspects of goat and sheep milk, Small Ruminants
Research. Journal 22:177-185
Khalfan Z.M. 2000. Sheep and Goats, Small Ruminants with Large Potential
http://idrinfo.idrc.ca/archive/ReportsINTRA/pdfs/v13n3e/110875.pdf (21 Mar
2007).
Khaila S and Itimu O. 1985. Small Ruminants and Rural Development in Malawi: A
Case Study of Goat Production in the Lilongwe Rural Development Project
(LRDP): A paper presented at the workshop on design and implementation of
rural development strategies and programmes, Bunda College, Malawi.
Losada, H., Neale M, Vieyra, J Rivera, and Cortés J.1996. Sheep management in the
region of Xochimilco for supplying benefits to the local population Livestock
Research for Rural Development.
http://www.cipav.org.co/lrrd/lrrd8/3/losada83.htm (23 march 2007)
Malawi Germany Livestock Development Programme.1988. MGLDP Annual Report
1987/1988, Ministry of Agriculture and Food Security, Lilongwe, Malawi

41
Mithi L. G.1991. Potential and Constraints of lambs Fattening under small holder
farmer conditions in Malawi, MSc thesis submitted to Faculty of Agriculture,
University of Malawi.
Miller E.J. and Zajac A.M. 2005. Contributions of Hair Sheep to Control Parasitism:
Hairy Sheep Workshop Held at Virginia State University. American Sheep
Industry Associatation. USA
http://www.sheepandgoat.com/HairSheepWorkshop/parasitism.html (13 May
2007)
MOAFS. 1998. National Livestock Development Master Plan, Department of Animal
Health and Industry, Ministry of Agriculture and Food Security, Lilongwe.
Malawi
Mutsuyo K, Mfitilodze W, Mlangwa J, Judith L .2006. Animal Agriculture in Malawi,
Tanzania, and Zambia at the beginning of the 21st Century, Obihiro university of
Agriculture and veterinary Medicine.
NPF. 2007. Mobile Health Clinics for the Children in the Remote Villages of Malawi.
Nando Perreti Founadation (NPF)
http://www.nandoperettifound.org/default.aspx?idPage=411 (11 May 2007)
Nguluve D. and Muir J.P.1999. Growth rates of fat-tailed sheep tethered or free on
range compared to free in a Leucaena leucocephala pasture. Livestock
Research for Rural Development,
http://www.cipav.org.co/lrrd/lrrd11/2/muir112.htm. (11 Nov 2005)
Phillips, C.JC, Mohamed M.O., Omed H. 2003. Effect of increasing sodium content of
grass or concentrates on the nutrition of sheep. Journal of Animal Science.
77:491-498
Phillips, C.J.C., and Youssef, M.Y.I. 2003. Effects of previous experience of four
pasture species on the grazing behaviour of ewes and their lambs, Journal of
animal science, 77:329-333.
Phoya RHD, Wheelhan O.P. 1982.An investigation into meat preferences of Malawians.
Journal of Consumers studies and Home Economics , 6, 362-366

42
Piringu P. C. 1990. The relationship of the body weight of ewes at lambing to the birth
weight and growth rate of the lamb. BSc in agriculture project. Faculty of
Agriculture. University of Malawi.
PRB. 2006. World Population Data Sheet. Population Reference Bureau (PRB),
Washington DC. USA http://www.prb.org/pdf06/06WorldDataSheet.pdf (23
march2007)
Ramanzin M., Bailoni L., and Schiavon S. 1997. Effect of forage to concentrate ratio on
comparative digestion in sheep, goats and fallow deer Journal of Animal Science,
64:163-170
Republic of Malawi .1983. Livestock and Meat Study, Final Report, Vl 2, booker
Agriculture International limited.
Rey B., Lebbie S.H.B and Reynolds L. 1992. Proceedings of the First Biennial
Conference of the African Small Ruminant Research Network, ILRAD, Nairobi,
Kenya 10-14 December 1990
http://www.fao.org/wairdocs/ILRI/x5520B/x5520b00.HTM (23 March 2007)
Safalaoh A.C.L. 1992. A review of Poultry Production in Malawi: Constraints and
possible solutions. Tizame. 3: 15-22.
Sawasawa Haigh L.A.1991. Ewe/ lamb studies: Correlation between birth 70-day
weights and dam weight at parturition. BSc in agriculture project. Faculty of
Agriculture. University of Malawi.
Soterios Economides.1986. Nutrition and Management of Sheep and Goats, FAO. Italy
http://www.fao.org/docrep/009/ah221e/AH221E05.htm (12 Ma y 2007)
Wells A, Gegner L. and Richard E. 2000. Sustainable Sheep Production: Livestock
Production Guide. http://www.attra.org/attra-pub/PDF/sheep.pdf (12 Nov, 2005)
Wildeus S.and Zajac. A.M. 2005.Gastrointestinal Parasitism in Hair Sheep and Meat
Goat Breeds Grazing Naturally Infected Pasture. Sheep and Goat Research
Journal. 20:42-46
http://www.sheepusa.org/?page=site/get_file&print=1&file_id=2c889af746a2c9
db968790ca51695910 (13 May 2007).
Wilson, R.T. and Bourzat, D. (Eds) .1985. Small ruminants in African agriculture.
ILCA: Addis Ababa, Ethiopia. 174-185pp

43
Winrock International. 1983. Sheep and goats in the Developing countries: their present
and potential role, World Bank technical paper. Winrock International,
Washington D.C., U.S.A.

44
APPENDICES
45
APPENDIX I
EVALUATION OF THE STATUS AND CONSTRAINTS TO SHEEP PRODUCTION
IN KALULUMA EPA
QUESTIONNAIRE FOR SHEEP AND NON -SHEEP FARMERS
1 DEMOGRAPHY
1.1 Name: Surname:…..……………….… First- name:………………………………
1.2 Village:……………………………..Section of EPA…………………………….
1.3 Household Number:……………….………………
1.4 Gender: 1. Male [ ] 2. Female [ ]
1.5 Age:…………………..years Do not know [ ]
1.6 Marital Status: 1. Single [ ] 2. Married [ ]
3. Widowed [ ] 4. Polygamist [ ]
5. Divorced [ ] 6. Other [ ]
1.7 Religion:
1. None [ ] 2. Presbyterian [ ]
3. Catholic [ ] 4. Adventist [ ]
5. Anglican [ ] 6. Pentecostal [ ]
7. .Moslem [ ]
1.8 Educational Status
1. Senior Primary [ ] 2 .Up to JCE [ ]
3. MSCE [ ] 4. Tertiary Ed. [ ]
4. Illiterate [ ]
1.9 Major Source Of Income
Occupation Type(s)
Livestock keeping
Farming crops
Business
Employment
46
1.10 Estimated Income Per Annum
< K20, 000.00 [ ]
K20, 000.01-K50,000.00 [ ]
K 50,000.01- K80, 000.00 [ ]
K80, 000.01- K120, 000.00 [ ]
>K120, 000.00 [ ]
1.11 Household Size
1-2 people [ ]
3-4 people [ ]
5-6 people [ ]
7-8 people [ ]
9-10 people [ ]
> 10 people [ ]
1.12 Land Owner Ship
What is your total land area? ……………………………. ha
How much land is allocated for: Hectares
Maize
Ground nuts
Sweet potatoes
Cassava
Beans
Tobacco
Millet
Fallow
Other (specify)
1.13 Livestock Ownership
Flock Size
Specie Numbers Others (specify numbers
Sheep
Goats
Pigs
Cattle
Poultry
Rabbits

- 47 -
PART 1
FOR SHEEP FARMERS ONLY (FOR NON-FARMERS GO TO PAGE -55- )
2 GENERAL LIVESTOCK INFORMATION
2.1 When did you start raising/keeping sheep? Indicate year…………………..
2.2 Why do you keep sheep?
Tick reason Your Priority Level
Cash [ ] [ ]
Meat supply [ ] [ ]
Savings security [ ] [ ]
Manure [ ] [ ]
Status in society [ ] [ ]
Others (Specify)
(i)………………… [ ]
(ii)………………… [ ]
(iii)… ……………... [ ]
2.3 What is the main objective or reason for keeping sheep?
……………………………………………………………………………………………
…
……………………………………………………………………………………………
…
……………………………………………………………………………………………
2.4 What breeds of sheep do you keep? Indicate numbers.
Breed Local Doper D×L
Crosses Merino
M×L
Crosses
Others
(Specify)
Ewes
Rams
Lambs
D = Doper L = Local M = Merino
2.5 Flock size and composition
Sex Age group
<1yr 2-3 yrs >4 yrs
Male
Female
- 48 -
2.6 How did you acquire your original breeds? Indicate numbers
Source Rams Ewes Lambs
Bought
Loan
Inherited
Gift
Others (specify)
(i)……………………………
(ii)…………………………..
…………………
…………………
………………..
…………………
………………
………………..
If purchased, where? If loan scheme (specify) 1………………….
Government market [ ]
Local market [ ] 2…………….……
Other specify
1…………………...........................
2………………...…………………
3. ………………………………….
3 SHEEP MANAGEMENT PRACTICES
3.1 HOUSING PROGRAM
3.1.1 How do you house your sheep?
Brick
khola
Pole without
thatch
Poleand thacth Mud khola house/kitchen Others(specify)
3.1.2 Are lambs and older sheep housed together? 1.yes [ ] 2. No [ ]
if no give reasons:………………………………………………..
………………………………………………..
- 49 -
3.2 BREEDING PROGRAM
3.2.1 Do not participate in breeding, how do you source the sheep. If NO go to
question 2.2.2.2
………………………………….…………………………………………
3.2.2 What breeds do you use for mating? Indicate figures in applicable combination
3.2.3 How are they mated?
Rams
Ewes others(specify)
Merino Dorper Local
Merino
Dorper
Local
others
(specify)
3.2.4 Any cross breeding program: Yes [ ] No[ ]
3.2.5 Are your rams and ewes running together all the time?
1 Yes [ ] 2 No [ ]
3.2.6 If NO when do they run separately?
Night Day
Through out the year [ ] [ ]
Wet season [ ] [ ]
Cold season [ ] [ ]
Hot season [ ] [ ]
3.2.7 If NO to question. 2.2.6, why run separately?
………………………………………………..
…………………………………………………
3.2.8 How many lambs were born in your in 2005 and 2006 khola? Indicate numbers
2005 Singles…………… Twins………….. Triplets…………….
2006 Singles…………… Twins………….. .Triplets…………….
Category Breed Figure
Rams Local
Merino
Dorper
Ewes Local
Merino
Dorper

- 50 -
3.2.9 How many gave birth more than once in the following years? Indicate numbers
2 005…………………
20065…………………
3.2.10 How many sheep gave birth in the following months? Indicate numbers
Jan Feb. Mar Apr May June July Aug Sept Oct Nov Dec
3.3 FEEDING PROGRAM
3.3.1 Do you give your animals anything to eat apart from what they get on their own?
1. Yes [ ] 2. [ ]
3.3.2 If NO give reasons for not giving them
i)……………………………………………………………………………
ii)…………………………………………………………………………..
iii)…………………………………………………………………………..
iii)…………………………………………………………………………..
3.3.3 If YES specify feeds used and amounts
Feed Quantity per day
Madeya
Peanut haulms
Maize Stover
Salt
Others (specify)
(i)………………………
(ii)………………………
(iii)………………………
(iv)………………………
…………………………..
………………………….
………………………….
…………………………..
3.3.4 What materials are used to give supplementary feed and water to animals?
Water supplementary feed
Tire [ ] Tires [ ]
Pails [ ] floor/ground [ ]
Buckets [ ]
Others (specify) i)………………….…i)……………………….…
ii)…………………….ii)……………………..….
iii)…………………...iii)…………………….…..
- 51 -
Others (specify)
(i)………………………………………...………..…..
(ii)…………………………….……………...……..….
(iii)……………………………………………....…..…
…
3.3.5 Where do you get the feeds?
Buy [ ] Others (Specify)
Get from field (residues) [ ] i)……………………..
Conserve [ ] ii)…………………….
Grow [ ] iii)……………………
3.3.6 Where do livestock get drinking water?
Season wet Dry
Harvested rain water [ ] [ ]
River /stream [ ] [ ]
Tap water [ ] [ ]
3.3.7 How are your sheep feed (Tick)
Method Wet
season
Dry season All year round
Tethered
Grazed alone
Grazing with cattle
Grazing with goats
Grazing with cattle and goats
Grazed with neighbours livestock
4 FARMER ATTITUDES TOWARD SHEEP KEEPING
4.1 Do keeping of sheep have any cultural value?
Yes [ ] No [ ]
4.2 If yes, what are they?
(i)……………………………
(ii)…………………………..
(iii)…………………………..
(iv)…………………………...
4.3 How many sheep farmers are in your village?..............
4.4 Why such a number?
Taste [ ] others (specify) i)………………………
Not interested [ ] ii)………………………
Difficult to rear (grazing) [ ] iii)………………………

- 52 -
4.5 How do you compare keeping sheep with raising cattle, pigs, goats,
or poultry in terms of money after slaughter? Give ranks.
5 MARKETING SYSTEMS
5.1 Where do you sell your sheep?
Middlemen [ ] others (specify)
Market (consumer) [ ] i)………………………….
Cold storage [ ] ii)………………………..
5.2 Any contracts with schools, cold storage, restaurants? List (if any)
School Cold storage Restaurant
5.3 In what form do you sell your sheep or sheep products?
1. Live [ ] 2. Dressed [ ] 3. Processed [ ]
5.4 If dressed, how do you store the meat?
1. Cold storage [ ] 2. Smoke [ ] 3. Dry [ ]
5.5 Are the prices offered satisfactory?
1. Yes [ ] 2.No [ ]
6 HOME CONSUMPTION PATTERN
6.1 Do you eat mutton or sheep meat?
1. Yes [ ] No [ ]
6.2 If yes, how often do you eat mutton? ……………times per year
6.3 Under what circumstances?
1. Funeral [ ] 2. Celebrations [ ] 3. Other (specify)………………
Livestock Sheep Cattle Goats Pigs Poultry Rabbits
Rank

- 53 -
6.4 How do you compare mutton to other meats?
1. Same [ ]
2. Better [ ] in what way……………………………………….
3. Worse [ ] in what way……………………………………….
7 CONSTRAINTS TO PRODUCTION
7.1 How many sheep did you lose or were disposed of during 2005? Give figures
Method of disposal Lambs Ewes Rams
Gifts
Exchange
Theft
Death
Disease (specify)*
Predators*
Accidents
Parasites*
Live sales
Butcher man
Gvt Market
Cold storage
Neighbours
Produce market
Slaughters
Sale
Feasts
Home use
Missing
Other (specify) *
*Specify the following
7.2 Diseases
i)……….………..…….. ii)………….…….……iii)…………..……………..
7.3 other causes of deaths deaths
i)………………………...ii………………………iii……………..……….….
7.4 Types of predators
i)……………………..... ii) …………………..…iii)…………………….…..
7.5 Parasites
i)………………………. iii) ……………………iiii)………………………..
- 54 -
7.6 What major problems do you face in sheep production and suggest a solutio
Inadequate grazing land/feed [ ]Solution……………………………….……..…
High mortality [ ] Solution…………………………………..……
Weak linkage with
Veterinary/advisory services [ ] Solution……………………………..………...
Diseases [ ] Solution………………………………..………
Seasonal changes in price
of sheep products [ ] Solution……………………….…………..….
Low demand for sheep [ ] Solution…………………………………….….
Theft [ ] Solution……………………………………….
Predation [ ] Solution…………………………………….…
Lack of breeding stock [ ] Solution……….…………………………..….
Others constraints and solutions
Constraint solution
i)………………………………...….....i)……………………………
ii)…………………………………..….ii)……………………………
ii)……………………………………..iii)……………………..……..
v)…………………………..................iv)………………………........
7.7 What other assistance would be required to improve sheep production in the area?
(i)…………………………………………
(ii)…………………………………………
(iii)…………………………………………..
(iv)…………………………….......................
7.8 what problems are you likely to meet if you increase scale of sheep production
(i)…………………………………………
(ii)…………………………………………
THE END, THANK YOU VERY MUCH

- 55 -
PART 2
FOR NON-SHEEP FARMERS ONLY
ATTITUDES TOWARDS SHEEP KEEPING
1. Have you ever kept sheep?
1. Yes [ ] 2. No [ ]
2. If YES why did you stop?
1. Market not adequate [ ]
2. Prices too low [ ]
3. Difficult to manage [ ]
4. Others (specify)
(i)……………………………
(ii)…………………………..
(iii)…………………………..
(iv)…………………………...
3. If NO, do you ever think of keeping sheep?
1. Yes [ ] 2. No [ ]
4. If YES why? (i)……………………… If NO why (i)………………………
(ii)……………………… (ii)………………………
(iii)……………………… (iii)………………..……
5. What do you think are the likely problems that keepers are facing?
i)………………………………..………….………
(ii)………………………….……….………………
(iii)………………………………..…….……………
(iv)…………………………..…….…………………
6. Do you have any other comments?
……………………………………………………………………………….
……………………………………………………………………………..
………………………………………………………………………………..
THE END, THANK YOU VERY MUCH
56
APPENDIX II
EVALUATION OF THE STATUS AND CONSTRAINTS TO SHEEP PRODUCTION
IN KALULUMA EPA
QUESTINNAIRE FOR LIVESTOCK PROCESSORS
(BUTCHERIES AND RETAIL OUTLETS)
1 ID number:………………………………………………………………………...….
2 Location:………………………………………………………………………..…..…
3 Name of Shop:………………………………………………………………………...
4 Name of Respondent…………………………Position…………………………….
5 WHAT LIVESTOCK PRODUCTS DO YOU SELL?
Livestock product
Sold
Tick
Mutton
Beef
Goat meat
Eggs
Chicken (meat)
Others specify
…………………………………………...
……………………………………………
……………………………………………
……………………………………………

57
6 INDICATE CURRENT PRICES FOR LIVESTOCK PRODUCTS
7 INDICATE AVERAGE MEAT PRICE S FROM 1999 TO 2007
Product 1999 2000 2001 2002 2003 2004 2005 2006 2007
Mutton
Goats
Chicken
Pork
Beef
8 SUPPLY OF VARIOUS LIVESTOCK PRODUCTS
Livestock productsS old Kwacha per kg
Mutton
Beef
Goat meat
Pig meat
Chicken (meat)
Others specify
………………………………….
………………………………….
……………………………………
………………………………
……………………………..
……………………………..
Livestock product sold Supplier/source Location
Mutton
Beef
Goat meat
Pig meat (Backon or pork)
Chicken (meat)
Others (Specify)
…………….…………………
…..……………….……………
……………………………
……………………………
………………
………………

58
9 Do you import any of the mutton you sell?
1. Yes [ ] 2. No [ ]
9.1 If YES, specify country………………………………………
9.2 What % of the products is imported?…………………………
10 Method of supply
i. Contract [ ]
ii. Own farm [ ]
iii. Other specify 1)………..……2)….……………3)…………………..
10.1 If not on contract basis, would you be willing to have farmers on contract to
supply you with mutton/lamb? 1. yes [ ] 2. No [ ]
10.2 If NO give reasons..1…………………………………….…………..
2…….…………………………………………
11 What standards do you use for grading mutton/lamb?
1………………………………………
2……………………………………….
3………………………………………
4………………………………………
12 What qualities do you look for when purchasing mutton/lamb?
1………………………………………
2……………………………………….
3………………………………………
4………………………………………
DEMAND OF VARIOUS LIVESTOCK PRODUCTS
13 Do you export any mutton?
1. Yes [ ] 2. No [ ]
13.1 If YES specify country ………………………………………….
13.2 What % of the products is exported?…………………………
14 What Method of sale do you use?
i) Retail [ ]
ii). Wholesale [ ]
iii) Both [ ]
15 In what form is mutton sold ?
…………………………………………………………..
…………………………………………………………

59
16 Average amounts of meat products sold per day
17 Any packaging?
1. Yes [ ] 2. No [ ]
If YES specify material used…………………………………….
18 Any value adding
1. Sausages [ ]
2. Minced meat [ ]
3. Cooked meat sold [ ]
19 Any mutton by products?
1. Yes [ ] 2. No [ ]
If yes specify.…………………
20 Any problems faced with demand and supply of lamb/mutton?
1…………………………………….…..
2……………………………………..….
3…………………………………..…….
4…………………………….…………..
5………………………………………….
THE END, THANK YOU VERY MUCH
Livestock product sold Average Amount sold per day
Mutton
Beef
Goat meat
Pig meat
Chicken (meat)
Others specify
………………………………….
………………………………….
………………………………
……………………………..