Evaluation of the Biogas Productivity Potential of Fish Waste
12
Evaluation of the Biogas Productivity Potential of Fish Waste: A Lab Scale Batch Study Gopi Krishna Kafle, Sang Hun Kim* Department of Biosystems Engineering, Kangwon National University, Chuncheon, Korea Received: August 9 th , 2012; Revised: October 12 th , 2012; Accepted: October 30 th , 2012 Purpose: The biogas productivity potential of fish waste (FW) was evaluated. Methods: Batch trials were carried out in 1.3 L glass digesters kept in a temperature controlled chambers at 36.5˚C. The first order kinetic model and the modified Gompertz model were evaluated for biogas production. The Chen and Hashimoto model was used to determine the critical hydraulic retention time (HRT Critical) for FW under mesophilic conditions. The feasibility of co-digestion of FW with animal manure was studied. Results: The biogas and methane potential of FW was found to be 757 and 554 mL/g VS, respectively. The methane content in the biogas produced from FW was found to be 73% and VS removal was found to be 77%. There was smaller difference between measured and predicted biogas production when using the modified Gompertz model (16.5%) than using first order kinetic model (31%). The time period for 80%-90% of biogas production (T80-90) from FW was calculated to be 50.3-53.5 days. Similarly, the HRT Critical for FW was calculated to be 13 days under mesophilic conditions. The methane production from swine manure (SM) and cow manure (CM) digesters could be enhanced by 13%-115% and 17%-152% by mixing 10%-90% of FW with SM and CM, respectively. Conclusions: The FW was found to be highly potential substrate for anaerobic digestion for biogas production. The modified Gompertz model could be more appropriate in describing anaerobic digestion process of FW. It could be promising for co-digestion of FW with animal manure. Keywords: Biochemical methane potential (BMP), Co-digestion, Fish waste, Kinetic study, Mesophilic temperature Original Article Journal of Biosystems Engineering J. of Biosystems Eng. 37(5):302-313. (2012. 10) http://dx.doi.org/10.5307/JBE.2012.37.5.302 eISSN : 2234-1862 pISSN : 1738-1266 *Corresponding author: Sang Hun Kim Tel: +82-33-250-6492; Fax: +82-33-255-6406 E-mail: [email protected] Copyright ⓒ 2012 by The Korean Society for Agricultural Machinery This is an Open Access article distributed under the terms of the Creative Commons Attribution Non-Commercial License (http://creativecommons.org/licenses/by-nc/3.0) which permits unrestricted non-commercial use, distribution, and reproduction in any medium, provided the original work is properly cited. Abbreviations % Percentage ADF Acid detergent fiber BMP Biochemical methane potential BR Mass of biogas removed (g) C/N Carbon to nitrogen ratio CF Crude fiber CP Crude protein d Day d.w. Dry weight EE Ether extract F/I Feed to inoculum ratio FW Fish waste g Gram HRT Hydraulic retention time (days) K Kinetic constant (1/day) K CH Chen and Hashimoto kinetic constant L Liter mL Milli liter NDF Neutral detergent fiber NFE Nitrogen free extract OLR Organic loading rate (g VS/L) ppm Parts per million SD Standard deviation STP Standard temperature (0℃) andpressure (1atm.) TA Total alkalinity ( mg/L CaCO 3 ) TCOD Total chemical oxygen demand (mg/L)
-
Upload
khangminh22 -
Category
Documents
-
view
2 -
download
0
Transcript of Evaluation of the Biogas Productivity Potential of Fish Waste

Evaluation of the Biogas Productivity Potential of Fish Waste: A Lab Scale Batch Study
Gopi Krishna Kafle, Sang Hun Kim*
Department of Biosystems Engineering, Kangwon National University, Chuncheon, KoreaReceived: August 9th, 2012; Revised: October 12th, 2012; Accepted: October 30th, 2012Purpose: The biogas productivity potential of fish waste (FW) was evaluated. Methods: Batch trials were carried out in 1.3 L glass digesters kept in a temperature controlled chambers at 36.5˚C. The first order kinetic model and the modified Gompertz model were evaluated for biogas production. The Chen and Hashimoto model was used to determine the critical hydraulic retention time (HRT Critical) for FW under mesophilic conditions. The feasibility of co-digestion of FW with animal manure was studied. Results: The biogas and methane potential of FW was found to be 757 and 554 mL/g VS, respectively. The methane content in the biogas produced from FW was found to be 73% and VS removal was found to be 77%. There was smaller difference between measured and predicted biogas production when using the modified Gompertz model (16.5%) than using first order kinetic model (31%). The time period for 80%-90% of biogas production (T80-90) from FW was calculated to be 50.3-53.5 days. Similarly, the HRT Critical for FW was calculated to be 13 days under mesophilic conditions. The methane production from swine manure (SM) and cow manure (CM) digesters could be enhanced by 13%-115% and 17%-152% by mixing 10%-90% of FW with SM and CM, respectively. Conclusions: The FW was found to be highly potential substrate for anaerobic digestion for biogas production. The modified Gompertz model could be more appropriate in describing anaerobic digestion process of FW. It could be promising for co-digestion of FW with animal manure.Keywords: Biochemical methane potential (BMP), Co-digestion, Fish waste, Kinetic study, Mesophilic temperature
Original Article Journal of Biosystems EngineeringJ. of Biosystems Eng. 37(5):302-313. (2012. 10)http://dx.doi.org/10.5307/JBE.2012.37.5.302
eISSN : 2234-1862 pISSN : 1738-1266
*Corresponding author: Sang Hun Kim Tel: +82-33-250-6492; Fax: +82-33-255-6406 E-mail: [email protected]
Copyright ⓒ 2012 by The Korean Society for Agricultural MachineryThis is an Open Access article distributed under the terms of the Creative Commons Attribution Non-Commercial License (http://creativecommons.org/licenses/by-nc/3.0)
which permits unrestricted non-commercial use, distribution, and reproduction in any medium, provided the original work is properly cited.
Abbreviations% PercentageADF Acid detergent fiberBMP Biochemical methane potentialBR Mass of biogas removed (g)C/N Carbon to nitrogen ratioCF Crude fiberCP Crude proteind Dayd.w. Dry weightEE Ether extractF/I Feed to inoculum ratio
FW Fish wasteg GramHRT Hydraulic retention time (days)K Kinetic constant (1/day)KCH Chen and Hashimoto kinetic constantL LitermL Milli literNDF Neutral detergent fiberNFE Nitrogen free extractOLR Organic loading rate (g VS/L)ppm Parts per millionSD Standard deviationSTP Standard temperature (0℃) andpressure (1atm.)TA Total alkalinity ( mg/L CaCO3)TCOD Total chemical oxygen demand (mg/L)

Kafle and Kim. Evaluation of the Biogas Productivity Potential of Fish Waste: A Lab Scale Batch StudyJournal of Biosystems Engineering • Vol. 37, No. 5, 2012 • www.jbeng.org
303
TS Total solids (%)TVFA Total volatile fatty acids (mg/L acetate)VS Volatile solids (%)w.w. Wet weightλ Lag phase (day)μm Maximum specific growth rate of microorganisms (1/day)
IntroductionEnergy production from biomass (biogas production) provides a renewable alternative to fossil fuels, con-sidering the huge amount of organic waste such as food-industrial wastes and municipal solid wastes produced around the world. Many of these wastes are still unexploited and contribute to environmental pollution in both urban and rural areas. World fish consumption per capita nearly doubled over the last 45 years, leading to larger quantities of fish processing wastes (Ward and Løes, 2011). In 2005, the UN Food and Agricultural Organization has estimated the annual world fish harvest resulting from commercial fishing in wild fisheries and fish farms to be 140 million tons (FAO, 2005). Fish processing generates considerable amounts of waste in the form of edible and non-edible by-products. Assuming 45% of the live weight to be waste (Rai et al., 2010), it can be estimated that nearly 64 million tons of fish waste are generated annually. This waste is mainly composed of heads, viscera, bones and scales, and is rich in lipids and proteins. Fish processing wastes have a great potential for energy production. The increase in fish processing wastes and the expansion of the renewable energy market imply that fish processing wastes could play a part in the future of bio-fuels. Waste such as fish waste and fish sludge, which are rich in lipids and proteins, have the advantage of giving high methane yields, and can be attractive as substrates in an anaerobic digestion process (Cirne et al., 2007). Thus, anaerobic digestion could be a good approach for FW utilization and energy generation. Anaerobic digestion of this biodegradable waste will provide a solution for reducing both this environmental problem and the consumption of fossil fuels. Plant nutrients such as nitrogen and phosphorus are retained in the effluent (digestate) after anaerobic digestion, which can be used as a bio-fertilizer in agricultural production provided it meets the required standards.
The experimental data on the bio-methanization of FW are limited. Ward and Løes (2011) examined the poten-tial of fish waste for liquid and gaseous biofuels. Kim et al. (2012) performed lab scale study on the technical feasibility of using jellyfish (Aurelia aurita) for biogas production. Similarly, Mshandete et al. (2004) tested the batch anaerobic digestion of fish waste obtained from the landing beach at F/I ratio of 0.05-1.6 (VS basis) and obtained highest methane yield of 0.39 L/g VS added at F/I ratio of 0.05 (VS basis). Eiroa et al. (2012) evaluated the BMP of different varieties of solid fish wastes (tuna, sardine, mackerel and needle fish waste) obtained from a canning industry. Chen et al. (2010) evaluated the BMP test on a fish farm waste at F/M ratio of 0.5-1.0 under both mesophilic and thermophilic conditions. The main objective of this study was to investigate the feasibility of biogas production from fish waste (FW). The biogas potential of FW was determined and anaerobic digestion process was evaluated using different kinetic models. Materials and Methods
Feed stock and inoculum FW was obtained from a market in Korea. The FW was crushed in a blender and stored at 4˚C. The anaerobic inoculum was obtained from a small lab digester with swine manure under mesophilic condition. The characteristics of FW and inoculum are shown in Table 1.Test set up and experimental designThe experimental design for batch test is shown in Table 2. The test was carried out in 1.13-1.28 L glass bottles (liquid volume 0.4-0.8 L). The feed to inoculum (F/I) ratio was maintained 0.0-0.5. The F/I ratio was calculated based on the initial VS of the substrate and inoculum.
VS) (g added InoculumVS) (g added SubstrateI/F = (1)
After adding the required amounts of inoculum and substrate, each digester was filled with tap water to maintain the designated volume. The batch digesters were checked for any leakage and flushed with 100%

Kafle and Kim. Evaluation of the Biogas Productivity Potential of Fish Waste: A Lab Scale Batch StudyJournal of Biosystems Engineering • Vol. 37, No. 5, 2012 • www.jbeng.org
304
Table 1. Characteristics of FW and inoculum
Characteristics units FW InoculumMoisture content % 68.7 98.18Total solids (TS) %, w.w. 31.30 1.82Volatile solids (VS) %, w.w. 27.50 0.73VS/TS 0.88 0.40
pH - 8.15Total volatile fatty acids (TVFA) mg/L - 1313Total alkalinity (TA) mg/L - 14397TVFA/TA - 0.091TCOD mg/L - 11627SCOD mg/L - 6400
NH3-N mg/L - 3320TKN %, TS 6.54 0.501Crude fiber (CF) %, TS 0.0 -Crude protein (CP) %, TS 40.9 -Crude fat (CF) %, TS 48.6 -Ash %, TS 5.7 -
Nitrogen free extract (NFE) %, TS 4.8 -Neutral detergent fiber (NDF) %, TS 0.0 -Acid detergent fiber (ADF) %, TS 0.0 -C/N 4.1 0.81
-: Not determinedCP = 6.25× TKNC/N = TOC/TKN
Table 2. Experimental design for batch test
F/I OLR(g VS/L) Liquidvolume
(mL)
Head space
mL
Test period(days)
Purpose
FW Inoculum Sugar
FW digestersa 0.50 2.5 5.0 0.0 800 380 60 Biogas potential of FWBlank digestersa 0.0 0.0 5.0 0.0 800 380 60 Biogas potential of inoculum
Sugar digestersa 0.25 0.0 5.0 1.25 400 730 3 Methanogenic activity of inoculuma Number of replications (n) = 2
pure nitrogen for approximately 1.5-2.0 minutes to ensure anaerobic conditions. The anaerobic digesters were maintained at 36.5℃ in a temperature-controlled incubator. Batch test was carried out in duplicate, and the results were expressed as a mean. Each digester was mixed manually for one minute once a day just before the gas volume measurement. Assays with inoculums alone were also used as controls. Biogas and methane produced from inoculums were subtracted from the sample assays.
Biogas volume/mass measurement and composition analysisThe daily biogas production of each digester was determined by the volume of biogas produced, which was calculated from the volume and pressure in the headspace of the digester. The pressure was measured using a WAL-BMP-Test system pressure gauge (Type 3150, Wal, Germany) (EI-Mashad and Zhang, 2010; Kafle and Kim, 2012). Daily pressure differences were converted into biogas volume using the following equation:
( )R.T
.CH.ViPfPBV
−= (2)
where,VB = Biogas volume (L)Pi = Initial pressure in the reactor head space (mbar)Pf = Final pressure in the reactor headspace after 24 hrs. (mbar)VH = Volume of the headspace (L) C = Molar volume (22.41 L/mol) R = Universal gas constant (83.14 L mbar/K/mol)The biogas composition (CH4 and CO2, %) was measured using a GC-2014 gas chromatograph (Shimadzu, Kyoto, Japan) equipped with a thermal conductivity detector. Helium was used as the carrier gas in the GC. The GC was calibrated using standard gases consisting of CH4 60% and CO2 40% on a volume basis (v/v). The hydrogen sulfide concentration in the biogas was measured using a handy gas analyzer (BioGas Check - Geotechnical Instruments, UK) (Kafle et al., 2012a). The measured wet biogas and methane volumes were adjusted to the volumes at standard temperature (0℃) and pressure (1 atm) (VDI 4630, 2006). The corrected methane content in the biogas was calculated using equation (3) as proposed in German standard procedure (VDI 4630, 2006).

Kafle and Kim. Evaluation of the Biogas Productivity Potential of Fish Waste: A Lab Scale Batch StudyJournal of Biosystems Engineering • Vol. 37, No. 5, 2012 • www.jbeng.org
305
24
4100
4COCH
CHCorr CC
CCH
+×
= (3)where,CH4 Corr = corrected methane content in the dry gas (% by volume) CCH4 = measured methane content in the gas (% by volume) CCO2 = measured carbon dioxide content in the gas (% by volume)During batch digestion, the biogas production rates and methane content change considerably over the digestion time. The methane content on intermediate days was calculated using linear interpolation by the INTERP1 function in Matlab software R2011b (7.13.0.564). The weighted average methane content over the digestion period was calculated. The mass removal in the form of biogas at the end of the experiment was calculated using a formula shown in equation (4). The density of CH4 was taken as 0.000668 g/mL, and the density of CO2 was taken as 0.00184 g/mL (Kafle et al., 2012b).
mV mixρ×= 0BR (4)
where,BR = Mass of biogas removed per gram VS added (g/ g VS added) V0 = Volume of biogas produced (ml, at STP)mixρ = Mass concentration of CH4 + CO2 in the biogas (g/mL) m = VS added (g)
Analytical methods and organic matter removalTotal solids (TS) and volatile solids (VS) were deter-mined in the well-mixed samples in triplicate according to standard methods (APHA, 1998). The TOC (total organic carbon) was calculated using relation, TOC = VS/1.8 (Haug, 1993). Total Kjeldahl nitrogen (TKN) was analyzed using a Kjeldahl apparatus (Kjeltec 2100, Foss, Sweden). The ammonia nitrogen (NH3-N) was measured using the Nessler method and was determined using a spectrophotometer (DR 2500, Hach, USA). The analysis of crude fiber (CF), crude protein (CP), Ether extract (EE), ash, nitrogen free extract (NFE) were done according to
the methods described in AOAC (1990). The analysis of neutral detergent fiber (NDF) and acid detergent fiber (ADF) was carried out according to the methods of Goering and Van Soest (1970). The closed reflux titration method was used for total chemical oxygen demand (TCOD) and soluble oxygen demand (SCOD) analysis. pH value was determined using a pH meter (YK-2001 PH, Taiwan). TVFA (Total volatile fatty acids), TA (total alkalinity) and TVFA/TA ratio were determined using Nordman method (Kafle and Kim, 2011; Kim and Kafle 2010). The TS and VS removal of feed during the batch test were calculated based on total mass removal from the testing reactors and the blank reactors (equation (5)).( )
FYIXIF(%) feed of removal VSor TS ×−×+= (5)where,F = Total TS or VS feed added to reactor (g)I = Total TS or VS inoculum added to reactor (g)X = Calculated TS or VS removal of mixture of feed and inoculum based on total initial and final gram TS or VS present in the testing reactors (%)Y = Calculated TS or VS removal of inoculum in blank reactors (%)
Kinetic modelingDue to the role of microbes in the anaerobic process, kinetic models (particularly first-order kinetics) were commonly applied to simulate anaerobic biodegradation. Like the phase of bacterial growth, biogas production rate showed a rising curve, and a decreasing curve indicated by exponential and linear equations (De Gioannis et al., 2009; Kumar et al., 2004). Assuming first-order kinetics for the hydrolysis of particulate organic matter, the cumulative biogas production can be described by equation (6).)e(1GG(t) Kt)(
o−−×= (6)where,G (t) = The cumulative biogas production at digestion time t days (mL) Go = Biogas production potential of the substrate (mL) K = Biogas or methane production rate constant (first order disintegration rate constant) (1/day) t = Time (days)

Kafle and Kim. Evaluation of the Biogas Productivity Potential of Fish Waste: A Lab Scale Batch StudyJournal of Biosystems Engineering • Vol. 37, No. 5, 2012 • www.jbeng.org
306
Along with biogas production, the duration of the lag phase is also an important factor in determining the efficiency of anaerobic digestion. The lag phase (λ ) can be calculated with the modified Gompertz model (Kafle and Kim, 2012) as follows:⎭⎬⎫
⎩⎨⎧
⎥⎦
⎤⎢⎣
⎡+−−= 1t)(λ
G.eRexp.expG)t(G
0
max0 (7)
where,Rmax = Maximum biogas production rate (mL/d) λ = Lag phase (day) t = Time (day) e = exp (1) = 2.7183A nonlinear least-square regression analysis was performed using SPSS program (IBM SPSS statistics 19 (2010)) to determine K, Rmax, λ , and the predicted biogas production. At the same time, the standard error and coefficient of determination or correlation coefficient (R2) were also obtained. The predicted biogas production obtained from the SPSS program was plotted with the measured biogas production using Matlab software R2011b (7.13.0.564). The statistical indicators R2 and root mean square error (RMSE) were calculated (Bhattarai, et al., 2012a; Bhattarai, et al., 2012b):
∑=
=m
j j
j ))Yd
(m
(RMSE1
21
21 (8)where,m = Number of data pairs j = jth values Y = Measured biogas production (mL)d = Deviations between experimental and predicted biogas production
Critical retention time Chen and Hashimoto’s model (Chen and Hashimoto, 1979; Chen and Hashimoto, 1980) was used to determine the critical retention time for FW (Tosun et al., 2004). This model is a modification of the Contois model (Contois, 1959) and is based on fundamental biochemical principles and has been found to be reliable predictive tool in applications regarding digestion of wastes with substantial TS content (Fongsatitkul et al., 2012). Chen and Hashimoto’s model (equation (9)) can be described as follows:
1KHRTK
CoC
CHm
CHt
−+μ×= (9)
where, Ct = Outlet substrate concentration (mg/L) Co = Inlet substrate concentration (mg/L)HRT = Hydraulic retention time (days) KCH = Chen and Hashimoto kinetic constant (dimension less) μm = Maximum specific growth rate of microorganisms (1/day)Substrate concentration can be expressed in terms of VS or COD. VS or COD removal is an indicator of biogas production in anaerobic digestion process:
o
ot
G)t(GG
CoC −= (10)
where,G (t) = The cumulative biogas production at digestion time t days (mL) Go = Biogas production potential of the substrate (mL)1KHRT
KG
)t(GG CHm
CH
o
o
−+μ×=− (11)
The equation (11) can be converted to equation (12).)t(GG
G(t)K 1RTH 0m
CH
m −μ+
μ= (12)
When hydraulic retention time (HRT) was plotted as a function of G(t)/(G0 – G(t)), a straight line was obtained with the slope KCH/μm and the intercept 1/μm. The critical hydraulic retention time (HRT Critical) indicating the time when the washout of micro-organisms occurs is numerically equal to the reciprocal of the maximum specific growth rate (Kafle and Kim, 2012): m
Critical1RTH
μ= (13)Results and Discussion
Substrate characterizationAs shown in Table 1, the TS content of FW was 31.3%
Kafle and Kim. Evaluation of the Biogas Productivity Potential of Fish Waste: A Lab Scale Batch StudyJournal of Biosystems Engineering • Vol. 37, No. 5, 2012 • www.jbeng.org
307
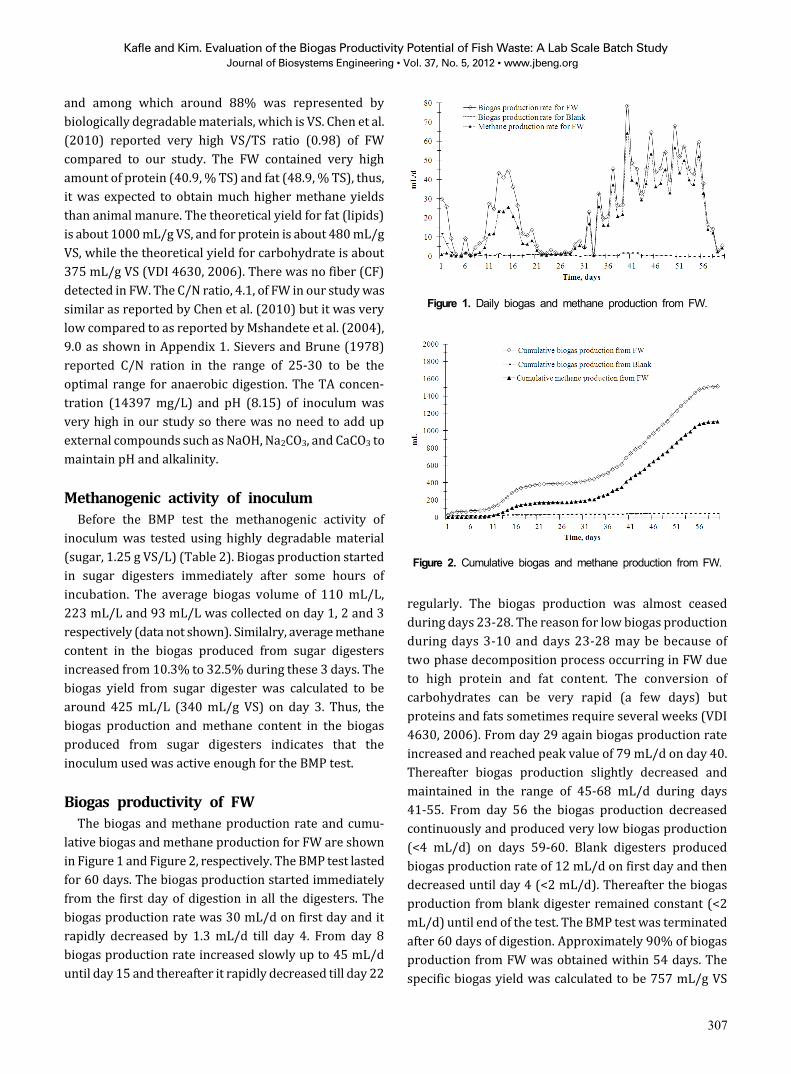
Figure 1. Daily biogas and methane production from FW.
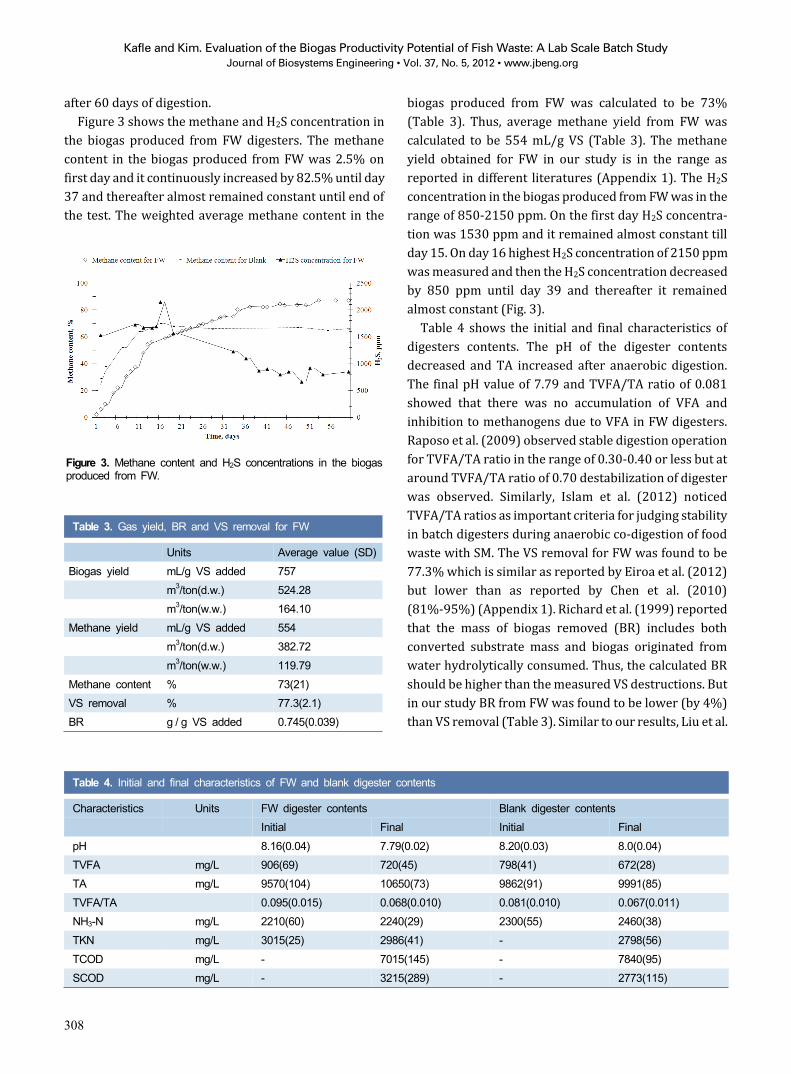
Figure 2. Cumulative biogas and methane production from FW.
and among which around 88% was represented by biologically degradable materials, which is VS. Chen et al. (2010) reported very high VS/TS ratio (0.98) of FW compared to our study. The FW contained very high amount of protein (40.9, % TS) and fat (48.9, % TS), thus, it was expected to obtain much higher methane yields than animal manure. The theoretical yield for fat (lipids) is about 1000 mL/g VS, and for protein is about 480 mL/g VS, while the theoretical yield for carbohydrate is about 375 mL/g VS (VDI 4630, 2006). There was no fiber (CF) detected in FW. The C/N ratio, 4.1, of FW in our study was similar as reported by Chen et al. (2010) but it was very low compared to as reported by Mshandete et al. (2004), 9.0 as shown in Appendix 1. Sievers and Brune (1978) reported C/N ration in the range of 25-30 to be the optimal range for anaerobic digestion. The TA concen-tration (14397 mg/L) and pH (8.15) of inoculum was very high in our study so there was no need to add up external compounds such as NaOH, Na2CO3, and CaCO3 to maintain pH and alkalinity. Methanogenic activity of inoculumBefore the BMP test the methanogenic activity of inoculum was tested using highly degradable material (sugar, 1.25 g VS/L) (Table 2). Biogas production started in sugar digesters immediately after some hours of incubation. The average biogas volume of 110 mL/L, 223 mL/L and 93 mL/L was collected on day 1, 2 and 3 respectively (data not shown). Similalry, average methane content in the biogas produced from sugar digesters increased from 10.3% to 32.5% during these 3 days. The biogas yield from sugar digester was calculated to be around 425 mL/L (340 mL/g VS) on day 3. Thus, the biogas production and methane content in the biogas produced from sugar digesters indicates that the inoculum used was active enough for the BMP test.Biogas productivity of FWThe biogas and methane production rate and cumu-lative biogas and methane production for FW are shown in Figure 1 and Figure 2, respectively. The BMP test lasted for 60 days. The biogas production started immediately from the first day of digestion in all the digesters. The biogas production rate was 30 mL/d on first day and it rapidly decreased by 1.3 mL/d till day 4. From day 8 biogas production rate increased slowly up to 45 mL/d until day 15 and thereafter it rapidly decreased till day 22
regularly. The biogas production was almost ceased during days 23-28. The reason for low biogas production during days 3-10 and days 23-28 may be because of two phase decomposition process occurring in FW due to high protein and fat content. The conversion of carbohydrates can be very rapid (a few days) but proteins and fats sometimes require several weeks (VDI 4630, 2006). From day 29 again biogas production rate increased and reached peak value of 79 mL/d on day 40. Thereafter biogas production slightly decreased and maintained in the range of 45-68 mL/d during days 41-55. From day 56 the biogas production decreased continuously and produced very low biogas production (<4 mL/d) on days 59-60. Blank digesters produced biogas production rate of 12 mL/d on first day and then decreased until day 4 (<2 mL/d). Thereafter the biogas production from blank digester remained constant (<2 mL/d) until end of the test. The BMP test was terminated after 60 days of digestion. Approximately 90% of biogas production from FW was obtained within 54 days. The specific biogas yield was calculated to be 757 mL/g VS
Kafle and Kim. Evaluation of the Biogas Productivity Potential of Fish Waste: A Lab Scale Batch StudyJournal of Biosystems Engineering • Vol. 37, No. 5, 2012 • www.jbeng.org
308
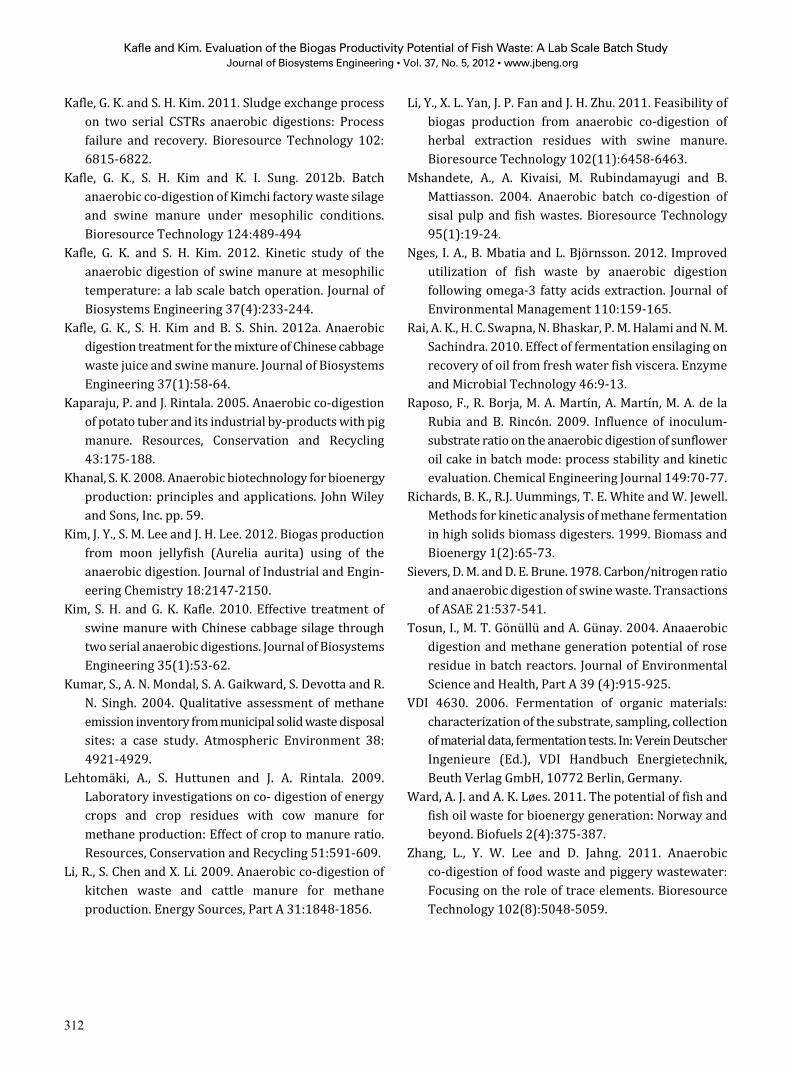
Figure 3. Methane content and H2S concentrations in the biogas produced from FW.
Table 3. Gas yield, BR and VS removal for FW
Units Average value (SD)Biogas yield mL/g VS added 757 m3/ton(d.w.) 524.28 m3/ton(w.w.) 164.10Methane yield mL/g VS added 554 m3/ton(d.w.) 382.72
m3/ton(w.w.) 119.79Methane content % 73(21)VS removal % 77.3(2.1)BR g / g VS added 0.745(0.039)
Table 4. Initial and final characteristics of FW and blank digester contents
Characteristics Units FW digester contents Blank digester contentsInitial Final Initial Final
pH 8.16(0.04) 7.79(0.02) 8.20(0.03) 8.0(0.04)TVFA mg/L 906(69) 720(45) 798(41) 672(28)TA mg/L 9570(104) 10650(73) 9862(91) 9991(85)TVFA/TA 0.095(0.015) 0.068(0.010) 0.081(0.010) 0.067(0.011)NH3-N mg/L 2210(60) 2240(29) 2300(55) 2460(38)TKN mg/L 3015(25) 2986(41) - 2798(56)
TCOD mg/L - 7015(145) - 7840(95)SCOD mg/L - 3215(289) - 2773(115)
after 60 days of digestion.Figure 3 shows the methane and H2S concentration in the biogas produced from FW digesters. The methane content in the biogas produced from FW was 2.5% on first day and it continuously increased by 82.5% until day 37 and thereafter almost remained constant until end of the test. The weighted average methane content in the
biogas produced from FW was calculated to be 73% (Table 3). Thus, average methane yield from FW was calculated to be 554 mL/g VS (Table 3). The methane yield obtained for FW in our study is in the range as reported in different literatures (Appendix 1). The H2S concentration in the biogas produced from FW was in the range of 850-2150 ppm. On the first day H2S concentra-tion was 1530 ppm and it remained almost constant till day 15. On day 16 highest H2S concentration of 2150 ppm was measured and then the H2S concentration decreased by 850 ppm until day 39 and thereafter it remained almost constant (Fig. 3).Table 4 shows the initial and final characteristics of digesters contents. The pH of the digester contents decreased and TA increased after anaerobic digestion. The final pH value of 7.79 and TVFA/TA ratio of 0.081 showed that there was no accumulation of VFA and inhibition to methanogens due to VFA in FW digesters. Raposo et al. (2009) observed stable digestion operation for TVFA/TA ratio in the range of 0.30-0.40 or less but at around TVFA/TA ratio of 0.70 destabilization of digester was observed. Similarly, Islam et al. (2012) noticed TVFA/TA ratios as important criteria for judging stability in batch digesters during anaerobic co-digestion of food waste with SM. The VS removal for FW was found to be 77.3% which is similar as reported by Eiroa et al. (2012) but lower than as reported by Chen et al. (2010) (81%-95%) (Appendix 1). Richard et al. (1999) reported that the mass of biogas removed (BR) includes both converted substrate mass and biogas originated from water hydrolytically consumed. Thus, the calculated BR should be higher than the measured VS destructions. But in our study BR from FW was found to be lower (by 4%) than VS removal (Table 3). Similar to our results, Liu et al.

Kafle and Kim. Evaluation of the Biogas Productivity Potential of Fish Waste: A Lab Scale Batch StudyJournal of Biosystems Engineering • Vol. 37, No. 5, 2012 • www.jbeng.org
309
Table 5. Parameters estimated from first order kinetic model and modified Gompertz model for anaerobic digestion of FW under mesophilic conditions
Units ValueFirst order kinetic modela Biogas production rate constant (K) 1/day 0.019Standard error 0.010R2 0.751Experimental biogas production (60 days) mL 1515Predicted biogas production (60 days) mL 1043Difference between measured and predicted biogas production % 31.1
Modified Gompertz modela Maximum biogas production rate (Rm) mL/d 32.9Standard error 2.4Lag phase (λ) days 14.1Standard error 1.6R2 0.904Experimental biogas production (60 days) mL 1515Predicted biogas production (60 days) mL 1265Difference between measured and predicted biogas production % 16.5
T50 days 41.3T80 days 50.3T90 days 53.5T80-90 days 50.3-53.5TEf days 36.2-39.4
a At 95% confidence intervalT50 = Time period for 50% of total biogas productionT80 = Time period for 80% of total biogas productionT90 = Time period for 90% of total biogas productionT80 -90 = Time period for 80-90% of total biogas productionTEf = Effective biogas production duration (T80-90 -λ)
a
b
Figure 4. Plot of measured and predicted cumulative biogas production from FW using (a) first order kinetic model; (b) modified Gompertz model.
(2009) also reported lower BR (up to 23%) than VS destructions during anaerobic digestion of green waste. The difference between BR and VS destructions may be due to an error in determination of VS concentration. Hayward and Pavlicick (1990) reported that the excessive loss of VFAs and other volatile compounds during the drying process of VS measurement can cause errors in determining the actual VS destruction.Results of kinetic modelingThe kinetic parameters estimated for FW using first order kinetic model and the modified Gompertz model are summarized in Table 5. The biogas production rate constant (K) and lag phase (λ) for FW was calculated to be
0.019 and 14.1 days, respectively. High difference between measured and predicted biogas production was found when using first order kinetic model (31.1%) than modified Gompertz model (16.5%). Fig. 4 shows the relation between measured and predicted biogas pro-duction with statistical indicators (R2 and RMSE value). The R2 value was calculated to be 0.909 and 0.826 when using first order kinetic model and the modified Gompertz model, respectively. Similarly, RMSE value was calculated to be 0.646 and 0.417 when using first order kinetic model and the modified Gompertz model respectively. Thus based on R2, RMSE and difference in measured and predicted biogas production, the modified Gompertz model was found to be better fitted to experimental results and first order kinetic model is not recommended for FW.It took 50.3-53.5 days for 80%-90% of total biogas production (T80-90). The effective time for biogas pro-duction (TEf) from FW was calculated to be 36.2-39.4 days. The higher difference in TEf and T80-90 was due to longer λ. The one reason for longer λ was due higher % of CP and EE in FW which has very slow rate of degradation

Kafle and Kim. Evaluation of the Biogas Productivity Potential of Fish Waste: A Lab Scale Batch StudyJournal of Biosystems Engineering • Vol. 37, No. 5, 2012 • www.jbeng.org
310
Figure 5. Critical HRT (HRTCritical) determinations for FW using Chenand Hashimoto model.
Figure 6. Predicted methane yields from swine manure (SM) and cow manure (CM) anaerobic digesters with addition of different % of fish waste (FW).
compared to other carbohydrates materials (Table 1). The other reason may be due to inhibition caused by long chain fatty acids (LCFAs). LCFAs are produced by the hydrolysis of lipids such as fats, oils and greases during anaerobic treatment (Khanal, 2008). The specific substrate utilization rate (μm) and critical HRT (HRTCritical) for FW under mesophilic conditions was calculated to be 0.075 per day and 13.3 days, respectively, using Chen and Hashimoto model as shown in Figure 5.Comparing FW, SM and CM digestionAppendix 1 summarizes results of previous studies on anaerobic batch digestion of FW, swine manure (SM) and cow manure (CM) under different experimental conditions. The previous studies showed much lower methane yield from SM and CM than FW thus; it showed large scope for co-digestion of FW with SM and CM to improve the methane production from SM and CM digesters. Figure 6 shows the predicted methane yield that could be obtained from SM and CM digesters at addition of different % of FW to respective digesters. The methane potential for FW, SM and CW were taken to be 554, 243 and 206 mL/g VS, respectively (Appendix 1) for predicting methane yield from co-digestion of FW with SM and CM (Fig. 6). The methane production from SM digester could be improved by 13%-115% (Fig. 6) by addition of 10%-90% of FW as co-substrate to SM digester. Similarly, the methane production from CM digester could be improved by 17%-152% (Fig. 6) by addition of FW as co-substrate to CM digester. Mshandete et al. (2004) reported increased in methane yield by 94% when 33% of FW was co-digested with sisal pulp. Callaghan et al. (1999) reported increased in methane yield from 0.28 to 0.38 L/g VS removed from co-digestion of fish offal with cattle slurry (Cattle slurry: fish offal: inoculum = 70:20:10, % w/w). Similalry, Bouallagui et al. (2009) reported improvement in gas production (8%) and digester process when FW was co-digested with fruits and vegetable waste (FVW) compared to FVW alone. Li et al. (2009) reported 106%-121% increased in methane production when 50%-75% of kitchen food waste was co-digested with CM. Kaparaju and Rintala (2005) reported that mixture of potato waste (20%) and SM (80%) increased methane yield up to 30% compared to swine manure alone at OLR of 2.0 g VS/L.d. Similarly, specific methane yield was increased by 19.2% when 25% of herbal extraction residues was co-digested with
75% of SM (VS basis) compared to SM alone (Li et al., 2011). ConclusionsIn the present study, the biogas productivity of fish waste (FW) was evaluated using batch anaerobic digesters under mesophilic conditions. FW showed very high biogas and methane potential of 757 and 554 mL/g VS, respectively. The modified Gompertz model was found to be best for describing the anaerobic digestion process of FW. The minimum HRT of 13 days is recommended to prevent the washout of biomass for continuous anaerobic digestion of FW. Similalry, total HRT of 50-54 days is suggested for maximum recovery of biogas from continuous FW digesters. Methane production

Kafle and Kim. Evaluation of the Biogas Productivity Potential of Fish Waste: A Lab Scale Batch StudyJournal of Biosystems Engineering • Vol. 37, No. 5, 2012 • www.jbeng.org
311
from biogas plant working with animal manure (SM and CM) could be enhanced by addition of FW as co-substrate.Conflict of InterestNo potential conflict of interest relevant to this article was reported.
AcknowledgementsThis work was supported by a research grant from the Rural Development Administration (RDA), Republic of Korea.ReferencesAOAC. 1990. Official methods of analysis, 15th ed. Associa-tion of Official Analytical Chemists, Washington DC.APHA. 1998. Standard Methods for the Examination of Water and Wastewater, 20th ed. American Public Health Assoc., Washington, DC.Bhattarai, S., D. H. Kim and J.H. Oh. 2012a. Simulation and model validation of pneumatic conveying drying for wood dust particles. Journal of Biosystems Engineer-ing 37(2):82-89.Bhattarai, S., J. H. Oh, S. H. Euh, G.K. Kafle and D. H. Kim. 2012b. Simulation and model validation of sheet and tube type photovoltaic thermal solar system and conventional solar collecting system in transient states. Solar Energy Materials and Solar Cells 103:184-193.Bouallagui, H., H. Lahdheb, E. Ben Romdan, B. Rachdi and M. Hamdi. 2009. Improvement of fruit and vegetable waste anaerobic digestion performance and stability with co-substrates addition. Journal of Environment Management 90:1844-1849.Callaghan, F. J., D. A. J. Wase, K. Thayanithy and C. F. Forster. 1999. Co-digestion of waste organic solids: batch studies. Bioresource Technology 67:117-122.Chen, X., R. T. Romano and R. Zhang. 2010. Anaerobic digestion of food wastes for biogas production. International Journal of Agricultural and Biological Engineering 3(4):61-72.Chen, Y. R. and A. G. Hashimoto. 1978. Kinetics of methane fermentation. Biotechnology Bioengineering Sympo-
sium 8:269-282.Chen, Y. R. and A.G. Hashimoto. 1980. Substrate utilization kinetic model for biological treatment processes. Biotechnology and Bioengineering 22(10):2081-2095.Cirne, D. G., X. Paloumet, L. Bjornsson, M. M. Alves and B. Mattiasson. 2007. Anaerobic digestion of lipid-rich waste - Effects of lipid concentration. Renewable Energy 32, 965-975.Contois, D. E. 1959. Kinetics of bacterial growth: Relation-ship between population density and space growth rate of continuous cultures. Journal of General Micro-biology 21 (1):40-50.De Gioannis, G., A. Muntoni, G. Cappai and S. Milia. 2009. Landfill gas generation after mechanical biological treatment of municipal solid waste. Estimation of gas generation constants. Waste Management 29:1026-1034.EI-Mashad, H. M. and R. Zhang. 2010. Biogas production from co-digestion of dairy manure and food waste. Bioresource Technology 101:4021-4028.Eiroa, M., J. C. Costa, M. M. Alves, C. Kennes and M. C. Veiga. 2012. Evaluation of the biomethane potential of solid fish waste. Waste Management 32:1347-1352.FAO. 2005. Review of the scale of world marine fishery resources. FAO Fisheries Technical Paper.Fongsatitkul, P., P. Elefsiniotis and D.G. Wareham. 2012. Two-phase anaerobic digestion of the organic fraction of municipal solid waste: estimation of methane production. Waste Management & Research 30(7): 720-726.Goring, H. K. and P. J. Van Soet. 1970. Forage fiber analysis. Agric. Handbook. No. 379. ARS. USDA. Washington DC.Gumisiriza, R., A. M. Mshandete, M. S. T. Rubindamayugi, F. Kansiime and A. K. Kivaisi. 2009. Enhancement of anaerobic digestion of Nile perch fish processing wastewater. African Journal of Biotechnology 8(2): 328-333.Haug, R. T. 1993. The practical handbook of composting engineering. Ann Arbor, MI: Lewis publisher.Hayward, G. and V. Pavlicick. 1990. A corrected method for dry matter determination for use in anaerobic digester control. Biological Wastes 34:101-111.Islam, M. N., K. J. Park and H. S. Yoon. 2012. Methane production potential of food waste and food waste mixture with swine manure in anaerobic digestion. Journal of Biosystems Engineering 37(2):100-105.
Kafle and Kim. Evaluation of the Biogas Productivity Potential of Fish Waste: A Lab Scale Batch StudyJournal of Biosystems Engineering • Vol. 37, No. 5, 2012 • www.jbeng.org
312
Kafle, G. K. and S. H. Kim. 2011. Sludge exchange process on two serial CSTRs anaerobic digestions: Process failure and recovery. Bioresource Technology 102: 6815-6822.Kafle, G. K., S. H. Kim and K. I. Sung. 2012b. Batch anaerobic co-digestion of Kimchi factory waste silage and swine manure under mesophilic conditions. Bioresource Technology 124:489-494Kafle, G. K. and S. H. Kim. 2012. Kinetic study of the anaerobic digestion of swine manure at mesophilic temperature: a lab scale batch operation. Journal of Biosystems Engineering 37(4):233-244.Kafle, G. K., S. H. Kim and B. S. Shin. 2012a. Anaerobic digestion treatment for the mixture of Chinese cabbage waste juice and swine manure. Journal of Biosystems Engineering 37(1):58-64.Kaparaju, P. and J. Rintala. 2005. Anaerobic co-digestion of potato tuber and its industrial by-products with pig manure. Resources, Conservation and Recycling 43:175-188.Khanal, S. K. 2008. Anaerobic biotechnology for bioenergy production: principles and applications. John Wiley and Sons, Inc. pp. 59. Kim, J. Y., S. M. Lee and J. H. Lee. 2012. Biogas production from moon jellyfish (Aurelia aurita) using of the anaerobic digestion. Journal of Industrial and Engin-eering Chemistry 18:2147-2150.Kim, S. H. and G. K. Kafle. 2010. Effective treatment of swine manure with Chinese cabbage silage through two serial anaerobic digestions. Journal of Biosystems Engineering 35(1):53-62.Kumar, S., A. N. Mondal, S. A. Gaikward, S. Devotta and R. N. Singh. 2004. Qualitative assessment of methane emission inventory from municipal solid waste disposal sites: a case study. Atmospheric Environment 38: 4921-4929.Lehtomäki, A., S. Huttunen and J. A. Rintala. 2009. Laboratory investigations on co- digestion of energy crops and crop residues with cow manure for methane production: Effect of crop to manure ratio. Resources, Conservation and Recycling 51:591-609.Li, R., S. Chen and X. Li. 2009. Anaerobic co-digestion of kitchen waste and cattle manure for methane production. Energy Sources, Part A 31:1848-1856.
Li, Y., X. L. Yan, J. P. Fan and J. H. Zhu. 2011. Feasibility of biogas production from anaerobic co-digestion of herbal extraction residues with swine manure. Bioresource Technology 102(11):6458-6463.Mshandete, A., A. Kivaisi, M. Rubindamayugi and B. Mattiasson. 2004. Anaerobic batch co-digestion of sisal pulp and fish wastes. Bioresource Technology 95(1):19-24.Nges, I. A., B. Mbatia and L. Björnsson. 2012. Improved utilization of fish waste by anaerobic digestion following omega-3 fatty acids extraction. Journal of Environmental Management 110:159-165.Rai, A. K., H. C. Swapna, N. Bhaskar, P. M. Halami and N. M. Sachindra. 2010. Effect of fermentation ensilaging on recovery of oil from fresh water fish viscera. Enzyme and Microbial Technology 46:9-13.Raposo, F., R. Borja, M. A. Martín, A. Martín, M. A. de la Rubia and B. Rincón. 2009. Influence of inoculum- substrate ratio on the anaerobic digestion of sunflower oil cake in batch mode: process stability and kinetic evaluation. Chemical Engineering Journal 149:70-77.Richards, B. K., R.J. Uummings, T. E. White and W. Jewell. Methods for kinetic analysis of methane fermentation in high solids biomass digesters. 1999. Biomass and Bioenergy 1(2):65-73.Sievers, D. M. and D. E. Brune. 1978. Carbon/nitrogen ratio and anaerobic digestion of swine waste. Transactions of ASAE 21:537-541.Tosun, I., M. T. Gönüllü and A. Günay. 2004. Anaaerobic digestion and methane generation potential of rose residue in batch reactors. Journal of Environmental Science and Health, Part A 39 (4):915-925.VDI 4630. 2006. Fermentation of organic materials: characterization of the substrate, sampling, collection of material data, fermentation tests. In: Verein Deutscher Ingenieure (Ed.), VDI Handbuch Energietechnik, Beuth Verlag GmbH, 10772 Berlin, Germany.Ward, A. J. and A. K. Løes. 2011. The potential of fish and fish oil waste for bioenergy generation: Norway and beyond. Biofuels 2(4):375-387. Zhang, L., Y. W. Lee and D. Jahng. 2011. Anaerobic co-digestion of food waste and piggery wastewater: Focusing on the role of trace elements. Bioresource Technology 102(8):5048-5059.
Kafle and Kim. Evaluation of the Biogas Productivity Potential of Fish Waste: A Lab Scale Batch StudyJournal of Biosystems Engineering • Vol. 37, No. 5, 2012 • www.jbeng.org
313
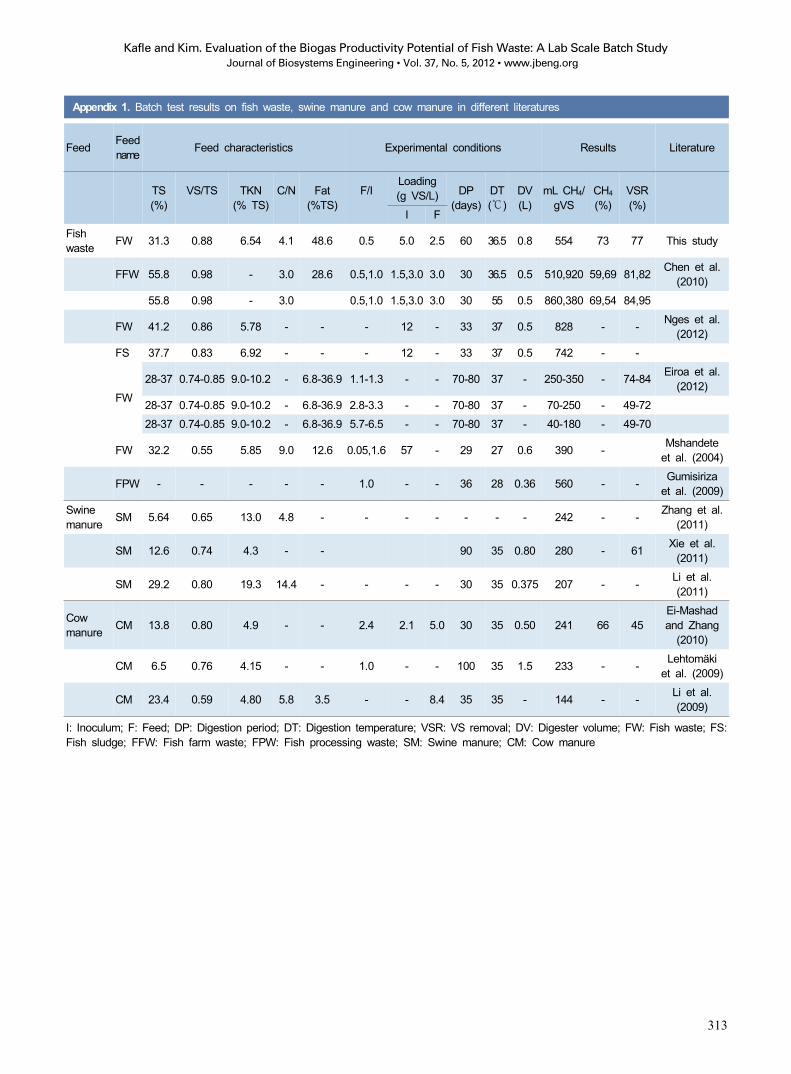
Appendix 1. Batch test results on fish waste, swine manure and cow manure in different literatures
Feed Feedname Feed characteristics Experimental conditions Results Literature
TS(%)
VS/TS TKN(% TS)
C/N Fat(%TS)
F/ILoading(g VS/L) DP
(days)DT(℃)
DV(L)
mL CH4/gVS
CH4
(%)VSR(%)
I FFish waste FW 31.3 0.88 6.54 4.1 48.6 0.5 5.0 2.5 60 36.5 0.8 554 73 77 This study
FFW 55.8 0.98 - 3.0 28.6 0.5,1.0 1.5,3.0 3.0 30 36.5 0.5 510,920 59,69 81,82 Chen et al. (2010)
55.8 0.98 - 3.0 0.5,1.0 1.5,3.0 3.0 30 55 0.5 860,380 69,54 84,95
FW 41.2 0.86 5.78 - - - 12 - 33 37 0.5 828 - - Nges et al. (2012)
FS 37.7 0.83 6.92 - - - 12 - 33 37 0.5 742 - -
FW28-37 0.74-0.85 9.0-10.2 - 6.8-36.9 1.1-1.3 - - 70-80 37 - 250-350 - 74-84 Eiroa et al.
(2012)28-37 0.74-0.85 9.0-10.2 - 6.8-36.9 2.8-3.3 - - 70-80 37 - 70-250 - 49-72 28-37 0.74-0.85 9.0-10.2 - 6.8-36.9 5.7-6.5 - - 70-80 37 - 40-180 - 49-70
FW 32.2 0.55 5.85 9.0 12.6 0.05,1.6 57 - 29 27 0.6 390 - Mshandete et al. (2004)
FPW - - - - - 1.0 - - 36 28 0.36 560 - - Gumisiriza et al. (2009)
Swine manure SM 5.64 0.65 13.0 4.8 - - - - - - - 242 - - Zhang et al.
(2011)
SM 12.6 0.74 4.3 - - 90 35 0.80 280 - 61 Xie et al. (2011)
SM 29.2 0.80 19.3 14.4 - - - - 30 35 0.375 207 - - Li et al. (2011)
Cow manure CM 13.8 0.80 4.9 - - 2.4 2.1 5.0 30 35 0.50 241 66 45
Ei-Mashad and Zhang
(2010)
CM 6.5 0.76 4.15 - - 1.0 - - 100 35 1.5 233 - - Lehtomäki et al. (2009)
CM 23.4 0.59 4.80 5.8 3.5 - - 8.4 35 35 - 144 - - Li et al. (2009)
I: Inoculum; F: Feed; DP: Digestion period; DT: Digestion temperature; VSR: VS removal; DV: Digester volume; FW: Fish waste; FS: Fish sludge; FFW: Fish farm waste; FPW: Fish processing waste; SM: Swine manure; CM: Cow manure