Experimental and Mathematical Modelling for Methane Biogas Production from Mixing of Real Municipal...
10
[Hussein, 3(7): July, 2014] ISSN: 2277-9655 Scientific Journal Impact Factor: 3.449 (ISRA), Impact Factor: 1.852 http: // www.ijesrt.com (C)International Journal of Engineering Sciences & Research Technology [379-388] IJESRT INTERNATIONAL JOURNAL OF ENGINEERING SCIENCES & RESEARCH TECHNOLOGY Experimental and Mathematical Modelling for Methane Biogas Production from Mixing of Real Municipal Solid Waste and Sewage Sludge Faiza E. Gharib* , Ahmed Hassoon Ali 1 , Wisam Ali Hussein 2 * Environmental Engineering Department, College of Engineering, University of Al-Mustansiriya 2 Environmental Engineering Dep., Iraq, Baghdad, Bab- al-Mu'adhem [email protected] Abstract Biogas (methane) production from batch anaerobic digesters containing varying ratio of organic fraction municipal solid waste and sewage sludge, pH, temperature and total solid are studied for a period of 30 days. It was observed that biogas production was optimized when waste and inoculum were mixed in a ratio of 5:1.At temperature, total solid and pH of 35 o C, 10 % and of 7.5 respectively. The maximum accumulative methane production is 450 mL/gm V.S. First order model was developed to assess the kinetics of the biodegradation process used to adequately describe the cumulative methane production from these digesters. It was observed that the rates of substrate biodegradability and removal of the biodegradable fractions of the substrate could be obtained by plotting 1/t (ln(dyt/dt)) against the inverse of time of digestion. This modified first order model also showed that the digester containing waste and inoculum in the ratio of 5:1 had the highest short term anaerobic biodegradability index (STABI) of 2.0424 and R 2 = 0.9385 In addition, The modified Gompertz equation was used to adequately describe the cumulative biogas production from these digesters. The kinetic parameters viz., biogas yield potential (B), the maximum biogas production rate (Rb) and the duration of lag phase (λ) were estimated at optimum condition obtained. The highest biogas yield of 450 mL/gm V.S and kinetic parameters B, Rb and λ were 455.6523mL/gm V.S, 35.161mL/gm V.S d -1 , 5.0542 d respectively where R 2 0.9997. To optimizing the production of methane the multiple correlations was used with a correlation coefficient of 92.687%. Keywords: Anaerobic digesters, solid waste, sewage sludge, multiple correlations, modified Gompertz equation, cumulative biogas. Introduction Due to rapid increases in urban population, organic fraction municipal solid waste (OFMSW) and sewage sludge (SS) (bio solids) have increased dramatically in the past 20 years. Environmental pollution caused by OFMSW and SS has become a serious social problem which hinders urban development. The need for alternative sources of energy for both decentralized and centralized power genera¬tion has led to the proliferation of research into alternative energy sources. Anaerobic digestion (AD) received considerable interest as one of such means of meeting both decentralized and central-ized power sources in recent years [1]. The process of anaerobic digestion has the potential of converting biodegradable organics into biogas which comprises methane (55–75%) and carbon dioxide (25–45%) [2]. with calorific value of 20 MJ/m 3 [3]. Bi¬ogas can therefore be a source of decentralized en¬ergy source for developing countries especially in this era of insecurity and unpredictability in fossil fuel supply. The study of biogas production from biodegrad¬able substrates is essential for an efficient selection of suitable substrate in anaerobic digestion. The presence of recalcitrant fractions in substrate uti- lized in biogas production in the form of cellulose and lignin may make most of these biodegradable volatile matter not to become available for bio¬degradation especially, when anaerobic digestion is carried out at suboptimum conditions (such as temperature, pH conditions). Numerous sources of biodegradable organic waste exist in nature and any technology that utilizes organic waste of high nuisance value, such as municipal solid waste, animal wastes from cattle, poultry etc., in anaerobic digestion, may just provide suitable means of not only man¬aging these wastes but also protecting
Transcript of Experimental and Mathematical Modelling for Methane Biogas Production from Mixing of Real Municipal...

[Hussein, 3(7): July, 2014] ISSN: 2277-9655 Scientific Journal Impact Factor: 3.449
(ISRA), Impact Factor: 1.852
http: // www.ijesrt.com (C)International Journal of Engineering Sciences & Research Technology
[379-388]
IJESRT INTERNATIONAL JOURNAL OF ENGINEERING SCIENCES & RESEARCH
TECHNOLOGY Experimental and Mathematical Modelling for Methane Biogas Production from Mixing of
Real Municipal Solid Waste and Sewage Sludge Faiza E. Gharib* , Ahmed Hassoon Ali 1, Wisam Ali Hussein 2
* Environmental Engineering Department, College of Engineering, University of Al-Mustansiriya 2 Environmental Engineering Dep., Iraq, Baghdad, Bab- al-Mu'adhem
Abstract Biogas (methane) production from batch anaerobic digesters containing varying ratio of organic fraction
municipal solid waste and sewage sludge, pH, temperature and total solid are studied for a period of 30 days. It was
observed that biogas production was optimized when waste and inoculum were mixed in a ratio of 5:1.At
temperature, total solid and pH of 35oC, 10 % and of 7.5 respectively. The maximum accumulative methane
production is 450 mL/gm V.S. First order model was developed to assess the kinetics of the biodegradation process
used to adequately describe the cumulative methane production from these digesters. It was observed that the rates
of substrate biodegradability and removal of the biodegradable fractions of the substrate could be obtained by
plotting 1/t (ln(dyt/dt)) against the inverse of time of digestion. This modified first order model also showed that the
digester containing waste and inoculum in the ratio of 5:1 had the highest short term anaerobic biodegradability
index (STABI) of 2.0424 and R2= 0.9385 In addition, The modified Gompertz equation was used to adequately
describe the cumulative biogas production from these digesters. The kinetic parameters viz., biogas yield potential
(B), the maximum biogas production rate (Rb) and the duration of lag phase (λ) were estimated at optimum
condition obtained. The highest biogas yield of 450 mL/gm V.S and kinetic parameters B, Rb and λ were
455.6523mL/gm V.S, 35.161mL/gm V.S d-1, 5.0542 d respectively where R2 0.9997. To optimizing the production of
methane the multiple correlations was used with a correlation coefficient of 92.687%.
Keywords: Anaerobic digesters, solid waste, sewage sludge, multiple correlations, modified Gompertz equation,
cumulative biogas.
Introduction Due to rapid increases in urban population,
organic fraction municipal solid waste (OFMSW)
and sewage sludge (SS) (bio solids) have increased
dramatically in the past 20 years. Environmental
pollution caused by OFMSW and SS has become a
serious social problem which hinders urban
development. The need for alternative sources of
energy for both decentralized and centralized power
genera¬tion has led to the proliferation of research
into alternative energy sources. Anaerobic digestion
(AD) received considerable interest as one of such
means of meeting both decentralized and central-ized
power sources in recent years [1]. The process of
anaerobic digestion has the potential of converting
biodegradable organics into biogas which comprises
methane (55–75%) and carbon dioxide (25–45%) [2].
with calorific value of 20 MJ/m3 [3].
Bi¬ogas can therefore be a source of decentralized
en¬ergy source for developing countries especially in
this era of insecurity and unpredictability in fossil
fuel supply. The study of biogas production from
biodegrad¬able substrates is essential for an efficient
selection of suitable substrate in anaerobic digestion.
The presence of recalcitrant fractions in substrate uti-
lized in biogas production in the form of cellulose
and lignin may make most of these biodegradable
volatile matter not to become available for
bio¬degradation especially, when anaerobic digestion
is carried out at suboptimum conditions (such as
temperature, pH conditions). Numerous sources of
biodegradable organic waste exist in nature and any
technology that utilizes organic waste of high
nuisance value, such as municipal solid waste, animal
wastes from cattle, poultry etc., in anaerobic
digestion, may just provide suitable means of not
only man¬aging these wastes but also protecting

[Hussein, 3(7): July, 2014] ISSN: 2277-9655 Scientific Journal Impact Factor: 3.449
(ISRA), Impact Factor: 1.852
http: // www.ijesrt.com (C)International Journal of Engineering Sciences & Research Technology
[379-388]
water quality and aesthetic beauty. [4] Viewed any
tech¬nology that tries to harness optimum use of
avail¬able resource in a given environment while
mini¬mizing the negative environmental
consequence as appropriate technology.
Anaerobic digestion (AD) is an environmental
friendly biological process in which microorganisms
work synergistically to convert organic waste into
biogas and a stable product (soil conditioner) for
agricultural practices without any detrimental effect
on the environment [5]. Co-digestion was used by
many researchers such as Chellapandi, 2004 and
Edelmann et al., 2005 and [6] [7].
To improve biogas yield by controlling the carbon to
nitrogen ratio. The source of animal or agriculture
wastes used in anaerobic digestion is important in
ensuring a successful operation of the process
because of the lignin components of animal manure.
Monogastric animals are known to produce wastes
that contain more nutrients than ruminants.
Ruminants are known to excrete more lignocelluloses
material due to extensive enzymic exposure in their
four chamber stomach [8]. The high presence of
lignin in animal waste can resist anaerobic
degradation even after a long retention time or may
prevent anaerobic process from commencing
[8][9][10].
At present study, methane is produced using M.S.W
in an anaerobic digester. By mixing different
proportion of M.S.W and sewage sludge, the
objectives of the present study is to optimization of
gas production, study the effect of different
parameters viz. (mixing, ratio, pH, temperature and
total solid) and establishing mathematical models for
production of methane.
Materials and method Sample Collection
Substrates used for the study were putrescible
waste mixed with anaerobic sludge collected from
thickener of Al-Rustamiyah sewage treatment plant,
the old project, Baghdad, Iraq. The solid wastes used
in the present study are collected from three transfer
stations located at Baghdad (New Baghdad, Al-Dora
and Al-Bayaa,). The anaerobic sludge used was
collected as (slurry) from sewage sludge collection
system (Al-Rustamiyah sewage treatment plant, the
old project, Baghdad, Iraq). The SW was crushed by
using an electrical blender minced into pieces of
<0.005 m in diameter using a food processor (Brown,
China ), Different physical parameters in the
biodegradable portion of municipal waste like pH,
moisture content, total solids and volatile solids were
estimated. All the raw materials and sewage sludge
are mixed well before the composting reaction began.
Experimental Design
A set of batch reactors as shown in Figure (1)
were used as digesters. Each digester contained
organic waste co-digested with different ratio of
sludge. In a 1000 ml conical flask bottle, the
substrates are mixed with different ratio of sewage
sludge to obtain a slurry, the ratios of sludge/SW
used in this study are (1:1, 1:3, 1:5, 1:7 and 1:10) at
temperature of 25±3 C0 and pH of 6.3. The bottle
was fit with a rubber cork having one hole. Delivery
tubes were inserted in the holes which remained
above the layer of the slurry [5]. The other end ran
through another cork enclosing 1000 ml of super
saturated salt (NAOH) solution without immersion,
while another tube with a rubber host, immersed in
super saturated salt solution; ran through the same
cork into an empty flask. The digesters were set up as
described by [11] [12] [13]. And methane
measurements were carried out by water
displacement method in which super saturated salt
solution displaced was proportional to the volume of
biogas produced. Ambient temperature was
determined with an analogue thermometer [13].
Figure (1) Batch scale anaerobic digester
After choosing the best ratio for methane production,
the pH, temperature and total solid are studied as a
single factors affecting on production, sets in Table
(1).

[Hussein, 3(7): July, 2014] ISSN: 2277-9655 Scientific Journal Impact Factor: 3.449
(ISRA), Impact Factor: 1.852
http: // www.ijesrt.com (C)International Journal of Engineering Sciences & Research Technology
[379-388]
Table1. Factors affecting on biogas production
Results and discussion In the present study, SW and sewage sludge were
utilized for the suitability of methane production at
different conditions (such as; mix ratio, pH,
temperature and T.S).
Effect of mixing ratio The effect of mixing ratio on methane production is
shown in Figures (2 and 3). The results show that, the
maximum accumulative production of methane as
shown in Figure (2) was at mixing ratio of (1:5
sludge/SW), the accumulative methane production is
(214.6625 mL/gm v.s), while for others ratio (1:1,
1:3,1:7 and 1:10) the productions are 174, 203.25,
180.135 and 171.019 mL/gm v.s respectively. However, Figure (3) show the maximum daily
methane production was observed at (15, 16, 15, 14
and 18) days for (1:1, 1:3, 1:5, 1:7 and 1:10) ratios
where the productions are (14.09, 18.06, 18, 16.27
and 12.28 mL/gm v.s) respectively. The reason for
choosing this ratio is to balance between the foods to
bacteria. If food less or more the needs amount, the
production may be decreasing. If the sludge/bacteria
ratio (i.e., bacteria/food ratio) is less than the best
ratio founding, this may case acidification ratio
which inhibit the activity of bacteria. However, if the
case is reverse this make substrate insufficient to
improve bacteria activity and thus reduce methane
production. This result is in agreement with those
obtained by [14][15]. The co-digestion of inoculum
with OFMSW in a 1:5 mixture (based on wet weight)
was successful at period of equal or more than 25
days [16].
Effect of pH
The pH of mixed thickener sludge and solid waste are
varied in the range (6.5, 7, 7.5, 8 and 8.5) using 0.1
H2SO4 and 0.1 NaOH. Temperature and TS and are
fixed at 25±3 oC, 11.54% respectively. While mixing
ratio is fixed at best value obtained from above
experiments. The experiments continue until no or
minimum methane production is produced which is
found to be 30 days. The methane production occurs
at pH (7.5) with maximum value of (391.685mL/gm
v.s) as shown in Figures (4).While, the maximum
daily methane production occurs at (13, 10, 10, 10
and 11) days for (6.5, 7, 7.5, 8 and 8.5) pH values
where the productions are (19.34, 24.12, 25.31, 11.31
and 9.22 mL/gm v.s) respectively. As shown in
Figure (5). The reason for this best pH may be
attributed to those methanogenic bacteria responsible
Parameter values
pH 6.5 7 7.5 8 8.5
Temperature oC 30 35 40
Total solid % 8 9 10 11 12 13
Figure (3) Daily methane production from different ratio
of sludge/ SW
0
2
4
6
8
10
12
14
16
18
20
0 5 10 15 20 25 30 35
Time (day)
Da
ily
meth
an
e p
ro
du
cti
on
(ml/
gm
V.S
)
1:5 1:3 1:7 1:1 1:10Figure (2) Accumulative biogas production (ml/gm v.s) from
different ratio
0
50
100
150
200
250
0 5 10 15 20 25 30 35
Time (day)
Accu
m.
Meth
an
e p
ro
du
cti
on
(ml/
gm
V.S
)
1:5 1:3 1:7 1:1 1:10

[Hussein, 3(7): July, 2014] ISSN: 2277-9655 Scientific Journal Impact Factor: 3.449
(ISRA), Impact Factor: 1.852
http: // www.ijesrt.com (C)International Journal of Engineering Sciences & Research Technology
[379-388]
for methane production can occasionally grow at pH
ranges which defined as 6.5-8.2. [17].
Variation in pH affected the anaerobic digestion
process because the hydrogen ion concentration has
direct influence on microbial growth. The ideal pH
for methanogens ranges from 6.80 to 7.60, and their
growth rate will be greatly reduced below pH 6.60. A
pH less than 6.10 or more than 8.30 will cause poor
performance and even the failure of a fermenter [18].
Effects of temperature
The effects of different temperature values (30, 35
and 40) on methane production were studied at best
bacteria source, mixing ratio, pH values. The total
solid is fixed at 11.54%. To increase the temperature
and keep it constant; water bath was used. The best
temperature was found to be (35 oC) with maximum
accumulative methane product of (410mL/gm v.s).
For temperatures 30 and 40 oC methane production
are 363 and 397 mL/gm v.s respectively as shown in
Figure (6). The maximum daily methane production
for (30, 35 and 40 oC) occurs at (13, 12 and 16) days
where the productions are (26.21, 30.44 and 29.34
mL/gm v.s) respectively as shown in Figure (7). It
was found by many researchers that mesophilic
bacteria play the major roles in methane production.
mesophilic level ranging from (25- 40 oC). These
results are in good agreement with those obtained by
[19][20].
Effects of total solid (TS)
Figure (8) show the effect of TS on biogas production
at optimum conditions obtained from previous
experiments. The TS is varied in the range (8, 9, 10,
11, 12 and 13 %). the maximum accumulative
methane production is occurred for TS percent of
10% where the production is (450 mL/gm v.s).While,
Figure (5) Daily methane production at different
pH
0
5
10
15
20
25
30
0 5 10 15 20 25 30 35
Time (day)
Da
ily
meth
an
e p
ro
du
ctio
n
(m
L/g
m V
.S)
ph7.5 ph7 ph6.5 ph8 ph8.5
Figure (4) Accumulative biogas production (ml/gm
v.s) at different pH
0
50
100
150
200
250
300
350
400
0 5 10 15 20 25 30 35
Time (day)
Accu
m.m
eth
an
e p
rod
uctio
n
(
mL
/gm
V.S
)
ph7.5 ph7 ph6.5 ph8 ph8.5
Figure (6) Accumulative biogas production (ml/gm
v.s) at different temperature
-50
0
50
100
150
200
250
300
350
400
450
0 5 10 15 20 25 30 35
Time (day)
Accu
m. m
eth
an
e p
ro
du
cti
on
(mL
/gm
V.S
)
temp.30 temp.40 temp.35
Figure (7) daily methane production at different
temperature
0
5
10
15
20
25
30
35
0 5 10 15 20 25 30 35
Time (day)
Da
ily
meth
an
e p
ro
du
cti
on
(m
L/g
m V
.S)
temp.35 temp.40 temp.30

[Hussein, 3(7): July, 2014] ISSN: 2277-9655 Scientific Journal Impact Factor: 3.449
(ISRA), Impact Factor: 1.852
http: // www.ijesrt.com (C)International Journal of Engineering Sciences & Research Technology
[379-388]
The maximum daily methane production as shown in
Figure (9) occur at (11, 11, 9, 10, 12 and 13) days for
(8, 9, 10, 11, 12 and 13 %) respectively where the
productions are (22.495, 34.22, 41.10, 35.20, 23.11
and 24.61 mL/gm v.s) respectively. The TS reached
to 1.74% after 30 days of reaction period where the
consumed is about 82.60% this gives an indicators to
the degree of reaction happen in the anaerobic
reactor.
A high volatile solid contents of substrates (i.e., 12
and 13 %) may not necessary translate to high biogas
yield due to the presence of non-degradable volatile
solids in form of lignin. It is important to note that
the volatile matter content of any substrate accounts
for the proportion of solids that is transformed into
biogas [11][21]. Hence, for a successful digestion to
take place; the process of anaerobic digestion of
organic wastes with thickener sludge will provide a
balance between the lignin content and the carbon to
nitrogen ratio [22].In addition to that, when TS
percentage increases, the percent of water decreases,
thus reducing the level of microbial activity, which
then affects the amount of biogas, particularly at
higher values of the TS [8]. It could be deduced from
the Figures that generally at low concentrations of
total solids, the gas production increases steadily than
at higher concentrations of total solids. But, it could
be noticed also that, as the solid concentration
increases above the recommended percentage total
solids of 7-10% the gas production begins to drop or
falls drastically with increased amount of total solids
which is agreed with the results of our study.
Total Volatile Acids and Total Alkalinity
The stability of anaerobic digestion process was
measured at optimum conditions obtained from
previous experiments. VFAs and alkalinity together
are the good indicators to evaluate the process
stability of the anaerobic reactor. The ratio obtained
is varied between (0.20 to 0.50) except during startup
period (first 6 days) though the ratio was noted up to
0.8. The process seemed stable because no
accumulation of VFAs. As reported by the previous
study [23]. If the ratio of VFAs to alkalinity exceeded
0.80, the inhibition of methanogens which is
responsible for methane production occurred. Other
researches [24][25] have stated that optimum average
ratio of VFAs to alkalinity should not be more than
0.40 and should not be less than 0.1 which is close to
the average ratio obtained in the present study
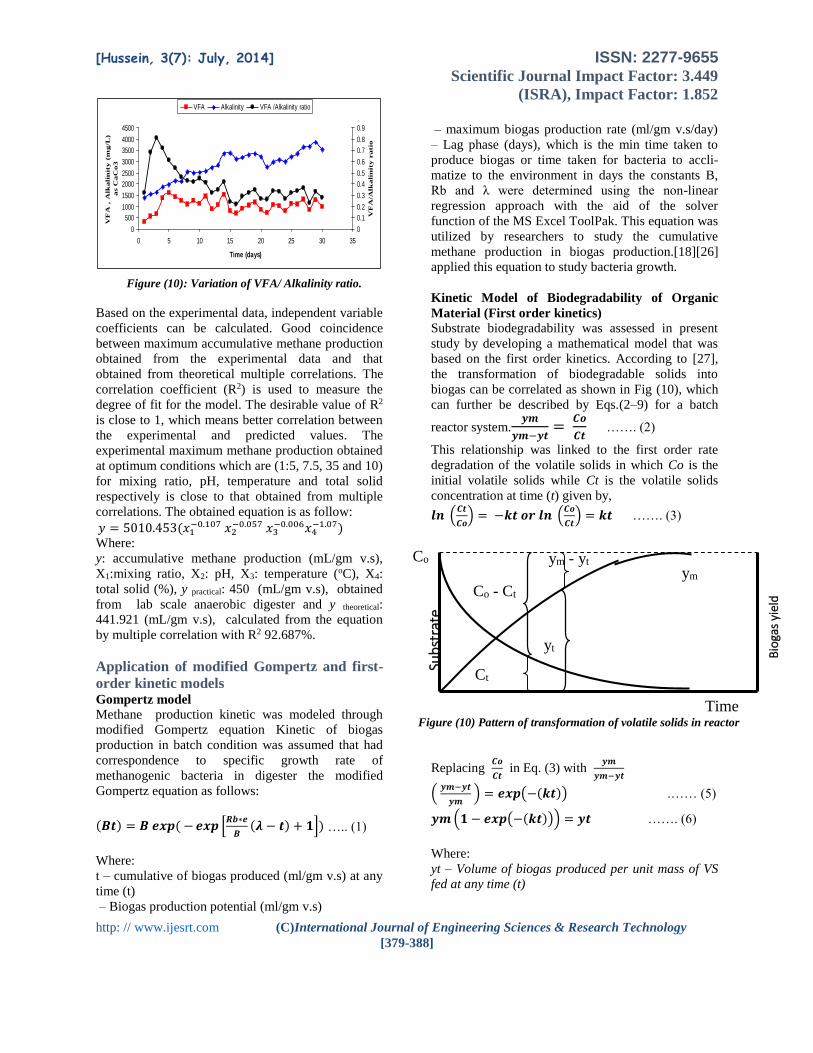
(0.389). Figure (10) shows the variation in VFAs to
alkalinity ratio.
Multiple correlations for methane production
process Multiple correlations methodology was employed to
find the relationship between the methane production
and mixing ratio, pH, temperature and total solid.
Equation (y=aX1 bX2 c X3
d X4e X5
f) was solved to find
out these relationships by the application of Excel
program.
Figure (8) Accumulative biogas production (ml/gm
v.s) at different total solid content
0
50
100
150
200
250
300
350
400
450
500
0 5 10 15 20 25 30 35
Time (day)
Accu
m. m
eth
an
e p
ro
du
cti
on
(m
L/g
m V
.S)
T.S 8% T.S 10% T.S 12%
T.S 9% T.S 11% T.S 14%
Figure (9): Daily methane production at different
total solid percent.
0
5
10
15
20
25
30
35
40
45
0 5 10 15 20 25 30 35
Time (day)
Da
ily
meth
an
e p
ro
du
cti
on
(mL
/gm
V.S
)
T.S 10% T.S 9% T.S 11%
T.S 8% T.S 12% T.S 13%
[Hussein, 3(7): July, 2014] ISSN: 2277-9655 Scientific Journal Impact Factor: 3.449
(ISRA), Impact Factor: 1.852
http: // www.ijesrt.com (C)International Journal of Engineering Sciences & Research Technology
[379-388]
0
500
1000
1500
2000
2500
3000
3500
4000
4500
0 5 10 15 20 25 30 35
Time (days)
VF
A ,
Alk
ali
nit
y (
mg
/L)
as C
aC
o3
0
0.1
0.2
0.3
0.4
0.5
0.6
0.7
0.8
0.9
VF
A/A
lkali
nit
y r
atio
VFA Alkalinity VFA /Alkalinity ratio
Figure (10): Variation of VFA/ Alkalinity ratio.
Based on the experimental data, independent variable
coefficients can be calculated. Good coincidence
between maximum accumulative methane production
obtained from the experimental data and that
obtained from theoretical multiple correlations. The
correlation coefficient (R2) is used to measure the
degree of fit for the model. The desirable value of R2
is close to 1, which means better correlation between
the experimental and predicted values. The
experimental maximum methane production obtained
at optimum conditions which are (1:5, 7.5, 35 and 10)
for mixing ratio, pH, temperature and total solid
respectively is close to that obtained from multiple
correlations. The obtained equation is as follow:
𝑦 = 5010.453(𝑥1−0.107 𝑥2
−0.057 𝑥3−0.006𝑥4
−1.07) Where:
y: accumulative methane production (mL/gm v.s),
X1:mixing ratio, X2: pH, X3: temperature (oC), X4:
total solid (%), y practical: 450 (mL/gm v.s), obtained
from lab scale anaerobic digester and y theoretical:
441.921 (mL/gm v.s), calculated from the equation
by multiple correlation with R2 92.687%.
Application of modified Gompertz and first-
order kinetic models Gompertz model
Methane production kinetic was modeled through
modified Gompertz equation Kinetic of biogas
production in batch condition was assumed that had
correspondence to specific growth rate of
methanogenic bacteria in digester the modified
Gompertz equation as follows:
(𝑩𝒕) = 𝑩 𝒆𝒙𝒑 ( − 𝒆𝒙𝒑 [𝑹𝒃∗𝒆
𝑩(𝝀 − 𝒕) + 𝟏])
Where:
t – cumulative of biogas produced (ml/gm v.s) at any
time (t)
– Biogas production potential (ml/gm v.s)
– maximum biogas production rate (ml/gm v.s/day)
– Lag phase (days), which is the min time taken to
produce biogas or time taken for bacteria to accli-
matize to the environment in days the constants B,
Rb and λ were determined using the non-linear
regression approach with the aid of the solver
function of the MS Excel ToolPak. This equation was
utilized by researchers to study the cumulative
methane production in biogas production.[18][26]
applied this equation to study bacteria growth.
Kinetic Model of Biodegradability of Organic
Material (First order kinetics)
Substrate biodegradability was assessed in present
study by developing a mathematical model that was
based on the first order kinetics. According to [27],
the transformation of biodegradable solids into
biogas can be correlated as shown in Fig (10), which
can further be described by Eqs.(2–9) for a batch
reactor system.𝒚𝒎
𝒚𝒎−𝒚𝒕=
𝑪𝒐
𝑪𝒕 ……. (2)
This relationship was linked to the first order rate
degradation of the volatile solids in which Co is the
initial volatile solids while Ct is the volatile solids
concentration at time (t) given by,
𝒍𝒏 (𝑪𝒕
𝑪𝒐) = −𝒌𝒕 𝒐𝒓 𝒍𝒏 (
𝑪𝒐
𝑪𝒕) = 𝒌𝒕 ……. (3)
Replacing 𝑪𝒐
𝑪𝒕 in Eq. (3) with
𝒚𝒎
𝒚𝒎−𝒚𝒕
( 𝒚𝒎−𝒚𝒕
𝒚𝒎 ) = 𝒆𝒙𝒑(−(𝒌𝒕)) .…… (5)
𝒚𝒎 (𝟏 − 𝒆𝒙𝒑(−(𝒌𝒕))) = 𝒚𝒕 ……. (6)
Where:
yt – Volume of biogas produced per unit mass of VS
fed at any time (t)
….. (1)
Figure (10) Pattern of transformation of volatile solids in reactor
Bio
gas
yiel
d Co - Ct
Ct
ym - yt
yt
Co
Sub
stra
te
Time
ym

[Hussein, 3(7): July, 2014] ISSN: 2277-9655 Scientific Journal Impact Factor: 3.449
(ISRA), Impact Factor: 1.852
http: // www.ijesrt.com (C)International Journal of Engineering Sciences & Research Technology
[379-388]
ym –Volume of biogas per unit of mass of VS
converted at max time
The rate constant associated with the degradation of
the biodegradable fractions is represented by k
(1/days), while the period of digestion is represented
by t (in days).
The application of Eq. (6) in assessing substrate
biodegradability and the rate constant was accom-
plished by attempting to linearize Eq. (6) as shown
below. By differentiating Eq. (6), we obtain,
( 𝒅𝒚𝒕
𝒅𝒕 ) = 𝒚𝒎 𝒌 𝒆𝒙𝒑(−(𝒌𝒕)) …… (7)
Taking natural logarithm on both sides of the
equation we obtain
𝒍𝒏 ( 𝒅𝒚𝒕
𝒅𝒕 ) = (𝒍𝒏 𝒚𝒎 + 𝒍𝒏 𝒌) − 𝒌𝒕 ……. (8)
This equation can be reduced to the form 𝟏
𝒕𝒍𝒏 (
𝒅𝒚𝒕
𝒅𝒕 ) =
𝟏
𝒕(𝒍𝒏 𝒚𝒎 + 𝒍𝒏 𝒌) − 𝒌𝒕 …….. (9)
Eq. (9) is analogous to the straight line equation y =
mx + c, in which (ln ym + ln k) represents the slope
while, (–k) represents the intercept of the plot of
against the inverse of the retention time.
𝟏
𝒕𝒍𝒏 (
𝒅𝒚𝒕 (𝒎𝒍
𝒈𝒎𝑽𝑺)
𝒅𝒕(𝒅𝒂𝒚) )
The term (ln ym + ln k) is a measure of the
availability of readily and moderately degradable
fractions of the substrate. [28] Reported that, because
of the limited time range of most biodegradability
test, only the readily and moderately degradable
fractions are consumed while the poorly or
recalcitrant fractions are hardly affected. Thus, the
term can be used to select substrate with the potential
for high biogas production from a given substrate
volatile solid under short retention time and was
referred to as the short term anaerobic
biodegradability index (STABI). Higher values of
this term depict substrate with the potential to
produce high quantity of biogas under short retention
periods while lower values are indicative of substrate
with the potential to produce low quantity of biogas
under short retention periods from a given substrate
volatile solids. The term (–k) is a measure of the rate
of removal of the biodegradable fractions as the
biogas yield increases with time. This rate constant is
an aspect of the first order rate constant. The first
order kinetic constant was described by [29] as
purely an empirical function that reflects the
cumulative effects of many processes such as pH,
temperature, quantity and quality of substrate, rate of
removal of the biodegradable fractions, rate of
inhibition by other components of the substrate such
as lignin or by- product of the reaction process such
as fatty acids etc.
The more negative the value of (k), the faster the
rates of removal of the biodegradable fractions while
of removal of the biodegradable fractions. Thus, Eq.
(9) can be used to measure the room temperature
short term biodegradability and also identify anaer-
obic processes that are progressive or stressed.
The application of this modified first order model
equation in assessing the room temperature short
term biodegradability and removal rate of the bio-
degradable fractions was carried out for the substrates
in digesters. A plot of
𝟏
𝒕𝒍𝒏 (
𝒅𝒚𝒕 (𝒎𝒍 𝒌𝒈
𝑽𝑺)
𝒅𝒕(𝒅𝒂𝒚) )
Versus 𝟏
𝒕 (1/day)
The experimental results for accumulative methane
poduction re fitted with Gompertz and first order
kinetic models. The , esults are listed in Table (2) and
shown in Figures (11 and 12). The parameters for
each model were estimated by non-liner regression
using STATISTICA version-6 and EXCEL-2010
software.
Table (2): parameters of Gompertz and first order kinetic
models.
Gompertz
model
B,
mL/gm
v.s
Rb,
mL/gm
v.s day
λ, days R2
455.652 35.161 5.054 0.9997
Experimental 450 41.1 3 ----
First order
kinetic model
K, 1/day R2
- 0.0491 0.939

[Hussein, 3(7): July, 2014] ISSN: 2277-9655 Scientific Journal Impact Factor: 3.449
(ISRA), Impact Factor: 1.852
http: // www.ijesrt.com (C)International Journal of Engineering Sciences & Research Technology
[379-388]
From the Figures and Table for application of the
above model the following conclusions can be drawn:
1. Gompertz model fitted very well with the
experimental data with high correlation coefficient.
The experimental methane production potential (B,
ml/gm v.s), maximum biogas production rate (Rb,
mL gm v.s /day) and lag phase (λ, days) are close to
those obtained by the applied model. These results
are in good agreement with those obtained by many
researchers. [18][26]. applied this equation to study
bacteria growth. Budiyono utilized this modified
equation to describe biogas yield from cattle manure
[30]. The obtained results are fitted with the
experimental data. Table (3) shows the comparison of
data obtained from this study and those obtained by
other researchers by applying Gompertz model.
2. SW biodegradability was assessed in this study by
applying a mathematical model that was based on the
first order kinetics. The term (–k) is a measure of the
rate of removal of the biodegradable fractions as the
biogas yield increases with time. The obtained
negative value of (- 0.0491), indicates that the solid
waste biodegradation was fast. This also confirms
that the biodegradation conditions which are sludge /
SW ratio, pH, temperature and TS improve the
anaerobic digestion process. This is in consistent with
those obtained by [8].
Conclusion In today’s energy demanding life style,
Organic Fractions of Municipal Solid Waste
(OFMSW) proves to be renewable source of energy
in the form of biogas. Anaerobic digestion of
OFMSW with sewage sludge increased the
cumulative biogas yield when compared to solid
waste. The best performance of biogas generation
was observed in digester at condition of mixing ratio,
pH, temperature and total solid. The values are (5:1,
7.5, 35 oC and 10%). Application of the multiple
correlations model, modified Gompertz equation and
kinetic first order in studying the biogas production
was able to predict the pattern of biogas production
with time and different parameters. When the R2
valve is greater than 0.5, it may be concluded that the
parameter is supporting the production of biogas.
Accordingly mixing ratio, pH, temperature and TS
are supporting the production of bio gas. The values
of R2 are (92.687, 0.9997 and 0.939) for multiple
correlations model, modified Gompertz equation and
kinetic first order respectively.
References 1. Sixt H., Sahm H., 1987. Biomethanation. In:
Sidwich J.M., Holdom R. (eds)
Biotechnology of Water Treatment and
Exploitation. Chichester UK, Ellis
Horwood.
2. Stiffen, R., Szolar. O., and Braun, R. (2000),
"Feed Stock for Anaerobic Digestion",
Making Energy and Solving Modern Waste
0 5 10 15 20 25 30 35
Time (days)
0
100
200
300
400
500
Accu
m.
meth
an
e p
rod
ucti
on
(m
L/g
m v
s)
Figure (11): Comparison of experimental data and
modified Gompertz model for biogas production
Experiential
Theoretical (Gompertz
model)
Figure (12): Comparison of experimental data and First
order kinetic model for methane production
0
0.05
0.1
0.15
0.2
0.25
0.3
0.35
0.4
0.45
0.5
0 0.05 0.1 0.15 0.2 0.251/t (1/day)
1/t ln
(d
yt/d
t) (m
L/gm
V
.S
)
Experimental
Theoretical (First order kinetic model)

[Hussein, 3(7): July, 2014] ISSN: 2277-9655 Scientific Journal Impact Factor: 3.449
(ISRA), Impact Factor: 1.852
http: // www.ijesrt.com (C)International Journal of Engineering Sciences & Research Technology
[379-388]
Problem [Internet], AD-Nett. Available from
<www.adnett.org/dl_feedstocks.pdf>
3. Myles R.M., 1985. Practical Guide to Janata
Biogas Plant Technology. New Delhi, India,
AFPRO Action Food Pro¬duction.
4. Vaa M., 1993. Towards more appropriate
technologies? Ex¬perience from the Water
and Sanitation Sector, Research Report 93
Nordiska Afrikain-Stitutet Uppsala.
Available at: http//nai.diva-portal.or
5. Jagadish, H., Malourdu, A.R., Muralidhara,
P.L., Desai, S.M., and Mahadeva, G.K.
(2012) Kinetics of Anaerobic Digestion of
Water Hycinth using Poultry Litter as
Inoculums. International Journal of
Environmental Science and Development, 3,
p. 2.
6. Edelmann, W., Baier, U., and Engeli, H.
(2005) Environmental aspects of the
anaerobic digestion of the organic fraction
of municipal solid wastes and of solid
agricultural wastes. Water, Science and
Technology, 52(1-2), pp.203-208.
7. Chellapandi, P. (2004), Enzymes and
Microbiological Pretreatment of Oil
Industry Waste for Biogas Production in
Batch Digesters. In: Pathade, G.R., and
Goel, P.K. ed. Biotechnology in
Environmental Management. Jaipur, India,
ABD Publishers, pp. 39-74.
8. Yusuf, M.O.L., Debora, A., and
Ogheneruona, D.E. (2011) Ambient
Temperature Kinetic Assessment of Biogas
Production from Co-digestion of Horse and
Cow dung. Res. Agr. Eng, 57(3), pp. 97-104.
9. Chae, K.J., Jang, A., Yim, S.K., and Kim, I.S.
(2008) The Effects of Digestion Temperature
and Temperature Shock on the Biogas Yield
from the Mesophillic Anaerobic Digestion of
Swine Manure. Bioresour. Technol., 99, pp.
1-6.
10. Stuckey, D.C. (1986) Biogas: A Global
Perspective. In: El- Halwagi, M.M. ed.
Biogas Technology, Transfer and Diffusion.
Elsevier applied science publishers Ltd., pp.
18-44.
11. Itodo, I.N., Lucas, E.B., and Kucha, E.L.
(1992) The Effect of Media Material and its
Quality on Biogas Yield. Nigeria Journal of
Renewable Energy, 3, pp. 45-49.
12. Momoh, O.L.Y., and Nwaogezie, I.L. (2008)
Effect of waste paper on biogas production
from co-digestion of cow dung and water
hyacinth in batch reactors. Journal of
Applied Science and Environmental
Management, 124, pp. 95-98.
13. Membere, E.A., Ugbebor, J., and Akan, U.E.
(2012) Biomechanization Potential of
Organic Fraction of Municipal Solid Waste
from Co-digestion of Pig and Cow dung.
International Journal of Environmental
Science (IJNS), 2(4), pp. 2387-2399.
14. Neves, R. Oliveira and M. M. Alves,
“Influence of inoculum activity on the bio-
methanization of a kitchen waste under
different waste/inoculum ratios”, Process
Biochem., vol. 39, pp. 2019-2024, 2004.
15. Raposo, M. A. de la Rubia, R. Borja, M.
Alaiz, J. Beltran and C. Cavinato, “An
interlaboratory study as a useful tool for
proficiency testing of chemical oxygen
demand measurements using solid
substrates and liquid samples with high
suspended solid content”, Talanta, vol. 80,
pp. 329-337, 2009.
16. Cuetos, M.J., Gómez, X., Otero, M. and
Morán, A., Anaerobic digestion of solid
slaughterhouse waste (SHW) at laboratory
scale: Influence of co‐digestion with the
organic fraction of municipal solid waste
(OFMSW). Biochemical Engineering
Journal, 2008. 40(1): p. 99‐106.
17. Anunputtikul, W., Rodtong, S., Laboratory
Scale Experiments for Biogas Production
from Cassava Tubers, The Joint
International Conference on “Sustainable
Energy and Environment (SEE)”, Hua Hin,
Thailand, 2004.
18. Lay JJ, Li YY, Noike T, Endo J, Ishimoto S
(1997). Analysis of Environmental Factors
Affecting Methane Production from High-
solids Organic Waste. Water Sci. Technol.,
36(6-7): 493-500.
19. Bitton, G., Wastewater Microbiology, New
York: A John Wiley & Sons, 1994 BPS,
Produksi Bahan-bahan Pangan Indonesia,
2009.
20. Mackie, R. L. and Bryant M. P., Anaerobic
Digestion of Cattle Waste at Mesophilic and
Thermophilic Temperatures, Applied
Microbiology and Biotechnolgy 43: 346-
350, 1995.
21. Ituen E.E., John M.M. and Bassey B.E.,
Biogas Production from Organic Waste in

[Hussein, 3(7): July, 2014] ISSN: 2277-9655 Scientific Journal Impact Factor: 3.449
(ISRA), Impact Factor: 1.852
http: // www.ijesrt.com (C)International Journal of Engineering Sciences & Research Technology
[379-388]
Akwa Ibom State of Nigeria, Appropriate
Technologies for Environmental Protection
in the Developing World, Selected Papers
from ERTEP 2007, July 17 -19, Ghana,
(2007)
22. Nuhu M., Mujahid M.M., Aminu A.H., Abbas
A.J., Babangida D., Tsunatu D.Y., Aminu
Y.Z., Mustapha Y., Ahmed I. and Onukak
I.E., Optimum Design Parameter
Determination of Biogas Digester using
Human Faeces Feedstock, Journal of
Chemical Engineering and Materials
Science (JCEMS); Academic Journals, 4(4),
46-49 (2013
23. Zhao HW, Viraraghavan T (2004). Analysis
of the Performance of an Anaerobic
Digestion System at the Rigna Wastewater
Treatment Plant. Bioresour. Technol. 95(3):
301-307.
24. Sánchez ER, Borja R, Travieso L, Martin A,
Colmenarvejo MF (2005). Effect of Organic
Loading Rate on Stability, Operational
Parameters and Performance of a
Secondary Upflow Anaerobic Sludge Bed
Reactor Treating Piggery Waste. Bioresour.
Technol., 96 (3): 335-344.]
25. Malpei F, Andreoni V, Daffonchio D, Rozzi
A (1998). Anaerobic Digestion of Print
Pastes: A Preliminary Screening of
Inhibition by Dyes and Biodegradability of
Thickeners. Bioresour. Technol., 63 (1): 49-
56.
26. Zwietering, M.H., Jongenburger I.,
Rombouts F.M., Van’t Riet K., 1990.
"Modeling of the bacterial growth curve",
Applied and Environmental Microbiology,
56: 1875–1881
27. Linke B., 2006. Kinetic study of thermophilic
anaerobic digestion of solid wastes from
potato processing. Biomass and Bioenergy,
30: 892–896.
28. Godley A., Lewin K., Graham A., 2003.
Estimating bio¬degradable municipal solid
waste diversion from landfill. Available at:
www.ecn.nl (accessed September 16, 2011).
29. Eastman J.A., Ferguson J.F., 1981.
Solubilization of particulate organics
carbon during the acid phase of anaerobic
digestion. Journal Water Pollution Control
Federation, 53: 352.
30. Budiyono, Widiasa I.N., Johari S. and
Sunarso, 2010, "The kinetics of biogas
production rate from cattle manure in batch
model", International Journal of Chemical
and Bio¬molecular Engineering, 3: 39–44