Evaluation of temperature gradient gel electrophoresis for the analysis of prey DNA within the guts...
10
Evaluation of temperature gradient gel electrophoresis for the analysis of prey DNA within the guts of invertebrate predators G.L. Harper 1 #, S.K. Sheppard 1 , J.D. Harwood 1 z, D.S. Read 1 , D.M. Glen 2 ·, M.W. Bruford 1 and W.O.C. Symondson 1 * 1 Cardiff School of Biosciences, Cardiff University, PO Box 915, Cardiff, CF10 3TL, UK: 2 IACR-Long Ashton Research Station, Department of Agricultural Sciences, University of Bristol, Long Ashton, Bristol, BS41 9AF, UK Abstract The utility of temperature gradient gel electrophoresis (TGGE) as a means of analysing the gut contents of predators was evaluated. Generalist predators consume multiple prey species and a species-specific primer approach may not always be a practical means of analysing predator responses to prey diversity in complex and biodiverse ecosystems. General invertebrate primers were used to amplify the gut contents of predators, generating banding patterns that identified component prey remains. There was no evidence of dominance of the polymerase chain reaction (PCR) by predator DNA. When applied to field samples of the carabid predator Pterostichus melanarius (Illiger) nine banding patterns were detected, including one for aphids. To further distinguish between species, group- specific primers were designed to separate species of earthworm and aphid. TGGE of the earthworm PCR products generated banding patterns that varied with haplotype in some species. Aphid and earthworm DNA could be detected in the guts of carabids for up to 24 h using TGGE. In P. melanarius, with low numbers of prey per insect gut (mean < 3), interpretation of banding patterns proved to be tractable. Potential problems of interpretation of TGGE gels caused by multiple prey bands, cryptic bands, haplotype variation, taxonomic uncertainties (especially with regard to earthworms), secondary predation, scavenging and presence of parasites and parasitoids in the prey or the predators, are discussed. The results suggest that PCR, using combinations of general invertebrate and group-specific primers followed by TGGE, provides a potentially useful approach to the analysis of multiple uncharacterized prey in predators. * Author for correspondence Fax: 029 20 874305 E-mail: [email protected] #Present address: School of Applied Sciences, University of Glamorgan, Pontypridd, Mid-Glamorgan, CF37 1DL, UK zPresent address: Department of Entomology, University of Kentucky, S-225 Agricultural Science Center – North, Lexington, KY 40546-0091, USA ·Present address: Styloma Research and Consulting, Phoebe, The Lippiatt, Cheddar, BS27 3QP, UK S.K. Sheppard and G.L. Harper contributed equally to the experimental work in this paper and should be considered joint first authors Bulletin of Entomological Research (2006) 96, 295–304 DOI: 10.1079/BER2006426
Transcript of Evaluation of temperature gradient gel electrophoresis for the analysis of prey DNA within the guts...

Evaluation of temperature gradientgel electrophoresis for the analysis of
prey DNA within the guts ofinvertebrate predators
G.L. Harper1#, S.K. Sheppard1, J.D. Harwood1z, D.S. Read1,D.M. Glen2·, M.W. Bruford1 and W.O.C. Symondson1 *1Cardiff School of Biosciences, Cardiff University, PO Box 915, Cardiff,CF10 3TL, UK: 2IACR-Long Ashton Research Station, Department ofAgricultural Sciences, University of Bristol, Long Ashton, Bristol,
BS41 9AF, UK
Abstract
The utility of temperature gradient gel electrophoresis (TGGE) as a means ofanalysing the gut contents of predators was evaluated. Generalist predatorsconsume multiple prey species and a species-specific primer approach may notalways be a practical means of analysing predator responses to prey diversity incomplex and biodiverse ecosystems. General invertebrate primers were used toamplify the gut contents of predators, generating banding patterns that identifiedcomponent prey remains. There was no evidence of dominance of the polymerasechain reaction (PCR) by predator DNA. When applied to field samples of thecarabid predator Pterostichus melanarius (Illiger) nine banding patterns weredetected, including one for aphids. To further distinguish between species, group-specific primers were designed to separate species of earthworm and aphid. TGGEof the earthworm PCR products generated banding patterns that varied withhaplotype in some species. Aphid and earthworm DNA could be detected in theguts of carabids for up to 24 h using TGGE. In P. melanarius, with low numbers ofprey per insect gut (mean< 3), interpretation of banding patterns proved to betractable. Potential problems of interpretation of TGGE gels caused by multipleprey bands, cryptic bands, haplotype variation, taxonomic uncertainties (especiallywith regard to earthworms), secondary predation, scavenging and presence ofparasites and parasitoids in the prey or the predators, are discussed. The resultssuggest that PCR, using combinations of general invertebrate and group-specificprimers followed by TGGE, provides a potentially useful approach to the analysisof multiple uncharacterized prey in predators.
*Author for correspondenceFax: 029 20 874305E-mail: [email protected]#Present address: School of Applied Sciences, University of Glamorgan, Pontypridd, Mid-Glamorgan, CF37 1DL, UKzPresent address: Department of Entomology, University of Kentucky, S-225 Agricultural Science Center – North,Lexington, KY 40546-0091, USA·Present address: Styloma Research and Consulting, Phoebe, The Lippiatt, Cheddar, BS27 3QP, UKS.K. Sheppard and G.L. Harper contributed equally to the experimental work in this paper and should be consideredjoint first authors
Bulletin of Entomological Research (2006) 96, 295–304 DOI: 10.1079/BER2006426

Keywords: aphid, carabid beetle, earthworm, gut content analysis, predator–preyinteractions, Pterostichus melanarius
Introduction
Interactions between generalist predators and their manydifferent prey are key components of ecological studies thatseek to explain the processes driving animal populationdynamics. DNA-based techniques are increasingly becomingthe methods of choice for research into predator–preyrelationships (reviewed in Symondson, 2002; Sheppard &Harwood, 2005). Techniques and PCR primers have beendeveloped to detect predation by invertebrate predatorsupon a range of other invertebrates including aphids(Homoptera: Aphididae) (Chen et al., 2000; Cuthbertsonet al., 2003), psyllids (Homoptera: Psyllidae) (Agustı́ et al.,2003b), Collembola (Agustı́ et al., 2003a), mosquitoes(Diptera: Culicidae) (Zaidi et al., 1999), moths (Lepidoptera:Noctuidae, Crambidae and Geometridae) (Agustı́ et al., 1999;Hoogendoorn & Heimpel, 2001; Sheppard et al., 2004),whiteflies (Homoptera: Aleyrodidae) (Agustı́ et al., 2000),earthworms (Annelida) and molluscs (Harper et al., 2005). Todate, few studies have gone on to use these techniques toanalyse predation on natural populations of prey in the field(Agustı́ et al., 2003a; Dodd et al., 2003; Kaspar et al., 2004;Harper et al., 2005).
Although the study of predation on specific targetprey is usually the goal, this is not always the case andimportant ecological questions can be asked using differentapproaches. Here, the primary goal was to evaluate TGGE asan approach that might be used to study predator responsesto prey diversity. It is known that, for generalist predators, adiverse diet can enhance predator fitness (Uetz et al., 1992;Toft & Wise, 1999; Oelbermann & Scheu, 2002) and that somearthropod predators actively seek to balance their diets(Greenstone, 1979; Mayntz et al., 2005). Therefore it might bepredicted that, if prey is sufficiently abundant, predatorsin the field would specifically aggregate to diversity andwhen they get there consume a diverse range of prey or,in an alternative scenario, be more selective, optimizingnutrient intake. Before undertaking such a study, we neededto develop methods that were primarily designed to examinediversity in the diet per se, rather than relying necessarilyupon identification of individual components within the diet(although that too is possible). Recently, gut content analysishas been made more rapid by multiplexing a broad range ofprey DNAs simultaneously using fluorescent labelledprimers and visualizing the prey-specific size fragments onan automated sequencer (Harper et al., 2005). This approachpermits rapid analysis of field samples to study the diversityof a specific range of target prey in the guts of predators.However, it cannot be used to detect uncharacterized orunexpected prey for which no specific primers have beendesigned. This may be addressed by using general or group-specific primers (Sutherland, 2000; Jarman et al., 2004), thencloning and sequencing. The process is slow and expensive,and relies completely upon the availability of matchingsequences on databases such as GenBank.
An alternative to these established methods is to usemolecular profiling technologies that have been usedextensively for the study of diversity amongst microbialcommunities. Profiling has been primarily by TGGE ordenaturing gradient gel electrophoresis (DGGE) (e.g.
Muyzer et al., 1993; Felske et al., 1998; Nakatsu et al., 2000;McCaig et al., 1999, 2001; Sheppard et al., 2005a). The aimof such studies was to examine bacterial diversity withinhabitats where diversity (rather than the identities of thecomponent species) was the primary criterion of interest.The bands generated within these DNA profiles aredescribed as operational taxonomic units (OTUs) (e.g.Torsvik et al., 1996) and can be counted to provide a grossmeasure of diversity within a microbial community. Eachband does not necessarily represent a distinct species. It isrecognized that the general primers used in such worksometimes amplify more than one band from some specieswhile cryptic bands (one superimposed on another) maymake separation incomplete. Nevertheless, overall, thenumber of bands amplified will be greater in samples froma more diverse than those from a less diverse community, asshown in the microbial studies of soils (e.g. McCaig et al.,1999, 2001; Sheppard et al., 2005a).
A TGGE-based approach allows sequences of the samelength to be separated where they vary by just a single basepair substitution (Riesner et al., 1991). This may be importantin predation studies when unique primer sites cannot befound to separate closely related species. Control DNA canbe run on the gels to allow species to be identified whenrequired. More importantly, it allows most species withinbroad groups of prey to be detected and separated, if notidentified to species; it may tell us, for example, that threedifferent aphids or two different earthworm species havebeen consumed even when the precise species are notknown. Thus TGGE can provide a method of analysingpredator responses to different levels of prey diversity in thefield, where ‘diversity’, rather than individual identity, is theprimary factor of interest. However, it can also be used toreveal predation on unexpected prey, or for prospecting.If TGGE, using general earthworm primers, revealed thatthree species were being regularly consumed, then effortscould be made to identify those prey by running earthwormDNA from identified species from the field site throughTGGE gels, to characterize the mobility of their species-diagnostic band or bands.
Despite these advantages, TGGE has several potentialdrawbacks. As this technique has never been used to studypredation before, our aim was to answer a series of criticalquestions. If general primers are used, would predator DNAdominate the PCR reaction and physically obscure preysequences on TGGE gels? Would cryptic and multiple bandsmake interpretation of TGGE fingerprints impossible?Would intraspecific haplotype diversity obscure species-level discrimination by TGGE? The following experimentswere designed to answer these questions.
Materials and methods
DNA extraction
DNA was extracted from invertebrate species (generallyn= 10), including earthworms (Annelida: Lumbricidae)(Allolobophora chlorotica (Savigny), Aporrectodea caliginosa(Savigny), Aporrectodea longa (Ude), Lumbricus rubellus(Hoffmeister), Lumbricus terrestris Linnaeus, Lumbricus
296 G.L. Harper et al.

castaneus (Savigny), Octolasion cyaneum (Savigny); aphids(Hemiptera: Aphididae) (Myzus persicae (Sulzer), Aphis fabaeScopoli, Brevicoryne brassicae Linnaeus, Metopolophium dirho-dum (Walker), Rhopalosiphum padi Linnaeus, Sitobion avenae(Fabricius)), blowfly larvae Calliphora vomitoria (Linnaeus)(Diptera: Calliphoridae), unfed carabids, Pterostichus mela-narius (Illiger) (Coleoptera: Carabidae), and beetles from thefeeding experiments. The same basic procedure was used toextract DNA from all specimens, including field-collectedbeetles. Prior to DNA extraction, the earthworms werestarved for 48 h to allow soil to pass through their gut. Beetleforeguts were removed and homogenized rather thanextracting DNA from the whole organism. Extraction wascarried out using the commercially available QIAamp1DNA Mini Kit (QIAGEN GMBH, Hilden, Germany),following the manufacturer’s instructions. The DNA wasresuspended in 75–200 ml of the elution buffer supplied, andstored at x20�C.
Earthworm and aphid specific primers
General invertebrate primers were employed tosequence-characterize part of the 12S rRNA gene of theearthworms, SR-J-14233 and Sr-N-14588 (Simon et al., 1994).PCR was conducted in a 25ml reaction, containing 50–100 ngof template DNA; 1U Taq polymerase (Gibco BRL, Paisley,UK); 0.5mMoles of each primer; 20mM (NH4)SO4; 75mM
Tris-HCl, pH8.8; 0.01% (v/v) Tween 20; 2mMMgCl2; 0.2mM
dNTPs (Abgene, Epsom, UK). The PCR reactions werecarried out on a GeneAmp 9700 PCR system (AppliedBiosystems, California, USA). The following conditions wereused: 1r94�C, 4min; 30r(94�C, 45 s; 45�C, 45 s; 72�C, 1min15 s); 1r72�C for 10min. The PCR amplified DNA wasthen cleaned up using a Turbo GeneClean kit (Q-BIOgene,Cambridge, UK), following the manufacturer’s instructions.Sequencing reactions were carried out using Big-DyeTerminators (PE-Applied Biosystems, California, USA) on aGeneAmp 9700 PCR system (Applied Biosystems, Califor-nia, USA) via the manufacturer’s instructions, then run outon a Perkin Elmer ABI3100 automated sequencer. The regionwas sequenced in both forward and reverse orientations.Group-specific primers for earthworms (12SNF AAACT-TAAAGATTTTGGCGGTGTCT and 12SNR GCTGCACTTT-GACCTGACGTAT) were designed from the 12SrRNA geneand synthesized (Sigma-Genosys, Gillingham, UK). Theseprimers proved to amplify earthworm sequences of �200 bp.The general aphid primers Aph149F (AATCAAAA-TAAATGTTGATA) and Aph344R (GGAACAGGWACAG-GATGAAC) designed by Harper et al. (2005) were used toseparate aphids.
PCR amplification with group-specific primers
In order to characterize a system for species separationwithin groups, PCR–TGGE was carried out on freshlyextracted DNA from the earthworm and aphid specieslisted above. Each 25ml reaction contained 50–100 ng oftemplate DNA, 1U Taq polymerase (Gibco BRL, Paisley,UK), 0.2mMoles of each primer, 20mM (NH4)SO4, 75mM
Tris-HCl, pH8.8, 0.01% (v/v) Tween 20, 2mMMgCl2 and0.2mM dNTPs (Abgene, Epsom, UK). The reaction wascarried out under the following conditions: 1r94�C, 4min;35r(94�C, 45 s; Ta, 45 s; 72
�C, 1min 15 s; 1r72�C for 10min(Ta: 57
�C for earthworms (12SNF/12SNR), 55�C for aphids
(149F/344R)). Each primer pair was also tested for crossreactivity against numerous other species of invertebrateincluding Annelida, Arachnida, Collembola, Coleoptera,Homoptera and Mollusca.
PCR amplification of the COI gene with ‘universal’invertebrate primers
PCR amplification of relatively small fragments of theCOI gene was performed using universal PCR primerstargeting conserved regions of the insect mitochondrialgenome. Four primer sets were initially tested, butthe combination C1-J-1859/C1-N-2191 (Simon et al., 1994)proved to be effective, and amplified a 332 bp fragment.
For the field-caught P. melanarius, species-specific PCRshad been performed previously to identify the presence ofaphid in the predators’ guts as part of the study by Harperet al. (2005). To prove the utility of the TGGE system field-caught predators were needed that had been shown, using aproven methodology, to have eaten aphids. Sixteen beetleswere selected for PCR with general invertebrate primers andsubsequent TGGE analysis.
PCR Amplification was performed with 25ml reactionvolumes consisting of 4 ml of extracted DNA, 2.5 ml 10rPCRbuffer (provided by the manufacturer), 10mM dNTPs(Boehringer Mannheim, Indianapolis, Indiana, USA), 5 UTaq polymerase (Promega, Madison, Wisconsin, USA),2.5mMMgCl2 and 50mM of each primer. Optimization ofPCR conditions was carried out in pilot experiments. Allreactions were carried out in a GeneAmp 9700 PCR system(Applied Biosystems, California, USA). The final parametersof the thermal cycle were: 95�C for 3min, then 40 cycles of94�C for 45 s, 47�C for 1min and 72�C for 1min 15 s, with afinal extension period at 72�C for 10min. 5 ml of PCRproducts were separated by electrophoresis in 1.5% agaroseand stained with 0.5 mgmlx1 ethidium bromide. Of the PCRamplification products derived using primers C1-J-1859/C1-N-2191, 20 ml or less were used in TGGE. These productswere selected as they were short enough (332 bp) to providean ecologically relevant detection period, whilst potentiallycontaining enough sequence variation for species separation.
A GC-clamp was used with the general invertebrate COIprimers and this improved the sensitivity/resolution of theTGGE analyses (Myers et al., 1985; Sheffield et al., 1989).However, they did not improve discrimination when usedwith the aphid and earthworm group-specific primers andtherefore results for the latter were obtained without GCclamps.
TGGE analysis
The DCode Universal Mutation System (Bio-Rad Inc.,California, USA) was used as described in the manufacturesinstruction manual. PCR samples were added to an equalvolume of loading buffer (0.5 g lx1 bromophenol blue,0.5 g lx1 xylene cyanol, 70% glycerol in dH2O) (Bio-Rad,California, USA) and loaded onto a 10% polyacrylamide gel.TGGE gels (16r10r0.1 cm) contained 5 ml polyacrylamide/BIS (37.5 : 1) in 1.25rTAE buffer (1rTAE: 40mM Trisacetate, 1mM EDTA, pH8.0), 6 M urea, 0.1% TEMED, and0.1 g lx1 of ammonium persulphate. Outside lanes were runas dye-only blanks (19 ml). Parallel gel electrophoresis wasperformed in TGGE tanks (Bio-Rad, California, USA) with7 litres of 1.25rTAE buffer. Changes were made to the
Detecting prey diversity within predators 297
temperature gradient and ramp rate following visualizationof perpendicular pilot gels and approximation of electro-phoretic mobilities of the partially melted DNA fragmentsfrom beetles and aphids. Numerous gels were producedbefore optimal separation of minimum temperature meltingdomains was obtained.
For the universal invertebrate primers, electrophoresisproceeded at a constant voltage of 50–65 V for approximately10 h on a temperature gradient increasing from 47�C to 54�Cat a ramp rate of 1�Chx1. The maximum temperature wasreached after 7 h but continued running of the gel enhancedseparation of partially melted DNA. For the aphid andearthworm-specific amplicons, electrophoresis proceeded ata constant voltage of 120V. For the aphid DNA, gels wererun for 5.5 h, on a temperature gradient increasing from 45�Cto 50.5�C, on a ramp rate of 1�Chx1. For the earthwormDNA, the gels were run for 4 h, over a temperature gradientof 56�C to 60�C, with a ramp rate of 1�Chx1. Visualizationof gels was achieved by UV transillumination followingelectrophoresis and gel staining for 20min with SYBR goldnucleic acid stain (1 : 10 000 dilution, Molecular Probes,Leiden, The Netherlands). GC-clamps enhanced the separa-tion of fragment amplified with the general primers.
Predators and field site
Carabid predators, P. melanarius, for both laboratory trialsand analysis of predation in the field, were collected fromcrops of winter wheat at Long Ashton Research Station,Bristol UK. Details of the trapping system are described inHarper et al. (2005). A subsample of carabids was used in thecurrent experiments to demonstrate the ability of TGGE todetect aphid DNA fragments known to be present, followingmultiplex PCR (Harper et al., 2005).
Feeding experiments
Three feeding experiments were conducted to test theability of TGGE to detect semi-digested prey in predators.Beetles used in the feeding experiments were maintained,individually, in a controlled environment room (16+1�C)with a 16 : 8 h L :D cycle, in transparent sealed perforatedplastic pots (9r6 cm) on 3 cm of sphagnum moss peat. Theywere fed up to two blowfly larvae, C. vomitoria, per week forone month to ensure a relatively constant nutrition status,then starved for two weeks and transferred to separatetriple-vented Petri dishes (9r1.5 cm) containing damp filterpaper. Twenty P. melanarius (10 of each sex) were killed(by freezing at x80�C) at the outset of the feeding trials toprovide unfed controls.
Carabid–mixed prey feeding experiment – detectionof multiple prey
The primary aim of this experiment, using universalinvertebrate primers (C1-J-1859/C1-N-2191, Simon et al.,1994), was to ensure that the PCR reaction was notdominated, or swamped, by DNA from the beetle predator.Ten P. melanarius, five of each sex, were fed, ad libitum, a 1 : 1homogenate (equal biomass of the two prey speciesmascerated together in an Eppendorf tube) of the aphidS. avenae and the blowfly C. vomitoria larvae for 2 h. Beetleswere killed by freezing at x80�C immediately after the
feeding period. DNA extraction, PCR and TGGE werecarried out as detailed above.
Carabid–aphid feeding experiment – post-feeding detectionperiod within predators
This experiment provided baseline data on the period oftime after feeding that aphid prey DNA could be detectedfrom within predator guts. Beetles were allowed to feed for2 h ad libitum on aphids, S. avenae, which had just been killedby freezing. Fourteen (seven male and seven female) beetleswere frozen immediately at x80�C after feeding. Theremaining beetles were moved to clean Petri dishes linedwith moist filter paper and 14 individuals (seven of each sex)were killed, by freezing, at various times after feeding. Timeperiods selected were based on previous studies of thedetectability of small multiple-copy prey DNA fragments ininvertebrate predator guts (Chen et al., 2000; Agustı́ et al.,2003a). Beetles were killed at 1, 3, 6, 12, 24, 48 and 72 h afterfeeding and stored at x80�C. All samples were tested byPCR–TGGE using the same general primers (C1-J-1859/C1-N-2191, Simon et al., 1994) as in the carabid–mixed preyfeeding experiment above.
Carabid–earthworm feeding experiment – post-feeding detectionperiod within predators
Beetles were fed on the earthworm Allolobophora chlor-otica. The samples were taken from the first 24 h ofthe feeding experiment described in detail in Harper et al.(2005). Briefly, starved beetles were fed ad libitum for 2 hon earthworms and only beetles observed feeding wereincluded in the experiment. Batches of beetles were killed byfreezing 0, 2, 4, 8, 16 and 24h after feeding on the wormsand analysed using the group-specific earthworm primers12SNF/12SNR.
Results
Carabid–mixed prey feeding experiment – detection ofmultiple prey
Analysis was carried out on total DNA from aphids,S. avenae, blowfly larvae, C. vomitoria, starved P. melanariusand P. melanarius fed with a mixture of aphid and maggot(n= 10) using the universal primer pair C1-J-1859/C1-N-2191. TGGE analysis of three replicates of each category ofinvertebrate are shown in fig. 1, and demonstrate that themelting domains on the amplified fragments were suffi-ciently different, in this simple system, to provide clearseparation on acrylamide gels. Most importantly, the profileswere not obscured by a preponderance of DNA amplifiedfrom the predator nor was PCR dominance a factor. Distinctand reproducible banding patterns are associated withS. avenae, C. vomitoria and P. melanarius, although in eachcase by a double band.
Carabid–aphid feeding experiment x post-feedingdetection period within predators
COI PCR products amplified from the beetles, againusing the general invertebrate primers C1-J-1859/C1-N-2191,were separated by TGGE. The detection of the S. avenaeand P. melanarius COI banding pattern in the same lanewas indicative of a positive result and was recorded as
298 G.L. Harper et al.

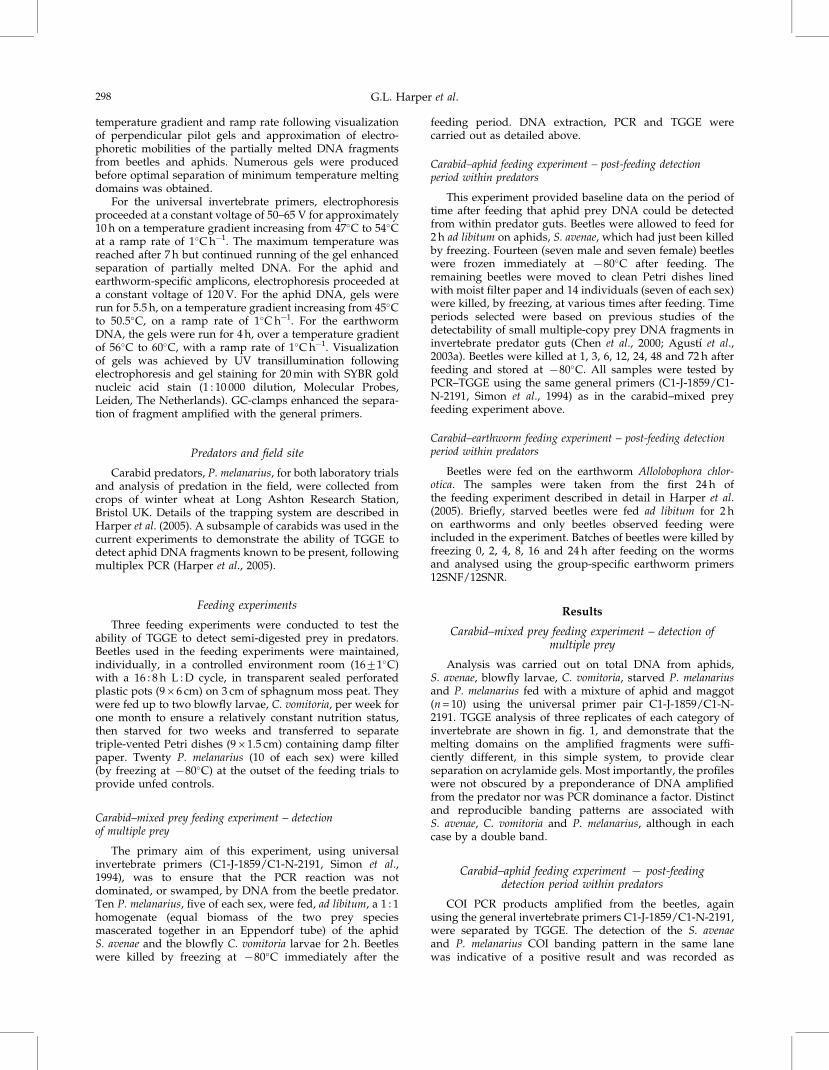
confirming beetle consumption of aphid. The number ofbeetles testing positive for aphid from a total of 14 at eachtime period is shown in fig. 2. Linear regression of thenumber testing positive (loge transformed) against time (h)showed a simple exponential decline in detectability, (logebeetle number = 2.663x0.054 hours R2 99.2%, P< 0.001).Aphid DNA was still detectable in 50% of the beetles 12 hafter feeding and 29% after 24 h.
Carabid–earthworm feeding experiment – post-feedingdetection period within predators
12S PCR products amplified from the beetles, using thegroup-specific earthworm primers 12SNF/12SNR, wereseparated by TGGE. Figure 3 shows that up to 8 h afteringestion the earthworm DNA was detectable by TGGEin 100% of predators and in some individuals up to 24 h.The single A. chlorotica bands amplified from the gutsof P. melanarius migrated in each case to one of two verydifferent points on the TGGE gel, probably becauseA. chlorotica in fact comprises two cryptic earthwormspecies/genotypes (see Discussion). Problems with earth-worm taxonomy are discussed in Harper et al. (2005).
Aphid consumption by field-caught carabids
Of the numerous field-collected beetles (from the studyby Harper et al., 2005), 16 were analysed by TGGE following
PCR using the general invertebrate primers C1-J-1859/C1-N-2191. These included 14 that had been shown to be positivefor aphid and two that were aphid-negative as controls. ThePCR products from these beetle gut samples were run on aTGGE gel with a negative control, an unfed beetle, and apositive control, aphid DNA (fig. 4). Pterostichus melanarius
1 2 3 4 5 6 7 8 9 10 11 12
Fig. 1. SYBR gold stained polyacrylamide gel of TGGE banding patterns of DNA extracted from Sitobion avenae (lanes 1–3), Calliphoravomitoria (lanes 4–6), Pterostichus melanarius (starved) (lanes 7–9) and P. melanarius killed immediately after eating a homogenate ofS. avenae and C. vomitoria (lanes 10–12). TGGE analysis was on COI mitochondrial gene fragments following PCR amplification withuniversal primers (C1-J-1859/C1-N-2191).
Time(h)
2.75
2.50
2.25
2.00
1.75
1.50
0 5 10 15 20 25
Lo
ge n
um
be
r o
f b
ee
tle
sp
os
itiv
e f
or
ap
hid
DN
A
Fig. 2. Loge numbers of Pterostichus melanarius predators thattested positive for aphid (Sitobion avenae) DNA between zeroand 24 h digestion (samples digested for 48 h and 72 h were allnegative). Detection was by PCR amplification of a 332 bpfragment of COI mtDNA using the general invertebrate primersC1-J-1859/C1-N-2191 (Simon et al., 1994).
Detecting prey diversity within predators 299

and aphids, S. avenae, gave distinct banding profilesanalogous to those recorded previously (fig. 1). Aphidpositives were recorded in 12 of the 14 specimens knownto have eaten aphid. No differences were detected between
the aphid banding patterns using these general invertebrateprimers. Known negatives gave negative results. The beetlesrepresented in lanes 6, 7, 9, 10, 11, 12, 13, 14, 15 and16 contained additional non-aphid bands representing
21 3 4 5 6 7 8 9 10 11 12 13 14 15 16 17 18
A
H
G
F
E
D
C
B
}
* * * * * * * ** * * *
Fig. 4. SYBR gold stained polyacrylamide gel of TGGE banding patterns of DNA extracted from Pterostichus melanarius collected fromthe field. TGGE analysis was on COI mitochondrial gene fragments following PCR amplification with universal primers (C1-J-1859/C1-N-2191). DNA bands from an unfed beetle and an aphid are in lanes 1 and 2 respectively. Lanes 3–16 are beetles previously shown bymultiplex-PCR to contain aphid, lanes 17–18 are beetles previously shown to be aphid negative. Lanes in which aphid positives wererecorded by TGGE are indicated ( *) on the figure. Non-aphid and non-beetle bands with the same melting domain (migration position)are put into groups (A–H). Band H is a cluster of bands.
2 h 4 h 8 h 16 h 24 h
1 2 3 4 B 1 2 3 4 −ve 1 2 3 4 −ve 1 2 3 4 −ve 1 2 3 4
Fig. 3. SYBR gold stained polyacrylamide gel of TGGE banding patterns of PCR-amplified earthworm DNA extracted from the guts ofPterostichus melanarius beetles killed at 2, 4, 8, 16 and 24 h post-feeding. Also shown are negative controls (xve) (unfed beetle) and a PCRnegative (B).
300 G.L. Harper et al.

non-aphid prey (or prey groups) consumed. Examination byeye allows these bands to be put into eight groups (A–H)representing genetically distinct prey categories. Band His a cluster of bands that appear together in several beetlesand probably represent a single prey category. Beetle 10(fig. 4) appears to contain the remains of six different non-aphid prey.
Refining the approach to separate species withina group (earthworms)
Whilst the PCR–TGGE approach using general inverte-brate primers could expose predation on disparate groupsof invertebrates, it could not always distinguish betweenindividual species within these groups. However, usingearthworm-specific primers, and appropriate temperaturegradient conditions, species-specific bands can be resolved(fig. 5) (similar results for aphid not shown). Among sevenearthworm species tested, using an c. 200 bp fragment ofthe 12S rRNA gene, species-specific differences were found(fig. 5). The addition of known and characterized positivecontrols in gel lanes adjacent to field samples would enablemost (but not all) species/haplotypes to be correctly scoredif necessary. Figure 5 shows that there was haplotypicvariation among the A. caliginosa (two haplotypic states,a and b) and the L. castaneus (three haplotypic states, c, dand e). When the 12S rRNA amplicons from these individ-uals were sequenced, it became clear that only slightsequence variations were necessary for marked changesin melting profiles. This is exemplified in A. caliginosa, wherea single base pair substitution has caused distinct scorablechanges in the melting profiles of the two haplotypes.GenBank accession numbers for the A. caliginosa andL. castaneus haplotypes are DQ157851–DQ157855.
Discussion
There are many positive aspects to this analysis. Theresults demonstrated, for the first time, that is it possible touse TGGE for the detection of multiple prey species in theguts of generalist predators using general or group-specific
primers. Previous work by Deagle et al. (2005), whoattempted to examine the dietary components in the gut ofa giant squid using DGGE, was plagued by PCR artefactsnot encountered here. By running known controls throughthe gels for prey species of interest (in this case aphids asa group, fig. 4), characteristic banding patterns can beestablished and predation on the species involved can berecorded. What is more it is also possible, as we have shown,to record and track predation on uncharacterized prey(fig. 4), something that is impossible using prey-specificprimers. Such work can provide the first indication that apreviously unrecognized prey was a significant componentof the predator’s diet. The unknown prey identified by thebands in fig. 4 could be tracked down, either by ream-plification from the TGGE bands, followed by sequencingand a BLAST search, or by prospecting for, and extractingDNA from, further prey species at the field site. Though verylimited in number, and included simply to illustrate thepotential of the system, the present results provide the firstfield data using this technology.
A primary application, for which this system wasdesigned, was to study predator responses to prey diversityin different habitats. In such an approach the parameter ofinterest is the diversity of prey in the guts of the predators asa separate measure from the component identities of speciesin the diet. It is not suggested that the components of the dietof generalist predators be ignored. However, the potential touse TGGE profiles to measure dietary diversity in a rangeof habitats is considerable and can be used to addressfundamental and applied ecological questions relating to theeffects of biodiversity on foodwebs. Bands can be clusteredinto OTUs and populations compared simply in terms ofdiversity. We suggest that such an approach is appropriatefor the study of diversity in the guts of predators, wherediversity may be of species but also of haplotype (fig. 5).
Most P. melanarius caught in the field had zero or oneidentifiable prey species/groups in its gut when analysedusing multiplex PCR (Harper et al., 2005). These were asubset of the prey species actually consumed, because themultiplex PCR only detected species for which primers wereincluded. The beetles in fig. 4 are a biased sample, in that
Aca Alo Lc Ach Lt Oc Lr .1a 2b 3b 4a 5a 6 7 8 9 10c 11d 12d 13e 14e 15 16 17 18 19 20 21 22 23 24 25 26 27 28
Fig. 5. SYBR gold stained polyacrylamide gel showing TGGE banding patterns for an earthworm-specific PCR amplicon, showingmitochondrial 12S rRNA variation among seven different earthworm species (Aporrectodea caliginosa (Aca), Aporrectodea longa (Alo),Lumbricus castanaus (Lc), Allolobophora chlorotica (Ach), Lumbricus terrestris (Lt), Octolasion cyaneum (Oc), Lumbricus rubellus (Lr)).Amplicons for the two species showing intraspecific variation (Aca and Lc) were sequenced, and haplotypes are represented as a to e insuperscript.
Detecting prey diversity within predators 301

14 were known to contain aphid in advance. Even so, thenumber of prey in each beetle was low, in most cases <3,making separation of bands or groups of bands as distinctOTUs relatively simple. Previous work using enzymeelectrophoresis attempted to create electrophoretic keys forall of the possible prey that might be consumed by apredator. This approach worked well where the predatorswere relatively stenophagous (reviewed in Symondson,2002) but was much less accurate where highly polyphagousspecies contained the remains of several different preysimultaneously that generated complex superimposedbanding patterns (Walrant & Loreau, 1995). The fact thatP. melanarius gut samples contained few prey does notprevent such confusion completely, but the dangers of sucherrors are reduced. For example, on a poorer gel than the oneillustrated (fig. 4) band E could become obscured within thecluster representing the predator, especially in individualswhere band E is faint as a result of a prolonged digestionperiod in the beetle gut. We also know that OTUs may notalways represent species. The aphids consumed by thebeetles in fig. 4 were not all the same species, but the generalprimer/denaturing gradient combination used did notseparate them. It is not possible to tell from the gel whetherDNA from one or several species of aphid were in the guts ofthe same individual predator at the same time withoutusing, in addition, aphid group-specific primers.
There are several possible causes of the multiplebands generated by TGGE. Other publications show similarmultiple banding profiles from single PCR amplicons (e.g.Foucher & Wilson, 2002), yet little attempt is ever made toexplain their significance. Extra bands may sometimes becaused by nuclear copies and these have indeed been foundpreviously in Sitobion spp. aphids (Sunnucks & Hales, 1996)(although in our own work resequencing failed to find any).In practical terms the number of bands produced does notmatter as long as they are consistent and the different speciescan be clearly distinguished.
Although TGGE has considerable potential for thedetection of haplotype variation amongst a prey population,this may pose a problem for conventional species identifica-tion and can be seen amongst a subset of the earthworms(A. caliginosa and L. castaneus) (fig. 5). The specimens used inthis study came from a number of geographically distantfield sites and some genetic variation might therefore beexpected. Although the 12S rRNA gene is more conservedthan, for example, the COI gene, in both earthworm speciesthe variation occurred within the less conserved loopdomains (Hickson et al., 1996). All TGGE-detectable haplo-types of these species at a given field site would need to becharacterized in advance. Very little molecular genetic workhas been applied to earthworms and species definitions areprobably outdated. For example, in Octolasion tyrtaeumi, thepresence of two size classes has recently been shown toclosely correlate with variation at the COII gene, indicatingthe existence of two genetically distinct lineages (Heethoffet al., 2004). It is thought that there could be several speciesaggregates and cryptic species even amongst the well-studied British earthworms (Simms & Gerard, 1985).Molecular detection of predation on different haplotypesoffers a new and potentially rich area for future research.Although it has been suggested for the study of haplotypeselection by owls feeding on small mammals (Taberlet &Fumagalli, 1996) it has never, to our knowledge, beenattempted for predation on invertebrates.
Before this work was conducted we did not knowwhether the use of general invertebrate primers would bepossible, given that it might be expected that the DNA fromthe gut tissue of the beetle would be in better condition thanthat of the semi-digested gut contents. This could have led tocomplete dominance of the PCR reaction by the beetle DNA.However, it is clear from figs 1 and 4 that this did nothappen and that prey bands are at least as strong as those forthe predator, often stronger. Thus it may be possible to usegeneral invertebrate primers, available to all, to studypredator responses to prey diversity in a range of differentinvertebrate food webs.
The earthworm amplicons remained clearly detectableeven after digestion within the gut of P. melanarius for 16 h(fig. 3). Even after 24 h, some samples could still beamplified. Similar results were obtained where the carabidshad consumed aphids, with a third of samples still positivefor aphid DNA after 24 h (fig. 1). These data comparefavourably with those obtained by Chen et al. (2000) who,using species-specific primers to amplify a smaller 198 bpfragment, could detect aphid DNA on agarose gels in 50% ofpredators 4–9 h after ingestion (depending upon predatorspecies). Comparable detection periods in other predator–prey systems have been both shorter and longer (reviewed inSymondson, 2002). Clearly, TGGE is capable of detectingprey remains for significant periods after prey ingestion andsuch detection periods need to be quantified where preciserates of predation on particular target prey species are beingmeasured (Symondson, 2002; Sheppard & Harwood, 2005).Interestingly, DNA from the earthworm A. chlorotica wasdetected as one of two alternate and very different bands onthe TGGE gel (fig. 3). Haplotypic variation is possible, butthere is strong evidence that A. chlorotica comprises twocryptic species (Satchell, 1967) and the observed separationinto two distinct genotypes would tend to support thisconjecture.
It is important to remember that predation is not the onlyway that DNA may have entered the gut of a generalistpredator (Sunderland, 1996). Secondary predation (Harwoodet al., 2001; Sheppard et al., 2005b) and scavenging (Calderet al., 2005; Foltan et al., 2005; Juen & Traugott, 2005) are alsopossible sources of error. There is little doubt that the bandsand groups of bands (A–H) in fig. 4 mainly represent preyspecies, but some could conceivably represent parasitoids orinvertebrate parasites on or in those prey items or even thepredators themselves.
To conclude, TGGE using group-specific primershas potential as a relatively simple method for analysingthe gut contents of predators without the need for priordesign of species-specific primers. This approach may beparticularly useful for examining predator responses toprey diversity and selection in the field of particularprey haplotypes. However, caution needs to be used inthe interpretation of TGGE gels and their limitationsrecognized.
Acknowledgements
These experiments were funded by the Biotechnologyand Biological Sciences Research Council (grant no. 72/D14569) as part of a larger project looking at the effectsof alternative prey and prey diversity on the ability ofpredators to control crop pests.
302 G.L. Harper et al.

References
Agustı́, N., de Vicente, C. & Gabarra, R. (1999) Development ofsequence characterized amplified region (SCAR) markersof Helicoverpa armigera: a new polymerase chain reaction-based technique for predator gut analysis.Molecular Ecology
8, 1467–1474.Agustı́, N., de Vicente, C. & Gabarra, R. (2000) Developing
SCAR markers to study predation on Trialeurodes vaporar-
iorum. Insect Molecular Biology 9, 263–268.Agustı́, N., Shayler, S.P., Harwood, J.D., Vaughan, I.P.,
Sunderland, K.D. & Symondson, W.O.C. (2003a) Collem-bola as alternative prey sustaining spiders in arableecosystems: prey detection within predators using mole-cular markers. Molecular Ecology 12, 3467–3475.
Agustı́, N., Unruh, T.R. & Welter, S.C. (2003b) DetectingCacopsylla pyricola (Hemiptera: Psyllidae) in predator gutsusing COI mitochondrial markers. Bulletin of Entomological
Research 93, 179–185.Calder, C.R., Harwood, J.D. & Symondson, W.O.C. (2005)
Detection of scavenged material in the guts of predatorsusing monoclonal antibodies: a significant source of errorin measurement of predation? Bulletin of Entomological
Research 95, 57–62.Chen, Y., Giles, K.L., Payton, M.E. & Greenstone, M.H. (2000)
Identifying key cereal aphid predators by molecular gutanalysis. Molecular Ecology 9, 1887–1898.
Cuthbertson, A.G.S., Fleming, C.C. & Murchie, A.K. (2003)Detection of Rhopalosiphum insertum (apple–grass aphid)predation by the predatory mite Anystis baccarum usingmolecular gut analysis. Agricultural and Forest Entomology 5,219–225.
Deagle, B.E., Jarman, S.N., Pemberton, D. & Gales, N.J. (2005)Genetic screening for prey in the gut contents froma giant squid (Architeuthis sp.). Journal of Heredity 96,417–423.
Dodd, C.S., Bruford, M.W., Symondson, W.O.C. & Glen, D.M.
(2003) Detection of slug DNA within carabid predatorsusing prey-specific PCR primers. pp. 13–20 in Dussart,G.B.J. (Ed.) Slug and snail pests: agricultural, veterinary and
environmental perspectives. Alton, UK, British Crop Protec-tion Council.
Felske, A., Akkermans, A.D.L. & de Vos, W.D. (1998)Quantification of 16S rRNAs in complex bacterial commu-nities by multiple competitive reverse transcription – PCRin temperature gradient gel electrophoresis fingerprints.Applied and Environmental Microbiology 64, 4581–4587.
Foltan, P., Sheppard, S.K., Konvicka, M. & Symondson,
W.O.C. (2005) The significance of facultative scavengingin generalist predator nutrition: detecting decayed preyin the guts of predators using PCR. Molecular Ecology 14,4147–4158.
Foucher, A. & Wilson, M. (2002) Development of a polymerasechain reaction-based denaturing gradient gel electrophor-esis technique to study nematode species biodiversity usingthe 18s rDNA gene. Molecular Ecology Notes 2, 45–48.
Greenstone, M.H. (1979) Spider behaviour optimises dietaryessential amino acid composition. Nature 282, 501–503.
Harper, G.L., King, R.A., Dodd, C.S., Harwood, J.D., Glen,
D.M., Bruford, M.W. & Symondson, W.O.C. (2005) Rapidscreening of invertebrate predators for multiple prey DNAtargets. Molecular Ecology 14, 819–827.
Harwood, J.D., Phillips, S.W., Sunderland, K.D. & Symond-
son, W.O.C. (2001) Secondary predation: quantification of
food chain errors in an aphid–spider–carabid system usingmonoclonal antibodies. Molecular Ecology 10, 2049–2057.
Heethoff, M., Etzold, K. & Scheu, S. (2004) MitochondrialCOII sequences indicate that the parthenogenic earth-worm Octolasion tyrtaeum (Savigny 1926) constitutes of twolineages differing in body size and genotype. Pedobiologia48, 9–13.
Hickson, R.E., Simon, C., Copper, A., Spicer, G.S., Sullivan, J.
& Penny, D. (1996) Conserved sequence motifs, alignment,and secondary structure for the third domain of animal 12SrRNA. Molecular Biology and Evolution 13, 150–169.
Hoogendoorn, M. & Heimpel, G.E. (2001) PCR-based gutcontent analysis of insect predators: using ribosomal ITS-1fragments from prey to estimate predation frequency.Molecular Ecology 10, 2059–2067.
Jarman, S.N., Deagle, B.E. & Gales, N.J. (2004) Group-specificPCR for DNA-based analysis of species diversity andidentity in dietary samples.Molecular Ecology 13, 1313–1322.
Juen, A. & Traugott, M. (2005) Detecting predation andscavenging by DNA gut content analysis: a case studyusing a soil insect predator–prey system. Oecologia 142,344–352.
Kaspar, M.L., Reeson, A.F., Cooper, S.J.B., Perry, K.D. &
Austin, A.D. (2004) Assessment of prey overlap between anative (Polistes humilis) and an introduced (Vespula germa-
nica) social wasp using morphology and phylogeneticanalysis of 16S rDNA. Molecular Ecology 13, 2037–2048.
Mayntz, D., Raubenheimer, D., Salomon, M., Toft, S. &
Simpson, S.J. (2005) Nutrient-specific foraging in inverte-brate predators. Nature 307, 111–113.
McCaig, A.E., Glover, L.A. & Prosser, J.I. (1999) Molecularanalysis of bacterial community structure and diversity inunimproved and improved upland grass pastures. Appliedand Environmental Microbiology 65, 1721–1730.
McCaig, A.E., Glover, L.A. & Prosser, J.I. (2001) Numericalanalysis of grassland bacterial community structure underdifferent land management regimes by using 16S ribosomalDNA sequence data and denaturing gradient gel electro-phoresis banding patterns. Applied and Environmental
Microbiology 67, 4554–4559.Muyzer, G., De Waal, E.C. & Uitterlinden, A.G. (1993) Profiling
of complex microbial populations by denaturing gradientgel electrophoresis analysis of polymerase chain reaction-amplified genes coding for 16S rRNA. Applied and Environ-
mental Microbiology 59, 695–700.Myers, R.M., Fischer, S.G., Lerman, L.S. & Mantiatis, T. (1985)
Nearly all single base substitutions in DNA fragmentsjoined to a gc-clamp can be detected by denaturing gradientgel electrophoresis. Nucleic Acids Research 13, 3131–3145.
Nakatsu, C.H., Torsvik, V. & Ovreas, L. (2000) Soil communityanalysis using DGGE of 16S rDNA polymerase chainreaction products. Soil Science Society of America Journal 64,1382–1388.
Oelbermann, K. & Scheu, S. (2002) Effects of prey type andmixed diets on survival, growth and development of ageneralist predator, Pardosa lugubris. Basic and AppliedEcology 3, 285–291.
Riesner, D., Henco, K. & Steger, G. (1991) Temperaturegradient gel electrophoresis: a method for the analysis ofconformational transitions and mutations in nucleic acidsand proteins. Advances in Electrophoresis 4, 169–250.
Satchell, J.E. (1967) Colour dimorphism in Allolobophora
chlorotica Sav. (Lumbricidae). Journal of Animal Ecology 36,623–630.
Detecting prey diversity within predators 303

Sheffield, V.C., Cox, D.R., Lerman, L.S. & Myers, R.M. (1989)Attachment of a 40-base pair G+C-rich sequence (GCclamp) to genomic DNA fragments by the polymerasechain reaction results in improved detection of single basepair changes. Proceedings of the National Academy of Sciences,
USA 86, 232–236.Sheppard, S.K. & Harwood, J.D. (2005) Advances in molecular
ecology: tracking trophic links through predator–prey foodwebs. Functional Ecology 19, 751–762.
Sheppard, S.K., Henneman, M.L., Memmott, J. & Symondson,
W.O.C. (2004) Infiltration of alien predators into inverte-brate food-webs in Hawaii: a molecular approach. Mole-cular Ecology 13, 2077–2088.
Sheppard, S.K., McCarthy, A.J., Loughnane, J.P., Gray, N.D.,
Head, I.M. & Lloyd, D. (2005a) The impact of sludgeamendment on methanogen community structure in anupland soil. Applied Soil Ecology 28, 147–162.
Sheppard, S.K., Bell, J., Sunderland, K.D., Fenlon, J., Skervin,
D. & Symondson, W.O.C (2005b) Detection of secondarypredation by PCR analysis of the gut contents of inverte-brate generalist predators. Molecular Ecology 14, 4461–4468.
Simms, R.W. & Gerard, B.M. (1985) Earthworms. London, E.J.Brill/W. Backhuys.
Simon, C., Frati, F., Beckenbach, A., Crespi, B., Liu, H. & Flook,
P. (1994) Evolution, weighting, and phylogenetic utilityof mitochondrial gene sequences and a compilation ofconserved polymerase chain reaction primers. Annals of theEntomological Society of America 87, 651–701.
Sunderland, K.D. (1996) Progress in quantifying predationusing antibody techniques. pp. 219–455 in Symondson,W.O.C. & Liddell, J.E. (Eds) The ecology of agricultural pests –
biochemical approaches. London, Chapman & Hall.Sunnucks, P. & Hales, D.F. (1996) Numerous transposed
sequences of mitochondrial cytochrome oxidase I-II in
aphis of the genus Sitobion (Hemiptera: Aphididae).Molecular Biology and Evolution 13, 510–524.
Sutherland, R.M. (2000) Molecular analysis of avian diets. PhDThesis, University of Oxford.
Symondson, W.O.C. (2002) Molecular identification of prey inpredator diets. Molecular Ecology 11, 627–641.
Taberlet, P. & Fumagalli, L. (1996) Owl pellets as a sourcefor genetic studies of small mammals. Molecular Ecology 5,301–305.
Toft, S. & Wise, D.H. (1999) Growth, development and survivalof a generalist predator fed single- and mixed-species dietsof different quality. Oecologia 119, 191–197.
Torsvik, V., Sorheim, R. & Goksoyr, J. (1996) Total bacterialdiversity in soil and sediment communities: a review.Journal of Industrial Microbiology 17, 170–178.
Uetz, G.W., Bischoff, J. & Raver, J. (1992) Survivorship ofwolf spiders (Lycosidae) reared on different diets. Journal ofArachnology 20, 207–211.
Walrant, A. & Loreau, M. (1995) Comparison of iso-enzymeelectrophoresis and gut content examination for determin-ing the natural diets of the groundbeetle species Abax
ater (Coleoptera: Carabidae). Entomologia Generalis 19,253–259.
Zaidi, R.H., Jaal, Z., Hawkes, N.J., Hemingway, J. &
Symondson, W.O.C. (1999) Can the detection of preyDNA amongst the gut contents of invertebrate predatorsprovide a new technique for quantifying predation in thefield? Molecular Ecology 8, 2081–2088.
(Accepted 1 February 2006)� CAB International, 2006
304 G.L. Harper et al.