Evaluation of production control strategies for negligible-setup, multi-product, serial lines with...
28
Evaluation of production control strategies for negligible-setup, multi-product, serial lines with consideration for robustness Oladipupo A. Olaitan and John Geraghty Enterprise Process Research Centre, School of Mechanical and Manufacturing Engineering, Dublin City University, Dublin, Ireland Abstract Purpose – The aims of this paper is to investigate simulation-based optimisation and stochastic dominance testing while employing kanban-like production control strategies (PCS) operating dedicated and, where applicable, shared kanban card allocation policies in a multi-product system with negligible set-up times and with consideration for robustness to uncertainty. Design/methodology/approach – Discrete event simulation and a genetic algorithm were utilised to optimise the control parameters for dedicated kanban control strategy (KCS), CONWIP and base stock control strategy (BSCS), extended kanban control strategy (EKCS) and generalised kanban control strategy (GKCS) as well as the shared versions of EKCS and GKCS. All-pairwise comparisons and a ranking and selection technique were employed to compare the performances of the strategies and select the best strategy without consideration of robustness to uncertainty. A latin hypercube sampling experimental design and stochastic dominance testing were utilised to determine the preferred strategy when robustness to uncertainty is considered. Findings – The findings of this work show that shared GKCS outperforms other strategies when robustness is not considered. However, when robustness of the strategies to uncertainty in the production environment is considered, the results of our research show that the dedicated EKCS is preferred. The effect of system bottleneck location on the inventory accumulation behaviour of different strategies is reported and this was also observed to have a relationship to the nature of a PCS’s kanban information transmission. Practical implications – The findings of this study are directly relevant to industry where increasing market pressures for product diversity require operating multi-product production lines with negligible set-up times. The optimization and robustness test approaches employed in this work can be extended to the analysis of more complicated system configurations and higher number of product types. Originality/value – This work involves further investigation into the performance of multi-product kanban-like PCS by examining their robustness to common sources of uncertainties after they have been initially optimized for base scenarios. The results of the robustness tests also provide new insights into how dedicated kanban card allocation policies might offer higher flexibility and robustness over shared policies under conditions of uncertainty. Keywords Kanban-like production control strategies, Shared and dedicated kanban allocation policies, Multi-product systems, Negligible set-up times, Optimization, Robustness, Stochastic dominance, Kanban, Optimization techniques Paper type Research paper The current issue and full text archive of this journal is available at www.emeraldinsight.com/1741-038X.htm This paper is part of the Special Issue on Advances in Production Line Systems guest edited by Dr Sabry Shaaban & Dr Sarah Hudson. Received March 2012 Revised July 2012 Accepted September 2012 Journal of Manufacturing Technology Management Vol. 24 No. 3, 2013 pp. 331-357 q Emerald Group Publishing Limited 1741-038X DOI 10.1108/17410381311318864 Production control strategies 331
Transcript of Evaluation of production control strategies for negligible-setup, multi-product, serial lines with...
Evaluation of production controlstrategies for negligible-setup,multi-product, serial lines withconsideration for robustness
Oladipupo A. Olaitan and John GeraghtyEnterprise Process Research Centre,
School of Mechanical and Manufacturing Engineering, Dublin City University,Dublin, Ireland
Abstract
Purpose – The aims of this paper is to investigate simulation-based optimisation and stochasticdominance testing while employing kanban-like production control strategies (PCS) operatingdedicated and, where applicable, shared kanban card allocation policies in a multi-product system withnegligible set-up times and with consideration for robustness to uncertainty.
Design/methodology/approach – Discrete event simulation and a genetic algorithm were utilisedto optimise the control parameters for dedicated kanban control strategy (KCS), CONWIP and basestock control strategy (BSCS), extended kanban control strategy (EKCS) and generalised kanbancontrol strategy (GKCS) as well as the shared versions of EKCS and GKCS. All-pairwise comparisonsand a ranking and selection technique were employed to compare the performances of the strategiesand select the best strategy without consideration of robustness to uncertainty. A latin hypercubesampling experimental design and stochastic dominance testing were utilised to determine thepreferred strategy when robustness to uncertainty is considered.
Findings – The findings of this work show that shared GKCS outperforms other strategies whenrobustness is not considered. However, when robustness of the strategies to uncertainty in theproduction environment is considered, the results of our research show that the dedicated EKCS ispreferred. The effect of system bottleneck location on the inventory accumulation behaviour ofdifferent strategies is reported and this was also observed to have a relationship to the nature of aPCS’s kanban information transmission.
Practical implications – The findings of this study are directly relevant to industry whereincreasing market pressures for product diversity require operating multi-product production lineswith negligible set-up times. The optimization and robustness test approaches employed in this workcan be extended to the analysis of more complicated system configurations and higher number ofproduct types.
Originality/value – This work involves further investigation into the performance of multi-productkanban-like PCS by examining their robustness to common sources of uncertainties after they havebeen initially optimized for base scenarios. The results of the robustness tests also provide newinsights into how dedicated kanban card allocation policies might offer higher flexibility androbustness over shared policies under conditions of uncertainty.
Keywords Kanban-like production control strategies, Shared and dedicated kanban allocation policies,Multi-product systems, Negligible set-up times, Optimization, Robustness, Stochastic dominance,Kanban, Optimization techniques
Paper type Research paper
The current issue and full text archive of this journal is available at
www.emeraldinsight.com/1741-038X.htm
This paper is part of the Special Issue on Advances in Production Line Systems guest edited byDr Sabry Shaaban & Dr Sarah Hudson.
Received March 2012Revised July 2012
Accepted September 2012
Journal of Manufacturing TechnologyManagement
Vol. 24 No. 3, 2013pp. 331-357
q Emerald Group Publishing Limited1741-038X
DOI 10.1108/17410381311318864
Productioncontrol strategies
331
1. IntroductionSeveral studies, such as Geraghty and Heavey (2005), Liberopoulos and Dallery (2000),Marek et al. (2001) and Bonvik et al. (1997), have been conducted on lean production andinventory control strategies in single product manufacturing environments.Multi-product manufacturing environments, on the other hand, are usually morecomplicated to study. However, a study by Baynat et al. (2002) proposes two approachesfor the control of multi-product, pull-based, production systems; shared and dedicatedKanban allocation policies. In a system operating a shared Kanban allocation policyproduct types share a common pool of Kanban cards, whereas in a system operating adedicated Kanban allocation policy each product type is assigned a set of Kanban cards.These two Kanban allocation policies have been studied in both serial lines contexts(Deokar, 2004) and assembly line configurations (Khojasteh-Ghamari, 2009). Section 2 ofthis paper provides a more detailed literature review of prior research in this domain.
In this study, the system under consideration is a multi-product, serial line,processing two product types, for which the performance of the dedicated and sharedallocation policies of the GKCS and EKCS strategies as well as the dedicated allocationpolicies for CONWIP, BSCS and KCS strategies are compared. Baynat et al. (2002) refersto these strategies as Kanban-like control strategies and are, henceforth, similarlyreferenced in this paper. The negligible-setup, multi-product, serial line assumed for thisstudy is based on the type of reconfigurable systems with rapid changeover describedby Marek et al. (2001). Such reconfigurable systems allow swift changeover between theprocessing of different product types and are a feature of many modern, complex,flexible manufacturing environments.
The numerous parameters involved in the design and optimisation of multi-productsystems make them more complex to study and as a result a simulation modellingapproach was used in conducting the study. Simulation-based optimisation using agenetic algorithm was used to determine the optimal Kanban and/or base stocksettings for each strategy studied. Each of the strategies was initially optimised byminimising the level of work-in-process (WIP) inventory required to achieve a targetservice level (SL) of 95 per cent for each product type, simultaneously. The comparisonwas then based on the level of WIP used by each strategy to achieve the target SL. Thedetails of the system studied, the model development and the optimisation approachare provided in Section 3.
In Section 4 we explore the selection of a pull-based production control strategy fornegligible-setup, multi-product, serial lines without consideration for risk in theestimation of the of the sources of instability in a manufacturing system. Findings instudies, such as Boonlertvanich (2005), Bonvik et al. (1997), Duri et al. (2000), Geraghtyand Heavey (2004), Gupta et al. (1999) and Koulouriotis et al. (2010), have shown thatthe level of instability in manufacturing systems has a significant impact on theperformance of pull production control strategies. In some cases, a high level of systeminstability can render some pull production control strategies inapplicable.
Only a few studies on the shared and dedicated Kanban allocation policies haveinvestigated how they will perform under varying levels of instability that mightoriginate from variability in demand, processing time, setup time and/or breakdown andrepair times. Deokar (2004) studied systems under varying levels of processing timevariability and different number of production stages (3 and 6 stages) in a multi-productmanufacturing system. Baynat et al. (2002) have already shown that the shared Kanban
JMTM24,3
332
policy cannot be operated with a Kanban control strategy (KCS) and this was also shownin Olaitan (2011) to extend to the CONWIP and BSCS strategies.
Industrial practitioners require solutions that are not only optimal but also robust tochanges in the environment. Therefore, the robustness of the optimised parameters foreach of the strategies and their different allocations policies is also investigated here inSection 5. The robustness tests are conducted in the presence of conditions such aschanging demand rates, frequency of breakdown and duration of machine repair tounderstand the sensitivity of the strategies to these instabilities. Gaury and Kleijnen(1998) and Kleijnen and Gaury (2003) conducted similar robustness tests of productionmanagement systems in single product manufacturing systems. The outcome of therobustness test gives insight into the suitability of each of the strategies and cardallocation policies under different conditions of instability. This can serve as a basis forcombining different card allocation policies in a single system in a manner similar tothe horizontally integrated hybrid production system used for combining push andpull production control strategies in studies such as Cochran and Kaylani (2008).
2. Literature reviewA primary objective of any organisation is to meet customer demands in the mostprofitable means achievable. Profitability depends on many factors surrounding theorganisation such as the purchasing, marketing, supply chain management andproduction management programmes. In this study, the focus is on the production andinventory control aspects of managing manufacturing systems.
2.1 Production control strategiesA production and inventory control strategy that aims to control the WIP of a systemwhile still maintaining a satisfactory response to customer demands is the Kanbancontrol strategy (KCS). KCS was first applied in Toyota’s assembly lines as an integralpart of an overall management strategy called lean or just in time ( JIT) manufacturing.Other constituents of the JIT system, according to Spearman et al. (1990), are totalquality control, set-up time reduction, and worker participation. These are identified assources of instability to a system that will need to be reviewed before the strategy canbe fully applied to a system. Toyota’s success in meeting customer demands with a lowlevel of inventory attracted so much attention that the strategy became highly studied,resulting in the development of variations of the original KCS through works such asthose of Spearman et al. (1990), Dallery and Liberopoulos (2000) and Boonlertvanich(2005). These variants, henceforth referred to as Kanban-like control systems, stillretain the original pull ideology of traditional KCS.
The availability of several variants of these Kanban-like strategies now poses achallenge to prospective users on which one would be the most suitable strategy for theirmanufacturing environment. Level of instability of system, loading factor, number ofproducts, nature of production and management style are some of the factors that havebeen found to be of importance in determining which strategy is best suited to aproduction setting. Simulation modelling approaches, such as in Spearman et al. (1990),Bonvik et al. (1997), Geraghty and Heavey (2005) and Hochreiter (1999) and someanalytical techniques have been applied in conducting studies to determine thesuitability of available strategies under different conditions. Markov time chainanalysis, as in Sivakumar and Shahabudeen (2008), multiclass queuing network
Productioncontrol strategies
333
approximation technique, for example Satyam and Krishnamurthy (2008), Baynat(2001) and Duri et al. (1995), and state space representation approach, as in the case ofBoonlertvanich (2005) and Karaesmen and Dallery (2000), are some of the mostcommonly used analytical methods of study. But according to Gupta et al. (1999) as wellas Kochel and Nielander (2002), simulation is the preferred approach because of itsability to handle the dynamics that occur in real manufacturing systems, whereanalytical methods have to make unrealistic assumptions to avoid intractability.
KCS uses signal cards, known as Kanbans, to authorise the processing of parts ateach stage of a manufacturing facility in order to control the level of inventory in thesystem. Some of the variations that appear in literature are Kanban, base stock,CONWIP (Spearman et al., 1990), extended Kanban control strategy (Dallery andLiberopoulos, 2000), generalised Kanban control strategy (Buzacott, 1989; Zipkin, 1989),hybrid CONWIP/Kanban (Bonvik and Gershwin, 1996; Bonvik et al., 1997), extendedCONWIP/Kanban (Boonlertvanich, 2005). All of these strategies except the last two areconsidered in this study. Another class of KCS found in the literature are the flexible oradaptive KCS (Gupta et al., 1999; Sivakumar and Shahabudeen, 2008) that propose realtime adjustment of the number of Kanbans in response to demand fluctuation andinventory build up.
Bonvik et al. (1997) showed that, while other Kanban-like PCS outperform KCS in singleproduct environments, the performance of KCS, in terms of minimising WIP to achieve atargeted service level, could be marginally improved by implementing a minimal-blockingpolicy. This involves providing a production stage with an input buffer in addition to theoutput buffer, thereby, allowing inventory to move to the next stage if it acquires theKanban card even though the machine at that stage may not be idle. This reduces blockingin Kanban-like strategies and the advantage in terms of reducing inventory appears to be adirect result of lower Kanban allocations, especially at the initial stage/s of the line, beingrequired to buffer a stage against blocking owing to unavailability of a downstream stage.From a practical viewpoint, a minimal-blocking policy may be the optimal KCS strategywhen there are significant transport times between workstations. Given this, in this paperall strategies are modelled as minimal-blocking strategies, with the exception of CONWIPand base stock, since production at a stage in both these strategies is not subject to localWIP control (i.e. no Kanban cards).
According to Baynat et al. (2002), Kanban-like control strategies generally have threeitems that are transferred within the system. Parts move downstream as they aretransformed from raw materials into finished goods. Demand information is propagatedupstream from the finished goods buffer, to which they arrive. Kanbans either moveattached to parts or demands and in some cases move alone creating a closed loop withina stage depending on the control strategy involved. What differentiates, respective,strategies can be partly attributed to the way in which demand and Kanban informationare transferred within the system. Two levels of information flow found in thesestrategies are described by Bonvik and Gershwin (1996) as global and local informationflows. At the global level, information is transmitted from the demand process to aparticular machine, without having to go through intermediate machines. Whereas,at the local level, information is circulated between a machine and an adjacent buffer.Kanban-like control strategies exhibit either a combination of these flow types or a strictadherence to a type. Another factor that differentiates strategies is the number ofparameters per stage; CONWIP for example requires that only the total number of WIP
JMTM24,3
334
allowed in the system be set while the KCS requires that the number of Kanbans perstage must be determined. The literature contains numerous papers describing theseKanban-like control strategies both in single (Baynat et al., 2002; Bonvik and Gershwin,1996; Liberopoulos and Dallery, 2000), and multi-product environments (Duri et al., 1995;Olaitan, 2011; Baynat et al., 2002).
2.2 Kanban control strategies in multi-product environmentsAssumptions on the significance of machine changeover time between processing ofdifferent products, and the need for production scheduling, have an impact on howmulti-product studies are conducted. This study considers a serial, multi-productprocessing line with insignificant changeover time between products, similar to thesystems Duri et al. (1995) studied using a multiclass queuing theory approach.An example of such systems are reconfigurable systems described in Marek et al.(2001), where parts are not batch processed but processed on a first come first served(FCFS) basis as they arrive because there is only a negligible changeover time inswitching between products. Marek et al. (2001) comment that this modellingassumption is realistic as production line designers are now examining the advantageof agile tooling, fixtures and material handling that makes it possible to produce anypart, from a family of parts, on the same set of machines.
On the other hand, systems that require considerable amount of changeover time,according to Duri et al. (1995), pose a higher level of complexity in analysis because of theextra need to determine the production sequence that minimises the setup cost. However,some approaches have been used to simplify the modelling of such systems. For instance,Krieg and Kuhn (2004) assume that products are batch processed such that at anyinstance of processing a product type, the same type continues to be processed until itsKanban cards are exhausted. Another approach in the same study by Krieg and Kuhn(2004) is the decomposition method that analyses the system as a single product system,treats the system as unavailable during the processing of other product types andcombines the results to approximate the overall system performance measures.
Applying Kanban-like strategies in multi-product environments poses the questionof how the Kanbans are allocated between the different product types. Parts anddemands are of a given part type and they remain the same throughout the system,but Kanbans can either be designed to be dedicated to a given part type and remain soor they can be designed to be shared by the part types and used interchangeably withinthe system as described in Baynat et al. (2002). This gives rise to the two policies ofallocating Kanbans known as the dedicated and shared Kanban allocation policies inmulti-product environments. Khojasteh-Ghamari (2009) studied these policies in aCONWIP controlled assembly line and reports differences in their performances.Deokar (2004) observed that the shared policies always outperform the dedicated typesin the serial and assembly line configurations studied.
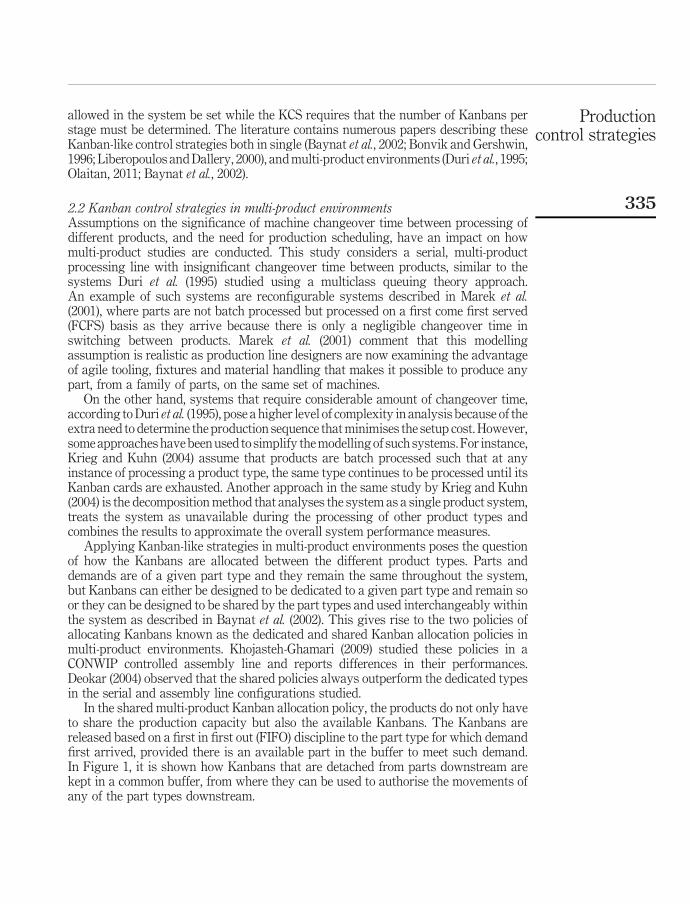
In the shared multi-product Kanban allocation policy, the products do not only haveto share the production capacity but also the available Kanbans. The Kanbans arereleased based on a first in first out (FIFO) discipline to the part type for which demandfirst arrived, provided there is an available part in the buffer to meet such demand.In Figure 1, it is shown how Kanbans that are detached from parts downstream arekept in a common buffer, from where they can be used to authorise the movements ofany of the part types downstream.
Productioncontrol strategies
335
However, Baynat et al. (2002) reported that some Kanban-like control strategies are notable to operate a shared policy owing to the tight level of coupling that exists in thesestrategies in the movement of demands, Kanbans and parts. Demands are always of aparticular part type, therefore the Kanbans too will end up being used by the same parttype from which the demand information was generated and the Kanban detached. KCSwas specifically identified in the study by Baynat et al. (2002) and in the simulation studyby Olaitan (2011) this same rule is reported to be applicable to CONWIP and BSCSbecause they also have tightly coupled Kanban and demand information transmissionor no Kanban transmission at all in the case of BSCS.
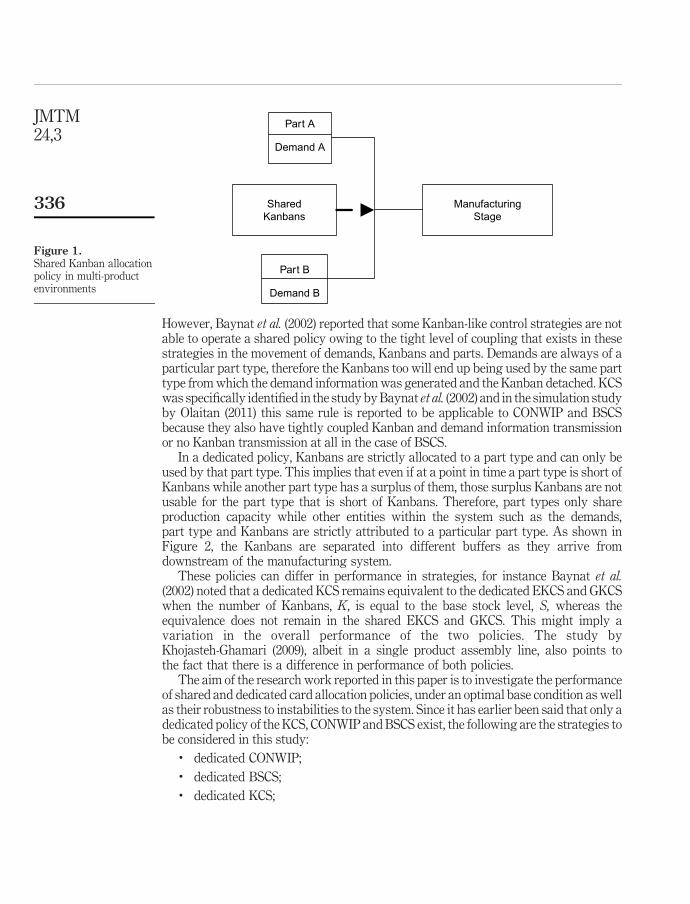
In a dedicated policy, Kanbans are strictly allocated to a part type and can only beused by that part type. This implies that even if at a point in time a part type is short ofKanbans while another part type has a surplus of them, those surplus Kanbans are notusable for the part type that is short of Kanbans. Therefore, part types only shareproduction capacity while other entities within the system such as the demands,part type and Kanbans are strictly attributed to a particular part type. As shown inFigure 2, the Kanbans are separated into different buffers as they arrive fromdownstream of the manufacturing system.
These policies can differ in performance in strategies, for instance Baynat et al.(2002) noted that a dedicated KCS remains equivalent to the dedicated EKCS and GKCSwhen the number of Kanbans, K, is equal to the base stock level, S, whereas theequivalence does not remain in the shared EKCS and GKCS. This might imply avariation in the overall performance of the two policies. The study byKhojasteh-Ghamari (2009), albeit in a single product assembly line, also points tothe fact that there is a difference in performance of both policies.
The aim of the research work reported in this paper is to investigate the performanceof shared and dedicated card allocation policies, under an optimal base condition as wellas their robustness to instabilities to the system. Since it has earlier been said that only adedicated policy of the KCS, CONWIP and BSCS exist, the following are the strategies tobe considered in this study:
. dedicated CONWIP;
. dedicated BSCS;
. dedicated KCS;
Figure 1.Shared Kanban allocationpolicy in multi-productenvironments
Demand A
Part A
Demand B
Part B
ManufacturingStage
SharedKanbans
JMTM24,3
336
. dedicated and shared GKCS; and
. dedicated and shared EKCS.
The analytical studies by Baynat et al. (2002) and Deokar (2004) provide a good sourceof reference for the last three set of policies, and the approach used in the samestudies are adopted in carrying out the multi-product analysis of the dedicatedCONWIP and BSCS.
2.3 System optimisationKoulouriotis et al. (2010) underscore the need to set the control parameter of eachstrategy to their best values before attempting to carry out performance comparisonsbecause the performance of a system operating under a certain pull type control strategyis significantly dependent on the parameter selection. The optimal Kanban number forKCS, as defined by Khojasteh-Ghamari (2009), is the minimum number of cardsallocated to the system that achieve the maximum possible throughput. Beyond thislevel, any card added only raises the level of WIP without any significant improvementin throughput. For the purpose of this study, in which demand is not infinite, the optimalnumber of Kanbans and base stock levels will be those that achieve the target servicelevel while minimising average WIP.
Simulation and analytical approaches have been mostly used in optimisingKanban-like strategies. Analytical methods used comprise of Markov time chain,Multiclass queuing network and mathematical programming. The simulationapproaches have either been to use card reduction heuristics or simulation-basedoptimisation. In the card reduction heuristics used by Marek et al. (2001), Monden andSpearman’s formulae were initially applied to determine the number of Kanbans andCONWIP cards, respectively, followed by a card reduction heuristic. Spearman et al.(1990) suggest the use of a system throughput equation to determine the number of cardsfor CONWIP systems. These formulae, however, require predetermined values ofthroughput and lead time. The card reduction heuristics involve a sequential cardreduction at the station that gives the highest level of utilisation during a simulation runand requires running a large number of simulations which makes it time consuming.
Figure 2.A dedicated Kanban
allocation policy inmulti-productenvironments
DedicatedKanbans
Demand B
Part B
ManufacturingStage
DedicatedKanbans
Demand A
Part A
Productioncontrol strategies
337

According to Koulouriotis et al. (2010), simulation-based optimisation is rapidlybecoming one of the most wide spread tools in the field of complex systems design. Thereport further quotes the definition of Bowden and Hall (1998), that simulationoptimisation is:
[. . .] the practice of linking an optimisation method with a simulation model to determineappropriate settings of certain input parameters so as to maximise the performance of thesimulated system.
Genetic algorithms, as in the case of Sivakumar and Shahabudeen (2008), Kochel andNielander (2002), Bowden et al. (1996), Cochran and Kaylani (2008) and Szczerbicka et al.(1998), Simulated Annealing, as in Geraghty and Heavey (2004) and Shahabudeen et al.(2003) and Tabu search used by Alabas et al. (2000), are some of the optimisationmethods that have been linked to simulation models in past studies. Some simulationsoftware have inbuilt optimisation blocks that use some of these algorithms;ExtendSim for instance uses a genetic algorithm to optimise the objective functionspecified for it. Sivakumar and Shahabudeen (2008), Karaesmen and Dallery (2000) andNori and Sarker (1998) built objective functions in the form of an equation consisting ofinventory holding and demand backlog costs to be minimised. Another commonlyused approach, found in Bonvik et al. (1997) and Geraghty and Heavey (2005) is to setthe objective function to achieve a target service level.
Pirlot (1996) describes genetic algorithms as a mechanism that imitates the geneticevolution of species. It operates by reproduction, crossover and mutation of populations,the population being the solution space to the specified problem (Sivakumar andShahabudeen, 2008). The reproduction operator selects an initial population of solutions,evaluates them for fitness and ranks them. Individuals with good fitness are combined asparents to produce offspring with hope that the offspring will retain some of the desirabletraits of the parents. The offspring go through some mutation and evaluation in order tosee if they can evolve into even better alternative individuals. In the context of optimisingKCS, an individual can be seen as a particular setting of Kanbans for all stages and itsmutation will involve interchanging these Kanban settings within the system.
In using simulation optimisation to search for the optimal settings, especially in amulti-product environment, the number of runs needed could become overwhelming. Inorder to overcome this, some inferences and assumptions can be made about strategiesbased on the results of more easily optimised single parameter strategies. For instance,optimisation of two parameter-per-stage strategies is sometimes simplified by performingthe search for optimal values around the values obtained from single parameter strategies.Duri et al. (2000) observed in their study that the same base stock levels are required forBSCS and GKCS in a single stage system and this can serve as a good basis for starting theoptimisation of a GKCS model. Dallery and Liberopoulos (2000) also suggests that insearching for the optimal Kanban and base stock number, starting with a zero base stock,the number of Kanban cards that would maximise throughput would then be determinedby first using single stages in isolation, followed by gradually increasing the base stocklevel and dropping the Kanban number sequentially.
2.4 Performance measuresThe most common performance measure used in studies, such as Bonvik et al. (1997),Geraghty and Heavey (2005) and Khojasteh-Ghamari (2009) comparing pull systems, has
JMTM24,3
338
been the service level versus WIP trade-off. Some other common measures that appear instudies, such as Deleersnyder et al. (1989), Spearman et al. (1990) and Deokar (2004), arecycle time, stability of throughput rate, average wait time of back ordered demands, andaverage duration and frequency of demand backlog. Studies like Spearman et al. (1990)and Gaury et al. (2000) that assume unlimited demands make use of the throughput rate ofthe system instead of the service level. Geraghty and Heavey (2005) and Deokar (2004)compared strategies based on the level of WIP to achieve different target service levels.Deleersnyder et al. (1989) compared the number of Kanbans that will be needed by eachpull strategy to meet a target service level at different levels of machine reliability, demandvariability and safety stock levels. A closely-related approach to using target service levelcan be found in studies by Duri et al. (2000) and Sivakumar and Shahabudeen (2008),where penalty costs are assigned to demands not filled immediately from stock in anobjective function. For WIP, various approaches have been used such as assigningdifferent costs to semi-finished inventory and finished goods inventory in their objectivefunction for optimisation, for example in Duri et al. (2000), or simply assigning equalvalues (costs) to inventories across all the stages as done in studies by Geraghty andHeavey (2005) and Spearman et al. (1990).
3. Model developmentThe manufacturing system studied for the purpose of experimentation was a threestage, serial production system with negligible set-up times. The system was observedoperating in a push-based mode in a health-care products manufacturer. Managementwished to evaluate how to control the inventory in the system in order to meet customerservice level agreements. We were, therefore, tasked to investigate the potential tooperate a pull-based line capable of producing two or more similar products, with theassumption of negligible set-up times.
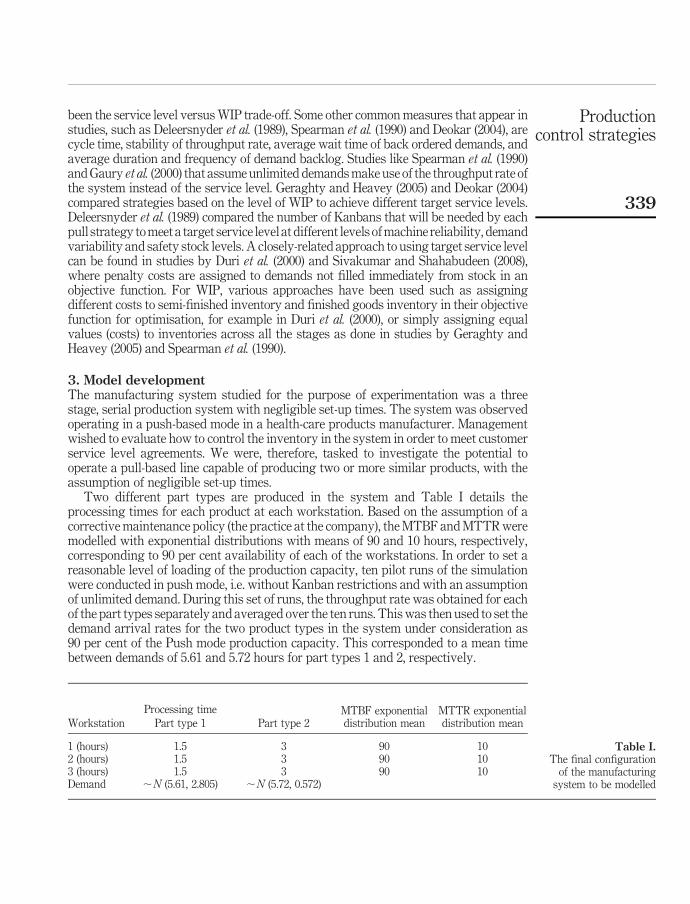
Two different part types are produced in the system and Table I details theprocessing times for each product at each workstation. Based on the assumption of acorrective maintenance policy (the practice at the company), the MTBF and MTTR weremodelled with exponential distributions with means of 90 and 10 hours, respectively,corresponding to 90 per cent availability of each of the workstations. In order to set areasonable level of loading of the production capacity, ten pilot runs of the simulationwere conducted in push mode, i.e. without Kanban restrictions and with an assumptionof unlimited demand. During this set of runs, the throughput rate was obtained for eachof the part types separately and averaged over the ten runs. This was then used to set thedemand arrival rates for the two product types in the system under consideration as90 per cent of the Push mode production capacity. This corresponded to a mean timebetween demands of 5.61 and 5.72 hours for part types 1 and 2, respectively.
Processing timeWorkstation Part type 1 Part type 2
MTBF exponentialdistribution mean
MTTR exponentialdistribution mean
1 (hours) 1.5 3 90 102 (hours) 1.5 3 90 103 (hours) 1.5 3 90 10Demand ,N (5.61, 2.805) ,N (5.72, 0.572)
Table I.The final configuration
of the manufacturingsystem to be modelled
Productioncontrol strategies
339
These values for mean time between demands are specified with a normal distributionbecause of its suitability for modelling distributions that represent a combination ofevents, and in this case the demand events can be said to emanate from differentcustomer sources. Moreover, with a normal distribution the mean and standarddeviation values can be easily combined to represent different levels of demandvariability which is part of the aims of this study. It was aimed to experiment with thesituation of having to cope with two products of highly disparate levels of demandvariability. Therefore, the standard deviation for Products 1 and 2 were set to 2.805 and0.572 hours corresponding to 50 and 10 per cent of their mean values, respectively. Thefinal system has 90 per cent capacity loading level with the configurations presented inTable I.
3.1 Model assumptionsTo simplify the model by eliminating aspects that are not likely to have a significantimpact on the results of the model and to give adequate consideration to the limitationsand capabilities of the simulation software, the following assumptions were madeabout the systems:
. The system produces two part types that are processed on the same set ofmachines in a serial line configuration.
. In order to capture the most complex scenario such system can deal with, the twopart types will have high and low levels of demand variability.
. Raw parts are always available for release to the first stage, therefore it is neverstarved of raw materials.
. The manufacturing system consists of three manufacturing stages each having aworkstation and an output buffer (a single Kanban system).
. Manufacturing stages 2 and 3 are also provided with an input buffer inorder to implement a minimal-block policy, i.e. to allow parts to move to thenext stage once they have acquired the authorisation card/s required by thePCS.
. The initial manufacturing stage is not allocated an input buffer, owing to theassumption of raw material always been available when required.
. Demands that cannot be immediately satisfied are backlogged.
. Negligible set-up time is assumed, so that the different part types waiting forprocessing at a stage are processed in FIFO order, and only a single unit can beprocessed on the machine at a time.
. Demands and Kanbans represent a single unit of an item, such that demandsarrive for a single item at a time and they are not treated as batches.
. The breakdown of machines is operation dependent which implies that amachine does not breakdown unless during processing of an item.
. The transmission of demand and Kanban information and the movement ofparts are instantaneous and take negligible time.
. Negative outputs generated by the normal distribution representing the demandarrival event will give instantaneous arrival of demands.
JMTM24,3
340
3.2 Warm up period, run length and number of replicationsBSCS is regarded as the strategy with the least tight WIP control, while CONWIP’sinventory is initialised at the last stage at the beginning of simulation, therefore the twostrategies were chosen for determining the warm up period. Based on therecommendations in Law and Kelton (2000), on the need to allow considerableoccurrence of infrequent events such as machine breakdowns, and observation of theresulting graph, a 15,000 hours warm up period was chosen. To achieve the desired levelof precision with mild consideration for computing resource requirements, thesimulation experiments were conducted over 30 replications each of 50,000 hours runlength.
3.3 ValidationValidation of the model was not entirely possible because there was no similar studyconducted on exactly the same type of system in existence, either in analytical orsimulation form. However, the equivalence of dedicated KCS and BSCS to dedicatedGKCS and EKCS, when there are equal number of Kanbans and base stock as reportedin Baynat et al. (2002), served as a good basis for validating the models.
4. Experimental analysis without consideration of robustness4.1 Experimental setupThe strategies were first optimised for a base scenario of the system using a geneticalgorithm combined with an objective function to minimise total WIP required toachieve 95 per cent service levels for both product types. The formulation of the geneticalgorithm’s objective function, for optimisation of the models, is presented in thefollowing sections, followed by the results of the all pairwise comparison of averageWIP. Paired comparisons were initially performed to select the better of the shared anddedicated policies for strategies that can operate either of them, followed by using thebetter of the two in an all pairwise comparison with all the other strategies.
4.2 Genetic algorithm optimisationMulti-product system optimisation involves determining values for numerousparameters, therefore, a genetic algorithm offered by the optimisation block ofExtendSim software, was applied in the determination of the optimal values of basestock and/or Kanbans. In this block, an objective function was specified against whichvarious system settings are evaluated until a 95 per cent target SL, for both products,was achieved with the lowest inventory level. The total system WIP was the objectivefunction to the genetic algorithm and it was specified as a cost minimisation type. Thesample space for each of the parameters was determined by conducting one-factor at atime sensitivity analysis.
The objective function was formulated as follows:
If ((SL1< 5 0.9449)k(SL2< 5 0.9449)) // Here it is verified if a settingmeets the set target SL of 0.95. SL1 and SL2 are the actual Service Levels achievedfor Product 1 and 2, respectively. Through trial and error, we found that if wespecified this test as SL<0.95 values in the range [0.945, 0.95) could be acceptedas meeting the test due to a rounding error in ExtendSim. Additionally, theoptimisation block appears to truncate values after four decimal places whenevaluating them in the optimiser block in an objective function, therefore, when we
Productioncontrol strategies
341
specified SL1 < ¼ 0.9449 k SL2 < ¼ 0. 9449 only parameter settings thatachieved a 95 per cent or greater service level would have their cost functioncalculated based on total WIP.
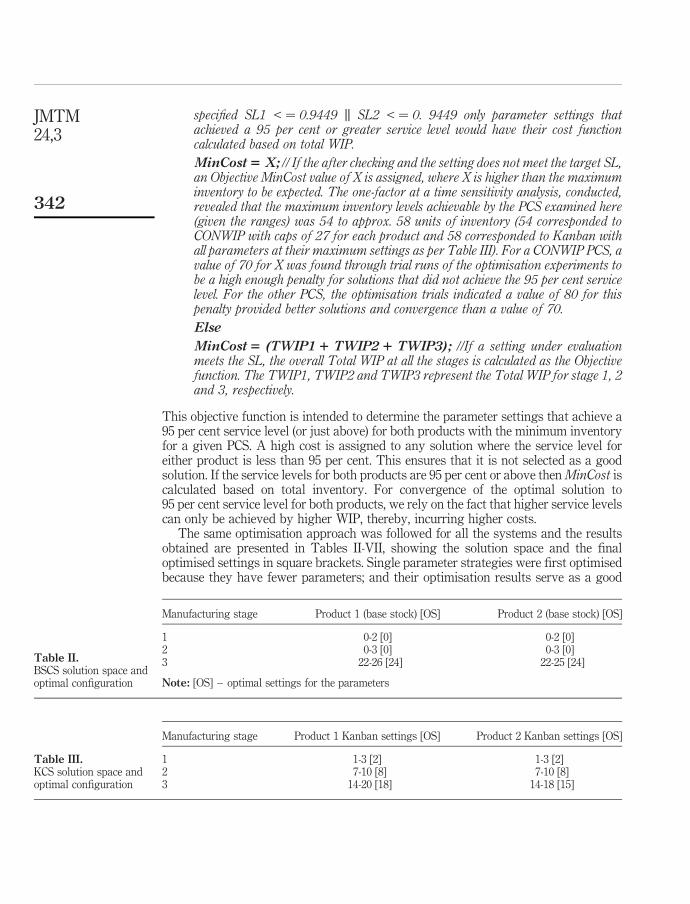
MinCost 5 X; // If the after checking and the setting does not meet the target SL,an Objective MinCost value of X is assigned, where X is higher than the maximuminventory to be expected. The one-factor at a time sensitivity analysis, conducted,revealed that the maximum inventory levels achievable by the PCS examined here(given the ranges) was 54 to approx. 58 units of inventory (54 corresponded toCONWIP with caps of 27 for each product and 58 corresponded to Kanban withall parameters at their maximum settings as per Table III). For a CONWIP PCS, avalue of 70 for X was found through trial runs of the optimisation experiments tobe a high enough penalty for solutions that did not achieve the 95 per cent servicelevel. For the other PCS, the optimisation trials indicated a value of 80 for thispenalty provided better solutions and convergence than a value of 70.
Else
MinCost 5 (TWIP1 1 TWIP2 1 TWIP3); //If a setting under evaluationmeets the SL, the overall Total WIP at all the stages is calculated as the Objectivefunction. The TWIP1, TWIP2 and TWIP3 represent the Total WIP for stage 1, 2and 3, respectively.
This objective function is intended to determine the parameter settings that achieve a95 per cent service level (or just above) for both products with the minimum inventoryfor a given PCS. A high cost is assigned to any solution where the service level foreither product is less than 95 per cent. This ensures that it is not selected as a goodsolution. If the service levels for both products are 95 per cent or above then MinCost iscalculated based on total inventory. For convergence of the optimal solution to95 per cent service level for both products, we rely on the fact that higher service levelscan only be achieved by higher WIP, thereby, incurring higher costs.
The same optimisation approach was followed for all the systems and the resultsobtained are presented in Tables II-VII, showing the solution space and the finaloptimised settings in square brackets. Single parameter strategies were first optimisedbecause they have fewer parameters; and their optimisation results serve as a good
Manufacturing stage Product 1 (base stock) [OS] Product 2 (base stock) [OS]
1 0-2 [0] 0-2 [0]2 0-3 [0] 0-3 [0]3 22-26 [24] 22-25 [24]
Note: [OS] – optimal settings for the parameters
Table II.BSCS solution space andoptimal configuration
Manufacturing stage Product 1 Kanban settings [OS] Product 2 Kanban settings [OS]
1 1-3 [2] 1-3 [2]2 7-10 [8] 7-10 [8]3 14-20 [18] 14-18 [15]
Table III.KCS solution space andoptimal configuration
JMTM24,3
342
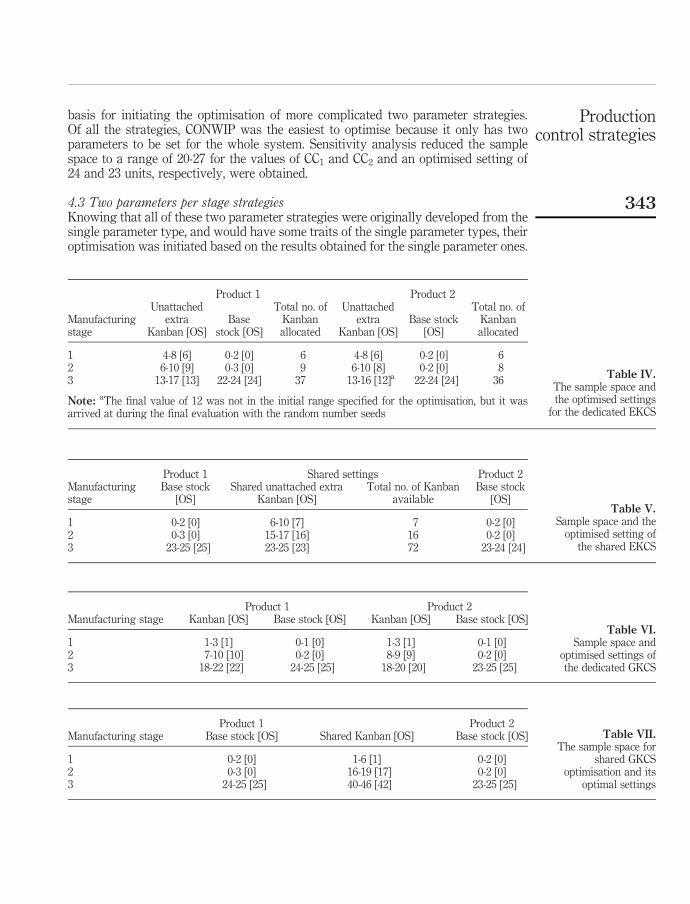
basis for initiating the optimisation of more complicated two parameter strategies.Of all the strategies, CONWIP was the easiest to optimise because it only has twoparameters to be set for the whole system. Sensitivity analysis reduced the samplespace to a range of 20-27 for the values of CC1 and CC2 and an optimised setting of24 and 23 units, respectively, were obtained.
4.3 Two parameters per stage strategiesKnowing that all of these two parameter strategies were originally developed from thesingle parameter type, and would have some traits of the single parameter types, theiroptimisation was initiated based on the results obtained for the single parameter ones.
Product 1 Shared settings Product 2Manufacturingstage
Base stock[OS]
Shared unattached extraKanban [OS]
Total no. of Kanbanavailable
Base stock[OS]
1 0-2 [0] 6-10 [7] 7 0-2 [0]2 0-3 [0] 15-17 [16] 16 0-2 [0]3 23-25 [25] 23-25 [23] 72 23-24 [24]
Table V.Sample space and the
optimised setting ofthe shared EKCS
Product 1 Product 2Manufacturing stage Kanban [OS] Base stock [OS] Kanban [OS] Base stock [OS]
1 1-3 [1] 0-1 [0] 1-3 [1] 0-1 [0]2 7-10 [10] 0-2 [0] 8-9 [9] 0-2 [0]3 18-22 [22] 24-25 [25] 18-20 [20] 23-25 [25]
Table VI.Sample space and
optimised settings ofthe dedicated GKCS
Product 1 Product 2
Manufacturingstage
Unattachedextra
Kanban [OS]Base
stock [OS]
Total no. ofKanbanallocated
Unattachedextra
Kanban [OS]Base stock
[OS]
Total no. ofKanbanallocated
1 4-8 [6] 0-2 [0] 6 4-8 [6] 0-2 [0] 62 6-10 [9] 0-3 [0] 9 6-10 [8] 0-2 [0] 83 13-17 [13] 22-24 [24] 37 13-16 [12]a 22-24 [24] 36
Note: aThe final value of 12 was not in the initial range specified for the optimisation, but it wasarrived at during the final evaluation with the random number seeds
Table IV.The sample space andthe optimised settings
for the dedicated EKCS
Product 1 Product 2Manufacturing stage Base stock [OS] Shared Kanban [OS] Base stock [OS]
1 0-2 [0] 1-6 [1] 0-2 [0]2 0-3 [0] 16-19 [17] 0-2 [0]3 24-25 [25] 40-46 [42] 23-25 [25]
Table VII.The sample space for
shared GKCSoptimisation and its
optimal settings
Productioncontrol strategies
343
Although they have more parameters to be optimised, the dedicated policies wereoptimised before the shared ones because they are reported by Baynat et al. (2002) toexhibit more direct interrelation to the single parameters strategies than theshared policies. These links between them were used during the initial solution spaceevaluation to minimise the sample spaces before the optimisation runs were conducted.
It should be noted that in the case of the shared and dedicated EKCS policies, it wasthe number of extra unattached Kanbans (K – S) that was optimised, unlike in otherstrategies where it was the total number of Kanbans, K. Since EKCS was developed byDallery and Liberopoulos (2000) as a combination of the BSCS and KCS, the initialsearch for its base stock level settings was conducted close to the values obtained forthe BSCS. From this evaluation, it was observed that a minimum base stock level of 0 –0 – 24 and 0 – 0 – 24 at stages 1 – 2 – 3 for products 1 and 2, respectively, would berequired to achieve the target SL irrespective of the Kanban assignments. The nextstep was to identify the number of extra unattached Kanbans, (K – S), and how theyshould be distributed across the stages.
The equality in the base stock levels of BSCS and GKCS, as reported in Duri et al.(2000), serves as a good basis for the optimisation of the latter based on the results fromthe optimisation of the BSCS. However, further evaluation revealed that the last stageof the dedicated GKCS would require more Kanbans than the dedicated KCS as shownin Table VI.
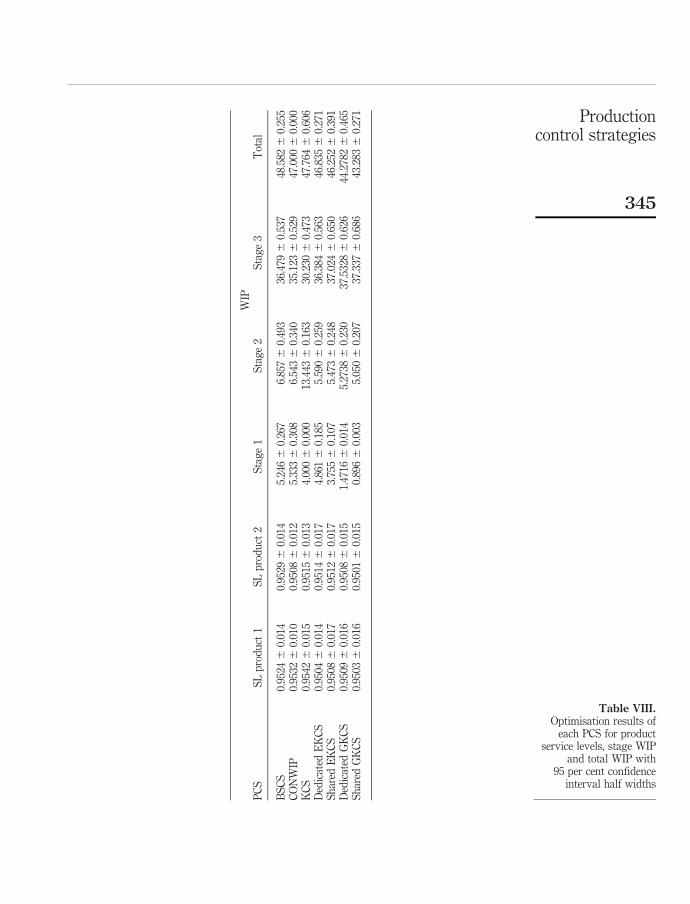
4.4 Optimisation resultsThe results from the optimisation experiments for each PCS examined are presented inTable IX for the optimal parameter settings detailed earlier. The table provides theservice level achieved for each product, the stage WIP and total WIP in the system. Foreach mean value the 95 per cent confidence interval half width is also provide inTable IX. Each PCS achieved the 95 per cent targeted service level for both products.Direct observation of the results for WIP, indicate that, the GKCS strategies (sharedand dedicated) outperform the other PCS in terms of total WIP owing to the ability tomaintain high stage 3, final goods, WIP and significantly lower stage 1 WIP. The poorperformance of KCS is attributable to lower stage 3 WIP and significantly higherstage 2 WIP which is a direct result of Demand information communication delay toupstream stages (Table VIII).
4.5 All pairwise comparison of strategiesIn the paired comparison of dedicated and shared policies of GKCS and EKCS, it wasobserved that the shared policies outperformed their dedicated counterparts, thereforeonly the shared policies were selected for the all pairwise comparisons. In order toachieve an overall confidence level of 95 per cent for the ten comparisons resultingfrom the five strategies selected, Bonferroni’s approximation of 99.5 per cent was usedfor individual comparisons. Each of the cells of Table IX show the confidence intervalof the differences between the intersecting top row strategies and the side columnstrategies being compared, such that a negative confidence interval not covering zeroimplies that the top row strategy has statistically significantly lesser average totalWIP. One apparent contradiction from the all pairwise comparison is that there is nostatistically significant difference between KCS and CONWIP or KCS and BSCS.However, there is evidence that CONWIP outperforms BSCS as the confidence interval
JMTM24,3
344
WIP
PC
SS
Lp
rod
uct
1S
Lp
rod
uct
2S
tag
e1
Sta
ge
2S
tag
e3
Tot
al
BS
CS
0.95
24^
0.01
40.
9529
^0.
014
5.24
6^
0.26
76.
857^
0.49
336
.479
^0.
537
48.5
82^
0.25
5C
ON
WIP
0.95
32^
0.01
00.
9508
^0.
012
5.33
3^
0.30
86.
543^
0.34
035
.123
^0.
529
47.0
00^
0.00
0K
CS
0.95
42^
0.01
50.
9515
^0.
013
4.00
0^
0.00
013
.443
^0.
163
30.2
30^
0.47
347
.764
^0.
606
Ded
icat
edE
KC
S0.
9504
^0.
014
0.95
14^
0.01
74.
861^
0.18
55.
590^
0.25
936
.384
^0.
563
46.8
35^
0.27
1S
har
edE
KC
S0.
9508
^0.
017
0.95
12^
0.01
73.
755^
0.10
75.
473^
0.24
837
.024
^0.
650
46.2
52^
0.39
1D
edic
ated
GK
CS
0.95
09^
0.01
60.
9508
^0.
015
1.47
16^
0.01
45.
2738
^0.
230
37.5
328^
0.62
644
.278
2^
0.46
5S
har
edG
KC
S0.
9503
^0.
016
0.95
01^
0.01
50.
896^
0.00
35.
050^
0.20
737
.337
^0.
686
43.2
83^
0.27
1
Table VIII.Optimisation results of
each PCS for productservice levels, stage WIP
and total WIP with95 per cent confidence
interval half widths
Productioncontrol strategies
345
for the difference between these two PCS does not contain zero and indicates thatCONWIP achieves the targeted service levels with statistically significantly less WIPthan BSCS. Based on the results of the optimisation and with a 95 per cent confidencelevel, the strategies can thus be ranked in order of improving performance as:
BSCS < KCS < CONWIP p Shared EKCS p Shared GKCS:
where , indicates difference of mean total WIP but not statistically significantand p indicates statistically significant difference in mean total WIP.
4.6 Selection of the best strategyNelson et al. (2001), provide a procedure for selecting the best system from a number ofalternatives that combines a screening procedure with Rinott’s two stage samplingprocedure for selecting the best system. This combined procedure allows for theelimination of obviously inferior alternatives without recourse to additional simulations.A survivor set is created as a result of the screening procedure that is guaranteed tocontain at least one of the systems but may contain all of the k alternatives. If the survivorset only contains one system, that system is selected as the best and the procedureterminates. When there is more than one survivor, Rinott’s two stage sampling procedureis then applied to members of the survivor set in order to determine the best system.
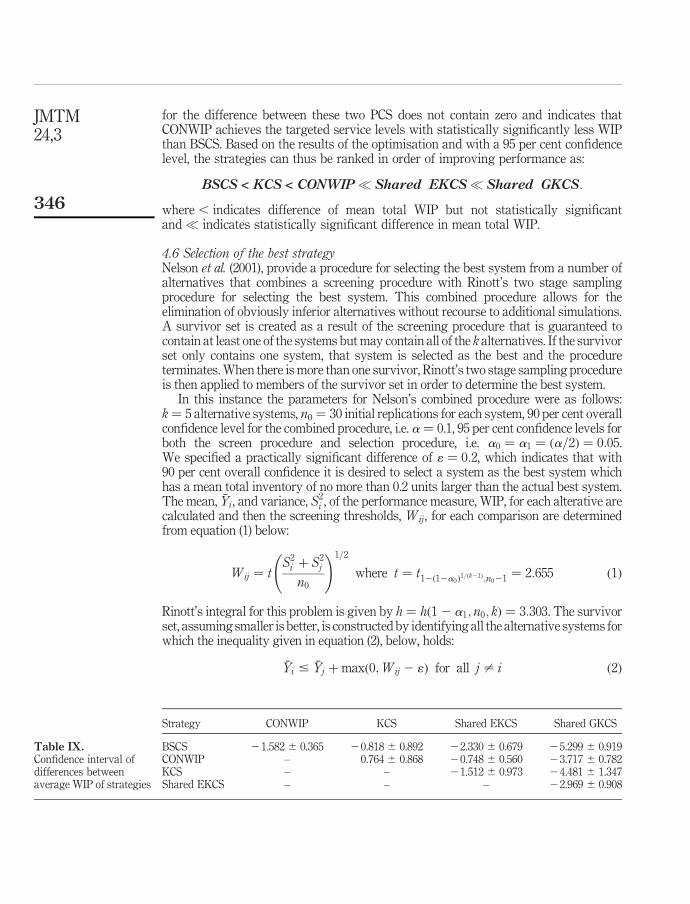
In this instance the parameters for Nelson’s combined procedure were as follows:k ¼ 5 alternative systems, n0 ¼ 30 initial replications for each system, 90 per cent overallconfidence level for the combined procedure, i.e. a ¼ 0.1, 95 per cent confidence levels forboth the screen procedure and selection procedure, i.e. a0 ¼ a1 ¼ ða=2Þ ¼ 0:05.We specified a practically significant difference of 1 ¼ 0:2, which indicates that with90 per cent overall confidence it is desired to select a system as the best system whichhas a mean total inventory of no more than 0.2 units larger than the actual best system.The mean, �Yi , and variance, S2
i , of the performance measure, WIP, for each alterative arecalculated and then the screening thresholds, Wij, for each comparison are determinedfrom equation (1) below:
Wij ¼ tS2i þ S2
j
n0
!1=2
where t ¼ t12ð12a0Þ1=ðk21Þ;n021 ¼ 2:655 ð1Þ
Rinott’s integral for this problem is given by h ¼ hð1 2 a1; n0; kÞ ¼ 3:303. The survivorset, assuming smaller is better, is constructed by identifying all the alternative systems forwhich the inequality given in equation (2), below, holds:
�Yi # �Yj þ maxð0;Wij 2 1Þ for all j – i ð2Þ
Strategy CONWIP KCS Shared EKCS Shared GKCS
BSCS 21.582 ^ 0.365 20.818 ^ 0.892 22.330 ^ 0.679 25.299 ^ 0.919CONWIP – 0.764 ^ 0.868 20.748 ^ 0.560 23.717 ^ 0.782KCS – – 21.512 ^ 0.973 24.481 ^ 1.347Shared EKCS – – – 22.969 ^ 0.908
Table IX.Confidence interval ofdifferences betweenaverage WIP of strategies
JMTM24,3
346
If the survivor set contains more than one member then the number of additionalreplications required for each survivor is determined from equation (3):
Ni ¼ max n0;hSi
1
� �2& ’ !
where ·d e implies round up ð3Þ
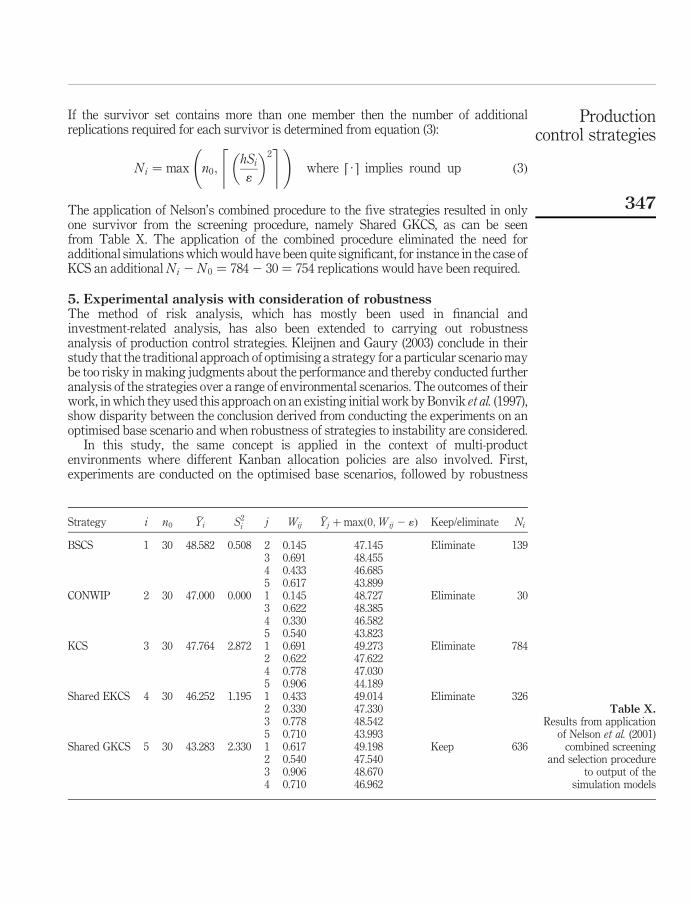
The application of Nelson’s combined procedure to the five strategies resulted in onlyone survivor from the screening procedure, namely Shared GKCS, as can be seenfrom Table X. The application of the combined procedure eliminated the need foradditional simulations which would have been quite significant, for instance in the case ofKCS an additional Ni 2 N 0 ¼ 784 2 30 ¼ 754 replications would have been required.
5. Experimental analysis with consideration of robustnessThe method of risk analysis, which has mostly been used in financial andinvestment-related analysis, has also been extended to carrying out robustnessanalysis of production control strategies. Kleijnen and Gaury (2003) conclude in theirstudy that the traditional approach of optimising a strategy for a particular scenario maybe too risky in making judgments about the performance and thereby conducted furtheranalysis of the strategies over a range of environmental scenarios. The outcomes of theirwork, in which they used this approach on an existing initial work by Bonvik et al. (1997),show disparity between the conclusion derived from conducting the experiments on anoptimised base scenario and when robustness of strategies to instability are considered.
In this study, the same concept is applied in the context of multi-productenvironments where different Kanban allocation policies are also involved. First,experiments are conducted on the optimised base scenarios, followed by robustness
Strategy i n0�Yi S2
i j Wij�Yj þ maxð0;Wij 2 1Þ Keep/eliminate Ni
BSCS 1 30 48.582 0.508 2 0.145 47.145 Eliminate 1393 0.691 48.4554 0.433 46.6855 0.617 43.899
CONWIP 2 30 47.000 0.000 1 0.145 48.727 Eliminate 303 0.622 48.3854 0.330 46.5825 0.540 43.823
KCS 3 30 47.764 2.872 1 0.691 49.273 Eliminate 7842 0.622 47.6224 0.778 47.0305 0.906 44.189
Shared EKCS 4 30 46.252 1.195 1 0.433 49.014 Eliminate 3262 0.330 47.3303 0.778 48.5425 0.710 43.993
Shared GKCS 5 30 43.283 2.330 1 0.617 49.198 Keep 6362 0.540 47.5403 0.906 48.6704 0.710 46.962
Table X.Results from application
of Nelson et al. (2001)combined screening
and selection procedureto output of the
simulation models
Productioncontrol strategies
347
tests for which the outcomes of the two approaches are compared. DOE, Taguchi Lossfunction and Monte Carlo methods are some of the methods that have been used inconducting similar studies, like it has been done with financial and investmentsanalysis and the design of highly delicate and critical systems. Latin hypercubesampling (LHS) is the preferred method for conducting this study because of thepossibility of achieving better coverage over the ranges of deviation of the factors.Gaury and Kleijnen (1998), state that a minimum of 100 samples are needed for a LHS.In this study, therefore, 100 samples are taken, over the range at which the factors areto be varied, followed by randomly combining them to form scenarios and thenexperimenting with the systems under these scenarios to record new realisations of theperformance measures.
Alternative strategies are compared by conducting stochastic dominance tests onthe cumulative density function plots of their outcomes for the various scenarios.Stochastic dominance test results can be of first-degree, second-degree and some otherhigher degrees depending on the significance of the difference between the outputs.The first-degree of dominance is often recognisable by visual observation. Stochasticdominance is described as follows for two systems Y and Z with cumulative densityfunctions FY ðxÞ and FZ ðxÞ where the objective is to maximise the value of x.
System Y is said to first-degree stochastically dominate Z, if:
FY ðxÞ # FzðxÞ; for all x
System Y second-order stochastically dominates Z, if:Z k
min
FY ðxÞdx #
Z k
min
FzðxÞdx; for all k
In real life situations, there are usually other justifications for taking decisionsabout the suitability of systems based on the outcome of sensitivity analysistests and as such the use of higher-order stochastic dominance tests is not alwaysnecessary.
5.1 Robustness tests using LHSIn the robustness test, factors that are usually susceptible to change from theenvironment, i.e. those factors that are not within the control of production linedesigners/managers, are selected and varied within the range of ^5 per cent tosimulate different experimental scenarios. The following environmental variables werechosen to reflect the possibility of increase or decrease in demand arrival rateand variability, and in-process variability that would create bottlenecks within thesystem:
. Mean and standard deviation of demand distribution for the two products; a totalof four factors.
. Mean time to repair and mean time between failure for the three stages of thesystem gives a total of six factors.
In all there were a total of ten factors and the LHS method of sampling was applied inconducting the sensitivity analysis within the range of ^5 per cent of each factor’sbase value. 100 samples were taken from within the ^5 per cent of each of the factors
JMTM24,3
348
and randomly combined to form scenarios. The simulation of each of the scenarios wasreplicated 30 times. The LHS scenarios were designed in JMP’s experimental designsoftware and the Stochastic Dominance test was conducted with Vose Software’sModelRisk MS Excel plug-in.
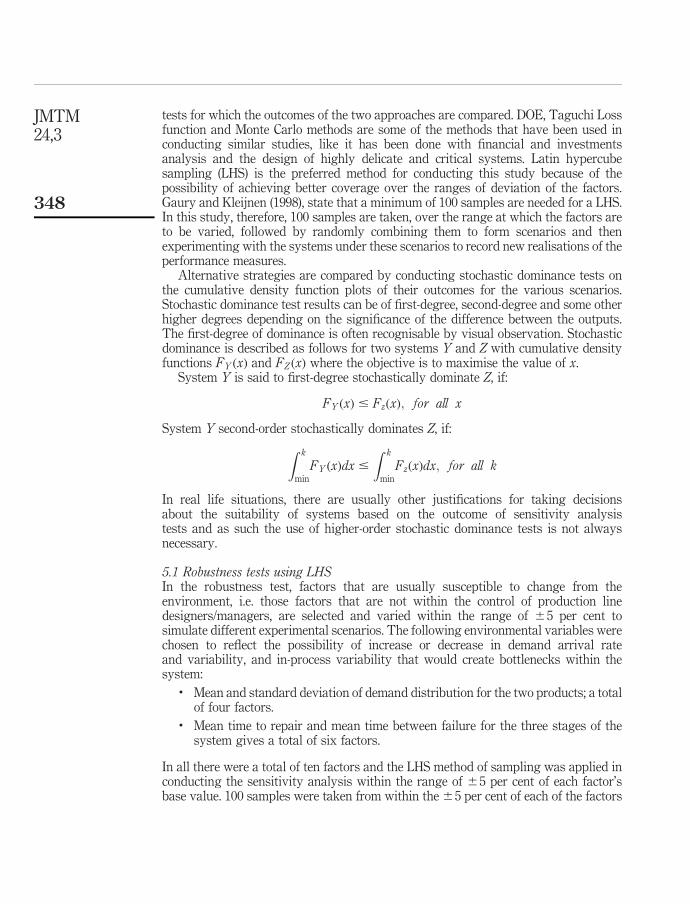
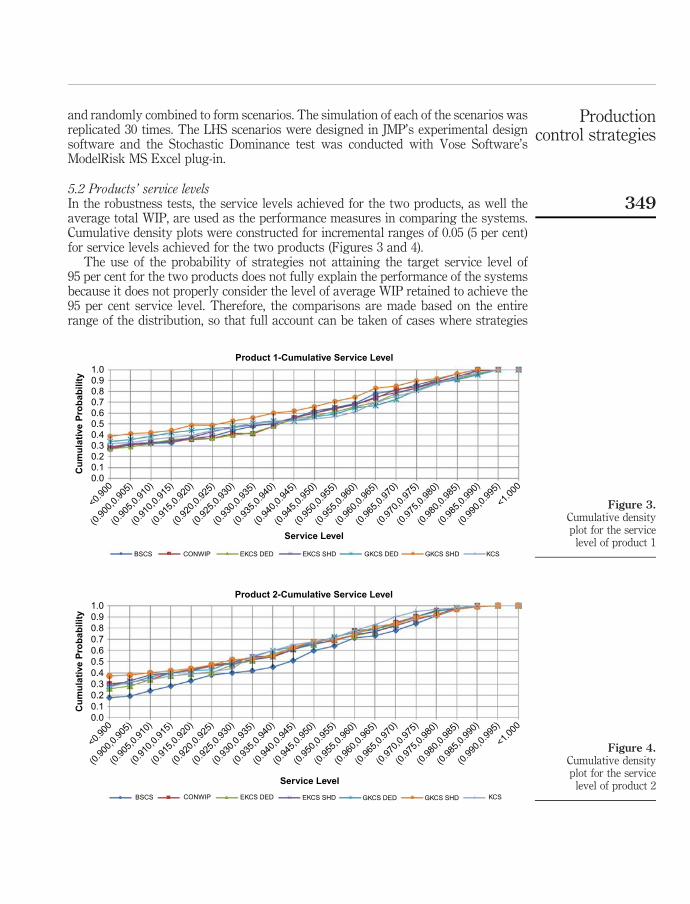
5.2 Products’ service levelsIn the robustness tests, the service levels achieved for the two products, as well theaverage total WIP, are used as the performance measures in comparing the systems.Cumulative density plots were constructed for incremental ranges of 0.05 (5 per cent)for service levels achieved for the two products (Figures 3 and 4).
The use of the probability of strategies not attaining the target service level of95 per cent for the two products does not fully explain the performance of the systemsbecause it does not properly consider the level of average WIP retained to achieve the95 per cent service level. Therefore, the comparisons are made based on the entirerange of the distribution, so that full account can be taken of cases where strategies
Figure 3.Cumulative densityplot for the service
level of product 1
Product 1-Cumulative Service Level1.00.90.80.7
Cu
mu
lati
ve P
rob
abili
ty
0.60.50.40.30.20.10.0
Service Level
BSCS
<0.9
00
(0.9
00,0
.905
)
(0.9
05,0
.910
)
(0.9
10,0
.915
)
(0.9
15,0
.920
)
(0.9
20,0
.925
)
(0.9
25,0
.930
)
(0.9
30,0
.935
)
(0.9
35,0
.940
)
(0.9
40,0
.945
)
(0.9
45,0
.950
)
(0.9
50,0
.955
)
(0.9
55,0
.960
)
(0.9
60,0
.965
)
(0.9
65,0
.970
)
(0.9
70,0
.975
)
(0.9
75,0
.980
)
(0.9
80,0
.985
)
(0.9
85,0
.990
)
(0.9
90,0
.995
)
<1.0
00
CONWIP EKCS DED EKCS SHD GKCS DED GKCS SHD KCS
Figure 4.Cumulative densityplot for the service
level of product 2
Product 2-Cumulative Service Level1.00.90.80.7
Cu
mu
lati
ve P
rob
abili
ty
0.60.50.40.30.20.10.0
Service Level
BSCS
<0.9
00
(0.9
00,0
.905
)
(0.9
05,0
.910
)
(0.9
10,0
.915
)
(0.9
15,0
.920
)
(0.9
20,0
.925
)
(0.9
25,0
.930
)
(0.9
30,0
.935
)
(0.9
35,0
.940
)
(0.9
40,0
.945
)
(0.9
45,0
.950
)
(0.9
50,0
.955
)
(0.9
55,0
.960
)
(0.9
60,0
.965
)
(0.9
65,0
.970
)
(0.9
70,0
.975
)
(0.9
75,0
.980
)
(0.9
80,0
.985
)
(0.9
85,0
.990
)
(0.9
90,0
.995
)
<1.0
00
CONWIP EKCS DED EKCS SHD GKCS DED GKCS SHD KCS
Productioncontrol strategies
349
achieve adequate service level at the expense of high average WIP, as well as cases ofnot attaining adequate service level because of strict maintenance of low average WIP.
Based on the service level of Product 1, BSCS stochastically dominates all otherstrategies followed by the dedicated EKCS and shared EKCS. KCS dominates the twotypes of GKCS strategies, among which there was an inconclusive stochasticdominance result. Inconclusive dominance test outcomes were also recorded betweenCONWIP and shared EKCS and between the dedicated and shared variants of EKCS.All the stochastic dominance test results reported are second degree except in thecomparisons between the shared GKCS and the two variants of the EKCS, where firstdegree dominance were recorded. The seven strategies can be ranked as follows, interms of increasing superiority:
ðGKCS SHD :5 GKCSDED :ÞpKCS < {CONWIP
< ð5EKCS SHD :5 } EKCS DED :Þp BSCS
In the case of Product 2 service level, BSCS stochastically dominates all other strategies,with four of the cases being first degree dominance. Two second degree dominance arerecorded in its comparison with CONWIP and shared GKCS. The dedicated EKCSdominates all other strategies, while its shared counterpart, which should have comeafter it in superiority, has inconclusive stochastic dominance over KCS and CONWIP.However, KCS separately stochastically dominates CONWIP, and shared GKCS hassecond degree stochastic dominance over its dedicated counterpart in this case. Based onthe Product 2 service levels, the seven strategies increase in superiority as follows:
GKCS SHD : < GKCSDED:p {CONWIP
< ð5EKCS SHD :5 }KCSÞp EKCS DED :p BSCS
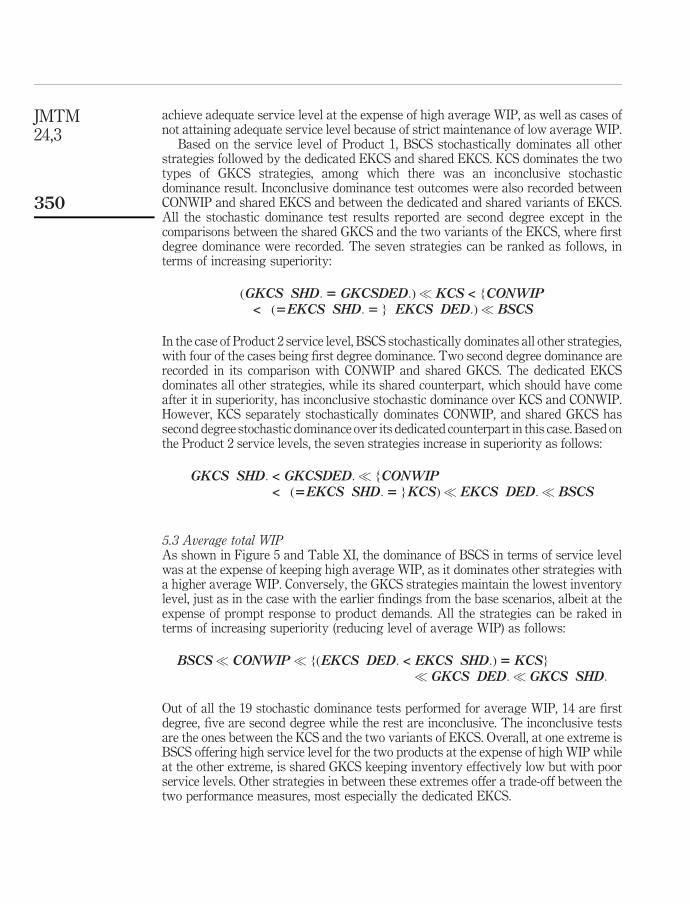
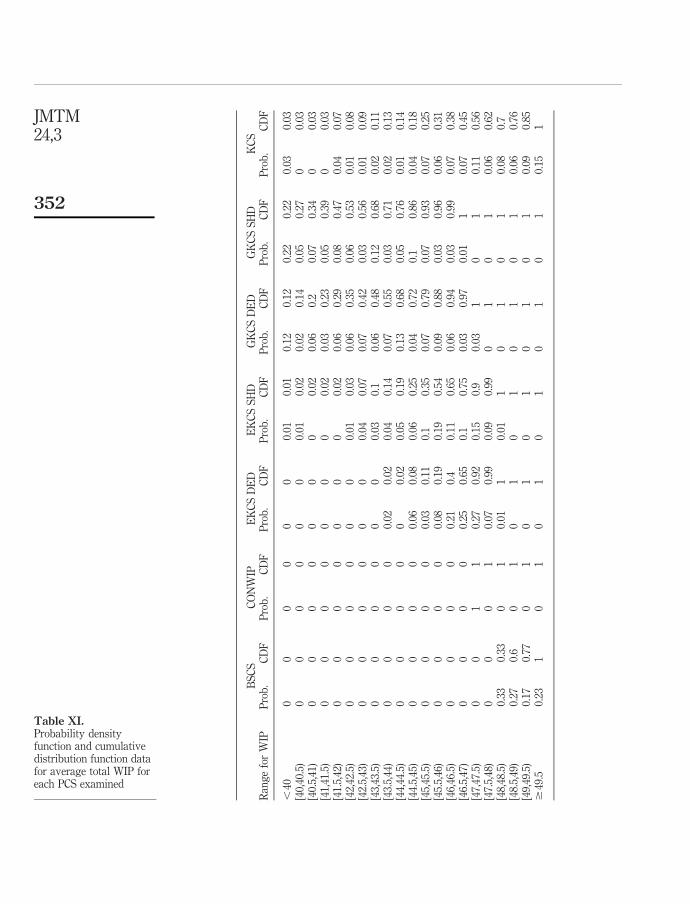
5.3 Average total WIPAs shown in Figure 5 and Table XI, the dominance of BSCS in terms of service levelwas at the expense of keeping high average WIP, as it dominates other strategies witha higher average WIP. Conversely, the GKCS strategies maintain the lowest inventorylevel, just as in the case with the earlier findings from the base scenarios, albeit at theexpense of prompt response to product demands. All the strategies can be raked interms of increasing superiority (reducing level of average WIP) as follows:
BSCS p CONWIP p {ðEKCS DED : < EKCS SHD :Þ5KCS}p GKCS DED :p GKCS SHD :
Out of all the 19 stochastic dominance tests performed for average WIP, 14 are firstdegree, five are second degree while the rest are inconclusive. The inconclusive testsare the ones between the KCS and the two variants of EKCS. Overall, at one extreme isBSCS offering high service level for the two products at the expense of high WIP whileat the other extreme, is shared GKCS keeping inventory effectively low but with poorservice levels. Other strategies in between these extremes offer a trade-off between thetwo performance measures, most especially the dedicated EKCS.
JMTM24,3
350
5.4 Shared versus dedicated policiesAnother observation from the study is that the dedicated policies, of both GKCS andEKCS, dominate their shared counterparts in the service level of lower demandvariability level Product 2 (10 per cent). However, there was no clear differentiationbetween their performances in the case of Product 1 with higher level of demandvariability (50 per cent). Although, there was also a difference in the mean processingtimes of the two products, the higher level of demand variability of Product 1 is muchmore likely to have been responsible for the subtleness of the difference between the twoallocation policies. On the other hand, the dedicated policies of both strategiesmaintained higher levels of average total WIP than their shared policy counterparts.Overall, the dedicated allocation policies are preferred to their shared policycounterparts, in terms of how they compare with other strategies.
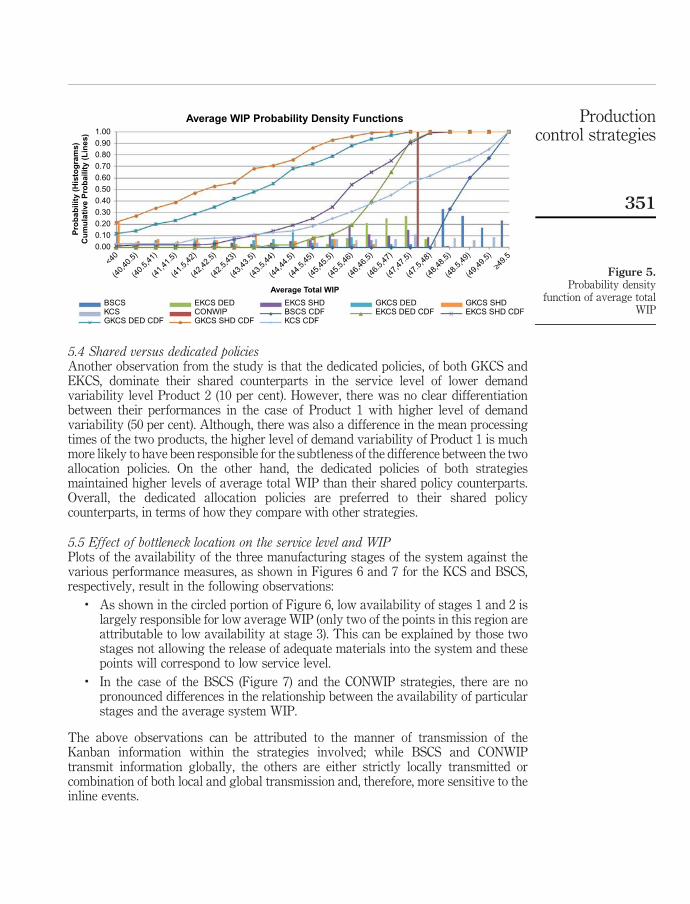
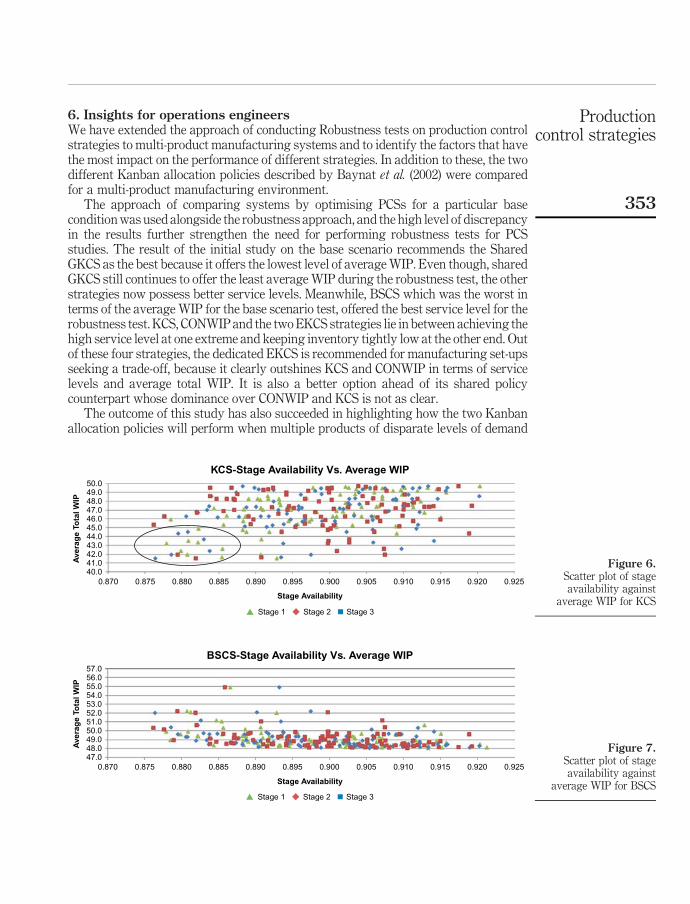
5.5 Effect of bottleneck location on the service level and WIPPlots of the availability of the three manufacturing stages of the system against thevarious performance measures, as shown in Figures 6 and 7 for the KCS and BSCS,respectively, result in the following observations:
. As shown in the circled portion of Figure 6, low availability of stages 1 and 2 islargely responsible for low average WIP (only two of the points in this region areattributable to low availability at stage 3). This can be explained by those twostages not allowing the release of adequate materials into the system and thesepoints will correspond to low service level.
. In the case of the BSCS (Figure 7) and the CONWIP strategies, there are nopronounced differences in the relationship between the availability of particularstages and the average system WIP.
The above observations can be attributed to the manner of transmission of theKanban information within the strategies involved; while BSCS and CONWIPtransmit information globally, the others are either strictly locally transmitted orcombination of both local and global transmission and, therefore, more sensitive to theinline events.
Figure 5.Probability density
function of average totalWIP
1.00
Average WIP Probability Density Functions
Pro
bab
ility
(H
isto
gra
ms)
Cu
mu
lati
ve P
rob
ailit
y (L
ines
)
0.90
0.80
0.70
0.60
0.50
0.40
0.30
0.20
BSCSBSCS CDFKCSKCS CDF
Average Total WIP
GKCS DED CDF GKCS SHD CDF
GKCS SHDGKCS DEDCONWIPEKCS DED EKCS SHD
EKCS SHD CDFEKCS DED CDF
0.10
0.00
<40
(40,
40.5
)
(40.
5,41
)
(41,
41.5
)
(41.
5,42
)
(42,
42.5
)
(42.
5,43
)
(43,
43.5
)
(43.
5,44
)
(44,
44.5
)
(44.
5,45
)
(45,
45.5
)
(45.
5,46
)
(46,
46.5
)
(46.
5,47
)
(47,
47.5
)
(47.
5,48
)
(48,
48.5
)
(48.
5,49
)
(49,
49.5
)
≥49.
5
Productioncontrol strategies
351
BS
CS
CO
NW
IPE
KC
SD
ED
EK
CS
SH
DG
KC
SD
ED
GK
CS
SH
DK
CS
Ran
ge
for
WIP
Pro
b.
CD
FP
rob
.C
DF
Pro
b.
CD
FP
rob
.C
DF
Pro
b.
CD
FP
rob
.C
DF
Pro
b.
CD
F
,40
00
00
00
0.01
0.01
0.12
0.12
0.22
0.22
0.03
0.03
[40,
40.5
)0
00
00
00.
010.
020.
020.
140.
050.
270
0.03
[40.
5,41
)0
00
00
00
0.02
0.06
0.2
0.07
0.34
00.
03[4
1,41
.5)
00
00
00
00.
020.
030.
230.
050.
390
0.03
[41.
5,42
)0
00
00
00
0.02
0.06
0.29
0.08
0.47
0.04
0.07
[42,
42.5
)0
00
00
00.
010.
030.
060.
350.
060.
530.
010.
08[4
2.5,
43)
00
00
00
0.04
0.07
0.07
0.42
0.03
0.56
0.01
0.09
[43,
43.5
)0
00
00
00.
030.
10.
060.
480.
120.
680.
020.
11[4
3.5,
44)
00
00
0.02
0.02
0.04
0.14
0.07
0.55
0.03
0.71
0.02
0.13
[44,
44.5
)0
00
00
0.02
0.05
0.19
0.13
0.68
0.05
0.76
0.01
0.14
[44.
5,45
)0
00
00.
060.
080.
060.
250.
040.
720.
10.
860.
040.
18[4
5,45
.5)
00
00
0.03
0.11
0.1
0.35
0.07
0.79
0.07
0.93
0.07
0.25
[45.
5,46
)0
00
00.
080.
190.
190.
540.
090.
880.
030.
960.
060.
31[4
6,46
.5)
00
00
0.21
0.4
0.11
0.65
0.06
0.94
0.03
0.99
0.07
0.38
[46.
5,47
)0
00
00.
250.
650.
10.
750.
030.
970.
011
0.07
0.45
[47,
47.5
)0
01
10.
270.
920.
150.
90.
031
01
0.11
0.56
[47.
5,48
)0
00
10.
070.
990.
090.
990
10
10.
060.
62[4
8,48
.5)
0.33
0.33
01
0.01
10.
011
01
01
0.08
0.7
[48.
5,49
)0.
270.
60
10
10
10
10
10.
060.
76[4
9,49
.5)
0.17
0.77
01
01
01
01
01
0.09
0.85
$49
.50.
231
01
01
01
01
01
0.15
1
Table XI.Probability densityfunction and cumulativedistribution function datafor average total WIP foreach PCS examined
JMTM24,3
352
6. Insights for operations engineersWe have extended the approach of conducting Robustness tests on production controlstrategies to multi-product manufacturing systems and to identify the factors that havethe most impact on the performance of different strategies. In addition to these, the twodifferent Kanban allocation policies described by Baynat et al. (2002) were comparedfor a multi-product manufacturing environment.
The approach of comparing systems by optimising PCSs for a particular basecondition was used alongside the robustness approach, and the high level of discrepancyin the results further strengthen the need for performing robustness tests for PCSstudies. The result of the initial study on the base scenario recommends the SharedGKCS as the best because it offers the lowest level of average WIP. Even though, sharedGKCS still continues to offer the least average WIP during the robustness test, the otherstrategies now possess better service levels. Meanwhile, BSCS which was the worst interms of the average WIP for the base scenario test, offered the best service level for therobustness test. KCS, CONWIP and the two EKCS strategies lie in between achieving thehigh service level at one extreme and keeping inventory tightly low at the other end. Outof these four strategies, the dedicated EKCS is recommended for manufacturing set-upsseeking a trade-off, because it clearly outshines KCS and CONWIP in terms of servicelevels and average total WIP. It is also a better option ahead of its shared policycounterpart whose dominance over CONWIP and KCS is not as clear.
The outcome of this study has also succeeded in highlighting how the two Kanbanallocation policies will perform when multiple products of disparate levels of demand
Figure 6.Scatter plot of stageavailability against
average WIP for KCS
0.870
50.049.048.0
Ave
rag
e To
tal W
IP
47.046.045.044.043.042.041.040.0
0.875 0.880 0.885 0.890 0.895 0.900 0.905 0.910 0.915 0.920 0.925
Stage Availability
KCS-Stage Availability Vs. Average WIP
Stage 1 Stage 2 Stage 3
Figure 7.Scatter plot of stageavailability against
average WIP for BSCS
0.870
57.056.055.0
Ave
rag
e To
tal W
IP
54.053.052.051.050.049.048.047.0
0.875 0.880 0.885 0.890 0.895 0.900 0.905 0.910 0.915 0.920 0.925
Stage Availability
BSCS-Stage Availability Vs. Average WIP
Stage 1 Stage 2 Stage 3
Productioncontrol strategies
353
fluctuations are involved. This is a very common scenario in modern multi-productmanufacturing environments. The effect of system bottleneck location on theinventory accumulation behaviour of different strategies was also described, and thiswas observed to have a relationship to the nature of a PCS’s Kanban informationtransmission. Furthermore, the importance of the level of interaction involved in theKanban and Basestock settings of individual product types has been shown. Studiessuch as Deokar (2004) and Bhuvnaesh (2006) report the same Kanban and base stocksettings for all the product types involved in the system, despite the fact that the basestock and Kanban levels for individual products strongly depend on factors such astheir individual processing times and demand arrival rates.
7. Opportunities for future workIn our opinion, while the system modelled is a theoretical, two product manufacturingenvironment with identical machines, the approach followed and proposed here foroptimisation, robustness assessment, bottleneck analysis and selection of a productioncontrol strategy would be valid for real world applications in multi-productmanufacturing environments. We are currently working with an industrial partner,a supplier of electronic components to the automotive sector, to verify the applicabilityof this methodology. This case study will enable us to assess the methodology inan environment that has a larger number of products, significant set-ups andnon-identical machine processing and availability distributions.
The poor performance of KCS relative to other PCS in this environment is a similarfinding to most previous work on single product environments. The surprise was thatCONWIP, which has generally been shown to outperform PCS such as EKCS and GKCSin single product environments, was not the best strategy in this two productenvironment. Further work is required in order to determine whether the relativeperformances of the various strategies are particular to the system and scenarios studiedor generalizable to a class or classes of manufacturing systems. Another avenue forfurther research is in the area of investigating, more rigorously, the effects of bottlenecklocation, bottleneck severity (degree of difference in availability relative to other stages)and uncertainty of demand on the performance of the various PCS in terms of WIP andservice level. Additionally, it would also be interesting to explore how these strategieswould perform in a multi-product environment subject to unstable demand profiles.
References
Alabas, C., Altiparmak, F. and Dengiz, B. (2000), “The optimization of number of Kanbans withgenetic algorithms, simulated annealing and Tabu search”, Proceedings of the 2000Congress on Evolutionary Computation, Vol. 1, pp. 580-585.
Baynat, B., Buzacott, J.A. and Dallery, Y. (2002), “Multi-product Kanban-like control systems”,International Journal of Production Research, Vol. 40 No. 16, pp. 4225-4255.
Baynat, B., Dallery, Y., Di Mascolo, M. and Frein, Y. (2001), “A multi-class approximationtechnique for the analysis of Kanban-like control systems”, International Journal ofProduction Research, Vol. 39 No. 2, pp. 307-328.
Bhuvnaesh, K. (2006), “A comparison of traditional and extended information Kanban controlsystems using dedicated and shared Kanbans”, MSc thesis, School of IndustrialEngineering and Management, Oklahoma State University, Stillwater, OK.
JMTM24,3
354
Bonvik, A.M. and Gershwin, S.B. (1996), “Beyond Kanban: creating and analyzing lean shop floorcontrol policies”, Manufacturing and Service Operations Management ConferenceProceedings, Dartmouth College, The Amos Tuck School Hanover, NH, USA, June,pp. 46-51.
Bonvik, A.M., Couch, C.E. and Gershwin, S.B. (1997), “A comparison of production-line controlmechanisms”, International Journal of Production Research, Vol. 35 No. 3, pp. 789-804.
Boonlertvanich, K. (2005), “Extended-CONWIP-Kanban system: control and performanceanalysis”, PhD thesis, School of Industrial and Systems Engineering, Georgia Institute ofTechnology, Atlanta, GA.
Bowden, R. and Hall, J.D. (1998), “Simulation optimization research and development”, inMedeiros, D.J., Watson, E.F., Carson, J.S. and Manivannan, M.S. (Eds), Proceedings of the30th Conference on Winter Simulation (WSC ’98), IEEE Computer Society Press, LosAlamitos, CA, pp. 1693-1698.
Bowden, R.O., Hall, J.D. and Usher, J.M. (1996), “Integration of evolutionary programming andsimulation to optimize a pull production system”, Computers & Industrial Engineering,Vol. 31 No. 1, pp. 217-220.
Buzacott, J.A. (1989), “Queueing models of Kanban and MRP controlled production systems”,Engineering Costs and Production Economics, Vol. 17 No. 1, pp. 3-20.
Cochran, J.K. and Kaylani, H.A. (2008), “Optimal design of a hybrid push/pull serialmanufacturing system with multiple part types”, International Journal of ProductionResearch, Vol. 46 No. 4, pp. 949-965.
Dallery, Y. and Liberopoulos, G. (2000), “Extended Kanban control system: combining Kanbanand base stock”, IIE Transactions, Vol. 32 No. 4, pp. 369-386.
Deleersnyder, J.-L., Hodgson, T.J., Muller (-Malek), H. and O’Grady, P.J. (1989), “Kanbancontrolled pull systems: an analytic approach”, Management Science, Vol. 35 No. 9,pp. 1079-1091.
Deokar, S.S. (2004), “Performance evaluation of multi-product Kanban-like control systems”, MScthesis, Department of Industrial and Management Systems Engineering, College ofEngineering, University of South Florida, Tampa, FL.
Duri, C., Frein, Y. and Di Mascolo, M. (1995), “Performance evaluation of Kanbanmultiple-product production systems”, Proceedings of 1995 INRIA/IEEE Symposium onEmerging Technologies and Factory Automation ETFA’95, 10-13 October, Vol. 3, IEEEComputing Society, Los Alamitos, CA, pp. 557-566.
Duri, C., Frein, Y. and Di Mascolo, M. (2000), “Comparison among three pull control policies:Kanban, base stock, and generalized Kanban”, Annals of Operations Research, Vol. 93No. 1, pp. 41-69.
Gaury, E.G.A. and Kleijnen, J.P.C. (1998), “Risk analysis of robust system design”,in Medeiros, D.J., Watson, E.F., Carson, J.S. and Manivannan, M.S. (Eds), Proceedings of1998 Winter Simulation Conference, Grand Hyatt, Washington, DC, USA, 13-16December, Vol. 2 No. 1, pp. 1533-1540.
Gaury, E.G.A., Pierreval, H. and Kleijnen, J.P.C. (2000), “An evolutionary approach to select a pullsystem among Kanban, Conwip and Hybrid”, Journal of Intelligent Manufacturing, Vol. 11No. 2, pp. 157-167.
Geraghty, J. and Heavey, C. (2004), “A comparison of hybrid push/pull and CONWIP/pullproduction inventory control policies”, International Journal of Production Economics,Vol. 91 No. 1, pp. 75-90.
Productioncontrol strategies
355
Geraghty, J. and Heavey, C. (2005), “A review and comparison of hybrid and pull-type productioncontrol strategies”, OR Spectrum, Vol. 27 No. 2, pp. 435-457.
Gupta, S.M., Al-Turki, Y.A.Y. and Perry, R.F. (1999), “Flexible Kanban system”, InternationalJournal of Operations & Production Management, Vol. 19 No. 10, pp. 1065-1093.
Hochreiter, T.A. (1999), “A comparative simulation study of Kanban, CONWIP, and MRPmanufacturing control systems in a flow shop”, MSc thesis, Industrial and SystemsEngineering Department, College of Engineering, University of Florida, Gainesville, FL.
Karaesmen, F. and Dallery, Y. (2000), “A performance comparison of pull type controlmechanisms for multi-stage manufacturing”, International Journal of ProductionEconomics, Vol. 68 No. 1, pp. 59-71.
Khojasteh-Ghamari, Y. (2009), “A performance comparison between Kanban and CONWIPcontrolled assembly systems”, Journal of Intelligent Manufacturing, Vol. 20 No. 6,pp. 751-760.
Kleijnen, J.P.C. and Gaury, E. (2003), “Short-term robustness of production management systems:a case study”, European Journal of Operational Research, Vol. 148 No. 2, pp. 452-465.
Kochel, P. and Nielander, U. (2002), “Kanban optimization by simulation and evolution”,Production Planning & Control: The Management of Operations, Vol. 13 No. 8, pp. 725-734.
Koulouriotis, D.E., Xanthopoulos, A.S. and Tourassis, V.D. (2010), “Simulation optimisation ofpull control policies for serial manufacturing lines and assembly manufacturing systemsusing genetic algorithms”, International Journal of Production Research, Vol. 48 No. 10,pp. 2887-2912.
Krieg, G.N. and Kuhn, H. (2004), “Analysis of multi-product Kanban systems withstate-dependent setups and lost sales”, Annals of Operations Research, Vol. 125 No. 1,pp. 141-166.
Law, A.M. and Kelton, D.M. (2000), Simulation Modeling and Analysis, 3rd ed., McGraw-HillHigher Education, Boston, MA.
Liberopoulos, G. and Dallery, Y. (2000), “A unified framework for pull control mechanisms inmulti-stage manufacturing systems”, Annals of Operations Research, Vol. 93 No. 1,pp. 325-355.
Marek, R.P., Elkins, D.A. and Smith, D.R. (2001), “Understanding the fundamentals of Kanbanand CONWIP pull systems using simulation”, in Peters, B.A., Smith, J.S., Medeiros, D.J.and Rohrer, M.W. (Eds), Proceedings of the 33rd Conference on Winter Simulation,Arlington, Virginia, 9-12 December, Vol. 2, IEEE Computing Society, Washington, DC,pp. 921-929.
Nelson, B.L., Swann, J., Goldsman, D. and Song, W. (2001), “Simple procedures for selecting thebest simulated system when the number of alternatives is large”, Operations Research,Vol. 49 No. 6, pp. 950-963.
Nori, V.S. and Sarker, B.R. (1998), “Optimum number of Kanbans between two adjacentstations”, Production Planning & Control, Vol. 9 No. 1, pp. 60-65.
Olaitan, O.A. (2011), “Lean production control in complex multi-product environments”,MSc thesis, School of Mechanical and Manufacturing Engineering, Dublin City University,Dublin.
Pirlot, M. (1996), “General local search methods”, European Journal of Operational Research,Vol. 92 No. 3, pp. 493-511.
Satyam, K. and Krishnamurthy, A. (2008), “Performance evaluation of a multi-product systemunder CONWIP control”, IIE Transactions, Vol. 40 No. 3, pp. 252-264.
JMTM24,3
356
Shahabudeen, P., Krishnaiah, K. and Thulasi Narayanan, M. (2003), “Design of a two-carddynamic kanban system using a simulated annealing algorithm”, The InternationalJournal of Advanced Manufacturing Technology, Vol. 21 No. 10, pp. 754-759.
Sivakumar, G. and Shahabudeen, P. (2008), “Design of multi-stage adaptive Kanban system”,International Journal of Advanced Manufacturing Technology, Vol. 38 No. 3, pp. 321-336.
Spearman, M.L., Woodruff, D.L. and Hopp, W.J. (1990), “CONWIP: a pull alternative to Kanban”,International Journal of Production Research, Vol. 28 No. 5, pp. 879-894.
Szczerbicka, H., Becker, M. and Syrjakow, M. (1998), “Genetic algorithms: a tool for modelling,simulation, and optimization of complex systems”, Cybernetics and Systems:An International Journal, Vol. 29 No. 7, pp. 639-659.
Zipkin, P. (1989), “A Kanban-like production control system: analysis of simple models”,Working Paper 89-1, Graduate School of Business, Columbia University, New York, NY.
About the authorsOladipupo A. Olaitan is a PhD Candidate in the Enterprise Process Research Centre in the Schoolof Mechanical and Manufacturing Engineering at Dublin City University (DCU), Ireland. Hisresearch interests include modelling and analysis of multi-product manufacturing systems, andinventory and production control strategies.
John Geraghty is a Lecturer in the School of Mechanical and Manufacturing Engineering atDublin City University (DCU), Ireland. He is a founding member of the Enterprise ProcessResearch Centre at DCU. His teaching interests include operations research, manufacturingsystems simulation, quality management and project management. His research interestsinclude modelling and analysis of semi-conductor fabrication systems, lean manufacturing andoperations excellence. John Geraghty is the corresponding author and can be contacted at: [email protected]
Productioncontrol strategies
357
To purchase reprints of this article please e-mail: [email protected] visit our web site for further details: www.emeraldinsight.com/reprints

Reproduced with permission of the copyright owner. Further reproduction prohibited withoutpermission.