Modulation of Lactobacillus plantarum Gastrointestinal Robustness by Fermentation Conditions Enables...
13
Modulation of Lactobacillus plantarum Gastrointestinal Robustness by Fermentation Conditions Enables Identification of Bacterial Robustness Markers Hermien van Bokhorst-van de Veen 1,2,3 , I-Chiao Lee 1,2,4 , Maria L. Marco 1,2¤ , Michiel Wels 1,2,5 , Peter A. Bron 1,2,6 , Michiel Kleerebezem 1,2,3 * 1 TI Food and Nutrition, Wageningen, The Netherlands, 2 NIZO Food Research, Ede, The Netherlands, 3 Laboratory of Microbiology, Wageningen University and Research Centre, Wageningen, The Netherlands, 4 Host-Microbe Interactomics, Wageningen University and Research Centre, Wageningen, The Netherlands, 5 Centre for Molecular and Biomolecular Informatics, Radboud University Medical Centre, Nijmegen, The Netherlands, 6 Kluyver Centre for Genomics of Industrial Fermentation, Delft, The Netherlands Abstract Background: Lactic acid bacteria (LAB) are applied worldwide in the production of a variety of fermented food products. Additionally, specific Lactobacillus species are nowadays recognized for their health-promoting effects on the consumer. To optimally exert such beneficial effects, it is considered of great importance that these probiotic bacteria reach their target sites in the gut alive. Methodology/Principal Findings: In the accompanying manuscript by Bron et al. the probiotic model organism Lactobacillus plantarum WCFS1 was cultured under different fermentation conditions, which was complemented by the determination of the corresponding molecular responses by full-genome transcriptome analyses. Here, the gastrointestinal (GI) survival of the cultures produced was assessed in an in vitro assay. Variations in fermentation conditions led to dramatic differences in GI-tract survival (up to 7-log) and high robustness could be associated with low salt and low pH during the fermentations. Moreover, random forest correlation analyses allowed the identification of specific transcripts associated with robustness. Subsequently, the corresponding genes were targeted by genetic engineering, aiming to enhance robustness, which could be achieved for 3 of the genes that negatively correlated with robustness and where deletion derivatives displayed enhanced survival compared to the parental strain. Specifically, a role in GI-tract survival could be confirmed for the lp_1669-encoded AraC-family transcription regulator, involved in capsular polysaccharide remodeling, the penicillin-binding protein Pbp2A involved in peptidoglycan biosynthesis, and the Na + /H + antiporter NapA3. Moreover, additional physiological analysis established a role for Pbp2A and NapA3 in bile salt and salt tolerance, respectively. Conclusion: Transcriptome trait matching enabled the identification of biomarkers for bacterial (gut-)robustness, which is important for our molecular understanding of GI-tract survival and could facilitate the design of culture conditions aimed to enhance probiotic culture robustness. Citation: van Bokhorst-van de Veen H, Lee I-C, Marco ML, Wels M, Bron PA, et al. (2012) Modulation of Lactobacillus plantarum Gastrointestinal Robustness by Fermentation Conditions Enables Identification of Bacterial Robustness Markers. PLoS ONE 7(7): e39053. doi:10.1371/journal.pone.0039053 Editor: Arnold Driessen, University of Groningen, The Netherlands Received April 12, 2012; Accepted May 14, 2012; Published July 3, 2012 Copyright: ß 2012 van Bokhorst-van de Veen et al. This is an open-access article distributed under the terms of the Creative Commons Attribution License, which permits unrestricted use, distribution, and reproduction in any medium, provided the original author and source are credited. Funding: PAB is partly employed within the research program of the Kluyver Centre for Genomics of Industrial Fermentation which is part of the Netherlands Genomics Initiative/Netherlands Organization for Scientific Research. The funders had no role in study design, data collection and analysis, decision to publish, or preparation of the manuscript. Competing Interests: All authors are affiliated to NIZO food research, which participates in the Kluyver Centre for Genomics of Industrial Fermentation and TI Food & Nutrition consortia. TI Food & Nutrition has patented the technology and genes described in these papers that are shown to be involved in bacterial robustness, but has no products in development or marketed products to declare. This does not alter the authors’ adherence to all the PLoS ONE policies on sharing data and materials, as detailed online in the guide for authors. * E-mail: [email protected] ¤ Current address: Department of Food Science and Technology, University of California Davis, Davis, California, United States of America Introduction According to the world health organization (WHO) probiotics are defined as live microorganisms which, when administered in adequate amounts, confer a health benefit on the host [1]. The most widely applied probiotic strains belong to the genera Lactobacillus and Bifidobacterium [2,3]. Probiotics are most common- ly provided as freshly fermented food products, non-fermented food products to which probiotics are added, or as dried bacterial preparations [3,4]. The viability of bacteria is considered an important trait for probiotic functionality, justifying the interest to unravel the mechanism(s) involved in gastrointestinal (GI)-tract survival at the molecular level [5,6,7,8]. During passage through the GI-tract, probiotics encounter several stresses including acidity in the stomach which may reach a pH as low as 1 during fasting [7]. This low extracellular pH affects the proton motive force of the bacterial cells, thereby disrupting the energy supply required for processes such as PLoS ONE | www.plosone.org 1 July 2012 | Volume 7 | Issue 7 | e39053
-
Upload
independent -
Category
Documents
-
view
1 -
download
0
Transcript of Modulation of Lactobacillus plantarum Gastrointestinal Robustness by Fermentation Conditions Enables...

Modulation of Lactobacillus plantarum GastrointestinalRobustness by Fermentation Conditions EnablesIdentification of Bacterial Robustness MarkersHermien van Bokhorst-van de Veen1,2,3, I-Chiao Lee1,2,4, Maria L. Marco1,2¤, Michiel Wels1,2,5,
Peter A. Bron1,2,6, Michiel Kleerebezem1,2,3*
1 TI Food and Nutrition, Wageningen, The Netherlands, 2 NIZO Food Research, Ede, The Netherlands, 3 Laboratory of Microbiology, Wageningen University and Research
Centre, Wageningen, The Netherlands, 4 Host-Microbe Interactomics, Wageningen University and Research Centre, Wageningen, The Netherlands, 5 Centre for Molecular
and Biomolecular Informatics, Radboud University Medical Centre, Nijmegen, The Netherlands, 6 Kluyver Centre for Genomics of Industrial Fermentation, Delft, The
Netherlands
Abstract
Background: Lactic acid bacteria (LAB) are applied worldwide in the production of a variety of fermented food products.Additionally, specific Lactobacillus species are nowadays recognized for their health-promoting effects on the consumer. Tooptimally exert such beneficial effects, it is considered of great importance that these probiotic bacteria reach their targetsites in the gut alive.
Methodology/Principal Findings: In the accompanying manuscript by Bron et al. the probiotic model organismLactobacillus plantarum WCFS1 was cultured under different fermentation conditions, which was complemented by thedetermination of the corresponding molecular responses by full-genome transcriptome analyses. Here, the gastrointestinal(GI) survival of the cultures produced was assessed in an in vitro assay. Variations in fermentation conditions led to dramaticdifferences in GI-tract survival (up to 7-log) and high robustness could be associated with low salt and low pH during thefermentations. Moreover, random forest correlation analyses allowed the identification of specific transcripts associatedwith robustness. Subsequently, the corresponding genes were targeted by genetic engineering, aiming to enhancerobustness, which could be achieved for 3 of the genes that negatively correlated with robustness and where deletionderivatives displayed enhanced survival compared to the parental strain. Specifically, a role in GI-tract survival could beconfirmed for the lp_1669-encoded AraC-family transcription regulator, involved in capsular polysaccharide remodeling, thepenicillin-binding protein Pbp2A involved in peptidoglycan biosynthesis, and the Na+/H+ antiporter NapA3. Moreover,additional physiological analysis established a role for Pbp2A and NapA3 in bile salt and salt tolerance, respectively.
Conclusion: Transcriptome trait matching enabled the identification of biomarkers for bacterial (gut-)robustness, which isimportant for our molecular understanding of GI-tract survival and could facilitate the design of culture conditions aimed toenhance probiotic culture robustness.
Citation: van Bokhorst-van de Veen H, Lee I-C, Marco ML, Wels M, Bron PA, et al. (2012) Modulation of Lactobacillus plantarum Gastrointestinal Robustness byFermentation Conditions Enables Identification of Bacterial Robustness Markers. PLoS ONE 7(7): e39053. doi:10.1371/journal.pone.0039053
Editor: Arnold Driessen, University of Groningen, The Netherlands
Received April 12, 2012; Accepted May 14, 2012; Published July 3, 2012
Copyright: � 2012 van Bokhorst-van de Veen et al. This is an open-access article distributed under the terms of the Creative Commons Attribution License,which permits unrestricted use, distribution, and reproduction in any medium, provided the original author and source are credited.
Funding: PAB is partly employed within the research program of the Kluyver Centre for Genomics of Industrial Fermentation which is part of the NetherlandsGenomics Initiative/Netherlands Organization for Scientific Research. The funders had no role in study design, data collection and analysis, decision to publish, orpreparation of the manuscript.
Competing Interests: All authors are affiliated to NIZO food research, which participates in the Kluyver Centre for Genomics of Industrial Fermentation and TIFood & Nutrition consortia. TI Food & Nutrition has patented the technology and genes described in these papers that are shown to be involved in bacterialrobustness, but has no products in development or marketed products to declare. This does not alter the authors’ adherence to all the PLoS ONE policies onsharing data and materials, as detailed online in the guide for authors.
* E-mail: [email protected]
¤ Current address: Department of Food Science and Technology, University of California Davis, Davis, California, United States of America
Introduction
According to the world health organization (WHO) probiotics
are defined as live microorganisms which, when administered in
adequate amounts, confer a health benefit on the host [1]. The
most widely applied probiotic strains belong to the genera
Lactobacillus and Bifidobacterium [2,3]. Probiotics are most common-
ly provided as freshly fermented food products, non-fermented
food products to which probiotics are added, or as dried bacterial
preparations [3,4]. The viability of bacteria is considered an
important trait for probiotic functionality, justifying the interest to
unravel the mechanism(s) involved in gastrointestinal (GI)-tract
survival at the molecular level [5,6,7,8].
During passage through the GI-tract, probiotics encounter
several stresses including acidity in the stomach which may
reach a pH as low as 1 during fasting [7]. This low extracellular
pH affects the proton motive force of the bacterial cells, thereby
disrupting the energy supply required for processes such as
PLoS ONE | www.plosone.org 1 July 2012 | Volume 7 | Issue 7 | e39053
membrane transport [9]. In addition, lower intracellular pH
values caused by acidic conditions may inhibit specific pathways
by damaging acid-sensitive associated enzyme functions [9].
After stomach passage probiotic strains reach the small intestine,
where bile acids act primarily as a surfactant that can disrupt
bacterial membranes [10] and damage macromolecules such as
RNA and DNA through the generation of free oxygen radicals
[11]. Moreover, protonated bile acids can freely pass bacterial
cell membranes and release protons intracellularly which might
lead to lowering of the intracellular pH, analogous to acid stress
[9].
Among the lactobacilli, Lactobacillus plantarum is encountered in a
plethora of fermentations, ranging from vegetables to dairy, meat
and sourdough [12,13]. L. plantarum is also frequently encountered
as a natural inhabitant of the GI-tract of several mammals,
including humans [14]. In addition, L. plantarum NCIMB8826 was
demonstrated to effectively survive passage of the human stomach,
reached the ileum in high numbers, and was detected in the colon
[15]. A single colony isolate of this strain (designated L. plantarum
strain WCFS1) was the first Lactobacillus strain of which the full
genome sequence was published [16]. Subsequently, sophisticated
bioinformatics tools were developed for this LAB strain, including
an advanced genome annotation [17], genome-based metabolic
models [18], as well as effective mutagenesis tools [19]. This
enables the molecular investigation of gene-regulatory mecha-
nisms underlying the observed GI-tract persistence of L. plantarum
WCFS1.
The availability of full genome sequences has also enabled the
exploration of genomic diversity among L. plantarum strains and its
association to differential phenotypes [13,20,21,22,23]. To enable
the identification of genes of which the relative expression level is
correlated to the phenotype of interest, we recently developed a
complementary transcriptome-phenotype matching strategy for L.
plantarum (see accompanying paper by Bron et al.). Here, we
employed this fermentation genomics platform to correlate
transcriptome data to GI-tract survival. These correlations led to
the identification of 13 candidate effector molecules for GI-tract
persistence. A subsequent gene deletion strategy established a
definite role in GI-tract persistence for the AraC-family transcrip-
tion regulator encoded by lp_1669, the penicillin-binding protein
Pbp2A involved in peptidoglycan biosynthesis, and the Na+/H+
antiporter NapA3.
Results
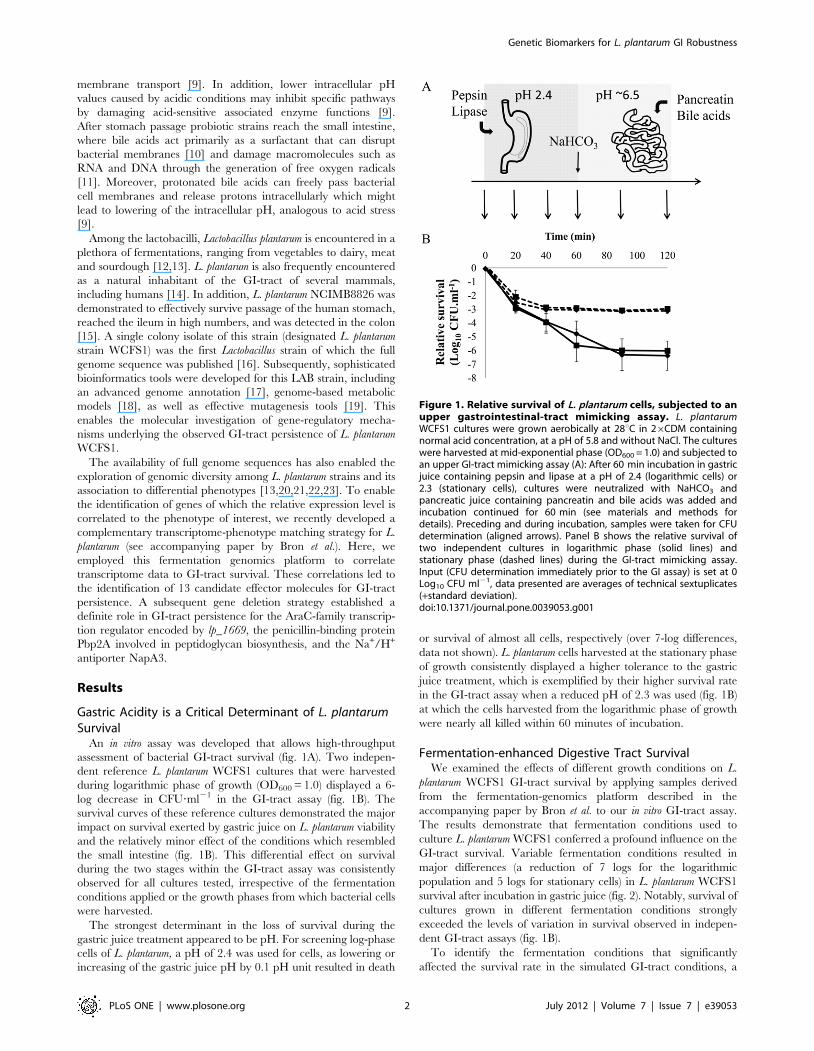
Gastric Acidity is a Critical Determinant of L. plantarumSurvival
An in vitro assay was developed that allows high-throughput
assessment of bacterial GI-tract survival (fig. 1A). Two indepen-
dent reference L. plantarum WCFS1 cultures that were harvested
during logarithmic phase of growth (OD600 = 1.0) displayed a 6-
log decrease in CFU?ml21 in the GI-tract assay (fig. 1B). The
survival curves of these reference cultures demonstrated the major
impact on survival exerted by gastric juice on L. plantarum viability
and the relatively minor effect of the conditions which resembled
the small intestine (fig. 1B). This differential effect on survival
during the two stages within the GI-tract assay was consistently
observed for all cultures tested, irrespective of the fermentation
conditions applied or the growth phases from which bacterial cells
were harvested.
The strongest determinant in the loss of survival during the
gastric juice treatment appeared to be pH. For screening log-phase
cells of L. plantarum, a pH of 2.4 was used for cells, as lowering or
increasing of the gastric juice pH by 0.1 pH unit resulted in death
or survival of almost all cells, respectively (over 7-log differences,
data not shown). L. plantarum cells harvested at the stationary phase
of growth consistently displayed a higher tolerance to the gastric
juice treatment, which is exemplified by their higher survival rate
in the GI-tract assay when a reduced pH of 2.3 was used (fig. 1B)
at which the cells harvested from the logarithmic phase of growth
were nearly all killed within 60 minutes of incubation.
Fermentation-enhanced Digestive Tract SurvivalWe examined the effects of different growth conditions on L.
plantarum WCFS1 GI-tract survival by applying samples derived
from the fermentation-genomics platform described in the
accompanying paper by Bron et al. to our in vitro GI-tract assay.
The results demonstrate that fermentation conditions used to
culture L. plantarum WCFS1 conferred a profound influence on the
GI-tract survival. Variable fermentation conditions resulted in
major differences (a reduction of 7 logs for the logarithmic
population and 5 logs for stationary cells) in L. plantarum WCFS1
survival after incubation in gastric juice (fig. 2). Notably, survival of
cultures grown in different fermentation conditions strongly
exceeded the levels of variation in survival observed in indepen-
dent GI-tract assays (fig. 1B).
To identify the fermentation conditions that significantly
affected the survival rate in the simulated GI-tract conditions, a
Figure 1. Relative survival of L. plantarum cells, subjected to anupper gastrointestinal-tract mimicking assay. L. plantarumWCFS1 cultures were grown aerobically at 28uC in 26CDM containingnormal acid concentration, at a pH of 5.8 and without NaCl. The cultureswere harvested at mid-exponential phase (OD600 = 1.0) and subjected toan upper GI-tract mimicking assay (A): After 60 min incubation in gastricjuice containing pepsin and lipase at a pH of 2.4 (logarithmic cells) or2.3 (stationary cells), cultures were neutralized with NaHCO3 andpancreatic juice containing pancreatin and bile acids was added andincubation continued for 60 min (see materials and methods fordetails). Preceding and during incubation, samples were taken for CFUdetermination (aligned arrows). Panel B shows the relative survival oftwo independent cultures in logarithmic phase (solid lines) andstationary phase (dashed lines) during the GI-tract mimicking assay.Input (CFU determination immediately prior to the GI assay) is set at 0Log10 CFU ml21, data presented are averages of technical sextuplicates(+standard deviation).doi:10.1371/journal.pone.0039053.g001
Genetic Biomarkers for L. plantarum GI Robustness
PLoS ONE | www.plosone.org 2 July 2012 | Volume 7 | Issue 7 | e39053

Mann-Whitney U test-based correlation analysis was performed in
FermDB on all time points measured (See accompanying
manuscript by Bron et al. for correlation analyses details). The
presence of 300 mM additional NaCl in the growth medium
resulted in a significant (P,0.05) negative influence on L. plantarum
GI-tract survival irrespective whether cells were analyzed after
collection from either logarithmic or stationary phase of growth
(shown for 60 min incubation in fig. 3A and B). L. plantarum grown
Figure 2. Relative GI-tract survival of differently grown L. plantarum WCFS1. Log10 CFU ml21 determination of L. plantarum WCFS1 inlogarithmic phase (A) and stationary phase (B) after 20 (light grey), 40 (dark grey), and 60 min (black) gastric juice incubation. Input is set at 0 Log10
CFU ml21, # = fermentation number, cultures were grown in 26CDM with (300 mM) or without (0) NaCl; with normal amino acid concentration (2)or reduced (1.1); at 28uC or 37uC; medium buffered at a pH of 5.2, 5.8, or 6.4; and aerobically (O2) or anaerobically (N2). Data presented are averages oftechnical sextuplicates (+ standard deviation).doi:10.1371/journal.pone.0039053.g002
Genetic Biomarkers for L. plantarum GI Robustness
PLoS ONE | www.plosone.org 3 July 2012 | Volume 7 | Issue 7 | e39053

in more acidic conditions (pH 5.2 instead of pH 6.4) and
harvested in stationary phase showed a significantly (P,0.05)
enhanced the gastric juice survival rate (shown for 60 min in
fig. 3C).
Transcriptome to Phenotype Association IdentifiesCandidate Effector Molecules for GI-tract Survival
In parallel with the GI-tract survival patterns, transcriptome
profiles were obtained for logarithmic cells harvested from all
fermentation conditions employed in this study (see accompanying
paper by Bron et al.). To investigate whether high- and low-rate
surviving cultures in the GI-tract assay could be distinguished
based on the expression of specific genes, the cultures were first
ranked on their GI-tract survival after gastric juice incubation
(t = 60 min). For cultures that had retained undetectable survival
rates after 60 min of gastric incubation, the relative survival rates
after 20 min and 40 min of gastric incubation, were employed to
refine their relative survival ranking (fig. 2A).
The transcriptomes of the eight cultures with the highest
survival rates and the eight cultures with the lowest survival in the
GI-tract assay were clearly distinguishable according to principal
component analysis (PCA) (fig. 4). This result indicated that the
transcriptomes contained information (genes) within the first two
components of the PCA which might allow the discrimination
between high- and low-survival rates in the GI-tract assay. To
identify specific transcripts that discriminate between low and high
GI-tract survival, and thus can be regarded as candidate
robustness markers, the random forest algorithm was applied
(see the accompanying paper by Bron et al.). This allowed the
identification of transcripts that have a high contribution to
accurately predict the low- and high-survival outcomes (table S1).
Validation of Target GI-tract Survival Effector Moleculesby Mutagenesis
To validate the association of the expression level of specific
genes in L. plantarum with GI-tract survival, the 13 genes with the
highest ranking based on the criteria described in the Materials
and Methods section were targeted by genetic engineering (table 1),
aiming to improve GI-tract survival beyond the levels observed
with the wild-type strain. Therefore, the direction of the
Figure 3. Effect of medium components on GI-tract survival ofL. plantarum WCFS1. Box plots of NaCl and 60 min GI-tract survival oflogarithmically (A) and stationary (B) grown cultures and of pH and60 min GI-tract survival of stationary cells (C). Results are based on datafrom all fermentations used in this study (see fig. 2A). * P-value ,0.05compared with 0 mM NaCl (A and B) or pH 6.4 (C).doi:10.1371/journal.pone.0039053.g003
Figure 4. MDS plot of the eight best and the eight poorestsurviving L. plantarum WCFS1 cultures grown under differentgrowth conditions after GI-tract passage. Sample distances ofgood (black circles) and poor (grey circles) surviving cultures (see fig.2A). Classification is based on the transcriptomes of these cultures justbefore subjection to the GI-tract survival assay.doi:10.1371/journal.pone.0039053.g004
Genetic Biomarkers for L. plantarum GI Robustness
PLoS ONE | www.plosone.org 4 July 2012 | Volume 7 | Issue 7 | e39053

correlation between transcript intensity and survival in the GI-
tract assay determined whether a gene would be targeted for
overexpression (positive correlation, see fig. 5A for an example) or
gene-deletion (negative correlation, fig. 5B).
Genes targeted for sakacin-inducible overexpression were thrC,
lp_0149, hicD3, and lp_1357 (table 1). For folB overexpression, we
used a previously constructed mutant that overexpresses the entire
folB-folK-folE-folC2-xtp2-folP cluster [24,25]. Sakacin P induced
overexpression of the cytoplasmic hicD3 and thrC and the
downstream lp_2759 gene products could readily be confirmed
by SDS-PAGE analysis of cell-free extracts of induced cultures
(figure S1). In contrast, overproduction of the membrane-
anchored (lp_1357) and transmembrane proteins (lp_0148–0150)
were not distinguishable by SDS-PAGE (data not shown).
Although overexpression could only be demonstrated for two of
the genetic loci, we applied all overexpression strains to our GI-
tract assay. The constructed overexpression and gene deletion
mutants were grown until the logarithmic growth phase and
subjected to the GI-tract assay. The survival of the Sakacin P
induced overexpression mutants was anticipated to improve when
compared to a control strain harboring the empty induction
plasmid (fig. 6). Although not significant, the contrary seemed to
be the case, since the slight effects that were observed in some of
the experiments suggested that the expression of the cloned genes
reduced the survival capacity of these cells rather than improved.
In contrast, the L. plantarum Dpbp2A::cat, Dlp_1669::cat, and
DnapA3::cat mutants showed significantly improved survival in the
GI-tract assay, as compared to their parental strain (fig. 7). These
strains harbored disruptions in genes associated with poor survival
in gastric stress. Notably, we have combined the individual
mutants described here to construct Dpbp2A-DnapA3::cat and
DnapA3-Dlp_1669::cat. However, these double gene deletion
derivatives displayed robustness phenotypes comparable to the
single DnapA3::cat gene deletion derivative, indicating that the
positive effect on GI robustness of these mutations appeared not
cumulative (data not shown). Nevertheless, these results establish
the involvement of certain fermentation-condition dependent gene
products in GI survival.
Pbp2A is annotated as a penicillin-binding protein involved in
peptidoglycan biosynthesis, Lp_1669 is predicted to be a
transcription regulator, and NapA3 is homologous to Na+/H+
antiporters. To gain more insight in the mechanisms by which
these proteins influence robustness, growth of the parental strain
and the Dpbp2A::cat, Dlp_1669::cat, and DnapA3::cat derivatives was
monitored under standard- and stress-conditions. At 28uC in
complex culture medium (MRS), the growth rates of the mutants
did not differ from the wild-type, nor did the addition of H2O2 (1
to 5 mM), lysozyme (0.025 to 3.2 g/ml), or SDS (0.9 to 30 g/l)
induce differences in growth rate of the mutants compared with
the wild type strain. However, the presence of bile salts (10 to
Table 1. Candidate genes linked with GI-tract survival of L. plantarum selected for genetic engineering.
ORFa Name function
Subcellularlocalizationpredictionb
Correlation withhigh survivalc R2d Importancee KO/overf Straing
lp_1413 pbp2A transpeptidase-transglycosylase(penicillin binding protein 2A)
N-terminally anchored(No CS)
2 0.702 1.832 KO NZ3412CM
lp_2827 napA3 Na(+)/H(+) antiporter Multi-transmembrane 2 0.686 1.503 KO NZ3416CM
lp_1669 lp_1669 transcription regulator, AraC family Intracellular 2 0.601 1.156 KO NZ3417CM
lp_3398 pacL3 cation transporting P-type ATPase Multi-transmembrane 2 0.474 1.790 KO NZ3415CM
lp_1817 lp_1817 ribitol-5-phosphate 2-dehydrogenase (putative)
Intracellular 2 0.378 1.156 KO NZ3414CM
lp_2758 thrC threonine synthase Intracellular + 0.714 1.227 over pNZ3432h
lp_3299 folB dihydroneopterin aldolase Intracellular + 0.638 1.772 over pNZ7026i
lp_0149 lp_0149 ABC transporter, ATP-bindingprotein, Cobalt (orcobalamine)
Intracellular + 0.634 1.977 over pNZ3433j
lp_3297 folE GTP cyclohydrolase I Intracellular + 0.554 1.356 over pNZ7026i
lp_0148 lp_0148 ABC transporter, permease protein,Cobalt (or cobalamine)
Multi-transmembrane + 0.523 1.156 over pNZ3433j
lp_2349 hicD3 L-2-hydroxyisocaproatedehydrogenase
Intracellular + 0.441 1.001 over pNZ3431
lp_3296 folC2 folylpolyglutamate synthase/dihydrofolate synthase
Intracellular + 0.432 1.081 over pNZ7026i
lp_1357 lp_1357 extracellular protein, membrane-anchored (putative)
N-terminally anchored(No CS)
+ 0.233 1.001 over pNZ3430
aORF, open reading frame.bSubcellular localization prediction according to LocateP [54].c+, positive correlation; -, negative correlation.dR2 based on linear regression of transcript intensity and GI-tract survival of the eight best and eight worst surviving cultures (see fig. 2).eImportance according to random forest [45].fKO, knock out; over, overexpression.gL. plantarum KO strains with NZ number or L. plantarum strains harboring plasmids (pNZ number).hpNZ3432 contains thrC and lp_2759.ipNZ7026 contains folB-folK-folE-folC2-xtp2-folP.jpNZ3433 contains lp_0148, lp_0149, and lp_0150.doi:10.1371/journal.pone.0039053.t001
Genetic Biomarkers for L. plantarum GI Robustness
PLoS ONE | www.plosone.org 5 July 2012 | Volume 7 | Issue 7 | e39053

50 mM) in the culture medium reduced the maximum growth rate
of Dpbp2A::cat to 20% as compared to the parental strain (data not
shown). This result indicates that Pbp2A contributes to the survival
capacity of L. plantarum in low-pH, stomach like conditions, but
also improves bile tolerance, but not to tolerance to detergents in
general.
The addition of NaCl to the growth medium reduced the
growth rate of DnapA3::cat to 20% (400 mM) and 80% (1 M) of the
wild type (data not shown). As NapA3 is a Na+/H+ antiporter
which might be affected by extracellular pH, the growth of the
DnapA3::cat mutant was monitored under different starting pH
conditions (pH 4.6 to 6.4) in the presence and absence of NaCl
(300 mM). The growth rate of the mutant appeared unaltered
during growth in the absence of salt. Only the presence of NaCl
reduced the growth rate of DnapA3::cat under all measured
conditions (data not shown). These results support a role of this
function in salt tolerance, which in our experiments, appeared to
be independent of the pH.
Contrary toDnapA3::cat andDpbp2A::cat, a specific phenotype was
not established for the transcription regulator Lp_1669. To
elucidate the regulon associated with this regulator, the transcrip-
tome profile of the NZ3417CM (Dlp_1669::cat) strain was compared
to that of the wild-type strain grown in 26CDM [17] or MRS. The
results showed that the Lp_1669-deficient strain displayed enhanced
expression of genes belonging to the main functional class of cell
envelope associated functions, and more specifically to its subclass of
surface polysaccharides, lipopolysaccharides, and antigens. This
effect of the mutation was observed independent of the medium used
(fig. 8 and table S2 and S3). Analysis at the individual transcript level
revealed that the capsular polysaccharide (CPS) clusters cps2, cps3,
and cps4 were induced in the MRS-grown Lp_1669-deficient strain
as compared to the wildtype, suggesting that the regulatory function
Figure 5. Correlation of L. plantarum WCFS1 GI-tract survivaland transcript intensity of thrC (A) and pbp2A (B). The eight bestand eight worst fermentations (see fig. 2A) are ranked with increasingGI-tract survival. *Data was normalized to correct for between slidevariation [22]. R2 thrC = 0.71, R2 pbp2A = 0.70.doi:10.1371/journal.pone.0039053.g005
Figure 6. Relative GI-tract survival of L. plantarum mutantsoverexpressing genes potentially involved in GI-tract survival.Log10 CFU ml21 determination of mid-exponentially grown in batch L.plantarum mutants after 60 min gastric juice incubation (white bars)and subsequent 60 min pancreatic juice incubation (grey bars). Input isset at 0 Log10 CFU ml21. Empty vectors are pSIP411 (A) and pNZ7021(B). L. plantarum harboring pNZ3430 (over-lp_1357), pNZ3431 (over-hicD3), pNZ3432 (over-thrC+lp_2759), pNZ3433 (over-lp_0148,0150),and pNZ7026 (over-lp_3294,3299). Data presented is the average oftechnical sextuplicates (+ standard deviation).doi:10.1371/journal.pone.0039053.g006
Figure 7. Relative GI-tract survival of L. plantarum mutants withcat replacements of candidate genes involved in GI-tractsurvival. Log10 CFU ml21 determination of logarithmic (OD600 = 1.0)batch L. plantarum mutants after 60 min gastric juice incubation (whitebars) and subsequent 60 min pancreatic juice incubation (grey bars).Input is set at 0 Log10 CFU ml21. Dpbp2A::cat = L. plantarum NZ3412CM,D1669::cat = L. plantarum NZ3417CM, D1817::cat = L. plantarumNZ3414CM, DpacL3::cat = L. plantarum NZ3415CM, and DnapA3::cat = L.plantarum NZ3416CM. * P-value ,0.05, ** P-value ,0.01 compared withwild type (wt). Representative of two independent experiments, datapresented are averages of technical sextuplicates (+ standard devia-tion).doi:10.1371/journal.pone.0039053.g007
Genetic Biomarkers for L. plantarum GI Robustness
PLoS ONE | www.plosone.org 6 July 2012 | Volume 7 | Issue 7 | e39053

encoded by lp_1669 is involved, either directly or indirectly, in the
regulation of CPS biosynthesis. Notably, especially the expression of
the cps2 cluster was induced in 26CDM grown Lp1669 deficient
cells (table S2 and S3). Analysis of monosaccharide composition
revealed minor changes in CPS sugar composition of the Lp_1669-
deficient strain in comparison to the wild type strain (table 2).
Galactosamine was only detected in the mutant strain, whereas
arabinose was found only in the wild-type strain. Rhamnose and
glucosamine also tended to be slightly more abundant in the wild
type L. plantarum WCFS1. Moreover, the average molar mass of
Dlp_1669::cat strain-derived CPS was 1.5-fold higher compared to
the wild type (Table 2). This indicates that Lp_1669 seems to be
involved in subtle CPS modification, specifically in chain length
determination. These observations might also (partially) explain the
observed increased gastrointestinal survival of the L. plantarum
Lp_l669-deficient strain.
Discussion
This study demonstrates that the production method, medium
composition, and stage of growth strongly influenced the GI-
survival efficacy of L. plantarum WCFS1. Combining the fermen-
tation and survival data pinpointed to specific fermentation
conditions that may enhance robustness (low salt and low pH),
whereas genome association analysis of the transcriptome and
survival data revealed 13 genes potentially involved in GI-survival.
As reported previously [26], cells harvested from stationary
phase generally were more robust than logarithmically growing
cells, and in particular, those cells displayed enhanced survival in
gastric juice which overall had a dramatically larger impact on
survival compared to pancreatic juice. The influence of acidity
on GI-tract survival was also emphasized by the observation that
lowering the gastric juice pH by as little as 0.1 unit had a
pronounced impact on survival. Differences among bacterial
Figure 8. Regulatory network of Lp_1669 grown in 26CDM or MRS. Yellow rectangle nodes represent growth in 26CDM (left node) or inMRS (right node). Round nodes represent single genes with their corresponding lp_number, which is the number as annotated in the sequencedparental L. plantarum WCFS1 strain [16], green lines represent down-regulation, and red lines represent up-regulation of the gene compared to theparental strain. The colors of the round nodes represent the annotated main class. See figure S2 of the supplemented materials for the originalcytoscape file.doi:10.1371/journal.pone.0039053.g008
Genetic Biomarkers for L. plantarum GI Robustness
PLoS ONE | www.plosone.org 7 July 2012 | Volume 7 | Issue 7 | e39053

species in their sensitivity to gastric and intestinal secretions have
been observed before [27,28,29] and a higher sensitivity for acid
than bile stress was also noted for L. rhamnosus, as well as for
other L. plantarum strains [30,31]. The finding that exposure to
low pH during growth enhances GI-survival is in agreement with
earlier observations that pre-adaptation to sublethal stress
conditions enhances the subsequent robustness of bacteria to
lethal stress conditions [9], supporting the suitability of the
fermentation genomics platform and bioinformatics tools em-
ployed in this study and the accompanying paper by Bron et al.
For salt it is known that it can protect against, but also increase
susceptibility to, other stresses [32,33]. Moreover, these results
clearly establish that fermentation conditions have a major
impact on the GI-tract associated stress tolerance of bacterial
cultures, and that specifically mild salt stress and lower pH
adaptation may elicit adaptive responses that reduce and support
such stress tolerance, respectively.
Overexpression and gene deletion derivatives of the parental
strain were constructed, depending on the direction of the
predicted correlation to GI-tract survival and aiming to enhance
this trait. Three of the five constructed gene deletion derivatives
displayed enhanced GI-tract survival, confirming the predicted
role of the targeted genes. By contrast, none of the overexpression
derivatives displayed improved robustness behavior in the GI-tract
assay, and all had survival characteristics that were virtually
identical to those of the parental strain. A possible explanation for
these observations may be found in the potential disruption of a
gene-regulatory network by the deletion of a single gene in that
network, while overexpression of a single element from a
complementary gene-function network may not provide the same
effect as the enhanced expression of all elements in the network.
The fact that 3 out of 5 gene deletion derivatives displayed
enhanced survival is in line with earlier observations [21,22,23]
and can be explained by the fact that the random forest algorithm
also leads to the identification of non-causal relationships,
reiterating the importance of follow-up mutagenesis approaches
to establish a definite role for candidate biomarkers identified with
this algorithm.
The 3 genes for which the importance in GI-tract survival
could be confirmed by gene deletion encode a AraC family
regulator (Lp_1669), a Na+/H+ antiporter; NapA3, and a
penicillin binding protein; Pbp2A. Notably, all three proteins
are associated with cell wall modification and transport, and their
mutation may lead to cell envelope modulation. This finding per
se, may not be qualified as surprising, because the cell envelope
is the first line of defense against stresses [34]. Moreover, the
resistance to acid and adaptation to bile stress in L. plantarum
WCFS1 has been associated with membrane integrity and cell
envelope modifications, respectively [35,36]. The AraC family of
regulators to which Lp_1669 belongs [16] is characterized by
transcriptional regulators that act mostly as activators. However,
in some cases these regulators serve as repressors of transcription
or as both activators and repressors [37]. The observed effect of
Lp_1669 on GI-tract survival is likely to be indirect, possibly via
CPS remodeling, because the Lp_1669-deficient strain had CPS
with a higher molar mass that might result in a thicker CPS layer
around the cells. It has been demonstrated that the presence of
EPS/CPS improved the in vivo GI survival of L. rhamnosus GG
[38]. The Na+/H+ antiporter NapA3 might affect GI survival via
a role in pH homeostasis. Because disruption of napA3 improved
GI-tract survival, it seems likely that NapA3 exports sodium ions
associated with the influx of protons, thereby decreasing its
internal pH and proton motive force due to the acid stomach
conditions. This is also in line with our observation that the gene
deletion derivative is only reduced during growth in the presence
of sodium salts. Finally, pbp2A encodes the penicillin binding
protein 2A which is annotated to be involved in peptidoglycan
biosynthesis [16]. Disruption of pbp2A improved the acid stomach
condition survival, while it decreased the growth rate in the
presence of bile. Noteworthy in this respect is the finding that the
compositions of peptidoglycan directly affects the integrity of the
cells and can influence the acid- and bile-tolerance [9,39,40,41].
Moreover, transcriptome analysis of L. acidophilus NCFM and L.
plantarum WCFS1 demonstrated that many genes related to cell
membrane and peptidoglycan biosynthesis displayed altered
expression profiles during exposure to bile [39,42]. An increased
acid sensitivity by the inactivation of penicillin binding proteins is
found in Lactococcus lactis and L. reuteri [9,40]. However, we found
the deletion of pbp2A improves the GI-tract survival, which
suggests that disruptions in peptidoglycan biosynthesis genes
could either improve or decrease the survival of probiotics,
reiterating the general concept of subtle inter-strain and species
differences in survival mechanisms.
In conclusion, this study demonstrated that fermentation
conditions have a large influence on the GI-tract survival of L.
plantarum. We showed that transcriptome-trait matching enables
the identification of genetic loci involved in gastrointestinal
robustness and this approach can also be employed to rationally
design fermentation and process conditions that aim for the
production of probiotics with improved GI survival and conse-
quently have a higher potential to achieve their desired health-
beneficial effects on the consumer.
Materials and Methods
GI-tract Assay and Correlation to Transcriptome DataCells were harvested from the fermentation-genomics plat-
form at OD600 = 1.0 for full-genome transcriptome profiling (see
accompanying paper by Bron et al.), while the GI-tract survival
was determined in the same cells, as well as in cells that were
harvested 25 h after inoculation. One set of fermentations (F19–
F24, see accompanying paper by Bron et al.) was excluded from
the data analysis as the GI-tract survival data appeared
unreliable, likely caused by minor deviations in the pH of the
batch of GJ applied which is known to heavily influence GI
survival. For GI-tract survival analysis, cultures were washed
with prewarmed (37uC) PBS and resuspended in prewarmed
(37uC) filter sterilized gastric juice [53 mM NaCl, 15 mM KCl,
Table 2. Molar mass and sugar composition of CPS isolatedfrom L. plantarum WCFS1 and NZ3417CM (Dlp_1669::cat).
Strain WCFS1 Dlp_1669::cat
Total molar mass (kg/mol) 20 (61.4) 30 (61.5)
Sugar (% of total sugars)a
Rhamnose 3.2 2.6
Galactosamine ND 1.3
Arabinose 0.5 ND
Glucosamine 3.7 2.8
Galactose 12.6 12.8
Glucose 27.8 26.4
Galacturonic acid 52.3 54.1
aND is not detected.doi:10.1371/journal.pone.0039053.t002
Genetic Biomarkers for L. plantarum GI Robustness
PLoS ONE | www.plosone.org 8 July 2012 | Volume 7 | Issue 7 | e39053

5 mM Na2CO3, 1 mM CaCl2, 0.1 mg ml21 lipase (Fluka; de-
rived from Aspergillus niger), and 1.2 mg ml21 pepsin (Sigma;
derived from porcine) that had a pH adjusted to 2.4 with HCl
(logarithmic cells) or 2.3 (stationary cells)]. The gastric juice
enzymes were added immediately prior to the treatment. After
60 min incubation while rotating at 10 rpm in a Hybridization
oven/shaker (Amersham pharmacia biotech, Little Chalfont,
UK) at 37uC, the cultures were neutralized to pH 6.5 with
0.5 M NaHCO3, and prewarmed (37uC) pancreatic juice
[85 mM NaCl, 5 mM KH2PO4, 2 mM Na2HPO4,
10 mM NaHCO3, 30 mg ml21 pancreatin (Sigma; derived from
porcine stomach) and bile acid mixture (latter two components
were added fresh to pancreatic juice immediately prior to the
treatment)] was added, followed by continued incubation for
another 60 min (agitation at 10 rpm, 37uC). The bile acid
mixture consisted of 3.0 mM (final concentration in assay)
sodium glycocholate hydrate, 1.3 mM sodium glycodeoxycho-
late, 2.4 mM sodium glycochenodeoxycholate, 1.0 mM tauro-
cholic acid sodium salt hydrate, 0.4 mM sodium taurodeox-
ycholate hydrate and 1.0 mM sodium taurochenodeoxycholate
to mimic human bile components and concentrations [43].
Preceding and during GI-tract assay incubation (t = 0, 20, 40,
60, 90, and 120), samples were taken for colony forming unit
(CFU) enumeration by spot-plating [44]. A reduction of 8 logs
could be detected with this method. Relative GI-tract survival of
the different cultures was expressed as the fraction of the
corresponding input numbers of viable cells (t = 0 was set at
1.00). The transcriptome and GI-tract survival data are
available in FermDB (www.cmbi.ru.nl/fermdb).
The initial list of genes predicted by the random forest
algorithm [45] (see the accompanying paper by Bron et al. for
details on correlation analyses) to be associated with GI-tract
survival was further refined by application of several selection
criteria that are based on transcript ranking. Firstly, only
transcripts with an importance factor higher than 1 according to
the random forest algorithm were selected for further analysis.
Secondly, the quantitative correlation of individual transcripts with
the survival rate observed in individual cultures was evaluated,
selecting those transcripts (genes) that had the highest quantitative
correlation with survival (expressed in R2 in table S1, see figure 5
for two examples). Lastly, genes encoding prophage associated
functions that are typically hypervariable among L. plantarum
strains were discarded [13,20]. The remaining transcripts and
their associated genes (table 1) were considered to have the
strongest correlation with the measured gastric juice tolerance and
were therefore selected for validation by gene deletion or
overexpression.
Deletion Mutant ConstructionGene deletion mutants were constructed using the mutagenesis
vector pNZ5319 according to Lambert et al. [19]. The L. plantarum
WCFS1 pbp2A, lp_1669, lp_1818, pacL3, and napA3 genes were
replaced with a lox66-P32-cat-lox71 cassette resulting in strains
NZ3412CM (Dpbp2A::cat), NZ3417CM (Dlp_1669::cat), NZ3414CM
(Dlp_1817::cat), NZ3415CM (DpacL::cat), and NZ3416CM (DnapA3::-
cat), respectively. Primer sequences used to construct the gene-
targeted knock-out vectors for L. plantarum WCFS1 are provided in
table S4. In short, upstream and downstream flanking regions (left
flank, LF; right flank, RF, respectively) of the target genes (i.e.,
pbp2A, lp_1669, lp_1817, pacL3, and napA3) were amplified with
primer pair combinations as listed in table S5. Primers at the 39-
end of the upstream and 59-end of the downstream flanking
regions (A3, A4, B3, B4, C3, C4, D3, D4, E3, and E4 ) were
extended with an overlap-sequence complementary to the 59 and
39 end of the lox66-P32-cat-lox71 cassette (amplified with primers I
and J [46]), to enable knock-out construction by a Splicing by
overlap extension (SOE) PCR [47] with primer pairs as listed in
table S5. The obtained (SOE-ing) amplicons were blunt-ligated
into Ecl136II-SwaI digested pNZ5319 [19] resulting in plasmids
pNZ3412, pNZ3417, pNZ3414, pNZ3415, and pNZ3416 (see
table 3). Escherichia coli was used as an intermediate cloning host
and after introduction of the mutagenesis plasmids into competent
L. plantarum WCFS1, cells were plated on MRS containing
10 mg ml21 chloramphenicol. After 48 h, grown colonies were
plated on MRS with and without 30 mg ml21 erythromycin.
Colonies from each mutant displaying the anticipated erythromy-
cin sensitive phenotype were selected for colony-PCR using primer
pairs as listed in table S6. Mutant colonies with the expected
genetic organization were selected for each of the knock-out target
loci; NZ3412CM (Dpbp2A::cat), NZ3417CM (Dlp_1669::cat),
NZ3414CM (Dlp_1817::cat), NZ3415CM (DpacL::cat) and
NZ3416CM (DnapA3::cat). The L. plantarum WCFS1 pbp2A plus
napA3 and napA3 plus lp_1669 double-mutants were constructed in
the NZ3412CM (Dpbp2A::cat) and NZ3416CM (DnapA3::cat) back-
ground, respectively, in a two-step procedure. Firstly, strains
NZ3412 (Dpbp2A) and NZ3416 (DnapA3) were constructed by
excision of the lox66-P32-cat-lox71 cassette by transient expression
of the Cre resolvase enzyme from pNZ5348 according to methods
described by Lambert et al. [19]. In these deletion mutant strains,
pNZ3416 and pNZ3417 were introduced and double mutant
strains were selected using the approach described above, resulting
in the isolation of strains NZ3419CM (Dpbp2A-DnapA3::cat) and
NZ3418CM (DnapA3-Dlp_1669::cat), respectively (table 3).
Overexpression Mutant Construction and SDS-PAGEAnalysis
Gene overexpression mutants were constructed using the
expression vector pSIP411 [48]. For the candidate genes selected
for overexpression that were part of a predicted operon [49], the
whole operon was cloned in the sakacin induction vector (table 1).
Primers were designed (table S5) to introduce a restriction enzyme
site for cloning the target gene(s) into the expression vector
pSIP411 at the NcoI site. The lp_1357 and thrC+lp_2759
overexpression mutants were designed with BspHI site, which
has compatible ends with NcoI site. The target gene(s) were
amplified by PCR using corresponding primers for each mutant
(F1/F2, G1/G2, H1/H2 and I1/I2 for lp_1357, lp_2349,
thrC+lp_2759, and lp_0148,0150 mutants, respectively). The
reactions were carried out with KOD polymerase (Novagen,
Darmstadt, Germany) according to the instructions of the
manufacturer. The purified PCR products were digested by
restriction enzymes (Invitrogen, Molecular probes, Inc, USA) for
which sites were introduced in the primers (see table S4) and
cloned in NcoI-SmaI digested pSIP411. Ligation mixtures were
transformed to E. coli, and re-isolated from primary transformants.
Correctly assembled overexpression plasmids were identified by
PCR, restriction and sequence analysis. Re-isolated plasmids were
propagated into L. plantarum WCFS1 and transformants were
selected on MRS containing 30 mg?ml21 erythromycin (table 3).
For protein analysis of the overexpression mutants, the
induction and sample preparation procedures were modified
from the description by Sørvig et al. [48]. The 19-amino-acid
inducing peptide (of Met-Ala-Gly-Asn-Ser-Ser-Asn-Phe-Ile-His-
Lys-Ile-Lys-Gln-Ile-Phe-Thr-His-Arg [50]) was custom-synthe-
sized by BACHEM (Budendorf, Switzerland). The inducing
peptide was dissolved in degassed water, as recommended by
BACHEM to avoid oxidation of the peptides. The overnight
cultures of the overexpression strains were diluted 50-fold and
Genetic Biomarkers for L. plantarum GI Robustness
PLoS ONE | www.plosone.org 9 July 2012 | Volume 7 | Issue 7 | e39053

then incubated at 37uC. After OD600 had reached 0.3, the
inducing peptide was added to the cultures at varying
concentrations of 0, 0.1, 1, 10, and 50 ng/ml. Incubation was
continued at 37uC for another 4 h until the OD600 had reached
approximately 1.8. Bacterial cells were collected by centrifuga-
tion at 5,2006g for 10 min, followed by resuspension of the cell
pellet in 50 mM Sodium-phosphate buffer pH 7. The cells were
disrupted with 1 g zirconium beads by using a FastPrepTM
(Qbiogene Inc, Cedex, France). After the disruption, the
samples were centrifuged 5 min at 20,8006g to obtain cell-free
extracts for analysis by SDS-PAGE.
DNA Microarray Analysis and Data VisualizationDNA microarray analysis were performed to compare global
transcriptome profiles of NZ3417CM (Dlp_1669::cat) and the wild-
type. RNA isolation from L. plantarum, subsequent cDNA synthesis
Table 3. Strains and plasmids used in this study.
Strain or plasmid Relevant feature(s)a Reference
Strains
L. plantarum
WCFS1 Single-colony isolate of L. plantarum NCIMB8826 [16]
NZ3412CM Derivative of WCFS1 containing a lox66-P32-cat-lox71 replacement of pbp2A (Dpbp2A::cat) This work
NZ3412 Derivative of WCFS1 containing a lox72 replacement of pbp2A (Dpbp2A) This work
NZ3417CM Derivative of WCFS1 containing a lox66-P32-cat-lox71 replacement of lp_1669 (Dlp_1669::cat) This work
NZ3414CM Derivative of WCFS1 containing a lox66-P32-cat-lox71 replacement of lp_1817 (D lp_1817::cat) This work
NZ3415CM Derivative of WCFS1 containing a lox66-P32-cat-lox71 replacement of pacL3 (D pacL3::cat) This work
NZ3416CM Derivative of WCFS1 containing a lox66-P32-cat-lox71 replacement of napA3 (DnapA3::cat) This work
NZ3416 Derivative of WCFS1 containing a lox72 replacement of napA3 (DnapA3) This work
NZ3419CM Derivative of NZ3412 containing a lox66-P32-cat-lox71 replacement of napA3 (Dpbp2A-DnapA3::cat) This work
NZ3418CM Derivative of NZ3416 containing a lox66-P32-cat-lox71 replacement of napA3 (DnapA3-Dlp_1669::cat) This work
SIP411 Derivative of WCFS1 harboring the pSIP411 plasmid This work
SIP411B Derivative of WCFS1 harboring the pSIP411B plasmid (empty vector) This work
NZ3430 Derivative of WCFS1 harboring the pNZ3430 plasmid (over-lp_1357) This work
NZ3431 Derivative of WCFS1 harboring the pNZ3431 plasmid (over-hicD3) This work
NZ3432 Derivative of WCFS1 harboring the pNZ3432 plasmid (over-thrC and lp_2759) This work
NZ3433 Derivative of WCFS1 harboring the pNZ3433 plasmid (over-lp_0148,0150) This work
NZ7021 Derivative of WCFS1 harboring the pNZ2021 plasmid (empty vector) [24]
NZ7026 Derivative of WCFS1 harboring the pNZ2026 plasmid (over-folB, folP, folk, folE, xtp2, and folC2) [24]
E. coli
TOP-10 Cloning host; F- mcrA D(mrr-hsdRMS-mcrBC) w80lacZDM15 DlacX74 nupG recA1 araD139 D(ara-leu)7697 galE15 galK16 rpsL(Strr) endA1 l-
Invitrogen
MC1061 Cloning host; araD139 D(araA-leu)7697 DlacX74 galK16 galE15(GalS) l- e14- mcrA0 relA1 rpsL150(strr)spoT1 mcrB1 hsdR2
[55]
Plasmids
pNZ5319 Cmr Emr; for multiple gene replacements in Gram-positive bacteria [19]
pNZ3412 Cmr Emr; pNZ5319 derivative containing homologous regions up- and downstream of WCFS1 pbp2A This work
pNZ3417 Cmr Emr; pNZ5319 derivative containing homologous regions up- and downstream of WCFS1 lp_1669 This work
pNZ3414 Cmr Emr; pNZ5319 derivative containing homologous regions up- and downstream of WCFS1 lp_1817 This work
pNZ3415 Cmr Emr; pNZ5319 derivative containing homologous regions up- and downstream of WCFS1 pacL3 This work
pNZ3416 Cmr Emr; pNZ5319 derivative containing homologous regions up- and downstream of WCFS1 napA3 This work
pSIP411 Emr; cloning vector [48]
pSIP411B Emr; pSIP11 derivative without the gusA gene (empty vector) This work
pNZ3430 Emr; pSIP411 derivative containing the lp_1357 gene of WCFS1 This work
pNZ3431 Emr; pSIP411 derivative containing the hicD3 gene of WCFS1 This work
pNZ3432 Emr; pSIP411 derivative containing the thrC and lp_2759 operon of WCFS1 This work
pNZ3433 Emr; pSIP411 derivative containing the lp_0148,0150 operon of WCFS1 This work
pNZ7021 Cmr; (empty vector) [24]
pNZ7026 Cmr; pNZ7021 derivative containing the folB, folP, folk, folE, xtp2, and folC2 gene cluster of WCFS1 [24]
pNZ5348 Emr; containing cre under the control of the pcrA (lp_1144) promoter [19]
aStrr, streptomycin resistant; Cmr chloramphenicol resistant; Emr, erythromycin resistant.doi:10.1371/journal.pone.0039053.t003
Genetic Biomarkers for L. plantarum GI Robustness
PLoS ONE | www.plosone.org 10 July 2012 | Volume 7 | Issue 7 | e39053

and indirect labeling, as well as DNA microarray hybridizations
were performed as described in the accompanying paper by Bron
et al. The hybridization scheme is presented in figure S3. Genes of
the Lp_1669 regulon with FDR-adjusted p-values less than 0.05
together with a fold-change higher than 2.0 or lower than 0.5 were
considered to be significantly differently expressed. All microarray
data is MIAME compliant and is available in the GEO database
under accession number GSE31254. The biomolecular interaction
network of the Lp_1669 regulon in 26 CDM and MRS was
visualised using the Cytoscape software (version 2.8.1) [51], and
the Biological Networks Gene Ontology (BiNGO) tool [52] was
employed to detect significantly overrepresented categories in the
regulon of Lp_1669. See the accompanying paper by Bron et al.
for details.
Phenotypic Assays of Mutant StrainsGene deletion mutants were analyzed for their gastrointestinal
survival characteristics in a procedure identical to that described
for the wild-type (see above). To evaluate the relative GI-tract
survival of the overexpression mutants, the mutant strain SIP411B
(empty vector) and the overexpression mutants were sakacin-
induced (50 ng/ml) (see above). Additionally, to measure the
relative GI-tract survival of the folate overexpression strain, strains
NZ7021 (empty vector) and NZ7026 (folate overproducing strain)
[25] were inoculated at OD600 = 0.1 in MRS containing 80 mg/
ml chloramphenicol and 0 or 10 mg/ml p-aminobenzoic acid
(pABA) according to Wegkamp et al. [24], grown at 37uC until
OD600 was 1.0, and subjected to the GI-tract survival assay. To
evaluate relative growth efficiency of the deletion mutants, the
parental strain (WCFS1) and mutant strains NZ3412CM (Dpbp2A::-
cat), NZ3417CM (Dlp_1669::cat), and NZ3416CM (DnapA3::cat) were
inoculated at OD600 = 0.1 in 96-wells plates and incubated in
MRS broth at 28uC. OD600 of the cultures was monitored
spectophotometrically (GENios, Tecan Austria GmbH, Grodig,
Austria).
Capsular Polysaccharide Isolation and DeterminationCapsular polysaccharide (CPS) was purified and chain lengths
and sugar composition were determined essentially as described
before [53]. Briefly, 500 ml cultures of L. plantarum WCFS1 and
NZ3417CM (Dlp_1669::cat) were grown in 26CDM at 37uC until
stationary phase (25 h). After 1 h incubation at 55uC, the cells
were separated from the CPS containing growth medium by
centrifugation for 15 min (60006g) and to prevent overgrowth
during dialysis, erythromicine was added to the supernatant to a
final concentration of 10 mg/ml. A dialyzing tube 12–1400 Da
(Fisher Scientific) was prepared by boiling twice 2% NaHCO3/
2 mM EDTA, and once in reverse osmosis water. After overnight
dialysis against running tap water followed by 4 h dialysis using
reverse osmosis water, the samples were freeze-dried and stored at
220uC until further analysis.
The samples were dissolved in eluent (100 mM
NaNO3+0.02% NaN3), filtered over 0.2 mm, and placed in a
thermally controlled sample holder at 10uC and 200 ml was
injected (model 231 Bio, Gilson) on the columns connected in
series and remained at 35uC with a temperature control module
(Waters, Milford, USA) to perform size exclusion chromatogra-
phy (SEC) [TSK gel PWXL guard column, 6.0 mm64.0 cm,
TSK gel G6000 PWXL analytical column, 7.8 mm630 cm,
13.0 mm and TSK gel G5000 PWXL analytical column,
7.8 mm630 cm, 10 mm (TosoHaas, King of Prussio, USA)].
Light scattering was measured at 632.8 nm at 15 angles
between 32u and 144u (DAWN DSP-F, Wyatt Technologies,
Santa Barbara, USA). UV absorption was measured at 280 nm
(CD-1595, Jasco, de Meern, The Netherlands) to detect
proteins. The specific viscosity was measured with a viscosity
detector (ViscoStar, Wyatt Technologies, Santa Barbara, USA)
at 35uC and sample concentration was measured by refractive
index detection, held at a fixed temperature of 35uC (ERC-
7510, Erma Optical Works, Tokyo, Japan).
During the analysis with SEC the polysaccharide peak was
collected (2 min60.5 mL/min = 1 mL). The acid hydrolyses of
the collected polysaccharide was carried out for 75 min at
120uC with 2 M trifluoro acetic acid under nitrogen. Following
hydrolyses, the solutions were dried overnight under vacuum
and dissolved in water. High Performance Anion Exchange
Chromatography with Pulsed Amperometric Detection
(HPAEC-PAD) on a gold electrode was used for the quantita-
tive analyses of the monosaccharides rhamnose, galactosamine,
arabinose, glucosamine, galactose, glucose, mannose, xylose,
galacturonic acid, and glucuronic acid. The analyses were
performed with a 600E System controller pump (Waters,
Milford, USA) with a helium degassing unit and a model 400
EC detector (EG&G, Albuquerque, USA). With a 717
autosampler (Waters, Milford, USA), 20 ml of the sample was
injected on a Dionex Carbopac PA-1, 25064 mm (10–32),
column thermostated at 30uC. The monosaccharides were
eluted at a flow rate of 1.0 mL/min. The monosaccharides
were eluted isocratic with 16 mM sodium hydroxide, followed
by the elution of the acid monosaccharides starting at 20 min
with a linear gradient to 200 mM sodium hydroxide +500 mM
sodium acetate in 20 minutes. Data analysis was done with
Dionex Chromeleon software version 6.80. Quantitative analy-
ses were carried out using standard solutions of the monosac-
charides (Sigma-Aldrich, St. Louis, USA).
Supporting Information
Figure S1 SDS-PAGE of cell-free extracts logarithmic L.plantarum strains overexpressing hicD3 (lp_2349) andoverexpressing thrC (lp_2758) and lp_2759. The arrows
indicate protein bands increasing with increasing amounts of
Sakacin P (inducing peptide, IP). Empty vector = pSIP411B. L.
plantarum harboring pNZ3431 (over-hicD3), and pNZ3432 (over-
thrC+lp_2759). Marker sizes are indicated in kDalton (kDa).
(TIF)
Figure S2 Cytoscape version of figure 8; regulatorynetwork of Lp_1669 grown in 26 CDM or MRS. Yellow
rectangle nodes represent growth in 26 CDM (left node) or in
MRS (right node). Round nodes represent single genes with their
corresponding lp_number, which is the number as annotated in
the sequenced parental L. plantarum WCFS1 strain [16], green lines
represent down-regulation, and red lines represent up-regulation
of the gene compared to the parental strain. The colors of the
round nodes represent the annotated main class.
(CYS)
Figure S3 Lp_1669 regulon hybridization scheme. Tail
and head of the arrow represent Cy3 and Cy5 labeling,
respectively.
(TIF)
Table S1 Candidate genes associated with GI-tractsurvival of L. plantarum WCFS1.
(DOCX)
Table S2 Differentially regulated genes in NZ3417CM
(Dlp_1669::cat) grown in 26CDM.
(DOCX)
Genetic Biomarkers for L. plantarum GI Robustness
PLoS ONE | www.plosone.org 11 July 2012 | Volume 7 | Issue 7 | e39053

Table S3 Differentially regulated genes in NZ3417CM
(Dlp_1669::cat) grown in MRS.
(DOCX)
Table S4 Primers used in this study.
(DOCX)
Table S5 Primer pair combinations used for LF and RFamplification and for the SOE step of the deletionmutants.
(DOCX)
Table S6 Primer pair combinations used for eachdeletion mutant to confirm the correct integration inthe genome.
(DOCX)
Acknowledgments
We thank Roger Bongers, Anne Wiersma, and Guido Staring (NIZO food
research, Ede, The Netherlands) for excellent technical assistance, Lex
Overmars (Radboud University Nijmegen Medical Centre, Nijmegen, The
Netherlands) for extending the FermDB database to allow inclusion of our
gastrointestinal survival data, and Yu Zhao (Wageningen University and
Research Centre, Wageningen, The Netherlands) for performing the
phenotypic assays. We acknowledge the managerial activities executed by
Dr. Paul de Vos (University Medical Centre Groningen, The Netherlands),
who was the project leader of this project.
Author Contributions
Conceived and designed the experiments: HvB-vdV MW MLM PAB MK.
Performed the experiments: HvB-vdV IL. Analyzed the data: HvB-vdV IL
MW PAB MK. Wrote the paper: HvB-vdV IL MW MLM PAB MK.
References
1. FAO/WHO (2001) Evaluation of health and nutritional properties of powder
milk with live lactic acid bacteria. Report of FAO/WHO expert consultation 1–
4 October.
2. Marco ML, Pavan S, Kleerebezem M (2006) Towards understanding molecular
modes of probiotic action. Curr Opin Biotechnol 17: 204–210.
3. Lebeer S, Vanderleyden J, De Keersmaecker SC (2010) Host interactions of
probiotic bacterial surface molecules: comparison with commensals and
pathogens. Nat Rev Microbiol 8: 171–184.
4. Bron PA, van Baarlen P, Kleerebezem M (2012) Emerging molecular insights
into the interaction between probiotics and the host intestinal mucosa. Nat Rev
Microbiol 10: 66–78.
5. Ma D, Forsythe P, Bienenstock J (2004) Live Lactobacillus reuteri is essential for the
inhibitory effect on tumor necrosis factor alpha-induced interleukin-8 expression.
Infect Immun 72: 5308–5314.
6. Gobbetti M, Cagno RD, De Angelis M (2010) Functional microorganisms for
functional food quality. Crit Rev Food Sci Nutr 50: 716–727.
7. Corcoran BM, Stanton C, Fitzgerald G, Ross RP (2008) Life under stress: The
probiotic stress response and how it may be manipulated. Current Pharmaceu-
tical Design 14: 1382–1399.
8. van Bokhorst-van de Veen H, Bron PA, Wels M, Kleerebezem M (2011)
Engineering robust lactic acid bacteria. In: Tsakalidou E, Papadimitriou K,
editors. Stress Responses of Lactic Acid Bacteria: Springer US. 369–394.
9. van de Guchte M, Serror P, Chervaux C, Smokvina T, Ehrlich SD, et al. (2002)
Stress responses in lactic acid bacteria. Antonie Van Leeuwenhoek 82: 187–216.
10. Watson D, Sleator RD, Hill C, Gahan CG (2008) Enhancing bile tolerance
improves survival and persistence of Bifidobacterium and Lactococcus in the murine
gastrointestinal tract. BMC Microbiol 8: 176.
11. Begley M, Gahan CG, Hill C (2005) The interaction between bacteria and bile.
FEMS Microbiol Rev 29: 625–651.
12. Weckx S, Van der Meulen R, Allemeersch J, Huys G, Vandamme P, et al.
(2010) Community dynamics of bacteria in sourdough fermentations as revealed
by their metatranscriptome. Appl Environ Microbiol 76: 5402–5408.
13. Siezen RJ, Tzeneva VA, Castioni A, Wels M, Phan HT, et al. (2010) Phenotypic
and genomic diversity of Lactobacillus plantarum strains isolated from various
environmental niches. Environ Microbiol 12: 758–773.
14. Ahrne S, Nobaek S, Jeppsson B, Adlerberth I, Wold AE, et al. (1998) The
normal Lactobacillus flora of healthy human rectal and oral mucosa. J Appl
Microbiol 85: 88–94.
15. Vesa T, Pochart P, Marteau P (2000) Pharmacokinetics of Lactobacillus plantarum
NCIMB 8826, Lactobacillus fermentum KLD, and Lactococcus lactis MG 1363 in the
human gastrointestinal tract. Aliment Pharmacol Ther 14: 823–828.
16. Kleerebezem M, Boekhorst J, van Kranenburg R, Molenaar D, Kuipers OP, et
al. (2003) Complete genome sequence of Lactobacillus plantarum WCFS1. Proc
Natl Acad Sci U S A 100: 1990–1995.
17. Teusink B, Wiersma A, Molenaar D, Francke C, de Vos WM, et al. (2006)
Analysis of growth of Lactobacillus plantarum WCFS1 on a complex medium using
a genome-scale metabolic model. J Biol Chem 281: 40041–40048.
18. Teusink B, van Enckevort FH, Francke C, Wiersma A, Wegkamp A, et al. (2005)
In silico reconstruction of the metabolic pathways of Lactobacillus plantarum:
comparing predictions of nutrient requirements with those from growth
experiments. Appl Environ Microbiol 71: 7253–7262.
19. Lambert JM, Bongers RS, Kleerebezem M (2007) Cre-lox-based system for
multiple gene deletions and selectable-marker removal in Lactobacillus plantarum.
Appl Environ Microbiol 73: 1126–1135.
20. Molenaar D, Bringel F, Schuren FH, de Vos WM, Siezen RJ, et al. (2005)
Exploring Lactobacillus plantarum genome diversity by using microarrays.
J Bacteriol 187: 6119–6127.
21. Pretzer G, Snel J, Molenaar D, Wiersma A, Bron PA, et al. (2005) Biodiversity-
based identification and functional characterization of the mannose-specific
adhesin of Lactobacillus plantarum. J Bacteriol 187: 6128–6136.
22. Meijerink M, van Hemert S, Taverne N, Wels M, de Vos P, et al. (2010)
Identification of genetic loci in Lactobacillus plantarum that modulate the immune
response of dendritic cells using comparative genome hybridization. PLoS ONE
5: e10632.
23. van Hemert S, Meijerink M, Molenaar D, Bron PA, de Vos P, et al. (2010)
Identification of Lactobacillus plantarum genes modulating the cytokine response of
human peripheral blood mononuclear cells. BMC Microbiol 10: 293.
24. Wegkamp A, de Vos WM, Smid EJ (2009) Folate overproduction in Lactobacillus
plantarum WCFS1 causes methotrexate resistance. FEMS Microbiol Lett 297:
261–265.
25. Wegkamp A (2008) Modulation of folate production in lactic acid bacteria.
Wageningen: Wageningen University, The Netherlands.
26. Corcoran BM, Ross RP, Fitzgerald GF, Stanton C (2004) Comparative survival
of probiotic lactobacilli spray-dried in the presence of prebiotic substances. J Appl
Microbiol 96: 1024–1039.
27. Marteau P, Minekus M, Havenaar R, Veld J (1997) Survival of lactic acid
bacteria in a dynamic model of the stomach and small intestine: Validation and
the effects of bile. Journal of Dairy Science 80: 1031–1037.
28. Jacobsen CN, Rosenfeldt Nielsen V, Hayford AE, Moller PL, Michaelsen KF, et
al. (1999) Screening of probiotic activities of forty-seven strains of Lactobacillus
spp. by in vitro techniques and evaluation of the colonization ability of five
selected strains in humans. Appl Environ Microbiol 65: 4949–4956.
29. Matto J, Malinen E, Suihko ML, Alander M, Palva A, et al. (2004) Genetic
heterogeneity and functional properties of intestinal bifidobacteria. J Appl
Microbiol 97: 459–470.
30. Succi M, Tremonte P, Reale A, Sorrentino E, Grazia L, et al. (2005) Bile salt
and acid tolerance of Lactobacillus rhamnosus strains isolated from Parmigiano
Reggiano cheese. FEMS Microbiol Lett 244: 129–137.
31. Georgieva RN, Iliev IN, Chipeva VA, Dimitonova SP, Samelis J, et al. (2008)
Identification and in vitro characterisation of Lactobacillus plantarum strains from
artisanal Bulgarian white brined cheeses. J Basic Microbiol 48: 234–244.
32. Prasad J, McJarrow P, Gopal P (2003) Heat and osmotic stress responses of
probiotic Lactobacillus rhamnosus HN001 (DR20) in relation to viability after
drying. Appl Environ Microbiol 69: 917–925.
33. Kim WS, Perl L, Park JH, Tandianus JE, Dunn NW (2001) Assessment of stress
response of the probiotic Lactobacillus acidophilus. Curr Microbiol 43: 346–350.
34. Jordan S, Hutchings MI, Mascher T (2008) Cell envelope stress response in
Gram-positive bacteria. FEMS Microbiol Rev 32: 107–146.
35. Bron PA, Marco M, Hoffer SM, Van Mullekom E, de Vos WM, et al. (2004)
Genetic characterization of the bile salt response in Lactobacillus plantarum and
analysis of responsive promoters in vitro and in situ in the gastrointestinal tract.
J Bacteriol 186: 7829–7835.
36. Ingham CJ, Beerthuyzen M, van Hylckama Vlieg J (2008) Population
heterogeneity of Lactobacillus plantarum WCFS1 microcolonies in response to
and recovery from acid stress. Appl Environ Microbiol 74: 7750–7758.
37. Gallegos MT, Schleif R, Bairoch A, Hofmann K, Ramos JL (1997) Arac/XylS
family of transcriptional regulators. Microbiol Mol Biol Rev 61: 393–410.
38. Lebeer S, Claes IJ, Verhoeven TL, Vanderleyden J, De Keersmaecker SC (2011)
Exopolysaccharides of Lactobacillus rhamnosus GG form a protective shield against
innate immune factors in the intestine. Microb Biotechnol 4: 368–374.
39. Pfeiler EA, Azcarate-Peril MA, Klaenhammer TR, Prouty AM, Brodsky IE, et
al. (2007) Characterization of a novel bile-inducible operon encoding a two-
component regulatory system in Lactobacillus acidophilus. J Bacteriol 189: 4624–
4634.
40. Wall T, Bath K, Britton RA, Jonsson H, Versalovic J, et al. (2007) The early
response to acid shock in Lactobacillus reuteri involves the ClpL chaperone and a
putative cell wall-altering esterase. Appl Environ Microbiol 73: 3924–3935.
41. Whitehead K, Versalovic J, Roos S, Britton RA (2008) Genomic and genetic
characterization of the bile stress response of probiotic Lactobacillus reuteri ATCC
55730. Appl Environ Microbiol 74: 1812–1819.
Genetic Biomarkers for L. plantarum GI Robustness
PLoS ONE | www.plosone.org 12 July 2012 | Volume 7 | Issue 7 | e39053

42. Bron PA, Molenaar D, de Vos WM, Kleerebezem M (2006) DNA micro-array-
based identification of bile-responsive genes in Lactobacillus plantarum. J ApplMicrobiol 100: 728–738.
43. Govers MJ, Termont DS, Van Aken GA, Van der Meer R (1994)
Characterization of the adsorption of conjugated and unconjugated bile acidsto insoluble, amorphous calcium phosphate. J Lipid Res 35: 741–748.
44. Sieuwerts S, de Bok FAM, Mols E, de Vos WM, Vlieg J (2008) A simple and fastmethod for determining colony forming units. Letters in Applied Microbiology
47: 275–278.
45. Breiman L (2001) Random forests. Machine Learning 45: 5–32.46. van Bokhorst-van de Veen H, Abee T, Tempelaars M, Bron PA, Kleerebezem
M, et al. (2011) Short- and long-term adaptation to ethanol stress and its cross-protective consequences in Lactobacillus plantarum. Appl Environ Microbiol 77:
5247–5256.47. Horton RM, Cai ZL, Ho SN, Pease LR (1990) Gene splicing by overlap
extension: tailor-made genes using the polymerase chain reaction. Biotechniques
8: 528–535.48. Sorvig E, Mathiesen G, Naterstad K, Eijsink VG, Axelsson L (2005) High-level,
inducible gene expression in Lactobacillus sakei and Lactobacillus plantarum usingversatile expression vectors. Microbiology 151: 2439–2449.
49. Wels M, Francke C, Kerkhoven R, Kleerebezem M, Siezen RJ (2006) Predicting
cis-acting elements of Lactobacillus plantarum by comparative genomics with
different taxonomic subgroups. Nucleic Acids Res 34: 1947–1958.
50. Eijsink VG, Brurberg MB, Middelhoven PH, Nes IF (1996) Induction of
bacteriocin production in Lactobacillus sake by a secreted peptide. J Bacteriol 178:
2232–2237.
51. Shannon P, Markiel A, Ozier O, Baliga NS, Wang JT, et al. (2003) Cytoscape: a
software environment for integrated models of biomolecular interaction
networks. Genome Res 13: 2498–2504.
52. Maere S, Heymans K, Kuiper M (2005) BiNGO: a Cytoscape plugin to assess
overrepresentation of gene ontology categories in biological networks. Bioinfor-
matics 21: 3448–3449.
53. Looijesteijn PJ, Hugenholtz J (1999) Uncoupling of growth and exopolysacchar-
ide production by Lactococcus lactis subsp. cremoris NIZO B40 and
optimization of its synthesis. J Biosci Bioeng 88: 178–182.
54. Zhou M, Boekhorst J, Francke C, Siezen RJ (2008) LocateP: genome-scale
subcellular-location predictor for bacterial proteins. BMC Bioinformatics 9: 173.
55. Casadaban MJ, Cohen SN (1980) Analysis of gene control signals by DNA
fusion and cloning in Escherichia coli. J Mol Biol 138: 179–207.
Genetic Biomarkers for L. plantarum GI Robustness
PLoS ONE | www.plosone.org 13 July 2012 | Volume 7 | Issue 7 | e39053