Evaluation of Pilot Injections in a Large Two-Stroke Marine Diesel Engine, Using CFD and T-φ...
8
1 Evaluation of Pilot Injections in a Large Two-Stroke Marine Diesel Engine, Using CFD and T-φ Mapping Panagiotis Kontoulis, *Christos Chryssakis and Lambros Kaiktsis Dept. of Naval Architecture and Marine Engineering National Technical University of Athens (NTUA) Heroon Polytechniou 9, GR-15773 Zografou, Greece Key Words: Marine Engines, CFD, Combustion, Emissions, Pilot Injection ABSTRACT In 2002 the European Commission adopted a European Union strategy to reduce atmospheric emissions from seagoing ships. The strategy reports on the magnitude and impact of ship emissions in the EU, and sets out a number of actions to reduce the contribution of shipping to health and climate change. One possible approach for the reduction of NO X and soot emissions of marine diesel engines is the use of multiple injection strategies, similar to the ones used in automotive diesel engines. In this way, diesel combustion could be optimized with respect to pollutant emissions, without compromising fuel efficiency. Our interest is in investigating the potential for emissions reduction and overall optimization of combustion in large two-stroke marine diesel engines, using numerical simulation. In this context, we study the effects of advanced injection strategies by utilizing Computational Fluid Dynamics (CFD) tools. We use the KIVA-3 code as the modeling platform, with improved models for spray breakup, autoignition and combustion. Here, we report first results, corresponding to pilot injections, which are visualized for the fuel injection and combustion processes, and are also mapped on temperature - equivalence ratio charts (T-φ maps). This analysis reveals important information on pollutant formation mechanisms in large marine diesel engines, and suggests that fuel savings with simultaneous reduction of soot emissions may be feasible. INTRODUCTION Substantial efforts have been made recently in order to develop new strategies for the in-cylinder reduction of soot and nitrogen oxides (NO X ) emissions from diesel engines. In small engines for automotive applications, these strategies include multiple fuel injections to improve fuel-air mixing and achieve combustion under conditions that do not favor emissions formation [1-5]. The main goal of this approach is the enhancement of fuel atomization and evaporation in order to create a more homogeneous fuel-air mixture in the cylinder (with reduced fuel-rich areas, where soot is produced). In addition, maintaining combustion at temperatures lower than approximately 2300 K is important for reducing the nitrogen oxides formation. Further development of two-stroke marine diesel engines can benefit from the knowledge acquired from the study of small engines; thus, similar strategies can possibly be employed to reduce pollutant emissions without sacrificing fuel economy. This is increasingly important, after the European Union’s efforts to reduce the environmental footprint of seagoing ships, both in terms of emissions and fuel consumption, which directly affects carbon dioxide (CO 2 ) emissions [6]. Moreover, reduction of the vast fuel consumption of marine diesel engines is of utmost importance due to the increasing fuel prices. CFD analysis can be a valuable tool in gaining insight into the engine aerothermochemistry, as it offers the possibility to visualize the fuel injection, spray atomization and evaporation, fuel-air mixing, as well as the development of the combustion process. In this context, the parameter combinations that favor emissions formation can be identified by using T-φ analysis of the fuel-air mixture, first introduced by Kamimoto et al. [7], and subsequently also used for Low Temperature Combustion (LTC) studies [8]. T-φ maps are isocontours
Transcript of Evaluation of Pilot Injections in a Large Two-Stroke Marine Diesel Engine, Using CFD and T-φ...

1
Evaluation of Pilot Injections in a Large Two-Stroke Marine
Diesel Engine, Using CFD and T-φ Mapping
Panagiotis Kontoulis, *Christos Chryssakis and Lambros Kaiktsis
Dept. of Naval Architecture and Marine Engineering
National Technical University of Athens (NTUA)
Heroon Polytechniou 9, GR-15773 Zografou, Greece
Key Words: Marine Engines, CFD, Combustion, Emissions, Pilot Injection
ABSTRACT
In 2002 the European Commission adopted a European Union strategy to reduce atmospheric emissions from
seagoing ships. The strategy reports on the magnitude and impact of ship emissions in the EU, and sets out a number of
actions to reduce the contribution of shipping to health and climate change. One possible approach for the reduction of
NOX and soot emissions of marine diesel engines is the use of multiple injection strategies, similar to the ones used in
automotive diesel engines. In this way, diesel combustion could be optimized with respect to pollutant emissions,
without compromising fuel efficiency.
Our interest is in investigating the potential for emissions reduction and overall optimization of combustion in large
two-stroke marine diesel engines, using numerical simulation. In this context, we study the effects of advanced injection
strategies by utilizing Computational Fluid Dynamics (CFD) tools. We use the KIVA-3 code as the modeling platform,
with improved models for spray breakup, autoignition and combustion. Here, we report first results, corresponding to
pilot injections, which are visualized for the fuel injection and combustion processes, and are also mapped on
temperature - equivalence ratio charts (T-φ maps). This analysis reveals important information on pollutant formation
mechanisms in large marine diesel engines, and suggests that fuel savings with simultaneous reduction of soot
emissions may be feasible.
INTRODUCTION Substantial efforts have been made recently in order
to develop new strategies for the in-cylinder reduction of
soot and nitrogen oxides (NOX) emissions from diesel
engines. In small engines for automotive applications,
these strategies include multiple fuel injections to
improve fuel-air mixing and achieve combustion under
conditions that do not favor emissions formation [1-5].
The main goal of this approach is the enhancement of
fuel atomization and evaporation in order to create a
more homogeneous fuel-air mixture in the cylinder (with
reduced fuel-rich areas, where soot is produced). In
addition, maintaining combustion at temperatures lower
than approximately 2300 K is important for reducing the
nitrogen oxides formation.
Further development of two-stroke marine diesel
engines can benefit from the knowledge acquired from
the study of small engines; thus, similar strategies can
possibly be employed to reduce pollutant emissions
without sacrificing fuel economy. This is increasingly
important, after the European Union’s efforts to reduce
the environmental footprint of seagoing ships, both in
terms of emissions and fuel consumption, which directly
affects carbon dioxide (CO2) emissions [6]. Moreover,
reduction of the vast fuel consumption of marine diesel
engines is of utmost importance due to the increasing
fuel prices.
CFD analysis can be a valuable tool in gaining
insight into the engine aerothermochemistry, as it offers
the possibility to visualize the fuel injection, spray
atomization and evaporation, fuel-air mixing, as well as
the development of the combustion process. In this
context, the parameter combinations that favor emissions
formation can be identified by using T-φ analysis of the
fuel-air mixture, first introduced by Kamimoto et al. [7],
and subsequently also used for Low Temperature
Combustion (LTC) studies [8]. T-φ maps are isocontours

2
of produced soot and NOX concentrations in a
temperature – equivalence ratio plane, obtained from 0-D
chemical kinetics simulations. The methodology was
extended by Bergman and Golovitchev [9], who created
transient emission maps, taking into account both soot
precursors and the varying pressure during the engine
cycle.
The objective of the present work is to investigate
the effect of injection characteristics on the combustion
process in large two-stroke marine diesel engines, with
respect to thermal efficiency and emissions formation. In
particular, the effect of pilot injections on engine
performance and emissions is evaluated. The analysis is
based on 3-D CFD simulations, used for the construction
of temperature - equivalence ratio (T-φ) maps, in order to
characterize emissions formation.
COMPUTATIONAL APPROACH The geometry corresponds to the RTA58T Sulzer
engine. Each cylinder has three injectors, located
symmetrically on the periphery of the cylinder head;
each injector has five orifices, to enhance dispersion of
the liquid fuel into the cylinder. In general, the injection
is in a co-swirl direction. The main engine characteristics
are given in Table 1.
Table 1: Main engine characteristics
Bore Diameter [m] 0.58
Stroke [m] 2.416
Injection System Common Rail
IPC [Deg. CA aTDC] -96
EVO [Deg. CA aTDC] 120
Engine Speed [RPM] 105
A modified version of the KIVA-3 code [10-11] has
been used. The modifications include the fuel
atomization, ignition, combustion, and NOX formation
models. In particular, spray modeling involves a cascade
drop breakup model [12-13], while ignition modeling
utilizes an ignition progress variable, obtained from the
solution of a corresponding transport equation [14]. NOX
modeling is based on a detailed chemical scheme,
implemented on top of the extended Zeldovich
mechanism [15]. Tetradecane (C14H30) has been used as
fuel. The present code has been used extensively by the
NTUA group in the simulation of flow and combustion
in two-stroke marine diesel engines [16-17].
In the simulations, a full 360o geometry has been
selected, in lieu of a 120o sector, to allow for variation of
the injection profile between the injectors, a possibility
provided by the common rail injection systems. The
computational mesh, validated in previous studies [16],
consists of approximately 85,000 cells at Intake Port
Closing (IPC). Only the closed part of the engine cycle is
computed, i.e. from -96 deg. CA aTDC (after Top Dead
Center) at IPC to 120 deg. CA aTDC at Exhaust Valve
Opening (EVO).
The initial swirl velocities are prescribed in terms of
a Bessel function, and correspond to a proper value of
swirl number, defined as the ratio of the angular velocity
of the swirl to the angular velocity of the engine
crankshaft:
engine
swirlSN
ωω
= , with fengine πω 2=
where f is the engine frequency. Note that ωswirl
corresponds to a wheel-flow (linear) profile of exactly
the same angular momentum as the Bessel function
profile.
The initial conditions for pressure and temperature
have been determined from a try-error procedure, by
comparing the computed cold-flow pressure against an
experimental pressure trace. The reference conditions,
corresponding to a continuous injection profile, are
summarized in Table 2. Here, the Start Of Injection (SOI)
and injection duration are those of an actual Sulzer
engine.
Table 2: Reference engine operating conditions
Intake Pressure [bar] 3.52
Intake Temperature [K] 330
SOI [Deg. CA aTDC] 2
Injection Duration [deg. CA] 15.2
Engine Load 100%
The computed pressure and rate of heat release traces
of the reference case are presented in Figures 1 and 2,
and compared to experimental data. The experimental
rate of heat release curve is based on the measured
pressure, and is obtained from a thermodynamic code (G.
Weisser, private communication). Note that here
normalized values of the rate of heat release are
presented:
( )( ) totchem
chem
QCAd
QdROHR
,
100⋅=
While the agreement between experiment and
simulation is very good regarding the pressure, the rate
of heat release curves indicate that the computation
predicts a slower burning in the late stages of combustion,
resulting in an overall longer combustion duration. This
suggests the requirement for further physical model
development.
Regarding the use of T-φ maps, we clarify that in the
present work transient maps have not been used for
combustion analysis; instead, for simplicity, one static
map is utilized, corresponding to the data reported in
Kitamura et al. [18], obtained for a pressure of 60 bar
and a residence time of 2 ms, which corresponds to 1.3
deg. CA for the current engine speed.
The T-φ maps indicate the concentrations of
produced NOX and soot, as functions of local
stoichiometry and temperature, thus identifying the
conditions that promote low-emissions engine operation.
It should be noted that for soot the interpretation is less
straightforward than for NOX, since the maps do not
provide information on the soot oxidation process, as
discussed subsequently.
3
-40 -20 0 20 40 600
20
40
60
80
100
120
140
160
Crank Angle [deg.]
Cylin
der P
ressure
[bar]
Experiment
Computation
Figure 1: Reference case pressure histories for
experiment and computation.
-20 -10 0 10 20 30 40 50 60-1
0
1
2
3
4
5
6
7
8
Crank Angle [deg.]
Ra
te o
f H
ea
t R
ele
ase
Experiment
Computation
Figure 2: Reference case normalized rate of heat release
histories for experiment and computation.
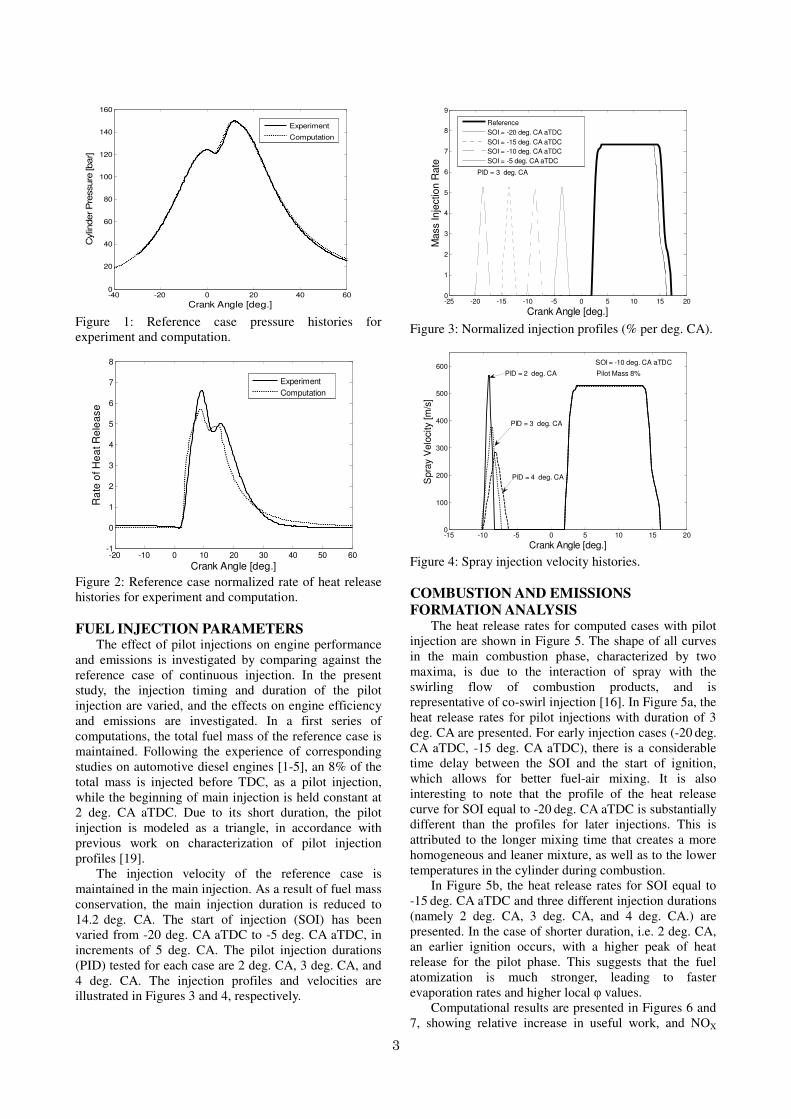
FUEL INJECTION PARAMETERS The effect of pilot injections on engine performance
and emissions is investigated by comparing against the
reference case of continuous injection. In the present
study, the injection timing and duration of the pilot
injection are varied, and the effects on engine efficiency
and emissions are investigated. In a first series of
computations, the total fuel mass of the reference case is
maintained. Following the experience of corresponding
studies on automotive diesel engines [1-5], an 8% of the
total mass is injected before TDC, as a pilot injection,
while the beginning of main injection is held constant at
2 deg. CA aTDC. Due to its short duration, the pilot
injection is modeled as a triangle, in accordance with
previous work on characterization of pilot injection
profiles [19].
The injection velocity of the reference case is
maintained in the main injection. As a result of fuel mass
conservation, the main injection duration is reduced to
14.2 deg. CA. The start of injection (SOI) has been
varied from -20 deg. CA aTDC to -5 deg. CA aTDC, in
increments of 5 deg. CA. The pilot injection durations
(PID) tested for each case are 2 deg. CA, 3 deg. CA, and
4 deg. CA. The injection profiles and velocities are
illustrated in Figures 3 and 4, respectively.
-25 -20 -15 -10 -5 0 5 10 15 200
1
2
3
4
5
6
7
8
9
Crank Angle [deg.]
Mass Inje
ction R
ate
Reference
SOI = -20 deg. CA aTDC
SOI = -15 deg. CA aTDC
SOI = -10 deg. CA aTDC
SOI = -5 deg. CA aTDC
PID = 3 deg. CA
Figure 3: Normalized injection profiles (% per deg. CA).
-15 -10 -5 0 5 10 15 200
100
200
300
400
500
600
Crank Angle [deg.]
Spra
y V
elo
city [m
/s]
SOI = -10 deg. CA aTDC
PID = 3 deg. CA
PID = 4 deg. CA
PID = 2 deg. CA Pilot Mass 8%
Figure 4: Spray injection velocity histories.
COMBUSTION AND EMISSIONS
FORMATION ANALYSIS The heat release rates for computed cases with pilot
injection are shown in Figure 5. The shape of all curves
in the main combustion phase, characterized by two
maxima, is due to the interaction of spray with the
swirling flow of combustion products, and is
representative of co-swirl injection [16]. In Figure 5a, the
heat release rates for pilot injections with duration of 3
deg. CA are presented. For early injection cases (-20 deg.
CA aTDC, -15 deg. CA aTDC), there is a considerable
time delay between the SOI and the start of ignition,
which allows for better fuel-air mixing. It is also
interesting to note that the profile of the heat release
curve for SOI equal to -20 deg. CA aTDC is substantially
different than the profiles for later injections. This is
attributed to the longer mixing time that creates a more
homogeneous and leaner mixture, as well as to the lower
temperatures in the cylinder during combustion.
In Figure 5b, the heat release rates for SOI equal to
-15 deg. CA aTDC and three different injection durations
(namely 2 deg. CA, 3 deg. CA, and 4 deg. CA.) are
presented. In the case of shorter duration, i.e. 2 deg. CA,
an earlier ignition occurs, with a higher peak of heat
release for the pilot phase. This suggests that the fuel
atomization is much stronger, leading to faster
evaporation rates and higher local φ values.
Computational results are presented in Figures 6 and
7, showing relative increase in useful work, and NOX
4
emissions levels, respectively, as functions of the
injection parameters (SOI, PID). The reference case
(Case A) is also illustrated, for comparison. We note that,
for the reference case, our results for NOX concentration
are in good agreement with the experimental value of
1400 ppm, provided by Wärtsilä Switzerland.
Inspection of Figures 6 and 7 reveals that, among the
computed cases, engine operation is mostly improved for
a pilot injection at -15 deg. CA aTDC, with duration of 3
deg. CA (Case B). Under these conditions, the work
output is increased by 1.5%, with a NOX emissions
concentration raise of only 2.2%, compared to the
reference case. The cylinder pressure for Case A and
Case B is presented in Figure 8. We note that, under real
operating conditions, a limit of 150 bar is imposed for
the maximum cylinder pressure, to avoid excessive
mechanical strain on the engine components. This
constraint has not yet been considered, and will be
imposed in the immediate next steps of the present study.
-20 -10 0 10 20 30 400
1
2
3
4
5
6
7
8
Crank Angle [deg.]
Rate
of H
eat R
ele
ase
SOI = -5 deg. CA aTDC
SOI = -10 deg. CA aTDC
SOI = -15 deg. CA aTDC
SOI = -20 deg. CA aTDC
Reference
PID = 3 deg. CA
(a)
-20 -10 0 10 20 30 400
1
2
3
4
5
6
Crank Angle [deg.]
Rate
of H
eat R
ele
ase
PID = 2 deg. CA
PID = 3 deg. CA
PID = 4 deg. CASOI = -15 deg. CA aTDC
(b)
Figure 5: Computed histories of normalized rate of heat
release for: (a) constant pilot injection duration (3 deg.
CA) and variable start of injection, (b) constant start of
injection (-15 deg. CA aTDC) and variable pilot injection
duration.
-25 -20 -15 -10 -5 0 50
2
4
0
0.5
1
1.5
2
PID [deg. CA]
SOI [deg. CA aTDC]
(W/W
ref-
1)*
10
0
Figure 6: Relative, with respect to reference case,
increase in computed useful work, versus start and
duration of pilot injection.
-25 -20 -15 -10 -5 0 50
1
2
3
4
5
1600
1700
1800
1900
PID [deg. CA]
SOI [deg. CA aTDC]
NO
x c
oncentra
tion [ppm
]
Figure 7: Computed final NOX concentrations versus
start and duration of pilot injection.
-100 -50 0 50 1000
20
40
60
80
100
120
140
160
180
Crank Angle [deg.]
Cylin
de
r P
ressu
re [
ba
r]
Case B
Reference
Figure 8: Computed pressure histories for reference case
and one case with pilot injection.
The above results have motivated a second series of
computations, with the aim of reducing fuel consumption.
Here, the injection characteristics of Case B are
maintained (SOI=-15 deg. CA aTDC, PID=3 deg. CA),
but the total injected fuel mass has been reduced so that
the total work output is the same as in Case A. The
simulations predict that the fuel consumption can be
reduced by 1.7%, in which case, NOX concentration is
also reduced by 1.1%. Thus, the above case, called
A
B
B
A

5
hereafter Case C, allows achieving the desired result in
terms of engine output, while reducing the fuel
consumption and maintaining the same NOX emission
levels. The results for Cases A, B, and C are summarized
in Table 3.
Table 3: Characteristics of cases A, B, and C
Case A Case B Case C
SOI [deg. CA aTDC] 2 -15 -15
Pilot Inj. Duration
[deg. CA] 0 3 3
Pilot Mass 0 % 8.0 % 7.86%
Main Mass 100% 92.0 % 90.44%
Work Output 100% 101.5% 100%
NOX [ppm] 1630 1665 1611
Max Pressure [bar] 149.08 158.97 157.73
Detailed information on the fuel-air mixing and the
combustion process can be revealed by post-processing
the simulation results and visualizing the flow. The fuel
injection process, along with local temperatures and
equivalence ratio values, in a horizontal plane at the
location of injectors, are visualized in Figure 9 for Case
C. In addition, analysis of combustion in T-φ maps for
Cases A and C is presented for the selected points in
time: here, the local values of temperature and
equivalence ratio of all computational cells are placed in
the maps.
A close observation of the maps indicates that the
fuel injected during the pilot injection is mixed with air,
and the resulting mixture does not penetrate map areas
that favor either NOX or soot formation. The fuel injected
during the pilot injection is entirely burnt before the start
of the main injection. This is shown in the T-φ map for 2
deg. CA aTDC, at which time the cylinder charge is
characterized by equivalence ratio values close to zero
(practically no fuel present), while the temperature
ranges from 700 to 1500 K. The part of main combustion
is similar for both cases, but in Case C the main injection
event lasts only 14.2 deg. CA, as opposed to 15.2 deg.
CA for Case A. One may thus infer that less soot is
formed in Case C. This effect is shown in the last two
rows of Figure 9 (at 17 deg. CA aTDC and 19 deg. CA
aTDC), where soot formation appears to drop
substantially for Case C. Furthermore, it can be deduced
that in Case C, due to more favorable conditions (higher
temperature and pressure), soot oxidation starts earlier.
Thus, we expect that in Case C the combined effect of
lower soot production and earlier start of oxidation leads
to reduced soot concentration at the exhaust.
Further analysis of the soot formation process
appears in Figure 10, where three-dimensional soot
formation areas inside the combustion chamber are
shown. These plots have been constructed by defining a
function that describes the likelihood of soot formation,
based on the T-φ maps. The form of the above function
accounts for the observed linear dependence of soot
formation on φ, as well as for the corresponding
parabolic dependence on mixture temperature. In
particular, in a first step, the following parabolic function
of temperature has been defined, to account for the effect
of temperature on soot formation:
cTbTaTy +⋅+⋅= 2)(
Here, the coefficients a, b, and c, were calculated from
the solution of a 3×3 system of linear equations,
corresponding to the data pairs (T, y)=(1500, 0), (2000,
1), (2500, 0). Thus, for temperatures lower than 1500 K
and higher than 2500 K there is no soot formation, while
the temperature effect is maximum for 2000 K. By
multiplying y(T) with the equivalence ratio, φ (to account
for the linear dependence of soot formation on φ), the
following function, named hereafter Soot Formation
function, SF, is defined:
−+−⋅= 15
125
22
000,250
1TTSF φ
For values SF>3, the above function approximates
the soot formation area of the T-φ map with
concentration higher than 5%. An isosurface with SF=3
has been constructed that includes all areas with SF>3
(which are more likely to contribute to soot production),
and is presented in Figure 10.
Figure 10 reveals that soot formation begins at
approximately 4 deg. CA aTDC, i.e. 2 deg. CA after the
start of main injection. One can observe that at this point
soot formation areas are slightly larger in Case C, due to
the higher temperatures inside the cylinder. However, the
soot formation areas rapidly become of comparable size
and shape, an observation which is in accordance with
the T-φ maps in Figure 9, regarding the main combustion
phase. A difference becomes obvious at 17 deg. CA
aTDC and later on, when, for case C, fuel injection
terminates. As indicated previously, even though soot
oxidation rates are not taken into account in the present
work, it can be concluded that reduced soot emissions
are achieved in Case C, in comparison with the reference
Case A.
CONCLUSIONS The effects of pilot injections in large two-stroke
marine diesel engines have been studied in this work,
using CFD and analysis of the combustion and emissions
formation process with T-φ mapping. It has been
demonstrated that, by adding a pilot injection,
appropriately timed, fuel savings of the order of 1.5%
can be achieved, without increasing NOX emissions.
Furthermore, analysis of the fuel-air mixture indicates
that soot formation can possibly also be reduced. To
illustrate the significance of the fuel economy, it is noted
that the present estimates correspond to approximately
one tone of fuel/day of engine operation, for an
8-cylinder engine of this type. Such an engine can propel
a tanker ship of 130,000 tones deadweight with 14
Knots.

6
T-φ – Case A T-φ – Case C Temperature – Case C Equiv. Ratio – Case C
Figure 9: T-φ maps for cases A and C, for different values of crank angle, and color-coded contours of temperature and
equivalence ratio in a horizontal plane at the location of injectors.

7
Figure 10: Soot formation areas (corresponding to values
of the soot formation function SF>3) for Case A and
Case C, for different values of crank angle.
Acknowledgements
The second author would like to acknowledge the
financial support by a Marie-Curie International
Reintegration Grant, agreement nr. 207232. We would
like to thank Dr. G. Weisser of Wärtsilä Switzerland for
helpful discussions, and for providing us with the engine
data.
Contact Information:
Mr. Panagiotis Kontoulis: [email protected]
Dr. Christos Chryssakis: [email protected]
Prof. Lambros Kaiktsis: [email protected]
NOMENCLATURE aTDC after Top Dead Centre [deg. CA]
CA Crank Angle [deg.]
EVO Exhaust Valve Opening [deg. CA]
f Engine Frequency [s-1
]
IPC Intake Port Closing [deg. CA]
p Pressure [bar]
Qchem Combustion Heat Release [J]
Qchem,tot Total Combustion Heat Release [J]
PID Pilot Injection Duration [deg. CA]
ROHR Rate Of Heat Release [% per deg. CA]
SF Soot Formation function [ - ]
SN Swirl Number [ - ]
SOI Start Of Injection [deg. CA]
T Temperature [K]
φ Equivalence ratio [ - ]
ωengine Angular velocity of engine crankshaft [s-1
]
ωswirl Angular velocity of swirl [s-1
]
REFERENCES [1] Benajes, J., Molina, S., Garcia, J.M, "Influence of
pre- and post-injection on the performance and
pollutant emissions in a HD diesel engine", SAE
Technical Paper Series 2001-01-0526,2001
[2] Ishikawa, N., Uekusa, T., Nakada, T., Hariyoshi, R.
"DI diesel emission control by optimized fuel
injection", SAE Technical Paper Series
2004-01-0117.2004
[3] Payri, F., Benajes, J., Pastor, J.V., Molina, S.
"Influence of the post-injection pattern on
performance, soot and NOx emissions in a HD
diesel Engine", SAE Technical Paper Series
2002-01-0502,2002
[4] Park,C., Kook, S., and Bae, C., “Effects of
Multiple Injections in a HSDI Diesel Engine
Equipped with Common Rail Injection System”,
SAE Technical Paper Series 2004-01-0127,2004
[5] Chryssakis, C.A., Hagena, J.R., Knafl, A.,
Hamosfakidis, V., Filipi, Z.S., Assanis, D.N.,
“In-Cylinder Reduction of PM and NOX Emissions
from Diesel Combustion with Advanced Injection
Strategies”, Int. J. of Vehicle Design, Vol. 41, No.
1-4, pp.83-102, 2006
[6] European Commission Directorate General
Environment, “Service Contract on Ship
Emissions: Assignment, Abatement and
Market-based Instruments”, August 2005
[7] Kamimoto, T., Bae, M., “High Combustion
Temperature for the Reduction of Particulate in
Diesel Engines”, SAE Technical Paper Series
880423, 1988
[8] Kook, S., Bae, C., Miles, P.C., Choi, D., Picket

8
L.M., “The Influence of Charge Dilution and
Injection Timing on Low-Temperature Diesel
Combustion and Emissions”, SAE Technical Paper
Series 2005-01-3837
[9] Bergman, M., Golovitchev, V.I., “Application of
Transient Temperature vs. Equivalence Ratio
Emission Maps to Engine Simulations”, SAE
Technical Paper Series 2007-01-1086, 2007
[10] Amsden, A.A., O’Rourke P.J. and Butler T.D.,
“KIVA II – A Computer Program for Chemically
Reactive Flows with Sprays”, Los Alamos
National Laboratory LA-11560-MS, 1989
[11] Amsden, A.A., “KIVA-3: A KIVA Program with
Block-Structured Mesh for Complex Geometries”,
Los Alamos National Laboratory LA-12503-MS,
1993
[12] Tanner, F.X., “Liquid Jet Atomization and Droplet
Breakup Modeling of Non-Evaporating Diesel Fuel
Sprays”, SAE Technical Paper Series 970050, 1997
[13] Tanner, F.X., Weisser, G., “Simulation of Liquid Jet
Atomization for Fuel Sprays by Means of a
Cascade Drop Breakup Model“, SAE Technical
Paper Series 980808, 1998
[14] Weisser, G., Tanner, F., Boulouchos, K., “Modeling
of Ignition and Early Flame Development with
Respect to Large Diesel Engine Simulation”, SAE
Technical Paper Series 981451, 1998
[15] Weisser G., “Modelling of Combustion and Nitric
Oxide Formation for Medium-Speed DI Diesel
Engines: a Comparative Evaluation of Zero- and
Three-Dimensional Approaches”, Ph.D., Thesis,
ETH Zurich, Switzerland, 2001
[16] Kaiktsis, L., “Numerical Simulation of Flow and
Combustion in the RTA58T Engine of Wärtsilä
NSD”, Technical Report, 2001
[17] Kotrogiannis, N., “Numerical Simulation of Flow
and Combustion in a Two-Stroke Marine Diesel
Engine”, Diploma Thesis, National Technical
University of Athens, 2006
[18] Kitamura, T., Ito, T., Senda, J., Fujimoto, H.,
“Mechanism of Smokeless Diesel Combustion
with Oxygenated Fuels Based on the Dependency
of the Equivalence Ratio and Temperature on Soot
Particles Information”, International Journal of
Engine Research, Vol. 3, No 4, pp. 223-247, 2002
[19] Bohbot, J., Chryssakis, C., Pacaud, P., Benkenida,
A., “Coupling of a 1-D Injection Model with a 3-D
Combustion Code for Direct Injection Diesel
Engine Simulations”, SAE Technical Paper Series
2008-01-0358, 2008