Conservation without Nature: The Trouble with In Situ versus Ex Situ Conservation
Upload
khangminh22Category
view
0download
0
Evaluation of photocatalytic activity of
porous films by in-situ environmental
ellipsometric analysis
Par Ronghua LI
Dirigée par David GROSSO
Soutenance Prevué le 2 Mars 2016
Devant un jury composé de :
Pr. L. MALFATTI Università degli Studi di Sassari Rapporteur
Pr. C.COULBEAU JUSTIN Université Paris Sud Rapporteur
Pr. C. CHANEAC Université de Paris 6 Examinateur
Dr. A. CATTONI LPN-CNRS Examinateur
Dr. M. FAUSTINI Université de Paris 6 Invité
Pr. D. GROSSO Aix-Marseille Université Directeur de thèse
Université Pierre et Marie Curie
ED 397 : Physique et Chimie des Matériaux
Laboratoire de Chimie de la Matière Condensée de Paris
1
Contents Contents ..................................................................................................................................... 1
General Introduction .................................................................................................................. 3
CHAPTER 1 Generality .......................................................................................................... 5
1.1 Titania photocatalytic activity ........................................................................................ 6
1.1.1 Titania photocatalytic properties ............................................................................. 6
1.1.2 Different Titania lattice structures ........................................................................... 9
1.1.3 Titania photocatalytic mechanisms ....................................................................... 11
1.1.4 Factors affecting the photocatalytic activity .......................................................... 13
1.1.5 Photoinduced superhydrophilicity ......................................................................... 14
1.2 Mesoporous titanium dioxide thin films ...................................................................... 16
1.2.1 Introduction ........................................................................................................... 16
1.2.2 Initial Solution Preparation .................................................................................... 19
1.2.3 Chemical Solution Deposition ............................................................................... 21
1.2.4 Evaporation Induced Self-Assembly Method ........................................................ 27
1.2.5 Aging ..................................................................................................................... 29
1.2.6 Crystallization by thermal treatment ..................................................................... 31
1.3 Photocatalytic characterization of TiO2 films .............................................................. 33
1.3.1 Introduction ........................................................................................................... 33
1.3.2 Photocatalytic characterization techniques ............................................................ 35
1.3.3 Ellipsometry........................................................................................................... 41
References ............................................................................................................................ 50
CHAPTER 2 Oxygen and Humidity effect on the photocatalytic activity of porous TiO2
films ......................................................................................................................................... 60
2.1 Introduction .................................................................................................................. 61
2.2 Description of the TiO2 film ......................................................................................... 62
2
2.2.1 Preparation of the film ........................................................................................... 62
2.2.2 Structural characterization of the model mesoporous TiO2 film ........................... 64
2.3 Photocatalytic investigations by in situ ellipsometry ................................................... 67
2.3.1 Investigation of the influence of oxygen on photocatalysis ................................... 70
2.3.2 Investigation of the influence of H2O vapour on photocatalysis ............................ 71
2.3.3 Discussion about photocatalytic efficiency and kinetics ....................................... 74
2.4 Influence of the probe: the case of Methylene Blue ..................................................... 79
2.4.1 Experimental details and optical model ................................................................... 80
2.4.2 Effect of O2 : photodegradation vs photoreduction ............................................... 82
2.4.3 Effect of humidity on the photo-degradation process of MB .................................. 84
2.4.4 Discussion on the utilization of MB as probe ........................................................ 87
2.5 Conclusions .................................................................................................................. 89
References ............................................................................................................................ 91
CHAPTER 3 Formation and photocatalytic activity of mesoporous TiO2/SiO2 composite
films ......................................................................................................................................... 93
3.1 Introduction ................................................................................................................... 94
3.2 Preparation of mesoporous composite TiO2/SiO2 films ............................................... 95
3.3 Porosity Characterization ............................................................................................. 96
3.3 Characterization of the Crystalline Network .............................................................. 104
3.4 Formation and evolution of the mesostructure ........................................................... 108
3.5 Optical properties of the composite films .................................................................. 109
3.6 Photocatalysis activity of the composite films ........................................................... 110
3.7 Conclusion .................................................................................................................. 115
References .......................................................................................................................... 117
CHAPTER 4 Conclusion ..................................................................................................... 120
References ........................................................................................................................... 124
ABSTRACTS ........................................................................................................................ 125
3
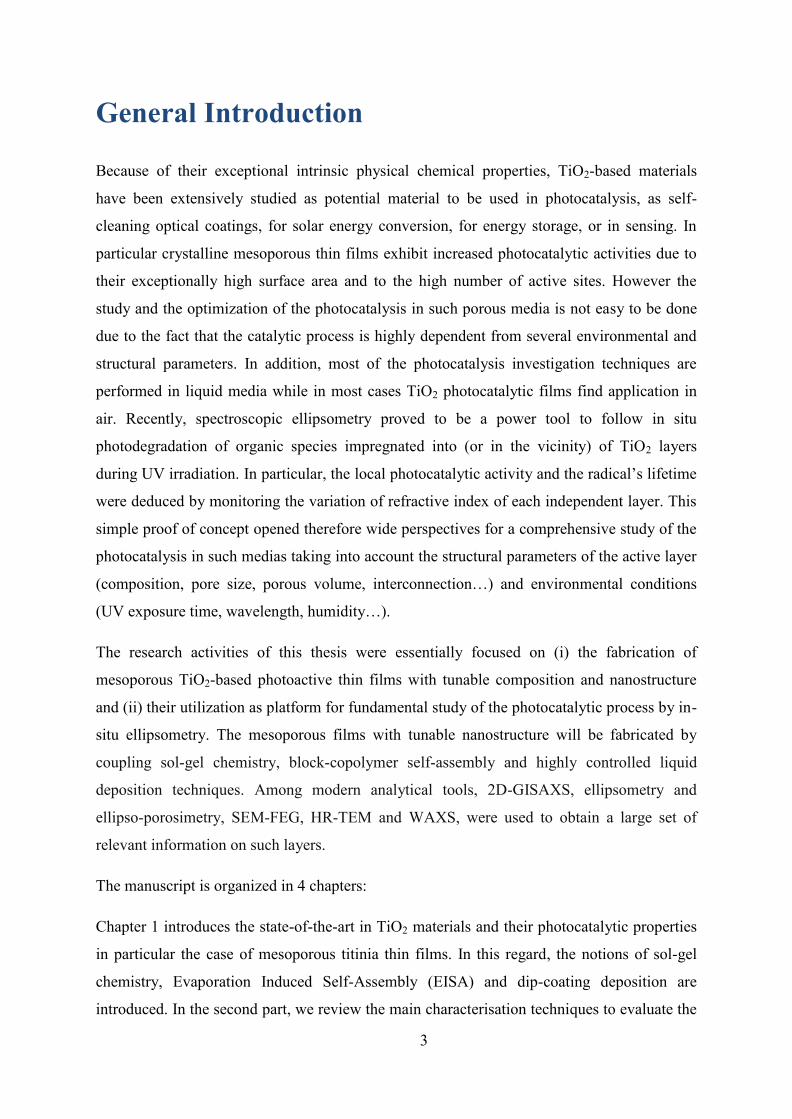
General Introduction
Because of their exceptional intrinsic physical chemical properties, TiO2-based materials
have been extensively studied as potential material to be used in photocatalysis, as self-
cleaning optical coatings, for solar energy conversion, for energy storage, or in sensing. In
particular crystalline mesoporous thin films exhibit increased photocatalytic activities due to
their exceptionally high surface area and to the high number of active sites. However the
study and the optimization of the photocatalysis in such porous media is not easy to be done
due to the fact that the catalytic process is highly dependent from several environmental and
structural parameters. In addition, most of the photocatalysis investigation techniques are
performed in liquid media while in most cases TiO2 photocatalytic films find application in
air. Recently, spectroscopic ellipsometry proved to be a power tool to follow in situ
photodegradation of organic species impregnated into (or in the vicinity) of TiO2 layers
during UV irradiation. In particular, the local photocatalytic activity and the radical’s lifetime
were deduced by monitoring the variation of refractive index of each independent layer. This
simple proof of concept opened therefore wide perspectives for a comprehensive study of the
photocatalysis in such medias taking into account the structural parameters of the active layer
(composition, pore size, porous volume, interconnection…) and environmental conditions
(UV exposure time, wavelength, humidity…).
The research activities of this thesis were essentially focused on (i) the fabrication of
mesoporous TiO2-based photoactive thin films with tunable composition and nanostructure
and (ii) their utilization as platform for fundamental study of the photocatalytic process by in-
situ ellipsometry. The mesoporous films with tunable nanostructure will be fabricated by
coupling sol-gel chemistry, block-copolymer self-assembly and highly controlled liquid
deposition techniques. Among modern analytical tools, 2D-GISAXS, ellipsometry and
ellipso-porosimetry, SEM-FEG, HR-TEM and WAXS, were used to obtain a large set of
relevant information on such layers.
The manuscript is organized in 4 chapters:
Chapter 1 introduces the state-of-the-art in TiO2 materials and their photocatalytic properties
in particular the case of mesoporous titinia thin films. In this regard, the notions of sol-gel
chemistry, Evaporation Induced Self-Assembly (EISA) and dip-coating deposition are
introduced. In the second part, we review the main characterisation techniques to evaluate the
4
photocatalytic activity of titania films. The in-situ ellipsometric analysis is also presented by
discussing the previous studies on photocatalysis.
In Chapter 2 a model TiO2 mesoporous film was analysed by in-situ ellipsometry for
fundamental investigations of the photocatalytic process kinetics as function of the
environmental composition (O2 and humidity) and the organic pollutant (lauric acid or
methylene blue). The photocatalytic efficiencies of porous thin films were evaluated by
following the refractive index diminution associated to the decomposition of impregnated
organic pollutants. The large amount of information obtain by in-situ ellipsometry has
allowed the proposition of photodegradation mechanisms in the studied conditions.
In Chapter 3, we focus on the photocatalytic films: composite mesoporous TiO2/SiO2 films
were fabricated by sol-gel chemistry. From the applicative point of view the goal here is to
prepare photoactive films with tunable optical properties in order to be applied on optical
devices or to be transparent on glass. A structural study on the films porous network and
composition was conducted. In-situ ellispometry was also used to determine the
photodegradation kinetics into the composite films and to clarify the photocatalytic
mechanism.
In Chapter 4, the discussion of the results and some perspective are finally reported. In
addition, the articles published during the thesis on the latter works are given in annex.
This work was supported by China Council Scholarship.

5
CHAPTER 1
Generality
6
1.1 Titania photocatalytic activity
1.1.1 Titania photocatalytic properties
Due to the continuously increasing world’s population and the substantial development of
industry, imperious demand for environment protection and production of green energy has
been brought out nowadays. Semiconductor-based photocatalytic processes has shown a great
potential to conquer the problem and presents additional advantages related to sustainability,
cost-effectiveness and cleanness. Among these semiconductors titanium dioxide is
conclusively the most promising one.
Indeed, as a non-toxic, wide band-gap (larger than 3.0 eV) semiconductor and because of its
brightness, very high refractive index, and extraordinary chemical stability, titanium dioxide
(TiO2) has been widely used in the twentieth century in industries of paint, optics, cosmetics,
food science, etc. Since Fujishima and Honda discovered the photocatalytic water splitting on
TiO2 electrode under ultraviolet light in 1972,1 massive efforts have been devoted to TiO2
material research, which led to great potential applications in areas such as photovoltaics,
photocatalysis, photo and electro chromism, sensors, optics, separation, biomaterial
technologies and advanced nanocomposites.2-4
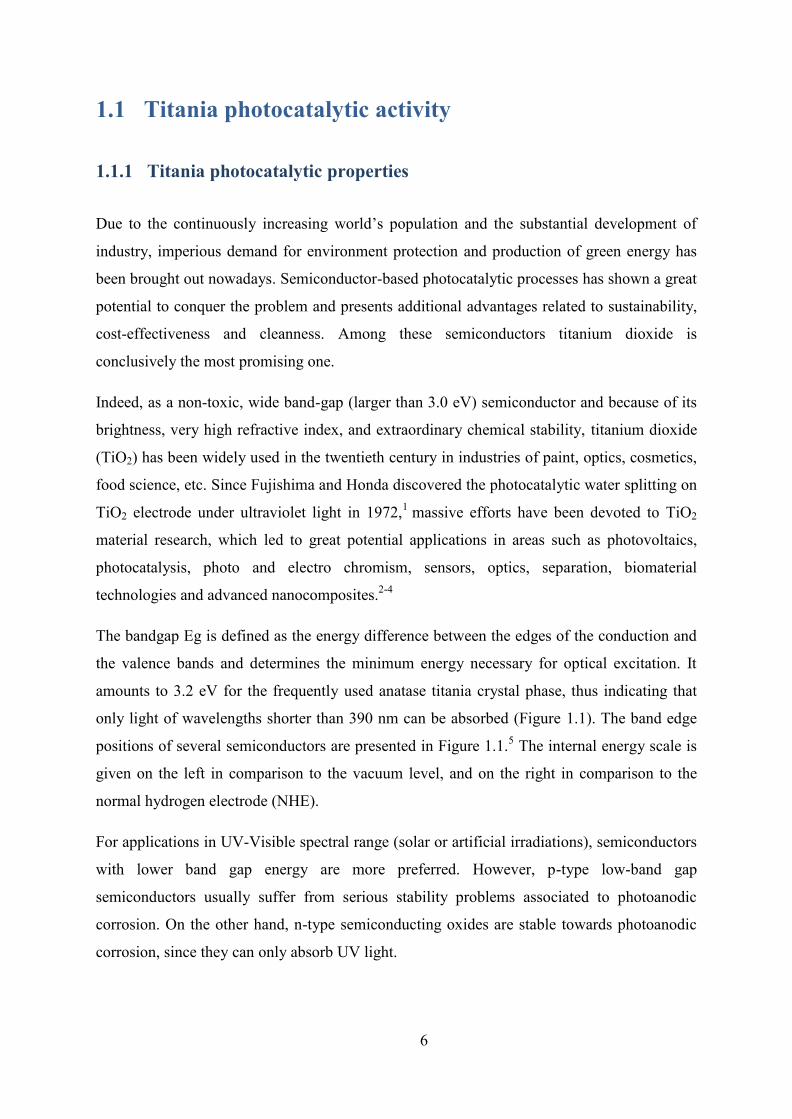
The bandgap Eg is defined as the energy difference between the edges of the conduction and
the valence bands and determines the minimum energy necessary for optical excitation. It
amounts to 3.2 eV for the frequently used anatase titania crystal phase, thus indicating that
only light of wavelengths shorter than 390 nm can be absorbed (Figure 1.1). The band edge
positions of several semiconductors are presented in Figure 1.1.5 The internal energy scale is
given on the left in comparison to the vacuum level, and on the right in comparison to the
normal hydrogen electrode (NHE).
For applications in UV-Visible spectral range (solar or artificial irradiations), semiconductors
with lower band gap energy are more preferred. However, p-type low-band gap
semiconductors usually suffer from serious stability problems associated to photoanodic
corrosion. On the other hand, n-type semiconducting oxides are stable towards photoanodic
corrosion, since they can only absorb UV light.
7
Figure 1.1 Band-edge positions and band-gap energies of various semiconductors in
aqueous electrolytes at pH=1.5
Among the semiconductors shown in Figure 1.1, some could be excited by UV or visible
light. The redox potentials of the edges of the valence and the conductive bands can promote
series of oxidative and reductive reactions. But some of the candidates do not have long term
stability. For example, the metal sulphide semiconductors, especially cadmium sulphide (CdS)
and zinc sulphide (ZnS), are unstable since they undergo photoanodic corrosion. Hematite (α-
Fe2O3) is not stable because of the photoanodic corrosion under visible light irradiation.6
Despite a similar bang gap at 3.2 eV, ZnO is not widely employed due to its low chemical
stability. It would even be photo-degraded upon excitation. Tungsten oxide (WO3) is active in
the visible region but its photocatalytic efficiency is much lower than that of titanium dioxide
(TiO2). Anatase titania appears thus to be the most attractive of this class of semicondutors
and has for such reason been extensively studied in the past decades.
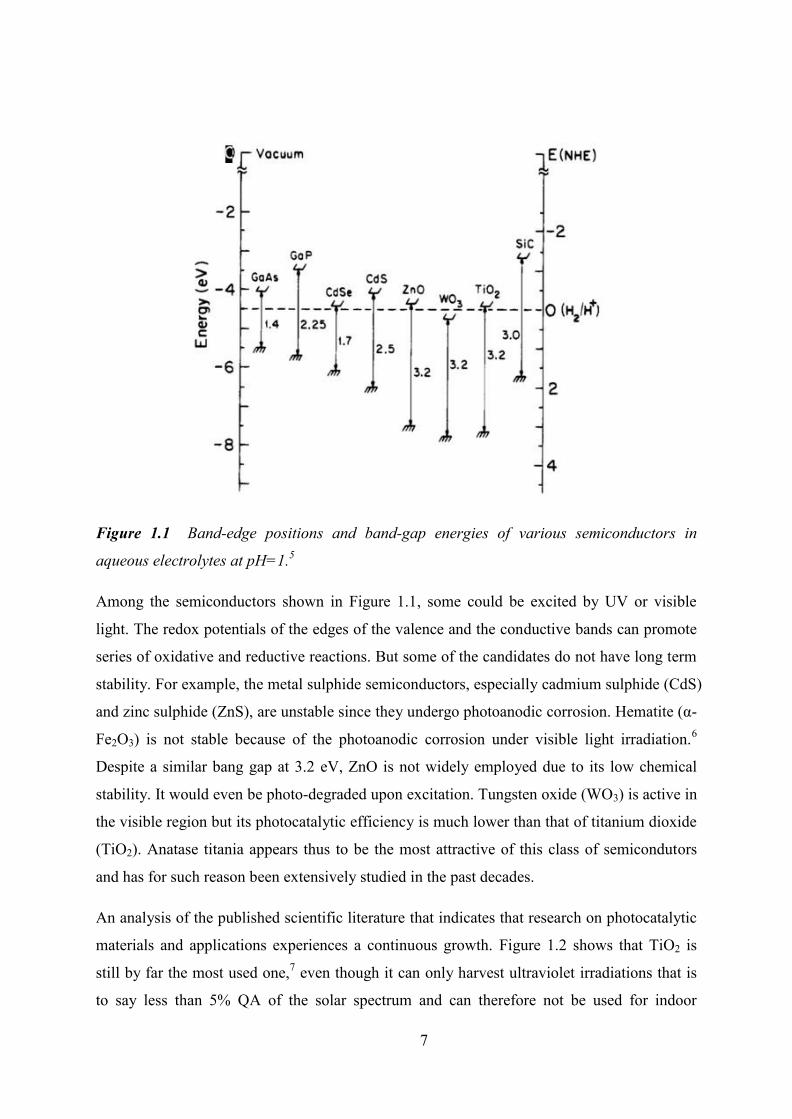
An analysis of the published scientific literature that indicates that research on photocatalytic
materials and applications experiences a continuous growth. Figure 1.2 shows that TiO2 is
still by far the most used one,7 even though it can only harvest ultraviolet irradiations that is
to say less than 5% QA of the solar spectrum and can therefore not be used for indoor
8
applications where no UV irradiation is present.
Figure 1.2 Yearly evolution of the titania predominance in the scientific literature on
photocatalysis estimated as the percentage of articles devoted to TiO2 among those related to
oxide semiconductors or out of the total. Source: Scopus.
There are two approaches aimed at solving the problem. The first most studied strategy to
develop new visible photocatalysts is to extend the absorption of TiO2 in the visible range
through the surface or bulk doping like TiO2 doped with carbon,8 nitrogen,9 fluorine,10 or
sulfur.11 However, the methods used for the doping element introduction are not fully
controlled, and the low thermal stability of these compounds limits their applications.
Moreover, these dopants may act as recombination centers between photogenerated electrons
and holes and consequently decrease photocatalyst efficiency. Another approach is to design
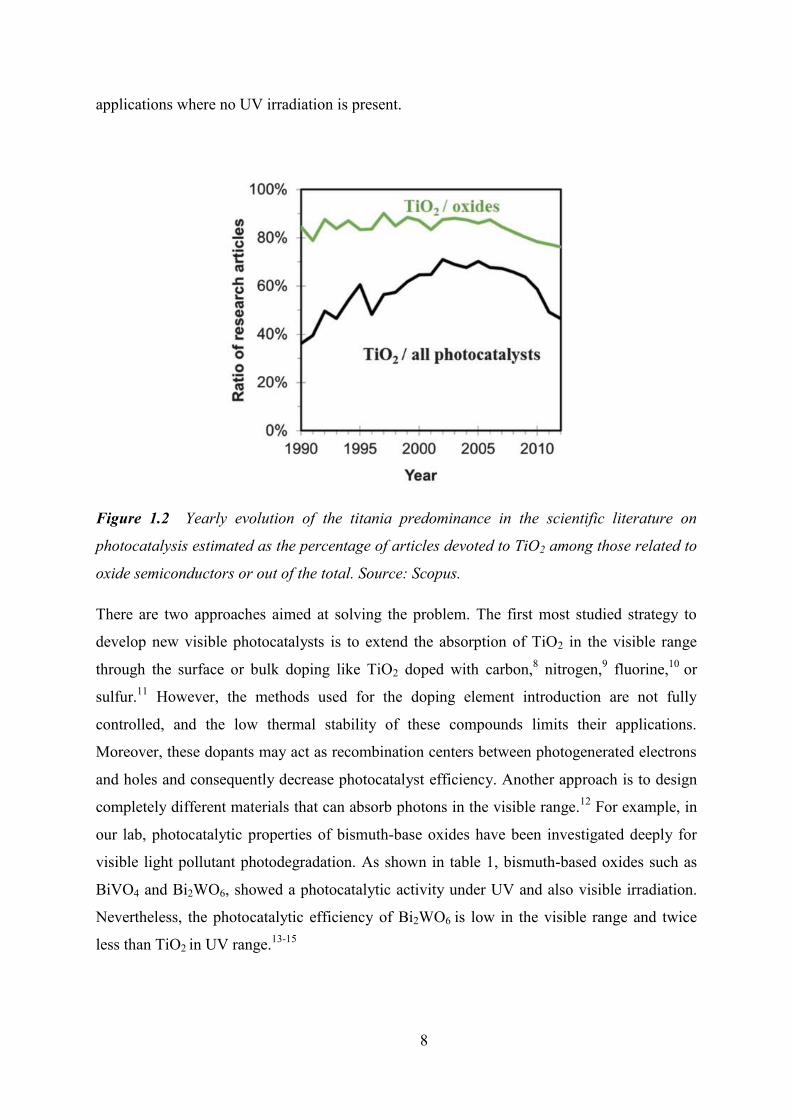
completely different materials that can absorb photons in the visible range.12 For example, in
our lab, photocatalytic properties of bismuth-base oxides have been investigated deeply for
visible light pollutant photodegradation. As shown in table 1, bismuth-based oxides such as
BiVO4 and Bi2WO6, showed a photocatalytic activity under UV and also visible irradiation.
Nevertheless, the photocatalytic efficiency of Bi2WO6 is low in the visible range and twice
less than TiO2 in UV range.13-15
9
Table 1. Characteristics of the different bismuth-based oxides.14
When exited in UV, electron-hole pairs are generated in Titania. Holes could effect on
organic decomposition. Because the potential of the holes in the valence band is low it can
oxide most organic compounds. Applications could be roughly specified into two main fields
that are environment (photocatalysis and sensing) and II) energy (photovoltaics and water
splitting). Since the urgent demand in energy and clean environments, TiO2 nanomaterials
play a more and more important role and it pushes further more research based on it. The
processing of titanium dioxide as thin films is required in most of these new promising fields.
Especially for the application in photocatalysis, to get a high photocatalytic activity, it is
necessary to use well-controlled crystalline materials with accessible mesoporosity associated
high surface area. In such optimal conditions, adsorptive capacity of pollutant molecules is
improved before been easily degraded.
1.1.2 Different Titania lattice structures
The commonly known polymorphs of TiO2 occuring in nature are anatase (tetragonal, space
group I41/amd, symmetry D4h), rutile (tetragonal, space group P42 / mnm, symmetry D4h),
brookite (orthorhombic, space group P42 / mnm, symmetry D4h), and TiO2 (B) (mzonoclinic,
space group C2/m). Four other Titania have been synthesized in high pressures from the rutile
or anatase phases: TiO2 (II) (“columbite”, (α-PbO2) space group Pbcn), TiO2 (III)
(“baddeleyite”, space group I4/m), TiO2 (H) (“hollandite”, space group I4/m), TiO2 (R)
(“ramsdellite”, space group Pbnm).16
Rutile is the most thermodynamically stable polymorph of TiO2 at all temperatures, whereas
10
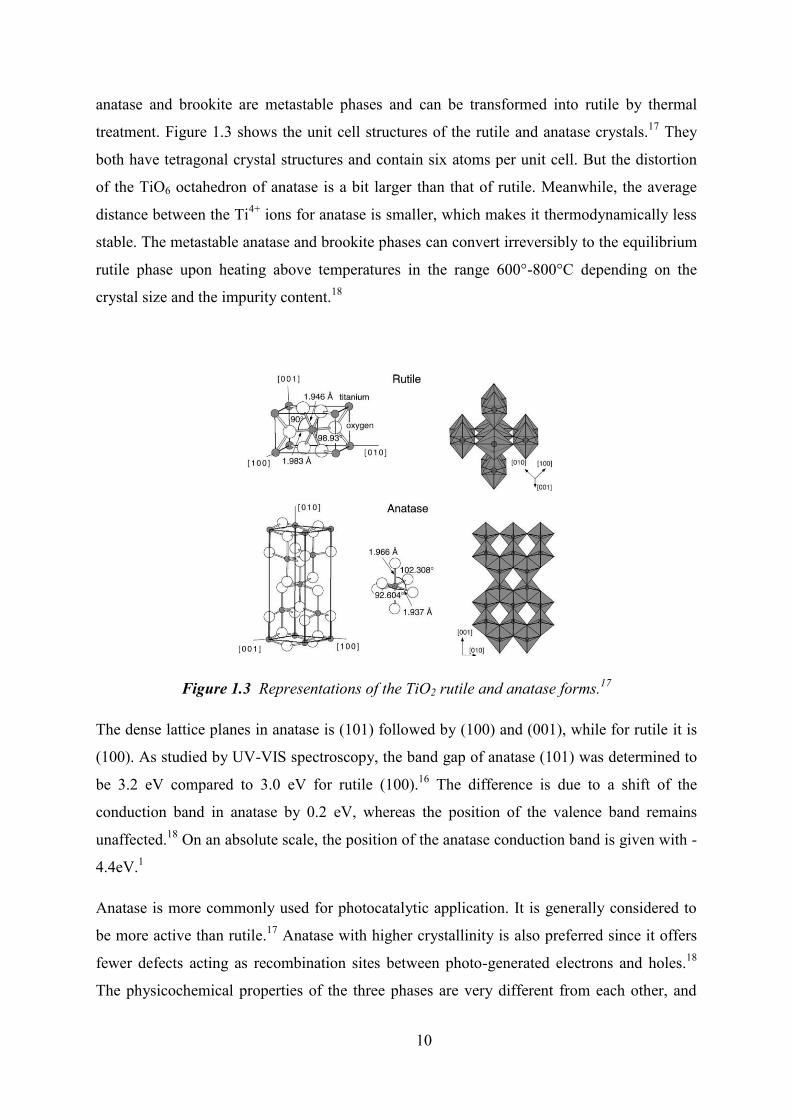
anatase and brookite are metastable phases and can be transformed into rutile by thermal
treatment. Figure 1.3 shows the unit cell structures of the rutile and anatase crystals.17 They
both have tetragonal crystal structures and contain six atoms per unit cell. But the distortion
of the TiO6 octahedron of anatase is a bit larger than that of rutile. Meanwhile, the average
distance between the Ti4+ ions for anatase is smaller, which makes it thermodynamically less
stable. The metastable anatase and brookite phases can convert irreversibly to the equilibrium
rutile phase upon heating above temperatures in the range 600°-800°C depending on the
crystal size and the impurity content.18
Figure 1.3 Representations of the TiO2 rutile and anatase forms.17
The dense lattice planes in anatase is (101) followed by (100) and (001), while for rutile it is
(100). As studied by UV-VIS spectroscopy, the band gap of anatase (101) was determined to
be 3.2 eV compared to 3.0 eV for rutile (100).16 The difference is due to a shift of the
conduction band in anatase by 0.2 eV, whereas the position of the valence band remains
unaffected.18 On an absolute scale, the position of the anatase conduction band is given with -
4.4eV.1
Anatase is more commonly used for photocatalytic application. It is generally considered to
be more active than rutile.17 Anatase with higher crystallinity is also preferred since it offers
fewer defects acting as recombination sites between photo-generated electrons and holes.18
The physicochemical properties of the three phases are very different from each other, and
11
they are closely related to the synthesis conditions. Anatase is the most thermodynamically
stable among the three nanocrystalline phases if the size of the particles is less than 11 nm,
brookite is the most stable phase between 11 nm and 35 nm, and rutile is the most stable when
for sizes larger than 35 nm.19 Thus, the synthesis conditions are very important and the
synthesis parameters such as the crystal structure, surface morphology, and phase stability
should be controlled and optimized.
1.1.3 Titania photocatalytic mechanisms
Semiconductors could be photocatalytic because of their special electronic energy structure.
Differently from metals which have continuous electronic states, semiconductors possess a
void energy region. This energy distance, which is called band gap, extends from the top of
the filled valence band to the bottom of the empty conduction band, and makes the
recombination of an electron and hole difficult. The band gap of the semiconductor gives the
excited hole-electron pairs sufficient time (in the nanosecond regime) to transfer charges to
the surface where adsorbed species sit and can be degraded through redox reactions. This
phenomenon applied in solution or in gas phase (air environment) and is addressed as
heterogeneous photocatalysis.20
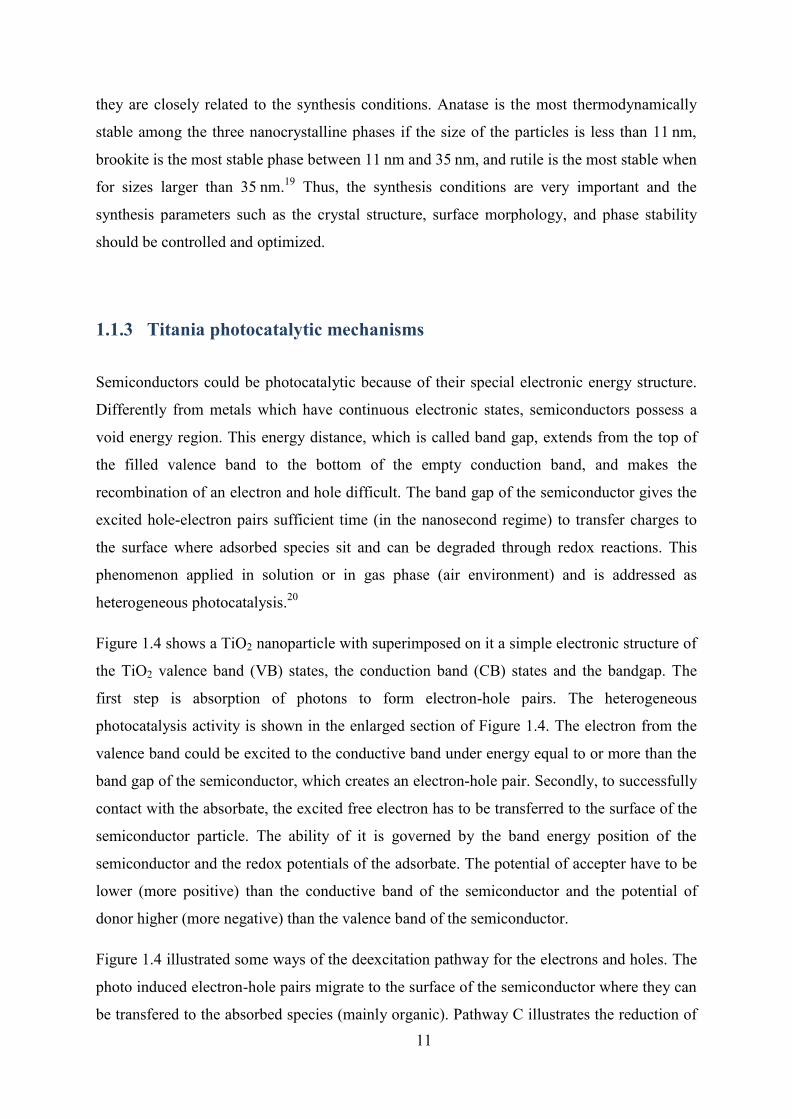
Figure 1.4 shows a TiO2 nanoparticle with superimposed on it a simple electronic structure of
the TiO2 valence band (VB) states, the conduction band (CB) states and the bandgap. The
first step is absorption of photons to form electron-hole pairs. The heterogeneous
photocatalysis activity is shown in the enlarged section of Figure 1.4. The electron from the
valence band could be excited to the conductive band under energy equal to or more than the
band gap of the semiconductor, which creates an electron-hole pair. Secondly, to successfully
contact with the absorbate, the excited free electron has to be transferred to the surface of the
semiconductor particle. The ability of it is governed by the band energy position of the
semiconductor and the redox potentials of the adsorbate. The potential of accepter have to be
lower (more positive) than the conductive band of the semiconductor and the potential of
donor higher (more negative) than the valence band of the semiconductor.
Figure 1.4 illustrated some ways of the deexcitation pathway for the electrons and holes. The
photo induced electron-hole pairs migrate to the surface of the semiconductor where they can
be transfered to the absorbed species (mainly organic). Pathway C illustrates the reduction of
12
acceptors at the surface, happening by donating the photo induced electron to the acceptor,
usually oxygen in an aerated solution. While pathway D describes at the same time the
migration of the photo-induced hole to the surface to catch an electron from the donor species
during its oxidation. Meanwhile, pathway A and B show the recombination of the active
electron-hole pair that may happen at the surface or in the volume of the semiconductor
particle. The action gives back energy releasing heat in a non-radiative transfer.
Figure 1.4 Schematic photoexcitation in a Titania crystal followed by de-excitation events.
Finally, the chemical reactions happening on the surface lead to the end of the heterogeneous
photocatalytic mechanism. Apparently this final activity depends on the redox active sites and
surface area. As well known, even though the generated electrons and holes have
thermodynamically sufficient potentials, they will still have to recombine with each other if
the active sites for redox reactions do not exist on the surface.18
Due to its enormous potential and efficiency to decompose organic contaminates (which is
well known as AOP-advanced oxidation process) in water and air, semiconductor
heterogeneous photocatalysis have been developed since 1970s. Numerous studies on
photocatalytic oxidation process to decompose and mineralize recalcitrant organic
compounds have been investigated during the past several decades.21 Among the many
semiconductor photo catalysts: TiO2, ZnO, Fe2O3, CdS, ZnS, In TiO2, the powerful electron-
hole pairs occur by excitation with ultraviolet light energy higher than 3.2 eV (λ<387nm)
(equal 1). These electron-hole pairs have an oxidizing potential of 2.9 eV versus NHE, which
13
is enough to oxidize most pollutants.
The mechanism is described in below. In equation (2) the hVB+ could catch the electron of the
organic and oxide it into carbon dioxide and water finally. However, the hVB+ could generate
the radicals •OH which has the second highest oxidation potential (2.8eV) (except the
strongest oxidant-fluorine). Due to its electrophilic nature, the •OH radical could convert
almost all the electron rich organic molecules to carbon dioxide and water (equation 4). The
electron which are excited at the conductive band could react with O2 forming an anion
radical O2•- which could lead to •OH finally through equation 6 and 7.23
TiO2 + hv (<387nm) → eCB- + hVB
+ (1)
hVB+ + R → intermediates → CO2 +H2O (2)
H2O + hVB+ →•OH + H+ (3)
•OH + R → intermediates → CO2 +H2O (4)
eCB- + O2 → O2•- (5)
O2•- + 2H+ → H2O2 (6)
H2O2 + 2hVB+ → 2•OH (7)
R = the organic compound.
1.1.4 Factors affecting the photocatalytic activity
The photocatalytic activity is influenced by both the photocatalyst itself and the environment.
Firstly, the structure of the photocatalyst decides the different energy level structure. The
band gap and the species redox potential are also critical parameters. As we explained in the
photocatalytic mechanism, the speed of the redox reaction depends on the potential of the
acceptor and donor compare to the semiconductor band-gap.
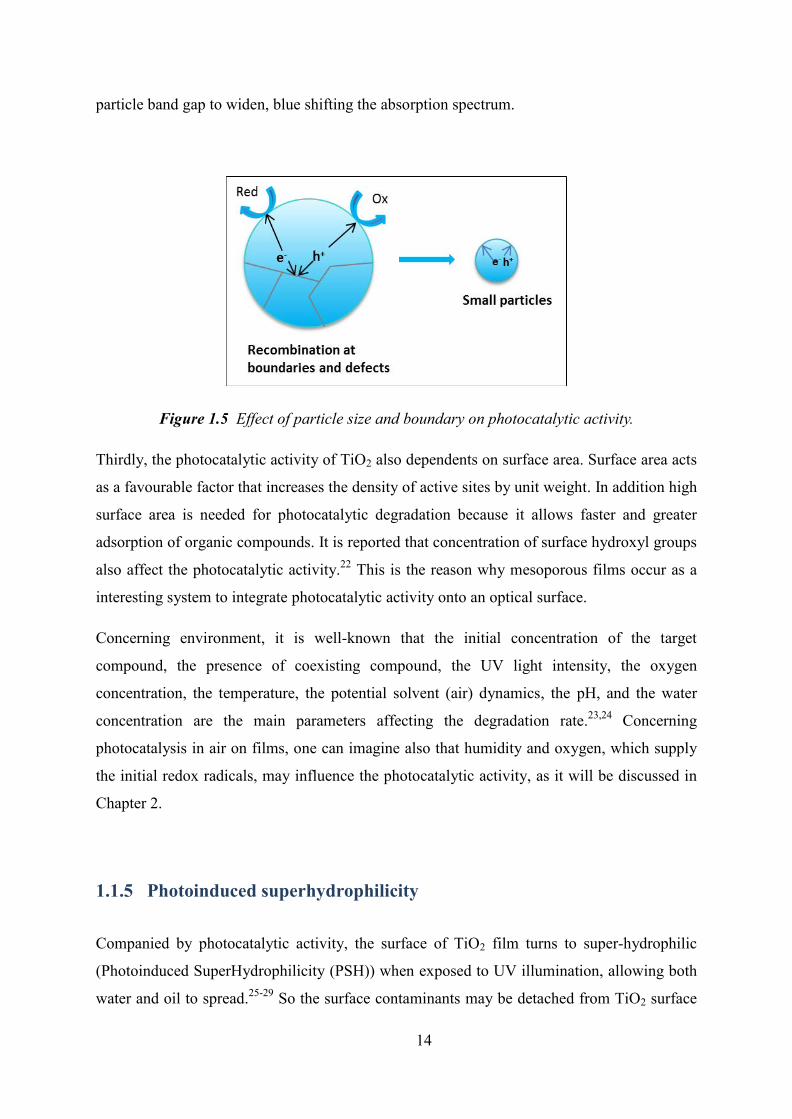
Secondly, the electron migration is affected not only by the crystal structure, but also by the
crystal crystallinity, defects and particle size which strongly affect the electron-hole transfer
step as shown in figure 1.5. The boundaries and defects act as recombination centers. Better
crystallized particles have fewer defects which lead to better photocatalytic activity.
Mentioning about the particle size, a smaller particle offers shorter migration distance for the
photogenerated electrons and holes to reach the reaction sites on the surface, decreasing the
probability for recombination.21 On the other hand, quantum confinement causes small
14
particle band gap to widen, blue shifting the absorption spectrum.
Figure 1.5 Effect of particle size and boundary on photocatalytic activity.
Thirdly, the photocatalytic activity of TiO2 also dependents on surface area. Surface area acts
as a favourable factor that increases the density of active sites by unit weight. In addition high
surface area is needed for photocatalytic degradation because it allows faster and greater
adsorption of organic compounds. It is reported that concentration of surface hydroxyl groups
also affect the photocatalytic activity.22 This is the reason why mesoporous films occur as a
interesting system to integrate photocatalytic activity onto an optical surface.
Concerning environment, it is well-known that the initial concentration of the target
compound, the presence of coexisting compound, the UV light intensity, the oxygen
concentration, the temperature, the potential solvent (air) dynamics, the pH, and the water
concentration are the main parameters affecting the degradation rate.23,24 Concerning
photocatalysis in air on films, one can imagine also that humidity and oxygen, which supply
the initial redox radicals, may influence the photocatalytic activity, as it will be discussed in
Chapter 2.
1.1.5 Photoinduced superhydrophilicity
Companied by photocatalytic activity, the surface of TiO2 film turns to super-hydrophilic
(Photoinduced SuperHydrophilicity (PSH)) when exposed to UV illumination, allowing both
water and oil to spread.25-29 So the surface contaminants may be detached from TiO2 surface
15
if interaction between the semiconductor surface and water is preferred.
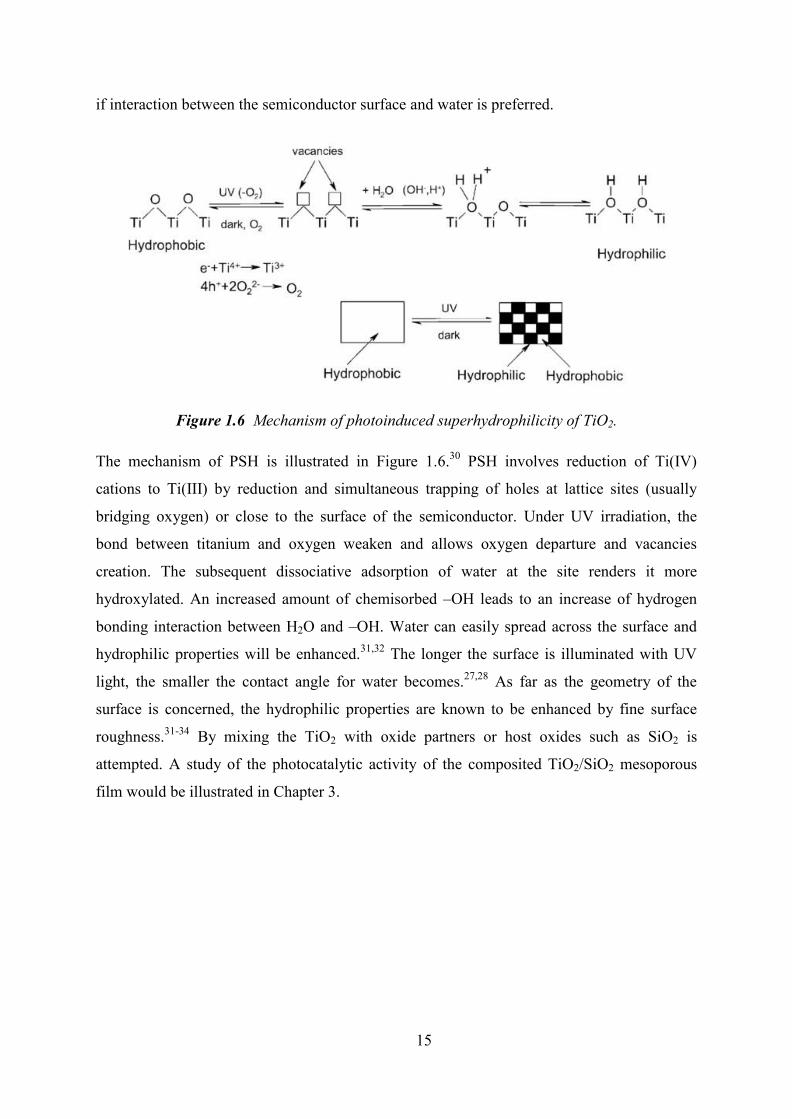
Figure 1.6 Mechanism of photoinduced superhydrophilicity of TiO2.
The mechanism of PSH is illustrated in Figure 1.6.30 PSH involves reduction of Ti(IV)
cations to Ti(III) by reduction and simultaneous trapping of holes at lattice sites (usually
bridging oxygen) or close to the surface of the semiconductor. Under UV irradiation, the
bond between titanium and oxygen weaken and allows oxygen departure and vacancies
creation. The subsequent dissociative adsorption of water at the site renders it more
hydroxylated. An increased amount of chemisorbed –OH leads to an increase of hydrogen
bonding interaction between H2O and –OH. Water can easily spread across the surface and
hydrophilic properties will be enhanced.31,32 The longer the surface is illuminated with UV
light, the smaller the contact angle for water becomes.27,28 As far as the geometry of the
surface is concerned, the hydrophilic properties are known to be enhanced by fine surface
roughness.31-34 By mixing the TiO2 with oxide partners or host oxides such as SiO2 is
attempted. A study of the photocatalytic activity of the composited TiO2/SiO2 mesoporous
film would be illustrated in Chapter 3.
16
1.2 Mesoporous titanium dioxide thin films
1.2.1 Introduction
As discussed in the previous section, titanium dioxide is indeed the most studied
photocatalyst. New promising fields for nanostructured titania that include catalysis,
information technology, non-linear optics, energy transfer devices, biomedical, selective
sensors, absorbents, implant technology et al. require its processing as thin film.35 These
applications require stable materials with a well defined crystalline structure, highly
controlled crystallite size and shape as well as a high, available surface area and accessible
pore networks to ensure contact with catalytic substrates, polymers or nanospecies. In
addition, titania thin films are transparent in the visible region, non-toxic and can be
fabricated by relatively cheap wet processing methods. As high surface area is needed to get
more efficiency in photocatalytic activity, it is not surprising to observe a much higher
activity in mesoporous film than in dense films.36
Porous materials are classically classified in three types depending on their pore size. What
we are more interested in are the mesoporosity, which corresponds to pore size between 2 and
50 nm. While the other two types are: microporous materials with pore sizes below 2 nm and
macroporous materials with pore sizes superior to 50 nm.37-39 Mesoporous materials can
adopt different geometry (lamellar, 2D hexagonal, 3D hexagonal and cubic) depending on the
processing conditions. A number of strategies lead to nanostructured TiO2 thin films from
soft chemistry methods (sol-gel).40-44
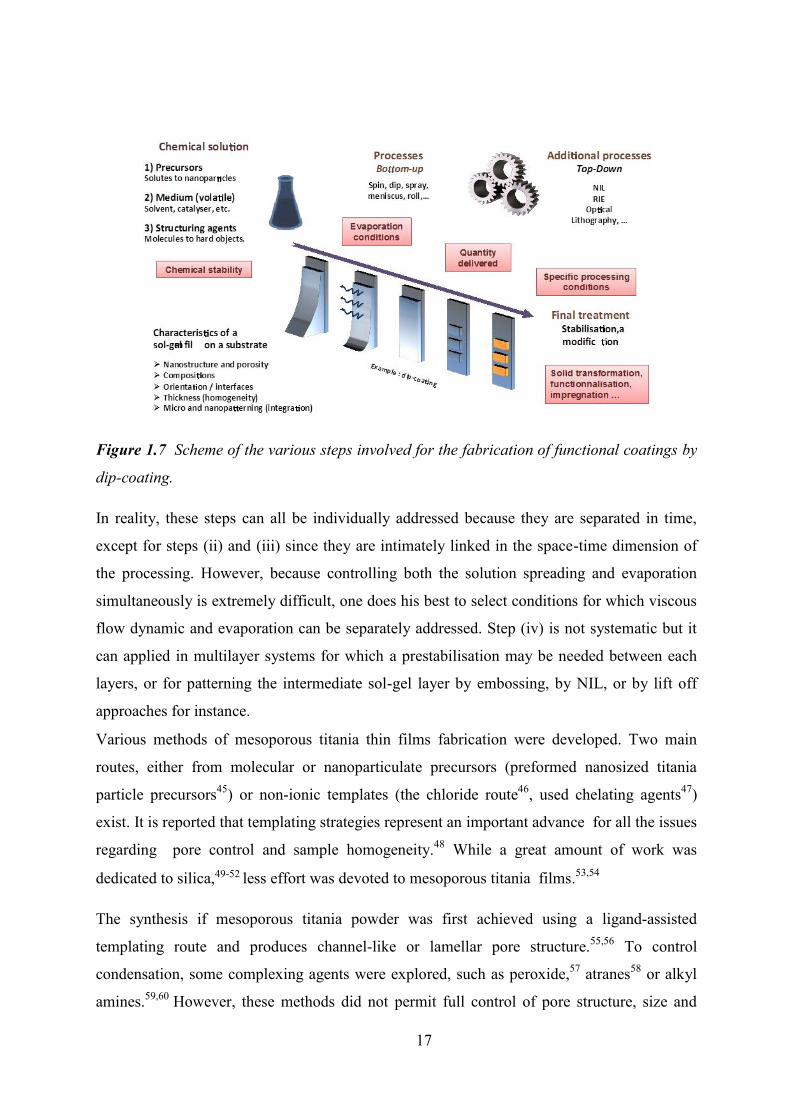
For a better understanding, a global stategy for the fabrication of functional coatings is shown
in Figure 1.7 for the case of dip-coating technique. It consists in a sequence of successive
steps that involves (i) the initial chemical solution formulation, (ii) the solution spreading on
the surface of the substrate, (iii) the evaporation of the liquid solution layer, (iv) the layer post
processing, and finally (v) the layer final treatment for stabilisation.
17
Figure 1.7 Scheme of the various steps involved for the fabrication of functional coatings by
dip-coating.
In reality, these steps can all be individually addressed because they are separated in time,
except for steps (ii) and (iii) since they are intimately linked in the space-time dimension of
the processing. However, because controlling both the solution spreading and evaporation
simultaneously is extremely difficult, one does his best to select conditions for which viscous
flow dynamic and evaporation can be separately addressed. Step (iv) is not systematic but it
can applied in multilayer systems for which a prestabilisation may be needed between each
layers, or for patterning the intermediate sol-gel layer by embossing, by NIL, or by lift off
approaches for instance.
Various methods of mesoporous titania thin films fabrication were developed. Two main
routes, either from molecular or nanoparticulate precursors (preformed nanosized titania
particle precursors45) or non-ionic templates (the chloride route46, used chelating agents47)
exist. It is reported that templating strategies represent an important advance for all the issues
regarding pore control and sample homogeneity.48 While a great amount of work was
dedicated to silica,49-52 less effort was devoted to mesoporous titania films.53,54
The synthesis if mesoporous titania powder was first achieved using a ligand-assisted
templating route and produces channel-like or lamellar pore structure.55,56 To control
condensation, some complexing agents were explored, such as peroxide,57 atranes58 or alkyl
amines.59,60 However, these methods did not permit full control of pore structure, size and
18
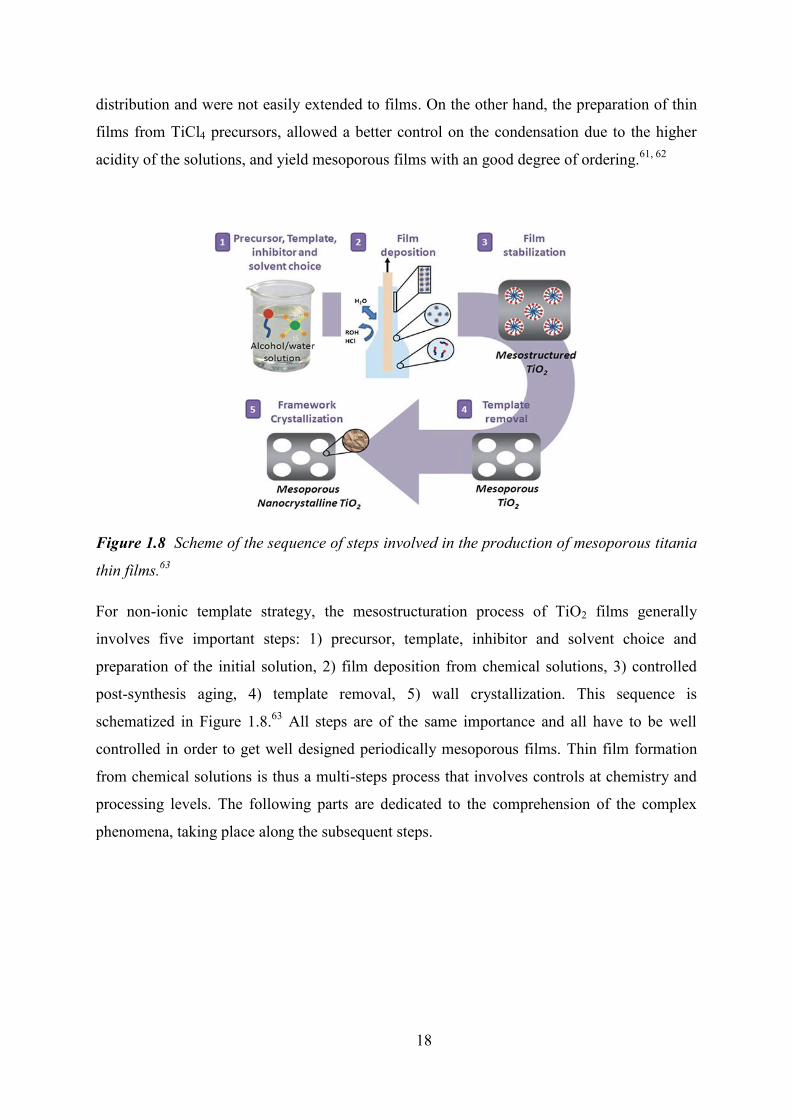
distribution and were not easily extended to films. On the other hand, the preparation of thin
films from TiCl4 precursors, allowed a better control on the condensation due to the higher
acidity of the solutions, and yield mesoporous films with an good degree of ordering.61, 62
Figure 1.8 Scheme of the sequence of steps involved in the production of mesoporous titania
thin films.63
For non-ionic template strategy, the mesostructuration process of TiO2 films generally
involves five important steps: 1) precursor, template, inhibitor and solvent choice and
preparation of the initial solution, 2) film deposition from chemical solutions, 3) controlled
post-synthesis aging, 4) template removal, 5) wall crystallization. This sequence is
schematized in Figure 1.8.63 All steps are of the same importance and all have to be well
controlled in order to get well designed periodically mesoporous films. Thin film formation
from chemical solutions is thus a multi-steps process that involves controls at chemistry and
processing levels. The following parts are dedicated to the comprehension of the complex
phenomena, taking place along the subsequent steps.
19
1.2.2 Initial Solution Preparation
The initial solution is of foremost important to the pore formation and is addressed as the
chemical conditions. In order to fit the high curvature of the micelles during self-assembly, it
is important to keep the titanium entities as small as possible and hydrophilic enough to
promote the interaction with the hydrophilic part of the surfactant. It implies the following
components: 1) a low surface tension solvent to improve wettability and cut back the
reactivity of the inorganic species by dilution; 2) an inorganic hydrolysis/condensation agent,
such as water; 3) the precursor, an inorganic species, whether molecular, cluster-like, or
nanosized; 4) a supermolecular template, a surfactant, acting as porogen; 5) a condensation
controlling agent or inhibitor. These chemical conditions must be fixed in order to control
accurately the Ti-O-Ti bond polycondensation. There are synthesis methods for both
molecular and pre-formed building blocks (nanoparticles) precursors. When using molecular
precursors, the condensation is controlled by adding acidic inhibitor or chelating agents. For
nanoparticle precursor, the size have to be properly controlled to a narrow distribution and
make it much smaller than the gyration radius of the template.
Towards mesoporous titania thin films, TiCl4 or Ti(OR)4 (OR: ethoxide, i-propoxide, n-but-
oxide) are most used as precursors in a classic synthesis. The solution is prepared by adding
the precursor slowly into the solvent (usually ethanol solution) with vigorous stirring. When
titania alkoxides are used, it is necessary to add acid or chelating agents. For both precursors
(alcoxides or salts), the intermediate species are controlled by chemical equilibrium existing
between the free and the coordinated nucleophilic species (z, u, v) while the ratio of
condensation (x, y) is decided by the sol-gel ratio h=[H2O]:[Ti] and p=[H+]:[Ti]. The same
solution is thus obtained from different precursors, as shown:
→
𝐶 →
During the synthesis of mesoporous titania, the precursors such as titanium alkoxides and
titanium tetrachloride, usually goes to hydrolysis and condensation very rapidly resulting
into precipitation and could not form mesopores. It’s of critical important to add inhibitor to
control the synthesis and condensation. So acidic species or some chelating agents has to be
added for the use of Ti(OR)4 precursor to control the condensation. Some chelating agents
(such as acetate or diketonate) are used as efficient growth inhibitor, which induces well
20
ordered mesopore structure. Unfortunatly the higher content of organic leads to a greater
contraction and collapse during thermal treatment. Hydrochloride acid is generally used in
these conditions to prevent fast condensation (instead of organic chalting agents). HCl is
however, not required for TiCl4 precursor, since the solution becomes naturally very acidic
upon hydrolysis. Anyway, the use of alkoxides and chlorides lead to similar intermediates as
the formation of Ti(IV) species is governed by the same chemical exchanges in the same
environment.
The porous system with a variety of ordering was influenced by different hydrolysis-
condensation conditions (sol-gel ratio h and p). Soler-Illia, G J A A et al investigated this
aspect by 17 O NMR of acidic titanium ethoxide solution with a different p = [H+] : [Ti(IV)]
ratio.64,65 The study showed larger signals belonging to µ2−, µ3−, µ4−oxo bridges appear in
less acidic solutions (p=1), which reveal more polydisperse and more condensed, larger Ti-
oxo polymers. While in more acidic solutions (p=4), a small amount of µ2-oxo bridges single
signal was observed indicative of smaller building blocks more suitable mesostructuring. This
was further confirmed by SAXS investigations of F127 templated films that revealed a higher
mesostructure ordering with smaller, less condensed building blocks. This may due to the
smaller dimensions of the blocks leading to a higher flexibility toward the template curvature
during solvent evaporation when the mesostructure starts to form.63 Aging conditions may
also influences the Ti-O-Ti condensation process in solution.
Preformed nanocrystalline titania has also been used as organic precursor to obtain film with
crystalline character at relatively low temperature while the molecular precursor results in
amorphous or semi crystalline wall. The titania nanoparticles are produced by presynthesis
after hydrolysis and condensation.
Working as a structure directing agent, the choice of the template is principally important to
control the porous network and the pore size. The properties of the mesoporous films are
related to the porosity %vol, pore size and pore size distribution. Most of the mesoporous
titania thin films are synthesised by using structure directing templates with non-ionic
hydrophilic blocks. Amphiphilic block copolymers (ABC) are particularly suitable templates
which lead to ordered mesoporous materials.
Triblock copolymers [HO(CH2CH2O)n−(CH2CH(CH3)O)m(CH2CH2O)nH, Pluronic
F127(average n/m=106/70) and Pluronic P123(average n/m=20/70)] are the well- known
commonly used amphiphilic block copolymers as structure directing agents.
21
More recently tailor-made block copolymers have become more and more used. In this new
family of template we can cite poly(etylene-co-butylene)-b-poly(ethylene oxide) (also called
“KLE”), poly(isobutylene)-b-poly(ethylene oxide) (PIB-b-PEO), poly(styrene)-b-
poly(ethylene oxide) (PS-b-PEO) and poly(butadyene)-b-poly(ethylene oxide) (PB-b-PEO);
the hydrophic part is chemically and thermally more stable than the PPO family and allows
the synthesis of a variety of mesoporous thin films in less drastic experimental conditions. In
addition the higher hydrophobic contrast achieved in these templates gives them the ability to
self-assemble faster and in a broader range of solvent.
1.2.3 Chemical Solution Deposition
A great number of different chemical, physicochemical and physical techniques could be
used for preparing thin films. While physical deposition techniques are preferred for dense
thin films, porous films are generally accessed by chemical solution deposition (CSD)
approach, such as dip, spin, meniscus, and spray coatings. They are seen as alternatives to dry
deposition techniques, such as PVD, CVD or PEVCD, because they combine excellent
control of the thinner layer structure and composition rapidly and low cost. Among the
various available techniques, some are already commonly used in various R&D and
production industries, such as dip coating or spin coating, while others are still in their
infancy and are in the process of being well understood and mastered, such as spray or ink-jet
coating. Each technique has advantages and drawbacks related to reproducibility, substrate
size and morphology, thickness control and homogeneity, accessibility, system handling,
disposability, etc. The choice usually depends on the coating requirements and the production
line.
With no doubt, dip coating is the easiest way to form a mesoporous film of optical quality. It
offers the maximum control over the evaporation conditions, which permits the deposition of
difficult solutions, or the control of unique characteristics (composition, mesostructure, etc.).
22
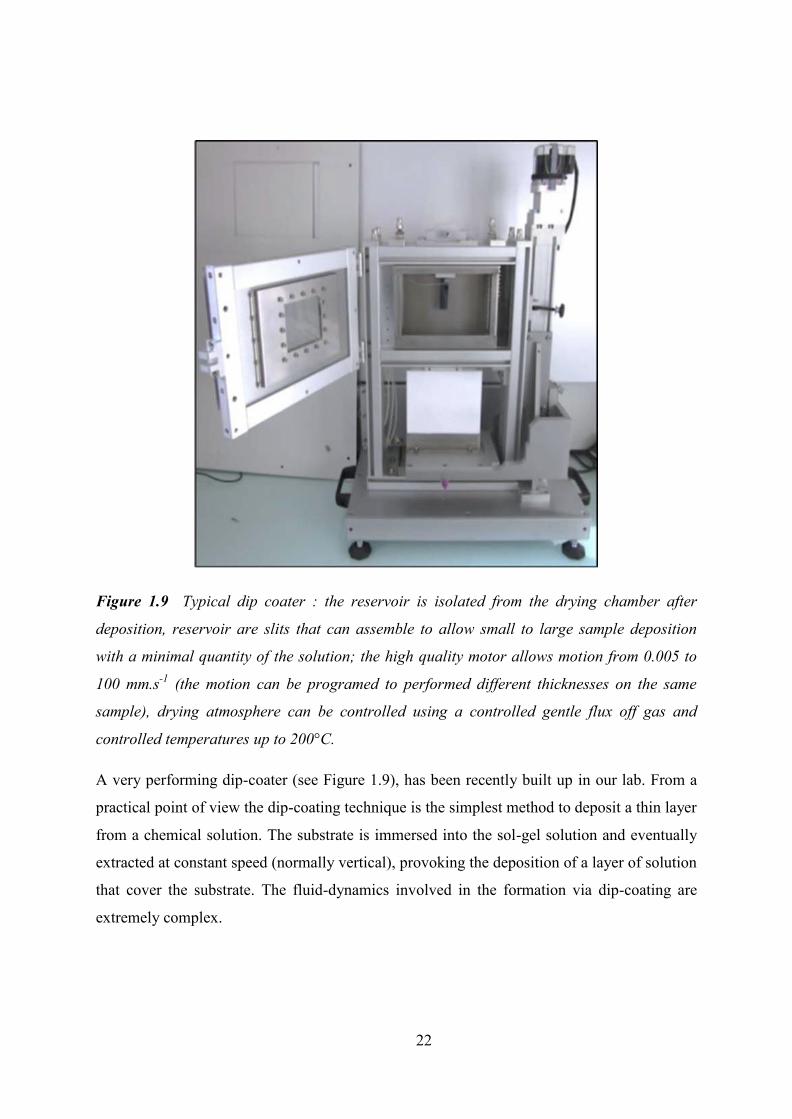
Figure 1.9 Typical dip coater : the reservoir is isolated from the drying chamber after
deposition, reservoir are slits that can assemble to allow small to large sample deposition
with a minimal quantity of the solution; the high quality motor allows motion from 0.005 to
100 mm.s-1 (the motion can be programed to performed different thicknesses on the same
sample), drying atmosphere can be controlled using a controlled gentle flux off gas and
controlled temperatures up to 200°C.
A very performing dip-coater (see Figure 1.9), has been recently built up in our lab. From a
practical point of view the dip-coating technique is the simplest method to deposit a thin layer
from a chemical solution. The substrate is immersed into the sol-gel solution and eventually
extracted at constant speed (normally vertical), provoking the deposition of a layer of solution
that cover the substrate. The fluid-dynamics involved in the formation via dip-coating are
extremely complex.
23
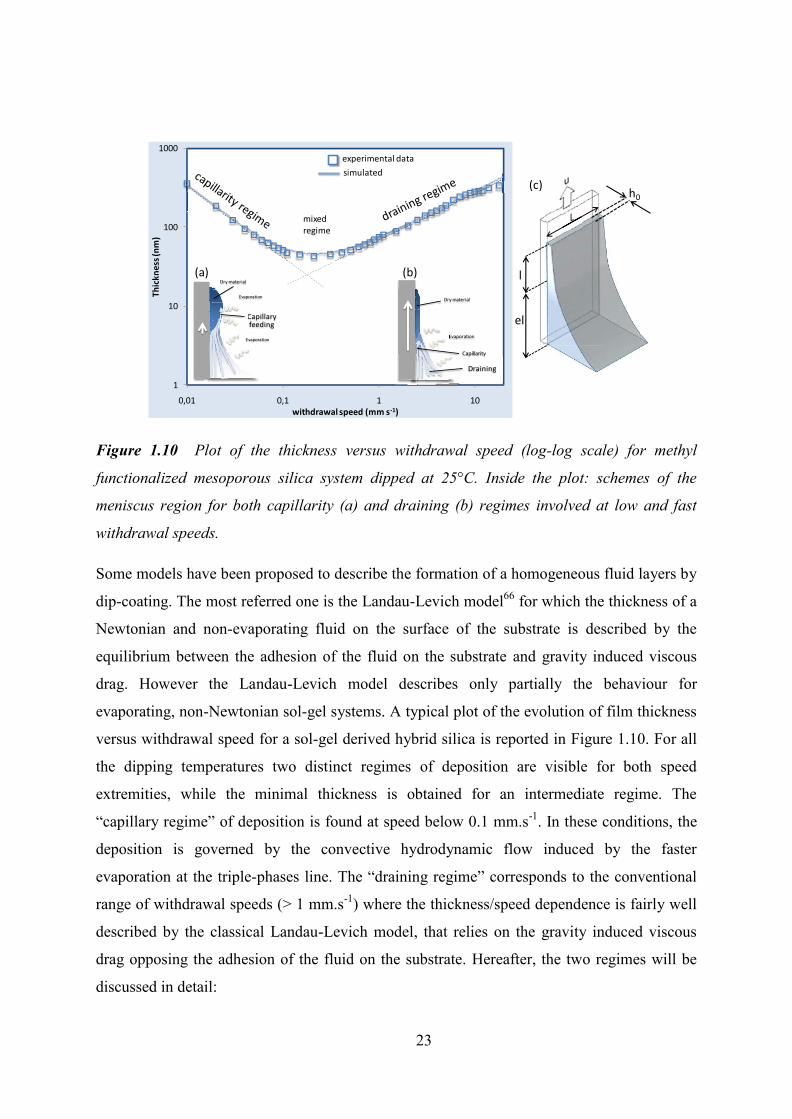
Figure 1.10 Plot of the thickness versus withdrawal speed (log-log scale) for methyl
functionalized mesoporous silica system dipped at 25°C. Inside the plot: schemes of the
meniscus region for both capillarity (a) and draining (b) regimes involved at low and fast
withdrawal speeds.
Some models have been proposed to describe the formation of a homogeneous fluid layers by
dip-coating. The most referred one is the Landau-Levich model66 for which the thickness of a
Newtonian and non-evaporating fluid on the surface of the substrate is described by the
equilibrium between the adhesion of the fluid on the substrate and gravity induced viscous
drag. However the Landau-Levich model describes only partially the behaviour for
evaporating, non-Newtonian sol-gel systems. A typical plot of the evolution of film thickness
versus withdrawal speed for a sol-gel derived hybrid silica is reported in Figure 1.10. For all
the dipping temperatures two distinct regimes of deposition are visible for both speed
extremities, while the minimal thickness is obtained for an intermediate regime. The
“capillary regime” of deposition is found at speed below 0.1 mm.s-1. In these conditions, the
deposition is governed by the convective hydrodynamic flow induced by the faster
evaporation at the triple-phases line. The “draining regime” corresponds to the conventional
range of withdrawal speeds (> 1 mm.s-1) where the thickness/speed dependence is fairly well
described by the classical Landau-Levich model, that relies on the gravity induced viscous
drag opposing the adhesion of the fluid on the substrate. Hereafter, the two regimes will be
discussed in detail:
1
10
100
1000
0,01 0,1 1 10
Thick
ness
(nm
)
withdrawal speed (mm s-1)
Dry material
Capillary feeding
Evaporation
Evaporation
Dry material
Dry material
Draining
Evaporation Evaporation
Capillarity
(a)
h0
l
el
experimental datasimulated
mixedregime
(b)
(c)
24
Model for the capillarity regime: At low withdrawal speeds, solvent evaporation becomes
faster than the motion of the drying line (three-phases-frontier), which leads to the continuous
feeding of the upper part of the meniscus by the solution through capillarity raise. In what
follows, it is assumed that the evaporation rate is constant and the mass conservation law tells
that the rate of film volume formation (F) can be related to the rate of solution feeding the
upper zone of the drying line, which is directly related to the rate of solution undergoing
evaporation (E). If ci is the solution inorganic molar concentration and i the volume fraction
of inorganic material in the final film, that can be deduced from the refractive index,67 one
can write:
(8)
F and E are in m3s-1, while Mi and ρi are the molar weight and the density of the thermally
stabilized inorganic material respectively. These chemical solution characteristics can be
replaced by ki, that is the material proportion constant for each solution. The rate of film
formation F corresponds to the variation of film volume with time, which leads to
(9)
With Vf, h0, l and L being the volume, the thickness, the height and the width of the
considered final film respectively. Since L is constant and l varies with the withdrawal speed
u=dl/dt, equation (9) can be transformed into (10).
(10)
The h0/ki versus 1/u plot gives a straight line when the capillarity/evaporation regime is
dominating the formation of the film, for which the slope corresponds to the rate of solution
consuming E/L (in m2.s-1). The latter value is thus deduced experimentally, and can then be
reintroduced in equation (10) to predict the thickness with respect to withdrawal rate in the
capillarity regime. The latter tendency confirms that the thickness proportionally varies with
u at the power -1 in these dip-coating conditions, while Le Berre et al. found a power of -1.1
with their horizontal set-up.68
Model for the draining regime: For high speed values, the formation of film is usually
F =ciMi
� i�i
E = kiE
dVf
dt=h0Ldldt
=ciMi
� i�i
E
h0 =ciMi
� i�i
EL
1u
= kiEL
1u
25
described by the Landau-Levich equation (11) that allows to predict the thickness (hS) of a
non-evaporating Newtonian fluid (the solution here) deposited by dip-coating with respect to
the fluid physical-chemical properties and the deposition processing conditions such as speed
and temperature. This equation was established considering that the fluid thickness is
homogeneous all over the substrate surface if the speed is constant, which is due to a delicate
balance between the viscous drag and the wetting property of the fluid with the substrate
surface.
(11)
ηS, γLS, ρS are the viscosity, the surface tension, and the density of the fluid respectively,
while g is the standard gravity. In the present case the fluid is the initial solution. For the
modelling one considers that the solution behaves as a Newtonian fluid (which is an
approximation since the viscosity and surface tension change with evaporation that
simultaneously induces concentration increase and condensation). The evaporation is taken
into account by introducing the material proportion constant ki in the equation while the
physico-chemical constants of the solution are gathered into a global constant D such that
equation (11), describing the fluid equilibrium thickness, becomes equation (12), describing
the final film thickness, disregarding the evaporation-dependent parameters.
(12)
For the Landau-Levich-based model to be verified, D must be constant whatever the value of
u. D can be calculated from experimental data since one know ki and h0 for each speed. D
values are reported for various sol-gel solutions.66 D can be extracted from experimental
points, in a range of u where D is rather constant, and can then be reintroduced in equation
(10) to predict the thickness with respect to the withdrawal rate in the draining regime.
Combining models to describe simultaneous both regimes: At intermediate u values, both
regime of film formation are overlapping and must be taken into account. Summing both
contributions (equations (10) and (12) into equation (13)), allows a fairly well description of
the final thickness with respect to the speed, suggesting that each regime does not influence
significantly the other one when overlapping.
hs =0.94�s
2 / 3
�LS1/ 6(�sg)1/ 2 u
2 / 3
h0 = kiDu2 / 3
26
(13)
The global evolution of the thickness described by this equation perfectly matches the
experimental points, especially at intermediate u values. Since the thickness reaches a
minimum value h0min at intermediate critical speed uc, the derivative of equation (13) must be
null for u = uc. uc can thus be calculated using relation (13) for which (dh0/du) = 0.
(14)
Adjusting final thickness by dip-coating may also be achieved by playing on the dilution
parameter ki. Because viscosity does not change too much when changing the concentration
in a reasonable range of a typical sol-gel solution, the thickness is quasi proportional to the
initial sol-gel concentration in both capillary and draining regimes. It is thus easy to adjust the
thickness if the processing conditions are fixed. On the other hand, increasing evaporation
rate can be tuned by lowering partial vapor pressure of component to evaporate in the drying
chamber or by simply increasing atmospheric temperature. While increasing evaporation rate
has no significant effect in the draining regime, it is a critical parameter in the capillary
regime. Experimental investigations confirmed that final film thickness is proportional to
evaporation rate at low withdrawal speed as revealed by equation (13). It was also
demonstrated that optical quality sol-gel films can be processed from pure aqueous solutions
at temperatures above 40°C since surface tension of water drops down with increasing
temperature, speeding up evaporation and improving the wetting properties of the solution.69
For a given solution, a thickness lower limit exists, that cannot be overcome except by
dilution of the initial solution. On the other hand, thicker films can be obtained with highly
diluted solutions at ultra-low withdrawal speeds than at high speeds. This is important when
species to deposit cannot be dissolved or dispersed in high concentrations. Increasing
temperature allows depositing thicker films in the capillarity regime, which is extremely be
useful when the solvent is poorly volatile such as water.69 Since any wetting solvent will give
a meniscus, solvent with high surface tension such as water again can be used without
dewetting problems, which are always encountered in the draining regime. Dip-coating
conformation allows also to process films with one-directional thickness gradients by
programming withdrawal speed along the dipping direction, which is very useful for
sampling the influence of the thickness on a single substrate sample, or also to construct multi
h0 = ki(ELu
+ Du2 / 3)
uC =2DL3E
� � �
� � ÷
�3 / 5
27
wavelengths interferometry monochromators. Dip-coating may also be attractive because it is
solution waste-free, since the whole quantity of solution that is withdrawn forms the final
layer. On the other its main drawback lays in the fact that all faces of the substrate will be
coated, which is not often required when manufacturing optical devices. Another drawback
exists when coating in the capillary regime. Because of the slow meniscus motion, a stick-
and-slip effect may occur in certain conditions, which produces periodical fluctuation in
thickness. While these fluctuations are typically of only a few tens of nanometer, they are not
detrimental to the film cohesion but only affect the visible aspect of the layer. This effect is
thus not a problem for applications that do not require optical homogeneity such as sensors or
electrodes.
1.2.4 Evaporation Induced Self-Assembly Method
Evaporation induced self-assembly method (EISA) is compatible with chemical solution
deposition (CSD) techniques. Among the wide variety of synthesis strategies developed so far,
evaporation induced self-assembly (EISA) method is considered of most convenient and
promising method for porous film preparation which was first proposed and reported by
Ogawa, Ozin’s and Brinker’s groups.70-72 Other approaches such as polymer layer casting,
growth at solution/air interfaces, or electrochemical deposition have been attempted with
more or less success. But these methods do not ensure good reproducibility and
mesostructured control as well as EISA can.
In the EISA approach, the templating agent and the inorganic precursors are gathered in the
same solution, for which chemical conditions, for example composition, stoichiometry,
addition of polymerization catalyst or inhibiting agent, aging time, etc., are adjusted so as to
favour homogeneous dispersion of both parts. At the drying line, the film reaches a tunable
steady state in which the mesostructure can be changed by the humidity or the temperature of
the environment.
28
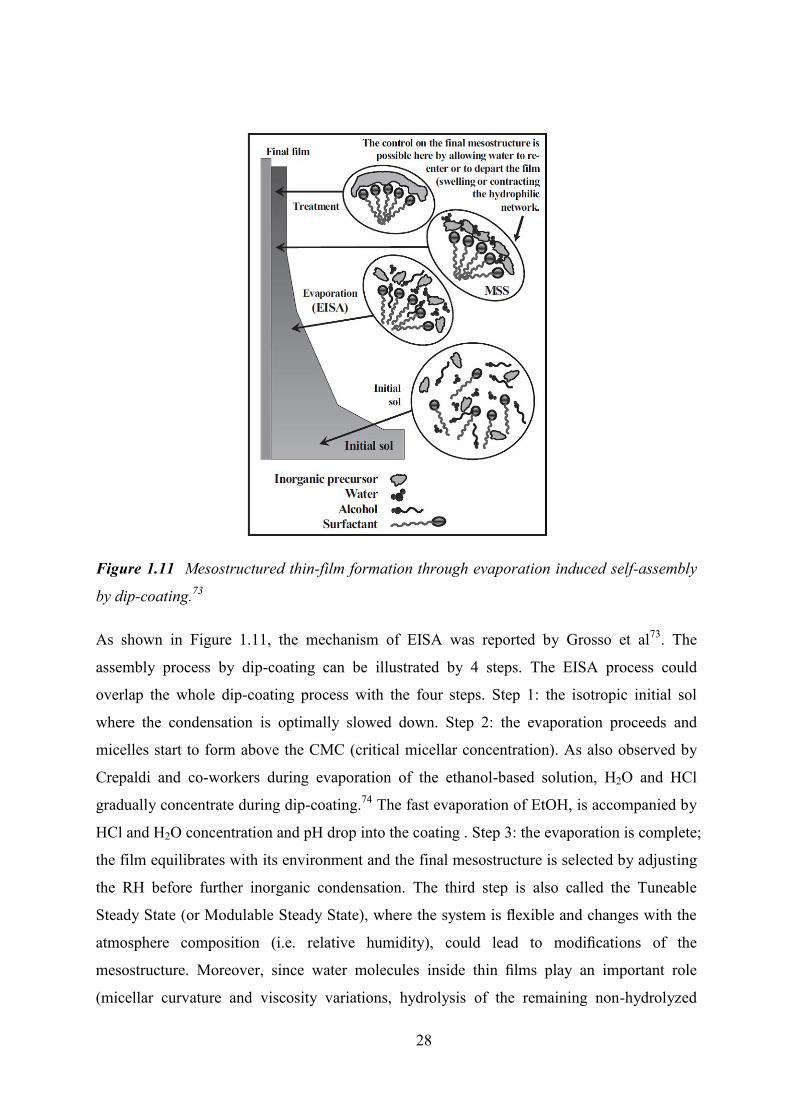
Figure 1.11 Mesostructured thin-film formation through evaporation induced self-assembly
by dip-coating.73
As shown in Figure 1.11, the mechanism of EISA was reported by Grosso et al73. The
assembly process by dip-coating can be illustrated by 4 steps. The EISA process could
overlap the whole dip-coating process with the four steps. Step 1: the isotropic initial sol
where the condensation is optimally slowed down. Step 2: the evaporation proceeds and
micelles start to form above the CMC (critical micellar concentration). As also observed by
Crepaldi and co-workers during evaporation of the ethanol-based solution, H2O and HCl
gradually concentrate during dip-coating.74 The fast evaporation of EtOH, is accompanied by
HCl and H2O concentration and pH drop into the coating . Step 3: the evaporation is complete;
the film equilibrates with its environment and the final mesostructure is selected by adjusting
the RH before further inorganic condensation. The third step is also called the Tuneable
Steady State (or Modulable Steady State), where the system is flexible and changes with the
atmosphere composition (i.e. relative humidity), could lead to modifications of the
mesostructure. Moreover, since water molecules inside thin films play an important role
(micellar curvature and viscosity variations, hydrolysis of the remaining non-hydrolyzed
29
precursor) in the formation of the liquid-crystalline phase, the fast water equilibrium appears
to be a critical point due to the competition of this process with the inorganic condensation.
Step 4: the inorganic network is condensed enough so that the hybrid mesostructure is
stabilized. Indeed the aim is to limit as far as possible chemical modifications and possible
phase separation resulting from solubility heterogeneity between non volatile species (i.e.
cations or hydrophobic organosilanes aggregation).
1.2.5 Aging
Considering the existence of a Tunable Steady State, aging freshly dip-coating films under
controlled environmental humidity and temperature is a crucial step during the formation of
well-ordered mesostructure.75 Crepaldi et al introduced the typical ageing step at 50% relative
humidity atmosphere. Even if the high humidity promotes template rearrangement, more than
70% humidity could destroy the meso-ordering because excessive mount of water induces
high film swelling.76 Soler-Illia et al reported that a highly ordered mesoporosity can be
achieved by a prolonged treatment at RH between 20 to 50%.63 It was reported that a purely
aqueous solution, composed of only water, TiCl4 and F127 leads to a similar mesoporous
structure, without the need of a humidity treatment, which clearly simplifies the problem.77
To do so, films were processed by dip-coating in warm atmosphere (40-80°C) to prevent
dewetting. The high quantity of water in the solution makes obsolete the use of a humidity
treatment.
However, the humidity treatment is also inducing to faster condensation of the inorganic
network through elimination of HCl. In order to optimize a better process to obtain highly
organized mesoporous titania thin films, a series of study was investigated that reports the
influence of relative humidity on the kinetics of condensation of F127 templated mesoporous
titania thin films from TiCl4 precursors.63
30
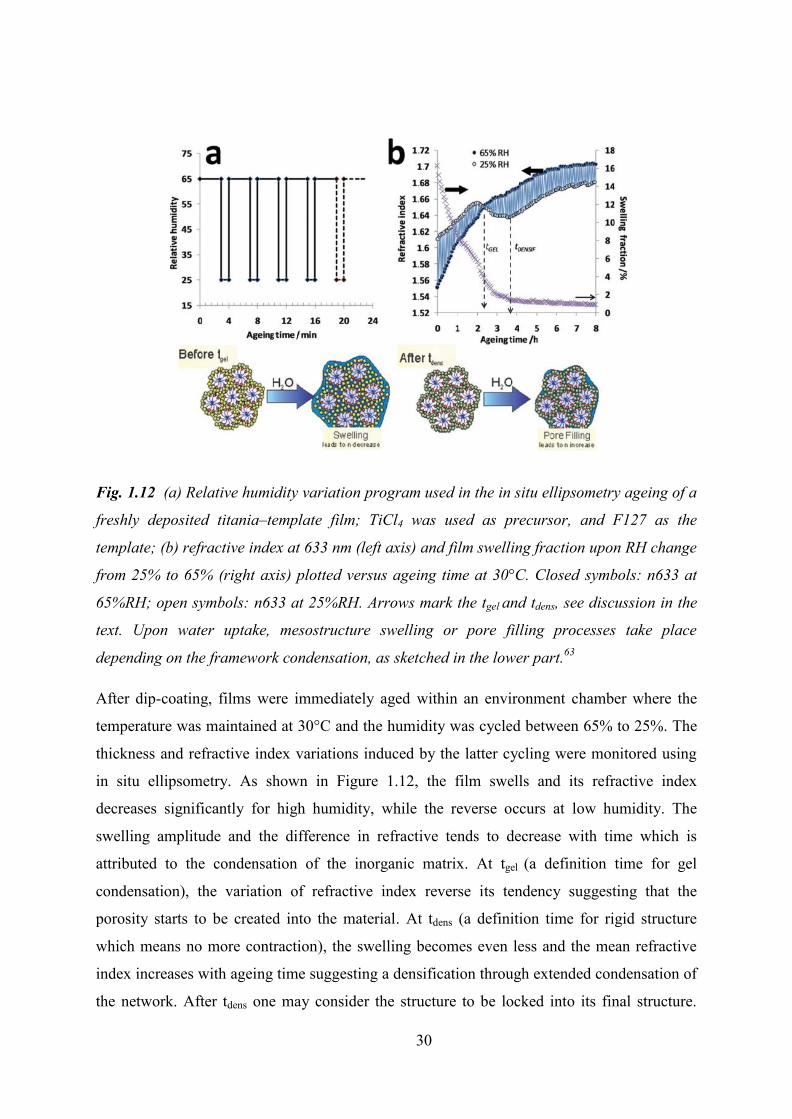
Fig. 1.12 (a) Relative humidity variation program used in the in situ ellipsometry ageing of a
freshly deposited titania–template film; TiCl4 was used as precursor, and F127 as the
template; (b) refractive index at 633 nm (left axis) and film swelling fraction upon RH change
from 25% to 65% (right axis) plotted versus ageing time at 30°C. Closed symbols: n633 at
65%RH; open symbols: n633 at 25%RH. Arrows mark the tgel and tdens, see discussion in the
text. Upon water uptake, mesostructure swelling or pore filling processes take place
depending on the framework condensation, as sketched in the lower part.63
After dip-coating, films were immediately aged within an environment chamber where the
temperature was maintained at 30°C and the humidity was cycled between 65% to 25%. The
thickness and refractive index variations induced by the latter cycling were monitored using
in situ ellipsometry. As shown in Figure 1.12, the film swells and its refractive index
decreases significantly for high humidity, while the reverse occurs at low humidity. The
swelling amplitude and the difference in refractive tends to decrease with time which is
attributed to the condensation of the inorganic matrix. At tgel (a definition time for gel
condensation), the variation of refractive index reverse its tendency suggesting that the
porosity starts to be created into the material. At tdens (a definition time for rigid structure
which means no more contraction), the swelling becomes even less and the mean refractive
index increases with ageing time suggesting a densification through extended condensation of
the network. After tdens one may consider the structure to be locked into its final structure.
31
This experiment confirms that the as-prepared mesostructure is indeed alive and responds to
humidity through adsorption into the material. Infiltrated water modifies the thickness and the
chemical reactions of condensation through elimination of HCl. An optimal aging time exists
at tdens. This time depends on the temperature and can be considerably reduced for slightly
higher temperature as a result of faster molecular exchange (2 or 3 minutes is enough above
34°C). In such conditions, mesoporous TiO2 films with a relatively high porosity and with
narrow pore size distribution can be prepared in a faster way. Interestingly, the porosity
appears to be highly accessible since large constrictions are present. In this thesis, this
approach will be used to prepare the TiO2 films.
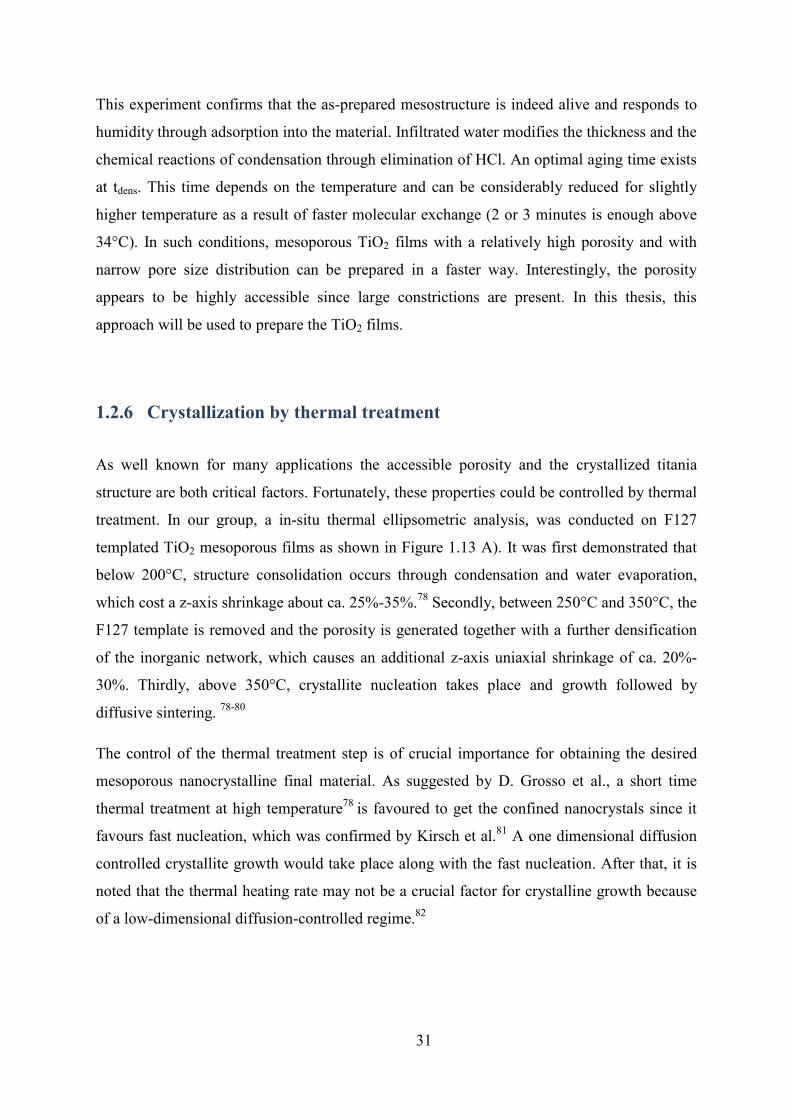
1.2.6 Crystallization by thermal treatment
As well known for many applications the accessible porosity and the crystallized titania
structure are both critical factors. Fortunately, these properties could be controlled by thermal
treatment. In our group, a in-situ thermal ellipsometric analysis, was conducted on F127
templated TiO2 mesoporous films as shown in Figure 1.13 A). It was first demonstrated that
below 200°C, structure consolidation occurs through condensation and water evaporation,
which cost a z-axis shrinkage about ca. 25%-35%.78 Secondly, between 250°C and 350°C, the
F127 template is removed and the porosity is generated together with a further densification
of the inorganic network, which causes an additional z-axis uniaxial shrinkage of ca. 20%-
30%. Thirdly, above 350°C, crystallite nucleation takes place and growth followed by
diffusive sintering. 78-80
The control of the thermal treatment step is of crucial importance for obtaining the desired
mesoporous nanocrystalline final material. As suggested by D. Grosso et al., a short time
thermal treatment at high temperature78 is favoured to get the confined nanocrystals since it
favours fast nucleation, which was confirmed by Kirsch et al.81 A one dimensional diffusion
controlled crystallite growth would take place along with the fast nucleation. After that, it is
noted that the thermal heating rate may not be a crucial factor for crystalline growth because
of a low-dimensional diffusion-controlled regime.82
32
Figure 1.13 A) In-situ thermal ellipsometry scheme (left), evolution of refractive index and
thickness vs temperature (right). B) Evolution from a cubic pore symmetry obtained at 350 °C
(left) to grid-like pores obtained at a short treatment at 600 °C (right) mesostructure upon
thermal treatment, as witnessed by TEM, SAXS and EP. Scale bars represent 50 nm.
This morphological evolution can be visualized in Figure 1.13 (B) (nanoscale ref. For
example, a (110) oriented cubic Im3m structure (obtained at 350°C) experiences successively
unidirectional shrinkage, nucleation-growth and diffusive sintering when heated at 600°C.
This leads to pore merging in the direction where the interpore walls are thinner. The
resulting structure can be defined as a “grid-like” structure. This structure is recognised by
the GI-SAXS diffraction signals corresponding to the lateral periodicity derived from the (1–
A
B
33
10) cubic peaks at qz = 0 (Figure 1.13 B). As a result of the sintering process, the film
interpore connectivity is modified as proven by the observed evolution of the adsorption
/desorption isotherms. The cubic structure obtained at 350 °C presents an wide hysteresis
loop, typical of mesopores with restrictions. The adsorption-desorption curve of a grid-like
mesostructure obtained after a short thermal treatment to 600 °C presents a narrow loop with
parallel branches that is similar to the ones obtained for open-ended cylindrical pores.
1.3 Photocatalytic characterization of TiO2 films
1.3.1 Introduction
The photocatalytic efficiency of mesoporous titania films is usually investigated through
impregnation of an organics probe into the porosity and monitoring of its degradation upon
UV irradiation. Many methods based on various types of probes and on various types of
analysis technique have been explored, which all present advantages and drawbacks. Dyes are
commonly used as model pollutants, partly because their concentration can be easily
monitored using a spectrometer. However, it was also studied that as dyes absorb light,
especially in the visible range, the influence of this photoabsorption should be excluded for
evaluation of the real photocatalytic activity of photocatalysts.83 Another alternative would be
to use fluorescent probes for which emission variation can be followed spectroscopically (7-
hydroxycoumarin by coumarin and 2-hydroxyterephthalic acid by terephthalic).84 The
characteristic study of photocatalytic activity of TiO2 thin films varies with the different
probes. With impregnated dyes, one would use UV-Visible spectroscopy,80 while with
impregnated fluorescent probes, the photocatalytic activity could be studied by fluorescence
spectroscopy.85 With adsorbed lauric acid, the photocatalytic activity can be monitored
though the variation of water contact angle at the TiO2 thin film surface.80
34
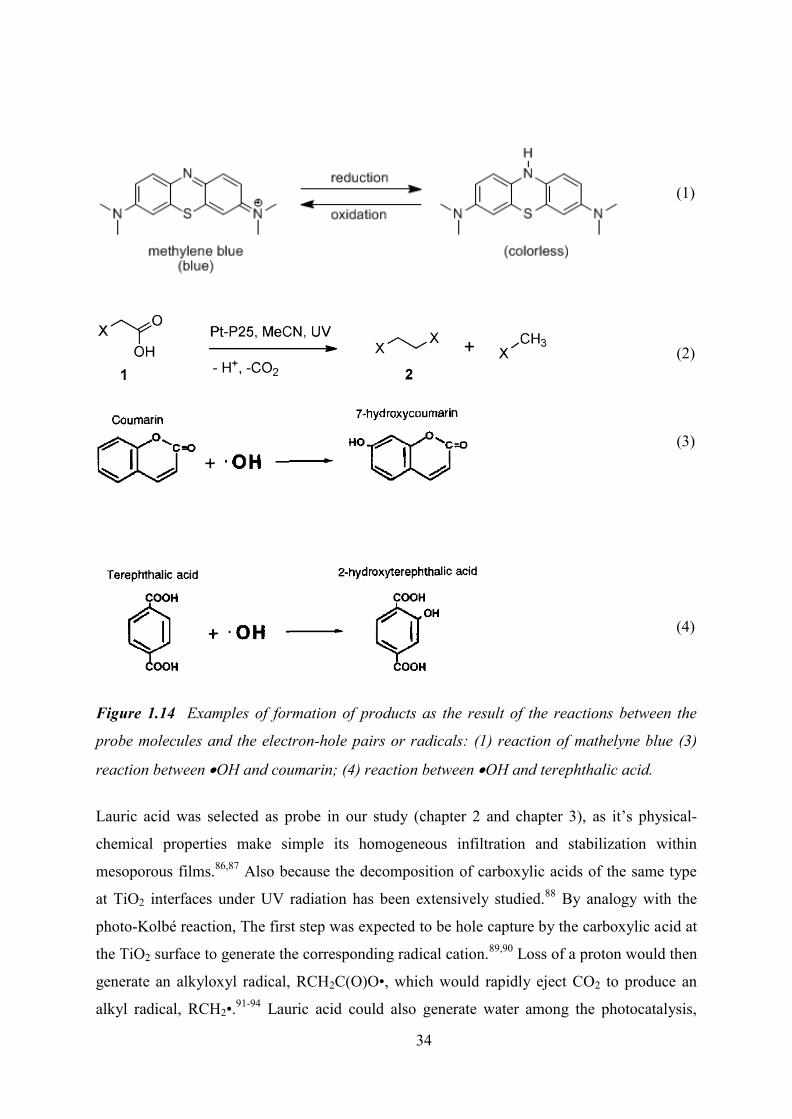
Figure 1.14 Examples of formation of products as the result of the reactions between the
probe molecules and the electron-hole pairs or radicals: (1) reaction of mathelyne blue (3)
reaction between OH and coumarin; (4) reaction between OH and terephthalic acid.
Lauric acid was selected as probe in our study (chapter 2 and chapter 3), as it’s physical-
chemical properties make simple its homogeneous infiltration and stabilization within
mesoporous films.86,87 Also because the decomposition of carboxylic acids of the same type
at TiO2 interfaces under UV radiation has been extensively studied.88 By analogy with the
photo-Kolbé reaction, The first step was expected to be hole capture by the carboxylic acid at
the TiO2 surface to generate the corresponding radical cation.89,90 Loss of a proton would then
generate an alkyloxyl radical, RCH2C(O)O•, which would rapidly eject CO2 to produce an
alkyl radical, RCH2•.91-94 Lauric acid could also generate water among the photocatalysis,
(1)
(2)
(3)
(4)
35
which could accelerate the organic decomposition.
In the following, some techniques for photocatalytic characterize are first introduced before
exposing the ellipsometry measurement approach that has been used in the present study.
1.3.2 Photocatalytic characterization techniques
1.3.2.1 UV-visible absorption spectroscopy
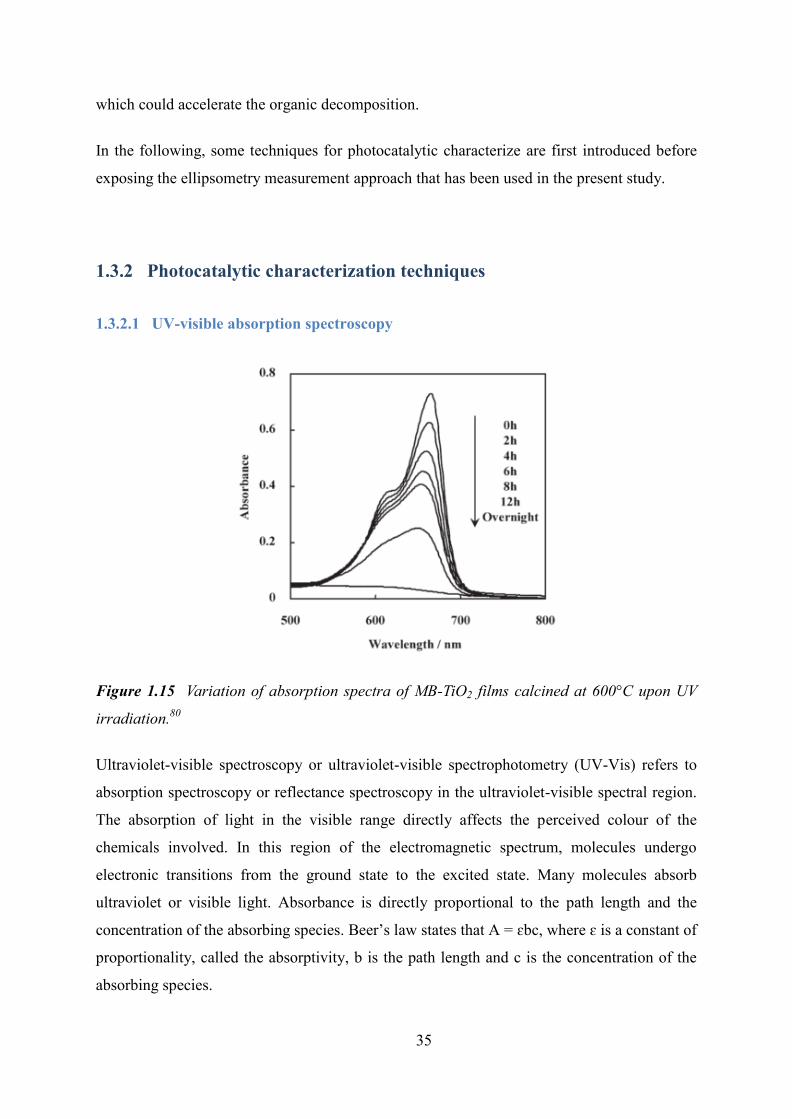
Figure 1.15 Variation of absorption spectra of MB-TiO2 films calcined at 600°C upon UV
irradiation.80
Ultraviolet-visible spectroscopy or ultraviolet-visible spectrophotometry (UV-Vis) refers to
absorption spectroscopy or reflectance spectroscopy in the ultraviolet-visible spectral region.
The absorption of light in the visible range directly affects the perceived colour of the
chemicals involved. In this region of the electromagnetic spectrum, molecules undergo
electronic transitions from the ground state to the excited state. Many molecules absorb
ultraviolet or visible light. Absorbance is directly proportional to the path length and the
concentration of the absorbing species. Beer’s law states that A = ɛbc, where ɛ is a constant of
proportionality, called the absorptivity, b is the path length and c is the concentration of the
absorbing species.
36
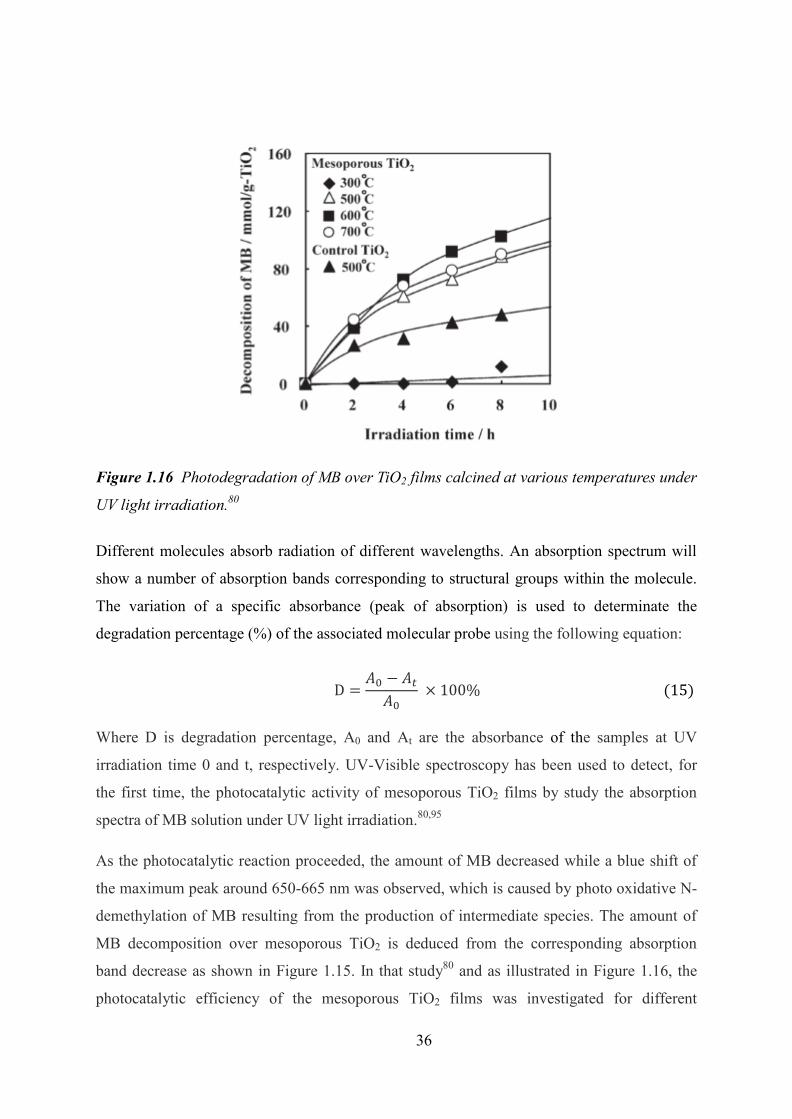
Figure 1.16 Photodegradation of MB over TiO2 films calcined at various temperatures under
UV light irradiation.80
Different molecules absorb radiation of different wavelengths. An absorption spectrum will
show a number of absorption bands corresponding to structural groups within the molecule.
The variation of a specific absorbance (peak of absorption) is used to determinate the
degradation percentage (%) of the associated molecular probe using the following equation:
Where D is degradation percentage, A0 and At are the absorbance of the samples at UV
irradiation time 0 and t, respectively. UV-Visible spectroscopy has been used to detect, for
the first time, the photocatalytic activity of mesoporous TiO2 films by study the absorption
spectra of MB solution under UV light irradiation.80,95
As the photocatalytic reaction proceeded, the amount of MB decreased while a blue shift of
the maximum peak around 650-665 nm was observed, which is caused by photo oxidative N-
demethylation of MB resulting from the production of intermediate species. The amount of
MB decomposition over mesoporous TiO2 is deduced from the corresponding absorption
band decrease as shown in Figure 1.15. In that study80 and as illustrated in Figure 1.16, the
photocatalytic efficiency of the mesoporous TiO2 films was investigated for different
37
calcination temperatures. It has demonstrated that samples obtained at 600°C showed the best
photocatalytic activity due to the ideal combination of good crystalline network and highly
accessible porosity.
1.3.2.2 Fluorescence spectroscopy
Fluorescence spectroscopy (also known as fluorometry or spectrofluorometry) is a type of
electromagnetic spectroscopy which analyses fluorescence from a sample. It involves a beam
of light, usually UV, that excites electrons of certain valence orbitals into orbitals of higher
energy, which then emit a photon of lower energy upon relaxation. Fluorescence
spectroscopy was used for the determination of the photocatalytic activity. K. Ishibashi et al.
have adapted the use of coumarin or terephthalic acid solution to measure OH production on
TiO2 photocatalysis. The method relies on the fluorescent signal generated by the
hydroxylation of coumarin or terephthalic acid. Then the tentative detection of OH
generated at the water/TiO2 interface was suggested based on the technique.96
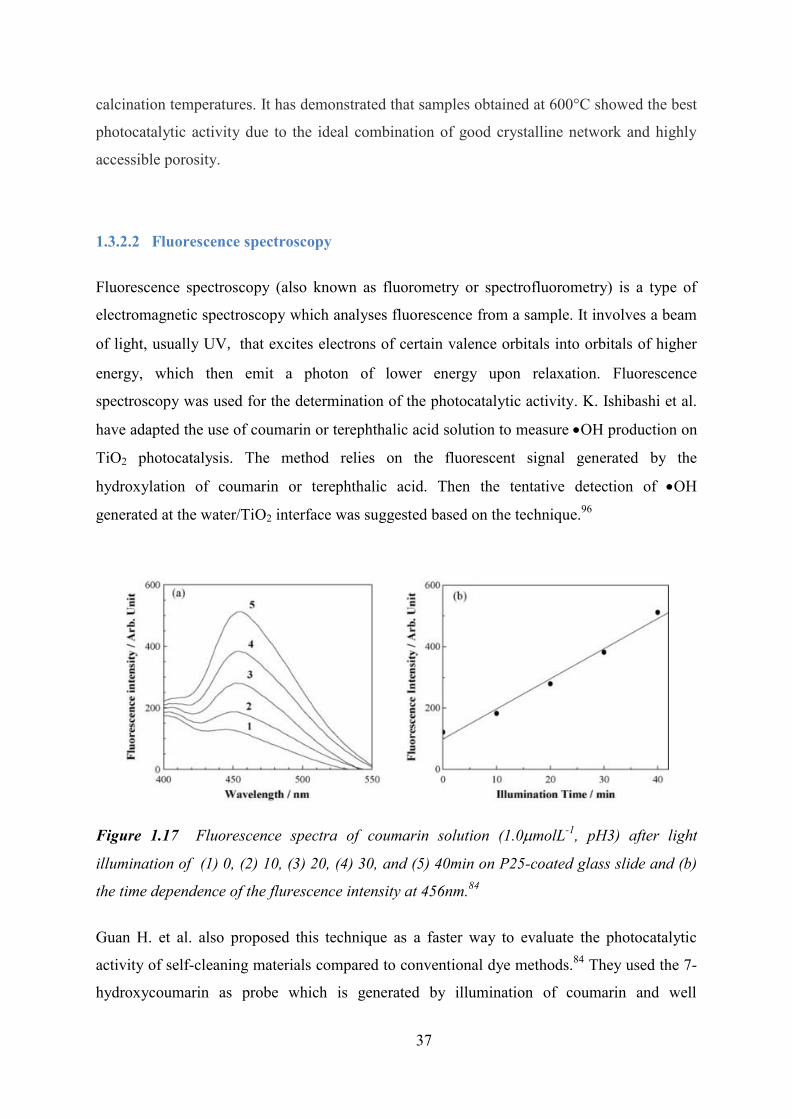
Figure 1.17 Fluorescence spectra of coumarin solution (1.0molL-1, pH3) after light
illumination of (1) 0, (2) 10, (3) 20, (4) 30, and (5) 40min on P25-coated glass slide and (b)
the time dependence of the flurescence intensity at 456nm.84
Guan H. et al. also proposed this technique as a faster way to evaluate the photocatalytic
activity of self-cleaning materials compared to conventional dye methods.84 They used the 7-
hydroxycoumarin as probe which is generated by illumination of coumarin and well
38
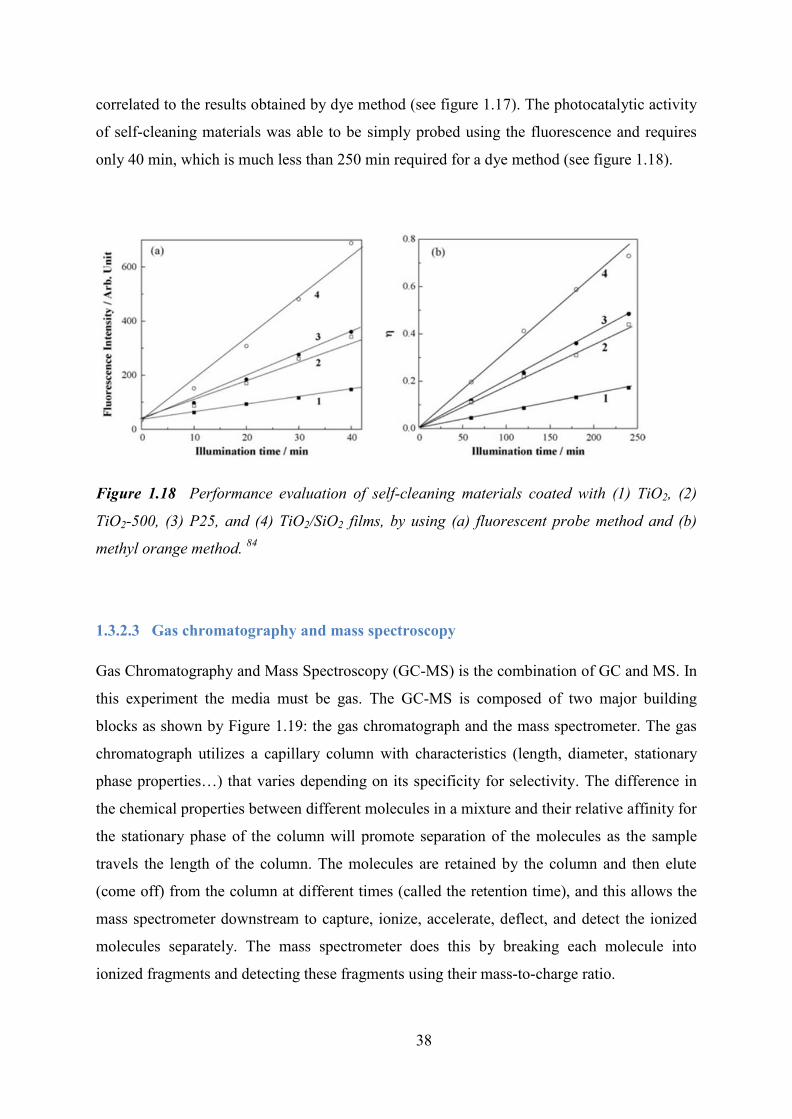
correlated to the results obtained by dye method (see figure 1.17). The photocatalytic activity
of self-cleaning materials was able to be simply probed using the fluorescence and requires
only 40 min, which is much less than 250 min required for a dye method (see figure 1.18).
Figure 1.18 Performance evaluation of self-cleaning materials coated with (1) TiO2, (2)
TiO2-500, (3) P25, and (4) TiO2/SiO2 films, by using (a) fluorescent probe method and (b)
methyl orange method. 84
1.3.2.3 Gas chromatography and mass spectroscopy
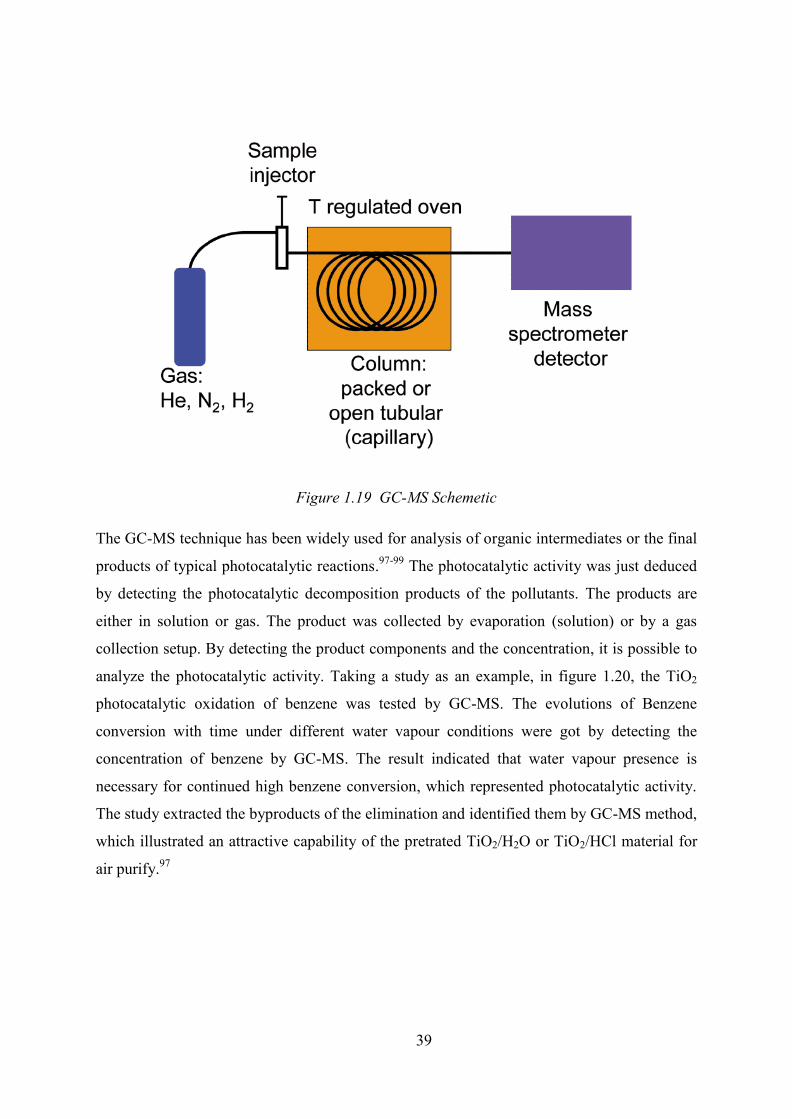
Gas Chromatography and Mass Spectroscopy (GC-MS) is the combination of GC and MS. In
this experiment the media must be gas. The GC-MS is composed of two major building
blocks as shown by Figure 1.19: the gas chromatograph and the mass spectrometer. The gas
chromatograph utilizes a capillary column with characteristics (length, diameter, stationary
phase properties…) that varies depending on its specificity for selectivity. The difference in
the chemical properties between different molecules in a mixture and their relative affinity for
the stationary phase of the column will promote separation of the molecules as the sample
travels the length of the column. The molecules are retained by the column and then elute
(come off) from the column at different times (called the retention time), and this allows the
mass spectrometer downstream to capture, ionize, accelerate, deflect, and detect the ionized
molecules separately. The mass spectrometer does this by breaking each molecule into
ionized fragments and detecting these fragments using their mass-to-charge ratio.
39
Figure 1.19 GC-MS Schemetic
The GC-MS technique has been widely used for analysis of organic intermediates or the final
products of typical photocatalytic reactions.97-99 The photocatalytic activity was just deduced
by detecting the photocatalytic decomposition products of the pollutants. The products are
either in solution or gas. The product was collected by evaporation (solution) or by a gas
collection setup. By detecting the product components and the concentration, it is possible to
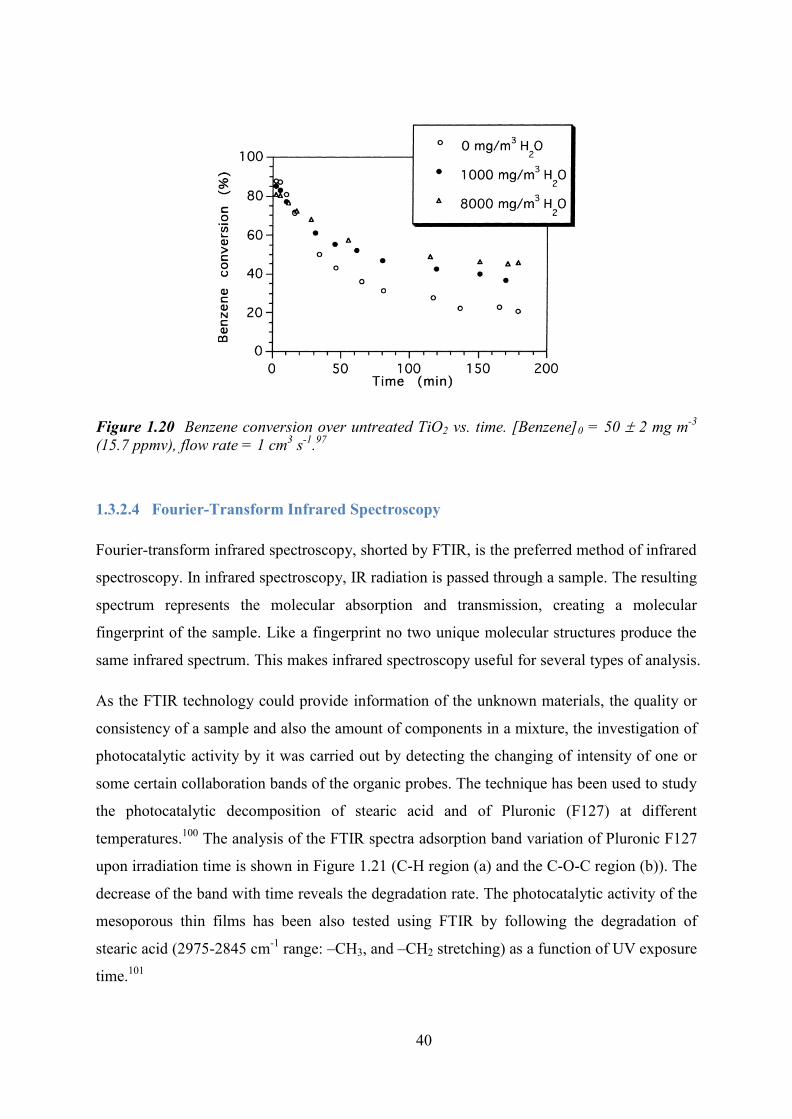
analyze the photocatalytic activity. Taking a study as an example, in figure 1.20, the TiO2
photocatalytic oxidation of benzene was tested by GC-MS. The evolutions of Benzene
conversion with time under different water vapour conditions were got by detecting the
concentration of benzene by GC-MS. The result indicated that water vapour presence is
necessary for continued high benzene conversion, which represented photocatalytic activity.
The study extracted the byproducts of the elimination and identified them by GC-MS method,
which illustrated an attractive capability of the pretrated TiO2/H2O or TiO2/HCl material for
air purify.97
40
Figure 1.20 Benzene conversion over untreated TiO2 vs. time. [Benzene]0 = 50 2 mg m-3
(15.7 ppmv), flow rate = 1 cm3 s-1.97
1.3.2.4 Fourier-Transform Infrared Spectroscopy
Fourier-transform infrared spectroscopy, shorted by FTIR, is the preferred method of infrared
spectroscopy. In infrared spectroscopy, IR radiation is passed through a sample. The resulting
spectrum represents the molecular absorption and transmission, creating a molecular
fingerprint of the sample. Like a fingerprint no two unique molecular structures produce the
same infrared spectrum. This makes infrared spectroscopy useful for several types of analysis.
As the FTIR technology could provide information of the unknown materials, the quality or
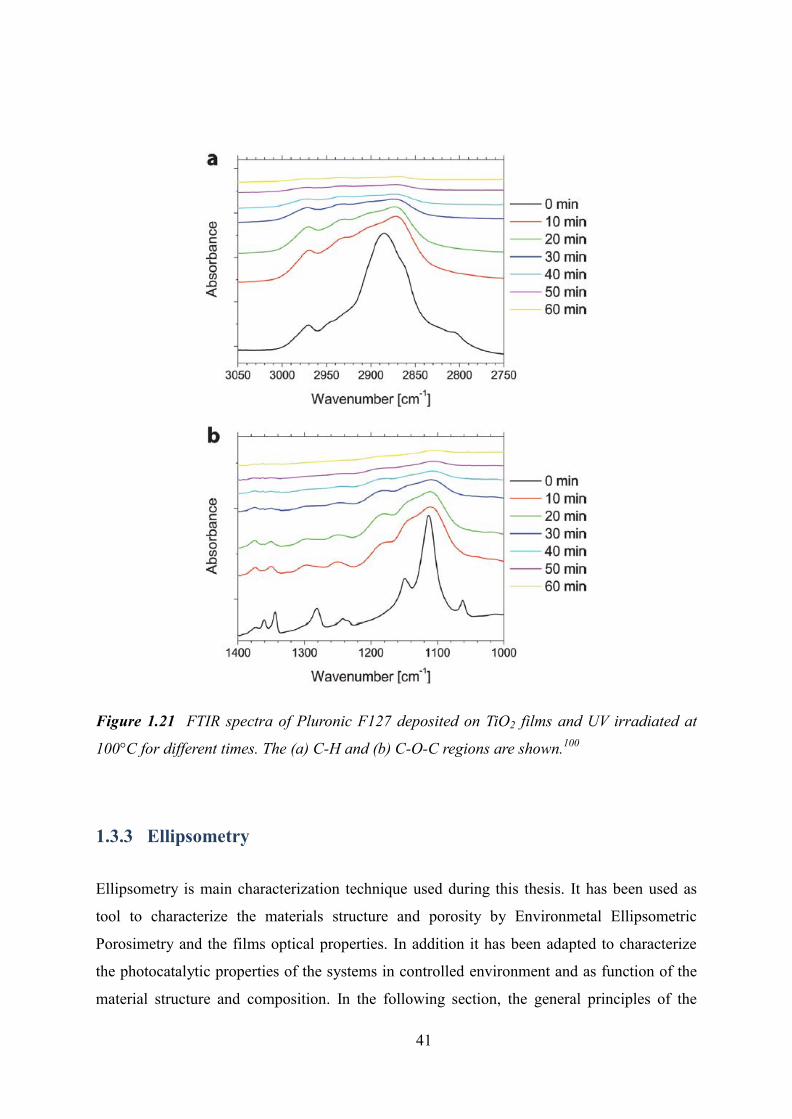
consistency of a sample and also the amount of components in a mixture, the investigation of
photocatalytic activity by it was carried out by detecting the changing of intensity of one or
some certain collaboration bands of the organic probes. The technique has been used to study
the photocatalytic decomposition of stearic acid and of Pluronic (F127) at different
temperatures.100 The analysis of the FTIR spectra adsorption band variation of Pluronic F127
upon irradiation time is shown in Figure 1.21 (C-H region (a) and the C-O-C region (b)). The
decrease of the band with time reveals the degradation rate. The photocatalytic activity of the
mesoporous thin films has been also tested using FTIR by following the degradation of
stearic acid (2975-2845 cm-1 range: –CH3, and –CH2 stretching) as a function of UV exposure
time.101
41
Figure 1.21 FTIR spectra of Pluronic F127 deposited on TiO2 films and UV irradiated at
100°C for different times. The (a) C-H and (b) C-O-C regions are shown.100
1.3.3 Ellipsometry
Ellipsometry is main characterization technique used during this thesis. It has been used as
tool to characterize the materials structure and porosity by Environmetal Ellipsometric
Porosimetry and the films optical properties. In addition it has been adapted to characterize
the photocatalytic properties of the systems in controlled environment and as function of the
material structure and composition. In the following section, the general principles of the
42
ellipsometry technique will be discussed together with its utilisation for porosity and
photocatalytis evaluation.
1.3.3.1 Generality on Ellipsometry Porosimetry
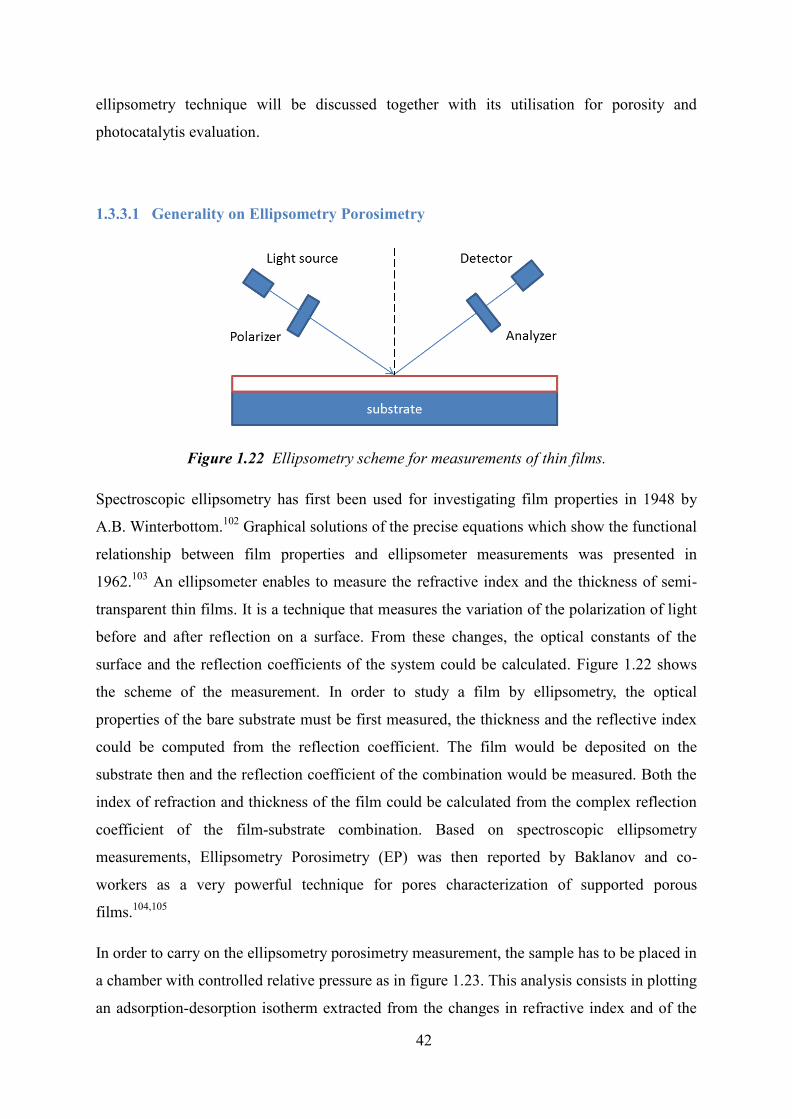
Figure 1.22 Ellipsometry scheme for measurements of thin films.
Spectroscopic ellipsometry has first been used for investigating film properties in 1948 by
A.B. Winterbottom.102 Graphical solutions of the precise equations which show the functional
relationship between film properties and ellipsometer measurements was presented in
1962.103 An ellipsometer enables to measure the refractive index and the thickness of semi-
transparent thin films. It is a technique that measures the variation of the polarization of light
before and after reflection on a surface. From these changes, the optical constants of the
surface and the reflection coefficients of the system could be calculated. Figure 1.22 shows
the scheme of the measurement. In order to study a film by ellipsometry, the optical
properties of the bare substrate must be first measured, the thickness and the reflective index
could be computed from the reflection coefficient. The film would be deposited on the
substrate then and the reflection coefficient of the combination would be measured. Both the
index of refraction and thickness of the film could be calculated from the complex reflection
coefficient of the film-substrate combination. Based on spectroscopic ellipsometry
measurements, Ellipsometry Porosimetry (EP) was then reported by Baklanov and co-
workers as a very powerful technique for pores characterization of supported porous
films.104,105
In order to carry on the ellipsometry porosimetry measurement, the sample has to be placed in
a chamber with controlled relative pressure as in figure 1.23. This analysis consists in plotting
an adsorption-desorption isotherm extracted from the changes in refractive index and of the
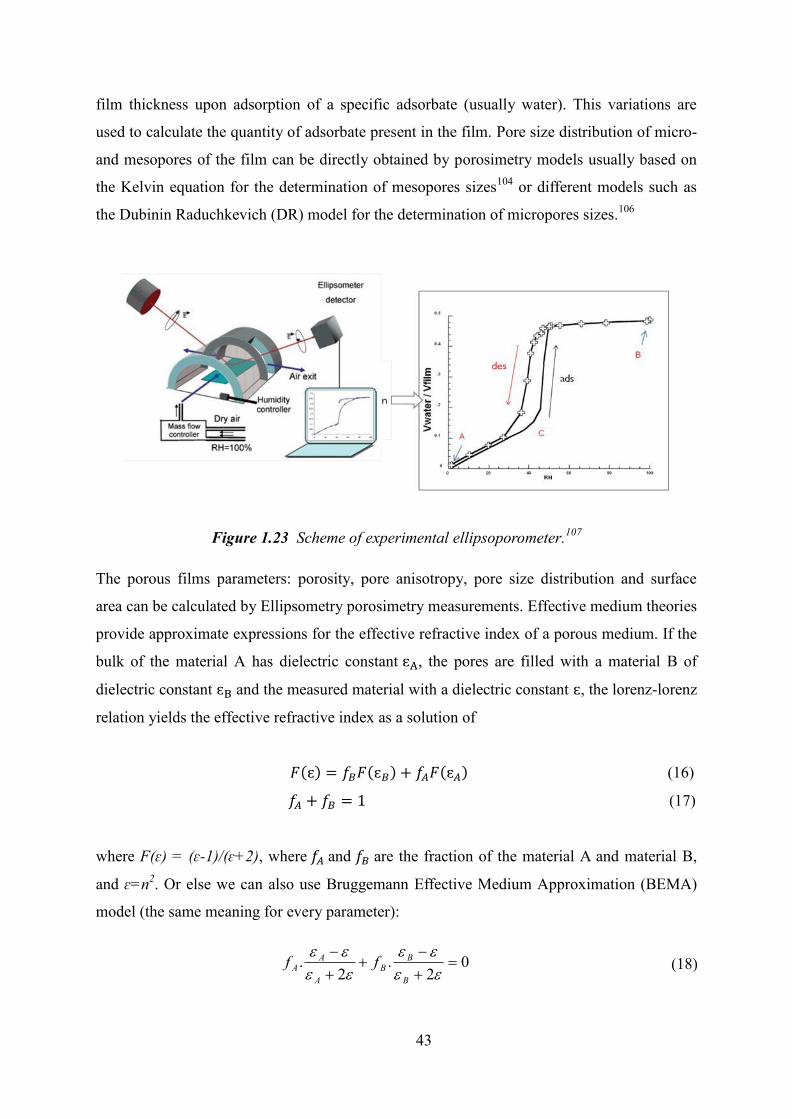
43
film thickness upon adsorption of a specific adsorbate (usually water). This variations are
used to calculate the quantity of adsorbate present in the film. Pore size distribution of micro-
and mesopores of the film can be directly obtained by porosimetry models usually based on
the Kelvin equation for the determination of mesopores sizes104 or different models such as
the Dubinin Raduchkevich (DR) model for the determination of micropores sizes.106
Figure 1.23 Scheme of experimental ellipsoporometer.107
The porous films parameters: porosity, pore anisotropy, pore size distribution and surface
area can be calculated by Ellipsometry porosimetry measurements. Effective medium theories
provide approximate expressions for the effective refractive index of a porous medium. If the
bulk of the material A has dielectric constant , the pores are filled with a material B of
dielectric constant and the measured material with a dielectric constant , the lorenz-lorenz
relation yields the effective refractive index as a solution of
𝐹 𝑓𝐵𝐹 𝐵 𝑓𝐴𝐹 𝐴 (16)
𝑓𝐴 𝑓𝐵 (17)
where F(ɛ) = (ɛ-1)/(ɛ+2), where 𝑓𝐴 and 𝑓𝐵 are the fraction of the material A and material B,
and ɛ=n2. Or else we can also use Bruggemann Effective Medium Approximation (BEMA)
model (the same meaning for every parameter):
(18) 02
.2
.
B
BB
A
AA ff
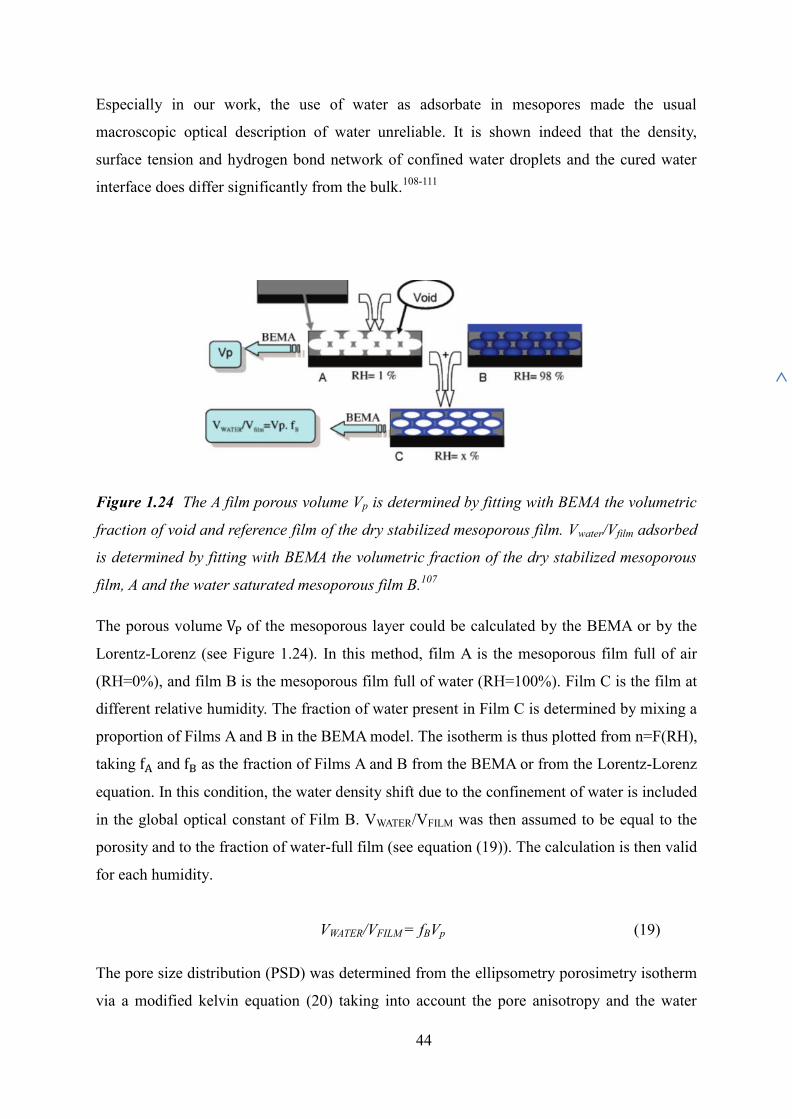
44
Especially in our work, the use of water as adsorbate in mesopores made the usual
macroscopic optical description of water unreliable. It is shown indeed that the density,
surface tension and hydrogen bond network of confined water droplets and the cured water
interface does differ significantly from the bulk.108-111
Figure 1.24 The A film porous volume Vp is determined by fitting with BEMA the volumetric
fraction of void and reference film of the dry stabilized mesoporous film. Vwater/Vfilm adsorbed
is determined by fitting with BEMA the volumetric fraction of the dry stabilized mesoporous
film, A and the water saturated mesoporous film B.107
The porous volume VP of the mesoporous layer could be calculated by the BEMA or by the
Lorentz-Lorenz (see Figure 1.24). In this method, film A is the mesoporous film full of air
(RH=0%), and film B is the mesoporous film full of water (RH=100%). Film C is the film at
different relative humidity. The fraction of water present in Film C is determined by mixing a
proportion of Films A and B in the BEMA model. The isotherm is thus plotted from n=F(RH),
taking f and f as the fraction of Films A and B from the BEMA or from the Lorentz-Lorenz
equation. In this condition, the water density shift due to the confinement of water is included
in the global optical constant of Film B. VWATER/VFILM was then assumed to be equal to the
porosity and to the fraction of water-full film (see equation (19)). The calculation is then valid
for each humidity.
VWATER/VFILM = fBVp (19)
The pore size distribution (PSD) was determined from the ellipsometry porosimetry isotherm
via a modified kelvin equation (20) taking into account the pore anisotropy and the water
B
45
layer thickness t which is measured by ellipsometry on a flat surface at each RH. The water
layer thickness absorbed of mesopores surface was assumed to be equivalent as the water
thickness t absorbed onto a flat surface of a reference film.
𝑛 𝑃
𝑃0 𝛾𝑉𝐿𝑐𝑜𝑠𝜃
𝑑𝑆
𝑑𝑉 (20)
The Kelvin equation (20) gives the relation between the relative pressure P/P0 of an absorbate
and the capillary radius describe as 𝑐𝑜𝑠𝜃 𝑑𝑆
𝑑𝑉. dS is the adsorbate liquid-air interface surface
area variation, while the volume V of absorbate varies of dV. 108,112 θ is the solid/liquid
wetting angle, VLis the molar volume of the adsorbate after capillary condensation, and γ is
the liquid-air surface tension of the curved interface. The relative pressure P/P0 could be
assumed to be equal to the RH because the metal oxide surface adsorbs preferentially water
than air molecules.
For ellipsoidal pore shapes (as in most of the mesoporous films), the dS/dV factor of equation
(20) could be modified as the ellipsoidal sphere volume V and surface expressions S are
given as function of b and p as follow:
𝑉 4
3𝜋𝑝2𝑏3 (21)
𝑆 𝑝2𝑏2𝜋 𝜋𝑏2/ 𝑛 *1+
1− + (22)
With 𝑝2−1 1/2
𝑝,
Where p equal to the ratio of the ellipse large radius a on small radius b. We obtain the Kelvin
equation for ellipsoidal interfaces:
𝑛 𝑃
𝑃0 𝛾𝑉𝐿𝑐𝑜𝑠𝜃[
𝐶
2𝑝2]/b (23)
With ln [
1+𝐸
1−𝐸]
1+C/2p2=G is the geometric coefficient. It showed a significant influence by ellipsoid
anisotropy p, especially when p value between 1 and 3, which means that the kelvin radius
determination was very sensitive to the anisotropy. This factor is dependeng on the
contraction of the mesostructure that could be described as a multiply of the wall contraction
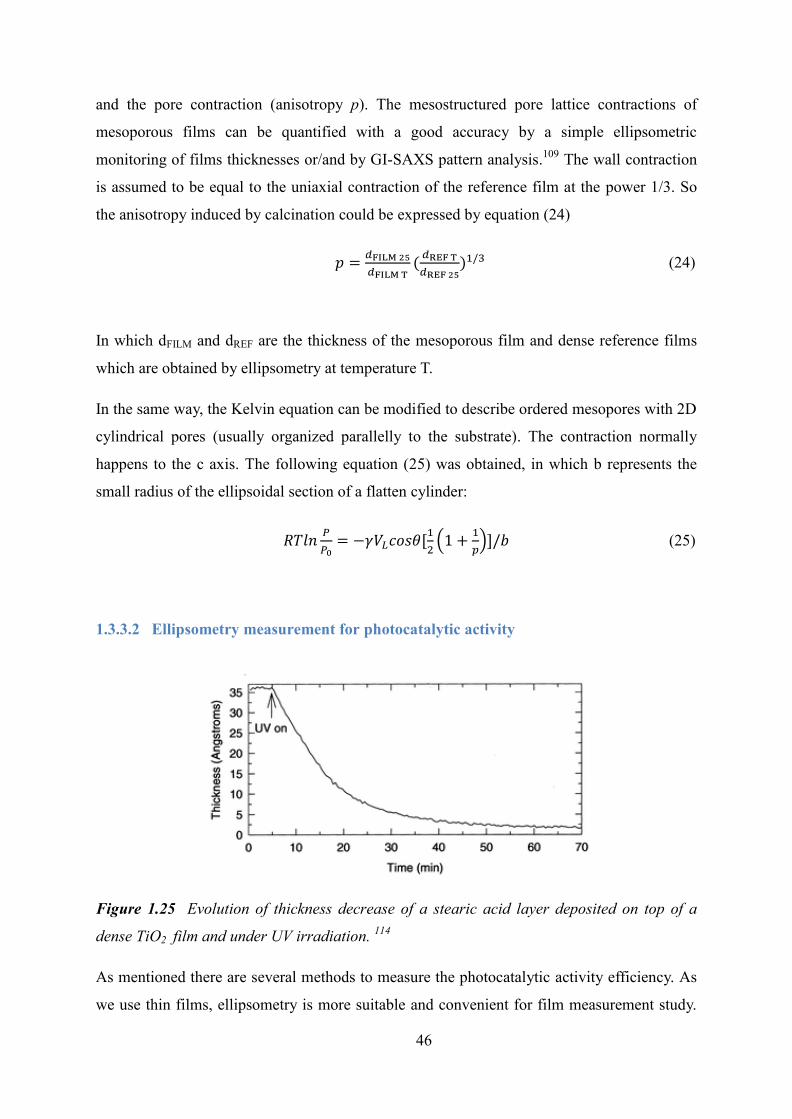
46
and the pore contraction (anisotropy p). The mesostructured pore lattice contractions of
mesoporous films can be quantified with a good accuracy by a simple ellipsometric
monitoring of films thicknesses or/and by GI-SAXS pattern analysis.109 The wall contraction
is assumed to be equal to the uniaxial contraction of the reference film at the power 1/3. So
the anisotropy induced by calcination could be expressed by equation (24)
𝑝 𝑑FILM 25
𝑑FILM T 𝑑REF T
𝑑REF 25 1/3 (24)
In which dFILM and dREF are the thickness of the mesoporous film and dense reference films
which are obtained by ellipsometry at temperature T.
In the same way, the Kelvin equation can be modified to describe ordered mesopores with 2D
cylindrical pores (usually organized parallelly to the substrate). The contraction normally
happens to the c axis. The following equation (25) was obtained, in which b represents the
small radius of the ellipsoidal section of a flatten cylinder:
𝑛 𝑃
𝑃0 𝛾𝑉𝐿𝑐𝑜𝑠𝜃[
1
2(
1
𝑝)]/𝑏 (25)
1.3.3.2 Ellipsometry measurement for photocatalytic activity
Figure 1.25 Evolution of thickness decrease of a stearic acid layer deposited on top of a
dense TiO2 film and under UV irradiation. 114
As mentioned there are several methods to measure the photocatalytic activity efficiency. As
we use thin films, ellipsometry is more suitable and convenient for film measurement study.
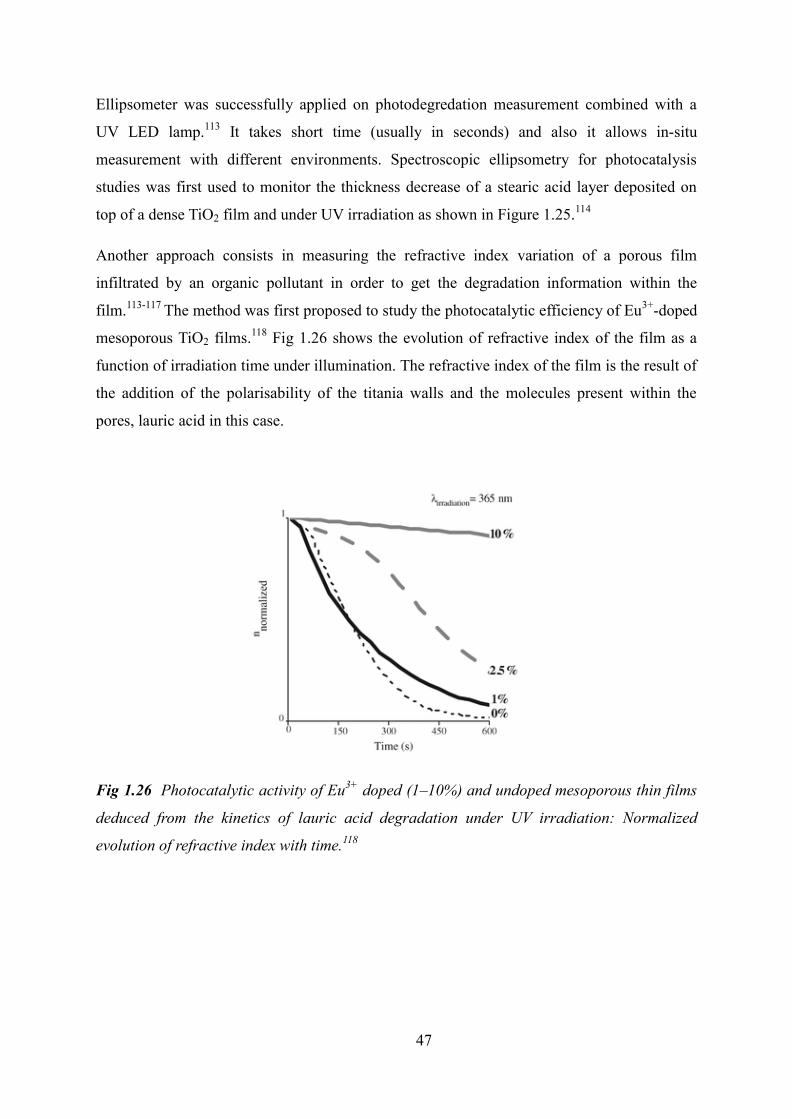
47
Ellipsometer was successfully applied on photodegredation measurement combined with a
UV LED lamp.113 It takes short time (usually in seconds) and also it allows in-situ
measurement with different environments. Spectroscopic ellipsometry for photocatalysis
studies was first used to monitor the thickness decrease of a stearic acid layer deposited on
top of a dense TiO2 film and under UV irradiation as shown in Figure 1.25.114
Another approach consists in measuring the refractive index variation of a porous film
infiltrated by an organic pollutant in order to get the degradation information within the
film.113-117 The method was first proposed to study the photocatalytic efficiency of Eu3+-doped
mesoporous TiO2 films.118 Fig 1.26 shows the evolution of refractive index of the film as a
function of irradiation time under illumination. The refractive index of the film is the result of
the addition of the polarisability of the titania walls and the molecules present within the
pores, lauric acid in this case.
Fig 1.26 Photocatalytic activity of Eu3+ doped (1–10%) and undoped mesoporous thin films
deduced from the kinetics of lauric acid degradation under UV irradiation: Normalized
evolution of refractive index with time.118
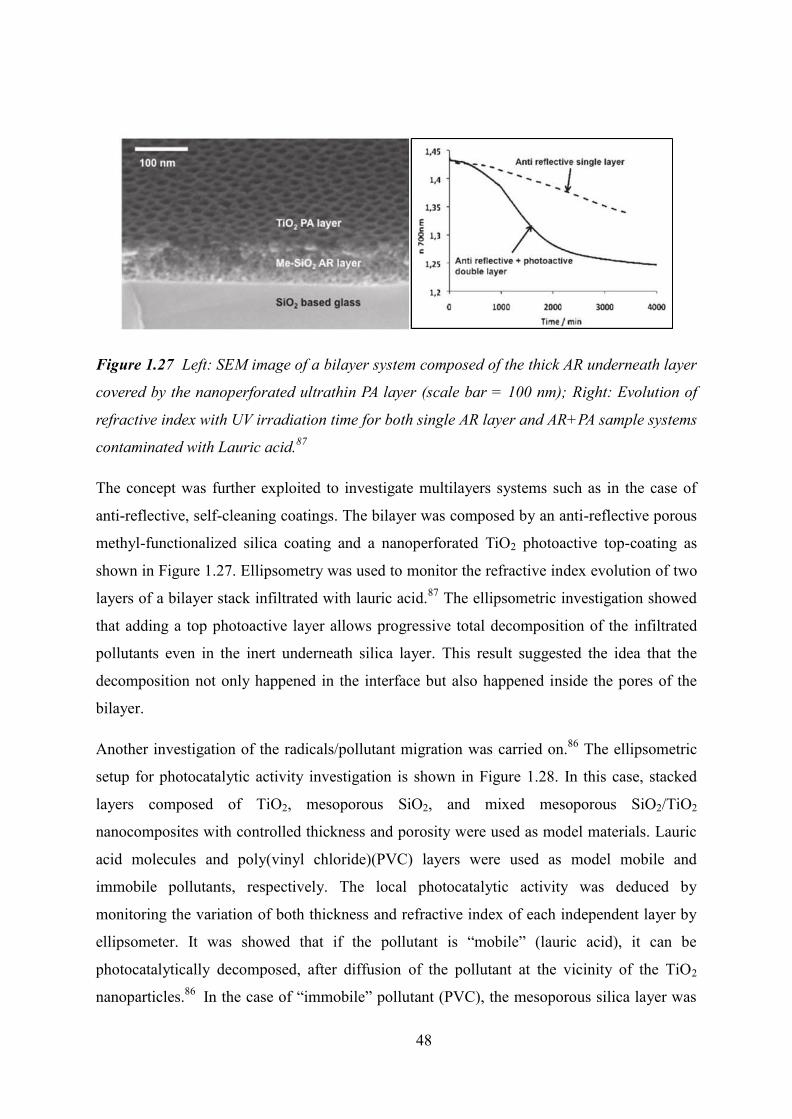
48
Figure 1.27 Left: SEM image of a bilayer system composed of the thick AR underneath layer
covered by the nanoperforated ultrathin PA layer (scale bar = 100 nm); Right: Evolution of
refractive index with UV irradiation time for both single AR layer and AR+PA sample systems
contaminated with Lauric acid.87
The concept was further exploited to investigate multilayers systems such as in the case of
anti-reflective, self-cleaning coatings. The bilayer was composed by an anti-reflective porous
methyl-functionalized silica coating and a nanoperforated TiO2 photoactive top-coating as
shown in Figure 1.27. Ellipsometry was used to monitor the refractive index evolution of two
layers of a bilayer stack infiltrated with lauric acid.87 The ellipsometric investigation showed
that adding a top photoactive layer allows progressive total decomposition of the infiltrated
pollutants even in the inert underneath silica layer. This result suggested the idea that the
decomposition not only happened in the interface but also happened inside the pores of the
bilayer.
Another investigation of the radicals/pollutant migration was carried on.86 The ellipsometric
setup for photocatalytic activity investigation is shown in Figure 1.28. In this case, stacked
layers composed of TiO2, mesoporous SiO2, and mixed mesoporous SiO2/TiO2
nanocomposites with controlled thickness and porosity were used as model materials. Lauric
acid molecules and poly(vinyl chloride)(PVC) layers were used as model mobile and
immobile pollutants, respectively. The local photocatalytic activity was deduced by
monitoring the variation of both thickness and refractive index of each independent layer by
ellipsometer. It was showed that if the pollutant is “mobile” (lauric acid), it can be
photocatalytically decomposed, after diffusion of the pollutant at the vicinity of the TiO2
nanoparticles.86 In the case of “immobile” pollutant (PVC), the mesoporous silica layer was
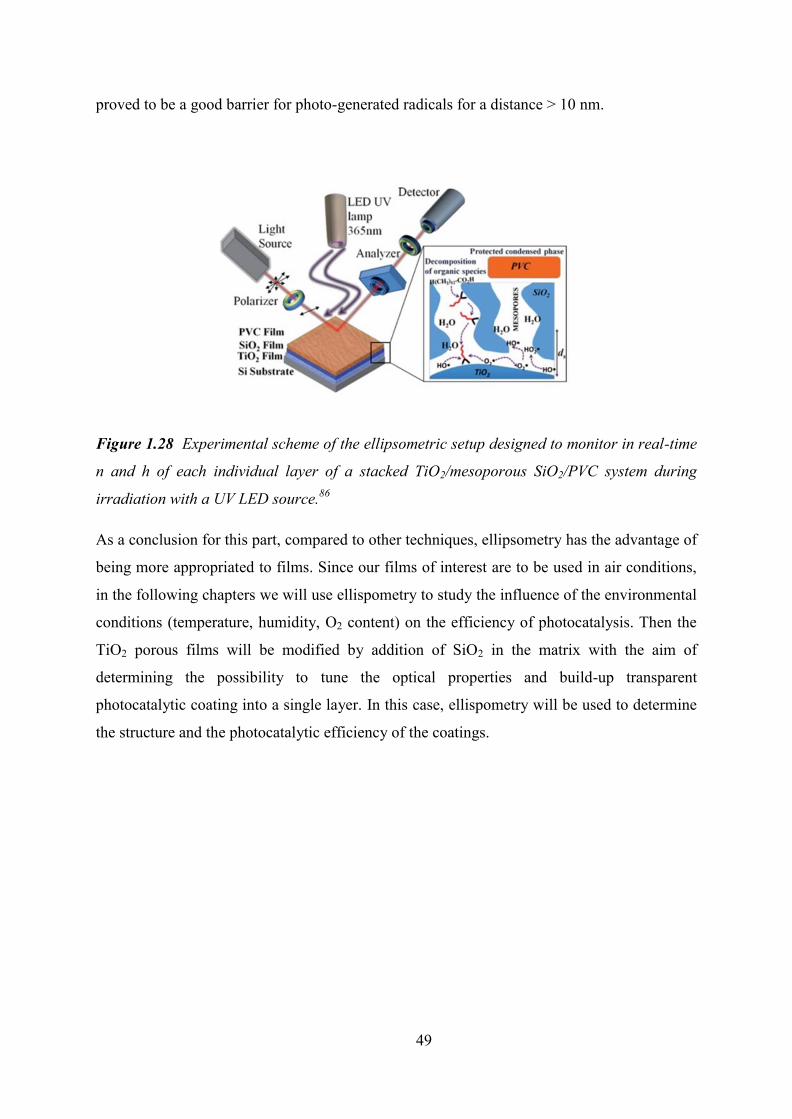
49
proved to be a good barrier for photo-generated radicals for a distance > 10 nm.
Figure 1.28 Experimental scheme of the ellipsometric setup designed to monitor in real-time
n and h of each individual layer of a stacked TiO2/mesoporous SiO2/PVC system during
irradiation with a UV LED source.86
As a conclusion for this part, compared to other techniques, ellipsometry has the advantage of
being more appropriated to films. Since our films of interest are to be used in air conditions,
in the following chapters we will use ellispometry to study the influence of the environmental
conditions (temperature, humidity, O2 content) on the efficiency of photocatalysis. Then the
TiO2 porous films will be modified by addition of SiO2 in the matrix with the aim of
determining the possibility to tune the optical properties and build-up transparent
photocatalytic coating into a single layer. In this case, ellispometry will be used to determine
the structure and the photocatalytic efficiency of the coatings.
50
References
1. Hagfeldt A, Graetzel M. Light-induced redox reactions in nanocrystalline systems[J].
Chemical Reviews, 1995, 95(1): 49-68.
2. Linsebigler A L, Lu G, Yates Jr J T. Photocatalysis on TiO2 surfaces: principles, mechanisms,
and selected results[J]. Chemical reviews, 1995, 95(3): 735-758.
3. Kavan L, Grätzel M, Gilbert S E, et al. Electrochemical and photoelectrochemical
investigation of single-crystal anatase[J]. Journal of the American Chemical Society, 1996,
118(28): 6716-6723.
4. Diebold U. The surface science of titanium dioxide[J]. Surface science reports, 2003, 48(5):
53-229.
5. Fujishima A. Electrochemical photolysis of water at a semiconductor electrode[J]. nature,
1972, 238: 37-38.
6. Fox M A, Dulay M T. Heterogeneous photocatalysis[J]. Chemical reviews, 1993, 93(1): 341-
357.
7. Fresno F, Portela R, Suárez S, et al. Photocatalytic materials: recent achievements and near
future trends[J]. Journal of Materials Chemistry A, 2014, 2(9): 2863-2884.
8. Sakthivel S, Kisch H. Daylight photocatalysis by carbon‐modified titanium dioxide[J].
Angewandte Chemie International Edition, 2003, 42(40): 4908-4911.
9. Asahi R, Morikawa T, Ohwaki T, et al. Visible-light photocatalysis in nitrogen-doped
titanium oxides[J]. science, 2001, 293(5528): 269-271.
10. Jimmy C. Synthesis of hierarchical nanoporous F-doped TiO2 spheres with visible light
photocatalytic activity[J]. Chemical Communications, 2006 (10): 1115-1117.
11. Ohno T, Mitsui T, Matsumura M. Photocatalytic Activity of S-doped TiO2 Photocatalyst
under Visible Light[J]. Chemistry Letters, 2003, 32(4): 364-365.
12. Kubacka A, Fernández-García M, Colón G. Advanced nanoarchitectures for solar
photocatalytic applications[J]. Chemical Reviews, 2011, 112(3): 1555-1614.
13. Saison T, Gras P, Chemin N, et al. New insights into Bi2WO6 properties as a visible-light
photocatalyst[J]. The Journal of Physical Chemistry C, 2013, 117(44): 22656-22666.
14. Saison T, Chemin N, Chaneac C, et al. New Insights Into BiVO4 Properties as Visible Light
Photocatalyst[J]. The Journal of Physical Chemistry C, 2015, 119(23): 12967-12977.
51
15. Saison T, Chemin N, Chanéac C, et al. Bi2O3, BiVO4, and Bi2WO6: impact of surface
properties on photocatalytic activity under visible light[J]. The Journal of Physical Chemistry
C, 2011, 115(13): 5657-5666.
16. Kavan L, Grätzel M, Gilbert S E, et al. Electrochemical and photoelectrochemical
investigation of single-crystal anatase[J]. Journal of the American Chemical Society, 1996,
118(28): 6716-6723.
17. Ollis D F, Al-Ekabi H. Photocatalytic purification and treatment of water and air: proceedings
of the 1st International Conference on TiO2 Photocatalytic Purification and Treatment of
Water and Air, London, Ontario, Canada, 8-13 November, 1992[M]. Elsevier Science Ltd,
1993.
18. He D, Lin F. Preparation and photocatalytic activity of anatase TiO2 nanocrystallites with
high thermal stability[J]. Materials Letters, 2007, 61(16): 3385-3387.
19. Furube A, Asahi T, Masuhara H, et al. Charge carrier dynamics of standard TiO2 catalysts
revealed by femtosecond diffuse reflectance spectroscopy[J]. The Journal of Physical
Chemistry B, 1999, 103(16): 3120-3127.
20. Banfield J F, Bischoff B L, Anderson M A. TiO2 accessory minerals: coarsening, and
transformation kinetics in pure and doped synthetic nanocrystalline materials[J]. Chemical
Geology, 1993, 110(1): 211-231.
21. Kudo A, Miseki Y. Heterogeneous photocatalyst materials for water splitting[J]. Chemical
Society Reviews, 2009, 38(1): 253-278.
22. Simonsen M E, Li Z, Søgaard E G. Influence of the OH groups on the photocatalytic activity
and photoinduced hydrophilicity of microwave assisted sol–gel TiO2 film[J]. Applied Surface
Science, 2009, 255(18): 8054-8062.
23. Carp O, Huisman C L, Reller A. Photoinduced reactivity of titanium dioxide[J]. Progress in
solid state chemistry, 2004, 32(1): 33-177.
24. Costacurta S, Maso G D, Gallo R, et al. Influence of Temperature on the Photocatalytic
Activity of Sol− Gel TiO2 Films[J]. ACS applied materials & interfaces, 2010, 2(5): 1294-
1298.
25. Wang R, Hashimoto K, Fujishima A, et al. Light-induced amphiphilic surfaces[J]. Nature,
1997, 388: 431-432.
26. Fujishima A, Rao T N, Tryk D A. Titanium dioxide photocatalysis[J]. Journal of
Photochemistry and Photobiology C: Photochemistry Reviews, 2000, 1(1): 1-21.
27. Wang R, Hashimoto K, Fujishima A, et al. Photogeneration of highly amphiphilic TiO2
surfaces[J]. Advanced Materials, 1998, 10(2): 135-138.
52
28. Sakai N, Wang R, Fujishima A, et al. Effect of ultrasonic treatment on highly hydrophilic
TiO2 surfaces[J]. Langmuir, 1998, 14(20): 5918-5920.
29. Wang R, Sakai N, Fujishima A, et al. Studies of surface wettability conversion on TiO2
single-crystal surfaces[J]. The Journal of Physical Chemistry B, 1999, 103(12): 2188-2194.
30. Carp O, Huisman C L, Reller A. Photoinduced reactivity of titanium dioxide[J]. Progress in
solid state chemistry, 2004, 32(1): 33-177.
31. Yu J, Zhao X, Zhao Q. Photocatalytic activity of nanometer TiO2 thin films prepared by the
sol–gel method[J]. Materials Chemistry and Physics, 2001, 69(1): 25-29.
32. Yu J G, Yu H G, Cheng B, et al. The effect of calcination temperature on the surface
microstructure and photocatalytic activity of TiO2 thin films prepared by liquid phase
deposition[J]. The Journal of Physical Chemistry B, 2003, 107(50): 13871-13879.
33. Yu J C, Yu J, Ho W, et al. Effects of F-doping on the photocatalytic activity and
microstructures of nanocrystalline TiO2 powders[J]. Chemistry of materials, 2002, 14(9):
3808-3816.
34. Yu J C, Ho W, Yu J, et al. Efficient visible-light-induced photocatalytic disinfection on
sulfur-doped nanocrystalline titania[J]. Environmental science & technology, 2005, 39(4):
1175-1179.
35. Sanchez C, Boissiere C, Grosso D, et al. Design, synthesis, and properties of inorganic and
hybrid thin films having periodically organized nanoporosity†[J]. Chemistry of materials,
2008, 20(3): 682-737.
36. Vivero-Escoto J L, Huxford-Phillips R C, Lin W. Silica-based nanoprobes for biomedical
imaging and theranostic applications[J]. Chemical Society Reviews, 2012, 41(7): 2673-2685.
37. Yamauchi Y, Suzuki N, Radhakrishnan L, et al. Breakthrough and future: nanoscale controls
of compositions, morphologies, and mesochannel orientations toward advanced mesoporous
materials[J]. The Chemical Record, 2009, 9(6): 321-339.
38. Kimura T, Kuroda K. Ordered mesoporous silica derived from layered silicates[J]. Advanced
Functional Materials, 2009, 19(4): 511-527.
39. Ariga K. Silica-supported biomimetic membranes[J]. The Chemical Record, 2004, 3(6): 297-
307.
40. Sanchez C, Soler-Illia G J A A, Ribot F, et al. Designed hybrid organic-inorganic
nanocomposites from functional nanobuilding blocks[J]. Chemistry of Materials, 2001,
13(10): 3061-3083.
41. Livage J, Henry M, Sanchez C. Sol-gel chemistry of transition metal oxides[J]. Progress in
solid state chemistry, 1988, 18(4): 259-341.
53
42. Brinker C J, Hurd A J, Schunk P R, et al. Review of sol-gel thin film formation[J]. Journal of
Non-Crystalline Solids, 1992, 147: 424-436.
43. Mann S, Burkett S L, Davis S A, et al. Sol-gel synthesis of organized matter[J]. Chemistry of
Materials, 1997, 9(11): 2300-2310.
44. Sanchez C, Boissiere C, Grosso D, et al. Design, synthesis, and properties of inorganic and
hybrid thin films having periodically organized nanoporosity†[J]. Chemistry of materials,
2008, 20(3): 682-737.
45. Burkett S L, Mann S. Spatial organization and patterning of gold nanoparticles on self-
assembled biolipid tubular templates [J]. Chem. Commun., 1996 (3): 321-322.
46. Grosso D, de AA Soler‐Illia G J, Babonneau F, et al. Highly Organized Mesoporous Titania
Thin Films Showing Mono‐Oriented 2D Hexagonal Channels[J]. Advanced Materials, 2001,
13(14): 1085-1090.
47. Yun H S, Miyazawa K, Zhou H S, et al. Synthesis of mesoporous thin TiO2 films with
hexagonal pore structures using triblock copolymer templates[J]. Advanced Materials, 2001,
13(18): 1377-1380.
48. Jaroniec M, Schüth F. Preface to the special issue: Templated materials[J]. Chemistry of
Materials, 2008, 20(3): 599-600.
49. Kresge C T, Leonowicz M E, Roth W J, et al. Ordered mesoporous molecular sieves
synthesized by a liquid-crystal template mechanism[J]. nature, 1992, 359(6397): 710-712.
50. Bagshaw S A, Prouzet E, Pinnavaia T J. Templating of mesoporous molecular sieves by
nonionic polyethylene oxide surfactants[J]. Science, 1995, 269(5228): 1242-1244.
51. Yang H, Coombs N, Sokolov I, et al. Free-standing and oriented mesoporous silica films
grown at the air–water interface[J]. 1996.
52. Attard G S, Glyde J C, Göltner C G. Liquid-crystalline phases as templates for the synthesis
of mesoporous silica[J]. Nature, 1995, 378(6555): 366-368.
53. Schüth F. Non-siliceous mesostructured and mesoporous materials[J]. Chemistry of Materials,
2001, 13(10): 3184-3195.
54. Yu C, Tian B, Zhao D. Recent advances in the synthesis of non-siliceous mesoporous
materials[J]. Current Opinion in Solid State and Materials Science, 2003, 7(3): 191-197.
55. Antonelli D M, Ying J Y. Synthesis of hexagonally packed mesoporous TiO2 by a modified
sol–gel method[J]. Angewandte Chemie International Edition in English, 1995, 34(18): 2014-
2017.
54
56. Putnam R L, Nakagawa N, McGrath K M, et al. Titanium dioxide-surfactant mesophases and
Ti-TMS1[J]. Chemistry of materials, 1997, 9(12): 2690-2693.
57. On D T. A simple route for the synthesis of mesostructured lamellar and hexagonal
phosphorus-free titania (TiO2)[J]. Langmuir, 1999, 15(25): 8561-8564.
58. Cabrera S, El Haskouri J, Guillem C, et al. Generalised syntheses of ordered mesoporous
oxides: the atrane route[J]. Solid State Sciences, 2000, 2(4): 405-420.
59. Ulagappan N, Rao C N R. Mesoporous phases based on SnO2 and TiO2[J]. Chem. Commun.,
1996 (14): 1685-1686.
60. Antonelli D M. Synthesis of phosphorus-free mesoporous titania via templating with amine
surfactants[J]. Microporous and Mesoporous Materials, 1999, 30(2): 315-319.
61. Yang P, Zhao D, Margolese D I, et al. Generalized syntheses of large-pore mesoporous metal
oxides with semicrystalline frameworks[J]. Nature, 1998, 396(6707): 152-155.
62. Yang P, Zhao D, Margolese D I, et al. Block copolymer templating syntheses of mesoporous
metal oxides with large ordering lengths and semicrystalline framework[J]. Chemistry of
Materials, 1999, 11(10): 2813-2826.
63. Soler-Illia G J A A, Angelomé P C, Fuertes M C, et al. Critical aspects in the production of
periodically ordered mesoporous titania thin films[J]. Nanoscale, 2012, 4(8): 2549-2566.
64. Day V W, Eberspacher T A, Chen Y, et al. Low-nuclearity titanium oxoalkoxides: the
trititanates [Ti3O](OPri)10 and [Ti3O](OPri)9(OMe)[J]. Inorganica chimica acta, 1995, 229(1):
391-405.
65. Blanchard J, Ribot F, Sanchez C, et al. Structural characterization of titanium-oxo-polymers
synthesized in the presence of protons or complexing ligands as inhibitors[J]. Journal of non-
crystalline solids, 2000, 265(1): 83-97.
66. L.D. Landau. and V. G. Levich, Dragging of a liquid by a moving plate, Acta
Physicochim.USSR1942, 17, 42-54.
67. Lee H, Dellatore S M, Miller W M, et al. Mussel-inspired surface chemistry for
multifunctional coatings[J]. science, 2007, 318(5849): 426-430.
68. Schunk P.R.; Hurd A.J.; Brinker, C.J. Liquid Film Coating, Chapman & Hall, London 1997,
673-708.
69. Krins N, Faustini M, Louis B, et al. Thick and crack-free nanocrystalline mesoporous TiO2
films obtained by capillary coating from aqueous solutions[J]. Chemistry of Materials, 2010,
22(23): 6218-6220.
70. Ogawa M. A simple sol–gel route for the preparation of silica–surfactant mesostructured
materials[J]. Chemical Communications, 1996 (10): 1149-1150.
55
71. Yang H, Coombs N, Ozin G A. Morphogenesis of shapes and surface patterns in mesoporous
silica[J]. Nature, 1997, 386(6626): 692-695.
72. Brinker C J, Lu Y, Sellinger A, et al. Evaporation-induced self-assembly: nanostructures
made easy[J]. Advanced materials, 1999, 11(7): 579-585.
73. Grosso D, Cagnol F, Soler‐Illia G J A A, et al. Fundamentals of mesostructuring through
evaporation‐induced self‐assembly[J]. Advanced Functional Materials, 2004, 14(4): 309-
322.
74. Crepaldi E L, Soler-Illia G J A A, Grosso D, et al. Controlled formation of highly organized
mesoporous titania thin films: from mesostructured hybrids to mesoporous nanoanatase TiO2
[J]. Journal of the American Chemical Society, 2003, 125(32): 9770-9786.
75. Carp O, Huisman C L, Reller A. Photoinduced reactivity of titanium dioxide[J]. Progress in
solid state chemistry, 2004, 32(1): 33-177.
76. Henderson M J, Gibaud A, Bardeau J F, et al. An X-ray reflectivity study of evaporation-
induced self-assembled titania-based films[J]. Journal of Materials Chemistry, 2006, 16(25):
2478-2484.
77. Krins N, Faustini M, Louis B, et al. Thick and crack-free nanocrystalline mesoporous TiO2
films obtained by capillary coating from aqueous solutions[J]. Chemistry of Materials, 2010,
22(23): 6218-6220.
78. Grosso D, Soler-Illia G J A A, Crepaldi E L, et al. Highly porous TiO2 anatase optical thin
films with cubic mesostructure stabilized at 700°C[J]. Chemistry of Materials, 2003, 15(24):
4562-4570.
79. Bass J D, Grosso D, Boissiere C, et al. Stability of mesoporous oxide and mixed metal oxide
materials under biologically relevant conditions[J]. Chemistry of materials, 2007, 19(17):
4349-4356.
80. Sakatani Y, Grosso D, Nicole L, et al. Optimised photocatalytic activity of grid-like
mesoporous TiO2 films: effect of crystallinity, pore size distribution, and pore accessibility[J].
Journal of Materials Chemistry, 2006, 16(1): 77-82.
81. Choi S Y, Mamak M, Speakman S, et al. Evolution of nanocrystallinity in periodic
mesoporous anatase thin films[J]. Small, 2005, 1(2): 226-232.
82. Angelomé P C, Andrini L, Calvo M E, et al. Mesoporous anatase TiO2 films: use of Ti K
XANES for the quantification of the nanocrystalline character and substrate effects in the
photocatalysis behavior[J]. The Journal of Physical Chemistry C, 2007, 111(29): 10886-
10893.
56
83. Yan, Xiaoli, et al. "Is methylene blue an appropriate substrate for a photocatalytic activity test?
A study with visible-light responsive titania." Chemical Physics Letters 429.4 (2006): 606-
610.
84. (a) Guan, Huimin, et al. "Rapid probing of photocatalytic activity on titania-based self-
cleaning materials using 7-hydroxycoumarin fluorescent probe." Analytica chimica acta
608.1 (2008): 73-78. (b) Ishibashi K I, Fujishima A, Watanabe T, et al. Detection of active
oxidative species in TiO2 photocatalysis using the fluorescence technique[J].
Electrochemistry Communications, 2000, 2(3): 207-210.
85. Guillard C, Pichat P, Huber G, et al. The GC-MS Analysis of Organic Intermediates from the
TiO~ 2 Photocatalytic Treatment of Water Contaminated by Lindane (1, 2, 3, 4, 5, 6 -
hexachlorocyclohexane)^+[J]. Journal of Advanced Oxidation Technologies, 1996, 1: 53-60.
86. Carretero-Genevrier A, Boissiere C, Nicole L, et al. Distance dependence of the
photocatalytic efficiency of TiO2 revealed by in situ ellipsometry[J]. Journal of the American
Chemical Society, 2012, 134(26): 10761-10764.
87. Faustini M, Nicole L, Boissiere C, et al. Hydrophobic, antireflective, self-cleaning, and
antifogging sol− gel coatings: an example of multifunctional nanostructured materials for
photovoltaic cells[J]. Chemistry of Materials, 2010, 22(15): 4406-4413.
88. Manley D W, McBurney R T, Miller P, et al. Unconventional titania photocatalysis: Direct
deployment of carboxylic acids in alkylations and annulations[J]. Journal of the American
Chemical Society, 2012, 134(33): 13580-13583.
89. Kraeutler B, Bard A J. Heterogeneous photocatalytic synthesis of methane from acetic acid-
new Kolbe reaction pathway[J]. Journal of the American Chemical Society, 1978, 100(7):
2239-2240.
90. Kraeutler B, Jaeger C D, Bard A J. Direct observation of radical intermediates in the photo-
Kolbe reaction-heterogeneous photocatalytic radical formation by electron spin resonance[J].
Journal of the American Chemical Society, 1978, 100(15): 4903-4905.
91. Janzen E G, Evans C A, Nishi Y. Kinetic study of radical production in the thermal
decomposition of benzoyl peroxide by electron spin resonance spin trapping (spin counting).
Rate (and substituent effect on the rate) of spin trapping by competitive scavenging of
benzoyloxy radicals with galvinoxyl[J]. Journal of the American Chemical Society, 1972,
94(23): 8236-8238.
92. Chateauneuf J, Lusztyk J, Ingold K U. Spectroscopic and kinetic characteristics of aroyloxyl
radicals. 1. The 4-methoxybenzoyloxyl radical[J]. Journal of the American Chemical Society,
1988, 110(9): 2877-2885.
57
93. Chateauneuf J, Lusztyk J, Ingold K U. Spectroscopic and kinetic characteristics of aroyloxyl
radicals. 2. Benzoyloxyl and ring-substituted aroyloxyl radicals[J]. Journal of the American
Chemical Society, 1988, 110(9): 2886-2893.
94. Fraind A, Turncliff R, Fox T, et al. Exceptionally high decarboxylation rate of a primary
aliphatic acyloxy radical determined by radical product yield analysis and quantitative 1H‐
CIDNP spectroscopy[J]. Journal of Physical Organic Chemistry, 2011, 24(9): 809-820.
95. Houas A, Lachheb H, Ksibi M, et al. Photocatalytic degradation pathway of methylene blue
in water[J]. Applied Catalysis B: Environmental, 2001, 31(2): 145-157.
96. Ishibashi K I, Fujishima A, Watanabe T, et al. Detection of active oxidative species in TiO2
photocatalysis using the fluorescence technique[J]. Electrochemistry Communications, 2000,
2(3): 207-210.
97. d'Hennezel O, Pichat P, Ollis D F. Benzene and toluene gas-phase photocatalytic degradation
over H2O and HCL pretreated TiO2: by-products and mechanisms[J]. Journal of
Photochemistry and Photobiology A: Chemistry, 1998, 118(3): 197-204.
98. Agüera A, Almansa E, Malato S, et al. Evaluation of photocatalytic degradation of
imidacloprid in industrial water by GC-MS and LC-MS[J]. Analusis, 1998, 26(7): 245-250.
99. Theurich J, Bahnemann D W, Vogel R, et al. Photocatalytic degradation of naphthalene and
anthracene: GC-MS analysis of the degradation pathway[J]. Research on chemical
intermediates, 1997, 23(3): 247-274.
100.Costacurta S, Maso G D, Gallo R, et al. Influence of Temperature on the Photocatalytic
Activity of Sol− Gel TiO2 Films[J]. ACS applied materials & interfaces, 2010, 2(5): 1294-
1298.
101.Carboni D, Marongiu D, Rassu P, et al. Enhanced Photocatalytic Activity in Low-
Temperature Processed Titania Mesoporous Films[J]. The Journal of Physical Chemistry C,
2014, 118(22): 12000-12009.
102.Winterbottom A B. Optical Determination of Thin Films on Reflecting Bases in Transparent
Environments[J]. JOSA, 1948, 38(12): 1074-1082.
103.Archer R J. Determination of the Properties of Films on Silicon by the Method of
Ellipsometry[J]. JOSA, 1962, 52(9): 970-977.
104.Baklanov M R, Mogilnikov K P, Polovinkin V G, et al. Determination of pore size
distribution in thin films by ellipsometric porosimetry[J]. Journal of Vacuum Science &
Technology B, 2000, 18(3): 1385-1391.
58
105.Baklanov M R, Mogilnikov K P, Polovinkin V G, et al. Determination of pore size
distribution in thin films by ellipsometric porosimetry[J]. Journal of Vacuum Science &
Technology B, 2000, 18(3): 1385-1391.
106.Dultsev F N. Investigation of the microporous structure of porous layers using ellipsometric
adsorption porometry[J]. Thin solid films, 2004, 458(1): 137-142.
107.Boissiere C, Grosso D, Lepoutre S, et al. Porosity and mechanical properties of mesoporous
thin films assessed by environmental ellipsometric porosimetry[J]. Langmuir, 2005, 21(26):
12362-12371.
108.Gregg, S. J.; Sing, K. S. W. Adsorption, surface area and Porosity; Academic Press, London,
1982, P52.
109.Boissiere C, Brubach J B, Mermet A, et al. Water confined in lamellar structures of aot
surfactants: an infrared investigation[J]. The Journal of Physical Chemistry B, 2002, 106(5):
1032-1035.
110.Smirnov P, Yamaguchi T, Kittaka S, et al. X-ray diffraction study of water confined in
mesoporous MCM-41 materials over a temperature range of 223-298 K[J]. The Journal of
Physical Chemistry B, 2000, 104(23): 5498-5504.
111.Tolman R C. The effect of droplet size on surface tension[J]. The journal of chemical physics,
1949, 17(3): 333-337.
112.Galarneau A, Desplantier D, Dutartre R, et al. Micelle-templated silicates as a test bed for
methods of mesopore size evaluation[J]. Microporous and Mesoporous Materials, 1999, 27(2):
297-308.
113.Boissiere C, Grosso D, Lepoutre S, et al. Porosity and mechanical properties of mesoporous
thin films assessed by environmental ellipsometric porosimetry[J]. Langmuir, 2005, 21(26):
12362-12371.
114.Remillard J T, McBride J R, Nietering K E, et al. Real time in situ spectroscopic ellipsometry
studies of the photocatalytic oxidation of stearic acid on titania films[J]. The Journal of
Physical Chemistry B, 2000, 104(18): 4440-4447.
115.Soler-Illia G J A A, Angelomé P C, Fuertes M C, et al. Critical aspects in the production of
periodically ordered mesoporous titania thin films[J]. Nanoscale, 2012, 4(8): 2549-2566.
116.Grosso D, Cagnol F, Soler Illia G J A A, et al. Fundamentals of mesostructuring through
evaporation induced self assembly[J]. Advanced Functional Materials, 2004, 14(4): 309-322.
117.Fujishima A. Electrochemical photolysis of water at a semiconductor electrode[J]. nature,
1972, 238: 37-38.
59
118.Leroy C M, Wang H F, Fargues A, et al. Emission-photoactivity cross-processing of
mesoporous interfacial charge transfer in Eu3+ doped titania[J]. Physical Chemistry Chemical
Physics, 2011, 13(25): 11878-11884.
60
CHAPTER 2
Oxygen and Humidity effect on the
photocatalytic activity of porous TiO2 films
As mentioned in the previous chapter, mesoporous titania films can find application as self-
cleaning, photoactive coatings for air depollution. In this chapter, we exploit spectroscopic
ellipsometry to follow in situ the photodegradation of organic species at TiO2 interfaces
during UV irradiation in air in real-operating conditions. In real systems for instance, outdoor
humidity varies constantly and porosity can be alternatively full of liquid water or empty and
more or less accessible to volatile organic compounds. Mesoporous crystalline TiO2 thin
films were used as photoactive catalysers, while lauric acid (or methylene bleu) was used as
model pollutant. After infiltration of lauric acid in the TiO2 film, the local photocatalytic
activity was deduced by monitoring the variation of refractive index, which is directly related
to the total organic content (TOC) elimination, during irradiation at 364 nm within different
atmosphere compositions in O2 and H2O vapour. We also investigate here the influence of the
organic probe by using methylene blue as pollutant and discussing its efficacy to monitor
photocatalysis.
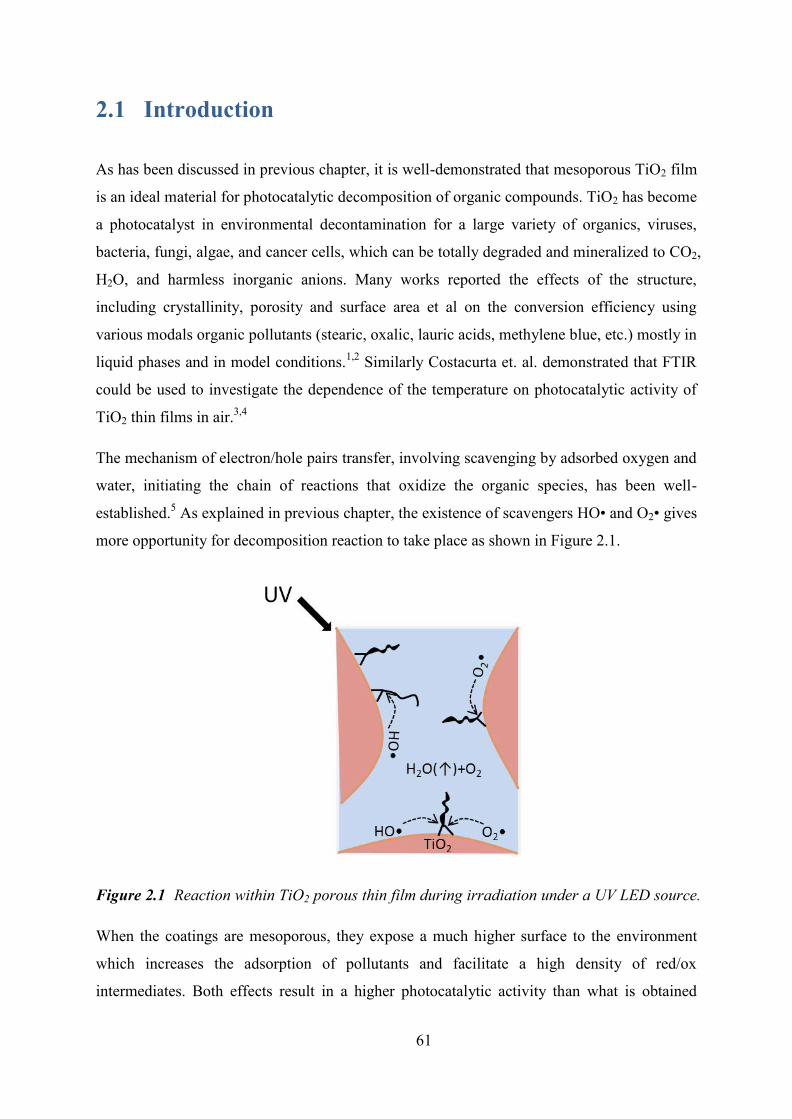
61
2.1 Introduction
As has been discussed in previous chapter, it is well-demonstrated that mesoporous TiO2 film
is an ideal material for photocatalytic decomposition of organic compounds. TiO2 has become
a photocatalyst in environmental decontamination for a large variety of organics, viruses,
bacteria, fungi, algae, and cancer cells, which can be totally degraded and mineralized to CO2,
H2O, and harmless inorganic anions. Many works reported the effects of the structure,
including crystallinity, porosity and surface area et al on the conversion efficiency using
various modals organic pollutants (stearic, oxalic, lauric acids, methylene blue, etc.) mostly in
liquid phases and in model conditions.1,2 Similarly Costacurta et. al. demonstrated that FTIR
could be used to investigate the dependence of the temperature on photocatalytic activity of
TiO2 thin films in air.3,4
The mechanism of electron/hole pairs transfer, involving scavenging by adsorbed oxygen and
water, initiating the chain of reactions that oxidize the organic species, has been well-
established.5 As explained in previous chapter, the existence of scavengers HO• and O2• gives
more opportunity for decomposition reaction to take place as shown in Figure 2.1.
Figure 2.1 Reaction within TiO2 porous thin film during irradiation under a UV LED source.
When the coatings are mesoporous, they expose a much higher surface to the environment
which increases the adsorption of pollutants and facilitate a high density of red/ox
intermediates. Both effects result in a higher photocatalytic activity than what is obtained
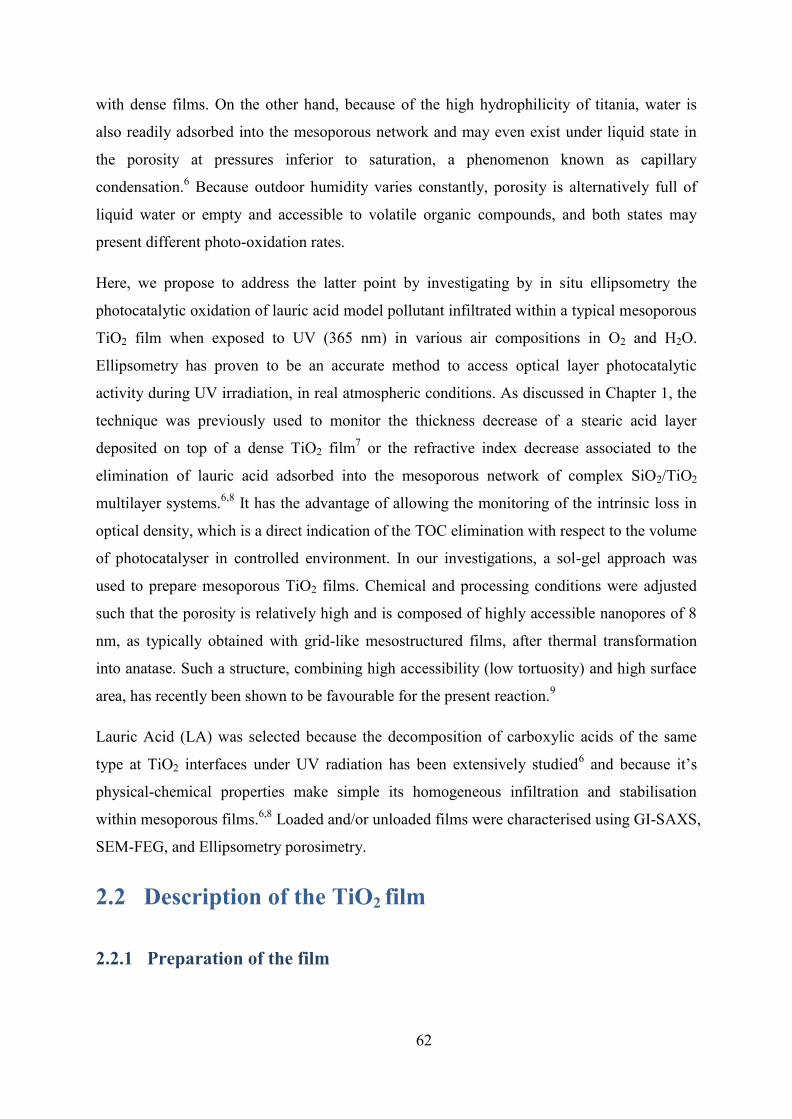
62
with dense films. On the other hand, because of the high hydrophilicity of titania, water is
also readily adsorbed into the mesoporous network and may even exist under liquid state in
the porosity at pressures inferior to saturation, a phenomenon known as capillary
condensation.6 Because outdoor humidity varies constantly, porosity is alternatively full of
liquid water or empty and accessible to volatile organic compounds, and both states may
present different photo-oxidation rates.
Here, we propose to address the latter point by investigating by in situ ellipsometry the
photocatalytic oxidation of lauric acid model pollutant infiltrated within a typical mesoporous
TiO2 film when exposed to UV (365 nm) in various air compositions in O2 and H2O.
Ellipsometry has proven to be an accurate method to access optical layer photocatalytic
activity during UV irradiation, in real atmospheric conditions. As discussed in Chapter 1, the
technique was previously used to monitor the thickness decrease of a stearic acid layer
deposited on top of a dense TiO2 film7 or the refractive index decrease associated to the
elimination of lauric acid adsorbed into the mesoporous network of complex SiO2/TiO2
multilayer systems.6,8 It has the advantage of allowing the monitoring of the intrinsic loss in
optical density, which is a direct indication of the TOC elimination with respect to the volume
of photocatalyser in controlled environment. In our investigations, a sol-gel approach was
used to prepare mesoporous TiO2 films. Chemical and processing conditions were adjusted
such that the porosity is relatively high and is composed of highly accessible nanopores of 8
nm, as typically obtained with grid-like mesostructured films, after thermal transformation
into anatase. Such a structure, combining high accessibility (low tortuosity) and high surface
area, has recently been shown to be favourable for the present reaction.9
Lauric Acid (LA) was selected because the decomposition of carboxylic acids of the same
type at TiO2 interfaces under UV radiation has been extensively studied6 and because it’s
physical-chemical properties make simple its homogeneous infiltration and stabilisation
within mesoporous films.6,8 Loaded and/or unloaded films were characterised using GI-SAXS,
SEM-FEG, and Ellipsometry porosimetry.
2.2 Description of the TiO2 film
2.2.1 Preparation of the film
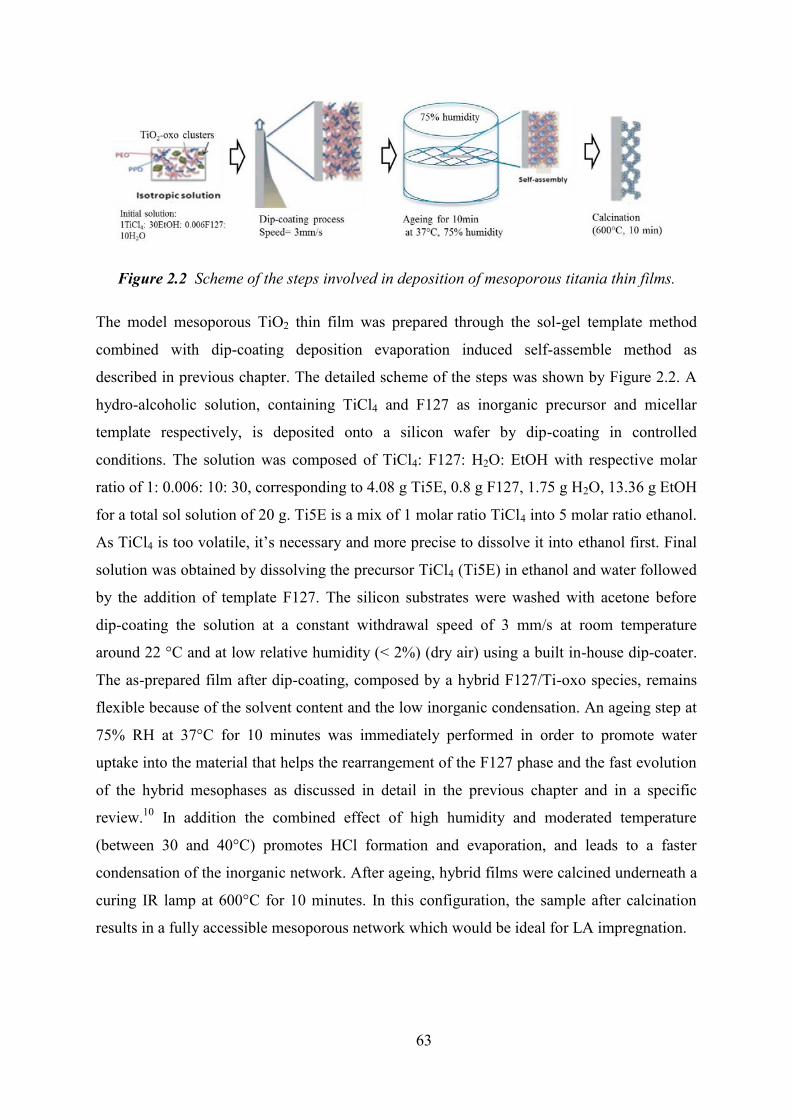
63
Figure 2.2 Scheme of the steps involved in deposition of mesoporous titania thin films.
The model mesoporous TiO2 thin film was prepared through the sol-gel template method
combined with dip-coating deposition evaporation induced self-assemble method as
described in previous chapter. The detailed scheme of the steps was shown by Figure 2.2. A
hydro-alcoholic solution, containing TiCl4 and F127 as inorganic precursor and micellar
template respectively, is deposited onto a silicon wafer by dip-coating in controlled
conditions. The solution was composed of TiCl4: F127: H2O: EtOH with respective molar
ratio of 1: 0.006: 10: 30, corresponding to 4.08 g Ti5E, 0.8 g F127, 1.75 g H2O, 13.36 g EtOH
for a total sol solution of 20 g. Ti5E is a mix of 1 molar ratio TiCl4 into 5 molar ratio ethanol.
As TiCl4 is too volatile, it’s necessary and more precise to dissolve it into ethanol first. Final
solution was obtained by dissolving the precursor TiCl4 (Ti5E) in ethanol and water followed
by the addition of template F127. The silicon substrates were washed with acetone before
dip-coating the solution at a constant withdrawal speed of 3 mm/s at room temperature
around 22 °C and at low relative humidity (< 2%) (dry air) using a built in-house dip-coater.
The as-prepared film after dip-coating, composed by a hybrid F127/Ti-oxo species, remains
flexible because of the solvent content and the low inorganic condensation. An ageing step at
75% RH at 37°C for 10 minutes was immediately performed in order to promote water
uptake into the material that helps the rearrangement of the F127 phase and the fast evolution
of the hybrid mesophases as discussed in detail in the previous chapter and in a specific
review.10 In addition the combined effect of high humidity and moderated temperature
(between 30 and 40°C) promotes HCl formation and evaporation, and leads to a faster
condensation of the inorganic network. After ageing, hybrid films were calcined underneath a
curing IR lamp at 600°C for 10 minutes. In this configuration, the sample after calcination
results in a fully accessible mesoporous network which would be ideal for LA impregnation.
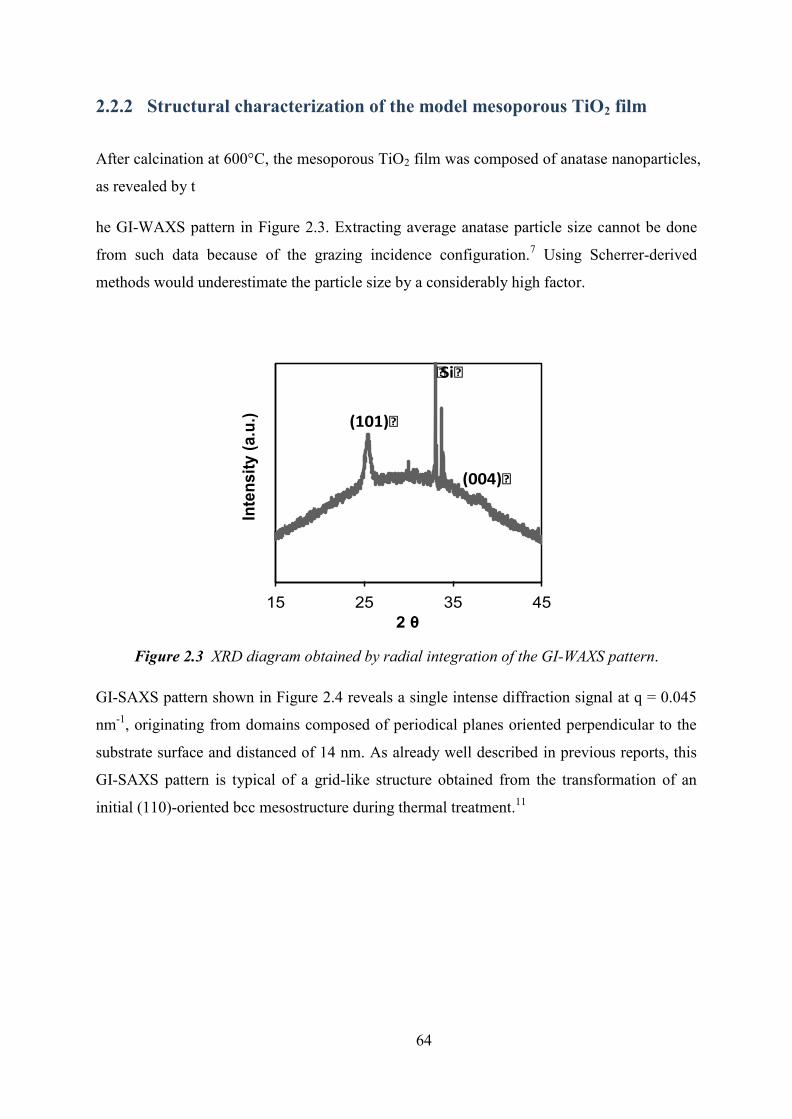
64
2.2.2 Structural characterization of the model mesoporous TiO2 film
After calcination at 600°C, the mesoporous TiO2 film was composed of anatase nanoparticles,
as revealed by t
he GI-WAXS pattern in Figure 2.3. Extracting average anatase particle size cannot be done
from such data because of the grazing incidence configuration.7 Using Scherrer-derived
methods would underestimate the particle size by a considerably high factor.
Figure 2.3 XRD diagram obtained by radial integration of the GI-WAXS pattern.
GI-SAXS pattern shown in Figure 2.4 reveals a single intense diffraction signal at q = 0.045
nm-1, originating from domains composed of periodical planes oriented perpendicular to the
substrate surface and distanced of 14 nm. As already well described in previous reports, this
GI-SAXS pattern is typical of a grid-like structure obtained from the transformation of an
initial (110)-oriented bcc mesostructure during thermal treatment.11
15 25 35 45
Inte
nsity
(a.u
.)
2 θ
(101)�
(004)�
�Si�C)�
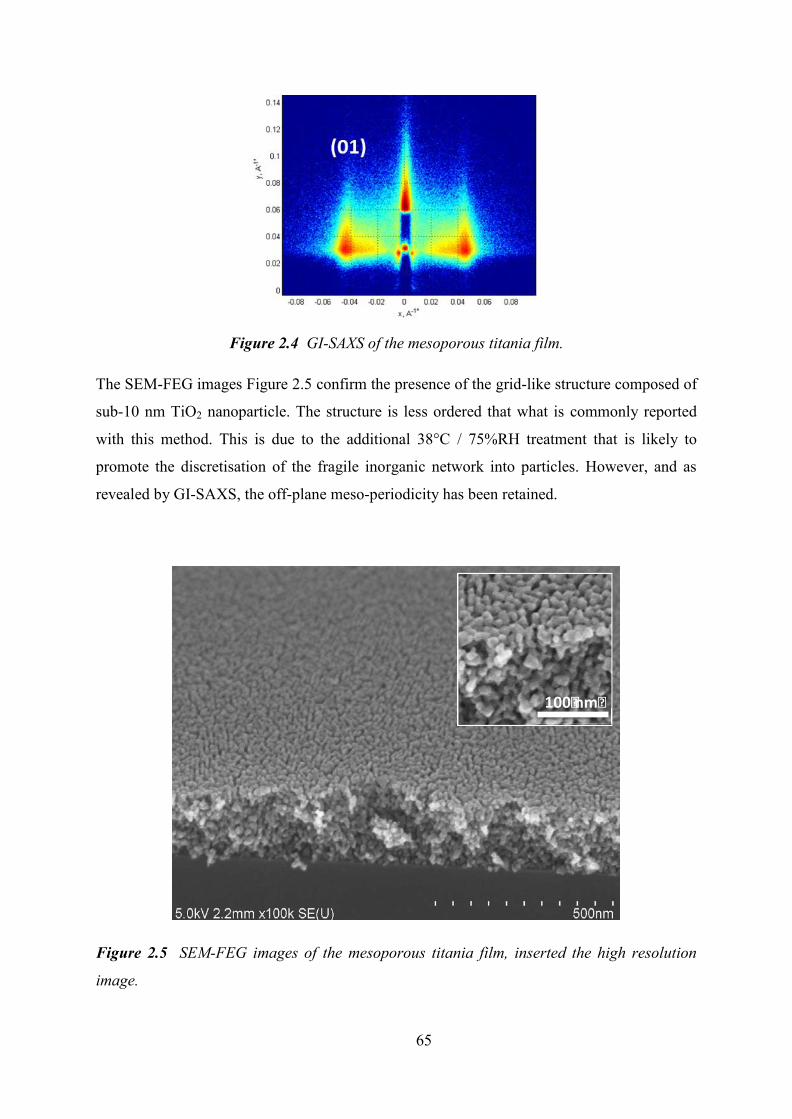
65
Figure 2.4 GI-SAXS of the mesoporous titania film.
The SEM-FEG images Figure 2.5 confirm the presence of the grid-like structure composed of
sub-10 nm TiO2 nanoparticle. The structure is less ordered that what is commonly reported
with this method. This is due to the additional 38°C / 75%RH treatment that is likely to
promote the discretisation of the fragile inorganic network into particles. However, and as
revealed by GI-SAXS, the off-plane meso-periodicity has been retained.
Figure 2.5 SEM-FEG images of the mesoporous titania film, inserted the high resolution
image.
D)�
E)�
100�nm�
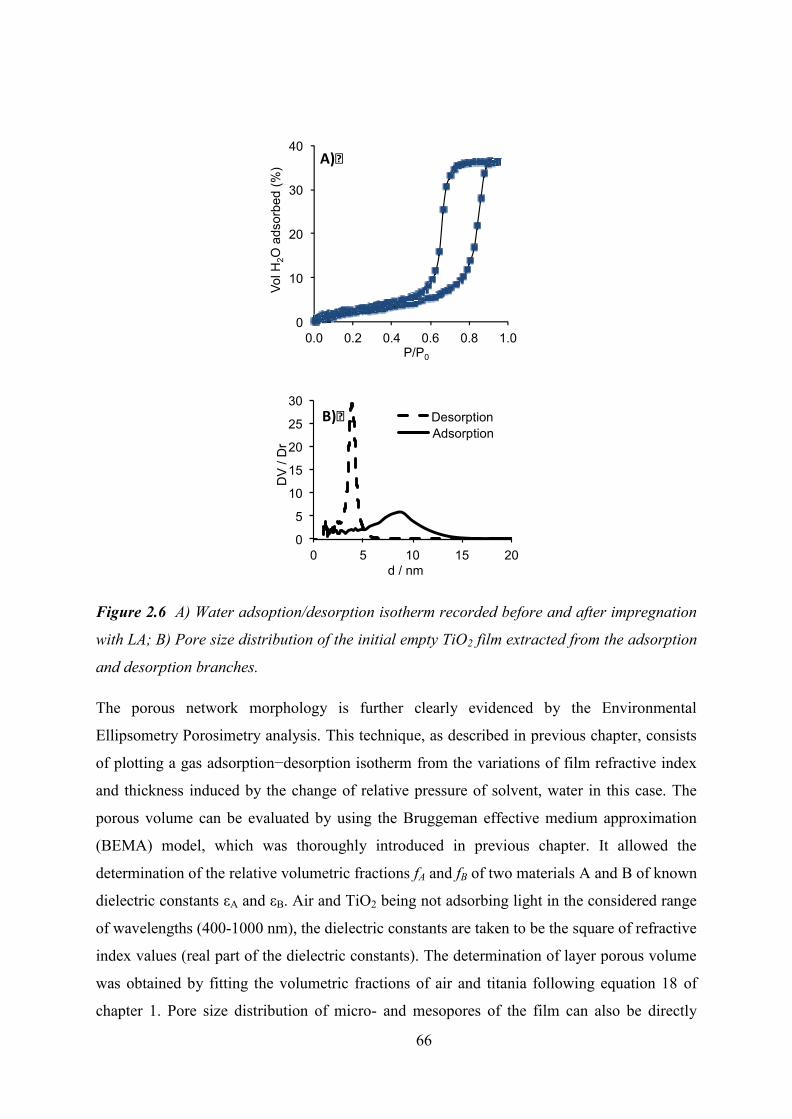
66
Figure 2.6 A) Water adsoption/desorption isotherm recorded before and after impregnation
with LA; B) Pore size distribution of the initial empty TiO2 film extracted from the adsorption
and desorption branches.
The porous network morphology is further clearly evidenced by the Environmental
Ellipsometry Porosimetry analysis. This technique, as described in previous chapter, consists
of plotting a gas adsorption−desorption isotherm from the variations of film refractive index
and thickness induced by the change of relative pressure of solvent, water in this case. The
porous volume can be evaluated by using the Bruggeman effective medium approximation
(BEMA) model, which was thoroughly introduced in previous chapter. It allowed the
determination of the relative volumetric fractions fA and fB of two materials A and B of known
dielectric constants εA and εB. Air and TiO2 being not adsorbing light in the considered range
of wavelengths (400-1000 nm), the dielectric constants are taken to be the square of refractive
index values (real part of the dielectric constants). The determination of layer porous volume
was obtained by fitting the volumetric fractions of air and titania following equation 18 of
chapter 1. Pore size distribution of micro- and mesopores of the film can also be directly
0
10
20
30
40
0.0 0.2 0.4 0.6 0.8 1.0
Vol H
2O a
dsor
bed
(%)
P/P0
0
5
10
15
20
25
30
0 5 10 15 20
DV
/ Dr
d / nm
Desorption Adsorption
A)�
B)�
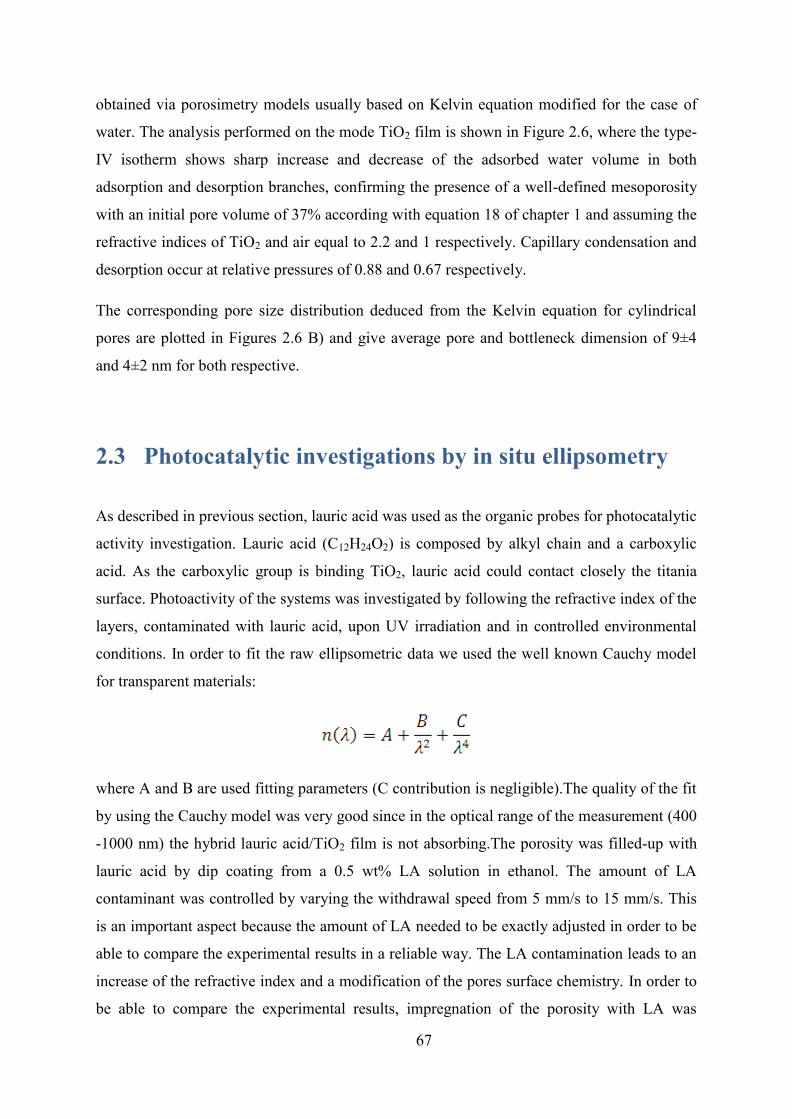
67
obtained via porosimetry models usually based on Kelvin equation modified for the case of
water. The analysis performed on the mode TiO2 film is shown in Figure 2.6, where the type-
IV isotherm shows sharp increase and decrease of the adsorbed water volume in both
adsorption and desorption branches, confirming the presence of a well-defined mesoporosity
with an initial pore volume of 37% according with equation 18 of chapter 1 and assuming the
refractive indices of TiO2 and air equal to 2.2 and 1 respectively. Capillary condensation and
desorption occur at relative pressures of 0.88 and 0.67 respectively.
The corresponding pore size distribution deduced from the Kelvin equation for cylindrical
pores are plotted in Figures 2.6 B) and give average pore and bottleneck dimension of 9±4
and 4±2 nm for both respective.
2.3 Photocatalytic investigations by in situ ellipsometry
As described in previous section, lauric acid was used as the organic probes for photocatalytic
activity investigation. Lauric acid (C12H24O2) is composed by alkyl chain and a carboxylic
acid. As the carboxylic group is binding TiO2, lauric acid could contact closely the titania
surface. Photoactivity of the systems was investigated by following the refractive index of the
layers, contaminated with lauric acid, upon UV irradiation and in controlled environmental
conditions. In order to fit the raw ellipsometric data we used the well known Cauchy model
for transparent materials:
where A and B are used fitting parameters (C contribution is negligible).The quality of the fit
by using the Cauchy model was very good since in the optical range of the measurement (400
-1000 nm) the hybrid lauric acid/TiO2 film is not absorbing.The porosity was filled-up with
lauric acid by dip coating from a 0.5 wt% LA solution in ethanol. The amount of LA
contaminant was controlled by varying the withdrawal speed from 5 mm/s to 15 mm/s. This
is an important aspect because the amount of LA needed to be exactly adjusted in order to be
able to compare the experimental results in a reliable way. The LA contamination leads to an
increase of the refractive index and a modification of the pores surface chemistry. In order to
be able to compare the experimental results, impregnation of the porosity with LA was
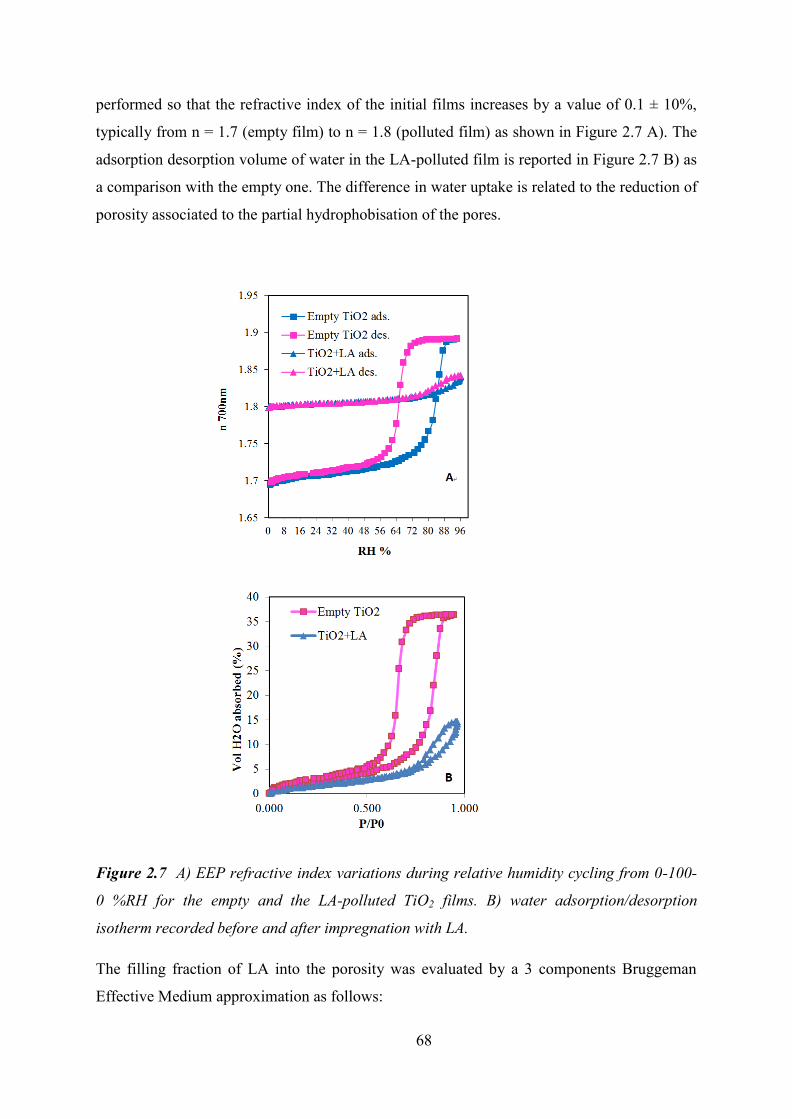
68
performed so that the refractive index of the initial films increases by a value of 0.1 ± 10%,
typically from n = 1.7 (empty film) to n = 1.8 (polluted film) as shown in Figure 2.7 A). The
adsorption desorption volume of water in the LA-polluted film is reported in Figure 2.7 B) as
a comparison with the empty one. The difference in water uptake is related to the reduction of
porosity associated to the partial hydrophobisation of the pores.
Figure 2.7 A) EEP refractive index variations during relative humidity cycling from 0-100-
0 %RH for the empty and the LA-polluted TiO2 films. B) water adsorption/desorption
isotherm recorded before and after impregnation with LA.
The filling fraction of LA into the porosity was evaluated by a 3 components Bruggeman
Effective Medium approximation as follows:
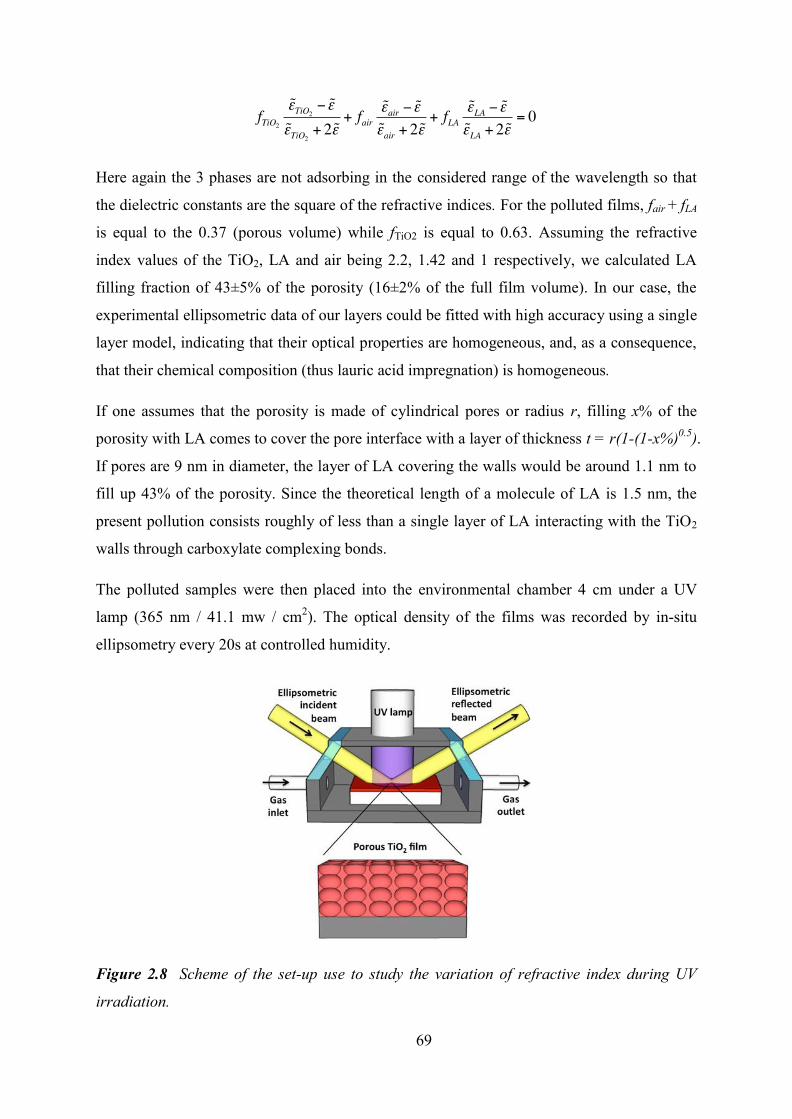
69
Here again the 3 phases are not adsorbing in the considered range of the wavelength so that
the dielectric constants are the square of the refractive indices. For the polluted films, fair + fLA
is equal to the 0.37 (porous volume) while fTiO2 is equal to 0.63. Assuming the refractive
index values of the TiO2, LA and air being 2.2, 1.42 and 1 respectively, we calculated LA
filling fraction of 43±5% of the porosity (16±2% of the full film volume). In our case, the
experimental ellipsometric data of our layers could be fitted with high accuracy using a single
layer model, indicating that their optical properties are homogeneous, and, as a consequence,
that their chemical composition (thus lauric acid impregnation) is homogeneous.
If one assumes that the porosity is made of cylindrical pores or radius r, filling x% of the
porosity with LA comes to cover the pore interface with a layer of thickness t = r(1-(1-x%)0.5).
If pores are 9 nm in diameter, the layer of LA covering the walls would be around 1.1 nm to
fill up 43% of the porosity. Since the theoretical length of a molecule of LA is 1.5 nm, the
present pollution consists roughly of less than a single layer of LA interacting with the TiO2
walls through carboxylate complexing bonds.
The polluted samples were then placed into the environmental chamber 4 cm under a UV
lamp (365 nm / 41.1 mw / cm2). The optical density of the films was recorded by in-situ
ellipsometry every 20s at controlled humidity.
Figure 2.8 Scheme of the set-up use to study the variation of refractive index during UV
irradiation.
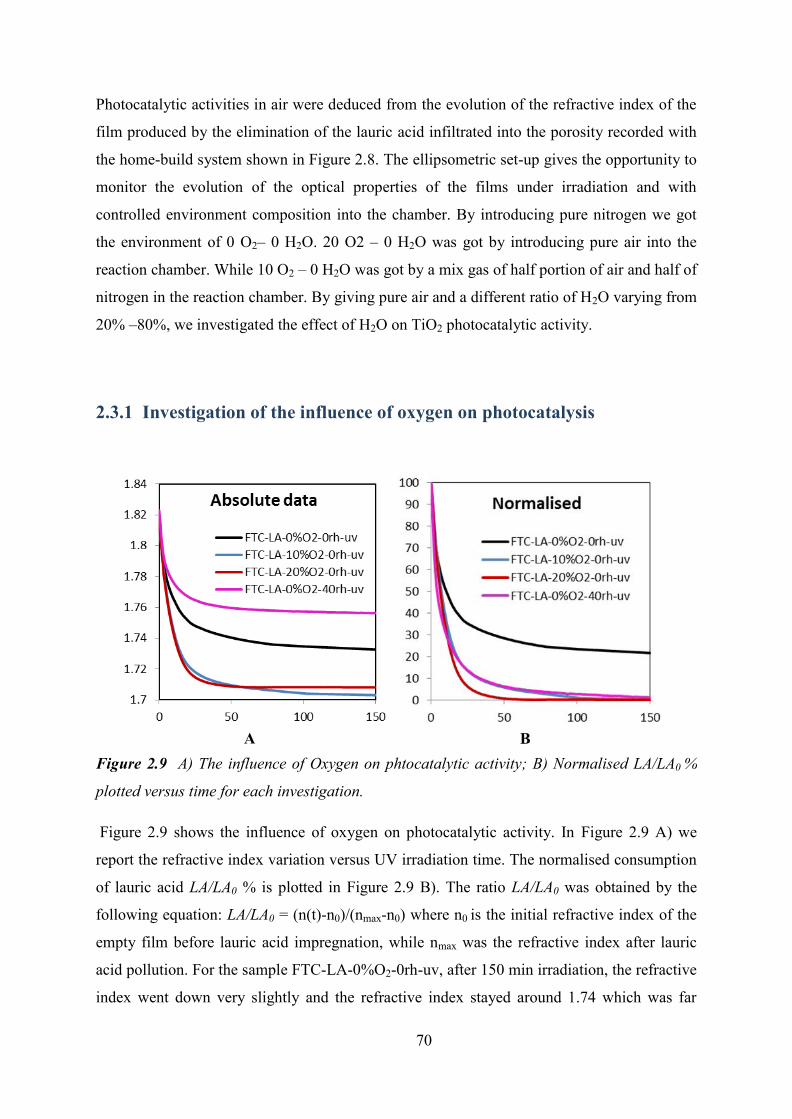
70
Photocatalytic activities in air were deduced from the evolution of the refractive index of the
film produced by the elimination of the lauric acid infiltrated into the porosity recorded with
the home-build system shown in Figure 2.8. The ellipsometric set-up gives the opportunity to
monitor the evolution of the optical properties of the films under irradiation and with
controlled environment composition into the chamber. By introducing pure nitrogen we got
the environment of 0 O2– 0 H2O. 20 O2 – 0 H2O was got by introducing pure air into the
reaction chamber. While 10 O2 – 0 H2O was got by a mix gas of half portion of air and half of
nitrogen in the reaction chamber. By giving pure air and a different ratio of H2O varying from
20% –80%, we investigated the effect of H2O on TiO2 photocatalytic activity.
2.3.1 Investigation of the influence of oxygen on photocatalysis
Figure 2.9 A) The influence of Oxygen on phtocatalytic activity; B) Normalised LA/LA0 %
plotted versus time for each investigation.
Figure 2.9 shows the influence of oxygen on photocatalytic activity. In Figure 2.9 A) we
report the refractive index variation versus UV irradiation time. The normalised consumption
of lauric acid LA/LA0 % is plotted in Figure 2.9 B). The ratio LA/LA0 was obtained by the
following equation: LA/LA0 = (n(t)-n0)/(nmax-n0) where n0 is the initial refractive index of the
empty film before lauric acid impregnation, while nmax was the refractive index after lauric
acid pollution. For the sample FTC-LA-0%O2-0rh-uv, after 150 min irradiation, the refractive
index went down very slightly and the refractive index stayed around 1.74 which was far
A B
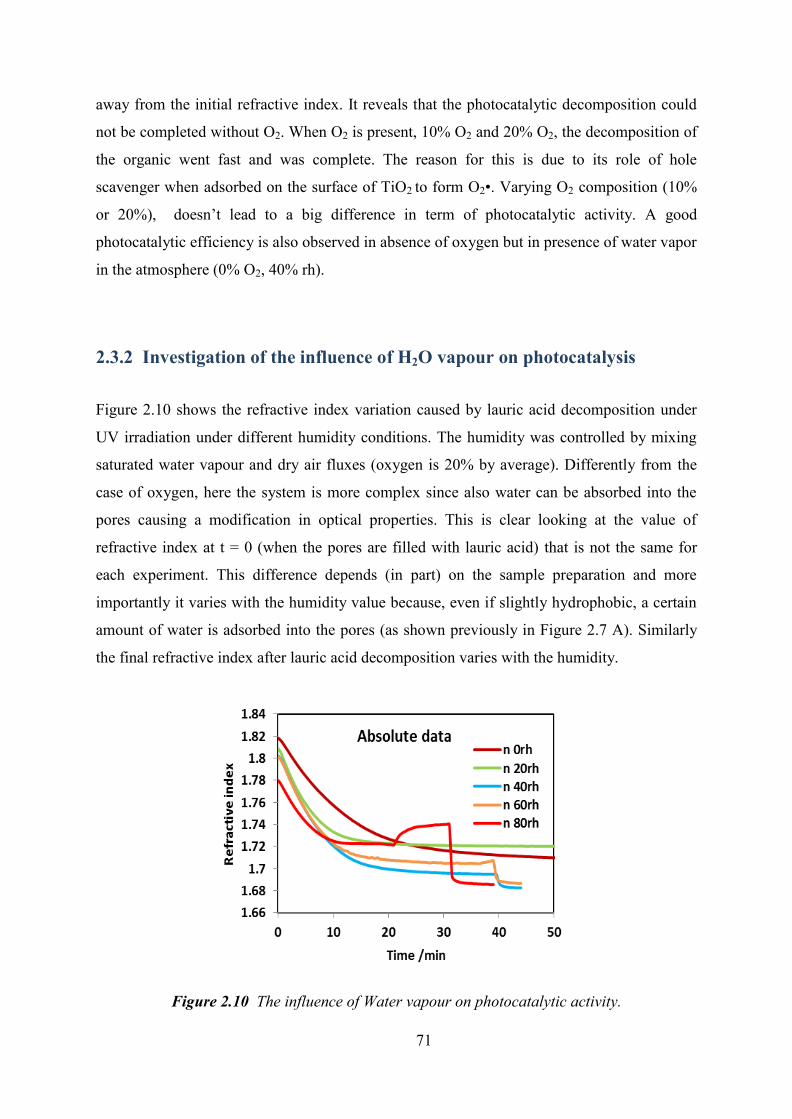
71
away from the initial refractive index. It reveals that the photocatalytic decomposition could
not be completed without O2. When O2 is present, 10% O2 and 20% O2, the decomposition of
the organic went fast and was complete. The reason for this is due to its role of hole
scavenger when adsorbed on the surface of TiO2 to form O2•. Varying O2 composition (10%
or 20%), doesn’t lead to a big difference in term of photocatalytic activity. A good
photocatalytic efficiency is also observed in absence of oxygen but in presence of water vapor
in the atmosphere (0% O2, 40% rh).
2.3.2 Investigation of the influence of H2O vapour on photocatalysis
Figure 2.10 shows the refractive index variation caused by lauric acid decomposition under
UV irradiation under different humidity conditions. The humidity was controlled by mixing
saturated water vapour and dry air fluxes (oxygen is 20% by average). Differently from the
case of oxygen, here the system is more complex since also water can be absorbed into the
pores causing a modification in optical properties. This is clear looking at the value of
refractive index at t = 0 (when the pores are filled with lauric acid) that is not the same for
each experiment. This difference depends (in part) on the sample preparation and more
importantly it varies with the humidity value because, even if slightly hydrophobic, a certain
amount of water is adsorbed into the pores (as shown previously in Figure 2.7 A). Similarly
the final refractive index after lauric acid decomposition varies with the humidity.
Figure 2.10 The influence of Water vapour on photocatalytic activity.
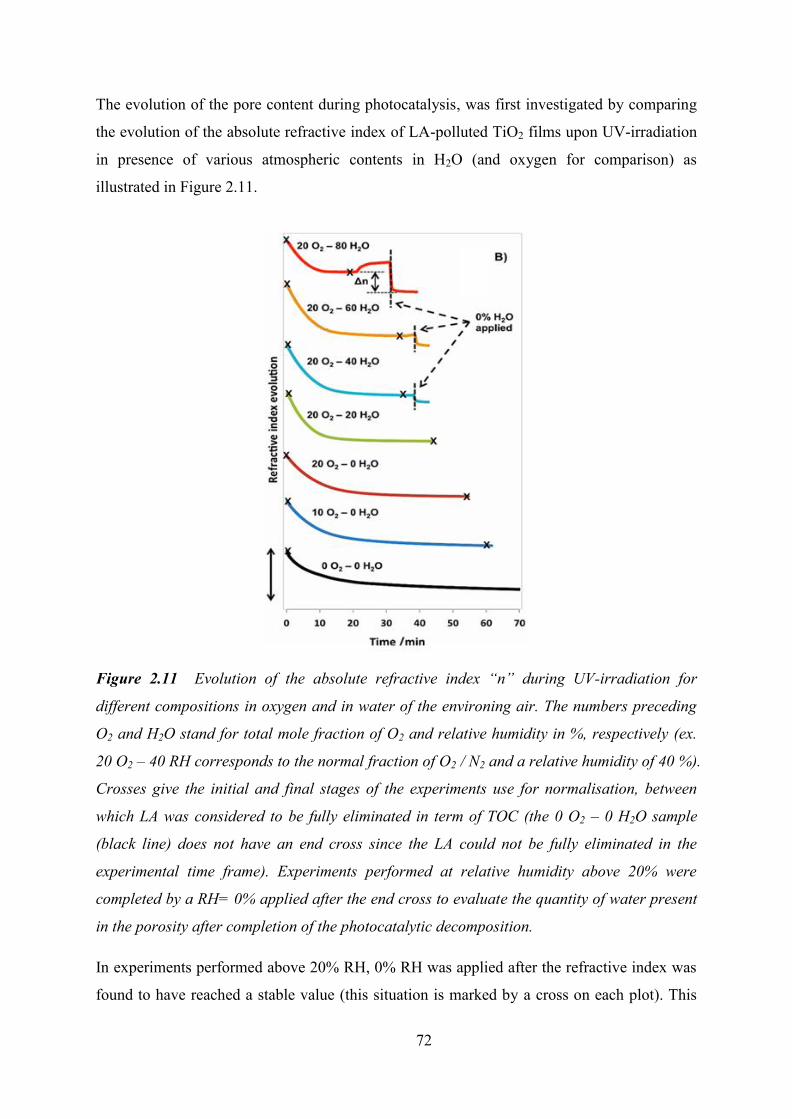
72
The evolution of the pore content during photocatalysis, was first investigated by comparing
the evolution of the absolute refractive index of LA-polluted TiO2 films upon UV-irradiation
in presence of various atmospheric contents in H2O (and oxygen for comparison) as
illustrated in Figure 2.11.
Figure 2.11 Evolution of the absolute refractive index “n” during UV-irradiation for
different compositions in oxygen and in water of the environing air. The numbers preceding
O2 and H2O stand for total mole fraction of O2 and relative humidity in %, respectively (ex.
20 O2 – 40 RH corresponds to the normal fraction of O2 / N2 and a relative humidity of 40 %).
Crosses give the initial and final stages of the experiments use for normalisation, between
which LA was considered to be fully eliminated in term of TOC (the 0 O2 – 0 H2O sample
(black line) does not have an end cross since the LA could not be fully eliminated in the
experimental time frame). Experiments performed at relative humidity above 20% were
completed by a RH= 0% applied after the end cross to evaluate the quantity of water present
in the porosity after completion of the photocatalytic decomposition.
In experiments performed above 20% RH, 0% RH was applied after the refractive index was
found to have reached a stable value (this situation is marked by a cross on each plot). This
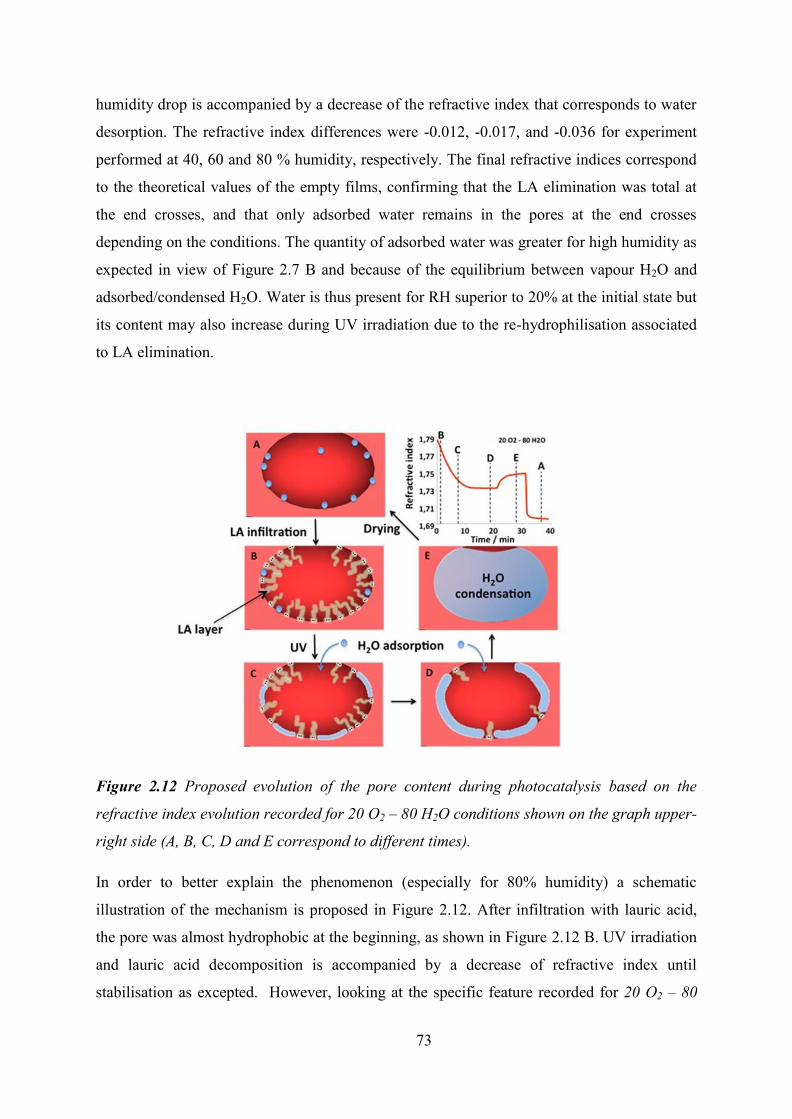
73
humidity drop is accompanied by a decrease of the refractive index that corresponds to water
desorption. The refractive index differences were -0.012, -0.017, and -0.036 for experiment
performed at 40, 60 and 80 % humidity, respectively. The final refractive indices correspond
to the theoretical values of the empty films, confirming that the LA elimination was total at
the end crosses, and that only adsorbed water remains in the pores at the end crosses
depending on the conditions. The quantity of adsorbed water was greater for high humidity as
expected in view of Figure 2.7 B and because of the equilibrium between vapour H2O and
adsorbed/condensed H2O. Water is thus present for RH superior to 20% at the initial state but
its content may also increase during UV irradiation due to the re-hydrophilisation associated
to LA elimination.
Figure 2.12 Proposed evolution of the pore content during photocatalysis based on the
refractive index evolution recorded for 20 O2 – 80 H2O conditions shown on the graph upper-
right side (A, B, C, D and E correspond to different times).
In order to better explain the phenomenon (especially for 80% humidity) a schematic
illustration of the mechanism is proposed in Figure 2.12. After infiltration with lauric acid,
the pore was almost hydrophobic at the beginning, as shown in Figure 2.12 B. UV irradiation
and lauric acid decomposition is accompanied by a decrease of refractive index until
stabilisation as excepted. However, looking at the specific feature recorded for 20 O2 – 80
74
H2O, one can observe a significant n increase occurring after stabilisation (after the end cross).
The refractive index increase is due to water adsorption and condensation after LA
degradation. Because of the hydrophobicity of the LA hydrocarbon tail, one expects the pore
to become more and more hydrophilic upon decomposition of the pollutant. It thus is not
surprising to have water adsorbing after depollution as shown in Figure 2.12 C. Finally, the
pore surface became completely hydrophilic as lauric acid disappearing as shown in 2.9 D
causing water capillary condensation phenomenon as shown in E. Refractive index showed a
significant rise at the point.
2.3.3 Discussion about photocatalytic efficiency and kinetics
In order to estimate the photocatalytic efficiency the lauric acid consumption must be
evaluated for each experiment. Here the goal is to determine the lauric acid composition
variation in the porosity in a system with 4 components (TiO2, LA, water and air). For
simplicity, for the following experiments involving 4 components the global refractive index
was taken to be linearly dependent with the volume fraction of components (fTiO2; fLA; fH2O;
fAIR), weighted by their own refractive index (nTiO2=2.2; nLA=1.42; nH2O=1.37; nAIR=1) as in
equation.
𝑛 𝑓 2𝑛 2 𝑓𝐿𝐴𝑛𝐿𝐴 𝑓 2 𝑛 2 𝑓 2𝐴 𝑛𝐴
With:
𝑓 2 𝑓𝐿𝐴 𝑓 2 𝑓𝐴
And knowing that for the polluted films without water, fair + fLA is equal to 0,37 (porous
volume) while fTiO2 is equal to 0,63. It would have been possible to use laws, such as the
Bruggeman Effective Medium approximation, to determine more accurately the fraction of
each phase from the refractive index dispersions of each, but it appears that it does not
significantly change the extracted tendencies exploited to compare the photocatalytic
efficiency.
In Figures 2.13 A) we show the evolution of the LA consumptions for different oxygen and
humidity content. One first observes that all experiments show the elimination of LA but with
different efficiencies. Except for the 0 O2 – 0 H2O, all data were collected up to less than 2%
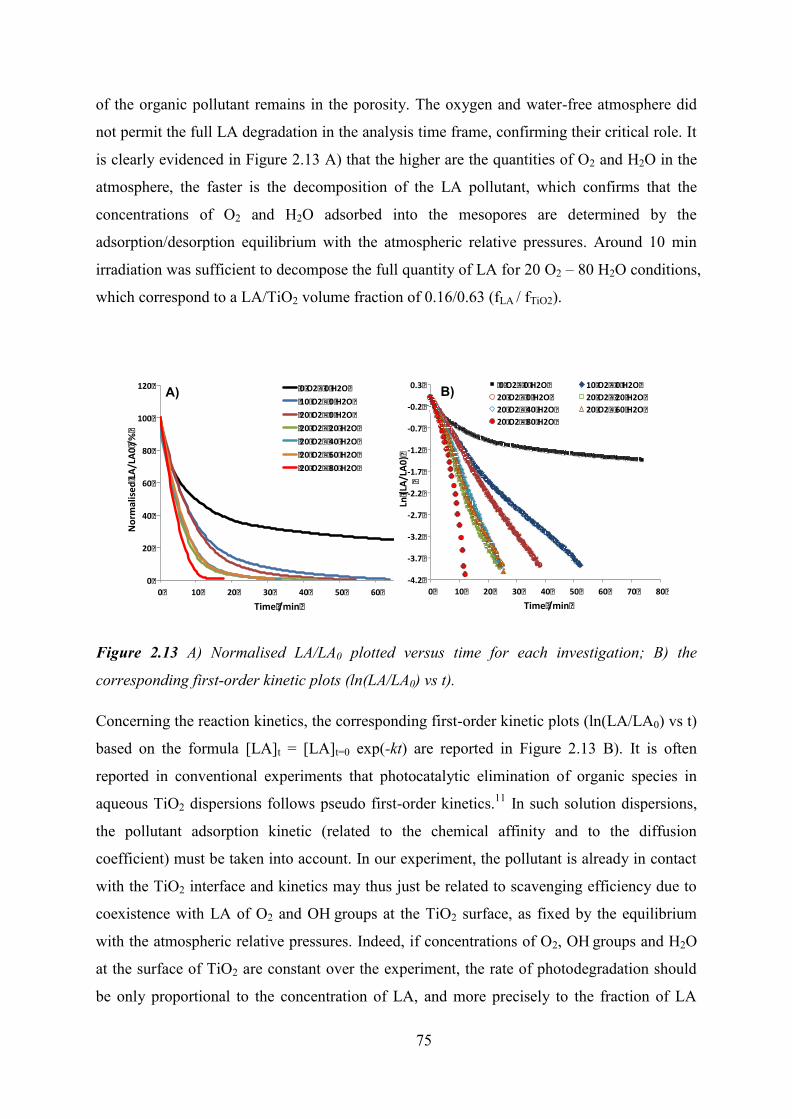
75
of the organic pollutant remains in the porosity. The oxygen and water-free atmosphere did
not permit the full LA degradation in the analysis time frame, confirming their critical role. It
is clearly evidenced in Figure 2.13 A) that the higher are the quantities of O2 and H2O in the
atmosphere, the faster is the decomposition of the LA pollutant, which confirms that the
concentrations of O2 and H2O adsorbed into the mesopores are determined by the
adsorption/desorption equilibrium with the atmospheric relative pressures. Around 10 min
irradiation was sufficient to decompose the full quantity of LA for 20 O2 – 80 H2O conditions,
which correspond to a LA/TiO2 volume fraction of 0.16/0.63 (fLA / fTiO2).
Figure 2.13 A) Normalised LA/LA0 plotted versus time for each investigation; B) the
corresponding first-order kinetic plots (ln(LA/LA0) vs t).
Concerning the reaction kinetics, the corresponding first-order kinetic plots (ln(LA/LA0) vs t)
based on the formula [LA]t = [LA]t=0 exp(-kt) are reported in Figure 2.13 B). It is often
reported in conventional experiments that photocatalytic elimination of organic species in
aqueous TiO2 dispersions follows pseudo first-order kinetics.11 In such solution dispersions,
the pollutant adsorption kinetic (related to the chemical affinity and to the diffusion
coefficient) must be taken into account. In our experiment, the pollutant is already in contact
with the TiO2 interface and kinetics may thus just be related to scavenging efficiency due to
coexistence with LA of O2 and OH groups at the TiO2 surface, as fixed by the equilibrium
with the atmospheric relative pressures. Indeed, if concentrations of O2, OH groups and H2O
at the surface of TiO2 are constant over the experiment, the rate of photodegradation should
be only proportional to the concentration of LA, and more precisely to the fraction of LA
A)
0�
20�
40�
60�
80�
100�
120�
0� 10� 20� 30� 40� 50� 60�
Norm
alise
d�LA
/LA0
�/%�
Time�/min�
�0�O2�-�0�H2O��10�O2�-�0�H2O��20�O2�-�0�H2O��20�O2�-�20�H2O��20�O2�-�40�H2O��20�O2�-�60�H2O��20�O2�-�80�H2O�
-4.2�
-3.7�
-3.2�
-2.7�
-2.2�
-1.7�
-1.2�
-0.7�
-0.2�
0.3�
0� 10� 20� 30� 40� 50� 60� 70� 80�
Ln�(LA/
LA0)�
�
Time�/min�
�0�O2�-�0�H2O� 10�O2�-�0�H2O�20�O2�-�0�H2O� 20�O2�-�20�H2O�20�O2�-�40�H2O� 20�O2�-�60�H2O�20�O2�-�80�H2O�
B)
76
occupying the catalytic sites here, as described by the model of Langmuir-Hinshelwood. Such
a situation would lead to a constant degradation rate that is only affected by the pollutant
density. The plot ln(LA/LA0) vs t in Figure 2.13 B) are not linear, suggesting that this simple
situation is not the case and that the evolution of rates is not only due to the progressive
consumption of LA but also due to other factors that evolve during the experiment. Figure
2.13 also shows that this evolution could be either an increase of the photocatalytic efficiency
as in the case of 20 O2 – 80 H2O, or inversely could be a diminution of the photocatalytic
efficiency as in the case 0 O2 – 0 H2O.
Because of the non-linearity of the first-order kinetic plots in Figure 2.13 B), no kinetic
constant (k) could be extracted for the whole curves. The fluctuation of (k) upon
advancement of the experiments can be visualised using the corresponding derivatives -
d(ln(LA/LA0))/dt vs t as plotted in Figure 2.14. It is clear that radically different tendencies
denote the influences of atmospheric water and oxygen contents. Because the structure and
dimension of the TiO2 matrix is expected to remain stable, we can assume that fluctuations in
k with time are mainly governed by evolution of TiO2 surface densities in scavengers.
Because atmospheric O2 and H2O relative pressures are fixed by the applied conditions, only
the diffusion of the latters within the porosity, throughout the adsorbed LA layer, and towards
the titania interface may be responsible for these fluctuations. First in absence of O2 and H2O
in the atmosphere, the activity starts with a kinetic constant that is 0.1 min-1, slightly less than
in presence of water, but which rapidly drops down to 0.007 min-1 after 30 min. The initial
activity is higher certainly due to the presence of scavengers intrinsically adsorbed during
handling and impregnation with LA. Once these were consumed, the remaining low activity
is due to photocatalytic activity in real water-free and anaerobic conditions. It was
demonstrated that in such anaerobic conditions, an unconventional titania catalysis of
carboxylic acids leads to carbon-carbon bond formation between two alkyl chains through a
decarboxylation followed by radical dimerization, analogous to the photo-Kolbe reaction.6,11
Similar observations can be made on the two following water-free experiments, involving 10%
and 20% O2 in the atmosphere. Activities start with k around 0.1min-1, but the decrease
occurs after 12 min and reaches around 0.045 and 0.075 min-1 respectively. This situation
corresponds to consumption of 70% of the organic pollutant. No Kolbe-type reaction is
expected. Since the latter experiments concern only O2, one concludes that a higher quantity
of O2 adsorbed on the TiO2 surface for higher content in the gas phase, as expected from
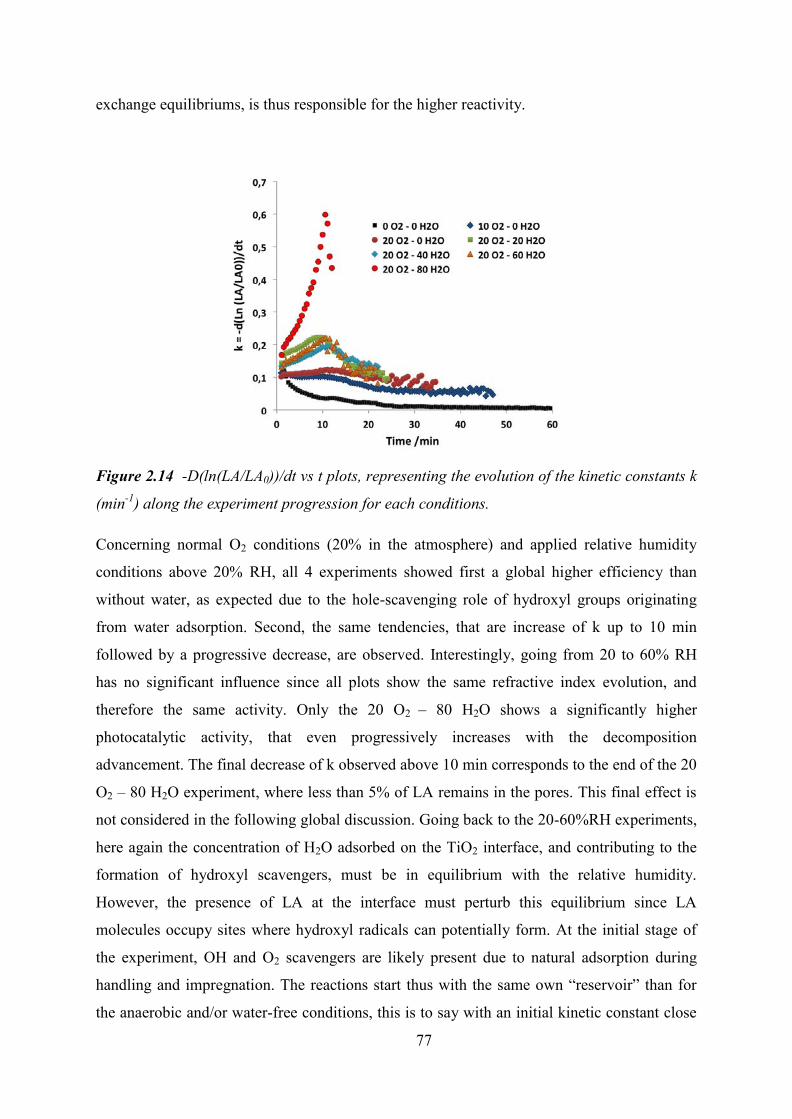
77
exchange equilibriums, is thus responsible for the higher reactivity.
Figure 2.14 -D(ln(LA/LA0))/dt vs t plots, representing the evolution of the kinetic constants k
(min-1) along the experiment progression for each conditions.
Concerning normal O2 conditions (20% in the atmosphere) and applied relative humidity
conditions above 20% RH, all 4 experiments showed first a global higher efficiency than
without water, as expected due to the hole-scavenging role of hydroxyl groups originating
from water adsorption. Second, the same tendencies, that are increase of k up to 10 min
followed by a progressive decrease, are observed. Interestingly, going from 20 to 60% RH
has no significant influence since all plots show the same refractive index evolution, and
therefore the same activity. Only the 20 O2 – 80 H2O shows a significantly higher
photocatalytic activity, that even progressively increases with the decomposition
advancement. The final decrease of k observed above 10 min corresponds to the end of the 20
O2 – 80 H2O experiment, where less than 5% of LA remains in the pores. This final effect is
not considered in the following global discussion. Going back to the 20-60%RH experiments,
here again the concentration of H2O adsorbed on the TiO2 interface, and contributing to the
formation of hydroxyl scavengers, must be in equilibrium with the relative humidity.
However, the presence of LA at the interface must perturb this equilibrium since LA
molecules occupy sites where hydroxyl radicals can potentially form. At the initial stage of
the experiment, OH and O2 scavengers are likely present due to natural adsorption during
handling and impregnation. The reactions start thus with the same own “reservoir” than for
the anaerobic and/or water-free conditions, this is to say with an initial kinetic constant close
78
to 0.1 min-1. During the first minutes, LA is decomposed and liberates sites where H2O and
O2 must adsorb. One recalls that water was present in increasing proportion in the pores at the
end of the experiments from 20% to 60% RH conditions (see Figure 2.11). Consequently, the
concentration in scavengers progressively increases with reaction time and the reaction
becomes thus more efficient as revealed by the value of k that double up to close to 0.2/min
in the first 10 min. This period is followed by a slow decrease of the efficiency down back to
k = 0.1 min-1. This inversion of the tendency occurring at 10 min corresponds to the
elimination of 80% of the LA that were likely replaced by scavengers. These observations
suggest that an ideal situation exists for the present system to react that could be related to an
optimal repartition of a certain ratio of scavenger/pollutant at the semi-conductor interface.
Water diffusion and adsorption is not the limiting factor since the same rates were recorded
between 20% and 60% RH while higher content of adsorbed water was recorded for 60% RH.
Finally, it is evident that the 20 O2 – 80 H2O conditions provide the more efficient
photoactivity, that is up to 3 times that of the second best conditions. It was mentioned earlier
that these conditions were also the only ones to allow for a much higher amount of water to
be adsorbed into the porosity (see Figure 2.7). The water adsorption/desorption isotherm in
Figure 2.7 B) shows that 80% RH is the relative pressure at which water capillary
condensation starts, suggesting that water does exist under liquid form into the nanoporosity.
The much higher photocatalytic activity recorded for 80% RH can thus be linked to the
presence of liquid water in the porosity. Such a liquid state must be beneficial to generate and
concentrate all activated oxygen intermediate species issued from cascade oxydoreduction
reaction from both scavengers. Liquid water allows also for the partial desorption (dissolution)
of LA, increasing the number of adsorption sites for scavengers. Both effects promote higher
LA decomposition efficiency. Finally, the final progressive increase in k value may also be
explained by the progressive uptake of liquid water during the reaction, as permitted by the
associated hydrophilisation of the pores, as already explained earlier. High humidity
conditions are thus beneficial for heterogeneous photocatalysis in nanoporous TiO2.
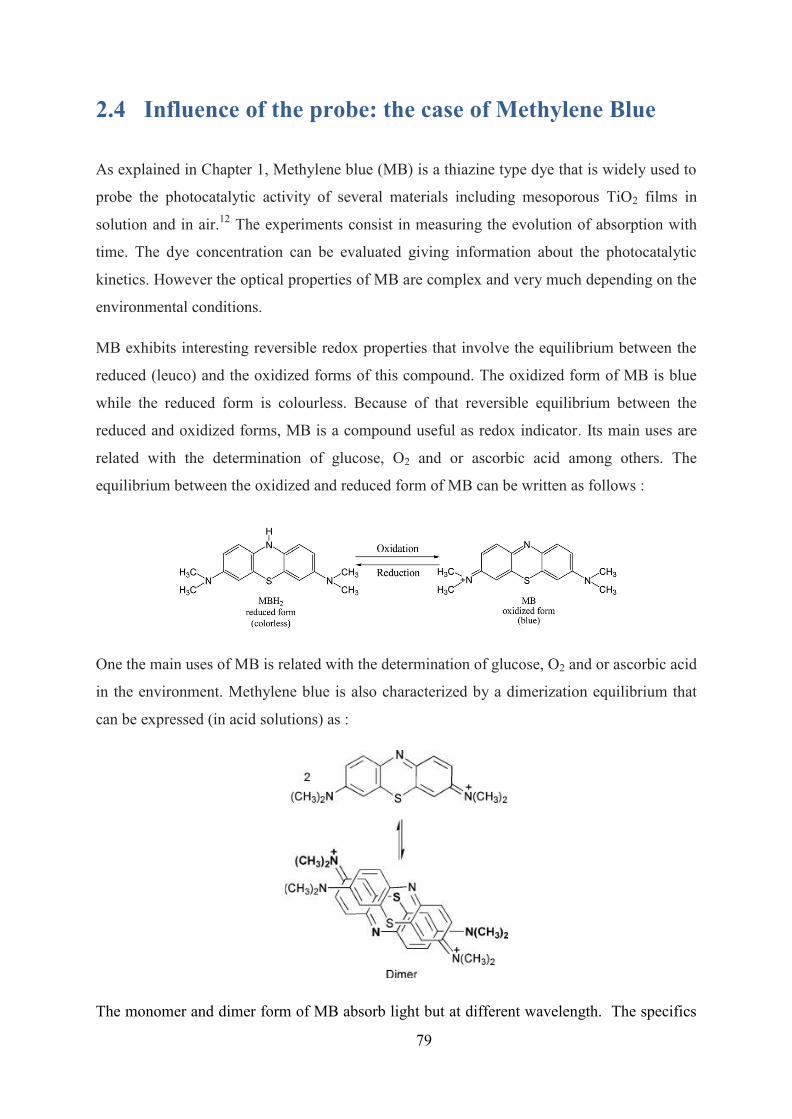
79
2.4 Influence of the probe: the case of Methylene Blue
As explained in Chapter 1, Methylene blue (MB) is a thiazine type dye that is widely used to
probe the photocatalytic activity of several materials including mesoporous TiO2 films in
solution and in air.12 The experiments consist in measuring the evolution of absorption with
time. The dye concentration can be evaluated giving information about the photocatalytic
kinetics. However the optical properties of MB are complex and very much depending on the
environmental conditions.
MB exhibits interesting reversible redox properties that involve the equilibrium between the
reduced (leuco) and the oxidized forms of this compound. The oxidized form of MB is blue
while the reduced form is colourless. Because of that reversible equilibrium between the
reduced and oxidized forms, MB is a compound useful as redox indicator. Its main uses are
related with the determination of glucose, O2 and or ascorbic acid among others. The
equilibrium between the oxidized and reduced form of MB can be written as follows :
One the main uses of MB is related with the determination of glucose, O2 and or ascorbic acid
in the environment. Methylene blue is also characterized by a dimerization equilibrium that
can be expressed (in acid solutions) as :
The monomer and dimer form of MB absorb light but at different wavelength. The specifics
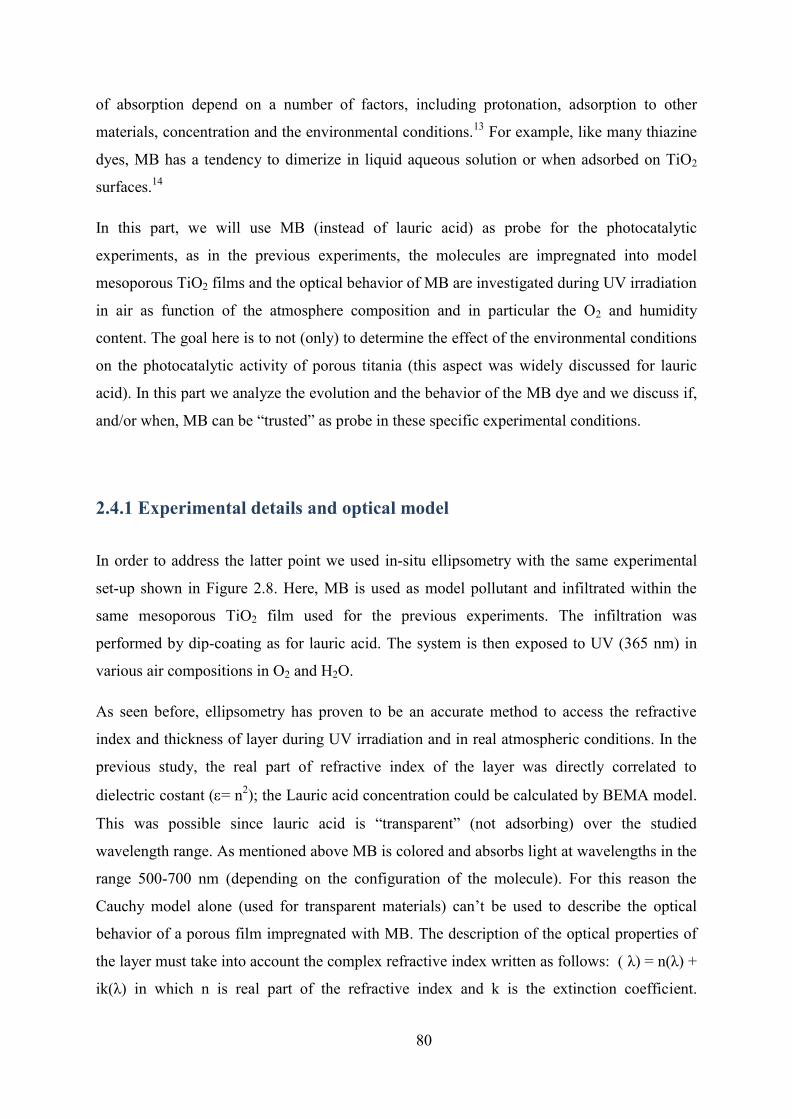
80
of absorption depend on a number of factors, including protonation, adsorption to other
materials, concentration and the environmental conditions.13 For example, like many thiazine
dyes, MB has a tendency to dimerize in liquid aqueous solution or when adsorbed on TiO2
surfaces.14
In this part, we will use MB (instead of lauric acid) as probe for the photocatalytic
experiments, as in the previous experiments, the molecules are impregnated into model
mesoporous TiO2 films and the optical behavior of MB are investigated during UV irradiation
in air as function of the atmosphere composition and in particular the O2 and humidity
content. The goal here is to not (only) to determine the effect of the environmental conditions
on the photocatalytic activity of porous titania (this aspect was widely discussed for lauric
acid). In this part we analyze the evolution and the behavior of the MB dye and we discuss if,
and/or when, MB can be “trusted” as probe in these specific experimental conditions.
2.4.1 Experimental details and optical model
In order to address the latter point we used in-situ ellipsometry with the same experimental
set-up shown in Figure 2.8. Here, MB is used as model pollutant and infiltrated within the
same mesoporous TiO2 film used for the previous experiments. The infiltration was
performed by dip-coating as for lauric acid. The system is then exposed to UV (365 nm) in
various air compositions in O2 and H2O.
As seen before, ellipsometry has proven to be an accurate method to access the refractive
index and thickness of layer during UV irradiation and in real atmospheric conditions. In the
previous study, the real part of refractive index of the layer was directly correlated to
dielectric costant (= n2); the Lauric acid concentration could be calculated by BEMA model.
This was possible since lauric acid is “transparent” (not adsorbing) over the studied
wavelength range. As mentioned above MB is colored and absorbs light at wavelengths in the
range 500-700 nm (depending on the configuration of the molecule). For this reason the
Cauchy model alone (used for transparent materials) can’t be used to describe the optical
behavior of a porous film impregnated with MB. The description of the optical properties of
the layer must take into account the complex refractive index written as follows: ( λ) = n(λ) +
ik(λ) in which n is real part of the refractive index and k is the extinction coefficient.
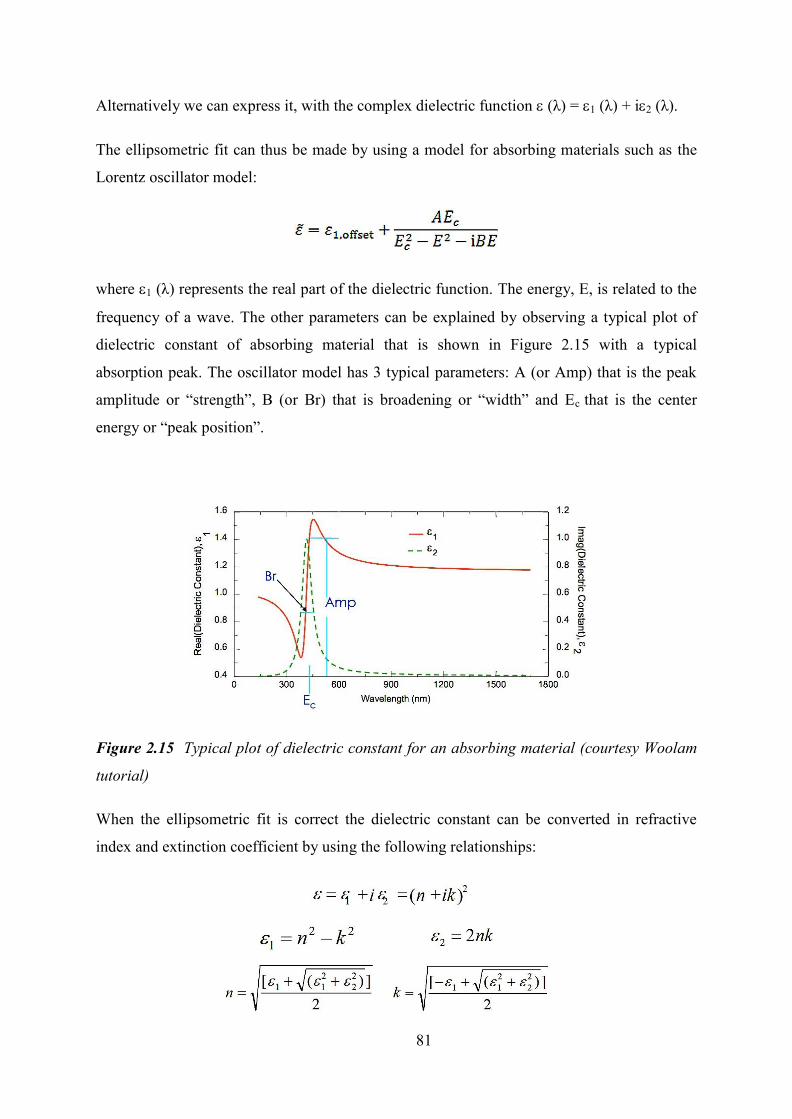
81
Alternatively we can express it, with the complex dielectric function (λ) = 1 (λ) + i2 (λ).
The ellipsometric fit can thus be made by using a model for absorbing materials such as the
Lorentz oscillator model:
where 1 (λ) represents the real part of the dielectric function. The energy, E, is related to the
frequency of a wave. The other parameters can be explained by observing a typical plot of
dielectric constant of absorbing material that is shown in Figure 2.15 with a typical
absorption peak. The oscillator model has 3 typical parameters: A (or Amp) that is the peak
amplitude or “strength”, B (or Br) that is broadening or “width” and Ec that is the center
energy or “peak position”.
Figure 2.15 Typical plot of dielectric constant for an absorbing material (courtesy Woolam
tutorial)
When the ellipsometric fit is correct the dielectric constant can be converted in refractive
index and extinction coefficient by using the following relationships:
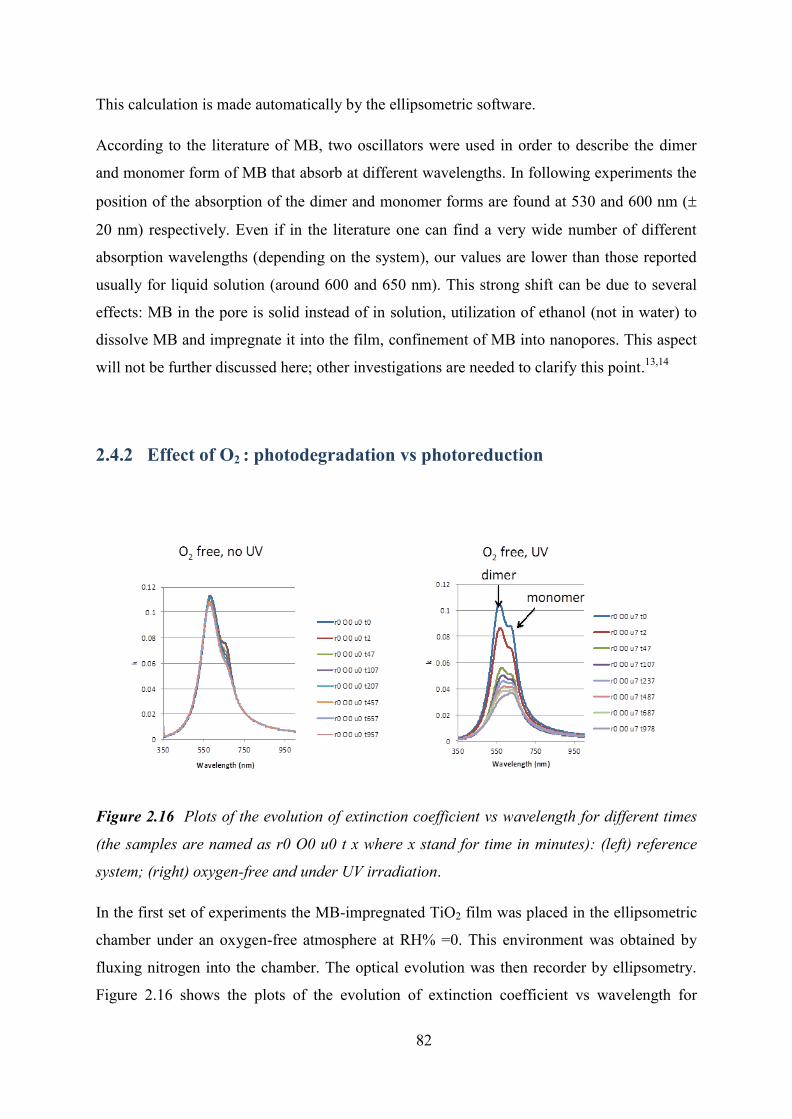
82
This calculation is made automatically by the ellipsometric software.
According to the literature of MB, two oscillators were used in order to describe the dimer
and monomer form of MB that absorb at different wavelengths. In following experiments the
position of the absorption of the dimer and monomer forms are found at 530 and 600 nm (
20 nm) respectively. Even if in the literature one can find a very wide number of different
absorption wavelengths (depending on the system), our values are lower than those reported
usually for liquid solution (around 600 and 650 nm). This strong shift can be due to several
effects: MB in the pore is solid instead of in solution, utilization of ethanol (not in water) to
dissolve MB and impregnate it into the film, confinement of MB into nanopores. This aspect
will not be further discussed here; other investigations are needed to clarify this point.13,14
2.4.2 Effect of O2 : photodegradation vs photoreduction
Figure 2.16 Plots of the evolution of extinction coefficient vs wavelength for different times
(the samples are named as r0 O0 u0 t x where x stand for time in minutes): (left) reference
system; (right) oxygen-free and under UV irradiation.
In the first set of experiments the MB-impregnated TiO2 film was placed in the ellipsometric
chamber under an oxygen-free atmosphere at RH% =0. This environment was obtained by
fluxing nitrogen into the chamber. The optical evolution was then recorder by ellipsometry.
Figure 2.16 shows the plots of the evolution of extinction coefficient vs wavelength for
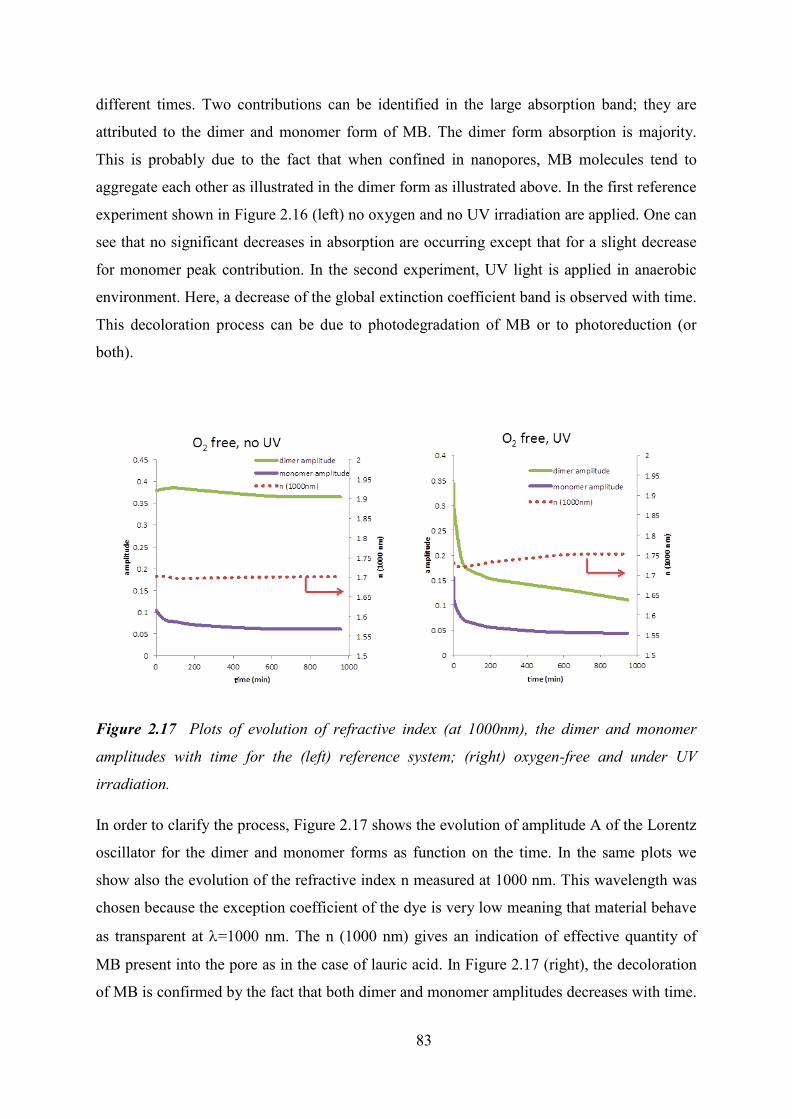
83
different times. Two contributions can be identified in the large absorption band; they are
attributed to the dimer and monomer form of MB. The dimer form absorption is majority.
This is probably due to the fact that when confined in nanopores, MB molecules tend to
aggregate each other as illustrated in the dimer form as illustrated above. In the first reference
experiment shown in Figure 2.16 (left) no oxygen and no UV irradiation are applied. One can
see that no significant decreases in absorption are occurring except that for a slight decrease
for monomer peak contribution. In the second experiment, UV light is applied in anaerobic
environment. Here, a decrease of the global extinction coefficient band is observed with time.
This decoloration process can be due to photodegradation of MB or to photoreduction (or
both).
Figure 2.17 Plots of evolution of refractive index (at 1000nm), the dimer and monomer
amplitudes with time for the (left) reference system; (right) oxygen-free and under UV
irradiation.
In order to clarify the process, Figure 2.17 shows the evolution of amplitude A of the Lorentz
oscillator for the dimer and monomer forms as function on the time. In the same plots we
show also the evolution of the refractive index n measured at 1000 nm. This wavelength was
chosen because the exception coefficient of the dye is very low meaning that material behave
as transparent at =1000 nm. The n (1000 nm) gives an indication of effective quantity of
MB present into the pore as in the case of lauric acid. In Figure 2.17 (right), the decoloration
of MB is confirmed by the fact that both dimer and monomer amplitudes decreases with time.
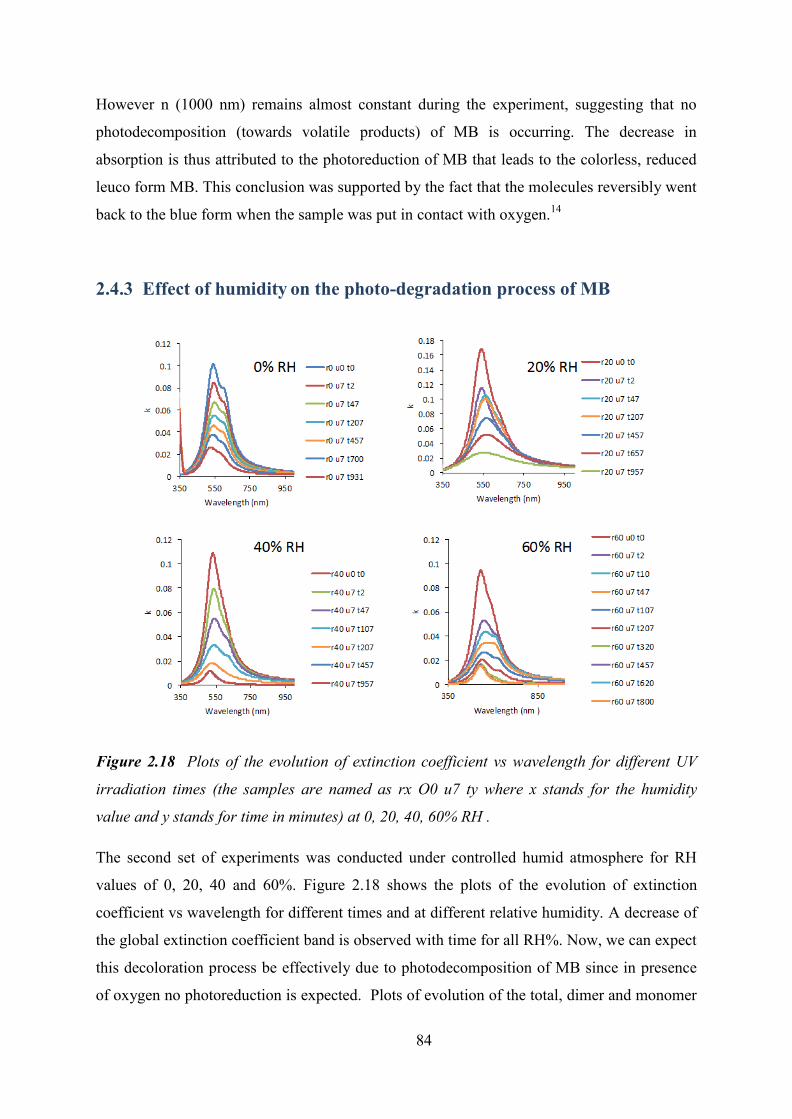
84
However n (1000 nm) remains almost constant during the experiment, suggesting that no
photodecomposition (towards volatile products) of MB is occurring. The decrease in
absorption is thus attributed to the photoreduction of MB that leads to the colorless, reduced
leuco form MB. This conclusion was supported by the fact that the molecules reversibly went
back to the blue form when the sample was put in contact with oxygen.14
2.4.3 Effect of humidity on the photo-degradation process of MB
Figure 2.18 Plots of the evolution of extinction coefficient vs wavelength for different UV
irradiation times (the samples are named as rx O0 u7 ty where x stands for the humidity
value and y stands for time in minutes) at 0, 20, 40, 60% RH .
The second set of experiments was conducted under controlled humid atmosphere for RH
values of 0, 20, 40 and 60%. Figure 2.18 shows the plots of the evolution of extinction
coefficient vs wavelength for different times and at different relative humidity. A decrease of
the global extinction coefficient band is observed with time for all RH%. Now, we can expect
this decoloration process be effectively due to photodecomposition of MB since in presence
of oxygen no photoreduction is expected. Plots of evolution of the total, dimer and monomer
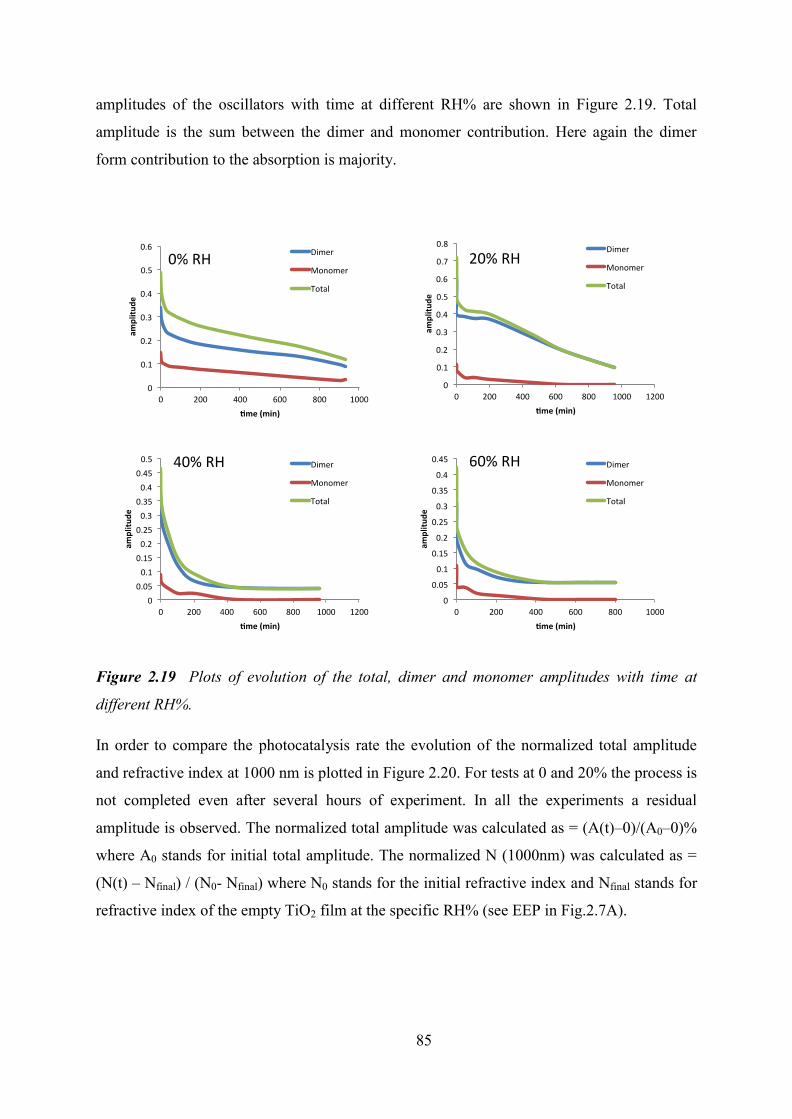
85
amplitudes of the oscillators with time at different RH% are shown in Figure 2.19. Total
amplitude is the sum between the dimer and monomer contribution. Here again the dimer
form contribution to the absorption is majority.
Figure 2.19 Plots of evolution of the total, dimer and monomer amplitudes with time at
different RH%.
In order to compare the photocatalysis rate the evolution of the normalized total amplitude
and refractive index at 1000 nm is plotted in Figure 2.20. For tests at 0 and 20% the process is
not completed even after several hours of experiment. In all the experiments a residual
amplitude is observed. The normalized total amplitude was calculated as = (A(t)–0)/(A0–0)%
where A0 stands for initial total amplitude. The normalized N (1000nm) was calculated as =
(N(t) – Nfinal) / (N0- Nfinal) where N0 stands for the initial refractive index and Nfinal stands for
refractive index of the empty TiO2 film at the specific RH% (see EEP in Fig.2.7A).
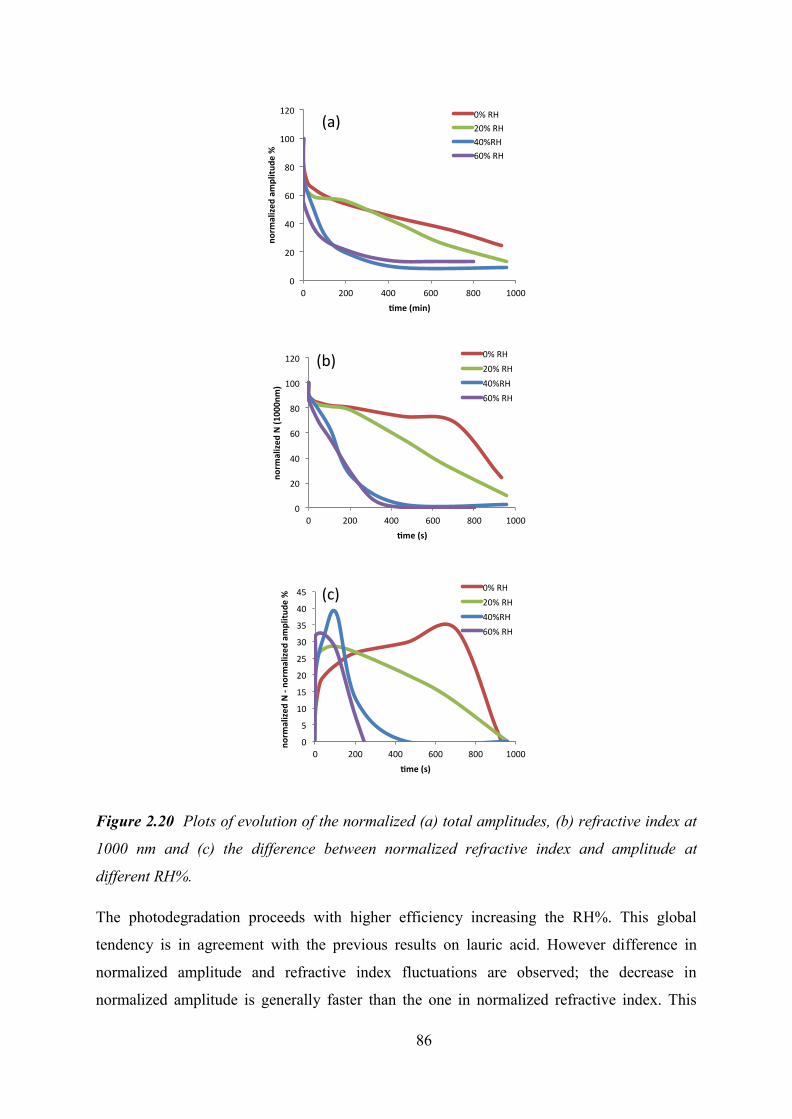
86
Figure 2.20 Plots of evolution of the normalized (a) total amplitudes, (b) refractive index at
1000 nm and (c) the difference between normalized refractive index and amplitude at
different RH%.
The photodegradation proceeds with higher efficiency increasing the RH%. This global
tendency is in agreement with the previous results on lauric acid. However difference in
normalized amplitude and refractive index fluctuations are observed; the decrease in
normalized amplitude is generally faster than the one in normalized refractive index. This
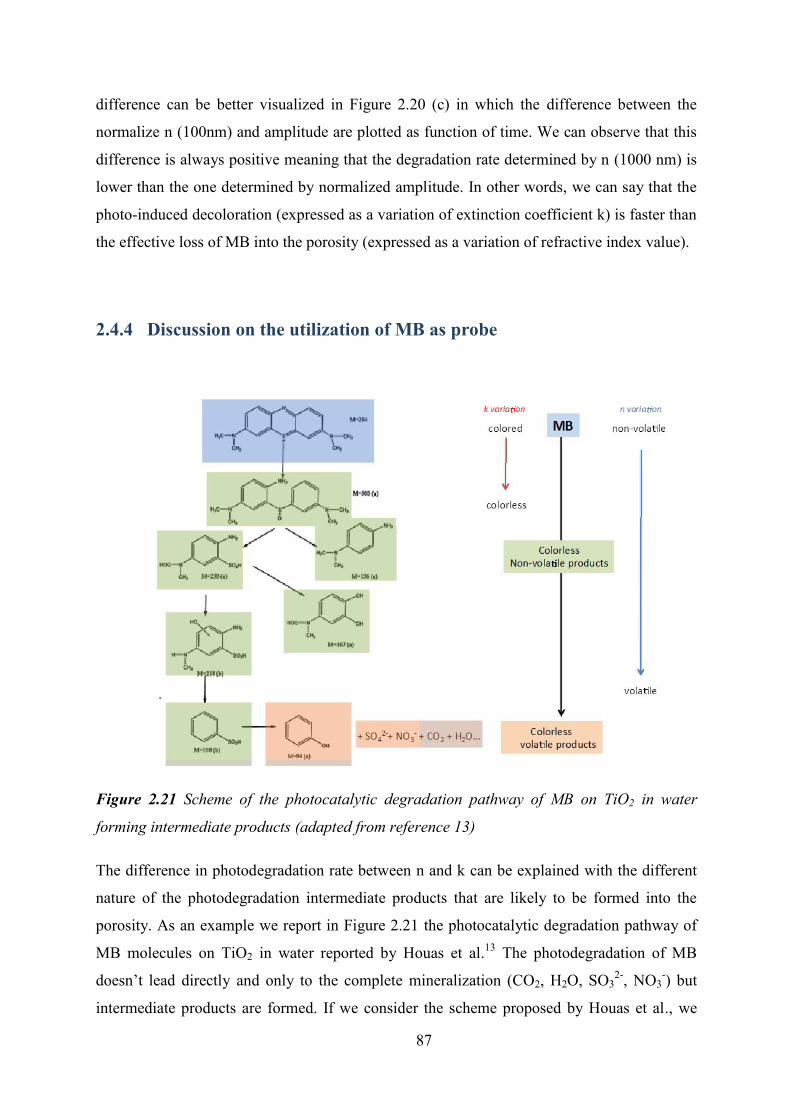
87
difference can be better visualized in Figure 2.20 (c) in which the difference between the
normalize n (100nm) and amplitude are plotted as function of time. We can observe that this
difference is always positive meaning that the degradation rate determined by n (1000 nm) is
lower than the one determined by normalized amplitude. In other words, we can say that the
photo-induced decoloration (expressed as a variation of extinction coefficient k) is faster than
the effective loss of MB into the porosity (expressed as a variation of refractive index value).
2.4.4 Discussion on the utilization of MB as probe
Figure 2.21 Scheme of the photocatalytic degradation pathway of MB on TiO2 in water
forming intermediate products (adapted from reference 13)
The difference in photodegradation rate between n and k can be explained with the different
nature of the photodegradation intermediate products that are likely to be formed into the
porosity. As an example we report in Figure 2.21 the photocatalytic degradation pathway of
MB molecules on TiO2 in water reported by Houas et al.13 The photodegradation of MB
doesn’t lead directly and only to the complete mineralization (CO2, H2O, SO32-, NO3
-) but
intermediate products are formed. If we consider the scheme proposed by Houas et al., we
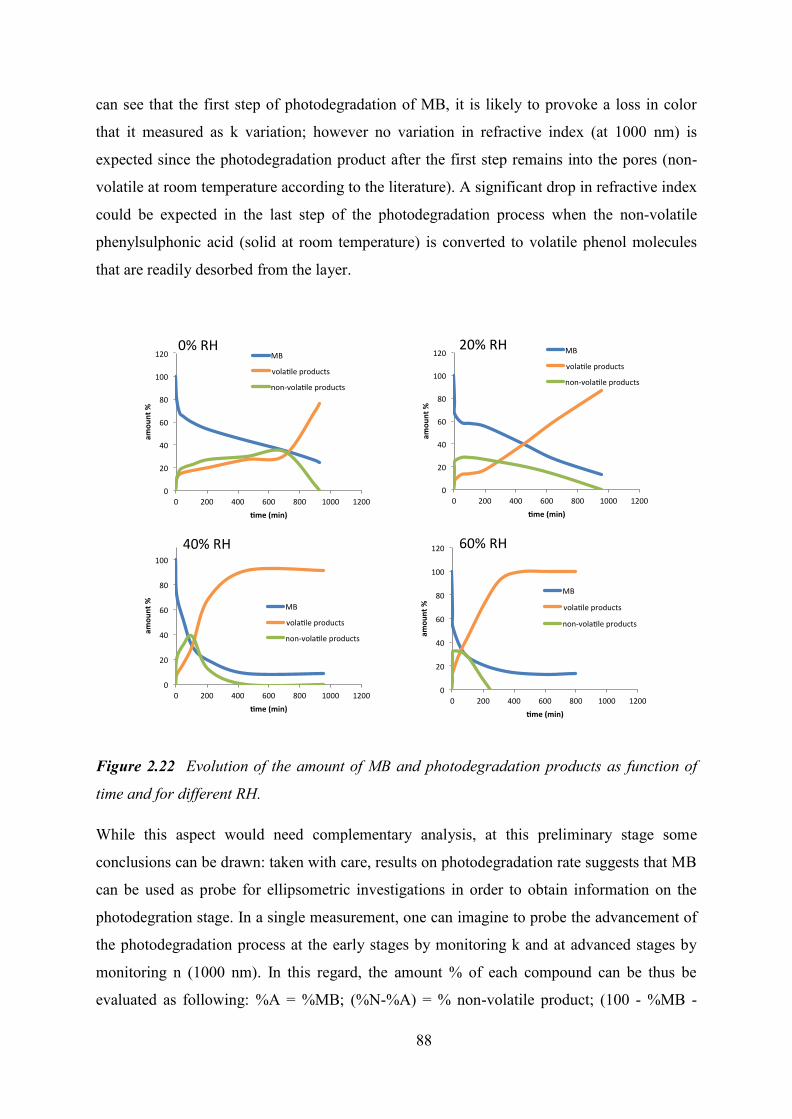
88
can see that the first step of photodegradation of MB, it is likely to provoke a loss in color
that it measured as k variation; however no variation in refractive index (at 1000 nm) is
expected since the photodegradation product after the first step remains into the pores (non-
volatile at room temperature according to the literature). A significant drop in refractive index
could be expected in the last step of the photodegradation process when the non-volatile
phenylsulphonic acid (solid at room temperature) is converted to volatile phenol molecules
that are readily desorbed from the layer.
Figure 2.22 Evolution of the amount of MB and photodegradation products as function of
time and for different RH.
While this aspect would need complementary analysis, at this preliminary stage some
conclusions can be drawn: taken with care, results on photodegradation rate suggests that MB
can be used as probe for ellipsometric investigations in order to obtain information on the
photodegration stage. In a single measurement, one can imagine to probe the advancement of
the photodegradation process at the early stages by monitoring k and at advanced stages by
monitoring n (1000 nm). In this regard, the amount % of each compound can be thus be
evaluated as following: %A = %MB; (%N-%A) = % non-volatile product; (100 - %MB -
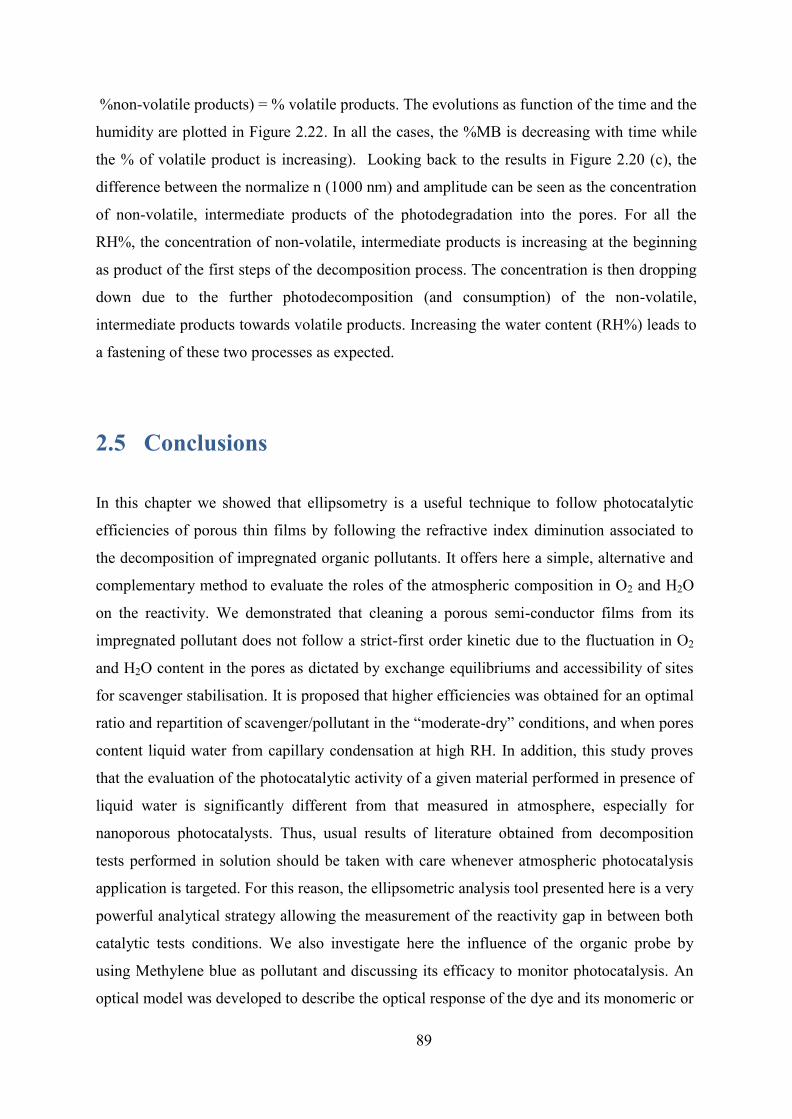
89
%non-volatile products) = % volatile products. The evolutions as function of the time and the
humidity are plotted in Figure 2.22. In all the cases, the %MB is decreasing with time while
the % of volatile product is increasing). Looking back to the results in Figure 2.20 (c), the
difference between the normalize n (1000 nm) and amplitude can be seen as the concentration
of non-volatile, intermediate products of the photodegradation into the pores. For all the
RH%, the concentration of non-volatile, intermediate products is increasing at the beginning
as product of the first steps of the decomposition process. The concentration is then dropping
down due to the further photodecomposition (and consumption) of the non-volatile,
intermediate products towards volatile products. Increasing the water content (RH%) leads to
a fastening of these two processes as expected.
2.5 Conclusions
In this chapter we showed that ellipsometry is a useful technique to follow photocatalytic
efficiencies of porous thin films by following the refractive index diminution associated to
the decomposition of impregnated organic pollutants. It offers here a simple, alternative and
complementary method to evaluate the roles of the atmospheric composition in O2 and H2O
on the reactivity. We demonstrated that cleaning a porous semi-conductor films from its
impregnated pollutant does not follow a strict-first order kinetic due to the fluctuation in O2
and H2O content in the pores as dictated by exchange equilibriums and accessibility of sites
for scavenger stabilisation. It is proposed that higher efficiencies was obtained for an optimal
ratio and repartition of scavenger/pollutant in the “moderate-dry” conditions, and when pores
content liquid water from capillary condensation at high RH. In addition, this study proves
that the evaluation of the photocatalytic activity of a given material performed in presence of
liquid water is significantly different from that measured in atmosphere, especially for
nanoporous photocatalysts. Thus, usual results of literature obtained from decomposition
tests performed in solution should be taken with care whenever atmospheric photocatalysis
application is targeted. For this reason, the ellipsometric analysis tool presented here is a very
powerful analytical strategy allowing the measurement of the reactivity gap in between both
catalytic tests conditions. We also investigate here the influence of the organic probe by
using Methylene blue as pollutant and discussing its efficacy to monitor photocatalysis. An
optical model was developed to describe the optical response of the dye and its monomeric or
90
dimeric forms. We highlight that photoreduction occurs when MB is used in O2 free
environments. Experiments in controlled humid atmosphere were conducted. By monitoring
independently the real and the imaginary part of refractive index, the results on
photodegradation rate suggested that MB can be used as probe for ellipsometric
investigations in order to obtain information on the photodegration advancement.
91
References
1. Tong H, Ouyang S, Bi Y, et al. Nano-photocatalytic materials: possibilities and challenges[J].
Advanced Materials, 2012, 24(2): 229-251.
2. Gaya U I, Abdullah A H. Heterogeneous photocatalytic degradation of organic contaminants
over titanium dioxide: a review of fundamentals, progress and problems[J]. Journal of
Photochemistry and Photobiology C: Photochemistry Reviews, 2008, 9(1): 1-12.
3. Costacurta S, Maso G D, Gallo R, et al. Influence of Temperature on the Photocatalytic
Activity of Sol-Gel TiO2 Films[J]. ACS applied materials & interfaces, 2010, 2(5): 1294-
1298.
4. Obee T N, Brown R T. TiO2 photocatalysis for indoor air applications: effects of humidity
and trace contaminant levels on the oxidation rates of formaldehyde, toluene, and 1, 3-
butadiene[J]. Environmental Science & Technology, 1995, 29(5): 1223-1231.
5. Henderson M a. A surface science perspective on TiO2 photocatalysis. Surf Sci Rep. 2011,
66(6-7):185-297.
6. Carretero-Genevrier A, Boissiere C, Nicole L, et al. Distance dependence of the
photocatalytic efficiency of TiO2 revealed by in situ ellipsometry[J]. Journal of the American
Chemical Society, 2012, 134(26): 10761-10764.
7. Remillard J T, McBride J R, Nietering K E, et al. Real time in situ spectroscopic ellipsometry
studies of the photocatalytic oxidation of stearic acid on titania films[J]. The Journal of
Physical Chemistry B, 2000, 104(18): 4440-4447.
8. Faustini M, Nicole L, Boissiere C, et al. Hydrophobic, antireflective, self-cleaning, and
antifogging sol− gel coatings: an example of multifunctional nanostructured materials for
photovoltaic cells[J]. Chemistry of Materials, 2010, 22(15): 4406-4413.
9. Roncaroli F, Martínez E D, Soler-Illia G J A A, et al. Mesoporous Thin Films of TiO2 on
Attenuated Total Reflection Crystals. An In Situ Fourier-Transform Infrared Study of the
Kinetics and Equilibrium of Adsorption and Photocatalysis of Carboxylic Acids[J]. The
Journal of Physical Chemistry C, 2013, 117(29): 15026-15034.
10. Soler-Illia G J A A, Angelomé P C, Fuertes M C, et al. Critical aspects in the production of
periodically ordered mesoporous titania thin films[J]. Nanoscale, 2012, 4(8): 2549-2566.
11. Obee T N, Brown R T. TiO2 photocatalysis for indoor air applications: effects of humidity
and trace contaminant levels on the oxidation rates of formaldehyde, toluene, and 1, 3-
butadiene[J]. Environmental Science & Technology, 1995, 29(5): 1223-1231.
92
12. Sakatani Y, Grosso D, Nicole L, et al. Optimised photocatalytic activity of grid-like
mesoporous TiO2 films: effect of crystallinity, pore size distribution, and pore accessibility[J].
Journal of Materials Chemistry, 2006, 16(1): 77-82.
13. Houas A, Lachheb H, Ksibi M, et al. Photocatalytic degradation pathway of methylene blue
in water[J]. Applied Catalysis B: Environmental, 2001, 31(2): 145-157.
14. Mills A, Wang J. Photobleaching of methylene blue sensitised by TiO2: an ambiguous
system?[J]. Journal of Photochemistry and Photobiology A: Chemistry, 1999, 127(1): 123-
134.
93
CHAPTER 3
Formation and photocatalytic activity of
mesoporous TiO2/SiO2 composite films
As discussed in Chapter 2, in-situ ellipsometry can be used to investigate the influence of the
environmental conditions (humidity, oxygen content) on the photocatalytic activity of a
model mesoporous TiO2 film. In this chapter we will focus on the composition and
morphology of the porous photocatalytic coatings. Mesoporous TiO2/SiO2 composite films
are synthetized and their porous structure and composition are characterized. The
photocatalytic performances are evaluated by in-situ ellipsometry. This composition was
chosen since this mixed system theoretically allows tuning the optical properties and reducing
the porous network collapse upon thermal treatment. From the application point of view, the
fabrication of photocatalytic coatings with well-controlled optical properties (such as
transparency on glass) is of great interest for their application in functional optical systems.
94
3.1 Introduction
As mentioned in Chapter 1, TiO2 thin films are widely used for many applications varying
from photodecomposition, self-cleaning1,2, environmental sensing3,4, super hydrophilic
layers5-7, photovoltaic energy8 and so on. The properties of the material could be tuned by
adding other elements such as doping with carbon, nitrogen, fluorine, sulfur, or novel metal
particles: Pt(IV), Ir(IV) and Au(III).9-13 In this chapter we focus on the role of SiO2 on the
structural, optical and chemical properties of TiO2 based thin films.
Photocatalytic TiO2 mesoporous films (like the ones described in Chapter 2) are extremely
attractive since they can be applied on glass (transparent windows) and act as
superhydrophilic, photoactive, self-cleaning layers for air-depollution. These coatings are
transparent in the visible range, however, in most of the previous reports, the minimal
refractive index was barely obtained below 1.6-1.7. This relative high value is due to the fact
that pure crystalline TiO2 presents a very high refractive index, n ≈ 2.4 in the visible range. In
this configuration, a mesoporous titania film (n > 1.6) applied on a glass substrate (n ≈ 1.45)
will also act as a reflective coating, lowering the amount of transmitted light through the glass
substrate. In this context, being able to tune the refractive index toward lower values of such
photocatalytic layers would be beneficial for their application as functional glasses. One way
to lower the refractive index is to increase the total porous volume. On the other hand, highly
porous TiO2 layers are difficult to obtain because of the collapse of the inorganic network due
to diffusive sintering during thermal treatment. From the optical point of view, adding SiO2 to
the matrix slightly reduces the refractive index of the inorganic phase, due to its low
refractive index compare to that of TiO2. In addition it has been observed in a previous paper
of our group for dense films that in presence of a small amount of silica, the growth of TiO2
anatase nanoparticles by diffusive sintering is totally hindered even at 800°C.14 This effect is
expected to have a strong influence on final structure of the mesoporous films and on the
crystal size, stabilizing the porous network during the thermal treatment. Concerning the
photocatalytic properties, the addition of “inert” silica to an active TiO2 matrix should
decrease the photocatalytic efficiency compare to pure titania. However it has been
demonstrated that silica could also have beneficial effect to the photocatalytic process due to
an increase of the adsorption of the pollutants.15
The chemistry and the formation of mixed TiO2/SiO2 systems have been extensively studied
95
in the last decades.16-18 More recently, it has been reported that photocatalytic reactivity of
TiO2/SiO2 nanocomposite powders is highly dependent on the Ti/Si ratios. The mechanical
stability was reported to be improved by the addition of SiO2.19-27 It is well known that the
photocatalytic activity of titania is strongly dependent on the synthesized crystal size.28 In
particular, it was reported that the crystal size of titania decreases with the increase of silica
ratio in the case of dense composite TiO2/SiO2 films.29,14 Despite a very rich literature on
these mixed systems, the structural, optical and photocatalytic properties of TiO2/SiO2
composite mesoporous films were barely investigated so far.
In the following section we will report an investigation of the photocatalytic activity of
mesoporous TiO2/SiO2 composites films with variable Ti/Si ratios (0%-100%) based on an
ethanolic EISA synthesis process by using TiCl4 and tetraethyl orthosilicate (TEOS) as
precursors and triblock copolymer F127 as template. All the films were thermal treated at
600°C. The evolution of porous, crystalline structure, optical properties and the
photocatalytic activity of the TiO2/SiO2 composite films of different SiO2 ratios were studied.
3.2 Preparation of mesoporous composite TiO2/SiO2 films
The composite films were prepared by EISA method. Exactly the same procedure as the one
use to prepare the mesoporous pure titania thin film d in Chapter 2 was applied. Titanium
tetrachloride (TiCl4) and Tetraethyl orthosilicate (Si(OC2H5)4) were used as precursors of
TiO2 and SiO2 respectively and Pluronic triblock copolymer F127 was used as a structuring
agent. A total of 11 compositions were used in this investigation: 100% TiO2/0% SiO2, 98%
TiO2/2% SiO2, 90% TiO2/10% SiO2, 80% TiO2/20% SiO2, 70% TiO2/30% SiO2, 60%
TiO2/40% SiO2, 50% TiO2/50% SiO2, 40% TiO2/60% SiO2, 30% TiO2/70% SiO2, 20%
TiO2/80% SiO2, 0% TiO2/100% SiO2. The initial solution compositions (in grams) are listed
in Table 1. The pure mesoporous titania thin film (100% TiO2/0% SiO2) was exactly the same
as the one described in Chapter 2. The solution was composed of TiCl4: F127: H2O: EtOH
with respective molar ratio of 1: 0.006: 10: 30, corresponding to 4.08g Ti5E, 0.8g F127,
1.75g H2O, 13.36g EtOH. For comparison purpose, the pure amorphous silica mesoporous
film (0% TiO2/100% SiO2) was synthesised following the same procedure as the pure titania
film, taking TEOS instead of Ti5E as precursor, and adding 0.005 molar ratio hydrochloride
(2M) for the initial solution preparation. The solutions were prepared under vigorous stirring
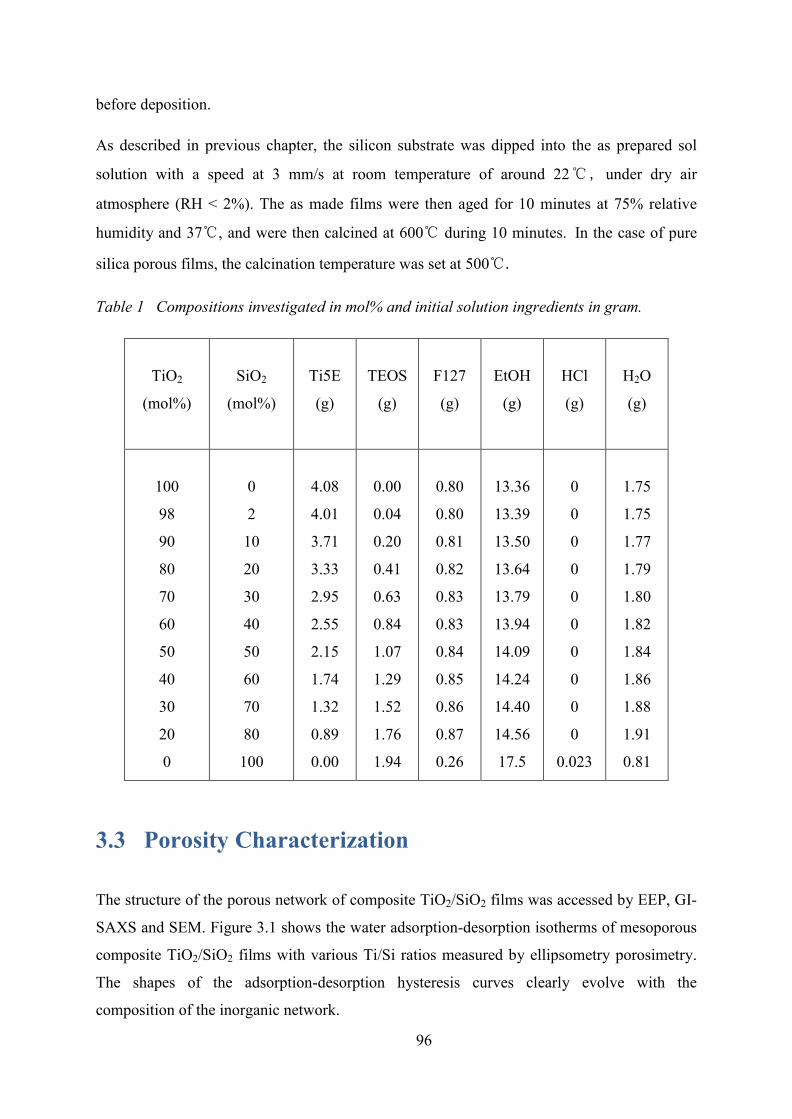
96
before deposition.
As described in previous chapter, the silicon substrate was dipped into the as prepared sol
solution with a speed at 3 mm/s at room temperature of around 22℃, under dry air
atmosphere (RH < 2%). The as made films were then aged for 10 minutes at 75% relative
humidity and 37℃, and were then calcined at 600℃ during 10 minutes. In the case of pure
silica porous films, the calcination temperature was set at 500℃.
Table 1 Compositions investigated in mol% and initial solution ingredients in gram.
TiO2
(mol%)
SiO2
(mol%)
Ti5E
(g)
TEOS
(g)
F127
(g)
EtOH
(g)
HCl
(g)
H2O
(g)
100
98
90
80
70
60
50
40
30
20
0
0
2
10
20
30
40
50
60
70
80
100
4.08
4.01
3.71
3.33
2.95
2.55
2.15
1.74
1.32
0.89
0.00
0.00
0.04
0.20
0.41
0.63
0.84
1.07
1.29
1.52
1.76
1.94
0.80
0.80
0.81
0.82
0.83
0.83
0.84
0.85
0.86
0.87
0.26
13.36
13.39
13.50
13.64
13.79
13.94
14.09
14.24
14.40
14.56
17.5
0
0
0
0
0
0
0
0
0
0
0.023
1.75
1.75
1.77
1.79
1.80
1.82
1.84
1.86
1.88
1.91
0.81
3.3 Porosity Characterization
The structure of the porous network of composite TiO2/SiO2 films was accessed by EEP, GI-
SAXS and SEM. Figure 3.1 shows the water adsorption-desorption isotherms of mesoporous
composite TiO2/SiO2 films with various Ti/Si ratios measured by ellipsometry porosimetry.
The shapes of the adsorption-desorption hysteresis curves clearly evolve with the
composition of the inorganic network.
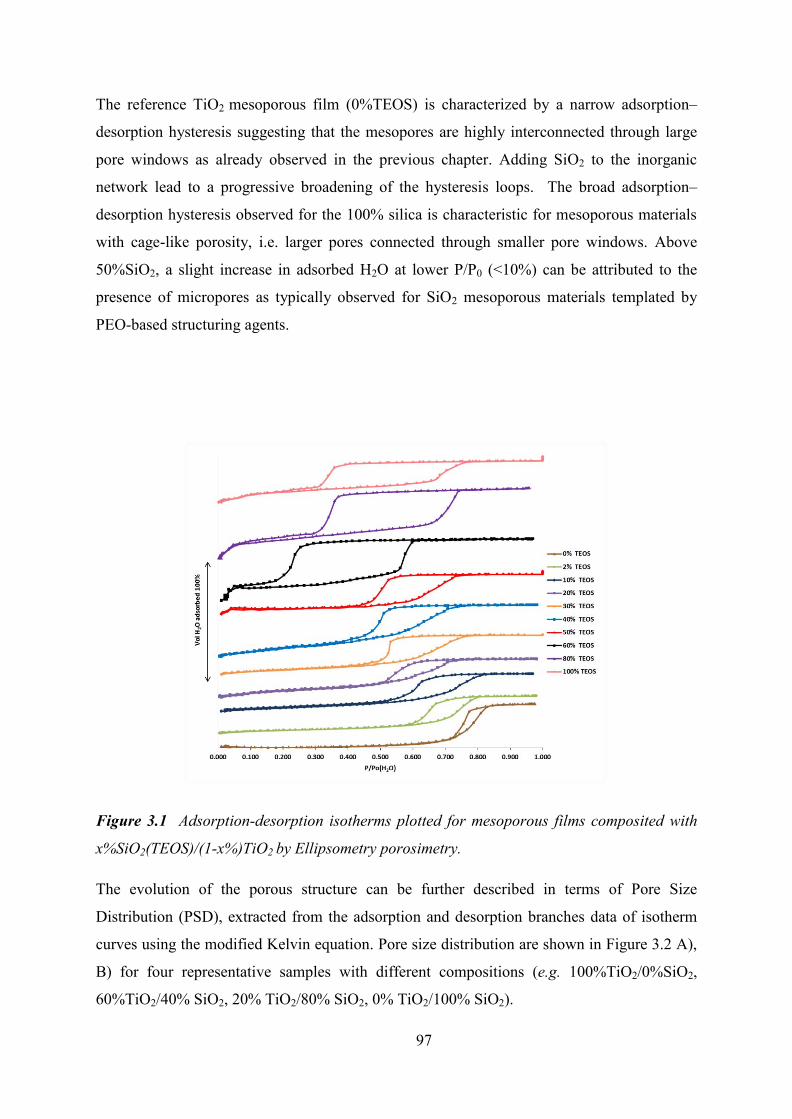
97
The reference TiO2 mesoporous film (0%TEOS) is characterized by a narrow adsorption–
desorption hysteresis suggesting that the mesopores are highly interconnected through large
pore windows as already observed in the previous chapter. Adding SiO2 to the inorganic
network lead to a progressive broadening of the hysteresis loops. The broad adsorption–
desorption hysteresis observed for the 100% silica is characteristic for mesoporous materials
with cage-like porosity, i.e. larger pores connected through smaller pore windows. Above
50%SiO2, a slight increase in adsorbed H2O at lower P/P0 (<10%) can be attributed to the
presence of micropores as typically observed for SiO2 mesoporous materials templated by
PEO-based structuring agents.
Figure 3.1 Adsorption-desorption isotherms plotted for mesoporous films composited with
x%SiO2(TEOS)/(1-x%)TiO2 by Ellipsometry porosimetry.
The evolution of the porous structure can be further described in terms of Pore Size
Distribution (PSD), extracted from the adsorption and desorption branches data of isotherm
curves using the modified Kelvin equation. Pore size distribution are shown in Figure 3.2 A),
B) for four representative samples with different compositions (e.g. 100%TiO2/0%SiO2,
60%TiO2/40% SiO2, 20% TiO2/80% SiO2, 0% TiO2/100% SiO2).
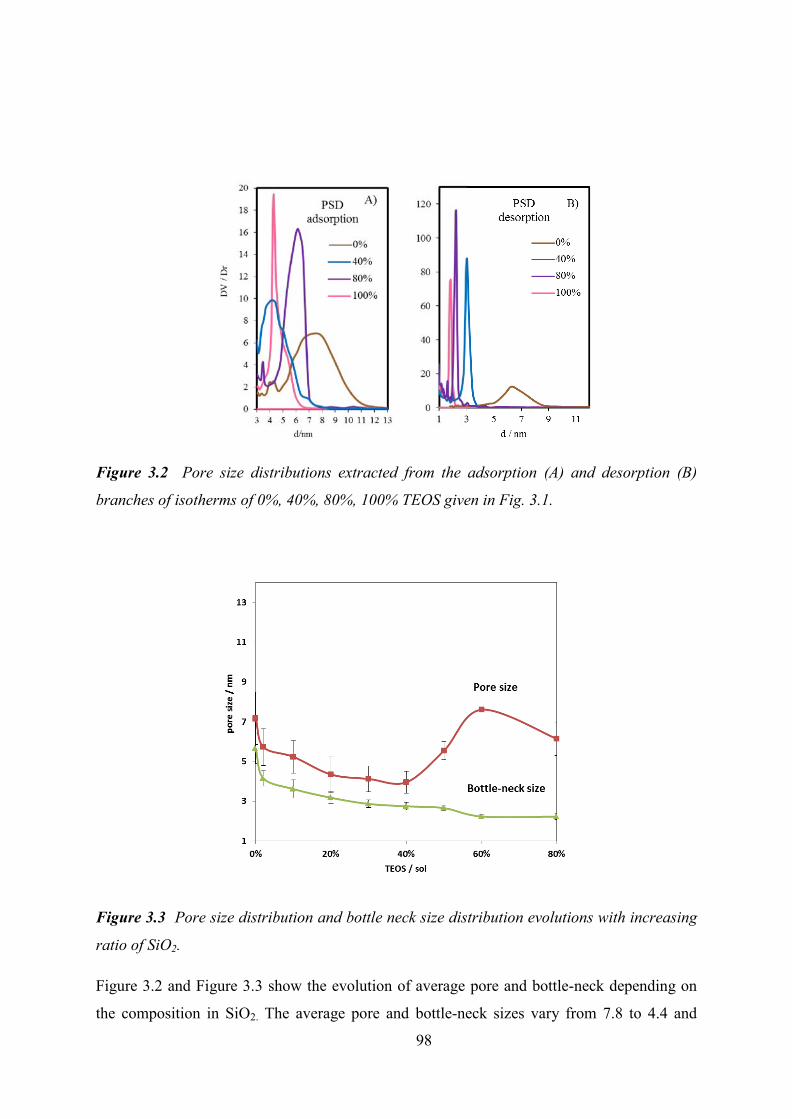
98
Figure 3.2 Pore size distributions extracted from the adsorption (A) and desorption (B)
branches of isotherms of 0%, 40%, 80%, 100% TEOS given in Fig. 3.1.
Figure 3.3 Pore size distribution and bottle neck size distribution evolutions with increasing
ratio of SiO2.
Figure 3.2 and Figure 3.3 show the evolution of average pore and bottle-neck depending on
the composition in SiO2. The average pore and bottle-neck sizes vary from 7.8 to 4.4 and
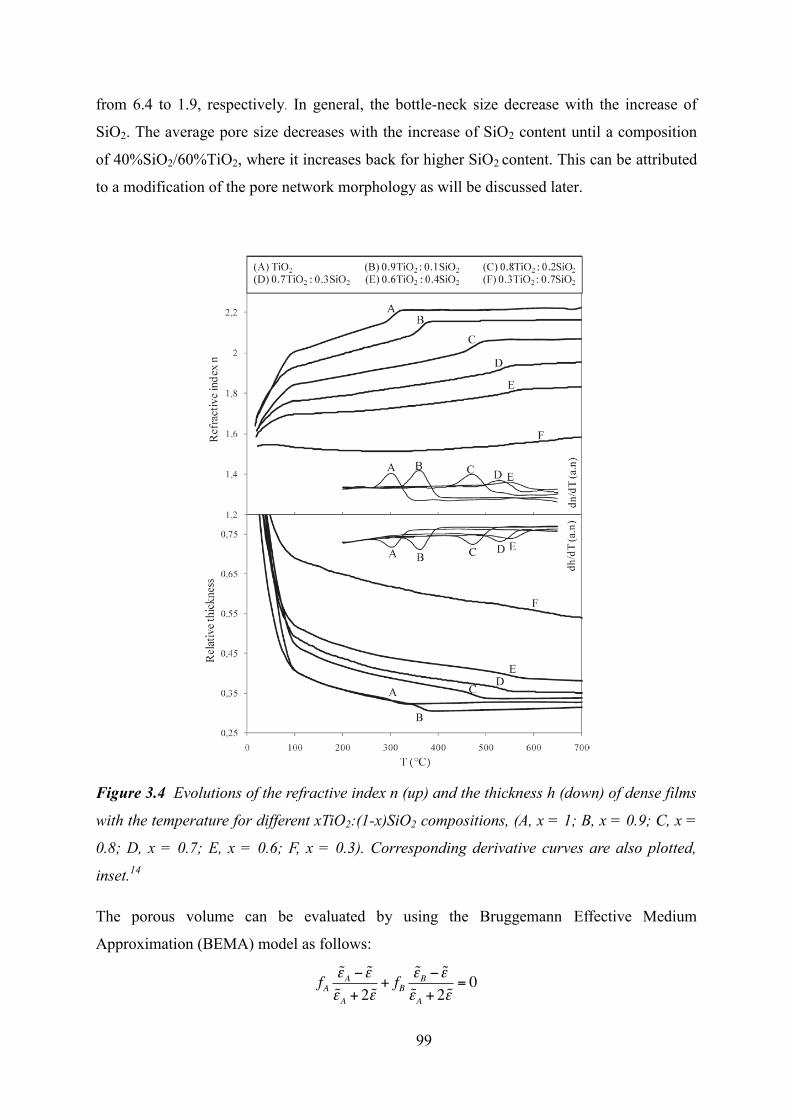
99
from 6.4 to 1.9, respectively. In general, the bottle-neck size decrease with the increase of
SiO2. The average pore size decreases with the increase of SiO2 content until a composition
of 40%SiO2/60%TiO2, where it increases back for higher SiO2 content. This can be attributed
to a modification of the pore network morphology as will be discussed later.
Figure 3.4 Evolutions of the refractive index n (up) and the thickness h (down) of dense films
with the temperature for different xTiO2:(1-x)SiO2 compositions, (A, x = 1; B, x = 0.9; C, x =
0.8; D, x = 0.7; E, x = 0.6; F, x = 0.3). Corresponding derivative curves are also plotted,
inset.14
The porous volume can be evaluated by using the Bruggemann Effective Medium
Approximation (BEMA) model as follows:
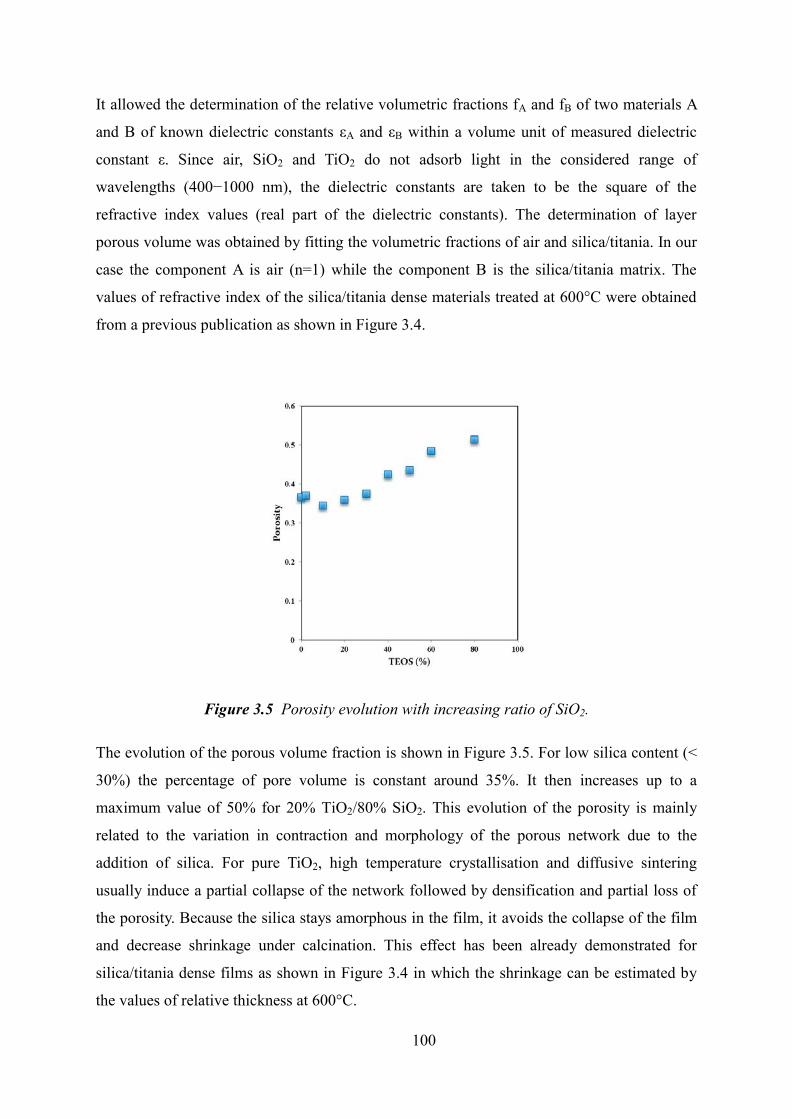
100
It allowed the determination of the relative volumetric fractions fA and fB of two materials A
and B of known dielectric constants εA and εB within a volume unit of measured dielectric
constant ε. Since air, SiO2 and TiO2 do not adsorb light in the considered range of
wavelengths (400−1000 nm), the dielectric constants are taken to be the square of the
refractive index values (real part of the dielectric constants). The determination of layer
porous volume was obtained by fitting the volumetric fractions of air and silica/titania. In our
case the component A is air (n=1) while the component B is the silica/titania matrix. The
values of refractive index of the silica/titania dense materials treated at 600°C were obtained
from a previous publication as shown in Figure 3.4.
Figure 3.5 Porosity evolution with increasing ratio of SiO2.
The evolution of the porous volume fraction is shown in Figure 3.5. For low silica content (<
30%) the percentage of pore volume is constant around 35%. It then increases up to a
maximum value of 50% for 20% TiO2/80% SiO2. This evolution of the porosity is mainly
related to the variation in contraction and morphology of the porous network due to the
addition of silica. For pure TiO2, high temperature crystallisation and diffusive sintering
usually induce a partial collapse of the network followed by densification and partial loss of
the porosity. Because the silica stays amorphous in the film, it avoids the collapse of the film
and decrease shrinkage under calcination. This effect has been already demonstrated for
silica/titania dense films as shown in Figure 3.4 in which the shrinkage can be estimated by
the values of relative thickness at 600°C.
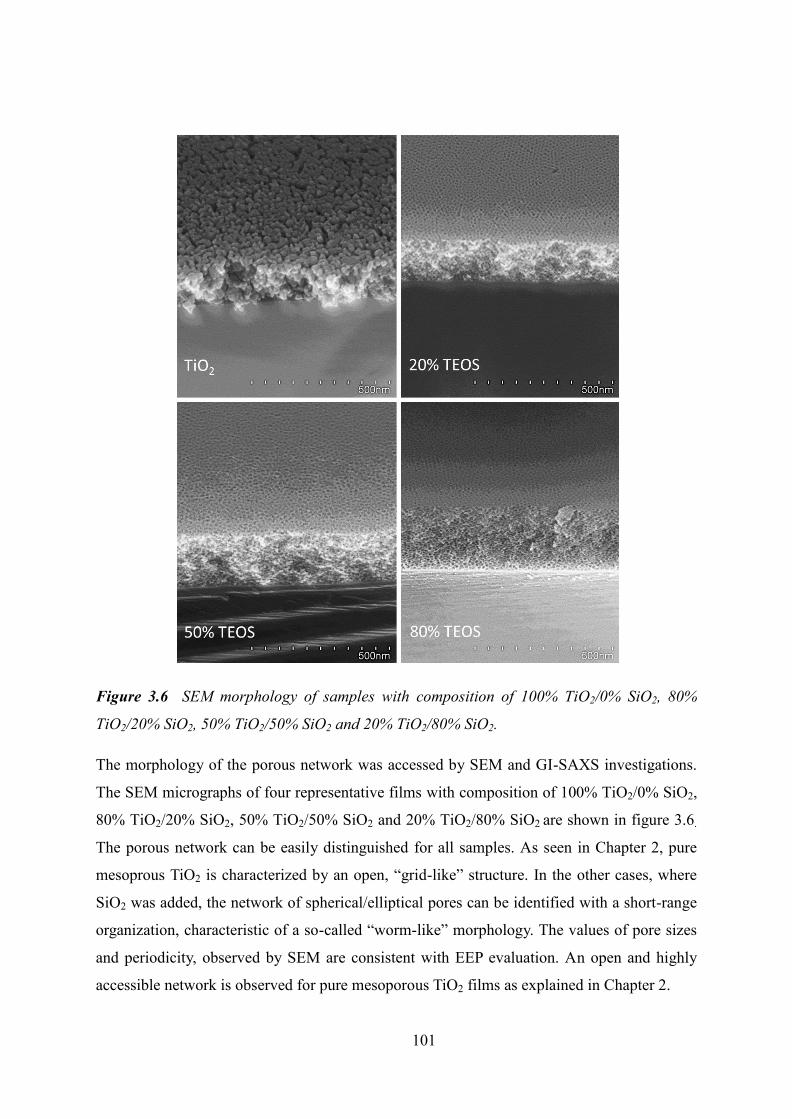
101
Figure 3.6 SEM morphology of samples with composition of 100% TiO2/0% SiO2, 80%
TiO2/20% SiO2, 50% TiO2/50% SiO2 and 20% TiO2/80% SiO2.
The morphology of the porous network was accessed by SEM and GI-SAXS investigations.
The SEM micrographs of four representative films with composition of 100% TiO2/0% SiO2,
80% TiO2/20% SiO2, 50% TiO2/50% SiO2 and 20% TiO2/80% SiO2 are shown in figure 3.6.
The porous network can be easily distinguished for all samples. As seen in Chapter 2, pure
mesoprous TiO2 is characterized by an open, “grid-like” structure. In the other cases, where
SiO2 was added, the network of spherical/elliptical pores can be identified with a short-range
organization, characteristic of a so-called “worm-like” morphology. The values of pore sizes
and periodicity, observed by SEM are consistent with EEP evaluation. An open and highly
accessible network is observed for pure mesoporous TiO2 films as explained in Chapter 2.
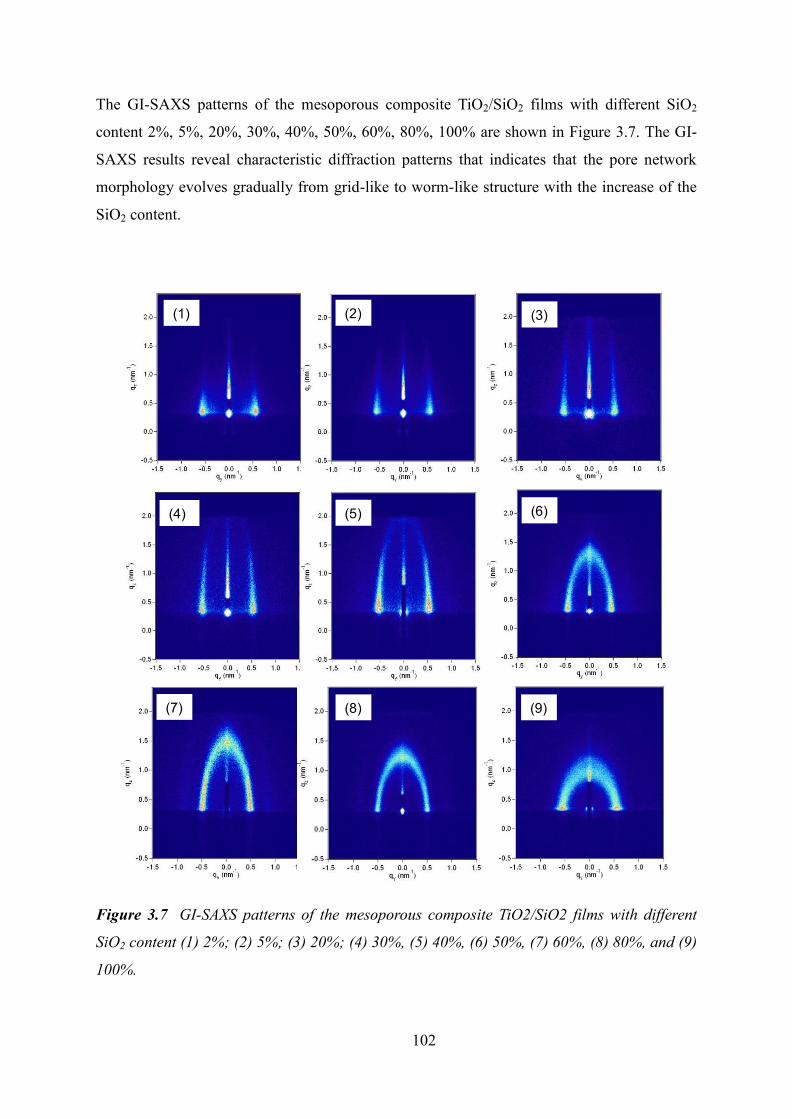
102
The GI-SAXS patterns of the mesoporous composite TiO2/SiO2 films with different SiO2
content 2%, 5%, 20%, 30%, 40%, 50%, 60%, 80%, 100% are shown in Figure 3.7. The GI-
SAXS results reveal characteristic diffraction patterns that indicates that the pore network
morphology evolves gradually from grid-like to worm-like structure with the increase of the
SiO2 content.
Figure 3.7 GI-SAXS patterns of the mesoporous composite TiO2/SiO2 films with different
SiO2 content (1) 2%; (2) 5%; (3) 20%; (4) 30%, (5) 40%, (6) 50%, (7) 60%, (8) 80%, and (9)
100%.
(1) (2) (3)
(4) (5) (6)
(7) (8) (9)
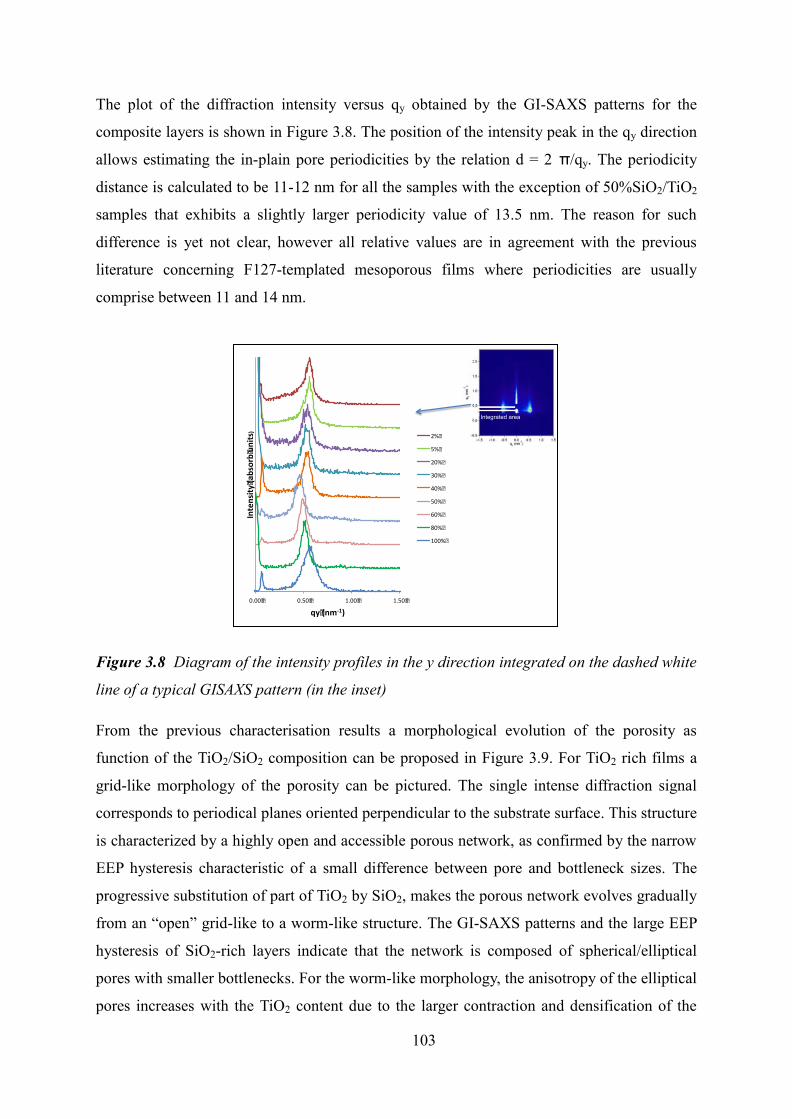
103
The plot of the diffraction intensity versus qy obtained by the GI-SAXS patterns for the
composite layers is shown in Figure 3.8. The position of the intensity peak in the qy direction
allows estimating the in-plain pore periodicities by the relation d = 2 π/qy. The periodicity
distance is calculated to be 11-12 nm for all the samples with the exception of 50%SiO2/TiO2
samples that exhibits a slightly larger periodicity value of 13.5 nm. The reason for such
difference is yet not clear, however all relative values are in agreement with the previous
literature concerning F127-templated mesoporous films where periodicities are usually
comprise between 11 and 14 nm.
Figure 3.8 Diagram of the intensity profiles in the y direction integrated on the dashed white
line of a typical GISAXS pattern (in the inset)
From the previous characterisation results a morphological evolution of the porosity as
function of the TiO2/SiO2 composition can be proposed in Figure 3.9. For TiO2 rich films a
grid-like morphology of the porosity can be pictured. The single intense diffraction signal
corresponds to periodical planes oriented perpendicular to the substrate surface. This structure
is characterized by a highly open and accessible porous network, as confirmed by the narrow
EEP hysteresis characteristic of a small difference between pore and bottleneck sizes. The
progressive substitution of part of TiO2 by SiO2, makes the porous network evolves gradually
from an “open” grid-like to a worm-like structure. The GI-SAXS patterns and the large EEP
hysteresis of SiO2-rich layers indicate that the network is composed of spherical/elliptical
pores with smaller bottlenecks. For the worm-like morphology, the anisotropy of the elliptical
pores increases with the TiO2 content due to the larger contraction and densification of the
0.00�� 0.50�� 1.00�� 1.50��
Intensity
�(absorb�un
its)
qy�(nm-1)
2%�
5%�
20%�
30%�
40%�
50%�
60%�
80%�
100%�
Integrated area
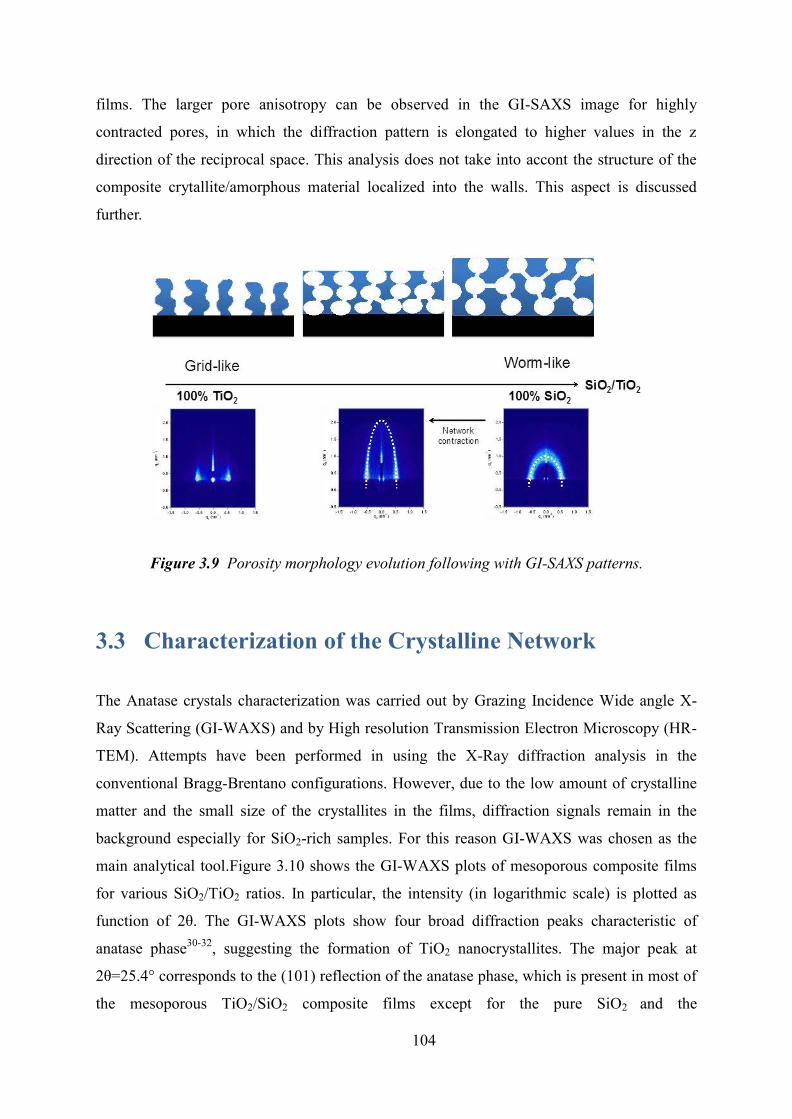
104
films. The larger pore anisotropy can be observed in the GI-SAXS image for highly
contracted pores, in which the diffraction pattern is elongated to higher values in the z
direction of the reciprocal space. This analysis does not take into accont the structure of the
composite crytallite/amorphous material localized into the walls. This aspect is discussed
further.
Figure 3.9 Porosity morphology evolution following with GI-SAXS patterns.
3.3 Characterization of the Crystalline Network
The Anatase crystals characterization was carried out by Grazing Incidence Wide angle X-
Ray Scattering (GI-WAXS) and by High resolution Transmission Electron Microscopy (HR-
TEM). Attempts have been performed in using the X-Ray diffraction analysis in the
conventional Bragg-Brentano configurations. However, due to the low amount of crystalline
matter and the small size of the crystallites in the films, diffraction signals remain in the
background especially for SiO2-rich samples. For this reason GI-WAXS was chosen as the
main analytical tool.Figure 3.10 shows the GI-WAXS plots of mesoporous composite films
for various SiO2/TiO2 ratios. In particular, the intensity (in logarithmic scale) is plotted as
function of 2θ. The GI-WAXS plots show four broad diffraction peaks characteristic of
anatase phase30-32, suggesting the formation of TiO2 nanocrystallites. The major peak at
2θ=25.4° corresponds to the (101) reflection of the anatase phase, which is present in most of
the mesoporous TiO2/SiO2 composite films except for the pure SiO2 and the
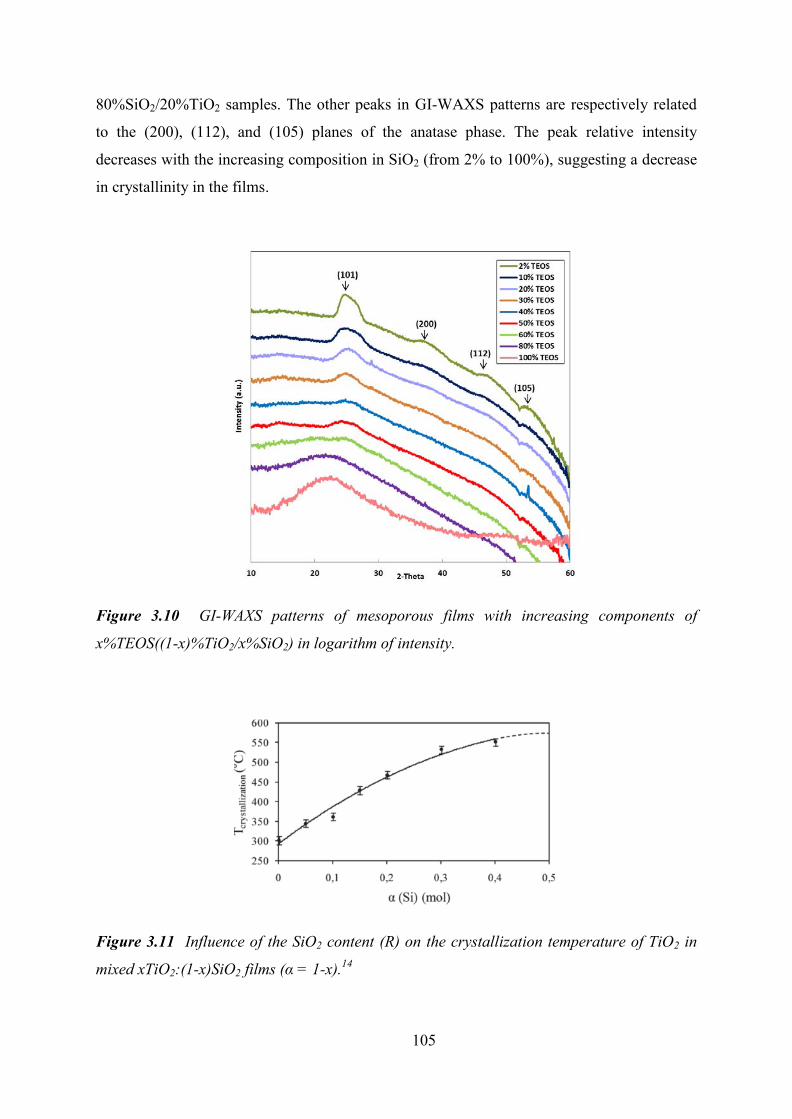
105
80%SiO2/20%TiO2 samples. The other peaks in GI-WAXS patterns are respectively related
to the (200), (112), and (105) planes of the anatase phase. The peak relative intensity
decreases with the increasing composition in SiO2 (from 2% to 100%), suggesting a decrease
in crystallinity in the films.
Figure 3.10 GI-WAXS patterns of mesoporous films with increasing components of
x%TEOS((1-x)%TiO2/x%SiO2) in logarithm of intensity.
Figure 3.11 Influence of the SiO2 content (R) on the crystallization temperature of TiO2 in
mixed xTiO2:(1-x)SiO2 films (α = 1-x).14
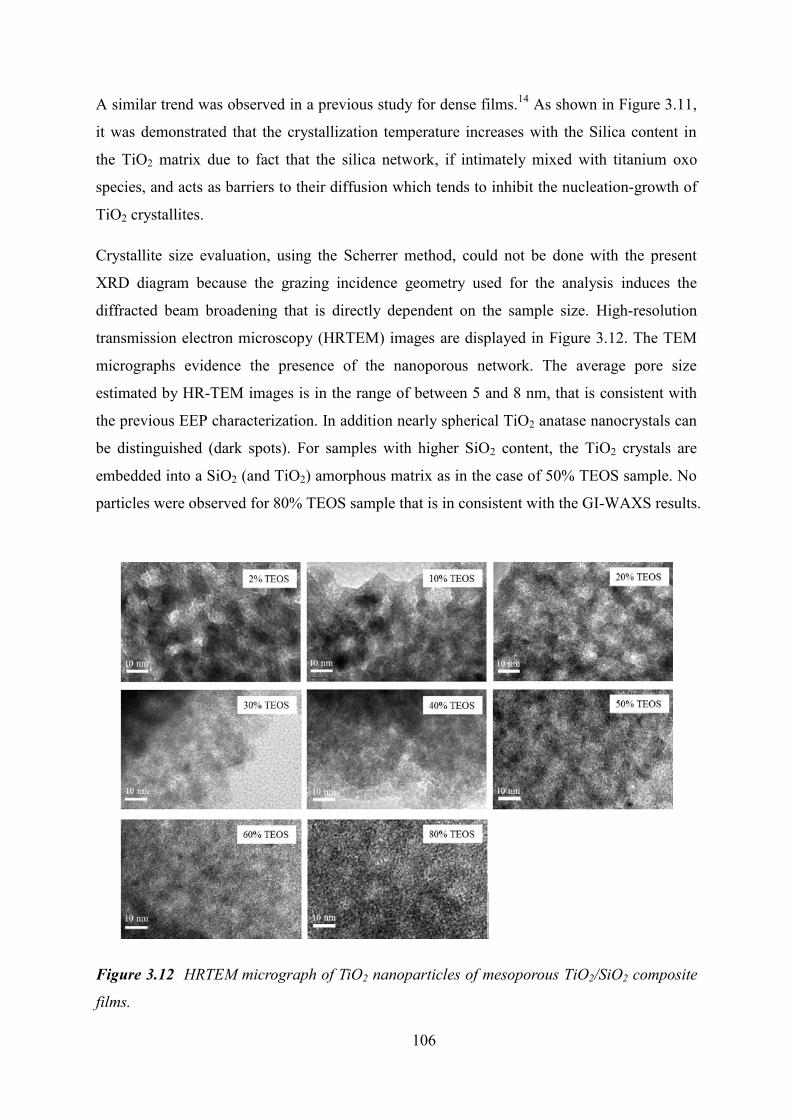
106
A similar trend was observed in a previous study for dense films.14 As shown in Figure 3.11,
it was demonstrated that the crystallization temperature increases with the Silica content in
the TiO2 matrix due to fact that the silica network, if intimately mixed with titanium oxo
species, and acts as barriers to their diffusion which tends to inhibit the nucleation-growth of
TiO2 crystallites.
Crystallite size evaluation, using the Scherrer method, could not be done with the present
XRD diagram because the grazing incidence geometry used for the analysis induces the
diffracted beam broadening that is directly dependent on the sample size. High-resolution
transmission electron microscopy (HRTEM) images are displayed in Figure 3.12. The TEM
micrographs evidence the presence of the nanoporous network. The average pore size
estimated by HR-TEM images is in the range of between 5 and 8 nm, that is consistent with
the previous EEP characterization. In addition nearly spherical TiO2 anatase nanocrystals can
be distinguished (dark spots). For samples with higher SiO2 content, the TiO2 crystals are
embedded into a SiO2 (and TiO2) amorphous matrix as in the case of 50% TEOS sample. No
particles were observed for 80% TEOS sample that is in consistent with the GI-WAXS results.
Figure 3.12 HRTEM micrograph of TiO2 nanoparticles of mesoporous TiO2/SiO2 composite
films.
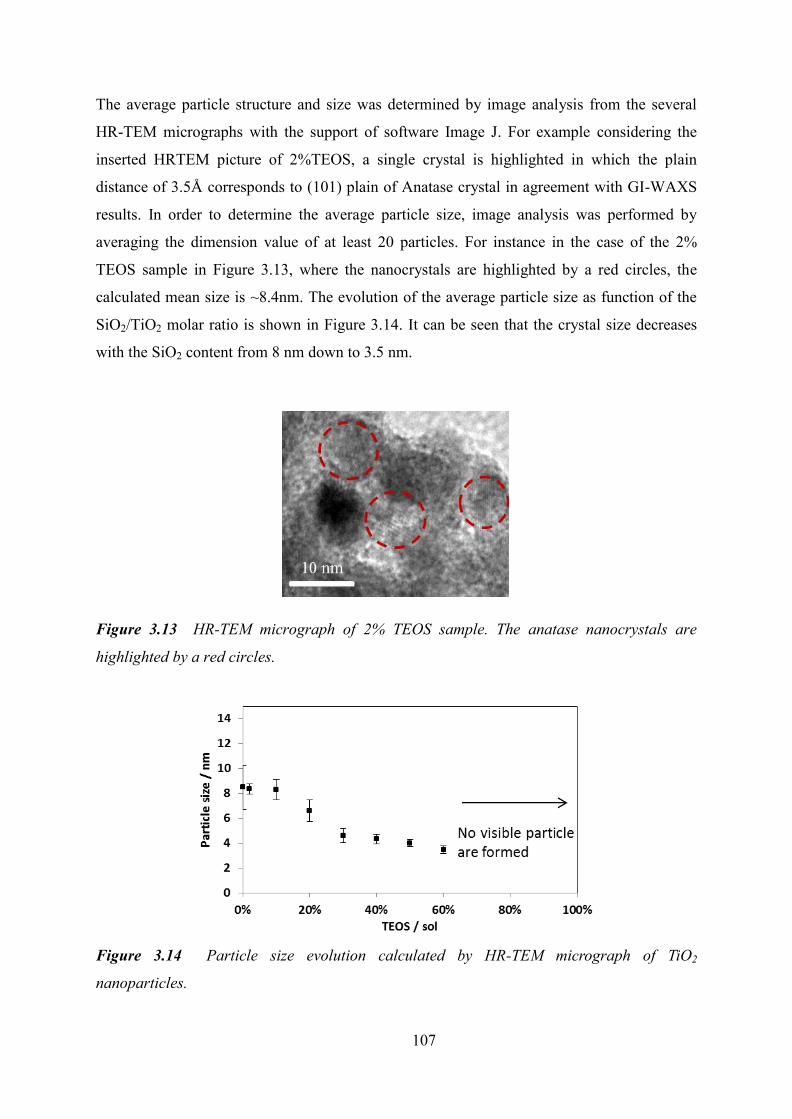
107
The average particle structure and size was determined by image analysis from the several
HR-TEM micrographs with the support of software Image J. For example considering the
inserted HRTEM picture of 2%TEOS, a single crystal is highlighted in which the plain
distance of 3.5Å corresponds to (101) plain of Anatase crystal in agreement with GI-WAXS
results. In order to determine the average particle size, image analysis was performed by
averaging the dimension value of at least 20 particles. For instance in the case of the 2%
TEOS sample in Figure 3.13, where the nanocrystals are highlighted by a red circles, the
calculated mean size is ~8.4nm. The evolution of the average particle size as function of the
SiO2/TiO2 molar ratio is shown in Figure 3.14. It can be seen that the crystal size decreases
with the SiO2 content from 8 nm down to 3.5 nm.
Figure 3.13 HR-TEM micrograph of 2% TEOS sample. The anatase nanocrystals are
highlighted by a red circles.
Figure 3.14 Particle size evolution calculated by HR-TEM micrograph of TiO2
nanoparticles.
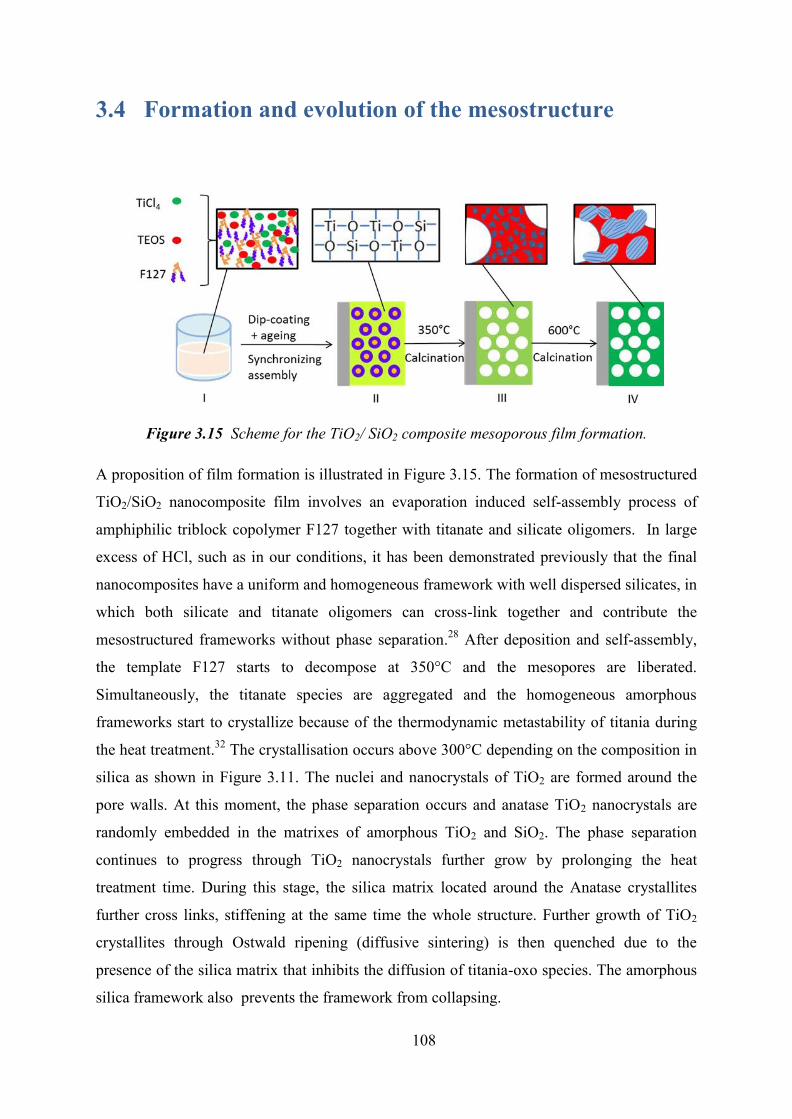
108
3.4 Formation and evolution of the mesostructure
Figure 3.15 Scheme for the TiO2/ SiO2 composite mesoporous film formation.
A proposition of film formation is illustrated in Figure 3.15. The formation of mesostructured
TiO2/SiO2 nanocomposite film involves an evaporation induced self-assembly process of
amphiphilic triblock copolymer F127 together with titanate and silicate oligomers. In large
excess of HCl, such as in our conditions, it has been demonstrated previously that the final
nanocomposites have a uniform and homogeneous framework with well dispersed silicates, in
which both silicate and titanate oligomers can cross-link together and contribute the
mesostructured frameworks without phase separation.28 After deposition and self-assembly,
the template F127 starts to decompose at 350°C and the mesopores are liberated.
Simultaneously, the titanate species are aggregated and the homogeneous amorphous
frameworks start to crystallize because of the thermodynamic metastability of titania during
the heat treatment.32 The crystallisation occurs above 300°C depending on the composition in
silica as shown in Figure 3.11. The nuclei and nanocrystals of TiO2 are formed around the
pore walls. At this moment, the phase separation occurs and anatase TiO2 nanocrystals are
randomly embedded in the matrixes of amorphous TiO2 and SiO2. The phase separation
continues to progress through TiO2 nanocrystals further grow by prolonging the heat
treatment time. During this stage, the silica matrix located around the Anatase crystallites
further cross links, stiffening at the same time the whole structure. Further growth of TiO2
crystallites through Ostwald ripening (diffusive sintering) is then quenched due to the
presence of the silica matrix that inhibits the diffusion of titania-oxo species. The amorphous
silica framework also prevents the framework from collapsing.
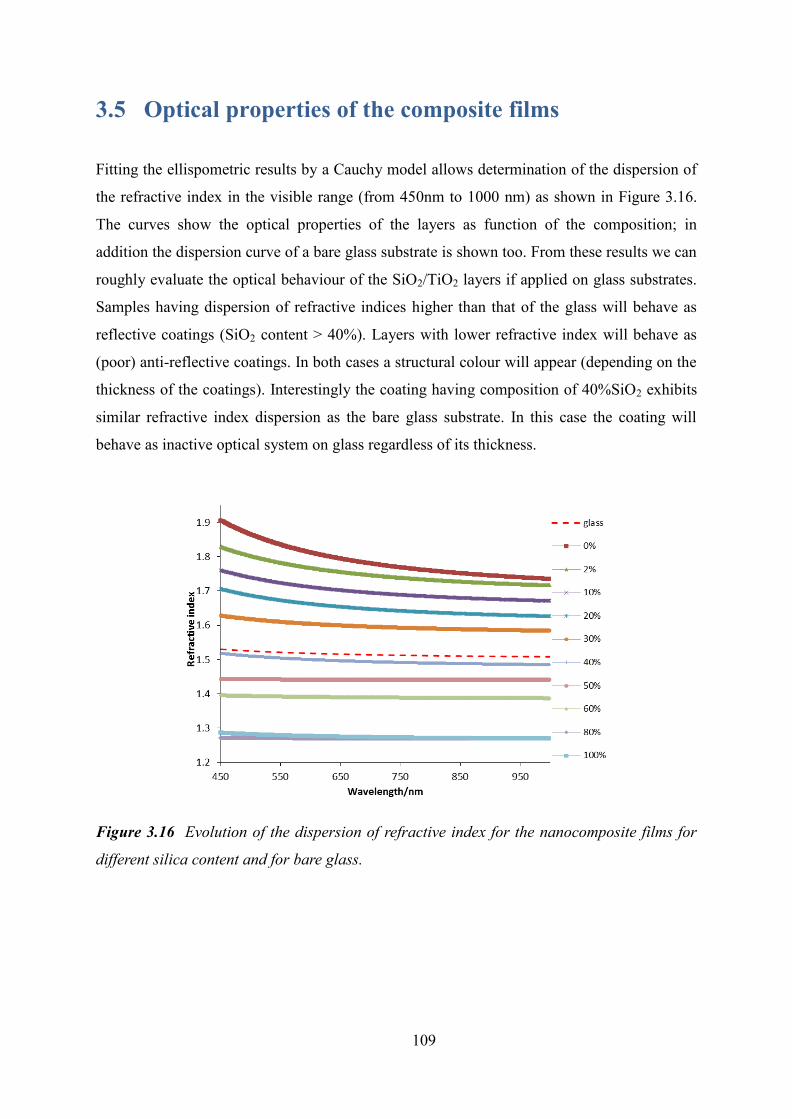
109
3.5 Optical properties of the composite films
Fitting the ellispometric results by a Cauchy model allows determination of the dispersion of
the refractive index in the visible range (from 450nm to 1000 nm) as shown in Figure 3.16.
The curves show the optical properties of the layers as function of the composition; in
addition the dispersion curve of a bare glass substrate is shown too. From these results we can
roughly evaluate the optical behaviour of the SiO2/TiO2 layers if applied on glass substrates.
Samples having dispersion of refractive indices higher than that of the glass will behave as
reflective coatings (SiO2 content > 40%). Layers with lower refractive index will behave as
(poor) anti-reflective coatings. In both cases a structural colour will appear (depending on the
thickness of the coatings). Interestingly the coating having composition of 40%SiO2 exhibits
similar refractive index dispersion as the bare glass substrate. In this case the coating will
behave as inactive optical system on glass regardless of its thickness.
Figure 3.16 Evolution of the dispersion of refractive index for the nanocomposite films for
different silica content and for bare glass.
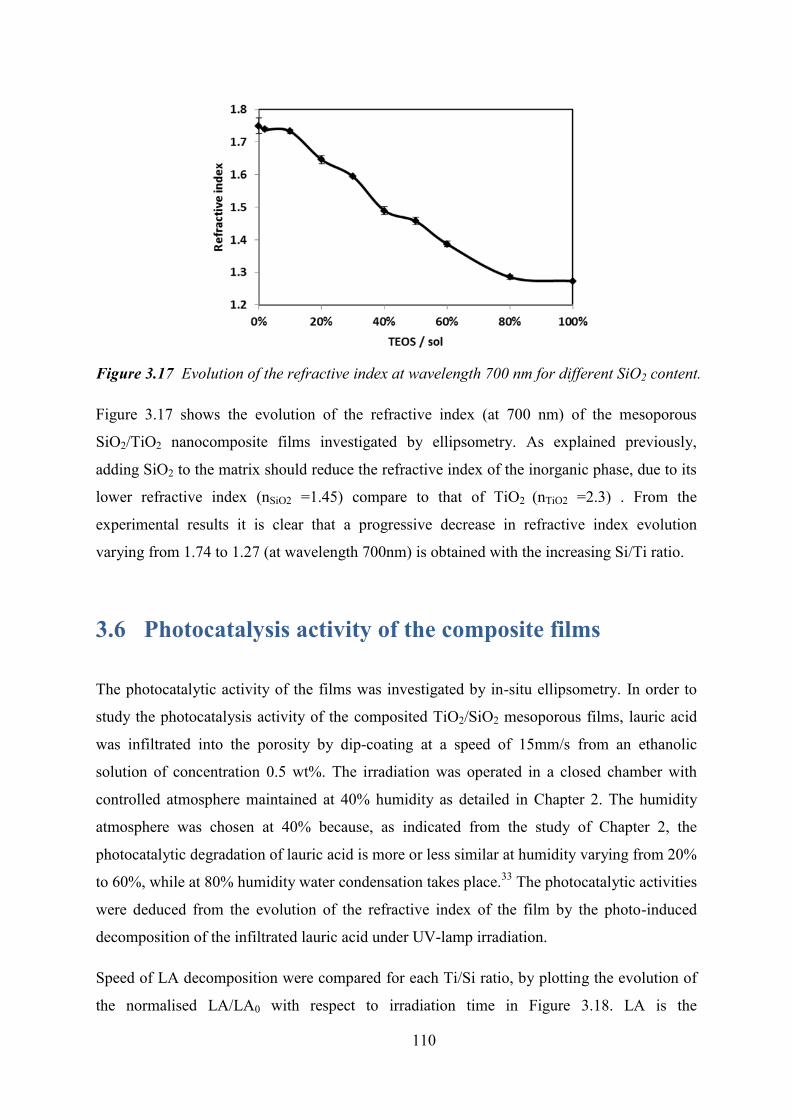
110
Figure 3.17 Evolution of the refractive index at wavelength 700 nm for different SiO2 content.
Figure 3.17 shows the evolution of the refractive index (at 700 nm) of the mesoporous
SiO2/TiO2 nanocomposite films investigated by ellipsometry. As explained previously,
adding SiO2 to the matrix should reduce the refractive index of the inorganic phase, due to its
lower refractive index (nSiO2 =1.45) compare to that of TiO2 (nTiO2 =2.3) . From the
experimental results it is clear that a progressive decrease in refractive index evolution
varying from 1.74 to 1.27 (at wavelength 700nm) is obtained with the increasing Si/Ti ratio.
3.6 Photocatalysis activity of the composite films
The photocatalytic activity of the films was investigated by in-situ ellipsometry. In order to
study the photocatalysis activity of the composited TiO2/SiO2 mesoporous films, lauric acid
was infiltrated into the porosity by dip-coating at a speed of 15mm/s from an ethanolic
solution of concentration 0.5 wt%. The irradiation was operated in a closed chamber with
controlled atmosphere maintained at 40% humidity as detailed in Chapter 2. The humidity
atmosphere was chosen at 40% because, as indicated from the study of Chapter 2, the
photocatalytic degradation of lauric acid is more or less similar at humidity varying from 20%
to 60%, while at 80% humidity water condensation takes place.33 The photocatalytic activities
were deduced from the evolution of the refractive index of the film by the photo-induced
decomposition of the infiltrated lauric acid under UV-lamp irradiation.
Speed of LA decomposition were compared for each Ti/Si ratio, by plotting the evolution of
the normalised LA/LA0 with respect to irradiation time in Figure 3.18. LA is the
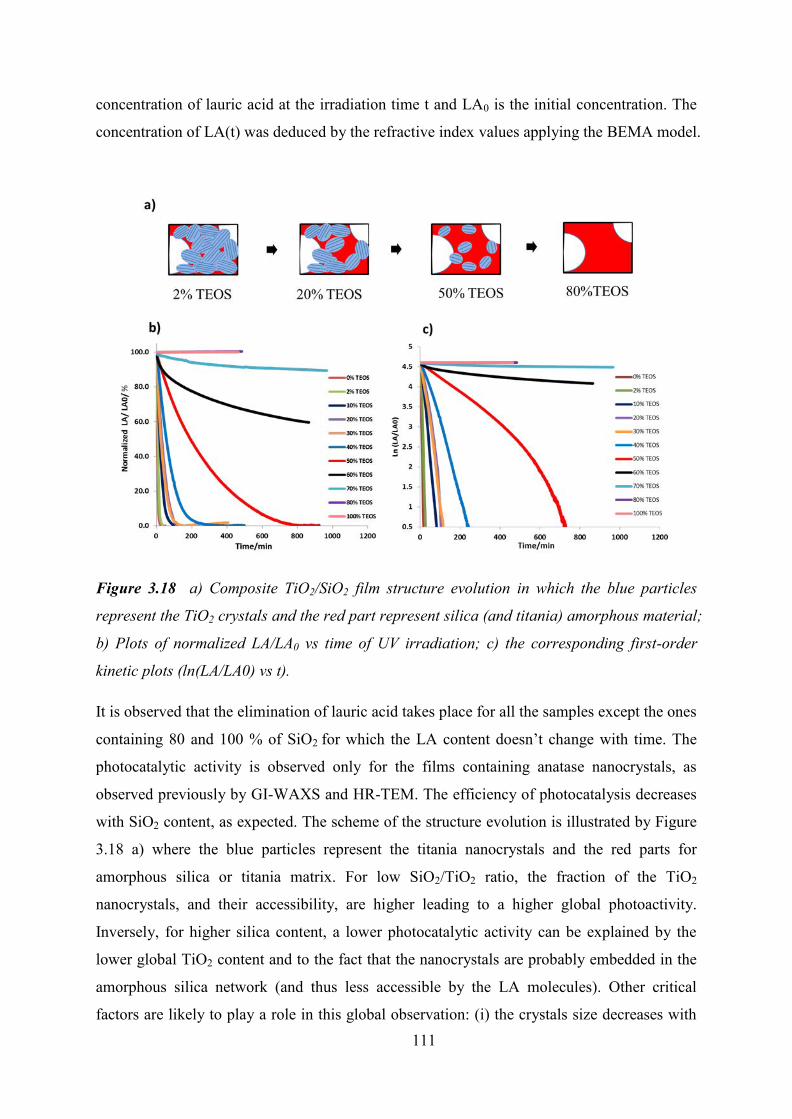
111
concentration of lauric acid at the irradiation time t and LA0 is the initial concentration. The
concentration of LA(t) was deduced by the refractive index values applying the BEMA model.
Figure 3.18 a) Composite TiO2/SiO2 film structure evolution in which the blue particles
represent the TiO2 crystals and the red part represent silica (and titania) amorphous material;
b) Plots of normalized LA/LA0 vs time of UV irradiation; c) the corresponding first-order
kinetic plots (ln(LA/LA0) vs t).
It is observed that the elimination of lauric acid takes place for all the samples except the ones
containing 80 and 100 % of SiO2 for which the LA content doesn’t change with time. The
photocatalytic activity is observed only for the films containing anatase nanocrystals, as
observed previously by GI-WAXS and HR-TEM. The efficiency of photocatalysis decreases
with SiO2 content, as expected. The scheme of the structure evolution is illustrated by Figure
3.18 a) where the blue particles represent the titania nanocrystals and the red parts for
amorphous silica or titania matrix. For low SiO2/TiO2 ratio, the fraction of the TiO2
nanocrystals, and their accessibility, are higher leading to a higher global photoactivity.
Inversely, for higher silica content, a lower photocatalytic activity can be explained by the
lower global TiO2 content and to the fact that the nanocrystals are probably embedded in the
amorphous silica network (and thus less accessible by the LA molecules). Other critical
factors are likely to play a role in this global observation: (i) the crystals size decreases with
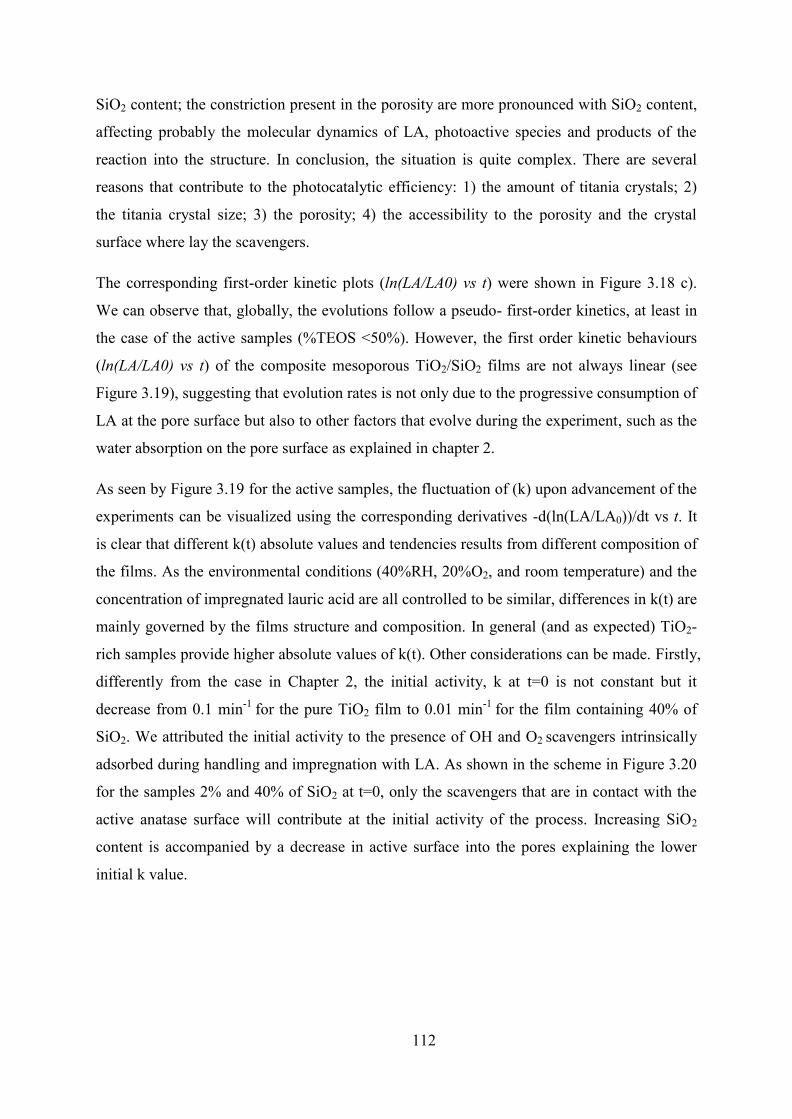
112
SiO2 content; the constriction present in the porosity are more pronounced with SiO2 content,
affecting probably the molecular dynamics of LA, photoactive species and products of the
reaction into the structure. In conclusion, the situation is quite complex. There are several
reasons that contribute to the photocatalytic efficiency: 1) the amount of titania crystals; 2)
the titania crystal size; 3) the porosity; 4) the accessibility to the porosity and the crystal
surface where lay the scavengers.
The corresponding first-order kinetic plots (ln(LA/LA0) vs t) were shown in Figure 3.18 c).
We can observe that, globally, the evolutions follow a pseudo- first-order kinetics, at least in
the case of the active samples (%TEOS <50%). However, the first order kinetic behaviours
(ln(LA/LA0) vs t) of the composite mesoporous TiO2/SiO2 films are not always linear (see
Figure 3.19), suggesting that evolution rates is not only due to the progressive consumption of
LA at the pore surface but also to other factors that evolve during the experiment, such as the
water absorption on the pore surface as explained in chapter 2.
As seen by Figure 3.19 for the active samples, the fluctuation of (k) upon advancement of the
experiments can be visualized using the corresponding derivatives -d(ln(LA/LA0))/dt vs t. It
is clear that different k(t) absolute values and tendencies results from different composition of
the films. As the environmental conditions (40%RH, 20%O2, and room temperature) and the
concentration of impregnated lauric acid are all controlled to be similar, differences in k(t) are
mainly governed by the films structure and composition. In general (and as expected) TiO2-
rich samples provide higher absolute values of k(t). Other considerations can be made. Firstly,
differently from the case in Chapter 2, the initial activity, k at t=0 is not constant but it
decrease from 0.1 min-1 for the pure TiO2 film to 0.01 min-1 for the film containing 40% of
SiO2. We attributed the initial activity to the presence of OH and O2 scavengers intrinsically
adsorbed during handling and impregnation with LA. As shown in the scheme in Figure 3.20
for the samples 2% and 40% of SiO2 at t=0, only the scavengers that are in contact with the
active anatase surface will contribute at the initial activity of the process. Increasing SiO2
content is accompanied by a decrease in active surface into the pores explaining the lower
initial k value.
113
Figure 3.19 -d(ln(LA/LA0))/dt vs t plots in logarithm, representing the evolution of the
kinetic constants k (min-1) along the experiment progression for each component; inserted
the route (i) and (ii) for decomposition of lauric acid.
Secondly, similar tendencies were observed for samples from 0% TEOS to 30% TEOS. In
the beginning, the kinetic constant goes up progressively since LA is decomposed at the
anatase suface and liberates sites where H2O and O2 are adsorbed. Consequently, the
concentration in scavengers increases with time, causing an acceleration of the reaction rate
by, at least, a factor 1.5. After reaching a maximum, k(t) goes down progressively due to the
fact that lauric acid was almost completely decomposed, which is the same tendency
observed and explained in Chapter 2. Thirdly, the k (t) maxima (which stand for the nearly
end of the decomposition reactions) shift to longer time with the increasing % TEOS; this
behavior is obviously due to the fact that less active films require more time to decompose
lauric acid. Fourthly, the k value is almost constant for the sample 40% TEOS that is
characteristic of nearly perfect first-order kinetics. As proposed in the scheme in Figure 3.20,
initially, part of the impregnated lauric acid molecules are in contact with TiO2 crystal and
the another part with the amorphous SiO2 (or TiO2) material. The lauric acid which is directly
in contact with anatase TiO2 could be readily decomposed freeing active sites to water to be
absorbed. However, no increase in k(t) is observed with the time here. This behavior is due to
0
0.05
0.1
0.15
0.2
0.25
0 50 100 150 200
k=-d
(ln(L
A/LA
0))/
dt
Time/min
0% TEOS
2% TEOS
10% TEOS
30% TEOS
40% TEOS
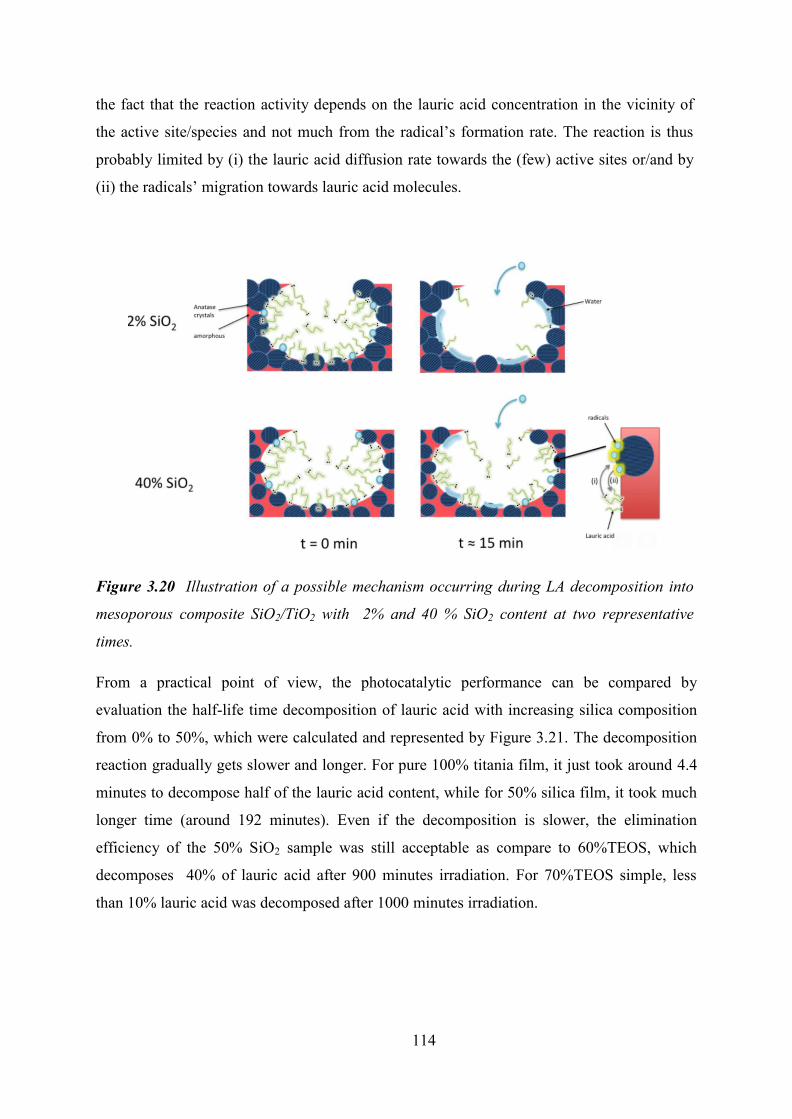
114
the fact that the reaction activity depends on the lauric acid concentration in the vicinity of
the active site/species and not much from the radical’s formation rate. The reaction is thus
probably limited by (i) the lauric acid diffusion rate towards the (few) active sites or/and by
(ii) the radicals’ migration towards lauric acid molecules.
Figure 3.20 Illustration of a possible mechanism occurring during LA decomposition into
mesoporous composite SiO2/TiO2 with 2% and 40 % SiO2 content at two representative
times.
From a practical point of view, the photocatalytic performance can be compared by
evaluation the half-life time decomposition of lauric acid with increasing silica composition
from 0% to 50%, which were calculated and represented by Figure 3.21. The decomposition
reaction gradually gets slower and longer. For pure 100% titania film, it just took around 4.4
minutes to decompose half of the lauric acid content, while for 50% silica film, it took much
longer time (around 192 minutes). Even if the decomposition is slower, the elimination
efficiency of the 50% SiO2 sample was still acceptable as compare to 60%TEOS, which
decomposes 40% of lauric acid after 900 minutes irradiation. For 70%TEOS simple, less
than 10% lauric acid was decomposed after 1000 minutes irradiation.
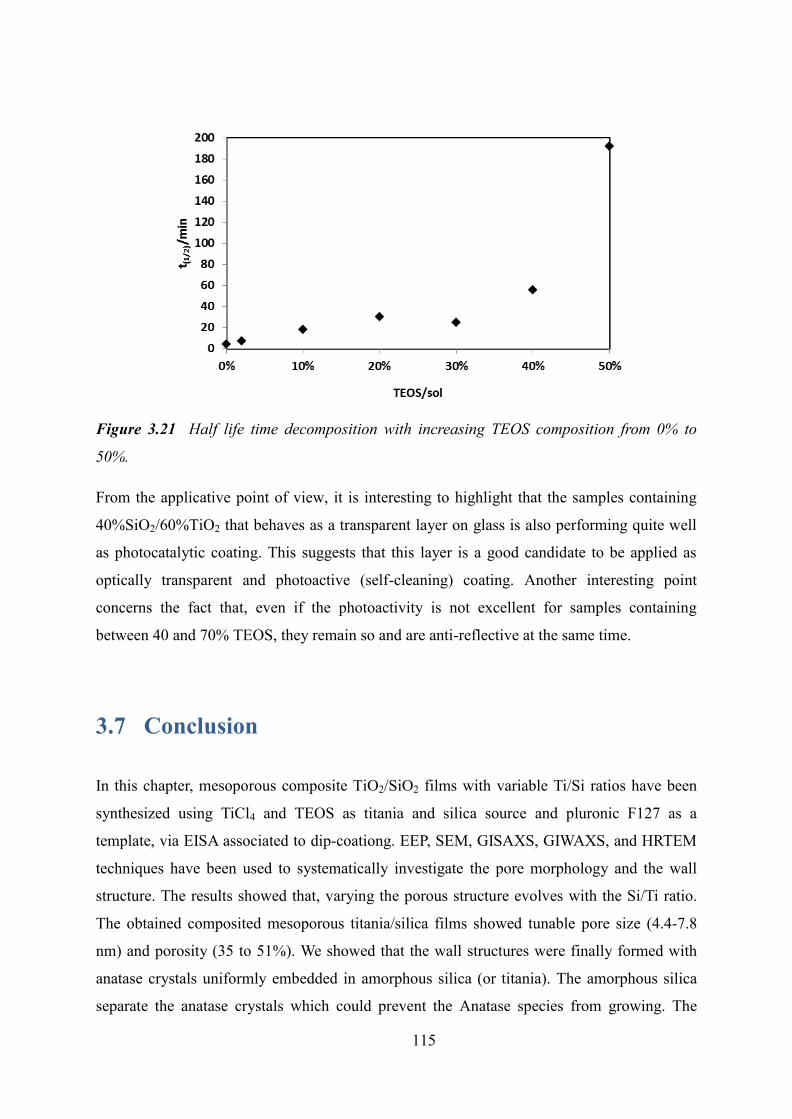
115
Figure 3.21 Half life time decomposition with increasing TEOS composition from 0% to
50%.
From the applicative point of view, it is interesting to highlight that the samples containing
40%SiO2/60%TiO2 that behaves as a transparent layer on glass is also performing quite well
as photocatalytic coating. This suggests that this layer is a good candidate to be applied as
optically transparent and photoactive (self-cleaning) coating. Another interesting point
concerns the fact that, even if the photoactivity is not excellent for samples containing
between 40 and 70% TEOS, they remain so and are anti-reflective at the same time.
3.7 Conclusion
In this chapter, mesoporous composite TiO2/SiO2 films with variable Ti/Si ratios have been
synthesized using TiCl4 and TEOS as titania and silica source and pluronic F127 as a
template, via EISA associated to dip-coationg. EEP, SEM, GISAXS, GIWAXS, and HRTEM
techniques have been used to systematically investigate the pore morphology and the wall
structure. The results showed that, varying the porous structure evolves with the Si/Ti ratio.
The obtained composited mesoporous titania/silica films showed tunable pore size (4.4-7.8
nm) and porosity (35 to 51%). We showed that the wall structures were finally formed with
anatase crystals uniformly embedded in amorphous silica (or titania). The amorphous silica
separate the anatase crystals which could prevent the Anatase species from growing. The

116
optical characterization indicates that the refractive index of the layers could be easily tuned
by controlling the inorganic phase composition. This is important to potentially integrate such
layers into optical devices (antireflective, Bragg-mirrors, transparent coatings…). Lauric acid
was impregnated into the porous network to study the photocatalytic activities by in-situ
ellipsometry. The mesoporous composite films with SiO2 content < 40% exhibit remarkable
photocatalytic activities. In particular we demonstrated that the mesoporous film with
composition 40%SiO2 60%TiO2 is a good candidate to be used as optically transparent,
photoactive, self-cleaning coating on glass.
117
References
1. Chien D M, Viet N N, Van N T K, et al. Characteristics modification of TiO2 thin films
by doping with silica and alumina for self-cleaning application[J]. Journal of
Experimental Nanoscience, 2009, 4(3): 221-232.
2. Biju K P, Jain M K. Effect of crystallization on humidity sensing properties of sol–gel
derived nanocrystalline TiO2 thin films[J]. Thin Solid Films, 2008, 516(8): 2175-2180.
3. Yaacob M H, Sadek A Z, Latham K, et al. Optical H2 sensing performance of anodized
nanoporous TiO2 thin films[J]. Procedia Chemistry, 2009, 1(1): 951-954.
4. Wang R, Hashimoto K, Fujishima A, et al. Light-induced amphiphilic surfaces[J]. Nature,
1997, 388: 431-432.
5. Houmard M, Riassetto D, Roussel F, et al. Enhanced persistence of natural super-
hydrophilicity in TiO2–SiO2 composite thin films deposited via a sol–gel route[J].
Surface Science, 2008, 602(21): 3364-3374.
6. Maeda M, Yamasaki S. Effect of silica addition on crystallinity and photo-induced
hydrophilicity of titania–silica mixed films prepared by sol–gel process[J]. Thin Solid
Films, 2005, 483(1): 102-106.
7. Liu Y Y, Qian L Q, Guo C, et al. Natural superhydrophilic TiO2/SiO2 composite thin
films deposited by radio frequency magnetron sputtering [J]. Journal of Alloys and
Compounds, 2009, 479(1): 532-535.
8. Fresno F, Portela R, Suárez S, et al. Photocatalytic materials: recent achievements and
near future trends[J]. Journal of Materials Chemistry A, 2014, 2(9): 2863-2884.
9. Sakthivel S, Kisch H. Daylight photocatalysis by carbon-modified titanium dioxide[J].
Angewandte Chemie International Edition, 2003, 42(40): 4908-4911.
10. Asahi R, Morikawa T, Ohwaki T, et al. Visible-light photocatalysis in nitrogen-doped
titanium oxides[J]. science, 2001, 293(5528): 269-271.
11. Jimmy C. Synthesis of hierarchical nanoporous F-doped TiO2 spheres with visible light
photocatalytic activity[J]. Chemical Communications, 2006 (10): 1115-1117.
12. Zang L, Macyk W, Lange C, et al. Visible-light detoxification and charge generation by
transition metal chloride modified titania[J]. Chemistry- A European Journal, 2000, 6(2):
379-384.
13. Louis B, Krins N, Faustini M, et al. Understanding Crystallization of Anatase into Binary
SiO2/ TiO2 Sol− Gel Optical Thin Films: An in Situ Thermal Ellipsometry Analysis[J].
118
The Journal of Physical Chemistry C, 2011, 115(7): 3115-3122.
14. Pitoniak E, Wu C Y, Londeree D, et al. Nanostructured silica-gel doped with TiO2 for
mercury vapor control[J]. Journal of Nanoparticle Research, 2003, 5(3-4): 281-292.
15. Levene L, Thomas I M. Process of converting metalorganic compounds and high purity
products obtained therefrom: U.S. Patent 3,640,093[P]. 1972-2-8.
16. Brinker C J, Scherer G W. Sol gel glass: I. Gelation and gel structure[J]. Journal of Non-
Crystalline Solids, 1985, 70(3): 301-322.
17. Yoldas B E. Deposition and properties of optical oxide coatings from polymerized
solutions[J]. Applied optics, 1982, 21(16): 2960-2964.
18. Kim S J, Park S D, Rhee C K, et al. Photocatalytic characteristics of homogeneously
precipitated TiO2 nano-sized powders[J]. Scripta materialia, 2001, 44(8): 1229-1233.
19. Aguado J, Van Grieken R, López-Munoz M J, et al. A comprehensive study of the
synthesis, characterization and activity of TiO2 and mixed TiO2/SiO2 photocatalysts[J].
Applied Catalysis A: General, 2006, 312: 202-212.
20. Kabra K, Chaudhary R, Sawhney R L. Treatment of hazardous organic and inorganic
compounds through aqueous-phase photocatalysis: a review[J]. Industrial & engineering
chemistry research, 2004, 43(24): 7683-7696.
21. Machida M, Norimoto K, Watanabe T, et al. The effect of SiO2 addition in super-
hydrophilic property of TiO2 photocatalyst[J]. Journal of Materials science, 1999, 34(11):
2569-2574.
22. Kamalasanan M N, Chandra S. Sol-gel synthesis of ZnO thin films[J]. Thin Solid Films,
1996, 288(1): 112-115.
23. Wang P, Zakeeruddin S M, Exnar I, et al. High efficiency dye-sensitized nanocrystalline
solar cells based on ionic liquid polymer gel electrolyte[J]. Chemical Communications,
2002 (24): 2972-2973.
24. Zribi M, Kanzari M, Rezig B. Structural, morphological and optical properties of thermal
annealed TiO thin films[J]. Thin Solid Films, 2008, 516(7): 1476-1479.
25. Yamashita H, Ichihashi Y, Harada M, et al. Photocatalytic degradation of 1-octanol on
anchored titanium oxide and on TiO2 powder catalysts[J]. Journal of Catalysis, 1996,
158(1): 97-101.
26. Caruso F, Spasova M, Salgueiriño‐Maceira V, et al. Multilayer Assemblies of Silica‐
Encapsulated Gold Nanoparticles on Decomposable Colloid Templates[J]. Advanced
Materials, 2001, 13(14): 1090-1094.
119
27. Gao L, Zhang Q. Effects of amorphous contents and particle size on the photocatalytic
properties of TiO2 nanoparticles[J]. Scripta materialia, 2001, 44(8): 1195-1198.
28. Dong W, Sun Y, Lee C W, et al. Controllable and repeatable synthesis of thermally
stable anatase nanocrystal-silica composites with highly ordered hexagonal
mesostructures[J]. Journal of the American Chemical Society, 2007, 129(45): 13894-
13904.
29. Li R, Faustini M, Boissière C, et al. Water Capillary Condensation Effect on the
Photocatalytic Activity of Porous TiO2 in Air[J]. The Journal of Physical Chemistry C,
2014, 118(31): 17710-17716.
30. Yang P, Zhao D, Margolese D I, et al. Generalized syntheses of large-pore mesoporous
metal oxides with semicrystalline frameworks[J]. Nature, 1998, 396(6707): 152-155.
31. Li D, Zhou H, Honma I. Design and synthesis of self-ordered mesoporous
nanocomposite through controlled in-situ crystallization[J]. Nature materials, 2004, 3(1):
65-72.
32. Choi S Y, Mamak M, Coombs N, et al. Thermally stable two-dimensional hexagonal
mesoporous nanocrystalline anatase, meso-nc-TiO2: Bulk and crack-free thin film
morphologies[J]. Advanced Functional Materials, 2004, 14(4): 335-344.
33. Carretero-Genevrier A, Boissiere C, Nicole L, et al. Distance dependence of the
photocatalytic efficiency of TiO2 revealed by in situ ellipsometry[J]. Journal of the
American Chemical Society, 2012, 134(26): 10761-10764.
120
CHAPTER 4 Conclusion
In this thesis, spectroscopic ellipsometry technique was used to study photocatalytic activity
of TiO2 and TiO2/SiO2 composite mesoporous films. Spectroscopic ellipsometry has been
used as tool to characterize the materials structure, porosity and the films optical properties.
In addition it has been adapted to characterize the photocatalytic properties of the systems in
controlled environment and as function of the material structure and composition.
In the first part, the photocatalytic efficiencies of porous TiO2 thin films were evaluated by
following the refractive index diminution associated to the decomposition of impregnated
organic pollutants. It offers here a simple, alternative and complementary method to evaluate
the roles of the atmospheric composition in O2 and H2O on the reactivity. In the case in
which lauric acid is used as pollutant we demonstrated that cleaning a porous semi-conductor
films from its impregnated pollutant does not follow a strict-first order kinetic due to the
fluctuation in O2 and H2O content in the pores as dictated by exchange equilibriums and
accessibility of sites for scavenger stabilisation. It is proposed that higher efficiencies was
obtained for an optimal ratio and repartition of scavenger/pollutant in the “moderate-dry”
conditions, and when pores content liquid water from capillary condensation at high RH. In
addition, this study proves that the evaluation of the photocatalytic activity of a given
material performed in presence of liquid water is significantly different from that measured
in atmosphere, especially for nanoporous photocatalysts (powder too). Thus, usual results of
literature obtained from decomposition tests performed in solution should be taken with care
whenever atmospheric photocatalysis application is targeted. We also investigate here the
influence of the organic probe by using Methylene blue as pollutant and by discussing its
efficacy to monitor photocatalysis. An optical model was developed to describe the optical
response of the dye and its monomeric or dimeric forms. We highlight that photoreduction
occurs when MB is used in O2 free environments. Experiments in controlled humid
atmosphere were conducted. By monitoring independently the real and the imaginary part of
refractive index, the results on photodegradation rate suggested that MB can be used as probe
for ellipsometric investigations in order to obtain information on the photodegration process
and identify the formation of volatile or non-volatile products.
In the second part, in-situ ellipsometry was also used to investigate the morphology and
121
photocatalytic activity of mesoporous composite TiO2/SiO2 films with different Ti/Si ratios.
The ordered films have been synthesized using TiCl4 and TEOS as titania and silica source,
Pluronic F127 as a template, via a synchronous assembly approach based on an ethanolic
EISA process and by dip-coationg, respectively. EEP, SEM, GISAXS, GIWAXS, and HR-
TEM techniques has been used to systematically investigate the pore morphology and wall
structure. The results showed that the porous morphology varies from grid-like to worm-like
structure. The obtained composite mesoporous titania/silica films shows tunable pore size
(4.4-7.8 nm) and large porosity (0.35-0.51). The wall structures were finally formed by
anatase crystals uniformly embedded in amorphous silica (or titania) which act as the wall
surrounding the pores. The amorphous silica separated the anatase crystals which could
prevent the anatase species from aggregating. Optical characterization indicates that the
refractive index of the layers could be easily tuned by controlling the inorganic phase
composition. This is important to potentially integrate such layers into optical devices
(antireflective, Bragg-mirrors, transparent coatings…). Lauric acid was impregnated into the
porous network to study the photocatalytic activities by in-situ ellipsometry. The mesoporous
composite films with SiO2 content < 40% exhibit remarkable photocatalytic activities. In
particular we demonstrated that the mesoporous film with composition 40%SiO2/60%TiO2 is
a good candidate to be used as optically transparent, photoactive, self-cleaning coating on
glass.
As a general conclusion, in-situ ellipsometry was proved to be a good tool to perform
fundamental studies of photocatalytic processes into model thin films. However some further
advancements can be proposed for the future.
Ellipsometry gives information about the kinetics of decomposition of non-volatile pollutant
however the understanding of chemical processes taking place into the films remains a black-
box. In this regards, it would be useful to couple ellipsometric analysis with other techniques
(such as FTIR or GC) in order to determine the exact composition of the photocatalysis
products. IR conducted some preliminary experiments but no significant data were measured
due to the low amount of materials on the surface. These experiments would be also needed
to confirm the validity of approach of MB to monitor the formation of volatile or non-volatile
products.
In this regard, another perspective could be to further investigate the utilization of colored
dye, as methylene blue, as a probe for ellipsometry. Concerning methylene blue some aspects
122
needs to be clarified such as the unusual initial absorption peak and the position evolution
with RH.
In here, lauric acid and methylene blue were chosen to study the decomposition behavior.
Lauric acid is composed by an alkyl chain (hydrophobic) and a carboxylic tail (hydrophilic)
that can bind TiO2; on the other hand methylene blue is hydrophilic (soluble in water) but not
binding TiO2. One could wonder how the structure and the chemical nature of the pollutant
influence the photocatalysis. As function of their composition and structure, the pollutants
are thus expected to be decomposed with different kinetics in air or liquid environments. A
more systematic study would be interesting even involving a mixture of different pollutants
(as in real conditions)
Another perspective consists in developing new photocatalytic films, for example active in
the visible range. In my opinion, one interesting system is composed by gold nanoparticles
supported on titania (Au/TiO2). TiO2 materials can only be excited by UV light (<360 nm);
however less than 5% of sunlight is active for TiO2. For real outdoor and indoor applications,
the visible light from a nature source would be more convenient than UV light as excitation
source. The most widely used approach to extend the photocatalytic response into the visible
region has been doping the TiO2 material with metals or non-metallic elements.1-3 In general,
it can be concluded that metal doping leads to unstable materials that undergo corrosion and
in the long term the metal dopant undergoes leaching causing a gradual decay in the
photocatalytic performance of the material.4-6 On the other hand, doping by non-metallic
element requires harsh preparation conditions and the degree of doping is difficult to
determine with chemical analyses. Related to metal doping, but conceptually a different type
of material, is when preformed TiO2 is subsequently modified by depositing on the surface
metal nanoparticles. The metal that modifies TiO2 does not form part of the solid framework,
but is in a separate phase in interfacial contact with semiconducting TiO2. The mechanism is
based on the gold photosensitization of titania by electron injection into the conduction band.
It has a remarkable photostability. Preparation procedures of Au/TiO2 have been well studied
and extensively described, particularly for materials with low gold loading and small particle
size.7-9 One point it seems that the requirements in terms of optimum particle size,
morphology and loading for photocatalytic reactions may not coincide exactly with those that
are optimal for catalysis and this issue also need specific attention.10 In this specific case, the
gold particle would behave like non-decomposing dye that can be optically described by
ellispometry as in the case of methylene blue. Therefore, it would be interesting to study

123
these structural aspects (and again the influence of the environmental conditions) with
ellipsometry.
124
References
1. P. V. Kamat, Photochemistry on nonreactive and reactive (semiconductor) surfaces[J], Chem.
Rev., 1993, 93, 267-300.
2. K. Takahama, N. Nakagawa, K. Kishimoto, JP 09192496 A 19970729, 1997.
3. Brezova V, Blažková A, Karpinský Ľ, et al. Phenol decomposition using M n+/TiO2
photocatalysts supported by the sol-gel technique on glass fibres[J]. Journal of
Photochemistry and Photobiology A: Chemistry, 1997, 109(2): 177-183.
4. Fox M A, Dulay M T. Heterogeneous photocatalysis[J]. Chemical reviews, 1993, 93(1): 341-
357.
5. Bekbölet M, Lindner M, Weichgrebe D, et al. Photocatalytic detoxification with the thin-film
fixed-bed reactor (TFFBR): clean-up of highly polluted landfill effluents using a novel TiO2-
photocatalyst[J]. Solar Energy, 1996, 56(5): 455-469.
6. Hoffmann M R, Martin S T, Choi W, et al. Environmental applications of semiconductor
photocatalysis[J]. Chemical reviews, 1995, 95(1): 69-96.
7. Kimling J, Maier M, Okenve B, et al. Turkevich method for gold nanoparticle synthesis
revisited[J]. The Journal of Physical Chemistry B, 2006, 110(32): 15700-15707.
8. Xu Z C, Shen C M, Yang T Z, et al. From aqueous to organic: A step-by-step strategy for
shape evolution of gold nanoparticles[J]. Chemical physics letters, 2005, 415(4): 342-345.
9. Buso D, Pacifico J, Martucci A, et al. Gold-Nanoparticle-Doped TiO2 Semiconductor Thin
Films: Optical Characterization[J]. Advanced Functional Materials, 2007, 17(3): 347-354.
10. primo A, Corma A, García H. Titania supported gold nanoparticles as photocatalyst[J].
Physical Chemistry Chemical Physics, 2011, 13(3): 886-910.
125
ABSTRACTS
Evaluation of photocatalytic activity of porous films by in-situ environmental
ellipsometric analysis
Because of their exceptional intrinsic physical chemical properties, TiO2-based materials
have been extensively studied as potential material to be used in photocatalysis, as self-
cleaning optical coatings, for solar energy conversion, for energy storage, or in sensing. In
particular crystalline mesoporous thin films exhibit increased photocatalytic activities due to
their exceptionally high surface area and to the high number of active sites. However the
study and the optimization of the photocatalysis in such porous media are not easy to be done
due to the fact that the catalytic process is highly dependent from several environmental and
structural parameters. The research activities of this thesis were essentially focused on (i) the
fabrication of mesoporous TiO2-based photoactive thin films with tunable composition and
nanostructure and (ii) their utilization as platform for fundamental study of the photocatalytic
process by in-situ ellipsometry. The mesoporous films with tunable nanostructure will be
fabricated by coupling sol-gel chemistry, block-copolymer self-assembly and highly
controlled liquid deposition techniques. Among modern analytical tools, 2D-GISAXS,
ellipsometry and ellipso-porosimetry, SEM-FEG, HR-TEM and WAXS, were used to obtain
a large set of relevant information on such layers. In the first part, a model TiO2 mesoporous
film was analysed by in-situ ellipsometry for fundamental investigations of the photocatalytic
process kinetics in air as function of the environmental composition (O2 and humidity) and
the organic pollutant (lauric acid or methylene blue). The large amount of information obtain
by in-situ ellipsometry has allowed the proposition of photodegradation mechanisms in the
studied conditions. In the second part, composite mesoporous TiO2/SiO2 films with tunable
optical properties were fabricated by sol-gel chemistry. A structural study on the films porous
network and composition was conducted. In-situ ellispometry was also used to determine the
photodegradation kinetics into the composite films and to clarify the photocatalytic
mechanism.
126
Evaluation de l’activité photocatalytique de films poreux par analyse ellipsométrique
environnementale in-situ
Du fait de leurs exceptionnelles propriétés intrinsèques physico-chimiques, les matériaux à
base de TiO2 ont déjà été très étudiés comme matériaux prépondérants pour être utilisés aussi
bien dans le domaine de la photocatalyse, que pour les revêtements optiques autonettoyants,
pour la conversion d’énergie solaire, pour le stockage d’énergie, ou encore pour la détection.
En particulier, les films minces mésoporeux cristallins de TiO2 montrent une activité photo-
catalytique élevée due à leur surface spécifique incomparable ainsi qu’à leur grand nombre de
sites actifs. Cependant, l’étude et l’optimisation de la photocatalyse dans un tel milieu poreux
n’est pas si simple car le processus catalytique dépend de plusieurs paramètres
environnementaux et structuraux. Les activités de recherche inhérentes à cette thèse se sont
essentiellement focalisées sur (i) la conception de couches minces mésoporeuses à base de
TiO2 avec une composition et une nanostructure variée et (ii) leur mise en œuvre comme
plateforme pour une étude fondamentale par ellipsométrie in-situ concernant le processus
photocatalytique. Des films minces mésoporeux avec une nanostructure ajustable ont été
produits en couplant la chimie sol-gel, l’auto-assemblage de copolymères à blocs, et des
procédés de dépôt liquide parfaitement contrôlés. Parmi des outils de caractérisation
analytiques modernes, 2D-GISAXS, ellipsométrie, porosimétrie par ellipsométrie, SEM-FEG,
HR-TEM et WAXS sont notamment les techniques qui ont été utilisées pour obtenir une large
gamme d’informations sur les couches minces ainsi produites. Dans la première partie du
manuscrit, un modèle de film mésoporeux de TiO2 a été analysé par ellipsométrie in-situ pour
des investigations fondamentales sur les cinétiques du processus photocatalytique dans l’air
en fonction de la composition environnementale (O2 ou humidité) et du polluant organique
(acide laurique ou bleu de méthylène). La grosse quantité d’information obtenue par
ellipsométrie in-situ a d’ailleurs permis la proposition de mécanismes de photo-dégradation
dans les conditions étudiées. Dans la seconde partie du manuscrit, des films minces
mésoporeux mixtes TiO2/SiO2 avec des propriétés optiques ajustables ont été préparées par
voie sol-gel. Une étude structurale a été conduite sur le réseau et la composition des films
poreux. L’ellipsométrie in-situ a été également mis en œuvre pour déterminer les cinétiques
de photo-dégradation à l’intérieur de ces films mixtes et pour clarifier le méchanisme
photocatalytique.
Copyright © 2022 FDOKUMEN