Evaluation of Iranian ESP Textbooks (Teachers vs. Students):Four Pairs of a Binoculars Watching a...
16
Archive of SID JOURNAL OF ENGLISH STUDIES Islamic Azad University, Science & Research Branch, 1(3), 51-66, Summer 2011 Four Pairs of Binoculars Watching a Single Prey: Evaluation of Iranian ESP Textbooks: (Teachers vs. Students) Gholam-Reza Abbasian* Imam Ali University and Islamic Azad University, South Tehran Branch Anahita Mahdavi Islamic Azad University, South Tehran Branch Received: November 5, 2011 Accepted: January 26, 2012 ABSTRACT: Humanism and socio-constructivism have entailed drastic developments in education including that of foreign/second language. Incorporating teachers and learners in all areas of education including materials development and evaluation, focusing four-pairs of binoculars on evaluating EFL materials can be taken amongst the outcomes of this trend. This study is a report of an evaluation of the ESP textbooks used in an Iranian university setting in order to investigate the extent of the compatibility of their perspectives on the ESP textbooks in general and on those in Humanities vs. engineering, specifically. To do so, about 180 ESP students and 30 teachers from Humanities and Engineering disciplines participated in the study. To collect the data, two valid questionnaires were specifically developed to measure general and specific features of the textbooks separately. Multi-method statistical analyses of the data revealed a comprehensive picture of the views of the participants on both the criteria dependability of the ESP materials in terms of content, exercises/activities, vocabulary-grammar, and physical attractiveness and maxims match. The chi-square results showed uniformities in the responses of both groups, but from the teachers’ perspectives, the books did not meet the criteria as they, holding more negative attitudes, expressed dissatisfaction with the books. On the contrary, the students showed more satisfaction with them, indicating that they meet the expected criteria of both types. ANOVA between groups’ evaluations of the data proved compatible with those of the frequency and chi-square analyses. Similarly, all of the correlation coefficients between the components of teachers and students’ questionnaires were shown statistically significant. Meanwhile, between-group paired samples t-test on both questionnaires showed significant differences between the students’ evaluations on both sets of criteria. Independent t-test for comparing teachers and students’ evaluations on both instruments sustained the results of the correlational analyses. Furthermore, both groups were found holding different perspectives as far as academic discipline was concerned: Humanities vs. Engineering. The findings, then, sustain roughly incompatible maxims towards ESP textbooks, varying views on the dependability issue, and differences as to componential analysis of the criteria. Pedagogically, the findings suggest student involvement in the process of syllabus design and materials evaluation, and preparation in general and ESP, in particular. Keywords: ESP students` involvement , ESP textbooks, evaluation 1 ESP, as Barnard and Zemach (2003) claim, has been known by five main currents in materials preparation: * Corresponding author`s email address: [email protected] www.SID.ir
-
Upload
abbasiantefl -
Category
Documents
-
view
0 -
download
0
Transcript of Evaluation of Iranian ESP Textbooks (Teachers vs. Students):Four Pairs of a Binoculars Watching a...
Archive
of S
ID
JOURNAL OF ENGLISH STUDIES
Islamic Azad University, Science & Research Branch, 1(3), 51-66, Summer 2011
Four Pairs of Binoculars Watching a Single Prey:
Evaluation of Iranian ESP Textbooks:
(Teachers vs. Students)
Gholam-Reza Abbasian* Imam Ali University and Islamic Azad University, South Tehran Branch
Anahita Mahdavi Islamic Azad University, South Tehran Branch
Received: November 5, 2011 Accepted: January 26, 2012
ABSTRACT: Humanism and socio-constructivism have entailed drastic developments in
education including that of foreign/second language. Incorporating teachers and learners in all
areas of education including materials development and evaluation, focusing four-pairs of
binoculars on evaluating EFL materials can be taken amongst the outcomes of this trend. This
study is a report of an evaluation of the ESP textbooks used in an Iranian university setting in
order to investigate the extent of the compatibility of their perspectives on the ESP textbooks in
general and on those in Humanities vs. engineering, specifically. To do so, about 180 ESP students
and 30 teachers from Humanities and Engineering disciplines participated in the study. To collect
the data, two valid questionnaires were specifically developed to measure general and specific
features of the textbooks separately. Multi-method statistical analyses of the data revealed a
comprehensive picture of the views of the participants on both the criteria dependability of the
ESP materials in terms of content, exercises/activities, vocabulary-grammar, and physical
attractiveness and maxims match. The chi-square results showed uniformities in the responses of
both groups, but from the teachers’ perspectives, the books did not meet the criteria as they,
holding more negative attitudes, expressed dissatisfaction with the books. On the contrary, the
students showed more satisfaction with them, indicating that they meet the expected criteria of
both types. ANOVA between groups’ evaluations of the data proved compatible with those of the
frequency and chi-square analyses. Similarly, all of the correlation coefficients between the
components of teachers and students’ questionnaires were shown statistically significant.
Meanwhile, between-group paired samples t-test on both questionnaires showed significant
differences between the students’ evaluations on both sets of criteria. Independent t-test for
comparing teachers and students’ evaluations on both instruments sustained the results of the
correlational analyses. Furthermore, both groups were found holding different perspectives as far
as academic discipline was concerned: Humanities vs. Engineering. The findings, then, sustain
roughly incompatible maxims towards ESP textbooks, varying views on the dependability issue,
and differences as to componential analysis of the criteria. Pedagogically, the findings suggest
student involvement in the process of syllabus design and materials evaluation, and preparation in
general and ESP, in particular.
Keywords: ESP students` involvement , ESP textbooks, evaluation
1 ESP, as Barnard and Zemach (2003) claim, has been known by five main currents in materials
preparation:
* Corresponding author`s email address: [email protected]
www.SID.ir
Archive
of S
ID
Abbasian and Mahdavi
52
Register analysis
Discourse and rhetorical analysis
Needs analysis
Skill centered approach
Learning centered approach
Often, there is much less attention to learners needs. Likewise, less significance is given to special
discourse and register of any discipline which the books have been written for. The purpose of
evaluation is to make sure that all aspects of instruction relate to the learner’s needs as identified
through interviews, questionnaires, observations, and examinations. Most importantly, a needs
analysis should take place at every stage, before, during, and after a course. This type of ongoing
evaluation allows a language program to be continuously modified and improved (Genesee, 2001).
Grant (1987, p.35) believed that the perfect textbook does not exist, and the best book should
satisfy three conditions:
1. It should suit the needs, interests and abilities of students;
2. It should suit the teacher and;
3. It must meet the needs of official public teaching syllabuses or examinations.
The situation implies that it is important for teachers to evaluate, select and adapt teaching
materials, especially ESP textbooks, to meet teachers’ and students’ needs in order to maximize
learning potentials. However, no single agent is involved in this process.
It is a common, but primarily subjective belief, that the ESP materials developed for Iranian
universities do not meet the learners’ and teachers’ expectations. Materials development for ESP
textbooks meets some especial criteria which are different from those applied to General English (GE)
materials. The most important issue to be considered in ESP materials development is learners’ needs.
Defining learners’ needs and precise needs assessment for every ESP course separately and developing
materials based on the findings of these evaluations are crucial for ESP materials development.
It seems that learners and teachers are not satisfied with these books. So, the evaluation of these
books helps the researchers see to what extent learners and teachers are satisfied with them and to
what extent their ideas are compatible. As an experimental Endeavor, this study attempts to evaluate
two different groups of (Iranian) ESP textbooks in engineering and humanities fields in terms of
learner-teacher’s maxims.
Theoretical Background Materials Development Following the advent of functional grammar and communicative language teaching, materials
development has changed to an important and real value. In this way, Tomlinson (2003) said:
Materials development has shown its real value since 1990s when materials development
became a tool for teachers to help them understand and apply theories of language learning and
contribute to their professional development. Either teacher-fronted or learner-centered
instruction, any classroom needs vehicles and materials to convey the needs, wants, interests
and purposes of learners and teachers. (pp. 480-481)
Materials development refers to anything that is done by writers, teachers, or learners to provide
sources of language input and to exploit those sources in ways that maximize the likelihood of intake.
Use of materials development by teachers is another dimension of this issue. Our situation shows
that problems exist with our teaching materials .We, as teachers, should take whatever is beneficial to
teaching and learning and modify what is not. Richards and Renandya (2002) assumed that teachers
and their experience have a crucial role to play in materials production as well as in their critical
classroom use, and the best writers are probably practicing teachers.
On the other hand, the experience of teacher is somehow important in materials development for
their class. Celce-Murcia (1991) stated that “the experience of the teacher will affect the materials
selection. The experienced teachers, as they know their students’ needs and capabilities, adjust and
www.SID.ir
Archive
of S
ID
JES, IAUSRB, 1(3), 51 -66, Summer 2011
53
adapt different teaching materials to students’ situation”(p.9). All these lie in or are the product of a
process called evaluation. To this end, Carter and Nunan (2001) said: “curriculum is made up of four
elements: aims, content, methodology and evaluation” (p.150).
Richards and Renandya (2002) believed, “evaluation must take place at all stages of curriculum
planning and implementation, and involve all participants” (p.77).They mentioned two purposes for
evaluation as follows:
The primary purpose of evaluation is to determine whether or not the curriculum goals have
been met, which, in the case of a language program, will be based on an assessment of the
participants in the program. Another purpose is to determine the effectiveness of the curriculum
and to evaluate the language program itself. (p.77)
ESP Materials Evaluation Hutchinson and Waters (1987) believed materials evaluation is vital for ESP courses because:
Any language teachings course has certain evaluation requirements, but in ESP these
requirements have sharply been brought into focus by the fact that the ESP course normally has
specified objectives. ESP is accountable teaching. ESP learners and sponsors are investors in the
ESP course and they want to see a return on their investment of time and/or money. The
managers of the ESP course are accountable to these investors. This accountability has produced
a demand for more and better evaluation procedures. (p.144)
Evans and St. John (1998) believed evaluation can be formative or summative. They said ESP
practitioners like formative evaluation because “it helps to shape the course during its life time”
(p.128). Summative evaluation is valuable for durable courses which are rare to find in ESP. They
(ibid) also mentioned evaluation can be both qualitative and quantitative. “Tests and objective-
question questionnaires provide numbers and percentage for individual items. They provide answers to
what questions but cannot easily address the how or why. More qualitative methods such as
discussions and interviews cover a wider picture, but may be less comparable” (p.128).
Teacher and Student Maxims Recently, there has been a growing interest in research on L2 teachers about their mental images,
thoughts, and the processes they employ while teaching. Richards (1996) believed teachers have two
different kinds of knowledge which influence their understanding and practice of teaching. One is
about subject matter and curricular issues and how to present the content of a lesson effectively. This
aspect is due to curricular goals, lesson plans, instructional activities, materials, tasks, and teaching
techniques. The other kind of knowledge relates to “personal working principles or maxims” (p. 286).
He defined maxims as: “A rule for good or sensible behavior, especially one which is in the form of a
proverb or short saying” (p. 286). He believed these maxims guide teachers’ actions. He states:
Conversations with teachers and observations of how teachers conduct their lessons suggest that
teachers’ belief systems lead to the development of rational principles which serve as a source
of how teachers interpret their responsibilities and implement their plans and which motivate
teachers’ interactive decisions during a lesson. These principles function like rules for best
behavior in that they guide the teacher’s selection of choices from among a range of
alternatives. They hence function as maxims which guide the teacher’s actions. These maxims
are reflected both in how teachers conduct their teaching as well as in the language they use to
talk about it. (p. 286)
As cited before, in addition to teachers, also learners can be an evaluation source in both ESP and
ELT environments. Like teachers, they have not only outer knowledge about their learning and its
environment but also “personal working principles or maxims” which build their concept about their
class and learning environment. It will be a bonus for an ESP or L2 environment if these maxims of
both learners and teachers meet the same objectivities and be compatible.
www.SID.ir
Archive
of S
ID
Abbasian and Mahdavi
54
ESP Evaluation in Iran In 2005, the First National ESP/EAP conference was held at the Foreign Language Department of
SAMT in Tehran. Most of the presented papers evaluated ESP textbooks from the perspective of
content uniformity and there were many critiques by researchers and curriculum writers.
Zangani (2009) evaluated ESP textbooks in humanities in the undergraduate program of Iranian
universities. The results indicated some parts of the ESP textbooks used in Iran are inappropriate and
need to be improved. Accordingly, the results of z-tests also indicated these textbooks should be
modified in terms of new approaches in language learning and teaching, as well as student needs.
Rahimy (2008) discussed the compatibility of the content of the Medical ESP materials with the
Iranian curriculum and believed there were many factors to be taken into account when writing ESP
textbooks for speakers of other languages. They could be genre analysis, contextualization, lexicon,
and grammar.
Research Questions 1. To what extent are Iranian ESP teachers and learners’ evaluations of the ESP textbooks compatible?
2. Are there any significant differences between the teachers and students’ evaluation of the content
factors of ESP textbooks?
Method Participants The participants of the study were two groups including ESP learners and teachers. The first group
was 180 randomly selected Iranian male and female university students at B.A. level of four
engineering disciplines (Industrial engineering, Computer, Textile, and Architecture) and two
humanity disciplines (Accounting and Law). From each field of study, 30 students holding the specific
and technical English courses participated in this research.
The second group of the participants was 30 ESP instructors of the above mentioned disciplines.
They were involved in teaching ESP course for several years and all of them held M.A. or Ph.D. in
TEFL or other relevant technical degrees. Those who educated in fields other than TEFL had a good
command of English and specialized in technical and scientific English of their own disciplines.
Instrumentation Two different checklists were employed for conducting this study. The first one was Mikley's 21-item
checklist (2005) entitled “ESL Textbook Checklist.” This checklist consists of 21 items on a five-point
Likert scale, and the items are classified into four categories of content, vocabulary and grammar,
exercise and activities, and attractiveness. This checklist was used to evaluate general features of the
ESP textbooks. This checklist was answered by both teachers and learners, but it was translated into
Persian to avoid any possible language ambiguities in the comprehension of the items by the learners.
Though the checklist is commonly used as a valid instrument, due to changing the setting of the
checklist use, the reliability of it, both teachers' and learners’ version were re-estimated and both
checklists demonstrated high reliability, i.e. teachers' α= 0.91, students' α= 0.88.
Another instrument used to measure the specific features of the ESP textbooks was a checklist
answered by both groups of the participants. It is an ESP oriented instrument and has been used for
evaluating ESP features of the books. Both checklists were in Persian and were adapted from a parallel
MA thesis from Islamic Azad University, Science and Research Branch in Tehran (Zangani, 2007).
The students’ checklist consisted of 27 items and teachers’22. These checklists are also on a five-
point Likert scale and because of the new setting, their reliability indexes were also re-estimated and
the results indicated high reliability for both checklists i.e. Teachers' α= 0.92, Students' α= 0.894.
ESP textbooks being the subject of the evaluation included ESP series published by The
Organization for Research and Composing University Textbooks in the Humanities (SAMT), which
are commonly prescribed to be used for academic purposes in Iran.
www.SID.ir
Archive
of S
ID
JES, IAUSRB, 1(3), 51 -66, Summer 2011
55
Procedure To conduct the study, the participants were first randomly selected from various universities offering
ESP courses. The logic behind multiple sampling was to make sure of the generalizability of the
findings. Then, both groups of the participants tapped the two separate checklists, one measuring the
ESP textbooks from their general features, and the other exploring their ESP characteristics. The
checklists were administered in one session. Data collection procedure took about one month due to
the nature of the study and sampling.
Data Analysis Given the nature of the research questions, the variables and dimensions involved as well as the nature
of the instruments employed, multiple analyses were deemed necessary. To this end, the data from
both checklists were coded and inserted into SPSS software version 18 for analyzing.
Both descriptive and inferential statistics were calculated. Descriptive statistics like frequency
analysis and estimation of percentage, mean, and standard deviation were calculated as both checklists
were answered by both groups. Inferential statistics included Chi-square analysis, t-test, ANOVA, and
correlational analyses and Post-hoc comparisons.
Design of the Study This study can be reasonably categorized as a subset of survey research as Brown (2001) defined
questionnaire as “any written instruments that present respondents with a series of questions or
statements to which they are to react either by writing out their answers or selecting them among
existing answers” (p.6). Moreover, the study lacked control group and treatment.
Results and Discussion Investigation of the First Research Question The first research question was “to what extent are Iranian ESP teachers and learners’ evaluations of
the ESP textbooks compatible?” In line with the analyses made concerning questions one and two,
further analyses were made to comparatively probe the perspectives of both groups on the ESP
textbooks in terms of general, specific, and content features. Similar statistical analyses were, though
comparatively, run as follows:
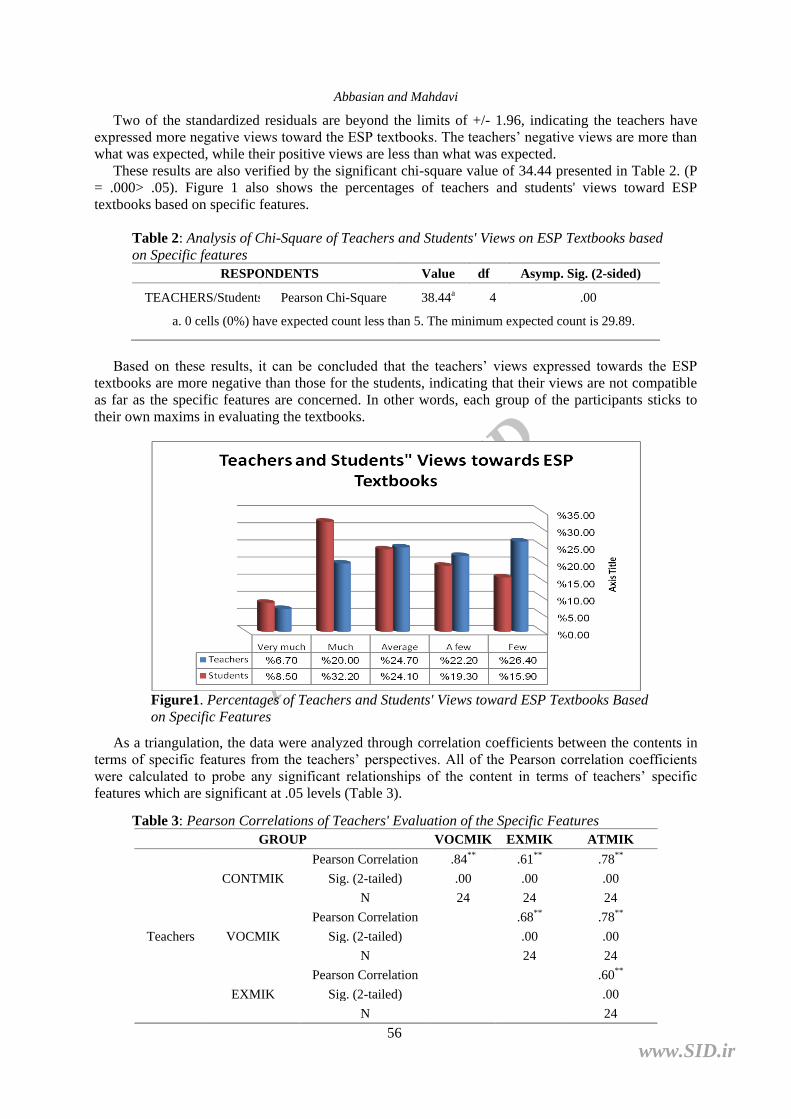
Table 1 displays the frequencies, percentages, and the standardized residuals for the teachers and
students’ responses to the specific features. The teachers evaluated ESP textbooks as negative. 48.6
percent of the teachers evaluated ESP textbooks as "few" and "A few," while the same percentage for
the students is 35.2. On the other side of the scale, 26.7 percent of teachers evaluated the ESP
textbooks as "Much" and "Very Much," while the same percentage for the students is 40.7. The
students evaluated the ESP textbooks more positively than the teachers.
Table 1. Frequencies, Percentages and Standardized Residuals of Teachers and
Students’ towards ESP Textbooks Based on Specific Features
CHOICES
Total Few A few Average Much Very much
Teachers
N 95 80 89 72 24 360
% 26.4% 22.2% 24.7% 20.0% 6.7% 100.0%
Std. Residual 4.2 1.1 .2 -3.7 -1.1
Students
N 429 521 651 868 230 2699
% 15.9% 19.3% 24.1% 32.2% 8.5% 100.0%
Std. Residual -1.6 -.4 .0 1.3 .4
Total N 524 601 740 940 254 3059
% 17.1% 19.6% 24.2% 30.7% 8.3% 100.0%
www.SID.ir
Archive
of S
ID
Abbasian and Mahdavi
56
Two of the standardized residuals are beyond the limits of +/- 1.96, indicating the teachers have
expressed more negative views toward the ESP textbooks. The teachers’ negative views are more than
what was expected, while their positive views are less than what was expected.
These results are also verified by the significant chi-square value of 34.44 presented in Table 2. (P
= .000> .05). Figure 1 also shows the percentages of teachers and students' views toward ESP
textbooks based on specific features.
Table 2: Analysis of Chi-Square of Teachers and Students' Views on ESP Textbooks based
on Specific features
RESPONDENTS Value df Asymp. Sig. (2-sided)
TEACHERS/Students Pearson Chi-Square 38.44a 4 .00
a. 0 cells (0%) have expected count less than 5. The minimum expected count is 29.89.
Based on these results, it can be concluded that the teachers’ views expressed towards the ESP
textbooks are more negative than those for the students, indicating that their views are not compatible
as far as the specific features are concerned. In other words, each group of the participants sticks to
their own maxims in evaluating the textbooks.
Figure1. Percentages of Teachers and Students' Views toward ESP Textbooks Based
on Specific Features
As a triangulation, the data were analyzed through correlation coefficients between the contents in
terms of specific features from the teachers’ perspectives. All of the Pearson correlation coefficients
were calculated to probe any significant relationships of the content in terms of teachers’ specific
features which are significant at .05 levels (Table 3).
Table 3: Pearson Correlations of Teachers' Evaluation of the Specific Features
GROUP VOCMIK EXMIK ATMIK
Teachers
CONTMIK
Pearson Correlation .84** .61** .78**
Sig. (2-tailed) .00 .00 .00
N 24 24 24
VOCMIK
Pearson Correlation .68** .78**
Sig. (2-tailed) .00 .00
N 24 24
EXMIK
Pearson Correlation .60**
Sig. (2-tailed) .00
N 24
www.SID.ir
Archive
of S
ID
JES, IAUSRB, 1(3), 51 -66, Summer 2011
57
Following the analyses concerning the specific features from both perspectives, similar trends were
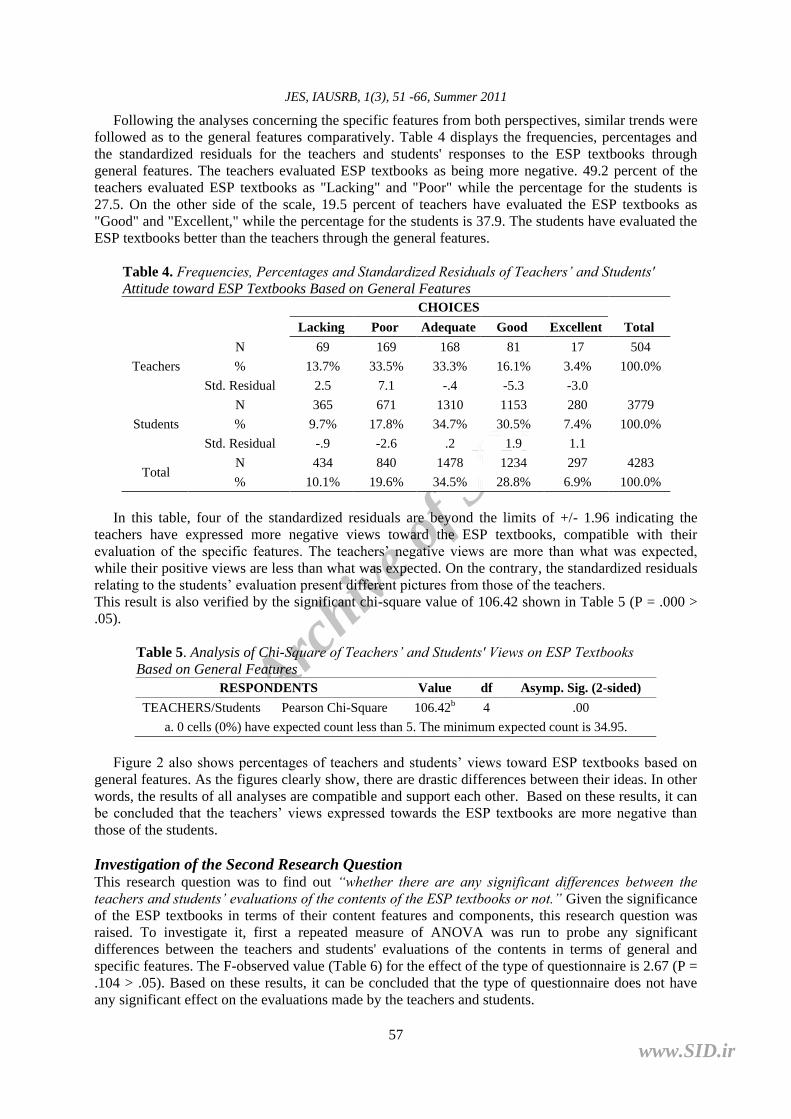
followed as to the general features comparatively. Table 4 displays the frequencies, percentages and
the standardized residuals for the teachers and students' responses to the ESP textbooks through
general features. The teachers evaluated ESP textbooks as being more negative. 49.2 percent of the
teachers evaluated ESP textbooks as "Lacking" and "Poor" while the percentage for the students is
27.5. On the other side of the scale, 19.5 percent of teachers have evaluated the ESP textbooks as
"Good" and "Excellent," while the percentage for the students is 37.9. The students have evaluated the
ESP textbooks better than the teachers through the general features.
Table 4. Frequencies, Percentages and Standardized Residuals of Teachers’ and Students'
Attitude toward ESP Textbooks Based on General Features
CHOICES
Total Lacking Poor Adequate Good Excellent
Teachers
N 69 169 168 81 17 504
% 13.7% 33.5% 33.3% 16.1% 3.4% 100.0%
Std. Residual 2.5 7.1 -.4 -5.3 -3.0
Students
N 365 671 1310 1153 280 3779
% 9.7% 17.8% 34.7% 30.5% 7.4% 100.0%
Std. Residual -.9 -2.6 .2 1.9 1.1
Total N 434 840 1478 1234 297 4283
% 10.1% 19.6% 34.5% 28.8% 6.9% 100.0%
In this table, four of the standardized residuals are beyond the limits of +/- 1.96 indicating the
teachers have expressed more negative views toward the ESP textbooks, compatible with their
evaluation of the specific features. The teachers’ negative views are more than what was expected,
while their positive views are less than what was expected. On the contrary, the standardized residuals
relating to the students’ evaluation present different pictures from those of the teachers.
This result is also verified by the significant chi-square value of 106.42 shown in Table 5 (P = .000 >
.05).
Table 5. Analysis of Chi-Square of Teachers’ and Students' Views on ESP Textbooks
Based on General Features
RESPONDENTS Value df Asymp. Sig. (2-sided)
TEACHERS/Students Pearson Chi-Square 106.42b 4 .00
a. 0 cells (0%) have expected count less than 5. The minimum expected count is 34.95.
Figure 2 also shows percentages of teachers and students’ views toward ESP textbooks based on
general features. As the figures clearly show, there are drastic differences between their ideas. In other
words, the results of all analyses are compatible and support each other. Based on these results, it can
be concluded that the teachers’ views expressed towards the ESP textbooks are more negative than
those of the students.
Investigation of the Second Research Question This research question was to find out “whether there are any significant differences between the
teachers and students’ evaluations of the contents of the ESP textbooks or not.” Given the significance
of the ESP textbooks in terms of their content features and components, this research question was
raised. To investigate it, first a repeated measure of ANOVA was run to probe any significant
differences between the teachers and students' evaluations of the contents in terms of general and
specific features. The F-observed value (Table 6) for the effect of the type of questionnaire is 2.67 (P =
.104 > .05). Based on these results, it can be concluded that the type of questionnaire does not have
any significant effect on the evaluations made by the teachers and students.
www.SID.ir
Archive
of S
ID
Abbasian and Mahdavi
58
Also, the F-observed value for comparing the grand means of the components of general and
specific features is 12.90 (P = .000 < .05). Based on these results, it can be concluded that there are
significant differences between the grand means of the components of content in terms of both general
and specific features.
Figure 2. Percentages of Teachers and Students' Views towards ESP Textbooks Based
on General Features
Table 6. Repeated ANOVA Components in Terms of General and Specific Features by Teachers and
Students
Effect Value F Hypothesis df Error df Sig. Partial Eta
Squared
QUESTIONNAIRE
Pillai's Trace .01 2.67a 1.00 202.00 .10 .01
Wilks' Lambda .98 2.67a 1.00 202.00 .10 .01
Hotelling's Trace .01 2.67a 1.00 202.00 .10 .01
Roy's Largest Root .01 2.67a 1.00 202.00 .10 .01
QUESTIONNAIRE
* GROUP
Pillai's Trace .00 .06a 1.00 202.00 .80 .00
Wilks' Lambda 1.00 .064a 1.00 202.00 .80 .00
Hotelling's Trace .00 .06a 1.00 202.00 .80 .00
Roy's Largest Root .00 .06a 1.00 202.00 .80 .00
COMPONENTS
Pillai's Trace .16 12.90a 3.00 200.00 .00 .16
Wilks' Lambda .83 12.90a 3.00 200.00 .00 .16
Hotelling's Trace .19 12.90a 3.00 200.00 .00 .16
Roy's Largest Root .19 12.90a 3.00 200.00 .00 .16
COMPONENTS *
GROUP
Pillai's Trace .00 .26a 3.00 200.00 .85 .00
Wilks' Lambda .99 .26a 3.00 200.00 .85 .00
Hotelling's Trace .00 .26a 3.00 200.00 .85 .00
Roy's Largest Root .00 .26a 3.00 200.00 .85 .00
QUESTIONNAIRE
* COMPONENTS
Pillai's Trace .02 1.48a 3.00 200.00 .22 .02
Wilks' Lambda .97 1.48a 3.00 200.00 .22 .02
Hotelling's Trace .02 1.48a 3.00 200.00 .22 .02
Roy's Largest Root .02 1.48a 3.00 200.00 .22 .02
QUESTIONNAIRE
* COMPONENTS *
GROUP
Pillai's Trace .03 2.46a 3.00 200.00 .06 .03
Wilks' Lambda .96 2.46a 3.00 200.00 .06 .03
Hotelling's Trace .03 2.46a 3.00 200.00 .06 .03
Roy's Largest Root .03 2.46a 3.00 200.00 .06 .03
www.SID.ir
Archive
of S
ID
JES, IAUSRB, 1(3), 51 -66, Summer 2011
59
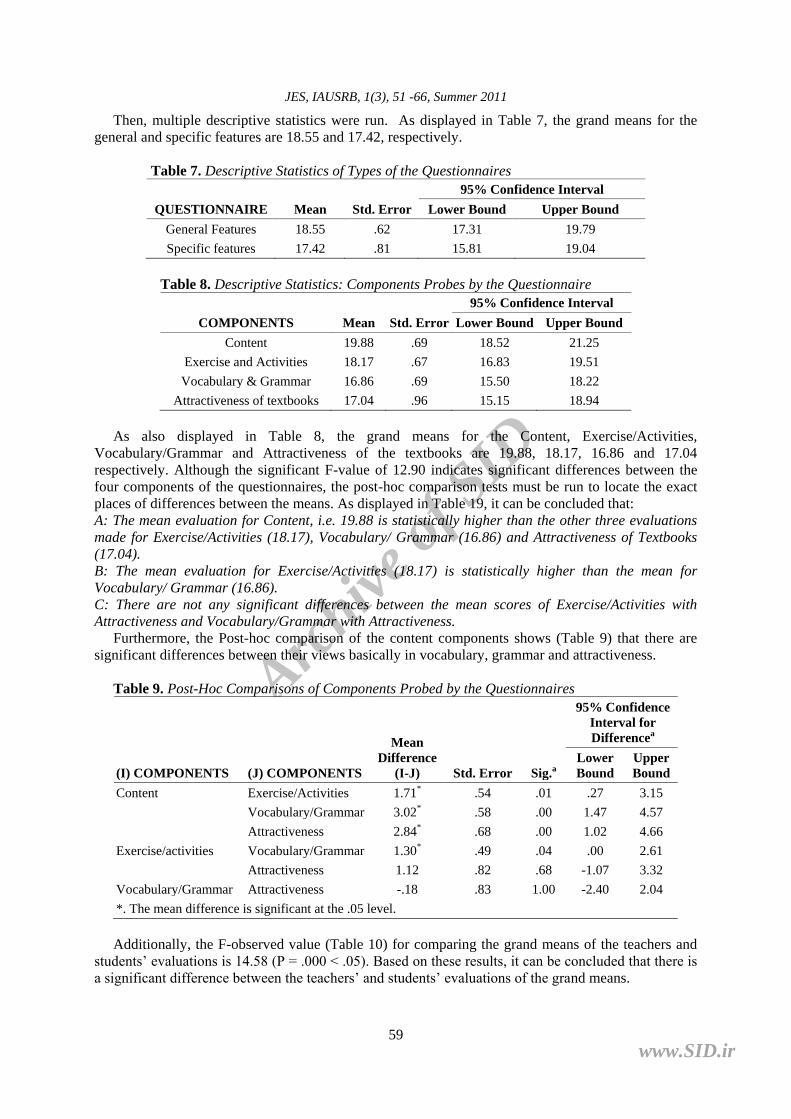
Then, multiple descriptive statistics were run. As displayed in Table 7, the grand means for the
general and specific features are 18.55 and 17.42, respectively.
Table 7. Descriptive Statistics of Types of the Questionnaires
QUESTIONNAIRE Mean Std. Error
95% Confidence Interval
Lower Bound Upper Bound
General Features 18.55 .62 17.31 19.79
Specific features 17.42 .81 15.81 19.04
Table 8. Descriptive Statistics: Components Probes by the Questionnaire
COMPONENTS Mean Std. Error
95% Confidence Interval
Lower Bound Upper Bound
Content 19.88 .69 18.52 21.25
Exercise and Activities 18.17 .67 16.83 19.51
Vocabulary & Grammar 16.86 .69 15.50 18.22
Attractiveness of textbooks 17.04 .96 15.15 18.94
As also displayed in Table 8, the grand means for the Content, Exercise/Activities,
Vocabulary/Grammar and Attractiveness of the textbooks are 19.88, 18.17, 16.86 and 17.04
respectively. Although the significant F-value of 12.90 indicates significant differences between the
four components of the questionnaires, the post-hoc comparison tests must be run to locate the exact
places of differences between the means. As displayed in Table 19, it can be concluded that:
A: The mean evaluation for Content, i.e. 19.88 is statistically higher than the other three evaluations
made for Exercise/Activities (18.17), Vocabulary/ Grammar (16.86) and Attractiveness of Textbooks
(17.04).
B: The mean evaluation for Exercise/Activities (18.17) is statistically higher than the mean for
Vocabulary/ Grammar (16.86).
C: There are not any significant differences between the mean scores of Exercise/Activities with
Attractiveness and Vocabulary/Grammar with Attractiveness.
Furthermore, the Post-hoc comparison of the content components shows (Table 9) that there are
significant differences between their views basically in vocabulary, grammar and attractiveness.
Table 9. Post-Hoc Comparisons of Components Probed by the Questionnaires
(I) COMPONENTS (J) COMPONENTS
Mean
Difference
(I-J) Std. Error Sig.a
95% Confidence
Interval for
Differencea
Lower
Bound
Upper
Bound
Content Exercise/Activities 1.71* .54 .01 .27 3.15
Vocabulary/Grammar 3.02* .58 .00 1.47 4.57
Attractiveness 2.84* .68 .00 1.02 4.66
Exercise/activities Vocabulary/Grammar 1.30* .49 .04 .00 2.61
Attractiveness 1.12 .82 .68 -1.07 3.32
Vocabulary/Grammar Attractiveness -.18 .83 1.00 -2.40 2.04
*. The mean difference is significant at the .05 level.
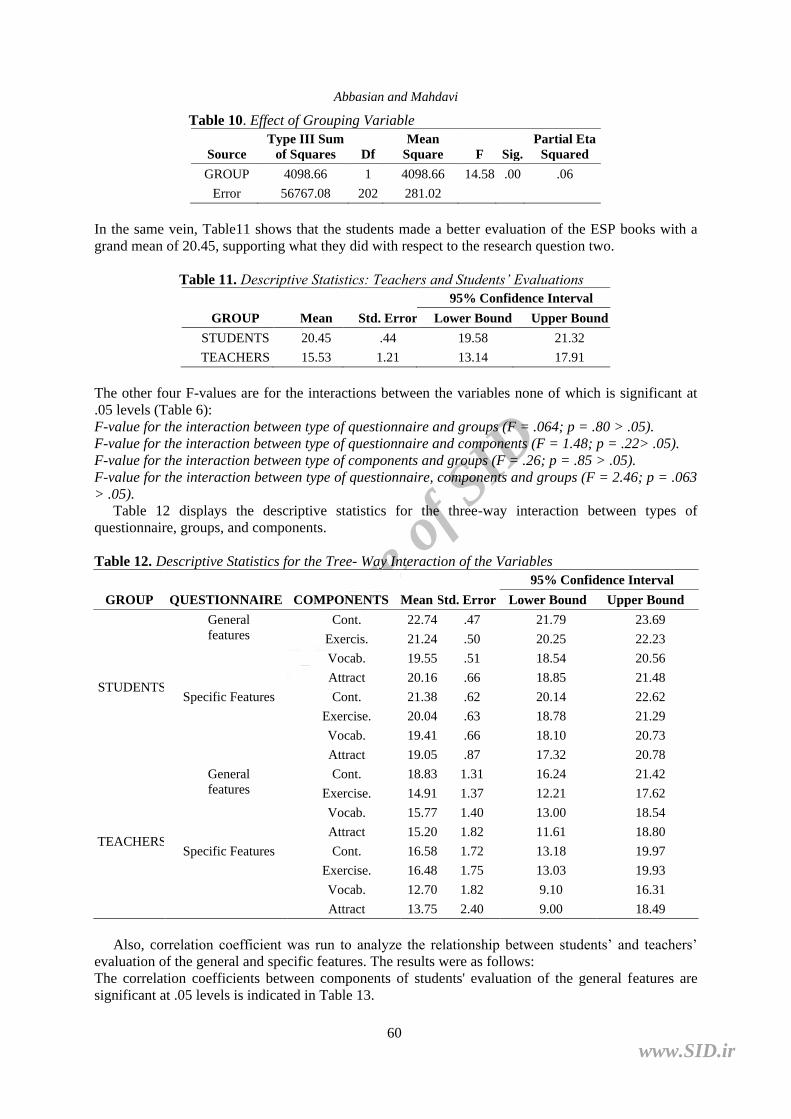
Additionally, the F-observed value (Table 10) for comparing the grand means of the teachers and
students’ evaluations is 14.58 (P = .000 < .05). Based on these results, it can be concluded that there is
a significant difference between the teachers’ and students’ evaluations of the grand means.
www.SID.ir
Archive
of S
ID
Abbasian and Mahdavi
60
Table 10. Effect of Grouping Variable
Source
Type III Sum
of Squares Df
Mean
Square F Sig.
Partial Eta
Squared
GROUP 4098.66 1 4098.66 14.58 .00 .06
Error 56767.08 202 281.02
In the same vein, Table11 shows that the students made a better evaluation of the ESP books with a
grand mean of 20.45, supporting what they did with respect to the research question two.
Table 11. Descriptive Statistics: Teachers and Students’ Evaluations
GROUP Mean Std. Error
95% Confidence Interval
Lower Bound Upper Bound
STUDENTS 20.45 .44 19.58 21.32
TEACHERS 15.53 1.21 13.14 17.91
The other four F-values are for the interactions between the variables none of which is significant at
.05 levels (Table 6):
F-value for the interaction between type of questionnaire and groups (F = .064; p = .80 > .05).
F-value for the interaction between type of questionnaire and components (F = 1.48; p = .22> .05).
F-value for the interaction between type of components and groups (F = .26; p = .85 > .05).
F-value for the interaction between type of questionnaire, components and groups (F = 2.46; p = .063
> .05).
Table 12 displays the descriptive statistics for the three-way interaction between types of
questionnaire, groups, and components.
Table 12. Descriptive Statistics for the Tree- Way Interaction of the Variables
GROUP QUESTIONNAIRE COMPONENTS Mean Std. Error
95% Confidence Interval
Lower Bound Upper Bound
STUDENTS
General
features
Cont. 22.74 .47 21.79 23.69
Exercis. 21.24 .50 20.25 22.23
Vocab. 19.55 .51 18.54 20.56
Attract 20.16 .66 18.85 21.48
Specific Features Cont. 21.38 .62 20.14 22.62
Exercise. 20.04 .63 18.78 21.29
Vocab. 19.41 .66 18.10 20.73
Attract 19.05 .87 17.32 20.78
TEACHERS
General
features
Cont. 18.83 1.31 16.24 21.42
Exercise. 14.91 1.37 12.21 17.62
Vocab. 15.77 1.40 13.00 18.54
Attract 15.20 1.82 11.61 18.80
Specific Features Cont. 16.58 1.72 13.18 19.97
Exercise. 16.48 1.75 13.03 19.93
Vocab. 12.70 1.82 9.10 16.31
Attract 13.75 2.40 9.00 18.49
Also, correlation coefficient was run to analyze the relationship between students’ and teachers’
evaluation of the general and specific features. The results were as follows:
The correlation coefficients between components of students' evaluation of the general features are
significant at .05 levels is indicated in Table 13.
www.SID.ir
Archive
of S
ID
JES, IAUSRB, 1(3), 51 -66, Summer 2011
61
Table 13. Pearson Correlations of Students' Evaluation of the General Features of
ESP Textbooks
GROUP VOCMIK EXMIK ATMIK
STUDENTS
CONTMIK
Pearson Correlation .46** .58** .41**
Sig. (2-tailed) .00 .00 .00
N 180 180 180
VOCMIK
Pearson Correlation .62** .41**
Sig. (2-tailed) .00 .00
N 180 180
EXMIK
Pearson Correlation .54**
Sig. (2-tailed) .00
N 180
Correlation coefficients between components of teachers' evaluation of the general features are
significant at .05 levels (Table14).
Table 14. Pearson Correlations of Teachers' Evaluation of the General Features of
ESP Textbooks
GROUP VOCMIK EXMIK ATMIK
Teachers
CONTMIK
Pearson Correlation .61** .54** .43*
Sig. (2-tailed) .00 .00 .03
N 24 24 24
VOCMIK
Pearson Correlation 1 .75** .72**
Sig. (2-tailed) .00 .00
N 24 24
EXMIK
Pearson Correlation .79**
Sig. (2-tailed) .00
N 24
Correlation coefficients between components of students’ evaluation of the specific features are
significant at .05 levels (Table 15).
Table 15. Pearson Correlations of Students’ Evaluation of the Specific Features of
ESP Textbooks
GROUP VOCMIK EXMIK ATMIK
STUDENTS
CONTMIK
Pearson Correlation .59** .44** .67**
Sig. (2-tailed) .00 .00 .00
N 180 180 180
VOCMIK
Pearson Correlation .62** .36**
Sig. (2-tailed) .00 .00
N 180 180
EXMIK
Pearson Correlation .27**
Sig. (2-tailed) .00
N 180
Correlation coefficients between components of teachers' evaluation of the specific features are
significant at .05 levels (Table 16).
www.SID.ir
Archive
of S
ID
Abbasian and Mahdavi
62
Table 16. Pearson Correlations of Teachers' Evaluation of the Specific Features
GROUP VOCMIK EXMIK ATMIK
Teachers
CONTMIK
Pearson Correlation .84** .61** .78**
Sig. (2-tailed) .00 .00 .00
N 24 24 24
VOCMIK
Pearson Correlation .68** .78**
Sig. (2-tailed) .00 .00
N 24 24
EXMIK
Pearson Correlation .60**
Sig. (2-tailed) .00
N 24
A paired-samples t-test was run to probe if there are any significant differences between the
students' evaluations on general and specific features. As displayed in Table 17 the t observed value
shows significant differences between the students' evaluations on general and specific features (t =
2.02; P = .045 < .05).
Table17. Paired-Samples T-Test Students' Evaluations on General and Specific Features
Paired Differences
t df Sig. (2-tailed) Mean
Std.
Deviation
Std. Error
Mean
95% Confidence Interval
of the Difference
Lower Upper
.95257 6.32 .47 .02 1.88 2.02 179 .04
As displayed in Table 18, the students’ evaluation on general features shows a higher mean, i.e.
20.92.
Table18. Descriptive Statistics: Students' Evaluations on General and Specific
Features
Mean N Std. Deviation Std. Error Mean
General
Features 20.92 180 5.79 .43
Specific
Features 19.97 180 7.34 .54
A paired-samples t-test was run to probe if there are any significant differences between the
teachers’ evaluations on general and specific features. As displayed in Table19, the t observed value
does not show significant differences between the teachers’ evaluations on general and specific
features (t = .98; P = .335> .05).
Table19. Paired-Samples T-Test Teachers' Evaluations on General and Specific Features
Paired Differences
t df Sig. (2-tailed) Mean Std. Deviation
Std. Error
Mean
95% Confidence Interval of
the Difference
Lower Upper
1.30 6.46 1.32 -1.43 4.03 .98 23 .33
As displayed in Table 20, the teachers’ evaluation on general and specific features is 16.18 and
14.88.
www.SID.ir
Archive
of S
ID
JES, IAUSRB, 1(3), 51 -66, Summer 2011
63
Table 20. Descriptive Statistics: Teachers' Evaluations on General and
Specific Features
Mean N Std. Deviation Std. Error Mean
General
Features 16.18 24 5.76 1.17
Specific
Features 14.88 24 8.92 1.82
An independent t-test was run to probe if there are any significant differences between the teachers’
and students’ evaluations on general features. As displayed in Table 21, the t observed value shows a
significant difference between the teachers and students’ evaluations on general features (t = 3.77; P =
.000< .05).
Table 21. Independent T-Test Teachers and Students' Evaluations on General Features
Levene's
Test for
Equality of
Variances t-test for Equality of Means
F Sig. T df
Sig.
(2-tailed)
Mean
Difference
Std. Error
Difference
95% Confidence Interval
of the Difference
Lower Upper
Equal variances
assumed .40 .52 3.77 202 .00 4.74 1.25 2.26 7.22
Equal variances not
assumed
3.78 29.54 .00 4.74 1.25 2.18 7.30
As displayed in Table 22, the students made a better evaluation on general features with a mean
score of 20.92, while the teachers’ mean score was 16.18.
Table 22. Descriptive Statistics: Teachers’ and Students' Evaluations on
General Features
Mean N Std. Deviation Std. Error Mean
STUDENTS 180 20.92 5.79 .43
TEACHERS 24 16.18 5.76 1.17
The teachers and students enjoy homogenous variances (Levene's F = .40; P = .52 > .05). That is
why the first row in Table 22 is reported.
An independent t-test was run to probe if there were any significant differences between the
teachers’ and students' evaluations on specific features. As displayed in Table23, the t-observed value
shows a significant difference between the teachers’ and students' evaluations on specific features (t =
3.10; P = .002< .05).
Table 23. Independent T-Test Teachers and Students' Evaluations on Specific Features
Levene's Test
for Equality
of Variances t-test for Equality of Means
F Sig. t df
Sig.
(2-tailed)
Mean
Difference
Std. Error
Difference
95% Confidence
Interval of the
Difference
Lower Upper
Equal variances assumed 1.65 .19 3.10 202 .00 5.09 1.63 1.86 8.32
Equal variances not assumed 2.67 27.31 .01 5.09 1.90 1.19 8.99
www.SID.ir
Archive
of S
ID
Abbasian and Mahdavi
64
As displayed in Table 24, the students made a better evaluation on the specific features with a
mean score of 19.97, while the teachers’ mean score is 14.88
Table 24. Descriptive Statistics: Teachers and Students’ Evaluations on
Specific Features
Mean N Std. Deviation Std. Error Mean
STUDENTS 180 19.97 7.34 .5
TEACHERS 24 14.88 8.92 1.82
The teachers and students enjoy homogenous variances (Levene's F = 1.65; P = .19> .05). That is
why the first row of Table 24 is reported.
Discussion The results of the present study showed that the two major groups involved in ESP textbooks (teachers
and learners) hold different approaches and perspectives about these books. Teachers are more
dissatisfied with them, whereas the learners showed more satisfaction. Also, speaking on the
component and content evaluation of these textbooks, teachers and students’ viewpoints are also
different.
The findings of the present study elaborate the results of Abbasian and Hassan-oghli (2011) which
indicate that teachers and learners hold different views on most areas and criteria related to the EFL
textbooks and their views are not much compatible. They also proved teachers are less satisfied with
textbooks than their learners.
Aligned with this study, Shahriari Ahmadi’s (2010) “A comparison of genre: Biological science
research article abstracts by Iranian and native English-speaking scholars” showed that Iranian writers
tend to focus on the methodology and procedure of the study, and pay little, if any, attention to relating
the findings to the outside world, or to solving a genuinely perceived problem. The study also
conducted interviews with Iranian researchers to investigate the reasons underlying such an
inclination. In the same vein, the participants’ perspectives may be attributed to the same approach
taken towards ESP textbook writing in Iran.
Furthermore, Tok’s (2010) study entitled “TEFL textbook evaluation: From teachers’ perspectives”
exactly matches the present study in title as well as the findings. His study aimed to examine the
advantages and disadvantages of one type of TEFL materials, English language textbook “Spot On,”
used in state primary schools in Turkey. In this research, the course book was evaluated in term of
layout and design, activities and tasks, language type, subject, content and skills and whole aspect. The
research revealed that ‘Spot On’ textbook actually did not stand up reasonably well to a systematic in-
depth analysis and that the negative attributes far out-weighed the positive characteristics. Similarly,
teachers were not satisfied with “Spot On” as they are not satisfied with the Iranian ESP textbooks in
general.
One reason for such findings may lie in the shortcoming in syllabus design and materials
preparation of ESP textbooks in Iran. Ajabshir (2011) indicated the major deficiencies are related to
the authors’ approach to language and methodology, lack of balance between language skills and
insufficient inclusion of communication activities. Also Zangani (2009) confirmed these findings by
criticizing Iranian ESP textbooks for being text-based and structural. He said the books hardly involve
students in developing language skills and communication ideas.
Another reason for the failure and faults of ESP textbooks which increases dissatisfaction among
their users can also be lack of students’ need analysis. When we do a critical analysis on the details of
the evaluation, it would be clear that as far as the Iranian ESP textbooks are concerned, both groups
are both satisfied and dissatisfied depending on the parameter type. Rezaei (2009) evaluated ESP
textbooks for Private Law students and showed that the results did not match up with the students’
needs. This result is partially in line with Jebahi’s (2009) study. The findings of his research showed
that learners are dissatisfied with topics, tasks, listening, pronunciation, how to take part in
conversation, skill coverage, skill integration, recycling, and revision of the textbooks and there is the
need to modify materials to suit the needs and levels of specific learners in specific situations.
www.SID.ir
Archive
of S
ID
JES, IAUSRB, 1(3), 51 -66, Summer 2011
65
Finally, Almazloum and Qeshta (2009) recommended establishing a follow-up research committee
whose duty is to apply formative and summative evaluation researches to achieve more innovations
and developments. Teachers are invited to attend workshops held by the Ministry of Education on new
trends in the area of curriculum and teaching and employ more effective methods such as group work,
teamwork, and cooperative learning methods.
Conclusion It can be concluded that the students have evaluated the ESP textbooks better than the teachers, and
the teachers’ views are more negative than those of the students in both general and specific features in
all four mentioned categories. So teachers and students’ views are not compatible; meanwhile,
regardless of teachers and learners’ separate perspectives to the ESP textbooks, when we look at the
issue in terms of content factor, the multiple statistical procedures show these two groups hold
different views on the textbooks in terms of the content, exercise/activities, vocabulary/grammar and
attractiveness. Therefore, there are significant differences between teachers and students’ evaluation of
the contents of the ESP textbooks. Therefore, the two groups of participants looked at the textbooks
differently. Teachers are more dissatisfied with ESP text books, while the learners are more or less
satisfied with them. Also, their views are different in terms of content factor of these books.
Pedagogically, both groups of participants are the representatives from the community of ESP
teachers and learners in Iran, and they send clear messages to policy makers and ESP textbook
developers to incorporate their ideas in planning and preparing ESP materials. According to
Tomlinson (2003) and Evans and St. John (1998), teachers and learners are valuable sources for ESP
textbook evaluation. The trend of teaching and learning system is leaning toward learners-centered
nowadays. So, the findings imply that the learners’ views should be sought in all areas of education
including materials selection, development, and adaptation.
Teachers’ attitudes can also be a valuable source for a better ESP materials planning as Evans and
St. John (1998) believed in the multi-dimensional roles of teachers in ESP courses. According to them,
teachers can act as course designer, researcher, collaborators, and evaluators. Therefore, their maxims
toward educational planning and material preparation should also be valued.
The findings can also be fruitful to ESP textbook developers and national language planners to
avoid centralized, pure theoretical and bench decisions for material preparation.
References Abbasian, Gh.R., & Hassan-oghli, E. (2011). Evaluation of Iranian EFL textbooks: A study of learner-
teacher’s criteria compatibility. The Iranian EFL Journal, 7(4), 176 – 202. Retrieved August, 2011,
from www.iranian-efl-journal.com/August-2011-Vol7-4.pdf. Ajabshir, Z. (2011). Evaluation of English for the students of management. The Iranian EFL Journal,
7(4), 72-91. Retrieved August, 2011, from www.iranian-efl-journal.com/August-2011-Vol7-4.pdf. Almazloum, M. Z., & Qeshta, A.(2009). Evaluating the content of English for Palestine, grade ten
textbook in the light of the standards for foreign language learning. Journal of Human Science, the
Islamic University of Gaza, 43, 1-27. Retrieved July, 2010, from
www.ejtemay.com/showthread.php? t =19521.
Barnard, R., & Zemach, D. (2003). Materials for specific purposes. In B. Tomlinson (Ed.), Developing
materials for language teachers (pp.306-325). London: Cromwell Press.
Brown, J. D. (2001). Using surveys in language programs. Cambridge, Cambridge University Press.
Carter, R., & Nunan, D. (2001). The Cambridge guide to teaching English to speakers of other
languages. Cambridge: Cambridge University Press.
Celce-Murcia, M. (Ed). (1991).Teaching English as a second or foreign language. (2nd ed.). Boston:
Heinle &Heinle.
Evans, T. D., & St. John, M.J. (1998). Developments in English for specific purposes: A
multidisciplinary approach. Cambridge: Cambridge University Press.
Genesee, F. (2001). Evaluation. In R.Carter & D. Nunan (Eds.), The Cambridge guide to teaching
English to speakers of other languages, (pp.144–150). Cambridge: Cambridge University Press.
Grant, N. (1987). Making the most of your textbook. London: Longman.
www.SID.ir
Archive
of S
ID
Abbasian and Mahdavi
66
Hutchinson, T., & Waters, A. (1987). ESP: A learning-centered approach. Cambridge: Cambridge
University Press.
Jebahi, Kh. (2009).Using a commercially developed ESP textbook: A classroom dilemma. The Asian
ESP Journal, 5(2), 75 - 92. Retrieved July, 2010, from www.asian-esp-journal.com/
August_2009_Ebook.pdf.
Rahimy, R. (2008). ESP, an evaluation of available textbooks: Medical Terminology. Unpublished
paper. Islamic Azad University, Tonekabon, Iran. Retrieved August, 2011, from www.esp-
world.info/Articles_17/PDF/Ramin_Rahimy.pdf.
Rezaei, S. (2009). ESP textbook evaluation: English for the students of private law. Paper presented at
the Annual TEFL and Literature Conference, University of Tehran, Tehran, Iran. Retrieved August,
2011, from http://atuir.academia.edu/ SaeedRezaei/Talks/33563/ESP_ Textbook_Evaluation_
English_for_the_Students_of_Private_Law.
Richards, J. C. (1996). Teachers’ maxims in language teaching. TESOL Quarterly, 30 (2), 281-296.
Richards, J. C. (2001). Curriculum development in language education. Cambridge: Cambridge
University Press.
Richards, J. C., & Renandya, W. A. (2002). Methodology in language teaching: An anthology of
current practice. Cambridge: Cambridge University Press.
Shahriari Ahmadi, H. (2010). A comparison of genre: Biological science research article abstracts by
Iranian and native English speaking scholars. The Asian ESP Journal, 5(2), 107-120. Retrieved
July, 2010, from www.asian-esp-journal.com/ August_2009_Ebook.pdf.
Tok, H. (2010). TEFL textbook evaluation: From teachers’ perspectives. Educational Research and
Review, 5 (9), 508-517. Retrieved August, 2011, from http://www.academicjournals.org/ERR2.
Tomlinson, B. (Ed.). (1998). Materials development in language teaching. Cambridge: Cambridge
University Press.
Tomlinson, B. (2003). Developing materials for language teaching. London: Cromwell Press.
Zangani, E. (2003). Evaluation of ESP textbooks in humanities in the undergraduate program of
Iranian universities. Unpublished master’s thesis, Islamic Azad University, Science and Research
Branch, Tehran, Iran.
Zangani, E. (2010). The ESP textbook problem: The evaluation of ESP textbooks in humanities in the
undergraduate program of Iranian universities. The Asian ESP Journal, 5(2), 93-106. Retrieved
July, 2010, from www.asian-esp-journal.com/ August_2009_Ebook.pdf
Authors Gholam-Reza Abbasian is an assistant professor of TEFL at Imam Ali University and IAU (South
Tehran Branch) and has been teaching English for more than 15 years at various levels. He has
presented at both national and international conferences. He is also the author and translator of several
books, and has published scholarly articles in referred academic journals. He has been designated as
the top scholar for five consecutive years and the most successful teacher in 2011. He is also a
member of editorial board of Journal of Social Science and Interdisciplinary Research (JSSIR) of NED
University of Engineering and Technology
Anahita Mahdavi is an M.A. holder in TEFL from IAU, South Tehran Branch. She has been teaching
English for some years at University of Applied Science and Jihad-Daneshgahi. Her main areas of
research interest are syllabus design and materials development and evaluation.
www.SID.ir