Evaluation of Green Buildings' Overall Performance through in Situ Monitoring and Simulations
23
Energies 2013, 6, 6525-6547; doi:10.3390/en6126525 energies ISSN 1996-1073 www.mdpi.com/journal/energies Article Evaluation of Green Buildings’ Overall Performance through in Situ Monitoring and Simulations Francesco Asdrubali *, Cinzia Buratti, Franco Cotana, Giorgio Baldinelli, Michele Goretti, Elisa Moretti, Catia Baldassarri, Elisa Belloni, Francesco Bianchi, Antonella Rotili, Marco Vergoni, Domenico Palladino and Daniele Bevilacqua CIRIAF (Inter-University Research Center on Pollution and Environment “Mauro Felli”), University of Perugia, Via G. Duranti, Perugia 67 06125, Italy; E-Mails: [email protected] (C.B.); [email protected] (F.C.); [email protected] (G.B.); [email protected] (M.G.); [email protected] (E.M.); [email protected] (C.B.); [email protected] (E.B.); [email protected] (F.B.); [email protected] (A.R.); [email protected] (M.V.); [email protected] (D.P.); [email protected] (D.B.) * Author to whom correspondence should be addressed; E-Mail: [email protected]; Tel.: +39-075-5853717; Fax: +39-075-5853697. Received: 10 October 2013; in revised form: 4 December 2013 / Accepted: 5 December 2013 / Published: 17 December 2013 Abstract: The evaluation of the overall performance of a green building is complex, since many construction, energy and environmental aspects have to be considered. The Umbria Region in Italy, through various public tenders, recently funded several residential buildings, innovative in terms of construction quality, green technologies and sustainable solutions, such as natural building materials, integrated sunspaces, PV (photovoltaic) modules and solar collectors, geothermal heat pumps, that had to be adopted to obtain the public contribution. The University of Perugia carried out an extended monitoring of these buildings, in order to verify the actual achievement of design objectives, to certify the real savings in terms of energy and environmental loads and to assess the indoor comfort conditions for occupants. In situ thermal, acoustical and lighting measurements were carried out for more than one year. Energy simulations were performed by means of codes which implement the algorithms required by the Italian Law. Moreover, a comparison between real consumptions and simulated energy requirements was carried out. Finally, the buildings were characterized from the environmental sustainability point of view, using the method adopted by the Umbria Region. This assessment was borrowed from ITACA (Institute for Innovation and Transparency in Government Procurement and Environmental Compatibility) OPEN ACCESS
Transcript of Evaluation of Green Buildings' Overall Performance through in Situ Monitoring and Simulations

Energies 2013, 6, 6525-6547; doi:10.3390/en6126525
energies ISSN 1996-1073
www.mdpi.com/journal/energies
Article
Evaluation of Green Buildings’ Overall Performance through in Situ Monitoring and Simulations
Francesco Asdrubali *, Cinzia Buratti, Franco Cotana, Giorgio Baldinelli, Michele Goretti,
Elisa Moretti, Catia Baldassarri, Elisa Belloni, Francesco Bianchi, Antonella Rotili,
Marco Vergoni, Domenico Palladino and Daniele Bevilacqua
CIRIAF (Inter-University Research Center on Pollution and Environment “Mauro Felli”),
University of Perugia, Via G. Duranti, Perugia 67 06125, Italy; E-Mails: [email protected] (C.B.);
[email protected] (F.C.); [email protected] (G.B.); [email protected] (M.G.);
[email protected] (E.M.); [email protected] (C.B.); [email protected] (E.B.);
[email protected] (F.B.); [email protected] (A.R.); [email protected] (M.V.);
[email protected] (D.P.); [email protected] (D.B.)
* Author to whom correspondence should be addressed; E-Mail: [email protected];
Tel.: +39-075-5853717; Fax: +39-075-5853697.
Received: 10 October 2013; in revised form: 4 December 2013 / Accepted: 5 December 2013 /
Published: 17 December 2013
Abstract: The evaluation of the overall performance of a green building is complex, since
many construction, energy and environmental aspects have to be considered. The Umbria
Region in Italy, through various public tenders, recently funded several residential buildings,
innovative in terms of construction quality, green technologies and sustainable solutions,
such as natural building materials, integrated sunspaces, PV (photovoltaic) modules and
solar collectors, geothermal heat pumps, that had to be adopted to obtain the public
contribution. The University of Perugia carried out an extended monitoring of these
buildings, in order to verify the actual achievement of design objectives, to certify the real
savings in terms of energy and environmental loads and to assess the indoor comfort
conditions for occupants. In situ thermal, acoustical and lighting measurements were carried
out for more than one year. Energy simulations were performed by means of codes which
implement the algorithms required by the Italian Law. Moreover, a comparison between real
consumptions and simulated energy requirements was carried out. Finally, the buildings
were characterized from the environmental sustainability point of view, using the method
adopted by the Umbria Region. This assessment was borrowed from ITACA (Institute for
Innovation and Transparency in Government Procurement and Environmental Compatibility)
OPEN ACCESS

Energies 2013, 6 6526
procedure [an Italian procedure similar to Leadership in Energy and Environmental Design
(LEED)] and consists of 20 worksheets, one for each different performance indicator, at the
aim of carefully describing the environmental quality of the building.
Keywords: green buildings; overall building performance; thermal performance;
acoustic performance; lighting performance; thermal comfort; energy consumptions;
renewable energies
Nomenclature:
ARPA Agenzia Regionale per la Protezione Ambientale (Regional
Environmental Protection Agency)
BREEAM Building Research Establishment Environmental Assessment
Method
clo clothing unit (1 clo = 0.155 m2·K/W)
D2m,nT,w façade acoustic insulation index (dB)
DF average indoor daylight factor (%)
E average indoor illuminance (lux)
Emin minimum indoor illuminance (lux)
E0 average outdoor illuminance (lux)
HVAC Heating, Ventilation and Air Conditioning
Icl thermal resistance of clothing (m2·K/W)
L average indoor luminance (cd/m2)
LASmax A-weighted maximum sound pressure level (Slow-time weighting)
[dB(A)]
Lb ÷ s,light ÷ dark maximum ÷ minimum indoor luminance of background ÷
surrounding areas (cd/m2)
LCA Life Cycle Assessment
LEED® Leadership in Energy and Environmental Design
L’nw impact sound pressure level index (corrected with the reverberation
time) (dB)
Lvo average indoor luminance of visual object area (cd/m2)
met metabolism unit (1 met = 58.2 W/m2)
PMV Predicted Mean Vote
PPD Predicted Percentage of Dissatisfied (%)
R’w weighted sound insulation index (dB)
Sw window area (m2)
Sf floor area (m2)
Sw/Sf Window-to- floor area ratio
U0 illuminance uniformity

Energies 2013, 6 6527
1. Introduction
The building sector is receiving a great attention worldwide since its energy consumption and
greenhouse gas emissions represent 40% and 33% of the total quantities, respectively, both in
developed and developing countries [1]. Besides, the construction segment is expected to grow
continuously in the next decades, being at the same time one of the most promising sectors in terms of
mitigation potential. The green or sustainable buildings concept is therefore becoming more and more
popular, despite the difficulties of finding a univocal definition [2]; numerous protocols already exist,
such as Building Research Establishment Environmental Assessment Method (BREEAM) [3], ITACA
(Institute for Innovation and Transparency in Government Procurement and Environmental
Compatibility) [4] and Leadership in Energy and Environmental Design (LEED) [5], and many others
approaches are in way of definition, such as Life Cycle Assessment (LCA) applied to buildings [6].
The common idea consists of guaranteeing a high environmental performance through a holistic
approach, including various aspects such as proper orientation, choice of sustainable materials [7,8],
advanced plants technologies, good indoor comfort, low environmental impact and reduced natural
resources depletion. A low primary energy consumption, therefore, represents a fundamental, but not
unique, aspect to be considered for green buildings design and evaluation [9,10].
Within this framework, an extended study was carried out by CIRIAF (Inter-University Research
Center on Pollution and Environment “Mauro Felli”) (University of Perugia), aimed at monitoring a
long-term action of Umbria Region that, by means of the Annual Operational Program 2005, 2006 and
2008 [11], issued three calls for incentives addressed to construction sector companies. The calls
promoted the implementation of measures for testing solutions in the field of green architecture and
energy saving. The economic contributions were given directly to the final buyers of the flats, which
were helped to offset the additional costs paid for the higher energy and environmental quality of
the dwellings.
The study started with a preliminary phase consisting of acquiring the project documentation,
identifying the most significant interventions in terms of green construction and on-site inspections
during the process work and acquisition of certificates for materials and building components.
Afterwards, the measurements for the performance evaluation were implemented: micro-climatic
and indoor air quality measurements, in-situ envelope transmittance assessment aided by a preliminary
infrared thermography analysis, acoustic, lighting and electromagnetic measurements, and the
quantification of the presence of radon. Furthermore, a procedure was implemented for the simulation
of the energy performance, which includes the contribution of renewable energy systems. Finally, real
water, gas, and electricity consumptions were recorded and compared with simulated values, along
with a cost-benefit analysis.
The peculiar characteristic of the study stands on the involvement of a large number of analyzed
buildings, covering several different construction techniques; besides, an original elaboration of the
information gathered is proposed and a critical analysis of the results is also implemented, trying to
classify and to compare all the aspects under evaluation, aiming to give a complete assessment of the
green buildings performance.

Energies 2013, 6 6528
2. Description of the Buildings
Among all the investigated interventions, nine buildings were chosen as the most representative of
all the constructions proposed. In each building, sample flats were chosen to carry on the in situ
measurements and the performance evaluation. The buildings’ typology and construction data are
summarized in Table 1.
Table 1. Typological and construction data of the investigated buildings.
Building No. 1 2 3 4 5 6 7 8 9
Typology Apartment
building
Multi-family
houses
Apartment
building
Multi-family
houses
Multi-family
houses
Apartment
building
Apartment
building
Multi-family
houses
Multi-family
houses
Shape Elongated Rectangular Rectangular Rectangular Rectangular Rectangular Rectangular Rectangular Elongated
N. floors Three/four Two/three Two/three Three Two/three Three/four Two Two Three
N. units 19 25 12 21 19 12 12 20 12
Net floor area (m2) 1442 1769 780 1776 1580 865 960 1490 1464
Envelope/external
walls
Bricks
facades and
plastered
walls
Brick
masonry
cavity walls
Brick
masonry
cavity walls
Brick
masonry
cavity walls
Plastered walls
Bricks
facades and
plastered
walls
Bricks and
plastered
walls
Brick
masonry
cavity walls
Brick
masonry
cavity walls
External wall
thermal insulation
Glass
wool
Glass
wool
Glass
wool
Glass
wool
Thermal
cork-based
plaster
Panel in
wood-wool
cement
Panel in
wood-wool
cement
Glass wool Cork
Building 1 It has three/four-storeys and a basement; it is rectangular, with an elongated shape and
its long axis runs north-east/south-west (Figure 1a). It is divided into 19 apartments
(flats and duplex apartments).
Building 2 It is made up by a group of three similar rectangular buildings with different
orientations, facing a large courtyard towards the South direction (Figure 1b). It
includes 25 apartments.
Building 3 The central body is a three-storey building with a mono-pitched roof; the other
two-storey buildings have a flat roof. (Figure 1c) It is divided into 12 apartments.
Building 4 It is realized by three similar buildings with the long axis running east/west (Figure 1d).
Each building has two apartments on the ground floor, three apartments on the first
floor and two apartments on the second floor.
Building 5 It is constituted by three rectangular buildings made of brick masonry walls coating
with plaster, reinforced concrete basement and a tiled gable-roof (Figure 1e).
Building 6 The structure is similar to the one of building 1 (Figure 1f).
Building 7 It is a split-level building with two/three stages and a basement, rectangular shaped
(Figure 1g). The last two floors host duplex apartments. The top-floor has a
mono-pitched roof and apartments on the first floor are provided with a roof garden.
Building 8 This compound consists of five similar buildings. Each building has two stages above
the ground and a basement (Figure 1h). It is divided into two apartments on the ground
floor and two apartments on the first floor.

Energies 2013, 6 6529
Building 9 The three-storey building has an elongated shape, with its long axis running east/west
(Figure 1i). It has wooden porches attached to the building skin facing the south
direction. It is divided into 12 apartments: flats on the ground floor (527 m2) and duplex
apartments on the first floor with attic (937 m2).
The examined buildings present interesting features, such as sunspaces (over 50% of the
investigated situations), sustainable insulation materials (wood in 1/3 of the cases), and solar shadings
(about 50% of the cases) [12]. All the buildings are provided with under-floor heating systems, seven
of them are provided with rain water recovery systems. Most of the buildings are integrated with PV
modules and/or solar collectors, some of them are also equipped with geothermal heat pumps.
Figure 1. (a) Building 1; (b) Building 2; (c) Building 3; (d) Building 4; (e) Building 5;
(f) Building 6; (g) Building 7; (h) Building 8; and (i) Building 9.
(a) (b) (c)
(d) (e) (f)
(g) (h) (i)
3. Simulations: Methodology and Description of the Codes
The energy analysis of buildings through simulations is possible by means of different
methodologies: some of them use simplified energy analysis tools, with a quick evaluation of the
annual energy consumption, others use more detailed analysis based on dynamic algorithms [13–15].
In this study, the primary energy consumptions for heating, cooling, and domestic hot water
production were estimated by the code MC4 Suite [16], that follows the calculation algorithms
proposed by the European Standard on energy certification: EN ISO 13790:2008 [17] based on a
quasi-steady-state monthly method. As stated in the European Directive 2002/91/CE [18] and other

Energies 2013, 6 6530
Italian Laws [19], buildings can be classified according to their energy performance during winter and
summer seasons (Figure 2).
As reported in the UNI/TS 11300-1 [20], the inner air temperature was set to 20 and 26 °C, for
winter and summer conditions respectively; the weather external conditions (temperature and solar
radiation) were taken from UNI 10349 [21]; the standard conditions of convective heat exchange on
the external wall were calculated according to EN ISO 6946 [22]. Moreover, all internal heat gains such
as rate of occupation, lights and other devices were defined according to the European Standard [17].
The buildings performance for winter season was calculated also considering the generation and
distribution heating system, as required by UNI/TS 11300-2 [20] that describes the calculation method
to evaluate primary energy need and system efficiencies for space heating and domestic hot water
production. All the buildings analyzed have floor heating system but different heat generation plants:
condensing boiler, heat pump and geothermal heat pump. On the other hand, for summer season,
simulations considered only the envelope performance.
Figure 2. Model of buildings in MC4 Suite and Energy Building Classification.
Some buildings include special elements aimed to improve the energy performance such as
sunspaces, solar thermal and photovoltaic plants; their contribution was simulated by means of
different software packages and methodologies. The 5000 Method was adopted to evaluate the solar
passive systems [23]; the methodology divides the overall energy contribution of the sunspace to the
heating of the adjacent room into four different solar gains: the solar radiation that penetrates directly
into the room through its window after having passed through the sunspace, the thermal radiation
stored in the opaque wall between the room and the sunspace due to the solar radiation incident on the
wall, which is reduced by the presence of the sunspace, and the “buffer effect” due to the warm air
contained in the sunspace; the pre-heating of ventilating air that passes through the sunspace increases
its temperature. Solarius T and Solarius PV [24,25] were used for the evaluation of the plants
efficiency (solar thermal and photovoltaic plants). These software packages allow the evaluation of the
main plants output after defining all parameters: number and characteristics of the modules,
geographical site, orientation of the modules and all components that define the two systems. Both
software packages use weather data taken from UNI 10349 [21] and other technical Standards specific
for the assessment of the solar energy received [26]; of course the energy provided by solar thermal
and photovoltaic plants improves the performance of the energy generation systems.

Energies 2013, 6 6531
4. In Situ Monitoring Methodology
4.1. Infrared Analysis and Thermal Transmittance Measurements
The evaluation of the thermal resistance of walls is very important for buildings thermal analyses [13].
The thermal properties of a building component can be evaluated by theoretical calculations (according
to EN ISO 6946 [22]), by laboratory measurements (according to EN 8990 [27–29] and EN 1934),
or by in-situ measurements (according to ISO 9869 [30]).
In general, the thermal transmittance values evaluated by in-situ measurements result higher than
the ones obtained by theoretical calculations.
The latter are useful to assess quickly the thermal performance of the building envelope, but they do
not usually define the real thermal behavior that instead in-situ measurement can show [31].
According to the ISO 9869, in order to consider the transient effects (storage and release of energy)
induced in the wall, the average values of heat flow and temperatures are used, instead of the
instantaneous values, evaluated over a sufficiently long period (average method [32–34]). The heat
flow passing through the sample and the temperatures (surface or air) of the internal and external side
of the measurement area should be acquired to evaluate the in-situ thermal transmittance. In order to
perform the measurement, it is necessary to provide a heat flow meter (internal side) and at least two
temperature sensors for each side. The temperature probes are usually installed on the surface of the
sample, so that the measuring parameter is the conductance of the wall. Thermal transmittance is
calculated by means of Standard heat convective coefficients [22].
Before the execution of the in-situ thermal transmittance measurements, it is therefore necessary to
investigate the wall by infrared thermography, in order to avoid placing the sensors in correspondence
of thermal bridges or defects in the envelope. Furthermore, infrared analysis results useful to assess the
conditions of the overall building and to conduct a survey of building elements.
4.2. Indoor Air and Comfort Analysis
The indoor measurement sessions were carried out in winter and summertime for each building,
trying to obtain an overall assessment of the comfort situation. It is necessary to consider that everyone
inside its house administrates the technological systems in a different way, everyone manages
windows or sunscreen openings in their own way, as well as the domestic hot water consumption; all
these factors contribute to involve a high number of variables. Two multichannel systems (Figure 3)
linked to different probes (in compliance with UNI EN ISO 7726 standard) [35] were used to get the
instrumental data set, which were post-processed to obtain the classical comfort indexes PMV and
PPD [36], according to UNI EN ISO 7730 [37,38]. Moreover, the measurement station was equipped
with local discomfort probes: draft risk percentage of dissatisfied, floor temperature, vertical
temperature gradient (between ankle and neck), and radiant asymmetry. The following values of
metabolism and thermal clothing insulation were assumed: all people did light work such as domestic
tasks, so the activity level was supposed equal to 70 W/m2 (1.20 met). Two configurations for males
and females were considered in terms of Icl: summer male clothing was supposed of 0.70 clo, while
female clothing was 0.50 clo. Winter clothing was 1.20 for male and 1.05 clo for female; finally,
spring and autumn clothing was 0.98 clo for men and 0.88 for women [39,40]. The measurement

Energies 2013, 6 6532
points were chosen for each room considering the inhabitants positions and the placement of cold or
warm vertical and horizontal surfaces (for instance windows and skylights [41,42]). The selected
rooms, mainly living rooms or bedrooms, were chosen as the most representative situations for the
normal use conditions. The measurement sessions lasted one week for each apartment, with an
acquisition rate of ten minutes. In the other rooms, the indoor conditions were controlled by stand-
alone programmable sensors (Figure 4b). In order to have a complete view of the situation, each
survey was linked to the external conditions of temperature and relative humidity. UNI EN ISO 7730
(Annex A) [37] classifies the rooms into three categories according to PMV and PPD: the A category
includes PPD < 6% while PMV is in the −0.2 ÷ +0.2 range; for the B category PPD < 10% and
PMV = −0.5 ÷ +0.5; finally, for the C category PPD < 15% and PMV = −0.7 ÷ +0.7.
Figure 3. (a) Multi channel systems and probes during the acquisition in a selected room;
and (b) temperature and relative humidity sensors (red circle) in other rooms.
(a) (b)
4.3. Lighting Measurements
Suitable lighting conditions enable people to perform visual tasks [43]; hygiene, health and energy
saving requirements [44–48] recommend the use of daylight in residential buildings. In green buildings,
particular attention is therefore given to daylighting to maximize visual comfort and energy efficiency.
A preliminary survey of the rooms selected as representatives of the tested apartments was
necessary to check the size and the position of windows, light sources and furniture. After identifying
the main visual tasks, a grid was traced for the measurements, according to standard values of point
spacing [43]. The following parameters were measured in the tested rooms, switching off the electric
lighting sources (Figure 4): illuminance E (lux) due to daylight, both in winter and summer conditions
(at the same time the outdoor illuminance was also measured), luminance L (cd/m2) due to daylight,
window and floor areas Sw and Sf (m2).
Illuminance and luminance were also measured in artificial lighting condition, shielding the
daylight, to give a comprehensive overview of visual comfort inside the buildings.
Finally, the collected data were processed to calculate the reference indicators, adopted to assess
both the indoor daylight and the artificial lighting performance. Results were compared with regulatory
requirements [43,46] (see Table 2).

Energies 2013, 6 6533
Table 2. Main indicators and limit values concerning indoor lighting performance.
Indicators Quantity Description
Statutory and
regulatory
requirements
Average daylight
factor
DF = (E/E0)
× 100 (%)
E = average indoor illuminance on reference working
planes; E0 = simultaneous average outdoor illuminance
from the unobstructed sky, excluding direct sunlight
≥DFlim = 2%
Window-to- floor
area ratio Sw/Sf Daylight ≥1/8
Luminance ratio and
distribution Lvo/Lx,y
Lvo = average indoor luminance of visual object area;
Lx,y = Lb ÷ s,light ÷ dark = maximum ÷ minimum indoor
luminance of background ÷ surrounding areas
≥ or ≤ (Lvo/Lx,y)lim
according to areas
Average illuminance E (lux) Artificial lighting ≥Elim (lux) according
to visual tasks
Illuminance uniformity U0 = Emin/E Artificial lighting: Emin = minimum indoor illuminance ≥0.8
Figure 4. Experimental lighting measurements: (a) illuminance measurements by an
illuminance-chroma-meter; (b) luminance measurements by a luminance-meter; and
(c) grid for the measurements, main visual tasks (hatched area) and position of light source
(L) and windows (F) in a monitored room in Building 6.
(a) (b) (c)
4.4. Acoustic Measurements
Noise affects health in terms of physical and psychological effects [49], becoming a primary issue
when inadequate sound insulation conditions in buildings influence the well-being of occupants.
Therefore, local building regulations introduced sound insulation requirements in order to improve
acoustical comfort in dwellings [50,51]. National building regulations specify requirements for
buildings in terms of airborne and impact sound insulation from traffic noise (roads, railways, airports)
and service equipment. In Italy, specific requirements depending on the building type (dwellings,
school, hospital, commercial buildings, etc.) were introduced since 1997 [52]. Sound insulation and
indoor acoustic comfort conditions were analyzed in all the investigated buildings by means of field
measurements, according to specific technical standards [52–55]; results were compared to the limits
given by legislation requirements. In order to evaluate airborne and impact sound insulation properties
of buildings elements, the descriptors (single-number indexes) defined in ISO 717 [54], and reported in
Table 3 were used. Figure 5 shows the experimental equipment during the tests: a loudspeaker was

Energies 2013, 6 6534
used as an artificial sound source, which can simulate external noise for the estimation of airborne
sound insulation of façades [53] (Figure 5a).The tapping machine showed in Figure 6c was used for
the evaluation of the impact sound insulation between dwellings [53].
Table 3. Main descriptors and limit values [50].
Descriptor Quantity Description Reference
Technical Standard
Statutory
requirements limit
Airborne sound
insulation between rooms
(in different dwellings)
R’w Weighted Sound Insulation Index ISO 140-4
ISO 717-1 ≥50 dB
Facade sound insulation D2m,nT,w Façade acoustic insulation index ISO 140-5
ISO 717-1 ≥40 dB
Impact sound
insulation of floors L’nw
Impact sound pressure level index
(corrected with the reverberation time)
ISO 140-7
ISO 717-2 ≤63 dB
Noise from building
service equipment LASmax
A-weighted maximum sound pressure
level (Slow-timeweighting)
ISO 16032
ISO 717-1 ≤35 dB (A)
Figure 5. Experimental acoustic campaign in the investigated buildings: (a) façade sound
insulation; (b) airborne sound insulation between rooms; and (c) impact sound insulation
of floors.
(a) (b) (c)
Moreover, measurements of sound pressure level from service equipments (discontinuously
working systems, discharge units of toilets) were carried out according to ISO 16032 [56]. For all the
investigated buildings, at least one measurement for each descriptor was carried out. The investigated
rooms, mainly living rooms or bedrooms, were chosen as the most representative situations. In some
cases, the descriptor was evaluated for different situations: for instance, in dwellings with different kinds
of floor (ceramic tiles or wood parquet), the impact sound pressure level L’nw was measured in both
cases and the highest value (the worst situation for people, typically ceramic tiles) was considered in
the results.
4.5. Real Energy and Water Consumptions
Real energy and water consumptions were analyzed in all the investigated buildings, in order to
evaluate their actual performance. For each building some sample flats were chosen. The methodology
of the consumptions data acquisition is based on the Italian standard UNI/TS 11300 [20].

Energies 2013, 6 6535
The analysis of the real consumptions was carried out monitoring periodically the energy and the
water meters; the consumptions data were also provided by occupants and building managers. The
heating energy consumptions in winter and the energy spent for production of domestic hot-water and
cooking were separately counted. Energy consumptions for winter heating were obtained trough
gas-meters or heat meters in case of central heating systems. Italian Standards impose different
conventional heating periods, considering different Italian localities; the investigated buildings are
located in the D and E Italian climatic zones, with a heating period that ranges respectively from
1 November to 15 April and from 15 October to 15 April. Electricity energy consumptions were
gathered trough electronic meters and water consumptions were collected through flow meters.
Based on the reading of the meters, the difference between recorded values at the beginning and at
the end of the monitoring period represented the amount of natural gas, electricity and water supplied
in each flat.
5. Results and Discussion
5.1. Infrared Analysis and Thermal Transmittance Measurements
Figure 6 shows several typologies of analysis aimed at verifying some aspects of the buildings.
Thermograms can show, for instance, the thermal behaviour of windows (Figure 6a), doors, thermal
bridges (Figure 6b) [19], air leakages, and HVAC systems (Figure 6c).
Figure 6. Infrared images of monitored buildings. (a) Windows; (b) Thermal bridges;
(c) HVAC systems Under-floor heating systems.
(a) (b) (c)
Infrared analysis supports in situ thermal transmittance measurement to install sensors on the wall,
in order to avoid particular thermal fields due to thermal bridges or defects. Furthermore, the correct
evaluation of the temperatures is useful to avoid the sun direct radiation on the external side of the wall
during the measurement campaign; the heat flow-meter on the internal side has also to be shielded and
the difference between the internal and the external temperatures should be at least 10 K. The
acquisition period considered in these experimental campaigns is seven days, according to the
recommendations of the Standards. Figure 7 shows one example of in situ thermal transmittance
measurement conducted in one of the buildings. The main feature of these measurements is the
unsteady-state of external temperatures trend due to the night-day alternation, while the internal
temperature remains quite steady around 18 °C. The trend of the heat flux is strongly linked to the
temperature difference between internal and external conditions; it shows the delay of thermal flux that
reaches his maximum value of the day (probe installed on the internal side) some hours later than the

Energies 2013, 6 6536
temperature difference peak between internal and external conditions. The specific wall studied is
exposed towards north-east and it is not directly struck by solar radiation; in this specific case, the
theoretical thermal transmittance of the wall studied results equal 0.39 W/m2·K while the thermal
transmittance measured is equal 0.44 W/m2·K.
Figure 7. Trends of internal and external temperature (a) and heat flux during (b) the
in-situ thermal transmittance measurement.
(a)
(b)
5.2. Comfort Analysis
During the measurement campaigns, no guidance was given to the owners in order to obtain a
standard evaluation, so everyone administrated their own house in an independent way. The comfort
analysis is strictly related to inhabitants’ routine in the heating system management, temperature
settings and duration of heating period in the day. The natural ventilation during autumn or winter has
270
275
280
285
290
295
K
Internal Temperature
External Temperature
2
3
4
5
6
7
8
W/m
2
Flux
Energies 2013, 6 6537
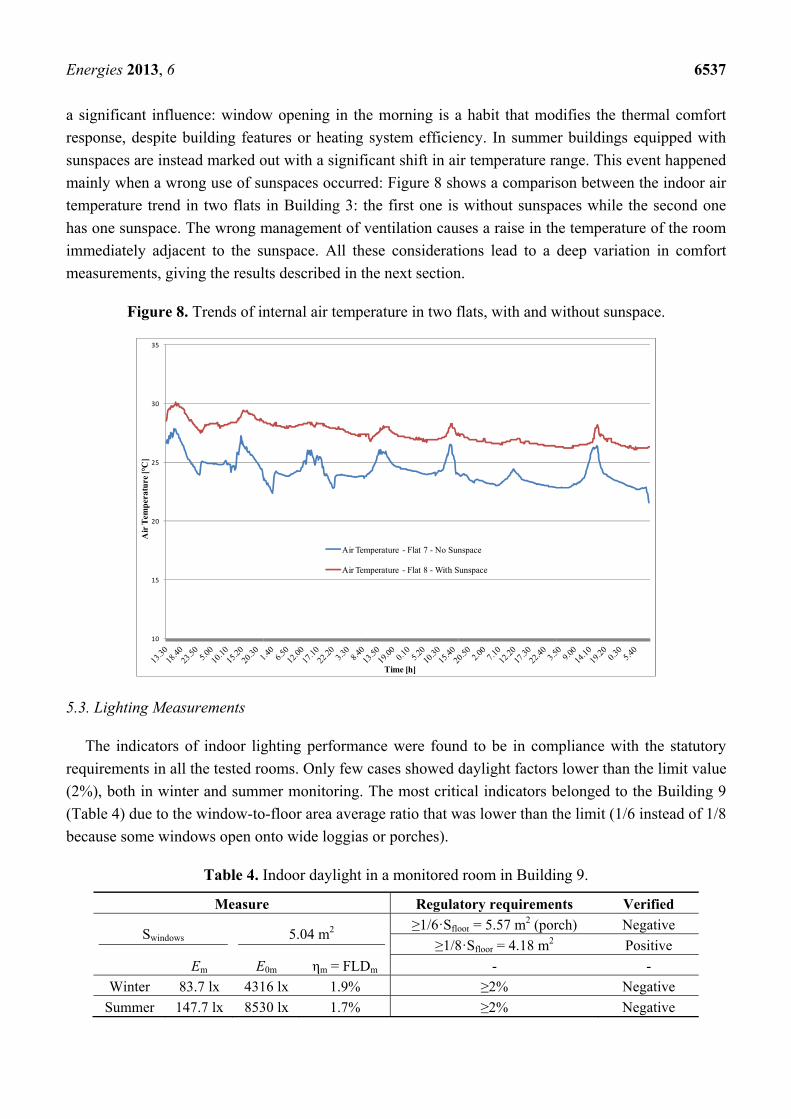
a significant influence: window opening in the morning is a habit that modifies the thermal comfort
response, despite building features or heating system efficiency. In summer buildings equipped with
sunspaces are instead marked out with a significant shift in air temperature range. This event happened
mainly when a wrong use of sunspaces occurred: Figure 8 shows a comparison between the indoor air
temperature trend in two flats in Building 3: the first one is without sunspaces while the second one
has one sunspace. The wrong management of ventilation causes a raise in the temperature of the room
immediately adjacent to the sunspace. All these considerations lead to a deep variation in comfort
measurements, giving the results described in the next section.
Figure 8. Trends of internal air temperature in two flats, with and without sunspace.
5.3. Lighting Measurements
The indicators of indoor lighting performance were found to be in compliance with the statutory
requirements in all the tested rooms. Only few cases showed daylight factors lower than the limit value
(2%), both in winter and summer monitoring. The most critical indicators belonged to the Building 9
(Table 4) due to the window-to-floor area average ratio that was lower than the limit (1/6 instead of 1/8
because some windows open onto wide loggias or porches).
Table 4. Indoor daylight in a monitored room in Building 9.
Measure Regulatory requirements Verified
Swindows 5.04 m2 ≥1/6·Sfloor = 5.57 m2 (porch) Negative
≥1/8·Sfloor = 4.18 m2 Positive
Em E0m ηm = FLDm - -
Winter 83.7 lx 4316 lx 1.9% ≥2% Negative
Summer 147.7 lx 8530 lx 1.7% ≥2% Negative
10
15
20
25
30
35
Air
Tem
per
atu
re [°
C]
Time [h]
Air Temperature - Flat 7 - No Sunspace
Air Temperature - Flat 8 - With Sunspace

Energies 2013, 6 6538
5.4. Acoustic Measurements
As far as the acoustic performance of the investigated buildings is concerned, the most critical
descriptor was the façade acoustic insulation index (dB), which was found to be in agreement with the
statutory requirements only for few cases. In most circumstances, poor façade sound insulation
conditions depended on the presence of roller shutter boxes or aeration systems, which can improve
thermohygrometric comfort conditions but can disadvantage acoustic sound insulation from external
noise sources. For instance, in Building 9 two different façade acoustic insulation indexes were
obtained considering the same kind of window (D2m,nT,w = 32 and 37 dB). Different values were
obtained from the tests because of the wrong installation of the windows, as shown in Figure 9. This
aspect is quite important for a good evaluation of the measurement results.
Figure 9. Façade sound insulation (D2m,n,T): influence of wrong installation for the same
type of window.
Impact sound pressure level strongly depends on the kind of floor (ceramic tiles or parquet) and on
the type of resilient material used in the floating floor installation. Figure 10 shows the comparison
between two sound pressure level trends for Building 1. The sound pressure level index is 62 dB for
the ceramic tiles and 46 dB for the parquet floating floor, considering the same total thickness.
0
5
10
15
20
25
30
35
40
45
50
100
125
160
200
250
315
400
500
630
800
1000
1250
1600
2000
2500
3150
4000
5000
D2m
,n,T
[dB
]
Frequency [Hz]
window a - D2m,n,T,w = 32 dB window b - D2m,n,T,w = 37 dB

Energies 2013, 6 6539
Figure 10. Impact sound pressure level (L’n): influence of kind of floor (ceramic tiles
or parquet).
5.5. Real Energy and Water Consumptions
The indicators of natural gas, electrical energy and water real consumptions were evaluated
referring to a sample flat selected in each building; representative flats have similar net floor areas and
numbers of occupants. The consumption data were divided by the number of days of the monitoring
period to evaluate the daily average consumption of energy (kW·h/d) and water (l/d).
The consumption of natural gas (m3) was converted in terms of primary energy (kW·h); the gas
consumption for the domestic hot water production was evaluated during summer season (Figure 11b).
The consumption of thermal energy for winter heating was estimated multiplying the daily average
value by the number of days of the conventional heating period; then, it was divided by the net floor
area of the sample flat to obtain the indicator of real energy consumption (kW·h/m2·yr).
The indicator of electricity consumption (Figure 11a) was evaluated multiplying the daily average
value by a period of 365 days and normalized by the net floor area of the flat (kW·h/m2·yr).
The daily average consumption of water was divided by the number of the occupants of the flat to
evaluate the average supply of water per capita in each flat (l/d·person).
The natural gas consumptions were collected only for the first five buildings, since the other ones
were occupied quite recently by the users, leaving the consumption data still not robust.
Figure 12 compares the real thermal energy consumption for winter heating with the estimated
winter energy performance index. The differences between actual and predicted values are lower than
30% in all cases, except for Building 4, where the behavior of the occupant probably deviates
significantly from the standard profile.
20
25
30
35
40
45
50
55
60
6510
0
125
160
200
250
315
400
500
630
800
1000
1250
1600
2000
2500
3150
4000
5000
L' n
[dB
]
Frequency [Hz]
L'n ceramic floor - L'n,w = 62 dB L'n parquet floating floor - L'n,w = 46 dB

Energies 2013, 6 6540
Figure 11. Daily average consumption of (a) electricity and (b) natural gas estimated for a
reference flat of the Building 2, for the period 2008–2011.
(a) (b)
Figure 12. Estimated energy needs and real energy consumption for the reference
flats (kW·h/m2·yr).
6. Overall Analysis
Figure 13 summarizes the main results of the monitoring activities, of the simulations and of the
real consumption data; since the investigated parameters are so numerous, the evaluation of the overall
performance can only be quali-quantitative. The so called Chercoff icons were chosen in Table 4.
As far as the energy performance indexes, Italian Laws define the limits of buildings thermal
transmittance for the opaque vertical walls, depending on the climatic zone and according to the year
of construction; they are 0.50 W/m2·K for Buildings 3, 4 and 7 (climatic zone D) and 0.46 W/m2·K for
Buildings 1, 2, 5, 6, 8 and 9 (Climatic zone E). Building 5 does not comply with the limits and the low
energy performance of the envelope is evident also in wintertime. Its walls, according to data sheet of
the envelope materials, should have a thermal transmittance equal to 0.29 W/m2·K, thanks to an
0
1
2
3
4
5
6
7
8
9
10
kWh/
d
0
10
20
30
40
50
60
70
80
kW
h/d
0
10
20
30
40
50
60
70
80
90
100
1 2 3 4 5
kWh/
m2yr
Building n.
Estimated Real

Energies 2013, 6 6541
innovative insulation plaster, but in situ measurement did not confirm this performance. In general,
summer and winter energy performance complies with the building energy classification, with the
majority of the interventions (eight out of nine) falling in the winter energy classes A or B. The
behavior of the constructions in summer seasons could be considered satisfactory (between Classes II
and III for all buildings, considering that, for the Italian Law, Class I is the best and Class V is the
worst). The lack of excellent marks is due to the scarce attention towards the control systems of solar
gain, such as glass external film, or sunscreens, together with the paintings of the external surfaces, which
obey more to aesthetic requirements than to radiation reflection properties.
Figure 13. Results of the monitoring process for the nine analyzed buildings (Chercoff
icons). Green = Satisfactory; Yellow = Average; Red = Unsatisfactory.
1 2 3 4 5 6 7 8 9SunspacesSustainable insulation materials wood wood wood corkSolar shadingsHeating System (centralized)Under-floor heating systemNatural depuration system (phytodepuration)Rain-water recovery systemThermal transmittance (W/m2K) 0.34 0.37 0.34 0.39 0.56 0.44 0.47 0.22 0.26
Winter Energy performance index (kWh/m2*yr) 63 73 89 29 56 32 37 60 54
Summer Energy performance index (kWh/m2*yr) 24 19 23 17 11 24 22 13 17
Energy Class (winter/summer) B/II C/II C/III B/II B/II A/III B/III B/II C/II
FACE
Solar Heating and DHWPhotovoltaic plantsUnconventional Heating System (Geothermal)
Natural gas (kWh/m2*yr) 82 95 78 18 71 n.a. n.a. n.a. n.a.
Electric Energy (kWh/m2*yr) 14 51 23 26 30 n.a. 24 n.a. 14Water (l/d*person) 93 260 230 30 125 45 55 43 100
FACE
Daylight Factor DF (%) 3.6 2.7 3.3 2.7 3.3 3.2 5.9 2.9 2.1
Window-to-floor area ratio Sw/Sf (-) 0.180 0.224 0.216 0.223 0.141 0.153 0.203 0.207 0.150
FACE
D2m,nT,w 37 41 38 37 40 39 35 40 38
R’w 51 52 52 48 51 51 53 52 51
L’nw 62 56 62 64 58 68 49 62 66
LASmax - 43 - 37 33 - 29 28 35
FACE
PMV Spring Summer -0.02 -0.66 0.62 -0.68 -0.53 0.66 0.14 0.28 0.83PMV Autumn Winter -0.12 -0.62 -0.42 -0.56 -0.86 -0.43 -0.48 -0.38 -0.29PPD Spring Summer 6.63 15.72 19.96 16.75 12.07 19.98 9.23 12.16 29.72PPD Autumn Winter 9.56 19.39 9.19 15.45 24.47 10.38 11.33 10.24 14.28
FACE
Environmental Class C D C B C C C C C
FACE
Envi
ronm
enta
l su
stai
nabi
lity
cert
ifica
tion
Build
ing
sing
ular
fe
atur
es
BUILDING
Ove
rall
Real
Co
nsum
ptio
nsLi
ghtin
g Ac
oust
icCo
mfo
rt a
naly
sis
Ener
gy P
erfo
rman
ce
inde
xes
Rene
wa
bles

Energies 2013, 6 6542
The renewable energy sources proposed are constituted by the installation of solar collectors for
domestic hot water production and rooms heating, photovoltaic plants, and unconventional heating
systems (geothermal plants). The best score was assigned to those buildings, where at least two
different kinds of renewable sources are included, a medium score when only one renewable plant is
realized, and the worst score when no renewables are present.
The reported values of real consumption represent the averages calculated with the data collected
during the monitoring period and normalized to the net floor area or the number of occupants of each
flat. The indicator of real consumptions were compared with performance benchmarks. The actual
energy consumptions were referred to the same limit of the corresponding winter energy performance
index, falling in the same winter energy class (only Buildings 1 and 2 result belong in a worse class
than the estimated performance). The indicator of water consumption was referred to daily domestic
water supply per capita suggested by the Italian Law (150 l/d·person). The benchmark of the
household electricity consumption was the average value per capita calculated in 2011 by the Italian
National Institute of Statistics (ISTAT) [57]. On this basis, the investigated buildings performed
generally well (except for the sample flat of the Building 2). Focusing the attention on lighting, the
daylight factor average values ranged from 2.1% to 5.9%, therefore all buildings showed a generally
positive and effective use of daylight. Only two rooms of a total of 27 gave daylight factors lower than
DFlim (2%), both during winter and summer monitoring. One of these two rooms belongs to Building 9,
where average daylight factor was just 2.1%. A confirmation comes from the fact that, in the same
building, window-to-floor area average ratio was lower than (Sw/Sf)lim (the limit is 1/6 instead of 1/8
because some windows open onto wide loggias or porches).
The acoustic experimental campaign showed that the Italian statutory requirements were totally
satisfied only for the Buildings 5 and 8. On the other hand, the airborne sound insulation between rooms
in different dwellings is good in almost all the cases (R’w ≥ 50 dB), except for Building 4 (R’w ≥ 48 dB).
The most critical descriptor was the façade acoustic insulation index (dB): the values are in the 35–41 dB
range and the measured value was higher than the limit value only for Building 2. Impact sound
pressure level index values varied in 49–68 dB range, depending on the floor kind and on the type of
resilient material used in the floating floor installation (as discussed in Section 5.4). In some cases
(Buildings 4, 6 and 9), the selected materials or the wrong installation led to higher values than the
maximum ones fixed by the Law. Regarding the comfort, results showed that only Buildings 1 and 7
reached a comfortable indoor condition: Building 1, in particular, showed PMV and PPD values in
spring and summer seasons typical of the A category. Building 7, despite its PPD value in autumn and
winter (lightly over the C category), showed good comfort conditions. Buildings 3, 6 and 8 obtained
sufficient scores, not far from the comfort situation. The other Buildings (2, 4, 5 and 9) showed a
certain criticality: the worst situation was found in PPD spring and summer values for Building 9, and
in PPD autumn and winter values for Building 5. In all these buildings both PMV and PPD calculated
fell considerably out of the optimal ranges.
Finally, the environmental quality of the buildings was evaluated through the method of the
Certification of Environmental Sustainability by Umbria Region, inspired to ITACA protocol (similar
to LEED). The ARPA-Umbria promotes the environmental certification of the residential buildings
and it provides 22 worksheets to calculate the value of the performance indicators classified into five
macro-areas and many sub-criteria: quality of the site (three sheets), resources consumption

Energies 2013, 6 6543
(ten sheets), environmental loads (three sheets), indoor comfort (four sheets) and quality of the service
(two sheets) [58]. The single final score is the sum of the value of each indicator, weighted according
to its importance, and it allows to assign an environmental class (from A to D) to the buildings. A
building in class D does not obtain the certification. Although the buildings were realized before the
introduction of the ARPA procedure, the environmental impacts of all the interventions resulted low
and obtained the ARPA-Umbria certification, except for Building 2.
Finally, the cost effectiveness of the capital investment was evaluated. The energy-economic
analysis is different case-by-case because each building is equipped with different innovative systems
(under-floor heating systems, sunspaces, solar thermal plans, photovoltaic plans, natural materials, etc.).
The cash flow can be analyzed for 30 years; considering an increasing of the initial investment of
about 10%, the cost-benefit analysis shows that the pay-back times are approximately equal to
13–14 years.
7. Conclusions
A growing interest is focusing in the recent years on green buildings, both for energy saving and
low GHG emissions. Nevertheless they require higher investments than conventional ones, due to the
higher cost of materials and of the integrated systems (such as Renewable Energy Systems—RES);
therefore public funds are necessary for the development and the spreading of innovative solutions
able to reach the environmental aims such the ones of the EU Directive 20-20-20.
The Umbria Region in Italy recently funded some residential buildings, characterized by green
technologies and sustainable solutions. An extended monitoring was carried out by the University of
Perugia, in order to evaluate the energy, comfort, and environmental benefits really achieved thanks to
the innovative solutions proposed, in a wide sample of buildings realized all over the Region. Many
parameters were monitored and verified, such as energy consumption, thermal properties of materials
and components, lighting and noise insulation characteristics, thermal comfort, and environmental
sustainability by means of ITACA procedure, an Italian methodology similar to LEED.
Numerous solutions were found and monitored, involving different materials, construction
techniques, technological plants, passive and/or active solar systems, so that it is not possible to
directly compare them by means of a single number index, able to take into account all the different
aspects. A complex performance assessment methodology was therefore developed, characterized by
wide experimental campaigns, in order to really characterize the different proposed solutions;
numerical simulations were also performed for the prevision of energy requirements and for the
comparison with the actual consumptions. In this way a critical comparison of all the examined aspects
is provided, able to obtain a global viewpoint of each examined building.
Overall results were satisfactory. A great part of the examined buildings had singular features, such
as sunspaces, sustainable insulation materials, underfloor heating systems, and rainwater recovery
systems. The thermal performance indexes were always good, especially the thermal transmittance;
Energy Classes were in the A–C range for winter and in the I–III range for summer.
At least one Renewable Energy Source system was present in all the buildings; six of the nine
examined buildings were provided with two RES systems. Also the values of Daylight Factor and
Window-to-floor area ratio were generally in compliance with the limitations imposed by the Law.

Energies 2013, 6 6544
Finally, the measured natural gas, electric energy, and water consumptions were in a good agreement
with the data obtained by the simulations; the environmental sustainability analysis, which includes all
the above mentioned aspects and also some others, can be considered satisfactory: eight of the nine
examined buildings obtained the certification. It may be concluded that the proposed approach can be a
very useful to monitor the characteristics of green buildings, in order to verify their global energy and
environmental performance and to provide the public bodies with a tool to control the actual
achievement of design objectives.
Acknowledgments
The authors wish to thank the Umbria Region, Housing Policies Office, for the support given to the
monitoring activity.
Conflicts of Interest
The authors declare no conflict of interest.
References
1. United Nations Environment Programme—Sustainable Buildings & Climate Initiative. Buildings
and Climate Change (UNEP-SBCI): A Summary for Decision Makers; UNEP DTIE (United
Nations Environment Programme Division of Technology, Industry and Economics) Sustainable
Consumption & Production Branch: Paris, France, 2009.
2. Berardi, U. Clarifying the new interpretations of the concept of sustainable building.
Sustain. Cities Soc. 2013, 8, 72–78.
3. Building Research Establishment Environmental Assessment Method for Buildings. Available
online: http://www.breeam.org (accessed on 28 June 2013).
4. ITACA Protocol for the Assessment of Buildings Energy and Environmental Sustainability; Institute
for Innovation and Transparency in Government Procurement and Environmental Compatibility:
Roma, Italy, 2011.
5. LEED 2009 for New Construction and Major Renovations; US Green Building Council:
Washington, DC, USA, 2008.
6. Asdrubali, F.; Baldassarri, C.; Fthenakis, V. Life cycle analysis in the construction sector:
Guiding the optimization of conventional Italian buildings. Energy Build. 2013, 64, 73–89.
7. Asdrubali, F.; Baldinelli, G.; D’Alessandro, F. Evaluation of the Acoustic Properties of Materials
Made from Recycled Tyre Granules. In Proceedings of the Internoise 2007, Istanbul, Turkey,
28–31 August 2007.
8. Asdrubali, F.; Schiavoni, S.; Horoshenkov, K.V. A review of sustainable materials for acoustic
applications. Build. Acoust. 2012, 19, 283–312.
9. Pisello, A.L.; Goretti, M.; Cotana, F. A method for assessing buildings’ energy efficiency by
dynamic simulation and experimental activity. Appl. Energy 2012, 97, 419–429.
10. Pisello, A.L.; Bobker, M.; Cotana, F. A building energy efficiency optimization method by
evaluating the effective thermal zones occupancy. Energies 2012, 5, 5257–5278.

Energies 2013, 6 6545
11. Legge Regionale n. 23, Regione Umbria. Norme di Riordino in Materia di Edilizia Residenziale
Pubblica (in Italian); Regione Umbria: Perugia, Italy, 2003.
12. Asdrubali, F.; Cotana, F.; Messineo, A. On the evaluation of solar greenhouse efficiency in
building simulation during the heating period. Energies 2012, 5, 1864–1880.
13. Desogus, G.; Mura, S.; Ricciu, R. Comparing different approaches to in situ measurement of
building components thermal resistance. Energy Build. 2011, 43, 2613–2620.
14. Pan, Y.; Huang, Z.; Wu, G. Calibrated building energy simulation and its application in a high-rise
commercial building in Shanghai Building integration of solar energy systems. Energy Build.
2007, 39, 651–657.
15. Buratti, C.; Moretti, E.; Belloni, E.; Cotana, F. Unsteady simulation of energy performance and
thermal comfort in non-residential buildings. Build. Environ. 2013, 59, 482–491.
16. MC4Suite 2010. Available online: http://www.mc4software.com (accessed on 20 September 2013).
17. International Organization of Standard (ISO). Energy Performance of Buildings—Calculation of
Energy Use for Space Heating and Cooling; EN ISO 13790; ISO: Geneva, Switzerland, 2008.
18. European Community. Directive 2002/91/EC of the European Parliament and of the Council of
16 December 2002 on the energy performance of buildings. Off. J. Eur. Communities 2003, L1, 65–71.
19. Linee Guida Nazionali per la Certificazione Energetica Degli Edifici (in Italian). Available
online: http://www.federcasa.it/news/certificazione_energetica/allegatoA.pdf (accessed on 10
September 2013).
20. Energy Performances of Buildings—Part 1, Part 2; UNI TS 11300:2008; UNI Italian Company
for Standardization: Milan, Italy, 2008.
21. Heating and Cooling of Buildings—Weather Data; UNI 10349:1994; UNI Italian Company for
Standardization: Milan, Italy, 1994.
22. International Organization of Standard (ISO). Building Components and Building
Elements—Thermal Resistance and Thermal Transmittance—Calculation Method; EN ISO 6946;
ISO: Geneva, Switzerland, 2008.
23. Achard, P.; Gicquel, R. European Passive Solar Handbook: Basic Principles and Concepts for
Passive Solar Architecture; Directorate-General XII for Science, Research and Development;
Commission of the European Communities: Brussels, Belgium, 1986.
24. ACCA Software. Solarius T, User’s Guide; ACCA Software: Montella, Italy, 2011.
25. ACCA Software. Solarius PV, User’s Guide; ACCA Software: Montella, Italy, 2011.
26. Solar Energy—Calculation of Contributions for Building Applications—Part 1: Evaluation of the
Solar Energy Received; UNI/TR 11328–1:2009; UNI Italian Company for Standardization: Milan,
Italy, 2009.
27. International Organization of Standard (ISO). Thermal Insulation—Determination of Steady-State
Thermal Transmission Properties—Calibrated and Guarded Hot Box; EN ISO 8990; ISO:
Geneva, Switzerland, 1999.
28. Asdrubali, F.; Baldinelli, G. Thermal transmittance measurements with the hot box methods:
Calibration, experimental procedures and uncertainty analyses of three different approaches.
Energy Build. 2011, 43, 1618–1626.

Energies 2013, 6 6546
29. Asdrubali, F.; Baldinelli, G.; Bianchi, F. Influence of cavities geometric and emissivity properties
on the overall thermal performance of aluminum frames for windows. Energy Build. 2013, 60,
298–309.
30. International Organization of Standard (ISO). Thermal Insulations—Building Elements—In-Situ
Measurements of Thermal Resistance and Thermal Transmittance; ISO 9869; ISO: Geneva,
Switzerland, 1994.
31. Peng, C.; Wu, Z. In situ measuring and evaluating the thermal resistance of building construction.
Energy Build. 2008, 40, 2076–2082.
32. Asdrubali, F.; Baldinelli, G.; Bianchi, F. A quantitative methodology to evaluate thermal bridges
in buildings. Appl. Energy 2012, 97, 365–373.
33. Baldinelli, G. A methodology for experimental evaluations of low-e barriers thermal properties:
Field tests and comparison with theoretical models. Build. Environ. 2010, 45, 1016–1024.
34. Buratti, C.; Barelli, L.; Moretti, E. Application of artificial neural network to predict thermal
transmittance of wooden windows. Appl. Energy 2012, 98, 425–432.
35. Ergonomics of the Thermal Environment—Instruments for Measuring Physical Quantities;
UNI EN ISO 7726:2002; UNI Italian Company for Standardization: Milan, Italy, 2002.
36. Fanger, P.O. Thermal Comfort, Analysis and Application in Environmental Engineering;
Danish Technical Press: Copenhagen, Denmark, 1970.
37. Ergonomics of the Thermal Environment—Analytical Determination and Interpretation of
Thermal Comfort Using Calculation of the PMV and PPD Indices and Local Thermal Comfort
Criteria; UNI EN ISO 7730:2006; UNI Italian Company for Standardization: Milan, Italy, 2006.
38. Djong Yang, N.; Tchnida, R.; Njomo, D. Thermal comfort: A review paper. Renew. Sustain. Energy
2010, 14, 2626–2640.
39. Buratti, C.; Ricciardi, P. Adaptive analysis of thermal comfort in university classrooms:
Correlation between experimental data and mathematical models. Build. Environ. 2008, 30, 1–14.
40. Buratti, C.; Ricciardi, P.; Vergoni, M. HVAC systems testing and check: A simplified model to
predict thermal comfort conditions in moderate environments. Appl. Energy 2013, 104, 117–127.
41. Ricciardi, P.; Buratti, C. Thermal comfort in open plan offices in northern Italy: An adaptive
approach. Build. Environ. 2012, 56, 314–320.
42. Buratti, C.; Mariani, R.; Moretti, E. Mean age of air in a naturally ventilated office: Experimental
data and simulations. Energy Build. 2011, 43, 2021–2027.
43. Light and Lighting—Lighting of Work Places—Part 1: Indoor Work Places; EN 12464–1:2011;
CEN—Comité Européen de Normalisation (European Committee for Standardization): Brussels,
Belgium, 2011.
44. Lighting for Buildings—Part 2: Code of Practice for Daylighting; BS 8206–2:2008; The British
Standards Institution: London, UK, 2008.
45. CIBSE Lighting Guide 10: Daylighting and Window Design; The Chartered Institution of
Building Services Engineers: London, UK, 1999.
46. Decreto Ministeriale 5 Luglio 1975. Modificazioni alle Istruzioni Ministeriali 20 Giugno 1896
Relativamente All'altezza Minima ed ai Requisiti Igienico Sanitari Principali dei Locali
D’abitazione (in Italian); Ministero Della Salute: Rome, Italy, 1975.

Energies 2013, 6 6547
47. Asdrubali, F.; Baldinelli, G. Theoretical modeling and experimental evaluation of the optical
properties of glazing systems with selective coatings. Build. Simul. 2009, 2, 75–84.
48. Buratti, C.; Moretti, E. Lighting and energetic characteristics of transparent insulating materials:
Experimental data and calculation. Indoor Built Environ. 2011, 20, 400–411.
49. Maschke, C.; Niemann, H. Health effects of annoyance induced by neighbour noise. Noise Control
Eng. J. 2007, 55, 348–356.
50. Rasmussen, B.; Rindel, J.H. Sound insulation between dwellings—Descriptors applied in building
regulations in Europe. Appl. Acoust. 2010, 71, 171–180.
51. Trombetta Zannin, P.H.; Coelho Ferreira, J.A. In situ acoustic performance of materials used in
Brazilian building construction. Constr. Build. Mater. 2007, 21, 1820–1824.
52. Decreto del Presidente Consiglio dei Ministri 5/12/97. Determinazione dei Requisiti Acustici
Passivi Degli Edifici (in Italian); Presidenza del Consiglio dei Ministri: Rome, Italy, 1997.
53. Buratti, C.; Barelli L.; Moretti, E. Wooden windows: Sound insulation evaluation by means of
artificial neural networks. Appl. Acoust. 2013, 74, 740–745.
54. International Organization of Standard (ISO). Rating of Sound Insulation in Buildings and of
Buildings Elements. Part 1, Part 2; ISO 717, Acoustics; ISO: Geneva, Switzerland, 2013.
55. International Organization of Standard (ISO). Measurement of Sound Insulation in Buildings and of
Building Elements—Part 4, Part 5, Part 7; ISO 140, Acoustics; ISO: Geneva, Switzerland, 1998.
56. International Organization of Standard (ISO). Measurement of Sound Pressure Level from
Service Equipment in Buildings—Engineering Method; ISO 16032, Acoustics; ISO: Geneva,
Switzerland, 2004.
57. XV Population and Housing Census; The Italian National Institute of Statistics: Rome, Italy, 2011.
58. Deliberazione Giunta Regionale Umbria 20 Febbraio 2013 n.130. Modifica e aggiornamento del
Disciplinare Tecnico Per la Valutazione Della Sostenibilità Ambientale Degli Edifici di Cui
All’Art. 4 Della Legge Regionale n. 17/2008—Destinazione d’uso Residenziale (in Italian);
Regione Umbria: Perugia, Italy, 2013.
© 2013 by the authors; licensee MDPI, Basel, Switzerland. This article is an open access article
distributed under the terms and conditions of the Creative Commons Attribution license
(http://creativecommons.org/licenses/by/3.0/).