Evaluation of Genetic Diversity Based on ... - MDPI
20
Citation: Munda, S.; Saikia, R.J.; Begum, T.; Bhandari, S.; Gogoi, A.; Sarma, N.; Tamang, R.; Lal, M. Evaluation of Genetic Diversity Based on Microsatellites and Phytochemical Markers of Core Collection of Cymbopogon winterianus Jowitt Germplasm. Plants 2022, 11, 528. https://doi.org/10.3390/ plants11040528 Academic Editors: Gun¯ ars L ¯ acis and Hilde Nybom Received: 30 November 2021 Accepted: 8 January 2022 Published: 16 February 2022 Publisher’s Note: MDPI stays neutral with regard to jurisdictional claims in published maps and institutional affil- iations. Copyright: © 2022 by the authors. Licensee MDPI, Basel, Switzerland. This article is an open access article distributed under the terms and conditions of the Creative Commons Attribution (CC BY) license (https:// creativecommons.org/licenses/by/ 4.0/). plants Article Evaluation of Genetic Diversity Based on Microsatellites and Phytochemical Markers of Core Collection of Cymbopogon winterianus Jowitt Germplasm Sunita Munda 1,2 , Raktim Jyoti Saikia 1 , Twahira Begum 1,2 , Sangeeta Bhandari 1 , Ankita Gogoi 1 , Neelav Sarma 1,2 , Raghu Tamang 1 and Mohan Lal 1,2, * 1 CSIR-North East Institute of Science and Technology, Jorhat 785006, Assam, India; [email protected] (S.M.); [email protected] (R.J.S.); [email protected] (T.B.); [email protected] (S.B.); [email protected] (A.G.); [email protected] (N.S.); [email protected] (R.T.) 2 AcSIR-Academy of Scientific and Innovative Research, Ghaziabad 201002, Uttar Pradesh, India * Correspondence: [email protected] Abstract: Cymbopogon winterianus Jowitt is an industrially important crop due to its value in the aromatic, perfumery and pharmaceutical industries. In this study, 72 accessions of C. winterianus were selected for molecular diversity analysis using SSR markers. It revealed a total of 65 polymorphic alleles showing an average of 68.10% polymorphism. The best SSR primer with competency in dis- criminating the germplasm was 3CM0506 with PIC (0.69), MI (0.69) and Rp (3.12). Genetic variation was studied between Assam, Manipur, Meghalaya and Arunachal Pradesh populations. A dendro- gram based on the Neighbour-Joining Method showed clustering of germplasm on the collection site. A total of six relevant genetic populations were identified through a structure harvester software analysis. Moreover, a dendrogram based on similarity, complete linkage and Euclidean distance was also elucidated differentiating the genotypes with respect to the major phytochemical constituents of the essential oil. GC-FID and GC-MS analyses of the essential oil of the 72 germplasms revealed citronellal content from 2.58–51.45%, citronellol from 0.00–26.39% and geraniol from 0.00–41.15%. This is the first molecular diversity report with 72 accessions of C. winterianus collected from the NE region using 28 SSR primers as well as their diversity based on phytochemical markers. This diversity computation will help with acquisition of the knowledge and relationship among each individual accession leading to the development of improved and essential oil component-rich cultivars. Keywords: C. winterianus; molecular diversity; phytochemical diversity; N-J Method; Euclidean distance 1. Introduction Genetic diversity analysis is a major step for developing plant breeding programmes [1]. A better understanding of the genetic relationship amongst plant species’ germplasms, both cultivated and wild, is necessary to formulate strategies for the breeding, conservation and utilization of the genetic resources [2] of a crop’s wild relatives, especially those with a primary gene pool [3]. One genus containing profound genetic diversity is the Cymbopogon species, belong- ing to the Poaceae family, which contains approximately 140 species of heterogeneous plants due to its cross-pollinative nature [1,4,5]. These species are generally distributed in tropical and subtropical regions of the world with an availability of 45 species grown in India [1,6,7]. These species are characterised by an aromatic essential oil, bearing many bioactive compounds that have a high pharmaceutical importance and economic value [8]. One of the important species of this genus, Cymbopogon winterianus Jowitt, popularly known as Java citronella, is a perennial grass that propagates by vegetative means [7,9,10]. The crop is cultivated for the extraction of essential oil, which has aromatic and medicinal Plants 2022, 11, 528. https://doi.org/10.3390/plants11040528 https://www.mdpi.com/journal/plants
-
Upload
khangminh22 -
Category
Documents
-
view
0 -
download
0
Transcript of Evaluation of Genetic Diversity Based on ... - MDPI
�����������������
Citation: Munda, S.; Saikia, R.J.;
Begum, T.; Bhandari, S.; Gogoi, A.;
Sarma, N.; Tamang, R.; Lal, M.
Evaluation of Genetic Diversity
Based on Microsatellites and
Phytochemical Markers of Core
Collection of Cymbopogon winterianus
Jowitt Germplasm. Plants 2022, 11,
528. https://doi.org/10.3390/
plants11040528
Academic Editors: Gunars Lacis and
Hilde Nybom
Received: 30 November 2021
Accepted: 8 January 2022
Published: 16 February 2022
Publisher’s Note: MDPI stays neutral
with regard to jurisdictional claims in
published maps and institutional affil-
iations.
Copyright: © 2022 by the authors.
Licensee MDPI, Basel, Switzerland.
This article is an open access article
distributed under the terms and
conditions of the Creative Commons
Attribution (CC BY) license (https://
creativecommons.org/licenses/by/
4.0/).
plants
Article
Evaluation of Genetic Diversity Based on Microsatellites andPhytochemical Markers of Core Collection ofCymbopogon winterianus Jowitt GermplasmSunita Munda 1,2, Raktim Jyoti Saikia 1, Twahira Begum 1,2, Sangeeta Bhandari 1 , Ankita Gogoi 1,Neelav Sarma 1,2, Raghu Tamang 1 and Mohan Lal 1,2,*
1 CSIR-North East Institute of Science and Technology, Jorhat 785006, Assam, India;[email protected] (S.M.); [email protected] (R.J.S.); [email protected] (T.B.);[email protected] (S.B.); [email protected] (A.G.); [email protected] (N.S.);[email protected] (R.T.)
2 AcSIR-Academy of Scientific and Innovative Research, Ghaziabad 201002, Uttar Pradesh, India* Correspondence: [email protected]
Abstract: Cymbopogon winterianus Jowitt is an industrially important crop due to its value in thearomatic, perfumery and pharmaceutical industries. In this study, 72 accessions of C. winterianus wereselected for molecular diversity analysis using SSR markers. It revealed a total of 65 polymorphicalleles showing an average of 68.10% polymorphism. The best SSR primer with competency in dis-criminating the germplasm was 3CM0506 with PIC (0.69), MI (0.69) and Rp (3.12). Genetic variationwas studied between Assam, Manipur, Meghalaya and Arunachal Pradesh populations. A dendro-gram based on the Neighbour-Joining Method showed clustering of germplasm on the collectionsite. A total of six relevant genetic populations were identified through a structure harvester softwareanalysis. Moreover, a dendrogram based on similarity, complete linkage and Euclidean distance wasalso elucidated differentiating the genotypes with respect to the major phytochemical constituentsof the essential oil. GC-FID and GC-MS analyses of the essential oil of the 72 germplasms revealedcitronellal content from 2.58–51.45%, citronellol from 0.00–26.39% and geraniol from 0.00–41.15%.This is the first molecular diversity report with 72 accessions of C. winterianus collected from the NEregion using 28 SSR primers as well as their diversity based on phytochemical markers. This diversitycomputation will help with acquisition of the knowledge and relationship among each individualaccession leading to the development of improved and essential oil component-rich cultivars.
Keywords: C. winterianus; molecular diversity; phytochemical diversity; N-J Method; Euclidean distance
1. Introduction
Genetic diversity analysis is a major step for developing plant breeding programmes [1].A better understanding of the genetic relationship amongst plant species’ germplasms,both cultivated and wild, is necessary to formulate strategies for the breeding, conservationand utilization of the genetic resources [2] of a crop’s wild relatives, especially those with aprimary gene pool [3].
One genus containing profound genetic diversity is the Cymbopogon species, belong-ing to the Poaceae family, which contains approximately 140 species of heterogeneousplants due to its cross-pollinative nature [1,4,5]. These species are generally distributedin tropical and subtropical regions of the world with an availability of 45 species grownin India [1,6,7]. These species are characterised by an aromatic essential oil, bearing manybioactive compounds that have a high pharmaceutical importance and economic value [8].
One of the important species of this genus, Cymbopogon winterianus Jowitt, popularlyknown as Java citronella, is a perennial grass that propagates by vegetative means [7,9,10].The crop is cultivated for the extraction of essential oil, which has aromatic and medicinal
Plants 2022, 11, 528. https://doi.org/10.3390/plants11040528 https://www.mdpi.com/journal/plants
Plants 2022, 11, 528 2 of 20
properties [8]. The leaf essential oil has vast use in the perfumery, cosmetics and flavouringindustries [10,11]. Due to the presence of this fragrance, the leaf essential oil is used in thefood industry [12]. The Java citronella essential oil is used as an antiseptic, antispasmodicand diuretic drug [13] and possesses analgesic and anticonvulsant activities [14]. Moreover,the anti-microbial activity of C. winterianus has been reported against different pathogenicbacteria and fungi [13–15]. It has also been used over the ages in Brazilian and Indian folkmedicines [16].
The Cymbopogon winterianus leaf essential oil is marked by the presence of citronel-lal, citronellol and geraniol as the major compounds [10,15,17]. These constituents canalternatively be used as phytochemical markers for the identification of the species. Phyto-chemical variation in the essential oil of this species has been observed due to the geneticmakeup of the genotype, as well as due to environmental factors [18], which was alsoreported in other wild species where different chemotypes were observed depending onmultiple environmental factors (e.g., vegetation type, topographical parameters, climaticconditions and pedological features) [19]. Various previous studies have reported that theC. winterianus essential oil, rich in these compounds, was responsible for the bioactivity [20].Citronellol is a monoterpene alcohol that has antimicrobial, anticonvulsant, anticancer,anti-inflammatory and analgesic properties [21]. Moreover, citronellol has been used inthe fragrance industry, in perfumery, as an insect repellent and mite attractant [21,22].Citronellal is an aldehyde, which gives C. winterianus its characteristic lemon-like fragrance.It has an effective mosquito repellent activity, and thus is used as the active constituent ofdifferent mosquito repellent products [23]. It has been used in the pharmaceutical industrydue to its anti-microbial, antinociceptive, anti-inflammatory and anticancer activities [24].Another constituent of the C. winterianus essential oil is geraniol, which is an aromaticcompound with a rose-like fragrance [25]. Geraniol is effective at preventing certain typesof cancer, and possesses antimicrobial, anti-inflammatory, antiseptic and insect repellentactivities [26,27]. It is also used mainly in the fragrance industry as well as the cosmeticindustry [28]. Both citronellal and geraniol are the starting material for the synthesis ofmany aromatic compounds [29,30].
Over the course of years, Java citronella has been introduced to different geographicallocations and climatic conditions, which has led to further genetic differentiation amongstthe germplasms through human selection, as well as domestication [31]. A wide varia-tion in terms of essential oil, as well as morphological characters, has been observed inthese species, but these are greatly affected by environmental fluctuations and the growthstage [4,32]. Moreover, genetic diversity in the crops is also reduced due to changingagricultural practices, deforestation, overgrazing, and urbanization. In addition to this,conservation and management of the crops is a slow and costly process because of severaldevelopmental stages in the crop and the environmental conditions affecting its growth.Molecular markers have helped with combating this problem by elucidating informationrelated to the diversity, which is useful for planning different conservative measures. A richsource of genetic diversity is a prerequisite for introducing novel traits into the crop [9,33].Therefore, an analysis of genetic divergence through molecular markers has an edge overthe morphological characters because they are not affected by external factors [34]. For anassessment of the genetic variations within the germplasm, DNA-based molecular markerslike RAPD, ISSR, and SSR markers are widely used. Many studies were reported on the ge-netic diversity of Cymbopogon winterianus using RAPD and ISSR molecular markers [4,31,35],but the number of germplasms used in these studies was very limited. Additionally, oneof the drawbacks of RAPD marker is its low reproducibility [36]. Currently, SSR markersare considered useful because they are highly sensitive to genomic polymorphism [1], andthey are robust and inexpensive [37]. Phylogenetic assessment and genetic diversity weresuccessfully studied in many crops using microsatellites (SSR) [38–40]. Microsatellites areco-dominant markers; they are locus specific and have the capacity to detect a high level ofpolymorphism in the genome [41,42]. Kumar et al. (2009) studied the genetic diversity ofthe Cymbopogon species using SSR markers because of their ability to differentiate between
Plants 2022, 11, 528 3 of 20
the species precisely [32]. This will help in the development of future strategies for theimprovement and commercial cultivation of this industrially important plant species. Thegenome mapping of complex traits and the selection of suitable genes for breeding can alsobe studied with this molecular tool [43,44]. Reports on the genetic divergence of differentCymbopogon taxa were performed [36], but very scanty information is available on theC. winterianus germplasm.
Hence, the present study aimed to estimate the level of divergence existing amongand within the population of this species using SSR marker. The study of diversity basedon phytochemical and molecular markers together is regarded as an appropriate measureto conserve and screen the elite genotypes for improvement of the crop and increase thegene pool [45–48]. This would also help in the identification and crossing of parents withdesirable traits, subdivided into clusters, for the development of a superior germplasmwith more yield-related traits. Segregating populations would also aid an increase inthe recombinant combination in the gene pool. To the best of our knowledge, this isthe first report on the phytochemical, as well as molecular, diversity of 72 accessions ofC. winterianus.
2. Results and Discussions
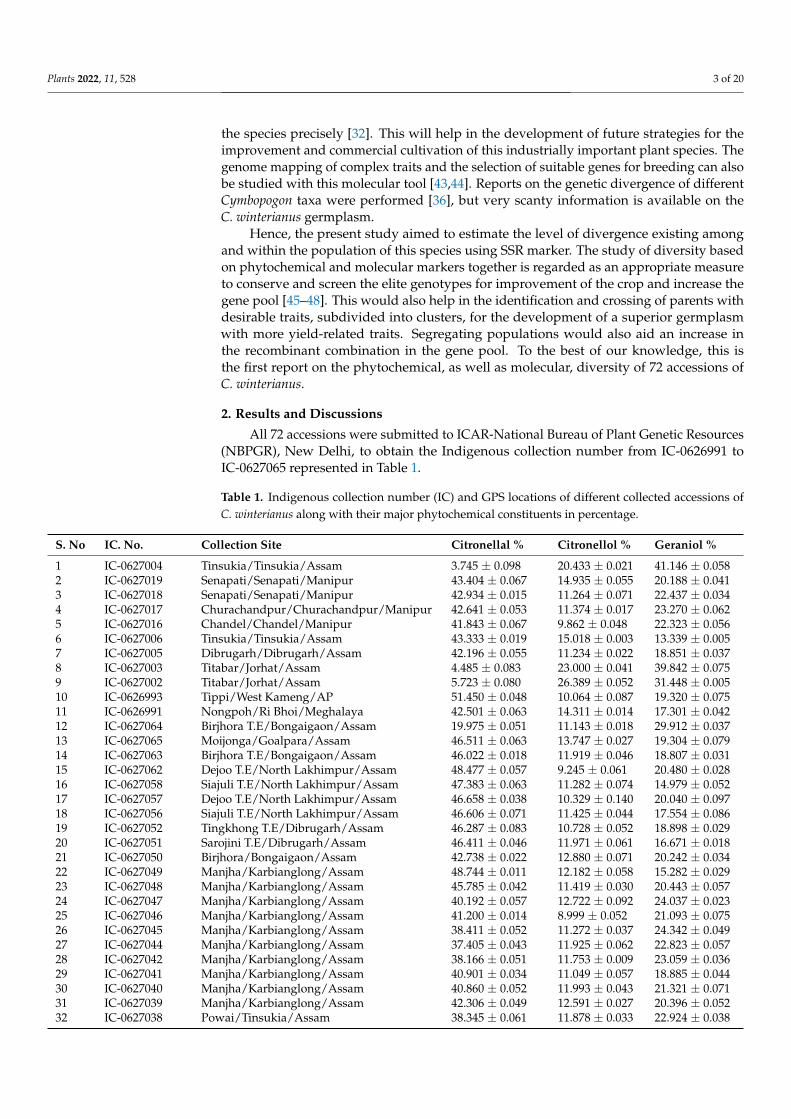
All 72 accessions were submitted to ICAR-National Bureau of Plant Genetic Resources(NBPGR), New Delhi, to obtain the Indigenous collection number from IC-0626991 toIC-0627065 represented in Table 1.
Table 1. Indigenous collection number (IC) and GPS locations of different collected accessions ofC. winterianus along with their major phytochemical constituents in percentage.
S. No IC. No. Collection Site Citronellal % Citronellol % Geraniol %
1 IC-0627004 Tinsukia/Tinsukia/Assam 3.745 ± 0.098 20.433 ± 0.021 41.146 ± 0.0582 IC-0627019 Senapati/Senapati/Manipur 43.404 ± 0.067 14.935 ± 0.055 20.188 ± 0.0413 IC-0627018 Senapati/Senapati/Manipur 42.934 ± 0.015 11.264 ± 0.071 22.437 ± 0.0344 IC-0627017 Churachandpur/Churachandpur/Manipur 42.641 ± 0.053 11.374 ± 0.017 23.270 ± 0.0625 IC-0627016 Chandel/Chandel/Manipur 41.843 ± 0.067 9.862 ± 0.048 22.323 ± 0.0566 IC-0627006 Tinsukia/Tinsukia/Assam 43.333 ± 0.019 15.018 ± 0.003 13.339 ± 0.0057 IC-0627005 Dibrugarh/Dibrugarh/Assam 42.196 ± 0.055 11.234 ± 0.022 18.851 ± 0.0378 IC-0627003 Titabar/Jorhat/Assam 4.485 ± 0.083 23.000 ± 0.041 39.842 ± 0.0759 IC-0627002 Titabar/Jorhat/Assam 5.723 ± 0.080 26.389 ± 0.052 31.448 ± 0.00510 IC-0626993 Tippi/West Kameng/AP 51.450 ± 0.048 10.064 ± 0.087 19.320 ± 0.07511 IC-0626991 Nongpoh/Ri Bhoi/Meghalaya 42.501 ± 0.063 14.311 ± 0.014 17.301 ± 0.04212 IC-0627064 Birjhora T.E/Bongaigaon/Assam 19.975 ± 0.051 11.143 ± 0.018 29.912 ± 0.03713 IC-0627065 Moijonga/Goalpara/Assam 46.511 ± 0.063 13.747 ± 0.027 19.304 ± 0.07914 IC-0627063 Birjhora T.E/Bongaigaon/Assam 46.022 ± 0.018 11.919 ± 0.046 18.807 ± 0.03115 IC-0627062 Dejoo T.E/North Lakhimpur/Assam 48.477 ± 0.057 9.245 ± 0.061 20.480 ± 0.02816 IC-0627058 Siajuli T.E/North Lakhimpur/Assam 47.383 ± 0.063 11.282 ± 0.074 14.979 ± 0.05217 IC-0627057 Dejoo T.E/North Lakhimpur/Assam 46.658 ± 0.038 10.329 ± 0.140 20.040 ± 0.09718 IC-0627056 Siajuli T.E/North Lakhimpur/Assam 46.606 ± 0.071 11.425 ± 0.044 17.554 ± 0.08619 IC-0627052 Tingkhong T.E/Dibrugarh/Assam 46.287 ± 0.083 10.728 ± 0.052 18.898 ± 0.02920 IC-0627051 Sarojini T.E/Dibrugarh/Assam 46.411 ± 0.046 11.971 ± 0.061 16.671 ± 0.01821 IC-0627050 Birjhora/Bongaigaon/Assam 42.738 ± 0.022 12.880 ± 0.071 20.242 ± 0.03422 IC-0627049 Manjha/Karbianglong/Assam 48.744 ± 0.011 12.182 ± 0.058 15.282 ± 0.02923 IC-0627048 Manjha/Karbianglong/Assam 45.785 ± 0.042 11.419 ± 0.030 20.443 ± 0.05724 IC-0627047 Manjha/Karbianglong/Assam 40.192 ± 0.057 12.722 ± 0.092 24.037 ± 0.02325 IC-0627046 Manjha/Karbianglong/Assam 41.200 ± 0.014 8.999 ± 0.052 21.093 ± 0.07526 IC-0627045 Manjha/Karbianglong/Assam 38.411 ± 0.052 11.272 ± 0.037 24.342 ± 0.04927 IC-0627044 Manjha/Karbianglong/Assam 37.405 ± 0.043 11.925 ± 0.062 22.823 ± 0.05728 IC-0627042 Manjha/Karbianglong/Assam 38.166 ± 0.051 11.753 ± 0.009 23.059 ± 0.03629 IC-0627041 Manjha/Karbianglong/Assam 40.901 ± 0.034 11.049 ± 0.057 18.885 ± 0.04430 IC-0627040 Manjha/Karbianglong/Assam 40.860 ± 0.052 11.993 ± 0.043 21.321 ± 0.07131 IC-0627039 Manjha/Karbianglong/Assam 42.306 ± 0.049 12.591 ± 0.027 20.396 ± 0.05232 IC-0627038 Powai/Tinsukia/Assam 38.345 ± 0.061 11.878 ± 0.033 22.924 ± 0.038
Plants 2022, 11, 528 4 of 20
Table 1. Cont.
S. No IC. No. Collection Site Citronellal % Citronellol % Geraniol %
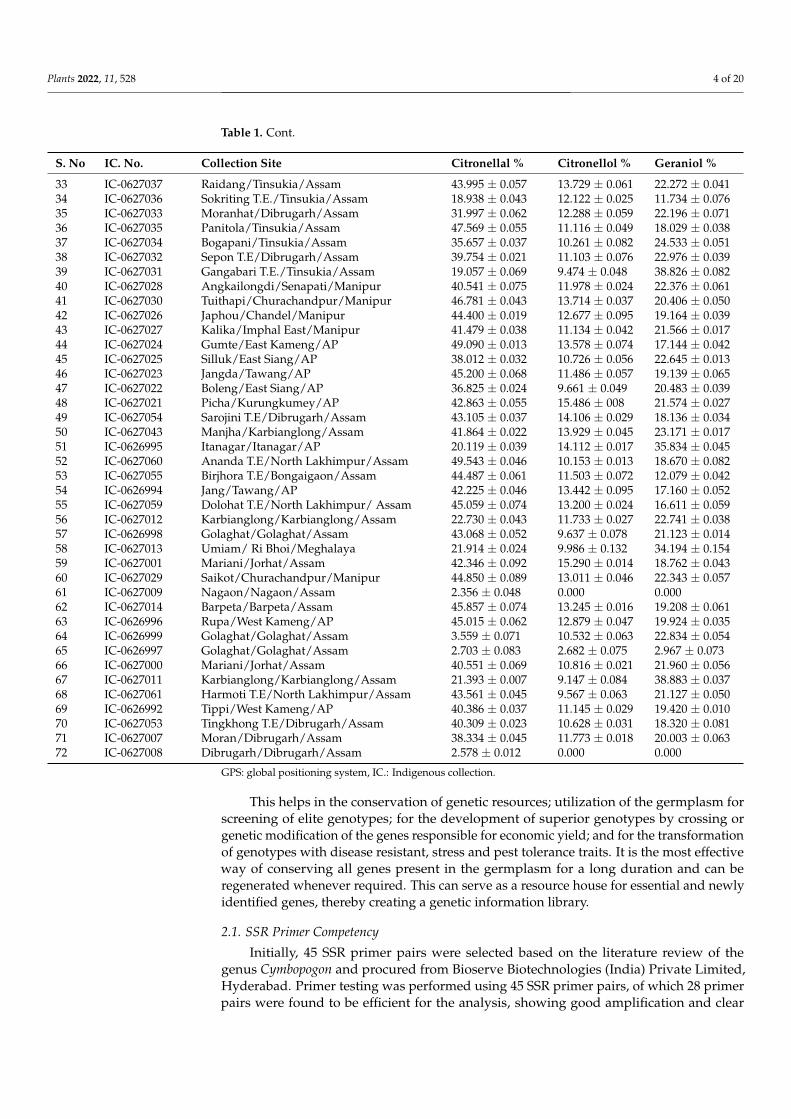
33 IC-0627037 Raidang/Tinsukia/Assam 43.995 ± 0.057 13.729 ± 0.061 22.272 ± 0.04134 IC-0627036 Sokriting T.E./Tinsukia/Assam 18.938 ± 0.043 12.122 ± 0.025 11.734 ± 0.07635 IC-0627033 Moranhat/Dibrugarh/Assam 31.997 ± 0.062 12.288 ± 0.059 22.196 ± 0.07136 IC-0627035 Panitola/Tinsukia/Assam 47.569 ± 0.055 11.116 ± 0.049 18.029 ± 0.03837 IC-0627034 Bogapani/Tinsukia/Assam 35.657 ± 0.037 10.261 ± 0.082 24.533 ± 0.05138 IC-0627032 Sepon T.E/Dibrugarh/Assam 39.754 ± 0.021 11.103 ± 0.076 22.976 ± 0.03939 IC-0627031 Gangabari T.E./Tinsukia/Assam 19.057 ± 0.069 9.474 ± 0.048 38.826 ± 0.08240 IC-0627028 Angkailongdi/Senapati/Manipur 40.541 ± 0.075 11.978 ± 0.024 22.376 ± 0.06141 IC-0627030 Tuithapi/Churachandpur/Manipur 46.781 ± 0.043 13.714 ± 0.037 20.406 ± 0.05042 IC-0627026 Japhou/Chandel/Manipur 44.400 ± 0.019 12.677 ± 0.095 19.164 ± 0.03943 IC-0627027 Kalika/Imphal East/Manipur 41.479 ± 0.038 11.134 ± 0.042 21.566 ± 0.01744 IC-0627024 Gumte/East Kameng/AP 49.090 ± 0.013 13.578 ± 0.074 17.144 ± 0.04245 IC-0627025 Silluk/East Siang/AP 38.012 ± 0.032 10.726 ± 0.056 22.645 ± 0.01346 IC-0627023 Jangda/Tawang/AP 45.200 ± 0.068 11.486 ± 0.057 19.139 ± 0.06547 IC-0627022 Boleng/East Siang/AP 36.825 ± 0.024 9.661 ± 0.049 20.483 ± 0.03948 IC-0627021 Picha/Kurungkumey/AP 42.863 ± 0.055 15.486 ± 008 21.574 ± 0.02749 IC-0627054 Sarojini T.E/Dibrugarh/Assam 43.105 ± 0.037 14.106 ± 0.029 18.136 ± 0.03450 IC-0627043 Manjha/Karbianglong/Assam 41.864 ± 0.022 13.929 ± 0.045 23.171 ± 0.01751 IC-0626995 Itanagar/Itanagar/AP 20.119 ± 0.039 14.112 ± 0.017 35.834 ± 0.04552 IC-0627060 Ananda T.E/North Lakhimpur/Assam 49.543 ± 0.046 10.153 ± 0.013 18.670 ± 0.08253 IC-0627055 Birjhora T.E/Bongaigaon/Assam 44.487 ± 0.061 11.503 ± 0.072 12.079 ± 0.04254 IC-0626994 Jang/Tawang/AP 42.225 ± 0.046 13.442 ± 0.095 17.160 ± 0.05255 IC-0627059 Dolohat T.E/North Lakhimpur/ Assam 45.059 ± 0.074 13.200 ± 0.024 16.611 ± 0.05956 IC-0627012 Karbianglong/Karbianglong/Assam 22.730 ± 0.043 11.733 ± 0.027 22.741 ± 0.03857 IC-0626998 Golaghat/Golaghat/Assam 43.068 ± 0.052 9.637 ± 0.078 21.123 ± 0.01458 IC-0627013 Umiam/ Ri Bhoi/Meghalaya 21.914 ± 0.024 9.986 ± 0.132 34.194 ± 0.15459 IC-0627001 Mariani/Jorhat/Assam 42.346 ± 0.092 15.290 ± 0.014 18.762 ± 0.04360 IC-0627029 Saikot/Churachandpur/Manipur 44.850 ± 0.089 13.011 ± 0.046 22.343 ± 0.05761 IC-0627009 Nagaon/Nagaon/Assam 2.356 ± 0.048 0.000 0.00062 IC-0627014 Barpeta/Barpeta/Assam 45.857 ± 0.074 13.245 ± 0.016 19.208 ± 0.06163 IC-0626996 Rupa/West Kameng/AP 45.015 ± 0.062 12.879 ± 0.047 19.924 ± 0.03564 IC-0626999 Golaghat/Golaghat/Assam 3.559 ± 0.071 10.532 ± 0.063 22.834 ± 0.05465 IC-0626997 Golaghat/Golaghat/Assam 2.703 ± 0.083 2.682 ± 0.075 2.967 ± 0.07366 IC-0627000 Mariani/Jorhat/Assam 40.551 ± 0.069 10.816 ± 0.021 21.960 ± 0.05667 IC-0627011 Karbianglong/Karbianglong/Assam 21.393 ± 0.007 9.147 ± 0.084 38.883 ± 0.03768 IC-0627061 Harmoti T.E/North Lakhimpur/Assam 43.561 ± 0.045 9.567 ± 0.063 21.127 ± 0.05069 IC-0626992 Tippi/West Kameng/AP 40.386 ± 0.037 11.145 ± 0.029 19.420 ± 0.01070 IC-0627053 Tingkhong T.E/Dibrugarh/Assam 40.309 ± 0.023 10.628 ± 0.031 18.320 ± 0.08171 IC-0627007 Moran/Dibrugarh/Assam 38.334 ± 0.045 11.773 ± 0.018 20.003 ± 0.06372 IC-0627008 Dibrugarh/Dibrugarh/Assam 2.578 ± 0.012 0.000 0.000
GPS: global positioning system, IC.: Indigenous collection.
This helps in the conservation of genetic resources; utilization of the germplasm forscreening of elite genotypes; for the development of superior genotypes by crossing orgenetic modification of the genes responsible for economic yield; and for the transformationof genotypes with disease resistant, stress and pest tolerance traits. It is the most effectiveway of conserving all genes present in the germplasm for a long duration and can beregenerated whenever required. This can serve as a resource house for essential and newlyidentified genes, thereby creating a genetic information library.
2.1. SSR Primer Competency
Initially, 45 SSR primer pairs were selected based on the literature review of thegenus Cymbopogon and procured from Bioserve Biotechnologies (India) Private Limited,Hyderabad. Primer testing was performed using 45 SSR primer pairs, of which 28 primerpairs were found to be efficient for the analysis, showing good amplification and clear
Plants 2022, 11, 528 5 of 20
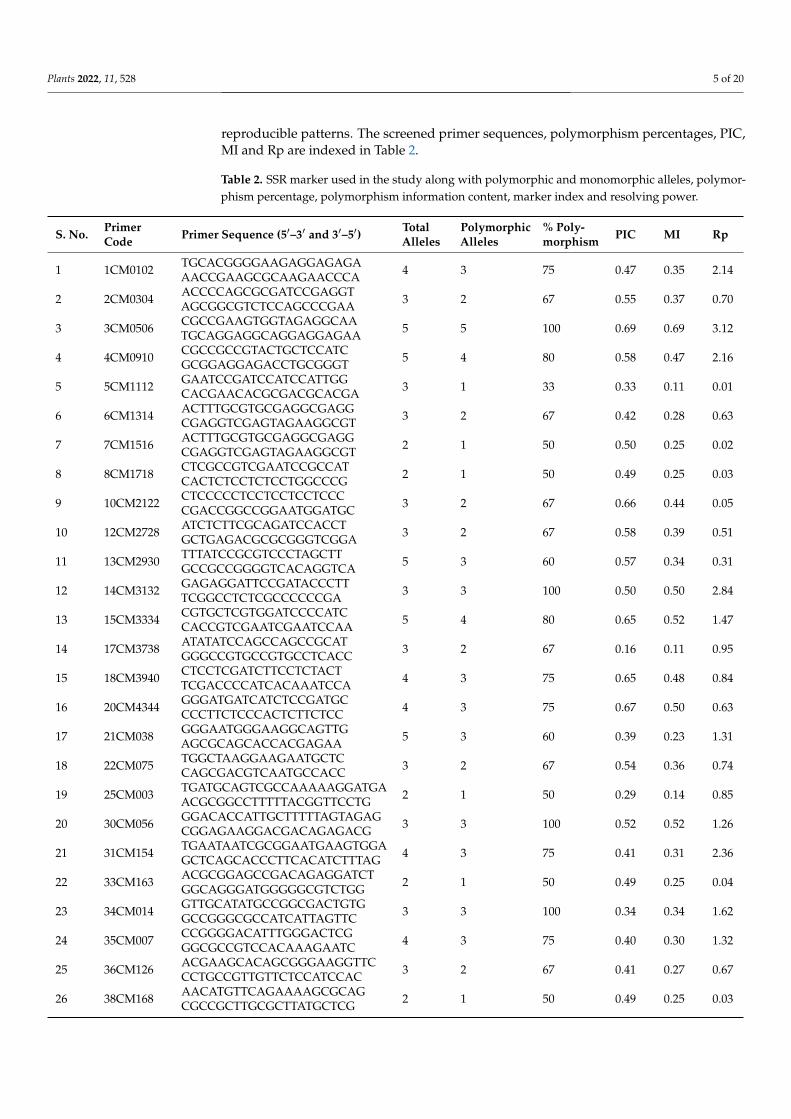
reproducible patterns. The screened primer sequences, polymorphism percentages, PIC,MI and Rp are indexed in Table 2.
Table 2. SSR marker used in the study along with polymorphic and monomorphic alleles, polymor-phism percentage, polymorphism information content, marker index and resolving power.
S. No. PrimerCode Primer Sequence (5′–3′ and 3′–5′) Total
AllelesPolymorphicAlleles
% Poly-morphism PIC MI Rp
1 1CM0102 TGCACGGGGAAGAGGAGAGAAACCGAAGCGCAAGAACCCA 4 3 75 0.47 0.35 2.14
2 2CM0304 ACCCCAGCGCGATCCGAGGTAGCGGCGTCTCCAGCCCGAA 3 2 67 0.55 0.37 0.70
3 3CM0506 CGCCGAAGTGGTAGAGGCAATGCAGGAGGCAGGAGGAGAA 5 5 100 0.69 0.69 3.12
4 4CM0910 CGCCGCCGTACTGCTCCATCGCGGAGGAGACCTGCGGGT 5 4 80 0.58 0.47 2.16
5 5CM1112 GAATCCGATCCATCCATTGGCACGAACACGCGACGCACGA 3 1 33 0.33 0.11 0.01
6 6CM1314 ACTTTGCGTGCGAGGCGAGGCGAGGTCGAGTAGAAGGCGT 3 2 67 0.42 0.28 0.63
7 7CM1516 ACTTTGCGTGCGAGGCGAGGCGAGGTCGAGTAGAAGGCGT 2 1 50 0.50 0.25 0.02
8 8CM1718 CTCGCCGTCGAATCCGCCATCACTCTCCTCTCCTGGCCCG 2 1 50 0.49 0.25 0.03
9 10CM2122 CTCCCCCTCCTCCTCCTCCCCGACCGGCCGGAATGGATGC 3 2 67 0.66 0.44 0.05
10 12CM2728 ATCTCTTCGCAGATCCACCTGCTGAGACGCGCGGGTCGGA 3 2 67 0.58 0.39 0.51
11 13CM2930 TTTATCCGCGTCCCTAGCTTGCCGCCGGGGTCACAGGTCA 5 3 60 0.57 0.34 0.31
12 14CM3132 GAGAGGATTCCGATACCCTTTCGGCCTCTCGCCCCCCGA 3 3 100 0.50 0.50 2.84
13 15CM3334 CGTGCTCGTGGATCCCCATCCACCGTCGAATCGAATCCAA 5 4 80 0.65 0.52 1.47
14 17CM3738 ATATATCCAGCCAGCCGCATGGGCCGTGCCGTGCCTCACC 3 2 67 0.16 0.11 0.95
15 18CM3940 CTCCTCGATCTTCCTCTACTTCGACCCCATCACAAATCCA 4 3 75 0.65 0.48 0.84
16 20CM4344 GGGATGATCATCTCCGATGCCCCTTCTCCCACTCTTCTCC 4 3 75 0.67 0.50 0.63
17 21CM038 GGGAATGGGAAGGCAGTTGAGCGCAGCACCACGAGAA 5 3 60 0.39 0.23 1.31
18 22CM075 TGGCTAAGGAAGAATGCTCCAGCGACGTCAATGCCACC 3 2 67 0.54 0.36 0.74
19 25CM003 TGATGCAGTCGCCAAAAAGGATGAACGCGGCCTTTTTACGGTTCCTG 2 1 50 0.29 0.14 0.85
20 30CM056 GGACACCATTGCTTTTTAGTAGAGCGGAGAAGGACGACAGAGACG 3 3 100 0.52 0.52 1.26
21 31CM154 TGAATAATCGCGGAATGAAGTGGAGCTCAGCACCCTTCACATCTTTAG 4 3 75 0.41 0.31 2.36
22 33CM163 ACGCGGAGCCGACAGAGGATCTGGCAGGGATGGGGGCGTCTGG 2 1 50 0.49 0.25 0.04
23 34CM014 GTTGCATATGCCGGCGACTGTGGCCGGGCGCCATCATTAGTTC 3 3 100 0.34 0.34 1.62
24 35CM007 CCGGGGACATTTGGGACTCGGGCGCCGTCCACAAAGAATC 4 3 75 0.40 0.30 1.32
25 36CM126 ACGAAGCACAGCGGGAAGGTTCCCTGCCGTTGTTCTCCATCCAC 3 2 67 0.41 0.27 0.67
26 38CM168 AACATGTTCAGAAAAGCGCAGCGCCGCTTGCGCTTATGCTCG 2 1 50 0.49 0.25 0.03
Plants 2022, 11, 528 6 of 20
Table 2. Cont.
S. No. PrimerCode Primer Sequence (5′–3′ and 3′–5′) Total
AllelesPolymorphicAlleles
% Poly-morphism PIC MI Rp
27 39CM125 CGATGCAGCGCGAGAGTAGAGAAACCTTCCCGCTGCTTCGTGCA 2 1 50 0.49 0.24 0.05
28 42CM128 CGTTTGCGCGAAGAGCCCTACCCCCGCACGCCATCCCCAACCA 2 1 50 0.47 0.24 0.11
Total 92 65 1907 13.71 9.5 26.77
Average 3.29 2.32 68.10 0.49 0.34 0.96
Standard deviation 1.05 1.09 17.49 0.12 0.14 0.90
PIC: polymorphism information content, MI: marker index, Rp: resolving power.
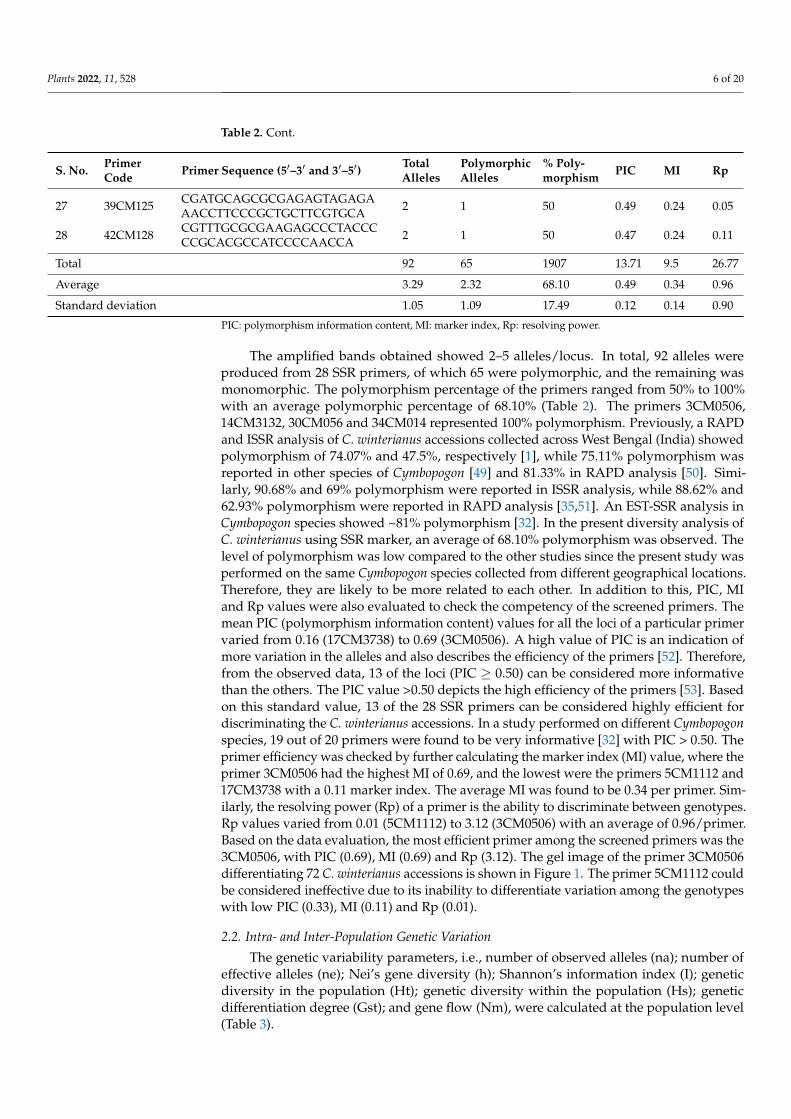
The amplified bands obtained showed 2–5 alleles/locus. In total, 92 alleles wereproduced from 28 SSR primers, of which 65 were polymorphic, and the remaining wasmonomorphic. The polymorphism percentage of the primers ranged from 50% to 100%with an average polymorphic percentage of 68.10% (Table 2). The primers 3CM0506,14CM3132, 30CM056 and 34CM014 represented 100% polymorphism. Previously, a RAPDand ISSR analysis of C. winterianus accessions collected across West Bengal (India) showedpolymorphism of 74.07% and 47.5%, respectively [1], while 75.11% polymorphism wasreported in other species of Cymbopogon [49] and 81.33% in RAPD analysis [50]. Simi-larly, 90.68% and 69% polymorphism were reported in ISSR analysis, while 88.62% and62.93% polymorphism were reported in RAPD analysis [35,51]. An EST-SSR analysis inCymbopogon species showed ~81% polymorphism [32]. In the present diversity analysis ofC. winterianus using SSR marker, an average of 68.10% polymorphism was observed. Thelevel of polymorphism was low compared to the other studies since the present study wasperformed on the same Cymbopogon species collected from different geographical locations.Therefore, they are likely to be more related to each other. In addition to this, PIC, MIand Rp values were also evaluated to check the competency of the screened primers. Themean PIC (polymorphism information content) values for all the loci of a particular primervaried from 0.16 (17CM3738) to 0.69 (3CM0506). A high value of PIC is an indication ofmore variation in the alleles and also describes the efficiency of the primers [52]. Therefore,from the observed data, 13 of the loci (PIC ≥ 0.50) can be considered more informativethan the others. The PIC value >0.50 depicts the high efficiency of the primers [53]. Basedon this standard value, 13 of the 28 SSR primers can be considered highly efficient fordiscriminating the C. winterianus accessions. In a study performed on different Cymbopogonspecies, 19 out of 20 primers were found to be very informative [32] with PIC > 0.50. Theprimer efficiency was checked by further calculating the marker index (MI) value, where theprimer 3CM0506 had the highest MI of 0.69, and the lowest were the primers 5CM1112 and17CM3738 with a 0.11 marker index. The average MI was found to be 0.34 per primer. Sim-ilarly, the resolving power (Rp) of a primer is the ability to discriminate between genotypes.Rp values varied from 0.01 (5CM1112) to 3.12 (3CM0506) with an average of 0.96/primer.Based on the data evaluation, the most efficient primer among the screened primers was the3CM0506, with PIC (0.69), MI (0.69) and Rp (3.12). The gel image of the primer 3CM0506differentiating 72 C. winterianus accessions is shown in Figure 1. The primer 5CM1112 couldbe considered ineffective due to its inability to differentiate variation among the genotypeswith low PIC (0.33), MI (0.11) and Rp (0.01).
2.2. Intra- and Inter-Population Genetic Variation
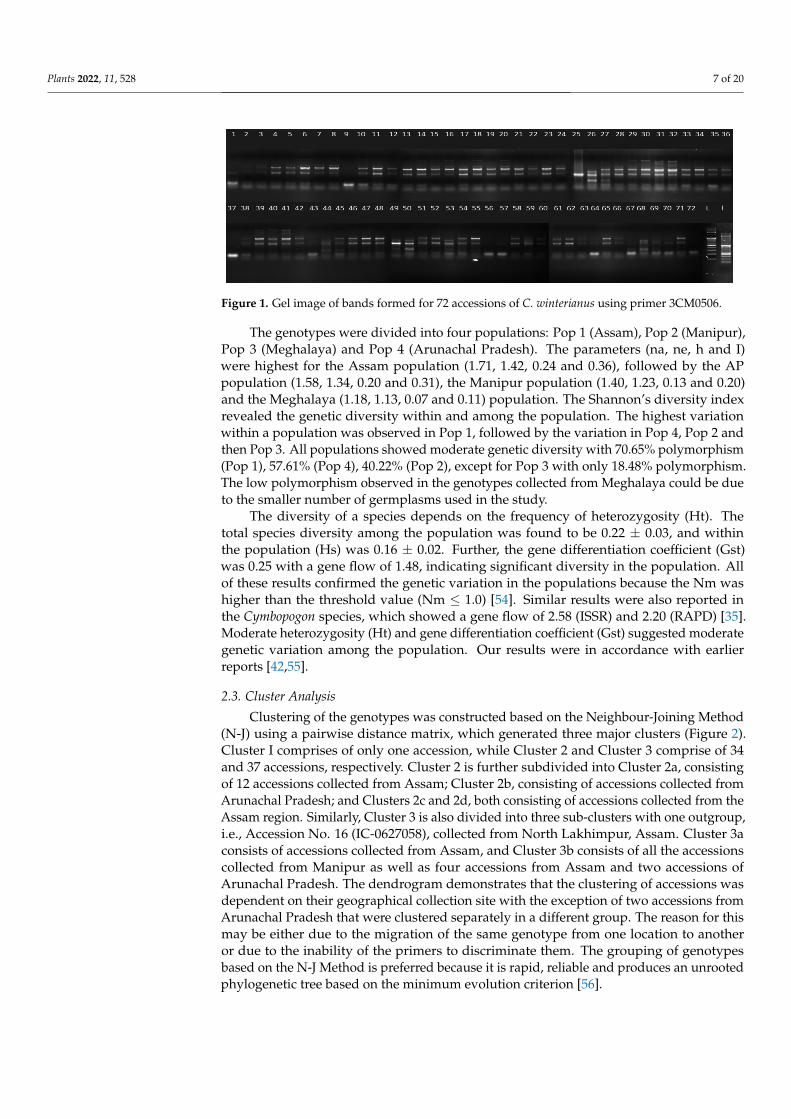
The genetic variability parameters, i.e., number of observed alleles (na); number ofeffective alleles (ne); Nei’s gene diversity (h); Shannon’s information index (I); geneticdiversity in the population (Ht); genetic diversity within the population (Hs); geneticdifferentiation degree (Gst); and gene flow (Nm), were calculated at the population level(Table 3).
Plants 2022, 11, 528 7 of 20Plants 2022, 11, x FOR PEER REVIEW 7 of 20
Figure 1. Gel image of bands formed for 72 accessions of C. winterianus using primer 3CM0506.
2.2. Intra- and Inter-Population Genetic Variation The genetic variability parameters, i.e., number of observed alleles (na); number of
effective alleles (ne); Nei’s gene diversity (h); Shannon’s information index (I); genetic di-versity in the population (Ht); genetic diversity within the population (Hs); genetic differ-entiation degree (Gst); and gene flow (Nm), were calculated at the population level (Table 3).
Table 3. Genetic diversity parameters of C. winterianus populations based on SSR primers.
S. No. C. winterianus Mean Polymorphic
% Ht Hs Gst Nm na ne h I
1. Pop 1 (Assam) 1.71 ± 0.46 1.42 ± 0.39 0.24 ± 0.20 0.36 ± 0.28 70.65
0.22 ± 0.03 0.16 ± 0.02 0.25 1.48
2. Pop 2 (Manipur) 1.40 ± 0.49 1.23 ± 0.34 0.13 ± 0.19 0.20 ± 0.27 40.22
3. Pop 3
(Meghalaya) 1.18 ± 0.39 1.13 ± 0.28 0.07 ± 0.16 0.11 ± 0.24 18.48
4. Pop 4 (Arunachal
Pradesh) 1.58 ± 0.50 1.34 ± 0.36 0.20 ± 0.20 0.31 ± 0.28 57.61
Mean 1.71 1.41 0.24 0.36 70.65
Standard deviation 0.46 0.38 0.20 0.27 na: observed number of alleles, ne: effective number of alleles [Kimura and Crow (1964)], h: Nei’s (1973) gene diversity, I: Shannon’s information index [Lewontin (1972)], Ht: total species diversity, Hs: diversity within population, Gst: gene differentiation coefficient, Nm: estimate of gene flow from Gst.
The genotypes were divided into four populations: Pop 1 (Assam), Pop 2 (Manipur), Pop 3 (Meghalaya) and Pop 4 (Arunachal Pradesh). The parameters (na, ne, h and I) were highest for the Assam population (1.71, 1.42, 0.24 and 0.36), followed by the AP population (1.58, 1.34, 0.20 and 0.31), the Manipur population (1.40, 1.23, 0.13 and 0.20) and the Me-ghalaya (1.18, 1.13, 0.07 and 0.11) population. The Shannon’s diversity index revealed the genetic diversity within and among the population. The highest variation within a popu-lation was observed in Pop 1, followed by the variation in Pop 4, Pop 2 and then Pop 3. All populations showed moderate genetic diversity with 70.65% polymorphism (Pop 1), 57.61% (Pop 4), 40.22% (Pop 2), except for Pop 3 with only 18.48% polymorphism. The low polymorphism observed in the genotypes collected from Meghalaya could be due to the smaller number of germplasms used in the study.
The diversity of a species depends on the frequency of heterozygosity (Ht). The total species diversity among the population was found to be 0.22 ± 0.03, and within the popu-lation (Hs) was 0.16 ± 0.02. Further, the gene differentiation coefficient (Gst) was 0.25 with a gene flow of 1.48, indicating significant diversity in the population. All of these results confirmed the genetic variation in the populations because the Nm was higher than the threshold value (Nm ≤ 1.0) [54]. Similar results were also reported in the Cymbopogon spe-cies, which showed a gene flow of 2.58 (ISSR) and 2.20 (RAPD) [35]. Moderate
Figure 1. Gel image of bands formed for 72 accessions of C. winterianus using primer 3CM0506.
The genotypes were divided into four populations: Pop 1 (Assam), Pop 2 (Manipur),Pop 3 (Meghalaya) and Pop 4 (Arunachal Pradesh). The parameters (na, ne, h and I)were highest for the Assam population (1.71, 1.42, 0.24 and 0.36), followed by the APpopulation (1.58, 1.34, 0.20 and 0.31), the Manipur population (1.40, 1.23, 0.13 and 0.20)and the Meghalaya (1.18, 1.13, 0.07 and 0.11) population. The Shannon’s diversity indexrevealed the genetic diversity within and among the population. The highest variationwithin a population was observed in Pop 1, followed by the variation in Pop 4, Pop 2 andthen Pop 3. All populations showed moderate genetic diversity with 70.65% polymorphism(Pop 1), 57.61% (Pop 4), 40.22% (Pop 2), except for Pop 3 with only 18.48% polymorphism.The low polymorphism observed in the genotypes collected from Meghalaya could be dueto the smaller number of germplasms used in the study.
The diversity of a species depends on the frequency of heterozygosity (Ht). Thetotal species diversity among the population was found to be 0.22 ± 0.03, and withinthe population (Hs) was 0.16 ± 0.02. Further, the gene differentiation coefficient (Gst)was 0.25 with a gene flow of 1.48, indicating significant diversity in the population. Allof these results confirmed the genetic variation in the populations because the Nm washigher than the threshold value (Nm ≤ 1.0) [54]. Similar results were also reported inthe Cymbopogon species, which showed a gene flow of 2.58 (ISSR) and 2.20 (RAPD) [35].Moderate heterozygosity (Ht) and gene differentiation coefficient (Gst) suggested moderategenetic variation among the population. Our results were in accordance with earlierreports [42,55].
2.3. Cluster Analysis
Clustering of the genotypes was constructed based on the Neighbour-Joining Method(N-J) using a pairwise distance matrix, which generated three major clusters (Figure 2).Cluster I comprises of only one accession, while Cluster 2 and Cluster 3 comprise of 34and 37 accessions, respectively. Cluster 2 is further subdivided into Cluster 2a, consistingof 12 accessions collected from Assam; Cluster 2b, consisting of accessions collected fromArunachal Pradesh; and Clusters 2c and 2d, both consisting of accessions collected from theAssam region. Similarly, Cluster 3 is also divided into three sub-clusters with one outgroup,i.e., Accession No. 16 (IC-0627058), collected from North Lakhimpur, Assam. Cluster 3aconsists of accessions collected from Assam, and Cluster 3b consists of all the accessionscollected from Manipur as well as four accessions from Assam and two accessions ofArunachal Pradesh. The dendrogram demonstrates that the clustering of accessions wasdependent on their geographical collection site with the exception of two accessions fromArunachal Pradesh that were clustered separately in a different group. The reason for thismay be either due to the migration of the same genotype from one location to anotheror due to the inability of the primers to discriminate them. The grouping of genotypesbased on the N-J Method is preferred because it is rapid, reliable and produces an unrootedphylogenetic tree based on the minimum evolution criterion [56].
Plants 2022, 11, 528 8 of 20
Table 3. Genetic diversity parameters of C. winterianus populations based on SSR primers.
S. No. C. winterianusMean Polymorphic % Ht Hs Gst Nm
na ne h I
1. Pop 1 (Assam) 1.71 ± 0.46 1.42 ± 0.39 0.24 ± 0.20 0.36 ± 0.28 70.65
0.22 ± 0.03 0.16 ± 0.02 0.25 1.482. Pop 2 (Manipur) 1.40 ± 0.49 1.23 ± 0.34 0.13 ± 0.19 0.20 ± 0.27 40.223. Pop 3 (Meghalaya) 1.18 ± 0.39 1.13 ± 0.28 0.07 ± 0.16 0.11 ± 0.24 18.484. Pop 4 (Arunachal Pradesh) 1.58 ± 0.50 1.34 ± 0.36 0.20 ± 0.20 0.31 ± 0.28 57.61
Mean 1.71 1.41 0.24 0.36 70.65
Standard deviation 0.46 0.38 0.20 0.27
na: observed number of alleles, ne: effective number of alleles [Kimura and Crow (1964)], h: Nei’s (1973) gene diversity, I: Shannon’s information index [Lewontin (1972)], Ht: totalspecies diversity, Hs: diversity within population, Gst: gene differentiation coefficient, Nm: estimate of gene flow from Gst.
Plants 2022, 11, 528 9 of 20
Plants 2022, 11, x FOR PEER REVIEW 8 of 20
heterozygosity (Ht) and gene differentiation coefficient (Gst) suggested moderate genetic variation among the population. Our results were in accordance with earlier reports [42,55].
2.3. Cluster Analysis Clustering of the genotypes was constructed based on the Neighbour-Joining
Method (N-J) using a pairwise distance matrix, which generated three major clusters (Fig-ure 2). Cluster I comprises of only one accession, while Cluster 2 and Cluster 3 comprise of 34 and 37 accessions, respectively. Cluster 2 is further subdivided into Cluster 2a, con-sisting of 12 accessions collected from Assam; Cluster 2b, consisting of accessions collected from Arunachal Pradesh; and Clusters 2c and 2d, both consisting of accessions collected from the Assam region. Similarly, Cluster 3 is also divided into three sub-clusters with one outgroup, i.e., Accession No. 16 (IC-0627058), collected from North Lakhimpur, As-sam. Cluster 3a consists of accessions collected from Assam, and Cluster 3b consists of all the accessions collected from Manipur as well as four accessions from Assam and two accessions of Arunachal Pradesh. The dendrogram demonstrates that the clustering of ac-cessions was dependent on their geographical collection site with the exception of two accessions from Arunachal Pradesh that were clustered separately in a different group. The reason for this may be either due to the migration of the same genotype from one location to another or due to the inability of the primers to discriminate them. The group-ing of genotypes based on the N-J Method is preferred because it is rapid, reliable and produces an unrooted phylogenetic tree based on the minimum evolution criterion [56].
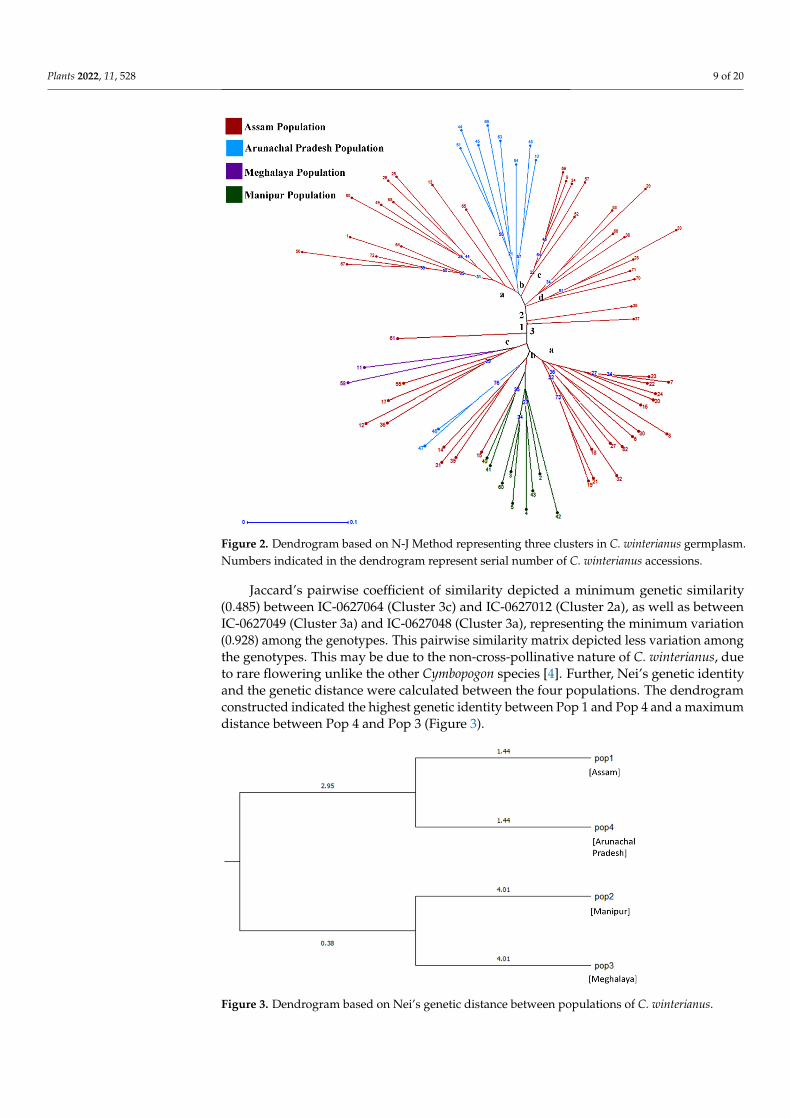
Figure 2. Dendrogram based on N-J Method representing three clusters in C. winterianus germplasm. Numbers indicated in the dendrogram represent serial number of C. winterianus acces-sions.
Figure 2. Dendrogram based on N-J Method representing three clusters in C. winterianus germplasm.Numbers indicated in the dendrogram represent serial number of C. winterianus accessions.
Jaccard’s pairwise coefficient of similarity depicted a minimum genetic similarity(0.485) between IC-0627064 (Cluster 3c) and IC-0627012 (Cluster 2a), as well as betweenIC-0627049 (Cluster 3a) and IC-0627048 (Cluster 3a), representing the minimum variation(0.928) among the genotypes. This pairwise similarity matrix depicted less variation amongthe genotypes. This may be due to the non-cross-pollinative nature of C. winterianus, dueto rare flowering unlike the other Cymbopogon species [4]. Further, Nei’s genetic identityand the genetic distance were calculated between the four populations. The dendrogramconstructed indicated the highest genetic identity between Pop 1 and Pop 4 and a maximumdistance between Pop 4 and Pop 3 (Figure 3).
Plants 2022, 11, x FOR PEER REVIEW 9 of 20
Jaccard’s pairwise coefficient of similarity depicted a minimum genetic similarity (0.485) between IC-0627064 (Cluster 3c) and IC-0627012 (Cluster 2a), as well as between IC-0627049 (Cluster 3a) and IC-0627048 (Cluster 3a), representing the minimum variation (0.928) among the genotypes. This pairwise similarity matrix depicted less variation among the genotypes. This may be due to the non-cross-pollinative nature of C. winteri-anus, due to rare flowering unlike the other Cymbopogon species [4]. Further, Nei’s genetic identity and the genetic distance were calculated between the four populations. The den-drogram constructed indicated the highest genetic identity between Pop 1 and Pop 4 and a maximum distance between Pop 4 and Pop 3 (Figure 3).
Figure 3. Dendrogram based on Nei’s genetic distance between populations of C. winterianus.
Nei’s genetic identity and the genetic distance between the four populations showed low variation, indicating the gene exchange or duplication of germplasms between adja-cent geographical populations [57]. In Cymbopogon winterianus, due to the presence of very rare flowering, the gene exchange is not carried out by pollens or seed. Therefore, we can interpret that the factors affecting the gene flow are mainly due to human interference, such as genetic swamping, genetic rescue, hybridization and urbanization.
The basis of a multivariate analysis is a principal component analysis which is an approximation of the data table provided by the analysis [58]. A field representation of variability can be provided by utilizing the PCA. The PCA is very useful for determining the similarity of samples as the non-similar samples become further apart in the presen-tation [36]. Population structure analysis and the PCA are used widely to visualize the structure of the data [59]. Therefore, the PCA was performed for the 72 accessions of C. winterianus to check the variability and relationships among them, which is represented in the biplot (Figure 4).
Figure 3. Dendrogram based on Nei’s genetic distance between populations of C. winterianus.
Plants 2022, 11, 528 10 of 20
Nei’s genetic identity and the genetic distance between the four populations showedlow variation, indicating the gene exchange or duplication of germplasms between adjacentgeographical populations [57]. In Cymbopogon winterianus, due to the presence of veryrare flowering, the gene exchange is not carried out by pollens or seed. Therefore, we caninterpret that the factors affecting the gene flow are mainly due to human interference, suchas genetic swamping, genetic rescue, hybridization and urbanization.
The basis of a multivariate analysis is a principal component analysis which is anapproximation of the data table provided by the analysis [58]. A field representation ofvariability can be provided by utilizing the PCA. The PCA is very useful for determiningthe similarity of samples as the non-similar samples become further apart in the presen-tation [36]. Population structure analysis and the PCA are used widely to visualize thestructure of the data [59]. Therefore, the PCA was performed for the 72 accessions ofC. winterianus to check the variability and relationships among them, which is representedin the biplot (Figure 4).
Plants 2022, 11, x FOR PEER REVIEW 10 of 20
Figure 4. Principal component analysis of all accessions of C. winterianus collected from different regions of NE India.
The Eigen values are higher in the first three groups (1.91, 0.99 and 0.69), which show a greater contribution to the explanation of variances among the accessions. The total cu-mulative variance observed for the fourteen principal components accounted for 69.33% of the variance, of which 16.09%, 8.36% and 5.77% of the variance was contributed by the first, second and third principal components, respectively (Table 4).
Table 4. Eigen value, % variance and cumulative variance of principal component analysis based on SSR marker.
PC Eigen Value % Variance Cumulative Variance 1 1.91 16.09 16.09 2 0.99 8.36 24.45 3 0.69 5.77 30.22 4 0.67 5.61 35.83 5 0.54 4.56 40.31 6 0.53 4.42 44.81 7 0.48 4.07 48.88 8 0.46 3.86 52.74 9 0.40 3.38 56.12 10 0.35 2.96 59.08 11 0.34 2.88 61.96 12 0.30 2.54 64.50 13 0.30 2.49 66.99 14 0.28 2.34 69.33
A cluster analysis along with the PCA based on molecular marker data help in the extraction of maximum information if the first three principal components account for more than 25% variance [60]. The present analysis revealed that the first three components contribute to 30.22% variance, which is in accordance with the previous study. The PCA plot resembled the cluster formed in the dendrogram, although some diversions of the accessions were observed on the PCA plot (Figure 4).
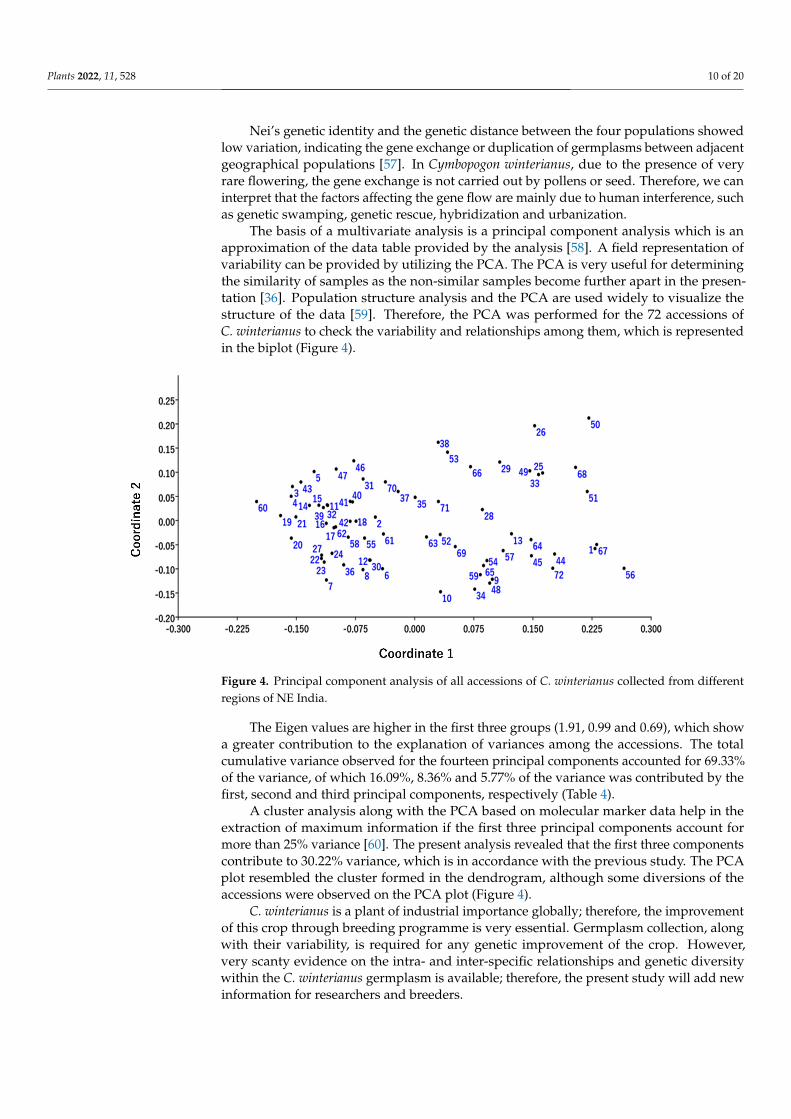
Figure 4. Principal component analysis of all accessions of C. winterianus collected from differentregions of NE India.
The Eigen values are higher in the first three groups (1.91, 0.99 and 0.69), which showa greater contribution to the explanation of variances among the accessions. The totalcumulative variance observed for the fourteen principal components accounted for 69.33%of the variance, of which 16.09%, 8.36% and 5.77% of the variance was contributed by thefirst, second and third principal components, respectively (Table 4).
A cluster analysis along with the PCA based on molecular marker data help in theextraction of maximum information if the first three principal components account formore than 25% variance [60]. The present analysis revealed that the first three componentscontribute to 30.22% variance, which is in accordance with the previous study. The PCAplot resembled the cluster formed in the dendrogram, although some diversions of theaccessions were observed on the PCA plot (Figure 4).
C. winterianus is a plant of industrial importance globally; therefore, the improvementof this crop through breeding programme is very essential. Germplasm collection, alongwith their variability, is required for any genetic improvement of the crop. However,very scanty evidence on the intra- and inter-specific relationships and genetic diversitywithin the C. winterianus germplasm is available; therefore, the present study will add newinformation for researchers and breeders.
Plants 2022, 11, 528 11 of 20
Table 4. Eigen value, % variance and cumulative variance of principal component analysis based onSSR marker.
PC Eigen Value % Variance Cumulative Variance
1 1.91 16.09 16.092 0.99 8.36 24.453 0.69 5.77 30.224 0.67 5.61 35.835 0.54 4.56 40.316 0.53 4.42 44.817 0.48 4.07 48.888 0.46 3.86 52.749 0.40 3.38 56.1210 0.35 2.96 59.0811 0.34 2.88 61.9612 0.30 2.54 64.5013 0.30 2.49 66.9914 0.28 2.34 69.33
2.4. Population Structure
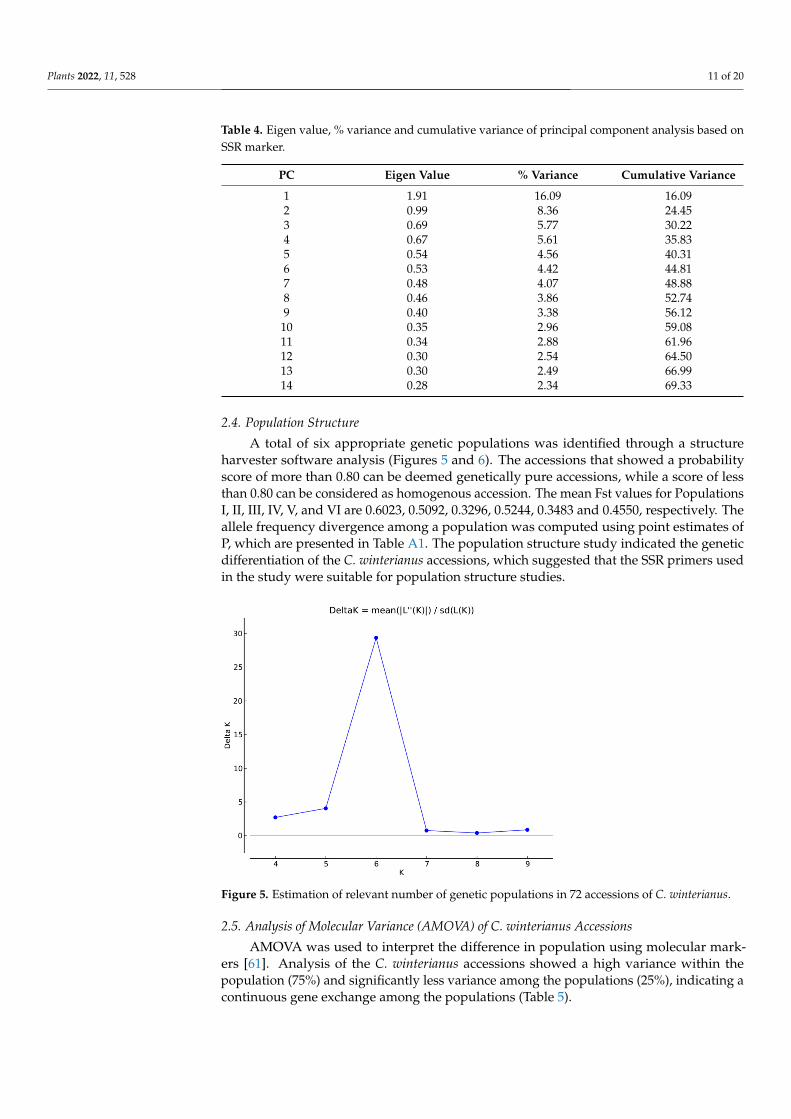
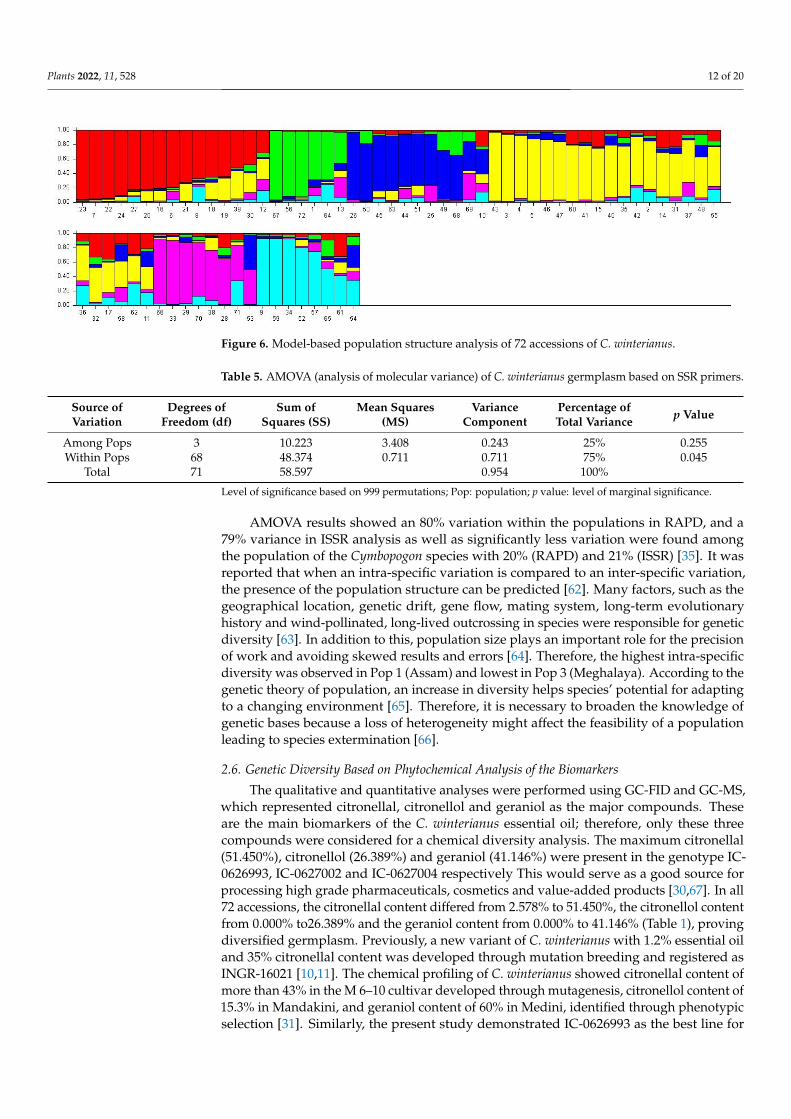
A total of six appropriate genetic populations was identified through a structureharvester software analysis (Figures 5 and 6). The accessions that showed a probabilityscore of more than 0.80 can be deemed genetically pure accessions, while a score of lessthan 0.80 can be considered as homogenous accession. The mean Fst values for PopulationsI, II, III, IV, V, and VI are 0.6023, 0.5092, 0.3296, 0.5244, 0.3483 and 0.4550, respectively. Theallele frequency divergence among a population was computed using point estimates ofP, which are presented in Table A1. The population structure study indicated the geneticdifferentiation of the C. winterianus accessions, which suggested that the SSR primers usedin the study were suitable for population structure studies.
Plants 2022, 11, x FOR PEER REVIEW 11 of 20
C. winterianus is a plant of industrial importance globally; therefore, the improvement of this crop through breeding programme is very essential. Germplasm collection, along with their variability, is required for any genetic improvement of the crop. However, very scanty evidence on the intra- and inter-specific relationships and genetic diversity within the C. winterianus germplasm is available; therefore, the present study will add new infor-mation for researchers and breeders.
2.4. Population Structure A total of six appropriate genetic populations was identified through a structure har-
vester software analysis (Figures 5 and 6). The accessions that showed a probability score of more than 0.80 can be deemed genetically pure accessions, while a score of less than 0.80 can be considered as homogenous accession. The mean Fst values for Populations I, II, III, IV, V, and VI are 0.6023, 0.5092, 0.3296, 0.5244, 0.3483 and 0.4550, respectively. The allele frequency divergence among a population was computed using point estimates of P, which are presented in Table A1. The population structure study indicated the genetic differentiation of the C. winterianus accessions, which suggested that the SSR primers used in the study were suitable for population structure studies.
Figure 5. Estimation of relevant number of genetic populations in 72 accessions of C. winterianus.
Figure 6. Model-based population structure analysis of 72 accessions of C. winterianus.
2.5. Analysis of Molecular Variance (AMOVA) of C. winterianus Accessions
Figure 5. Estimation of relevant number of genetic populations in 72 accessions of C. winterianus.
2.5. Analysis of Molecular Variance (AMOVA) of C. winterianus Accessions
AMOVA was used to interpret the difference in population using molecular mark-ers [61]. Analysis of the C. winterianus accessions showed a high variance within thepopulation (75%) and significantly less variance among the populations (25%), indicating acontinuous gene exchange among the populations (Table 5).
Plants 2022, 11, 528 12 of 20
Plants 2022, 11, x FOR PEER REVIEW 11 of 20
C. winterianus is a plant of industrial importance globally; therefore, the improvement of this crop through breeding programme is very essential. Germplasm collection, along with their variability, is required for any genetic improvement of the crop. However, very scanty evidence on the intra- and inter-specific relationships and genetic diversity within the C. winterianus germplasm is available; therefore, the present study will add new infor-mation for researchers and breeders.
2.4. Population Structure A total of six appropriate genetic populations was identified through a structure har-
vester software analysis (Figures 5 and 6). The accessions that showed a probability score of more than 0.80 can be deemed genetically pure accessions, while a score of less than 0.80 can be considered as homogenous accession. The mean Fst values for Populations I, II, III, IV, V, and VI are 0.6023, 0.5092, 0.3296, 0.5244, 0.3483 and 0.4550, respectively. The allele frequency divergence among a population was computed using point estimates of P, which are presented in Table A1. The population structure study indicated the genetic differentiation of the C. winterianus accessions, which suggested that the SSR primers used in the study were suitable for population structure studies.
Figure 5. Estimation of relevant number of genetic populations in 72 accessions of C. winterianus.
Figure 6. Model-based population structure analysis of 72 accessions of C. winterianus.
2.5. Analysis of Molecular Variance (AMOVA) of C. winterianus Accessions
Figure 6. Model-based population structure analysis of 72 accessions of C. winterianus.
Table 5. AMOVA (analysis of molecular variance) of C. winterianus germplasm based on SSR primers.
Source ofVariation
Degrees ofFreedom (df)
Sum ofSquares (SS)
Mean Squares(MS)
VarianceComponent
Percentage ofTotal Variance p Value
Among Pops 3 10.223 3.408 0.243 25% 0.255Within Pops 68 48.374 0.711 0.711 75% 0.045
Total 71 58.597 0.954 100%
Level of significance based on 999 permutations; Pop: population; p value: level of marginal significance.
AMOVA results showed an 80% variation within the populations in RAPD, and a79% variance in ISSR analysis as well as significantly less variation were found amongthe population of the Cymbopogon species with 20% (RAPD) and 21% (ISSR) [35]. It wasreported that when an intra-specific variation is compared to an inter-specific variation,the presence of the population structure can be predicted [62]. Many factors, such as thegeographical location, genetic drift, gene flow, mating system, long-term evolutionaryhistory and wind-pollinated, long-lived outcrossing in species were responsible for geneticdiversity [63]. In addition to this, population size plays an important role for the precisionof work and avoiding skewed results and errors [64]. Therefore, the highest intra-specificdiversity was observed in Pop 1 (Assam) and lowest in Pop 3 (Meghalaya). According to thegenetic theory of population, an increase in diversity helps species’ potential for adaptingto a changing environment [65]. Therefore, it is necessary to broaden the knowledge ofgenetic bases because a loss of heterogeneity might affect the feasibility of a populationleading to species extermination [66].
2.6. Genetic Diversity Based on Phytochemical Analysis of the Biomarkers
The qualitative and quantitative analyses were performed using GC-FID and GC-MS,which represented citronellal, citronellol and geraniol as the major compounds. Theseare the main biomarkers of the C. winterianus essential oil; therefore, only these threecompounds were considered for a chemical diversity analysis. The maximum citronellal(51.450%), citronellol (26.389%) and geraniol (41.146%) were present in the genotype IC-0626993, IC-0627002 and IC-0627004 respectively This would serve as a good source forprocessing high grade pharmaceuticals, cosmetics and value-added products [30,67]. In all72 accessions, the citronellal content differed from 2.578% to 51.450%, the citronellol contentfrom 0.000% to26.389% and the geraniol content from 0.000% to 41.146% (Table 1), provingdiversified germplasm. Previously, a new variant of C. winterianus with 1.2% essential oiland 35% citronellal content was developed through mutation breeding and registered asINGR-16021 [10,11]. The chemical profiling of C. winterianus showed citronellal content ofmore than 43% in the M 6–10 cultivar developed through mutagenesis, citronellol content of15.3% in Mandakini, and geraniol content of 60% in Medini, identified through phenotypicselection [31]. Similarly, the present study demonstrated IC-0626993 as the best line for

Plants 2022, 11, 528 13 of 20
the citronellal content with 51.45%, while the genotypes IC-0627002 and IC-0627004 wererich in citronellol (26.38%) and geraniol (41.15%), respectively. All variants possessing highlevels of the three measured constituents were identified through selection that may befurther developed for superior lines. From the quantitative and qualitative analyses of theessential oil, IC-0627062 was identified as the ideal genotype with a commendable amountof the phytochemicals (citronellal: 48.48%, citronellol: 9.25% and geraniol: 20.48%). A GCchromatogram of germplasm (IC-0627062) is shown in Figure 7.
Plants 2022, 11, x FOR PEER REVIEW 13 of 20
Figure 7. Chromatogram representing GC analysis of the best line (IC-0627062) with high phyto-chemical contents (citronellal, citronellol and geraniol).
Apart from the molecular diversity analysis, a variation based on the essential oil constituents was performed by different researchers on different species of the genus Cymbopogon [36]. However, in the current study, diversity based on the phytochemical analysis of the essential oil was investigated in the same species of C. winterianus. There-fore, using these biomarkers, a dendrogram was constructed based on similarity, com-plete linkage and the Euclidean distance, which formed three clusters. Cluster I comprises nine accessions; Cluster II comprises fifty-eight, and the remaining five accessions come under Cluster III (Figure 8).
Figure 8. Dendrogram constructed based on the phytochemical diversity of C. winterianus acces-sions, representing three major clusters. The numbers indicated in the dendrogram represent the serial number of the C. winterianus accessions.
A boxplot graphical representation of these markers depicts that Cluster I involves the accessions with high citronellol and geraniol contents, while the Cluster II accessions
Figure 7. Chromatogram representing GC analysis of the best line (IC-0627062) with high phyto-chemical contents (citronellal, citronellol and geraniol).
Apart from the molecular diversity analysis, a variation based on the essential oilconstituents was performed by different researchers on different species of the genusCymbopogon [36]. However, in the current study, diversity based on the phytochemicalanalysis of the essential oil was investigated in the same species of C. winterianus. Therefore,using these biomarkers, a dendrogram was constructed based on similarity, completelinkage and the Euclidean distance, which formed three clusters. Cluster I comprises nineaccessions; Cluster II comprises fifty-eight, and the remaining five accessions come underCluster III (Figure 8).
Plants 2022, 11, x FOR PEER REVIEW 13 of 20
Figure 7. Chromatogram representing GC analysis of the best line (IC-0627062) with high phyto-chemical contents (citronellal, citronellol and geraniol).
Apart from the molecular diversity analysis, a variation based on the essential oil constituents was performed by different researchers on different species of the genus Cymbopogon [36]. However, in the current study, diversity based on the phytochemical analysis of the essential oil was investigated in the same species of C. winterianus. There-fore, using these biomarkers, a dendrogram was constructed based on similarity, com-plete linkage and the Euclidean distance, which formed three clusters. Cluster I comprises nine accessions; Cluster II comprises fifty-eight, and the remaining five accessions come under Cluster III (Figure 8).
Figure 8. Dendrogram constructed based on the phytochemical diversity of C. winterianus acces-sions, representing three major clusters. The numbers indicated in the dendrogram represent the serial number of the C. winterianus accessions.
A boxplot graphical representation of these markers depicts that Cluster I involves the accessions with high citronellol and geraniol contents, while the Cluster II accessions
Figure 8. Dendrogram constructed based on the phytochemical diversity of C. winterianus accessions,representing three major clusters. The numbers indicated in the dendrogram represent the serialnumber of the C. winterianus accessions.

Plants 2022, 11, 528 14 of 20
A boxplot graphical representation of these markers depicts that Cluster I involvesthe accessions with high citronellol and geraniol contents, while the Cluster II accessionswere high in citronellal content. Cluster III comprises the accessions with low levels of thecompounds measured (Figure 9).
Plants 2022, 11, x FOR PEER REVIEW 14 of 20
were high in citronellal content. Cluster III comprises the accessions with low levels of the compounds measured (Figure 9).
Figure 9. Boxplot of the major phytochemical markers along with their cluster mean values.
Previously, it was reported that C. winterianus is different from C. nardus in the con-text of the major constituent of the essential oil because the former contains citronellol as the major component, while the later contains geraniol [68]. However, it was also proved that the production of phytochemicals might be due to genetic makeup and geographical variations [18,47]. The analysis of both phytochemical and molecular markers revealed different clustering, probably due to the incorporation of a locus-specific SSR marker con-cerning the genes not responsible for phytochemical biosynthesis [32].
3. Materials and Methods 3.1. Plant Materials
A total of 72 accessions of Java citronella were collected from different states (Assam, Arunachal Pradesh, Manipur and Meghalaya) in Northeast India. The GPS locations of the collected accessions were previously reported [69]. The plants were identified by the plant breeder of the Medicinal, Economic and Aromatic Plant (MAEP) Group of the CSIR-North East Institute of Science and Technology (NEIST). The accessions were planted dur-ing kharif 2016 and maintained at the NEIST Institutional experimental farm in Jorhat. The latitude and longitude of the experimental farm were recorded using the WGS84 geo-graphical system as 26°44′15.6948′′ N and 94°9′25.4628′′ E, respectively. The pH of the ex-perimental soil was 4.9 with a sandy loam texture. The NPK (nitrogen, phosphorus and potassium) available were 224, 115 and 142 kg/ha, respectively.
3.2. Genetic Diversity Analysis Based on Molecular Marker 3.2.1. Genomic DNA Extraction
The tender leaves of the C. winterianus germplasm were collected separately in dif-ferent zip lock bags from the experimental farm of CSIR-NEIST, Jorhat. The leaf samples
Figure 9. Boxplot of the major phytochemical markers along with their cluster mean values.
Previously, it was reported that C. winterianus is different from C. nardus in the contextof the major constituent of the essential oil because the former contains citronellol as themajor component, while the later contains geraniol [68]. However, it was also provedthat the production of phytochemicals might be due to genetic makeup and geographicalvariations [18,47]. The analysis of both phytochemical and molecular markers revealeddifferent clustering, probably due to the incorporation of a locus-specific SSR markerconcerning the genes not responsible for phytochemical biosynthesis [32].
3. Materials and Methods3.1. Plant Materials
A total of 72 accessions of Java citronella were collected from different states (Assam,Arunachal Pradesh, Manipur and Meghalaya) in Northeast India. The GPS locations of thecollected accessions were previously reported [69]. The plants were identified by the plantbreeder of the Medicinal, Economic and Aromatic Plant (MAEP) Group of the CSIR-NorthEast Institute of Science and Technology (NEIST). The accessions were planted during kharif2016 and maintained at the NEIST Institutional experimental farm in Jorhat. The latitudeand longitude of the experimental farm were recorded using the WGS84 geographicalsystem as 26◦44′15.6948′ ′ N and 94◦9′25.4628′ ′ E, respectively. The pH of the experimentalsoil was 4.9 with a sandy loam texture. The NPK (nitrogen, phosphorus and potassium)available were 224, 115 and 142 kg/ha, respectively.
3.2. Genetic Diversity Analysis Based on Molecular Marker3.2.1. Genomic DNA Extraction
The tender leaves of the C. winterianus germplasm were collected separately in differ-ent zip lock bags from the experimental farm of CSIR-NEIST, Jorhat. The leaf samples were

Plants 2022, 11, 528 15 of 20
cleaned, lyophilised for 48 h at −40 ◦C and tissue lysed in Tissue Lyser (Qiagen, Germany)using liquid nitrogen gas (N2) for 150 s at a frequency of 25 Hz. Genomic DNA ex-traction was carried using HiPurA™ Plant DNA Isolation Kit by CTAB method (Cetyltrimethylammonium bromide). The purity of the extracted DNA was checked using0.8% agarose gel, and the bands observed were detected in a gel-documentation system(Eppendorf, Germany). The concentration was quantified using 3 µL of the stock DNA ina Nano Bio Spectrophotometer (Eppendorf, Germany) at λ260/ λ280 ratio. The stock DNAwas further diluted to 30 ng/µL for PCR analysis using SSR marker.
3.2.2. SSR Primers–PCR Analysis
A total of 42 pairs of microsatellite (SSR) primers were screened, out of which thebest amplifications were observed in 28 primer pairs, for the analysis of genetic diversityin the C. winterianus germplasm (Table 2). The reaction mixture for an SSR–PCR analysisconsists of 6µL of working DNA (30 ng/µL), 1.6 µL each of forward and reverse primer(Bio Serve Biotechnologies, Hyderabad, India), 8.5 µL of 1X Hi-Chrome PCR Master Mix(Hi-Media, India) and 2.3 µL of double distilled water, making the total volume 20 µL. APrima-96 (Hi-Media, India) thermocycler was used for amplification of the product withPCR programming of 94 ◦C (initial denaturation) for 3 min, then 35 cycles of denaturationfor 30 s at 94 ◦C, annealing for 60 s at primer melting temperature (Tm) ±5 ◦C, extensionfor 90 s at 72 ◦C and final extension for 10 min at 72 ◦C. The amplified product along with100 and 50 bp ladder (Hi-Media, India) was observed using 2% agarose gel in a 1× TBEbuffer. Additionally, aliquots (15 µL) were also separated using 8% Polyacrylamide GelElectrophoresis (PAGE). The acrylamide gel was stained with 0.5 mg/mL SYBR solutionwhich is considered a safe stain for 25–30 min. The DNA bands in the gel were thenvisualised in a gel documentation system. Electrophoresis was run for 1 h at 100 constantvoltages in the 1X TBE buffer.
3.2.3. Statistical Analysis of Data
The amplicons formed were observed in the gel documentation system and werescored to obtain the genetic variation. The Neighbour-Joining tree, distance matrix andprincipal coordinate analysis (PCA) were constructed based on Jaccard’s pairwise distancematrix using Darwin software version 6.0. Based on the polymorphism of the bands, the PIC(Polymorphic information content) percentage was calculated as follows: PIC = 1 − Σpi2,where Pi is the frequency of the ith allele [53]. Marker index (MI) was calculated using theformula MI = EMR × PIC where the effective multiplex ratio (EMR) is the product of anumber and a fraction of the polymorphic loci [70,71], whereas resolving power (Rp) is thesummation of the band informativeness [Ib = 1 − [2 × |0.5 − p|] and p is the proportionof individuals containing the band [71]. The genetic diversity variables, such as geneticdifferentiation degree (Gst), genetic diversity in the population (Ht), genetic diversitywithin the population (Hs), Shannon’s information index (I), number of observed alleles(na), number of effective alleles (ne) and Nei’s gene diversity (h), were calculated using thePOPGENE (Version-1.31) software package [72]. The inter-specific and intra-specific geneticdiversities were determined using analysis of molecular variance (AMOVA) with the helpof GenAlex software Version 6.5 [73]. The genetic relationships among the 72 accessionswere established using 28 SSR primers and utilizing a model-based population structure,which was performed using STRUCTURE software Version 2.3.4. The software was runmultiple times by setting k (the number of populations) from 3 to 10, and the length of theburn-in period and number of Markov Chain Monte Carlo (MCMC) replications were setat 100,000 for each run for all 72 accessions in order to evaluate the number of populations.An online tool called Structure Harvester was used to calculate the most probable geneticpopulation groups from the study.

Plants 2022, 11, 528 16 of 20
3.3. Quantitative and Qualitative Analysis of the Citronellal, Citronellol and Geraniol (Biomarkers)by GC-FID and GC-MS3.3.1. Extraction of Essential Oil
The extraction of essential oil was carried out by boiling 300 g of fresh leaves ofC. winterianus in water using a 3-litre capacity Clevenger apparatus for 3
12 h in three repli-
cates. The essential oil produced was measured, collected and treated with anhydroussodium sulphate (Na2SO4) to remove excess moisture present and was stored in 4 ◦C forqualitative and quantitative analysis.
3.3.2. Essential Oil Analysis
For the qualitative and quantitative evaluation of the major phytochemical biomarkers,a GC-FID and GC-MS analysis of the essential oil was carried out using the followinginstrument and GC conditions (Table 6) [69]:
Table 6. The optimum conditions for GC-MS and GC-FID analysis in C. winterianus essential oil.
GC-MS GC-FID
InstrumentTRACE Ultra Gas Chromatograph
coupled with an ISQ MassSpectrometer
Thermo Scientific TRACE 1110
Column TG WAX/MS (60 m × 0.25mm i.d) TG WAX/MSA (60 m × 0.25mmi.d)
Film thickness 0.25 µm 0.25 µm
Running conditions40 ◦C for 2 min
250 ◦C at 5 ◦C/min300 ◦C at 30 ◦C/min for 10 min
Initial temperature: 50 ◦COven temperature: 300 ◦C
Injector temperature: 280 ◦CFID temperature: 310 ◦C
Sample injection 1 µL 1 µL
Carrier gas Helium (1mL min−1) Nitrogen (0.30 mL min−1)
The identification of the major components was done by comparing the retentiontime of the standard samples (Sigma Aldrich, Germany and Hi-media, India) with thesame GC conditions, and the percentages of the compounds were determined by an areanormalization method. In GC-MS, the mass spectra of the obtained peaks were identifiedby comparison with the NIST/WILEY Mass Spectral Library and retention indices withinthe literature.
3.3.3. Statistical Analysis
MINITAB 16.0 software (Minitab Inc, State College, PA, USA) was used to evaluatethe analysis of the variances (ANOVA) for the quantitative data of citronellal, citronel-lol and geraniol, followed by dendrogram clustering based on complete linkage andEuclidean distance.
4. Conclusions
C. winterianus is a plant of high industrial importance because of its yielding capac-ity for essential oil and its compounds of high pharmaceutical importance. Therefore,preservation and conservation is highly recommended for proper utilisation of the cropin breeding programmes. Several breeding techniques, such as molecular, mutation andselection breeding, are the most suitable measures for the development of high-yieldingvarieties. Successful breeding depends upon genetic diversity and information about theaccessions collected from different places. Therefore, diversity based on phytochemicaland molecular markers was studied to differentiate the accessions into different clusters.Depending on the requirement of the particular constituents, genotypes could be selected
Plants 2022, 11, 528 17 of 20
for the development of recombinant lines with desirable characteristics. The recombinantlines may contain more essential oil with a highly valuable lead molecule. The knowledgeobtained by this study would also enhance the information regarding the phylogeny ofdifferent accessions and would enrich the gene bank. The findings would help in adoptingproper conservation strategies by minimizing the risk of extinction of the elite lines. Mostimportantly, the scientific community, academicians, and the commercial sector wouldbenefit highly by utilizing this research work for plant improvement programmes.
Author Contributions: Conceptualization, M.L. and S.M.; methodology, M.L., S.M. and R.J.S.; soft-ware, S.M. and N.S.; validation, M.L., S.B. and A.G.; formal analysis, S.M. and N.S.; investigation,M.L. and S.M.; resources, M.L.; data curation, S.M., R.J.S., T.B. and R.T.; writing—original draftpreparation, S.M.; writing—review and editing, M.L.; visualization, T.B.; supervision, M.L.; projectadministration, M.L. All authors have read and agreed to the published version of the manuscript.
Funding: This research was funded by SERB New Delhi Grant Number: YSS/2014/00314.
Institutional Review Board Statement: Not applicable.
Informed Consent Statement: Not applicable.
Data Availability Statement: Data is contained within the article.
Acknowledgments: The authors are thankful to CSIR-NEIST, Jorhat, for providing the necessaryfacilities and encouraging us throughout the work.
Conflicts of Interest: The authors declare no conflict of interest.
Appendix A
Table A1. The allele frequency divergences among and within (bold) populations were computedusing point estimates of P.
Pop I Pop II Pop III Pop IV Pop V Pop VI
Pop I 0.1215 0.1589 0.1377 0.0620 0.1144 0.0999Pop II 0.1774 0.0980 0.1793 0.0977 0.0804Pop III 0.2395 0.1171 0.0842 0.0913Pop IV 0.1386 0.1240 0.1124Pop V 0.2296 0.0707Pop VI 0.1666
Plants 2022, 11, x FOR PEER REVIEW 17 of 20
importantly, the scientific community, academicians, and the commercial sector would benefit highly by utilizing this research work for plant improvement programmes.
Author Contributions: Conceptualization, M.L. and S.M.; methodology, M.L., S.M. and R.J.S.; soft-ware, S.M. and N.S.; validation, M.L., S.B. and A.G.; formal analysis, S.M. and N.S.; investigation, M.L. and S.M.; resources, M.L.; data curation, S.M., R.J.S., T.B. and R.T.; writing—original draft preparation, S.M.; writing—review and editing, M.L.; visualization, T.B.; supervision, M.L.; project administration, M.L. All authors have read and agreed to the published version of the manuscript.
Funding: This research was funded by SERB New Delhi Grant Number: YSS/2014/00314.
Institutional Review Board Statement: Not applicable
Informed Consent Statement: Not applicable
Data Availability Statement: Data is contained within the article
Acknowledgments: The authors are thankful to CSIR-NEIST, Jorhat, for providing the necessary facilities and encouraging us throughout the work.
Conflicts of Interest: The authors declare no conflict of interest.
Appendix A
Table A1. The allele frequency divergences among and within (bold) populations were computed using point estimates of P.
Pop I Pop II Pop III Pop IV Pop V Pop VI Pop I 0.1215 0.1589 0.1377 0.0620 0.1144 0.0999 Pop II 0.1774 0.0980 0.1793 0.0977 0.0804 Pop III 0.2395 0.1171 0.0842 0.0913 Pop IV 0.1386 0.1240 0.1124 Pop V 0.2296 0.0707 Pop VI 0.1666
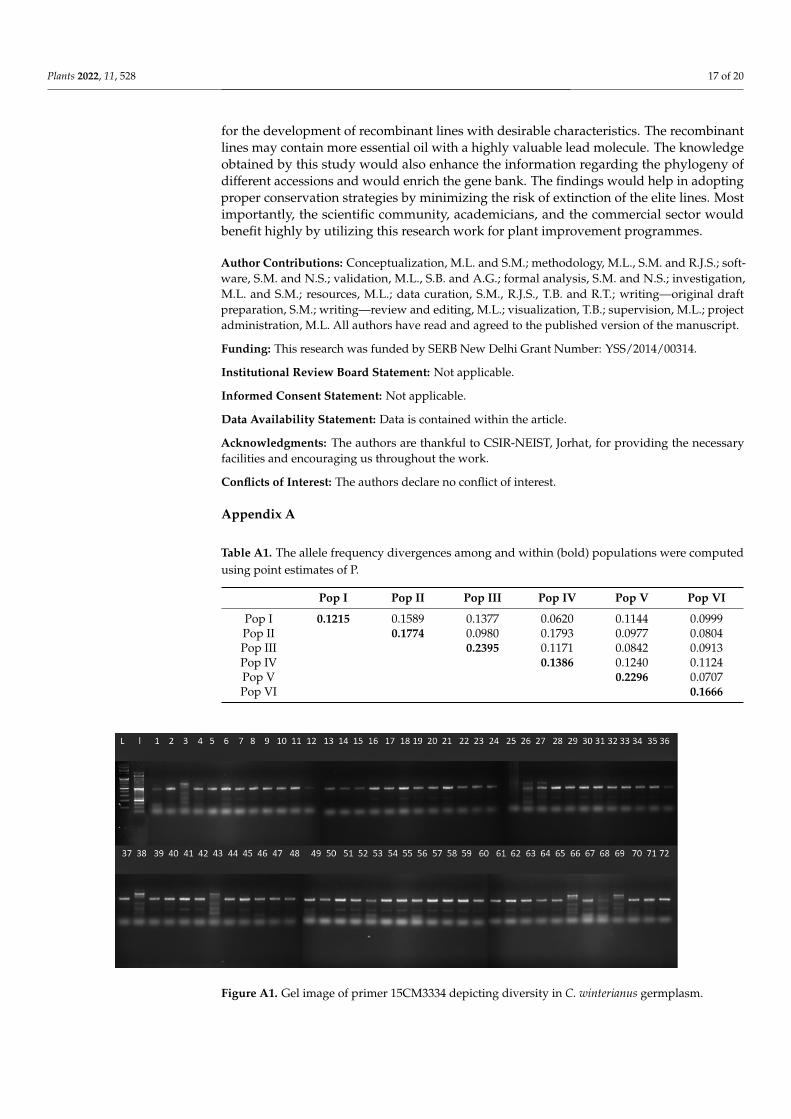
Figure A1. Gel image of primer 15CM3334 depicting diversity in C. winterianus germplasm.
References 1. Bhattacharya, S.; Bandopadhyay, T.K.; Ghosh, P.D. Efficiency of RAPD and ISSR markers in assessment of molecular diversity
in elite germplasms of Cymbopogon winterianus across West Bengal, India. Emir. J. Food Agric. 2010, 1, 13–24. 2. Paterson, A.H.; Tanksley, S.D.; Sorrells, M.E. DNA markers in plant improvement. Adv. Agron. 1991, 46, 39–90. 3. Perrino, E.V.; Perrino, P. Crop wild relatives: Know how past and present to improve future research, conservation and utiliza-
tion strategies, especially in Italy: A review. Resour. Crop Evol. 2020, 67, 1067–1105. 4. Adhikari, S.; Saha, S.; Bandyopadhyay, T.K.; Ghosh, P. Efficiency of ISSR marker for characterization of Cymbopogon
germplasms and their suitability in molecular barcoding. Plant Syst. Evol. 2015, 301, 439–450.
Figure A1. Gel image of primer 15CM3334 depicting diversity in C. winterianus germplasm.
Plants 2022, 11, 528 18 of 20
References1. Bhattacharya, S.; Bandopadhyay, T.K.; Ghosh, P.D. Efficiency of RAPD and ISSR markers in assessment of molecular diversity in
elite germplasms of Cymbopogon winterianus across West Bengal, India. Emir. J. Food Agric. 2010, 1, 13–24. [CrossRef]2. Paterson, A.H.; Tanksley, S.D.; Sorrells, M.E. DNA markers in plant improvement. Adv. Agron. 1991, 46, 39–90.3. Perrino, E.V.; Perrino, P. Crop wild relatives: Know how past and present to improve future research, conservation and utilization
strategies, especially in Italy: A review. Resour. Crop Evol. 2020, 67, 1067–1105. [CrossRef]4. Adhikari, S.; Saha, S.; Bandyopadhyay, T.K.; Ghosh, P. Efficiency of ISSR marker for characterization of Cymbopogon germplasms
and their suitability in molecular barcoding. Plant Syst. Evol. 2015, 301, 439–450. [CrossRef]5. Lal, M.; Munda, S.; Dutta, S.; Pandey, S.K. Identification of a novel germplasm (Jor Lab L-9) of lemon grass (Cymbopogon khasianus)
rich in methyl eugenol. Crop Breed. Appl. Biotechnol. 2020, 3, e320720315. [CrossRef]6. Dutta, S.; Munda, S.; Lal, M.; Bhattacharyya, P.R. A short review on Chemical composition, therapeutic use and enzyme inhibition
activities of Cymbopogon species. Indian J. Sci. Technol. 2016, 9, 1–9. [CrossRef]7. Lal, M.; Dutta, S.; Munda, S.; Pandey, S.K. Novel high value elemicin-rich germplasm of Lemon grass (Cymbopogn khasianus (hack)
Staf (ex Bor) from North East India. Ind. Crops Prod. 2018, 115, 98–103. [CrossRef]8. Deka, H.; Deka, S.; Baruah, C.K.; Das, J.; Hoque, S.; Sarma, N.S. Vermicomposting of distillation waste of citronella plant
(Cymbopogon winterianus Jowitt.) employing Eudrilus eugeniae. Bioresour. Technol. 2011, 102, 6944–6950.9. Dey, T.; Saha, S.; Ghosh, P.D. Somaclonal variation among somatic embryo derived plants-Evaluation of agronomically important
somaclones and detection of genetic changes by RAPD in Cymbopogon winterianus. S. Afr. J. Bot. 2015, 96, 112–121. [CrossRef]10. Lal, M.; Dutta, S.; Bhattacharyya, P.R. Development of a new superior variety (Jor Lab C-5) of Java Citronella with characteristics
of stable and high oil yield. Ann. Biol. 2016, 32, 22–23.11. Lal, M. Jor Lab C-5 (IC0619027; INGR16021), a Java citronella (Cymbopogon winterianus Jowitt) germplasm with high herbage
yield with high essential oil content. Indian J. Plant Genet. Resour. 2018, 31, 118.12. Simic, A.; Rancic, A.; Sokovic, M.D.; Ristic, M.; Grujic-Jovanovic, S.; Vukojevic, J.; Marin, P.D. Essential oil composition of
Cymbopogon winterianus and Carum carvi and their antimicrobial activities. Pharm. Biol. 2008, 46, 437–441. [CrossRef]13. Lawless, J. The Encyclopaedia of Essential Oils; Thorsons: London, UK, 2002; pp. 70–83.14. Quintans-Junior, L.J.; Souza, T.T.; Leite, B.S.; Lessa, N.M.; Bonjardim, L.R.; Santos, M.R.; Alves, P.B.; Blank, A.F.; Antoniolli, A.R.
Phytochemical screening and anticonvulsant activity of Cymbopogon winterianus Jowitt (Poaceae) leaf essential oil in rodents.Phytomedicine 2008, 15, 619–624. [CrossRef]
15. Munda, S.; Dutta, S.; Pandey, S.K.; Sarma, N.; Lal, M. Antimicrobial activity of essential oils of medicinal and aromatic plants ofthe North east India: A biodiversity hot spot. J. Essent. Oil Bear. Pl. 2019, 2, 105–119. [CrossRef]
16. Ganjewala, D. Cymbopogon essential oils: Chemical compositions and bioactivities. Int. J. Essent. Oil Ther. 2009, 3, 56–65.17. Ganjewala, D.; Gupta, A.K. Lemongrass (Cymbopogon flexuosus Steud.) wats essential oil: Overview and biological activities.
Essent. Oils II RPMP 2016, 37, 232–274.18. Kumar, V.; Roy, B.K. Population authentication of the traditional medicinal plant Cassia tora L. based on ISSR markers and FTIR
analysis. Sci. Rep. 2018, 8, 10714. [CrossRef] [PubMed]19. Perrino, E.V.; Valerio, F.; Jallali, S.; Trani, A.; Mezzapesa, G.N. Ecological and biological properties of Satureja cuneifolia and
Thymus spinulosus Ten.: Two wild officinal species of conservation concern in Apulia (Italy). A preliminary survey. Plants 2021,10, 1952. [CrossRef]
20. Cassel, E.; Vargas, R.M.F. Experiments and modeling of the Cymbopogon winterianus essential oil extraction by steam distillation.J. Mex. Chem. Soc. 2006, 50, 126–129.
21. Sousa, D.P.; Gonclaves, J.C.R.; Quintans, J.L.; Cruz, J.S.; Araujo, D.A.M.; Almeida, R.N. Study of anticonvulsant effect of citronellol,a monoterpene alcohol, in rodents. Neurosci. Lett. 2006, 401, 231–235. [CrossRef]
22. Gogoi, R.; Loying, R.; Sarma, N.; Munda, S.; Pandey, S.; Lal, M. A comparative study on antioxidant, anti-inflammatory,genotoxicity, anti-microbial activities and chemical composition of fruit and leaf essential oils of Litsea cubeba Pers. fromNorth-east India. Ind. Crops Prod. 2018, 125, 131–139. [CrossRef]
23. Sultanbawa, Y. Essential oils in food application: Australian aspects. In Essential Oils in Food Preservation, Flavor and Safety;Preedy, V.R., Ed.; Elsevier: Amsterdam, The Netherlands, 2016; pp. 155–159.
24. Silva, Y.M.S.; Silva, M.T.A.; Sampaio, P.A.; Quintans, J.S.S.; Qunitans-Junior, L.J.; Ribeiro, L.A.A. Relaxant effect of carvacrol,citronellal and p-cymene, monoterpenes present in Thymus and Cymbopogon species, in guinea-pig trachea: A comparative study.J. Med. Plant Res. 2014, 8, 881–888.
25. Burdock, G.A. Fenaroli’s Handbook of Flavor Ingredients, 6th ed.; CRC Press Taylor and Francis Group: London, UK;New York, NY, USA, 2010; pp. 733–734.
26. Chen, W.; Viljoen, A.M. Geraniol-A review of a commercially important fragrance material. S. Afr. J. Bot. 2010, 76, 643–651.[CrossRef]
27. Lal, M.; Borah, A.; Pandey, S.K. Identification of a new high geraniol rich variety “Jor Lab L-15” of Lemongrass [Cymbopogonkhasianus (Hack) Stapf (ex Bor)]. J. Essent. Oil Bear. Pl. 2019, 22, 972–978. [CrossRef]
28. Surburg, H.; Panten, J. Common Fragrance and Flavor Materials: Preparation, Properties and Uses, 5th ed.; Wiley: Weinheim, Germany, 2006.29. Heiba, H.I.; Rizk, A.M. Constituents of Cymbopogon species. Qatar Univ. Sci. Bull. 1986, 6, 53–75.

Plants 2022, 11, 528 19 of 20
30. Munda, S.; Lal, M. Cymbopogon winterianus Jowitt ex Bor, a Hub for various industrial and pharmaceutical applications. InBotanical Leads for Drug Discovery; Singh, B., Ed.; Springer: Singapore, 2020; pp. 405–419. [CrossRef]
31. Shasany, A.K.; Lal, R.K.; Patra, N.K.; Darokar, M.P.; Garg, A.; Kumar, S.; Khanuja, S.P.S. Phenotypic and RAPD diversity amongCymbopogon winterianus Jowitt accessions in relation to Cymbopogon nardus Rendle. Genet. Resour. Crop Evol. 2000, 47, 553–559.[CrossRef]
32. Kumar, J.; Verma, V.; Goyal, A.; Shahi, A.K.; Sparoo, R.; Sangwan, R.S.; Qazi1, G.N. Genetic diversity analysis in Cymbopogonspecies using DNA markers. Plant Omics 2009, 2, 20–29.
33. Munda, S.; Dutta, S.; Lal, M. Variability estimation and genetic divergence in Cymbopogon winterianus for development of superiorgenotype. Agron. J. 2020, 113, 993–1007. [CrossRef]
34. Gupta, A.K.; Ganjewala, D. A study on developmental changes in essential oil content and composition in Cymbopogon flexuosuscultivar Suvarna. Acta Biol. Szeged. 2015, 59, 119–125.
35. Baruah, J.; Gogoi, B.; Das, K.; Ahmed, N.M.; Sarmah, D.K.; Lal, M.; Bhau, B.S. Genetic diversity study amongst Cymbopogonspecies from NE-India using RAPD and ISSR markers. Ind. Crops Prod. 2016, 95, 235–243. [CrossRef]
36. Sangwan, N.S.; Yadav, U.; Sangwan, R.S. Molecular analysis of genetic diversity in elite Indian cultivars of essential oil tradetypes of aromatic grasses (Cymbopogon species). Plant Cell Rep. 2001, 20, 437–444. [CrossRef]
37. Herrera, M.R.; Ghislain, M. Robust and inexpensive SSR markers analyses using LI-COR DNA analyzer. Microsatellites 2013, 1006,197–205.
38. Naghavi, M.R.; Mardi, M.; Pirseyedi, S.M.; Kazemi, M.; Potki, P.; Ghaffari, M.R. Comparison of genetic variation among accessionsof Aegilops tauschii using AFLP and SSR markers. Genet. Resour. Crop. Evol. 2007, 54, 237–240. [CrossRef]
39. Henkrar, F.; El-Haddoury, J.; Ouabbou, H.; Nsarellah, N.; Iraqi, D.; Bendaou, N.; Udupa, S.M. Genetic diversity reduction inimproved durum wheat cultivars of Morocco as revealed by microsatellite markers. Sci. Agric. 2016, 73, 134–141. [CrossRef]
40. Abbasov, M.; Akparov, Z.; Gross, T.; Babayeva, S.; Izzatullayeva, V.; Hajiye, E.; Rustamov, K.; Gross, P.; Tekin, M.; Akar, T.; et al.Genetic relationship of diploid wheat (Triticum spp.) species assessed by SSR markers. Genet. Resour. Crop Evol. 2018, 65,1441–1453. [CrossRef]
41. Song, Q.J.; Shi, J.R.; Singh, S.; Fickus, E.W.; Costa, J.M.; Lewis, J.; Gill, B.S.; Ward, R.; Cregan, P.B. Development and mapping ofmicrosatellite (STMS) markers in wheat. Theor. Appl. Genet. 2005, 110, 550–560. [CrossRef] [PubMed]
42. Baruah, J.; Pandey, S.K.; Sarmah, N.; Lal, M. Assessing molecular diversity among high capsaicin content lines of Capsicumchinense Jacq. using simple sequence repeat marker. Ind. Crops Prod. 2019, 141, 111769. [CrossRef]
43. Hajiyev, E.S.; Akparov, Z.I.; Aliyev, R.T.; Saidova, S.V.; Izzatullayeva, V.I.; Babayeva, S.M.; Abbasov, M.A. Genetic polymorphismof durum wheat (Triticum durum Desf.) accessions of Azerbaijan. Russ. J. Genet. 2015, 51, 863–870. [CrossRef]
44. Abbasov, M.; Brueggeman, R.; Raupp, J.; Akparov, Z.; Aminov, N.; Bedoshvili, D.; Gross, T.; Gross, P.; Babayeva, S.;Izzatullayeva, V.; et al. Genetic diversity of Aegilops L. species from Azerbaijan and Georgia using SSR markers. Genet. Resour.Crop Evol. 2019, 66, 453–463. [CrossRef]
45. Kaur, P.; Pandeya, D.K.; Gupta, R.C.; Dey, A. Assessment of genetic diversity among different population of five Swertia speciesby using molecular and phytochemical markers. Ind. Crops Prod. 2019, 138, 111569. [CrossRef]
46. Hyun, D.Y.; Gi, G.Y.; Sebastin, R.; Cho, G.T.; Kim, S.H.; Yoo, E.; Lee, S.; Son, D.M.; Lee, K.J. Utilization of phytochemical andmolecular diversity to develop a target-oriented core collection in tea germplasm. Agronomy 2020, 10, 1667. [CrossRef]
47. Qaderi, A.; Omidi, M.; Pour-Aboughadareh, A.; Poczai, P.; Shaghaghi, J.; Mehrafarin, A.; Nohooji, M.G.; Etminan, A. Moleculardiversity and phytochemical variability in the Iranian poppy (Papaver bracteatum Lindl.): A baseline for conservation andutilization in future breeding programmes. Ind. Crops Prod. 2019, 130, 237–247. [CrossRef]
48. Ray, A.; Jena, S.; Haldar, T.; Sahoo, A.; Kar, B.; Patnaik, J.; Ghosh, B.; Panda, P.C.; Mahapatra, N.; Nayak, S. Population geneticstructure and diversity analysis in Hedychium coronarium populations using morphological, phytochemical and molecular markers.Ind. Crops Prod. 2019, 132, 118–133. [CrossRef]
49. Saikia, D.; Dutta, S.; Ghosh, S.; Lal, M.; Bhau, B.S. RAPD and ISSR based intra-specific molecular genetic diversity analysis ofCymbopogon flexuosus L. Stapf with a distinct correlation of morpho-chemical observations. Res. J. Biotechol. 2015, 10, 105–113.
50. Lal, N.; Awasthi, S.K. A comparative assessment of molecular marker assays (AFLP and RAPD) for Cymbopogon germplasmcharacterization. World J. Pharm. Res. 2015, 4, 1019–1041.
51. Bishoyi, A.K.; Sharma, A.; Kavane, A.; Geetha, K.A. Varietal discrimination and genetic variability analysis of Cymbopogon usingRAPD and ISSR markers analysis. Appl. Biochem. Biotechnol. 2016, 179, 659–670. [CrossRef] [PubMed]
52. Paw, M.; Borah, A.; Pandey, S.K.; Baruah, J.; Begum, T.; Lal, M. Simple sequence repeat marker based genetic diversity assessmentamongst high essential oil yielding lines of Curcuma caesia Roxb. Genet. Resour. Crop Evol. 2021, 6, 1345–1358. [CrossRef]
53. Botstein, D.; White, R.L.; Skolnick, M.; Davis, R.W. Construction of a genetic linkage map in man using restriction fragmentlength polymorphisms. Am. J. Hum. Genet. 1980, 32, 314–331.
54. Slatkin, M. Gene flow and geographic structure of natural populations. Science 1987, 236, 787–792. [CrossRef]55. Zheng, W.H.; Zhuo, Y.; Liang, L.; Ding, W.Y.; Liang, L.Y.; Wang, X.F. Conservation and population genetic diversity of Curcuma
wenyujin (Zingiberaceae), a multifunctional medicinal herb. Genet. Mol. Res. 2015, 14, 10422–10432. [CrossRef]56. Saitou, N.; Nei, M. The neighbour joining method: A new method for reconstructing phylogenetic trees. Mol. Biol. Evol. 1987, 4,
406–425.
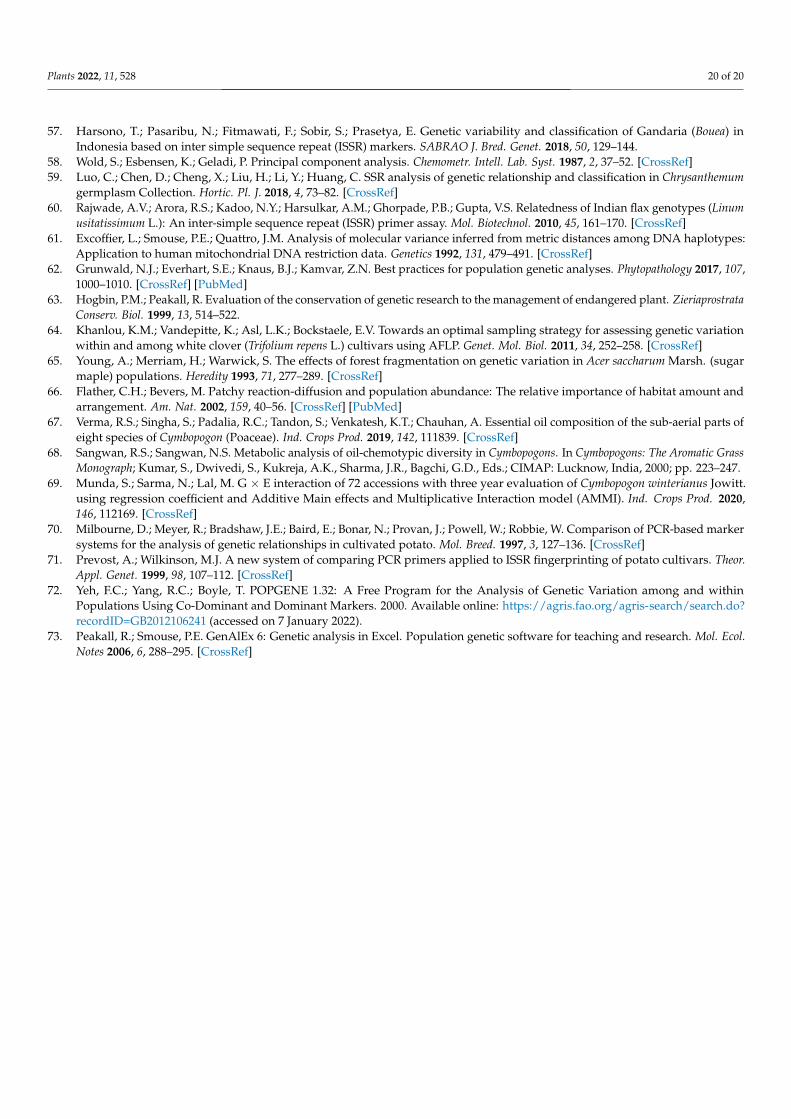
Plants 2022, 11, 528 20 of 20
57. Harsono, T.; Pasaribu, N.; Fitmawati, F.; Sobir, S.; Prasetya, E. Genetic variability and classification of Gandaria (Bouea) inIndonesia based on inter simple sequence repeat (ISSR) markers. SABRAO J. Bred. Genet. 2018, 50, 129–144.
58. Wold, S.; Esbensen, K.; Geladi, P. Principal component analysis. Chemometr. Intell. Lab. Syst. 1987, 2, 37–52. [CrossRef]59. Luo, C.; Chen, D.; Cheng, X.; Liu, H.; Li, Y.; Huang, C. SSR analysis of genetic relationship and classification in Chrysanthemum
germplasm Collection. Hortic. Pl. J. 2018, 4, 73–82. [CrossRef]60. Rajwade, A.V.; Arora, R.S.; Kadoo, N.Y.; Harsulkar, A.M.; Ghorpade, P.B.; Gupta, V.S. Relatedness of Indian flax genotypes (Linum
usitatissimum L.): An inter-simple sequence repeat (ISSR) primer assay. Mol. Biotechnol. 2010, 45, 161–170. [CrossRef]61. Excoffier, L.; Smouse, P.E.; Quattro, J.M. Analysis of molecular variance inferred from metric distances among DNA haplotypes:
Application to human mitochondrial DNA restriction data. Genetics 1992, 131, 479–491. [CrossRef]62. Grunwald, N.J.; Everhart, S.E.; Knaus, B.J.; Kamvar, Z.N. Best practices for population genetic analyses. Phytopathology 2017, 107,
1000–1010. [CrossRef] [PubMed]63. Hogbin, P.M.; Peakall, R. Evaluation of the conservation of genetic research to the management of endangered plant. Zieriaprostrata
Conserv. Biol. 1999, 13, 514–522.64. Khanlou, K.M.; Vandepitte, K.; Asl, L.K.; Bockstaele, E.V. Towards an optimal sampling strategy for assessing genetic variation
within and among white clover (Trifolium repens L.) cultivars using AFLP. Genet. Mol. Biol. 2011, 34, 252–258. [CrossRef]65. Young, A.; Merriam, H.; Warwick, S. The effects of forest fragmentation on genetic variation in Acer saccharum Marsh. (sugar
maple) populations. Heredity 1993, 71, 277–289. [CrossRef]66. Flather, C.H.; Bevers, M. Patchy reaction-diffusion and population abundance: The relative importance of habitat amount and
arrangement. Am. Nat. 2002, 159, 40–56. [CrossRef] [PubMed]67. Verma, R.S.; Singha, S.; Padalia, R.C.; Tandon, S.; Venkatesh, K.T.; Chauhan, A. Essential oil composition of the sub-aerial parts of
eight species of Cymbopogon (Poaceae). Ind. Crops Prod. 2019, 142, 111839. [CrossRef]68. Sangwan, R.S.; Sangwan, N.S. Metabolic analysis of oil-chemotypic diversity in Cymbopogons. In Cymbopogons: The Aromatic Grass
Monograph; Kumar, S., Dwivedi, S., Kukreja, A.K., Sharma, J.R., Bagchi, G.D., Eds.; CIMAP: Lucknow, India, 2000; pp. 223–247.69. Munda, S.; Sarma, N.; Lal, M. G × E interaction of 72 accessions with three year evaluation of Cymbopogon winterianus Jowitt.
using regression coefficient and Additive Main effects and Multiplicative Interaction model (AMMI). Ind. Crops Prod. 2020,146, 112169. [CrossRef]
70. Milbourne, D.; Meyer, R.; Bradshaw, J.E.; Baird, E.; Bonar, N.; Provan, J.; Powell, W.; Robbie, W. Comparison of PCR-based markersystems for the analysis of genetic relationships in cultivated potato. Mol. Breed. 1997, 3, 127–136. [CrossRef]
71. Prevost, A.; Wilkinson, M.J. A new system of comparing PCR primers applied to ISSR fingerprinting of potato cultivars. Theor.Appl. Genet. 1999, 98, 107–112. [CrossRef]
72. Yeh, F.C.; Yang, R.C.; Boyle, T. POPGENE 1.32: A Free Program for the Analysis of Genetic Variation among and withinPopulations Using Co-Dominant and Dominant Markers. 2000. Available online: https://agris.fao.org/agris-search/search.do?recordID=GB2012106241 (accessed on 7 January 2022).
73. Peakall, R.; Smouse, P.E. GenAlEx 6: Genetic analysis in Excel. Population genetic software for teaching and research. Mol. Ecol.Notes 2006, 6, 288–295. [CrossRef]