Genetic diversity among Brazilian okra landraces detected by ...
Upload
khangminh22Category
view
0download
0
Genetic diversity of the Chaerephon leucogaster/pumilus complex from
mainland Africa and the western Indian Ocean islands
Theshnie Naidoo
202513500
Submitted in fulfillment of the academic
Requirements for the degree of
Doctor of Philosophy in the
School of Life Sciences,
Westville Campus,
University of KwaZulu – Natal,
Durban.
NOVEMBER 2013 Supervisory Committee
Prof. JM. Lamb
Dr. MC. Schoeman
Dr. PJ. Taylor
Dr. SM. Goodman
ABSTRACT
Chaerephon (Dobson, 1874), an Old World genus belonging to the family Molossidae, is part of the
suborder Vespertilioniformes. Members of this genus are distributed across mainland Africa
(sample sites; Tanzania, Yemen, Kenya, Botswana, South Africa and Swaziland), its offshore
islands (Zanzibar, Pemba and Mozambique Island), Madagascar and the surrounding western Indian
Ocean islands (Anjouan, Mayotte, Moheli, Grande Comore, Aldabra and La Reunion). A
multifaceted approach was used to elucidate the phylogenetic and population genetic relationships
at varying levels amongst these different taxa.
Working at the subspecific level, I analysed the phylogenetics and phylogeography of Chaerephon
leucogaster from Madagascar, based on mitochondrial cytochrome b and control region sequences.
Cytochrome b genetic distances among C. leucogaster samples were low (maximum 0.35 %).
Genetic distances between C. leucogaster and C. atsinanana ranged from 1.77 % to 2.62 %.
Together, phylogenetic and distance analyses supported the classification of C. leucogaster as a
separate species. D-loop data for C. leucogaster samples revealed significant but shallow
phylogeographic structuring into three latitudinal groups (13º S, 15 - 17º S, 22 - 23º S) showing
exclusive haplotypes which correlated with regions of suitable habitat defined by ecological niche
modelling. Population genetic analysis of D-loop sequences indicated that populations from
Madagascar have been expanding since 5 842 - 11 143 years BP.
At the infra-generic level, I carried out analyses of sequences of the mitochondrial cytochrome b
gene and control region, and the nuclear RAG2 region, to resolve the evolutionary history and
taxonomy of the C. pumilus species complex from Africa and the western Indian Ocean islands. The
i
ii
nominate form comprised C. pumilus from Massawa, Eritrea, and this was genetically distinct from
all other forms of Chaerephon. Our molecular evidence does not support that the syntype of
C. limbatus and the holotypes of C. elphicki and C. langi and topotype of C. naivashae are
specifically distinct from C. pumilus s.s. There is evidence of introgression of both C.
pusillus and C. pumilus s.l. (south eastern Africa) mitochondrial haplotypes into C.
leucogaster. The C. pumilus species complex has several attributes of a ring species, but
appears to differ from this model in some important respects. It occurs on the African
mainland and western Indian Ocean Islands, including Madagascar, ringing a potential
barrier to gene flow, the Mozambique Channel. The taxa within the species complex form a
ring in which the differentiated terminal forms, C. pusillus and C. leucogaster, occur in
sympatry on Mayotte (Comoro Islands). Although there is evidence of isolation by distance
around the ring, there is also a relatively high degree of genetic structure and limited gene
flow. It appears that the island-based component species may have differentiated in
allopatry, with some gene flow by over water dispersal, whereas the African mainland
species may have differentiated through isolation by distance.
A further study was aimed at re-examining the phylogeny of C. pumilus sensu lato from
south eastern Africa based on a considerably larger sample set with a wider geographic
range; I confirmed the previously-reported phylogenetic structure, and identified an
additional strongly-supported control region clade. Discriminant Function Analysis based
on four echolocation parameters could not discriminate between these clades. The
hypothesised existence of cryptic species with distinct echolocation characteristics was not
supported. Indices of diversity and neutrality, combined with a ragged multimodal
iii
mismatch distribution, are inconsistent with demographic expansion of a single C. pumilus
south eastern African population and suggest that the control region lineages are stable
populations at demographic equilibrium that were established during the late Pleistocene
between 60 000 and 13 000 years ago.
Further, more variable markers (microsatellites) were employed for finer-scale resolution of
population genetic structure among the five genetic lineages of C. pumilus sensu lato found
in the Durban area of KwaZulu-Natal, and to search for hybridization between these
lineages. We recovered strong mitochondrial genetic structure, with 90% of the molecular
variance occurring among four phylogenetically-defined groups, and a high significant Fst
(0.897). Microsatellite data recovered three admixed populations with 3% of the nuclear
variance occurring among populations, and global (Fst=0.037) and pairwise Fst values
among populations were low and not significant. This is indicative of little genetic structure
among the groups of C. pumilus s.l., which appear to comprise a single interbreeding
population. Such high levels of mitochondrial genetic structure in the absence of significant
nuclear structure are consistent with social isolation mechanisms such as female philopatry,
and may reflect introgression of mitochondrial genes due to past hybridisation events with
mitochondrially-distinct forms from outside the sampled area.

iv
PREFACE The experimental work described in this thesis was carried out at the School of Life Sciences,
University of KwaZulu-Natal, Westville Campus, Durban. This was carried out under the
supervision of Prof. Jenny M. Lamb, Dr. M.C. Schoeman, Dr. Peter J. Taylor and Dr. Steven M.
Goodman.
This study represents original work by the author and has not otherwise been submitted in any form
for a degree or diploma to any tertiary institution. Where use has been made of the work of others, it
is duly noted in the text.
Signed: ___________ Name: Miss. T. Naidoo Date:

v
DECLARATION 1 – PLAGARISM I, Theshnie Naidoo declare that
1. The research reported in this thesis, except where otherwise indicated, is my original
research.
2. This thesis has not been submitted for any degree or examination at any other University.
3. This thesis does not contain other persons’ data, pictures, graphs or other information,
unless specifically acknowledged as being sourced from other persons.
4. This thesis does not contain other persons’ writing unless specifically acknowledged as
being sourced from other researchers. Where other written sources have been quoted, then:
(a) Their words have been re-written but the general information attributed to them has
been referenced.
(b) Where their exact words have been used, then their writing has been placed in
italics and inside quotation marks, and referenced.
5. This thesis does not contain text, graphics or tables copied and pasted from the
Internet, unless specifically acknowledged, and the source being detailed in the
thesis and in the References section.
Signed: ______________
vi
DECLARATION 2 – PUBLICATIONS PLEASE NOTE: CHAPTER 1 OF THIS THESIS COMPRISES MY MSC THESIS. IT WAS
EXAMINED AND PASSED IN 2008.
Publication 1 (Chapter 2)
NAIDOO, T., M. CORRIE. SCHOEMAN, PETER .J. TAYLOR, STEVEN. M. GOODMAN, AND JENNIFER.
M. LAMB. 2013. Stable Pleistocene-era populations of Chaerephon pumilus (Chiroptera:
Molossidae) in south eastern Africa do not use different echolocation calls. African
Zoology, 48: 125-142.
The ideas were conceived by Naidoo T, Lamb J and Schoeman M. The data were collected
and analysed by Naidoo T. The writing was led by Naidoo T.
Publication 2 (Chapter 3)
NAIDOO, T., M. CORRIE. SCHOEMAN, STEVEN. M. GOODMAN, PETER .J. TAYLOR, AND JENNIFER.
M. LAMB. Discordance between mitochondrial and nuclear genetic structure in the bat,
Chaerephon pumilus s. l. (Chiroptera: Molossidae) from South Africa
Submitted to Biological Journal of the Linnean Society
The ideas were conceived by Naidoo T, Lamb J and Schoeman M. The data were collected
and analysed by Naidoo T. The writing was led by Naidoo T.
vii
Publication 3 (Chapter 4)
NAIDOO, T., STEVEN. M. GOODMAN, M. CORRIE. SCHOEMAN, PETER .J. TAYLOR, AND JENNIFER.
M. LAMB. The Chaerephon pumilus species complex (Chiroptera: Molossidae) from
south eastern Africa and the western Indian Ocean islands is not a classical ring species.
Submitted to Acta Chiropterologica
The ideas were conceived by Naidoo T, Lamb J and Goodman S. The data were collected
by Goodman S, Taylor P, Schoeman M and Naidoo T. The data were analysed by Naidoo
T. The writing was led by Naidoo T.
Publication 4
RATRIMOMANARIVO, F.H., S.M. GOODMAN, W.T. STANLEY, T. NAIDOO, P.J. TAYLOR, and J.
LAMB. 2009. Patterns of geographic and phylogeographic variation in Chaerephon leucogaster
(Chiroptera: Molossidae) of Madagascar and the western Indian Ocean islands of Mayotte and
Pemba. Acta Chiropterologica, 11: 25-52.
This is multi-authored report on a collaborative project involving morphometric and genetic
assessments of phylogenetic and phylogeographic relationships in Chaerephon leucogaster.
Sample collection and the morphological work, which comprises half of the paper, was carried out
by Ratrimomanarivo, F.H., Goodman, S.M. and Stanley, W.T.
The molecular work, which comprises the other half of the paper, was carried out by Naidoo, T.
who was supervised by Lamb, J., Taylor, P.J and Goodman, S.M.
viii
Publication 5
TAYLOR, P.J., J. LAMB, D. REDDY, T. NAIDOO, F. RATRIMOMANARIVO, E. RICHARDSON, and S.M.
GOODMAN. 2009. Cryptic lineages of little free-tailed bats, Chaerephon pumilus (Chiroptera:
Molossidae) from southern Africa and the western Indian Ocean islands. African Zoology, 44:
55-70.
This work was carried out and formed the basis of the MSc thesis of Devendran Reddy. Further
sample collection, morphological work and the molecular work on Chaerephon pumilus was carried
out by Taylor, P.J and Reddy, D.
The molecular work and analysis on Chaerephon leucogaster was carried out by Naidoo, T. who
was supervised by Lamb, J., Taylor, P.J and Goodman, S.M.
Publication 6
LAMB, J.M., T.M.C. RALPH, T. NAIDOO, P.J. TAYLOR, F. RATRIMOMANARIVO, W.T. STANLEY, and
S.M. GOODMAN. 2011. Toward a molecular phylogeny for the Molossidae (Chiroptera) of the
Afro-Malagasy region. Acta Chiropterologica, 13: 1-16.
Molecular work of all Chaerephon samples together with a few other molossids was carried out by
Naidoo, T.
Publication 7
GOODMAN, S.M., W. BUCCAS, T. NAIDOO, F. RATRIMOMANARIVO, P.J. TAYLOR, and J.M. LAMB.
2010. Patterns of morphological and genetic variation in western Indian Ocean members of the
Chaerephon ‘pumilus’ complex (Chiroptera: Molossidae), with the description of a new species
from Madagascar. Zootaxa, 2551: 1-36.
ix
Molecular work for all Chaerephon samples was carried out by Naidoo, T supervised by Lamb,
J.M.
Sample collection and the morphological work, which comprises half of the paper, was carried out
by Ratrimomanarivo, F.H., Goodman, S.M.
Publication 8
LAMB, J.M., T. NAIDOO, P.J. TAYLOR, M. NAPIER, F. RATRIMOMANARIVO, and S.M. GOODMAN.
2012. Genetically and geographically isolated lineages of a tropical bat (Chiroptera: Molossidae)
show demographic stability over the late Pleistocene. Biological Journal of the Linnean Society,
106: 18-40.
Molecular work was carried out by Naidoo, T and Napier, M. supervised by Lamb, J.M.
Publication 9
NAIDOO, T., A. MCDONALD, and J. LAMB. 2013. Cross-genus amplification and
characterisation of microsatellite loci in the little free tailed bat, Chaerephon pumilus s.l.
(Molossidae) from South Eastern Africa. African Journal of Biotechnology, 12: 3143-
3147.
The ideas were conceived by Naidoo T and Lamb J. The data were collected by Naidoo T.
The data were analysed by Naidoo T. The writing was led by Naidoo T.
Signed: ______________
x
“It is interesting to contemplate a tangled bank, clothed with many plants of many kinds,
with birds singing on the bushes, with various insects flitting about, and with worms
crawling through the damp earth, and to reflect that these elaborately constructed forms,
so different from each other, and dependent upon each other in so complex a manner, have
all been produced by laws acting around us. . .
There is grandeur in this view of life, with its several powers, having been originally
breathed by the Creator into a few forms or into one; and that, whilst this planet has gone
circling on according to the fixed law of gravity, from so simple a beginning endless forms
most beautiful and most wonderful have been, and are being evolved.”
- Charles Darwin

xi
ACKNOWLEDGEMENTS
I am extremely indebted to my supervisor, Prof. Jenny Lamb. Thank you for your time, support and
guidance in shaping me as a scientist. You have been a true inspiration with your wealth of
knowledge and patience throughout the years.
I would also like to acknowledge my co-supervisors, Dr. Corrie Schoeman, Dr. Peter Taylor and Dr.
Steven Goodman who provided the material to make this work possible and for their support and
guidance. Corrie, Peter and Steve - you have re-ignited my love for science and made me push
boundaries I never would have without your support. Thank you for being my mentors but most of
all an inspiration.
A special mention to the students at theVahatra Association in Madagascar who work tirelessly in
the field and have assisted in contributing to this project.
My sincere appreciation to the National Research Foundation and the University of KwaZulu Natal
for their financial assistance over these years.
I am grateful to my colleagues for providing assistance and support. To my partners in crime: Taryn
Ralph and Leigh Richards, thank you for sharing this experience with me and making it enjoyable
even through the toughest of times.
My achievements thus far are a heartfelt gift of thanks to my family: my grandmother (the matriarch
of the family), my parents (Pinky and Danny) and my brother and sister in law (Preshen and
Raksha) for their love and unwavering support during these years. Mum, Dad thank you for letting
me choose a very uncertain path in life, something I sincerely loved, and for providing me with an
education.
To husband, Indhrasen, thank you for the unconditional love and support during this journey and
thank you for being a part of it. You mean more to me than words can ever describe....
xii
TABLE OF CONTENTS ABSTRACT .....................................................................................................i
PREFACE ......................................................................................................iv
DECLARATION 1 – PLAGARISM ............................................................v
DECLARATION 2 – PUBLICATIONS .....................................................vi
ACKNOWLEDGEMENTS .........................................................................xi
LIST OF ABBREVIATIONS ....................................................................xiv
GENERAL INTRODUCTION ......................................................................1
CHAPTER 1: Analysis of the Genetic Diversity of Chaerephon
leucogaster (Chiroptera: Molossidae) of Madagascar and from the
western Indian Ocean islands of Mayotte and Pemba……………....……20
CHAPTER 2: Stable Pleistocene-era populations of Chaerephon pumilus
(Chiroptera: Molossidae) in south eastern Africa do not use different
echolocation calls…………………………………………………………..121
CHAPTER 3: Discordance between mitochondrial and nuclear genetic
structure in the bat, Chaerephon pumilus s. l. (Chiroptera: Molossidae)
from South Africa…………………………………………………………162
xiii
CHAPTER 4: The Chaerephon pumilus species complex (Chiroptera:
Molossidae) from south eastern Africa and the western Indian Ocean
islands is not a classical ring species……………………………………...201
SUMMARY AND SYNTHESIS .................................................................255
APPENDICES …………………………………………………………......261
xiv
LIST OF ABBREVIATIONS
AMOVA Analysis of Molecular Variance
AUC Area under curve
bp base-pair/s
BP before present
˚C degrees Celsius
dNTPs deoxynucleoside triphosphates
ESU evolutionary significant unit
g grams
GTR general time reversible
Iss index of substitution saturation
Iss.c critical value of index of substitution saturation mg milligram
ml millilitre
mM millimolar MP maximum parsimony
mtDNA mitochondrial DNA
myr million years
ng ml-1 nanogram per millilitre
ng ul-1 nanogram per microlitre
ng nanogram
NJ neighbour-joining
PCR polymerase chain reaction
Taq Thermus aquaticus
V volts
w/v weight per volume
μM micromolar
µl microlitre
1
GENERAL INTRODUCTION
The measure of biodiversity is typically based on the fundamental and central unit of
species (O’Brien 1994; Stearns and Hoekstra 2000), which is essential to future conservation
efforts. Understanding biodiversity, more specifically genetic diversity, and how it is distributed is
central to the resolution of taxonomic uncertainties surrounding species complexes (Cooper et al.
1998; Cardinal and Christidis 2000), including the identification of genetically distinct populations.
Additionally, these measures have important conservation management implications.
Bats belong to the order Chiroptera and are one of the most diverse mammalian groups.
Huge strides have been made recently in our understanding of chiropteran systematics even though
gaps remain. Previous studies based on morphological characters suggested that the Order
Chiroptera is comprised of two suborders: Megachiroptera and Microchiroptera (Simmons 1995;
Simmons and Geisler 1998). In contrast, Megachiroptera was suggested to be more closely related
to primates than to microchiroptera (Smith and Madkour 1980; Pettigrew 1986, Pettigrew et al.
1989; Pettigrew and Kirsch 1995) thus challenging the monophyletic status of bats (Smith and
Madkour 1980; Pettigrew et al. 1989; Goodman 1991; reviewed in Simmons 1994). Over the past
decade, molecular analyses strongly supported the monophyly of bats (Miyamoto et al. 2000;
Teeling et al. 2000; Jones et al. 2002; Eick et al. 2005). However, the monophyly of groups that are
part of the suborder Microchiroptera has also been controversial. Some authors suggest based on
morphological analyses that Microchiroptera have a common ancestor with all extant taxa and have
the defining feature of a complex laryngeal echolocation system (Simmons 1998; Simmons and
Geisler 1998) and that and Megachiroptera comprise all other non-echolocating bats. Recent
molecular studies confirmed microbat paraphyly using multiple nuclear gene sequences (Teeling et
al. 2000, 2002, 2005, Springer et al. 2001). Monophyletic Chiroptera was systematically divided
into Yinpterochiroptera (Springer et al. 2001), grouping megabats and Rhinolophoidea and
Yangochiroptera (Simmons and Geisler 1998), containing all other microbats.
However, under the new proposed nomenclature Chiroptera is divided into two sub-orders,
Pteropodiformes (formerly referred to as Yinpterochiroptera) and Vespertilioniformes (formerly
referred to as Yangochiroptera) (Hutcheon and Kirsch 2006). Pteropodiformes consists of the
families Pteropodidae, Hipposideridae, Rhinolophidae, Megadermatidae and Craesonycteridae
2
(Hutcheon and Kirsch 2006). Vespertilioniformes consists of the remaining bat families and
includes the families Vespertilionidae, Miniopteridae, Molossidae, Emballonuridae, and Nycteridae
(Hutcheon and Kirsch 2006). The family Molossidae Gervais, 1856, comprises 16 genera (Simmons
2005); seven Old World genera (Mops, Chaerephon, Platymops, Sauromys, Cheiromeles, Otomops,
and Myopterus), seven New World genera (Promops, Molossus, Eumops, Nyctinomops, Molossops,
Cynomops, and Tomopeas), and two genera with members found in both the Old World and New
World (Mormopterus and Tadarida). These genera comprise about 100 species. The species
delimitations of African, Arabian Peninsula and western Indian Ocean island members of
Chaerephon pumilus (Cretzschmar, 1830-1831), a molossid species-complex, remain largely
unresolved. Most species within this genus have been defined by traditional morphological
approaches. However, genetic markers provide an important tool for unravelling phylogenetic and
phylogeographic patterns in species complexes such as C. pumilus (Taylor 1999; Aspetsberger et al.
2003; Fenton et al. 2004; Jacobs et al. 2004; Bickford et al. 2006; Pfenninger and Schwenk 2007;
Taylor et al. 2009; Goodman et al. 2010). Molecular approaches have been successfully applied to
the resolution of other taxonomically complicated bat groups occurring on western Indian Ocean
islands (e.g., Ratrimomanarivo et al. 2008, 2009a; Weyeneth et al. 2008; Goodman et al. 2009a)
and other regions (Campbell et al. 2004; Juste et al. 2004; Miller-Butterworth et al. 2005; Ibanez et
al. 2006). The discovery of cryptic species has also shown to have profound implications on
biodiversity (Bickford et al. 2006). Despite an exponential increase in discovery of cryptic species
over the past few decades, there is still uncertainty on the number of cryptic species that remain un-
described; for this reason, efforts to catalogue and explain biodiversity need to be prioritized
(Pfenninger and Schwenk 2007).
My thesis encompasses a multifaceted approach to elucidate phylogenetic and population
genetic relationships amongst members of the C. pumilus species complex from eastern and
southern Africa, Arabia, Madagascar and western Indian Ocean islands including the Comoros
Archipelago (Grande Comore, Mohéli, Mayotte, Anjouan), Seychelles (Aldabra), Pemba, Zanzibar
and Mozambique Island. A further aim was to assess the phylogenetic position of Chaerephon
within the family Molossidae.
3
The Chaerephon pumilus species complex and C. pumilus sensu lato
The taxonomic arrangement of the genus Chaerephon currently includes 21 species, based
on both morphological and genetic data. Simmons (2005) recognised 18 species and recent studies
described an additional three species (Goodman and Cardiff 2004; Goodman et al. 2010). Six
species (C. major, C. chapini, C. pumilus, C. ansorgei, C. nigeriae and C. bivittatus) occur in the
southern African subregion (Monadjem et al. 2010) and four (C. atsinanana, C. leucogaster, C.
pusillus and C. jobimena) across Madagascar and on some western Indian Ocean islands. On the
African mainland, there are a number of geographically diverse forms of Chaerephon that are
grouped in a single species complex, C. pumilus. Animals placed in the genus Chaerephon found in
western portions of Madagascar were assigned to C. leucogaster (Ratrimomanarivo et al. 2009b),
and a recent study by Goodman et al. (2010) referred forms occurring in the eastern portion of the
island and previously identified as C. pumilus to new species, C. atsinanana (Appendix 4). Further,
Goodman et al. (2010) assigned C. pumilus from western Seychelles and Comoros Archipelago to
C. pusillus. Goodman et al. (2010) obtained DNA from a 120 year old specimen of the nominate
form, C. p. pumilus, from the type locality (Massawa, Eritrea) and, based on a portion of the
mitochondrial cytochrome b gene, defined this individual as the nominate pumilus (Appendix 4).
By implication, all other genetically distinct forms which bore the name ‘C. pumilus’ are referred to
herein as C. pumilus sensu lato. This includes C. leucogaster, which has been shown by Taylor et
al. (2009) to be included in a paraphyletic C. pumilus sensu lato clade from south eastern Africa.
ORGANISATION AND STRUCTURE
Sub-specific level studies
Many molecular studies of the interrelationships among genera and species have made use of
mitochondrial DNA. Over the last two decades, the cytochrome b gene has widely used molecular
marker (Bradley and Baker 2001; Avise 2004; Baker and Bradley 2006), useful in elucidating
relationships at various systematic levels (Porter and Baker 2004). For a number of bat families, this
marker has been used at intra-generic level to define species, for example within the genera of the
following families: Molossidae (Baker et al. 2009), Phyllostomidae (Van de Bussche and Baker
1993; Hoffman and Baker 2001; Porter and Baker 2004; Larsen et al. 2007), Vespertilionidae
4
(Hulva et al. 2004; Rodriguez and Ammerman 2004), Miniopteridae (Tian et al. 2004; Goodman et
al. 2009b) and Rhinolophidae (Li et al. 2006).
My work has been undertaken within the context of a research group including Prof. P. J.
Taylor, Dr. C. Schoeman, Dr. S. Goodman and Prof. J. Lamb, in a molecular lab at the School of
Life Sciences at the University of KwaZulu-Natal. This group is engaged in a series of ongoing
phylogenetic and phylogeographic studies on molossid bat taxa, primarily from Madagascar and
western Indian Ocean, but also including congeners from mainland Africa. These studies, based on
mitochondrial DNA markers, focused on several different taxa, namely: C. leucogaster
(Ratrimomanarivo et al. 2009b); the C. pumilus group from southern Africa (Taylor et al. 2009) and
the Malagasy region (Goodman et al. 2010); Mops condylurus A. Smith, 1833, M. leucostigma
G.M.Allen, 1918 and M. midas Sundevall, 1843 (Ratrimomanarivo et al. 2007, 2008); Mormopterus
jugularis Peters, 1865; Otomops madagascarensis Dorst, 1953 and O. martiensseni Matchie, 1897
(Lamb et al. 2006, 2008).
My MSc thesis focused on the genetic diversity of C. leucogaster from Madagascar and the
western Indian Ocean islands of Mayotte and Pemba from a phylogenetic and phylogeographic
perspective. It was examined and passed in 2008, and I took the option of upgrading my MSc to a
PhD. This meant that I would not graduate with a MSc, but would incorporate the MSc thesis into
my PhD thesis; hence, Chapter 1 of this thesis comprises my MSc thesis. This work was published
jointly with the morphological data of Fanja Ratrimomanarivo and is included as Appendix 1
(Ratrimomanarivo et al. 2009).
Devendran Reddy, a fellow student at the University of KwaZulu Natal, carried out a study in a
similar vein focusing on C. pumilus from southern Africa, referred to in this thesis as C. pumilus
sensu lato, because subsequent work (Goodman et al. 2010) has shown that C. pumilus sensu stricto
refers to a genetically distinct form from the type locality of Massawa in Eritrea. Work carried out
by Devendran Reddy reported genetically distinct lineages within C. pumilus sensu lato from south
eastern Africa and neighbouring Swaziland. Analyses of the mitochondrial cytochrome b and
control regions revealed at least four clades from the greater Durban (South Africa) area, separated
by inter-clade cytochrome b genetic distances of 0.6 - 0.9%. Taylor et al. (2009) extended this study
with a greater sample set, which included C. leucogaster samples from western Madagascar, and
hypothesised that the southern African C. pumilus clades may represent cryptic species with distinct
echolocation characteristics (Appendix 2).
The examination of molecular data has demonstrated that many morphologically cohesive
species harbour genetically distinct cryptic species (Mayr 1996; Lincoln et al. 1998; Pfenninger and
5
Schwenk 2007). Molecular phylogenetic techniques have proven to be a powerful tool in revealing
cryptic forms across different biological groups (Birungi and Arctander 2000; Omland et al. 2000;
Peppers and Bradley 2000; Olson et al. 2004; Ravaoarimanana et al. 2004; Vences and Glaw 2005;
Yoder et al. 2005; Brambilla et al. 2008; Brown et al. 2007; Pfenninger and Schwenk 2007; Towes
and Irwin 2008). Bioacoustic information combined with genetic data has been widely used to
provide additional insight into taxonomic delimitations in bat species complexes (Russo and Jones
2000; Rydell et al. 2002; Kingston and Rossiter 2004; Thabah et al. 2006; Ramasindrazana et al.
2011).
Using bioacoustic and genetic information, I extended the study by Taylor et al. (2009) with an
increased sample size and expanded geographic representation to test the hypothesis that the south
eastern African C. pumilus sensu lato clades represent cryptic species with distinct echolocation
characteristics. This work, which focuses on the molecular ecology (genetic diversity and
echolocation characteristics) of a taxon within the C. pumilus species complex, forms the second
chapter of this thesis.
Population genetic structure of Chaerephon pumilus sensu lato from South Africa
Environmental barriers, historical demographic processes and life histories have shaped the
genetic structure of populations (Castella et al. 2000; Donnelly and Townson 2000; Gerlach and
Musolf 2000; Palsson 2000; Tiedmann et al. 2000; Burland et al. 2001; Balloux and Lougon-
Moulin 2002, Salgueiro et al. 2008; Bilgin et al. 2008; Chinnasamy et al. 2011; Dixon 2011). In
addition to mitochondrial marker systems, recent research has demonstrated the usefulness at
population level of nuclear marker systems, the most conventional being microsatellites.
Microsatellites have grown in popularity because these are single-locus, co-dominant markers
which are useful for the description and understanding of the social life (e.g. parentage analysis,
mating systems, roosting biology and sex-biased dispersal) and population structure in bats
(Castella et al. 2000; Burland et al. 2001; Castella et al. 2001; Nagy et al. 2007; Salgueiro et al.
2008; Campbell et al. 2009; Durrant et al. 2009; Flanders et al. 2009; Chen et al. 2010; Hua et al.
2011).
The focus of Chapter 3 of this dissertation is the microsatellite analysis of the structure of
C. pumilus sensu lato populations from South Africa. The aim of this work was to search for finer-
scale resolution among the genetic lineages found in the Durban area of KwaZulu-Natal (reported
6
on in Chapter 1), and to search for hybridization between these lineages. This work had a
methodological aspect, as I tested nine primer pairs used by Russell et al. (2005) on the genus
Tadarida for cross-amplification and variability within C. pumilus sensu lato.
Position of Chaerephon within the Molossidae
Earlier taxonomic studies on the family Molossidae were based on characteristics such as
dental and cranial morphology (Freeman 1981; Legendre 1984; Taylor 1999) and a molecular
phylogeny on the family was lacking. Ongoing studies on different Afro-Malagasy molossid taxa
led to the investigation on the molecular phylogeny of the family for the region (Lamb et al. 2011).
Mitochondrial DNA markers (such as the cytochrome b) evolve too rapidly to provide adequate
resolution at deeper nodes, owing to problems with homoplasy (Guillén et al. 2003), whereas more
slowly-evolving nuclear markers are suitable for resolution at higher taxonomic levels, for example
among genera within a family (Lovejoy and Collette 2001; Springer et al. 2001; Steppan et al.
2004, Rubinoff and Holland 2005). Analyzing single-gene data sets problems arise due to gene trees
and species trees which may be conflicting. Species trees reflect the evolutionary history of a group,
whereas gene trees reflect the diversification of a group of sequences derived from different gene
fragments. Unlike species trees, gene trees are sensitive to the effects of gene duplication,
hybridization, introgression, lineage sorting and female biased disperal (Moritz & Hillis 1996;
Lyons-Weiler & Milinkovitch 1997), but the congruence of multiple independently segregating
markers may provide a more reliable estimate of the species tree (Pamilo & Nei 1988).
Therefore, it is important to use multiple sources of phylogenetic information to overcome
the limited ability of a single dataset to reconstruct molecular phylogenies with accuracy (Cao et al.
1994; Cummings et al. 1995). Thus, phylogenies incorporating mitochondrial cytochrome b and
nuclear DNA could provide valuable insight into the evolutionary relationships of/among different
taxa. Molecular phylogenetic approaches using multiple genes were used to elucidate the
evolutionary history of a number of bat families: Vespertilionidae (Hoofer and Van Den Bussche
2003; Roehrs et al. 2010), Phyllostomidae (Baker et al. 2003), Emballonuridae (Lim et al. 2008),
Pteropodidae (Colgan and da Costa 2002), Natalidae (Da´valos 2005), and Mormoopidae (Lewis-
Oritt et al. 2001).
7
The taxonomic relationship among three genera within the family Molossidae namely,
Mops, Chaerephon and Tadarida has been an issue of contention due to their polyphyletic
association (Arroyo-Calabres et al. 2002; Monadjem et al. 2010). Freeman (1981) divided certain
African members formerly placed in the genus Tadarida into four genera (Mormopterus, Tadarida,
Chaerephon and Mops). Peterson et al. (1995) regarded Chaerephon as a subgenus of Tadarida
based on morphological characters that are shared by a few species of Chaerephon and Mops.
Simmons (2005) has adopted the generic classification proposed by Freeman (1981), whereby
Chaerephon is given generic status.
I sequenced the nuclear RAG2 gene of all regional Chaerephon taxa from Africa and the western
Indian Ocean islands and contributed to a paper in which these sequences were used, together with
the mitochondrial cytochrome b gene (my C.leucogaster cytochrome b sequences were included
here), to resolve phylogenetic relationships within the Chaerephon/Mops grouping of the
Molossidae family (Lamb et al. 2011) (Appendix 3). We found no variation in RAG2 sequences
between the different Chaerephon taxa. This study revealed that Chaerephon and Mops were not
clearly distinct genera. Chaerephon and Mops combined formed a very strongly-supported
monophyletic group (1.00 pp and ~100% bootstrap support) in both the RAG2 and concatenated
RAG2/cytochrome b analyses. This group included all Chaerephon samples except C. jobimena,
which was nested within Tadarida. Within the Chaerephon/Mops clade, it appears that Mops
maintains the more ancestral position relative to the more derived Chaerephon samples. These
results were further supported by a study subsequently published by Ammerman et al. (2012).
A phylogeny for Chaerephon pumilus sensu lato
Chapter 4 of this thesis is a more in depth look at the phylogenetic structure of C. pumilus
sensu lato by extending the study of Goodman et al. (2010) using broader geographic and
taxonomic sampling to include specimens from eastern and southern Africa (Appendix 4). I also
attempt to resolve the taxonomy of C. elphicki, C. langi, C. limbata and C. naivashae, currently
considered synonyms of African C. pumilus sensu stricto.
8
AIMS OF THIS STUDY
The overall aim of this study is to resolve phylogenetic and population genetic relationships
within the Chaerephon pumilus species complex, and the position of Chaerephon within the
Molossidae.
Specific aims were as follows (objectives are given within the chapters):
(i) Investigate the genetic diversity and phylogeography of Chaerephon leucogaster
populations from Madagascar and the islands of Mayotte and Pemba in the western
Indian Ocean (Chapter 1).
(ii) Revisit the study of Taylor et al. (2009) on the phylogeny on C. pumilus sensu lato in south
eastern Africa by increasing the sample size and expanding the geographic sampling to
include a wider area of southern and northern KwaZulu-Natal. Further, to test their
hypothesis that the southern African C. pumilus sensu lato clades represent cryptic
species with distinct echolocation characteristics (Chapter 2).
(iii) Optimise the microsatellite markers used by Russell et al. (2005) in a study of population
structure in New World Tadarida brasiliensis for cross-amplification and variability in
C. pumilus sensu lato. Use the applicable markers for fine-scale resolution of
relationships among the genetic lineages of C. pumilus sensu lato found in South Africa
(established in Chapter 2), and to search for possible hybridization between these
lineages (Chapter 3).
(iv) Establish an inclusive phylogeny for C. pumilus sensu lato from mainland Africa, Arabia,
Madagascar and western Indian Ocean islands by extending the mitochondrial
cytochrome b and D-loop dataset of Goodman et al. (2010) to include samples from
Mozambique and Zanzibar and further samples from the Comoros Archipelago, Pemba
Island and southeastern Africa. To include museum specimens of C. limbata, C. langi,
9
C. naivashae and C. elphicki which are considered synonyms of C. pumilus in the
current systematic arrangement and comment on the validity of these species
designations (Chapter 4).
(v) To assess the position of Chaerephon within the Molossidae using nuclear RAG2 and
mitochondrial cytochrome b sequence analysis (Appendix 3).
REFERENCES
Ammerman, L.K., Lee, D.N. and Tipps, T.M. (2012). First molecular phylogenetic insights into the
evolution of free-tailed bats in the subfamily Molossinae (Molossidae, Chiroptera). Journal of
Mammalogy 93: 12-28.
Arroy-Cabrales, J. R., Gregorin, D., Schlitter, A., Walker, A. (2002). The oldest African molossid
bat cranium (Chiroptera: Molossidae). Journal of Vertebrate Palaeontology 22: 380-387.
Aspetsberger, F., Brandsen, D. and Jacobs, D. S. (2003). Geographic variation in the
morphology, echolocation and diet of the little free-tailed bat, Chaerephon pumilus
(Molossidae). African Zoology 38: 245-254.
Avise, J.C. (2004). Molecular markers, natural history, and evolution, 2nd edition. Sinauer
Associates, Sunderland, Massachusetts. Pp. 684.
Baker, R. J. and Bradley, R. D. (2006). Speciation in mammals and the genetic species concept.
Journal of Mammalogy 87: 643-662.
Baker, R. J., Hoofer, S.R., Porter, C.A., and Van Den Bussche, R.A. (2003). Diversification among
New World leaf-nosed bats: evolutionary hypothesis and classification inferred from digenomic
congruence of DNA sequence. Occasional Papers, Museum of Texas Tech University 230:1–32.
Baker, R.J., McDonough, M.M., Swier, V.J., Larsen, P.A., Carrera, J.P. and Ammerman, L.K.
(2009). New species of bonneted bat, Genus Eumops (Chiroptera: Molossidae) from the
lowlands of western Ecuador and Peru. Acta Chiropterologica 11: 1-13.
Balloux, F. and Lougon-Moulin, N.(2002). The estimation of population differentiation with
microsatellite markers. Molecular Ecology 11: 155-165.
10
Bickford, D., Lohman, D.J., Sodhi, N.S., Ng, P.K.L., Meier, R., Winker, K., Ingram, K.K. and Das,
I. (2006). Cryptic species as a window on diversity and conservation. Trends in Ecology and
Evolution 22: 148-155.
Bilgin, R., Karatas, A., Coraman, E., Disotell, T. and Morales, J.C. (2008). Regionally and
climatically restricted patterns of distribution of genetic diversity in a migratory bat species,
Miniopterus schreibersii (Chiroptera: Vespertilionidae). BMC Evolutionary Biology 8: 209.
Birungi, J. and Arctander, P. (2000). Large sequence divergence of mitochondrial DNA
genotypes of the control region within populations ofthe African antelope, kob (Kobus kob).
Molecular Ecology 9: 1997-2008.
Bradley, R.D. and Baker, R.J. (2001). A test of the genetic species concept: Cytochrome-b
sequences and mammals. Journal of Mammalogy 84: 960-973.
Brambilla, M., Vitulano, S., Spina, F., Baccetti, N., Gabriel Gargallo, G., Fabbri, E.,
Guidali, F. and Randi, E. (2008). A molecular phylogeny of the Sylvia cantillans complex: Cryptic
species within the Mediterranean basin. Molecular Phylogenetics and Evolution 48: 461-472.
Brito, P.H. and Edwards, S.V. (2009). Multilocus phylogeography and phylogenetics using
sequence-based markers. Genetics135: 439-455.
Brown, D.M., Brenneman, R.A., Koepfli, K-P., Pollinger, J.P., Mila, B., Georgiadis, N.J., Louis Jr,
E.E., Grether, G.F., Jacobs, D.K. and Wayne, R.K. (2007). Extensive population genetic
structure in the giraffe. BMC Biology 5:57 doi: 10.1186/1741-7007-5-57.
Burland, T.M., Barratt, E.M., Nicholas, R.A. and Racey, P.A. (2001). Mating patterns, relatedness
and the basis of natal philopatry in the brown long-eared bat, Plecotus auritus. Molecular
Ecology 10: 1309-1321.
Campbell, P., Schneider, C.J., Adnan, A.M., Zubaid, A. and Kunz, T.H. (2004). Phylogeny and
phylogeography of Old World fruit bats in the Cynopterus brachyotis complex. Molecular
Phylogenetics and Evolution 33: 764-781.
Campbell, S., Guay, P.-J., Mitrovski, P.J. and Mulder, R. (2009). Genetic differentiation among
populations of a specialist fishing bat suggests lack of suitable habitat connectivity. Biological
Conservation 142: 2657-2664.
Cao, Y., Adachi, J., Janke, A., Pääbo, S. and Hasegawa, M. (1994). Phylogenetic
relationships among eutherian orders estimated from inferred sequence of mitochondrial proteins:
Instability of a tree based on a single gene. Journal of Molecular Evolution 39: 519-527.
11
Cardinal, B.R. and Christidis, L. (2000). Mitochondrial DNA and morphology reveal three
geographically distinct lineages of the large bentwing bat (Miniopterus schreibersii) in Australia.
Australian Journal of Zoology 48: 1–19.
Castella, V., Ruedi, M. and Excoffier, L. (2001). Contrasted patterns of mitochondrial and nuclear
structure among nursery colonies of the bat Myotis myotis. Journal of Evolutionary Biology 14:
708-720.
Castella, V., Ruedi, M., and Excoffier, L., Ibanez, C., Arlettaz, R. and Hausser, J. (2000). Is the
Gibralter Strait a barrier to gene flow for the bat Myotis myotis (Chiroptera: Vespertilionidae)?
Molecular Ecology 9: 1761-1772.
Chen, J., Rossiter, S.J., Flanders, J.R., Sun, Y., Hua, P., Miller-Butterworth, C., Liu, X., Rajan, K.E.
and Zhang, S. (2010). Contrasting genetic structure in two co-distributed species of Old World
fruit bat. PLoS ONE 5: E13903.
Chinnasamy, K., Pitchamuthu, M., Doss, P.S., Marimuthu, G. and Rajan, K.E. (2011). Genetic
diversity and population structure of leaf-nosed bat Hipposideros speoris (Chiroptera:
Hipposideridae) in Indian subcontinent. African Journal of Biotechnology 10(8): 1320 – 1328.
Colgan, D. J. and Costa, P. (2002). Megachiropteran evolution studied with 12S rDNA and c-mos
DNA sequences. Journal of Mammalian Evolution 9: 3–22.
Cooper, S.J.B., Reardon, T.B. and Skilins, J. (1998). Molecular systematics of Australian
rhinolophid bats (Chiroptera: Rhinolophidae). Australian Journal of Zoology 46: 203–220.
Cummings, M. P., Otto, S. P. and Waeley, J. (1995). Sampling properties of DNA sequence data in
phylogenetic analysis. Systematic Biology 43: 449-459.
Da´ valos, L. M. (2005). Molecular phylogeny of funnel-eared bats (Chiroptera: Natalidae), with
notes on biogeography and conservation. Molecular Phylogenetics and Evolution 37: 91–103.
Dixon, M.D. (2011). Population genetic structure and natal philopatry in the widespread North
American bat Myotis lucifugus. Journal of Mammalogy 92(6): 1343 – 1351.
Donnelly, M.J and Townson, H. (2000). Evidence for extensive genetic differentiation among
populations of the malaria vector Anopheles arabiensis from Eastern Africa. Insect Molecular
Biology 9:357–367.
Durrant, C.J., Beebee, T.J.C., Greenaway, F. and Hill, D.A. (2009). Evidence of recent population
bottlenecks an inbreeding in British populations of Bechstein’s bat, Myotis bechsteinii.
Conservation Genetics 10: 489-496.
Eick, G. N., Jacobs, D. S., and Matthee, C. A. (2005). A nuclear DNA phylogenetic
12
perspective on the evolution of echolocation and historical biogeography of extant bats
(Chiroptera). Molecular Biology and Evolution 22: 1869- 1886.
Fenton, M. B., Jacobs, D. S., Richardson, E. R., Taylor, P. J. and White, W. (2004). Individual
signatures in the frequency modulated sweep calls of African large-eared free-tailed bats
(Otomops martiensseni) (Chiroptera: Molossidae). Journal of Zoology 262:11-19.
Flanders, J., Jones, G., Benda, P., Dietz, C., Zhang, S., Li, G., Sharifi, M. and Rossiter, S.J. (2009).
Phylogeography of the greater horseshoe bat, Rhinolophus ferrumequinum: Contrasting results
from mitochondrial and microsatellite data. Molecular Ecology 18: 306-318.
Freeman, P.W. (1981). A multivariate study of the family Molossidae (Mammalia: Chiroptera):
morphology, ecology, evolution. Fieldiana Zoology 7: 1-173.
Gerlach, G. and Musolf, K.F. (2000). Fragmentation of landscape as a cause for genetic subdivision
in bank voles. Conservation Biology 14:1066–1074.
Goodman, B. (1991). Holy phylogeny! Did bats evolve twice? Science 253: 36.
Goodman, S.M. and Cardiff, S.G. (2004). A new species of Chaerephon (Molossidae) from
Madagascar with notes on other members of the family. Acta Chiropterologica 6: 227-248.
Goodman, S.M., Maminirina, C.P., Bradman, H.M., Christidis, L. and Appleton, B. (2009a). The
use of molecular phylogenetic and morphological tools to identify cryptic and paraphyletic
species: examples from the diminutive long-fingered bats (Chiroptera: Miniopteridae:
Miniopterus) on Madagascar. American Museum Novitates 3669: 1-34.
Goodman, S.M., Maminirina, C.P., Weyeneth, N., Bradman, H.M., Christidis, L., Ruedi, M. and
Appleton, B. (2009b). The use of molecular and morphological characters to resolve the
taxonomic identity of cryptic species: The case of Miniopterus manavi (Chiroptera,
Miniopteridae). Zoologica Scripta 38: 339–363.
Goodman, S.M., Buccas, W., Naidoo, T., Ratrimomanarivo, F., Taylor, P.J. and Lamb, J. (2010).
Patterns of morphological and genetic variation in western Indian Ocean members of the
Chaerephon leucogaster/C. pumilus complex (Chiroptera: Molossidae) with the description of a
new species from Madagascar. Zootaxa 2551: 1-36.
Guillen, A., Francis, C. M. and Ricklefs, R. E. (2003). In: Horseshoe Bats of the World. (eds G.
Csorba, P. Ujhelyi and N. Thomas), Phylogeny and biogeography of the horseshoe bats. Alana
Books, Bishop’s castle, United Kingdom. Pp. xii-xiv.
Hoffmann, F.G. and Baker, R.J. (2001). Systematics of bats of the genus Glossophaga (Chiroptera:
Phyllostomidae) and phylogeography in G. soricina based on cytochrome-b gene. Journal of
Mammalogy 82: 1092-1101.
13
Hoofer, S. R. and Van Den Bussche, R. A. (2003). Molecular phylogenetics of the chiropteran
family Vespertilionidae. Acta Chiropterologica 5, supplement: 1–63.
Hua, P., Zhang, L., Zhu, G., Jones, G., Zhang, S. and Rossiter, S.J. (2011). Hierarchial polygyny in
multiparous lesser flat-headed bats. Molecular Ecology 20: 3669-3680.
Hulva, P., Horacek, I., Strelkov, P.P. and Benda, P. (2004). Molecular architecture of Pipistrellus
pipistrellus/Pipistrellus pygmaeus complex (Chiroptera: Vespertilionidae): Further cryptic
species and Mediterranean origin of the divergence. Molecular Phylogenetics and Evolution 32:
1023-1035.
Hutcheon, J. M., Kirsch, J. A. W., Pettigrew, J .D. (1998). Base compositional biases and the bat
problem III. The question of microchiropteran monophyly. Transaction of the Royal Society of
London B 353:607–617.
Ibanez, C., Garcia-Mudarra, J.L., Ruedi, M., Stadelmann, B. and Juste, J. (2006). The Iberian
contribution to cryptic diversity in European bats. Acta Chiropterologica 8: 277-297.
Jacobs, D. S., Richardson, E. J. and Taylor, P. (2004). Genetic similarity amongst
phenotypicallydiverse little free-tailed bats, Chaerephon pumilus. Acta Chiropterologica 6:13-
21.
Jones, K. E., Purvis, A., Maclarnon, A., Bininda-Emonds, O. R. P. and Simmons, N. B. (2002). A
phylogenetic supertree of the bats (Mammalia: Chiroptera). Biological Reviews 77: 223-259.
Juste, J., Ibanez, C., Munoz, J., Trujillo, D., Benda, P., Karatas, A. and Ruedi, M. (2004).
Mitochondrial phylogeography of the long-eared bats (Plecotus) in the Mediterranean
Palaearctic and Atlantic Islands. Molecular Phylogenetics and Evolution 31: 1114-1126.
Kingston, T. and Rossiter, S.J. (2004). Harmonic-hopping in Wallacea’s bats. Nature 429: 654–657.
Lamb, J. M., Ralph, T. M. C., Goodman, S. M., Bogdanowicz, W., Fahr, J., Gajewska, M.,
Bates, P. J. J., Eger, J., Benda, P. and Taylor, P. J. (2008). Phylogeography and predicted
distribution of African-Arabian and Malagasy populations of giant mastiff bats, Otomops spp.
(Chiroptera: Molossidae). Acta Chiropterologica 10: 21-40.
Lamb, J. M., Abdel-Rahman, E.H., Ralph, T., Fenton, M.B., Naidoo, A., Richardson, E.J., Jacobs,
D.S., Denys, C. and Taylor, P.J. (2006). Phylogeography of southern and northeastern African
populations of Otomops martiensseni (Chiroptera: Molossidae). Durban Museum Novitates
31:42–53.
Lamb, J.M., Ralph, T.M.C., Naidoo, T., Taylor, P.J., Ratrimomanarivo, F., Stanley, W.T. and
Goodman, S.M. (2011). Toward a molecular phylogeny for the Molossidae (Chiroptera) of the
Afro-Malagasy region. Acta Chiropterologica 13: 1-16.
14
Larsen, P.A., Hoofer, S.R., Bozeman, M.C., Pedersen, S.C., Genoways, H.H., Phillips, C.J., Pumo,
D.E and Baker, R. J. (2007). Phylogenetics and phylogeography of the Artibeus jamaicensis
complex based on cytochrome b DNA sequences. Journal of Mammalogy 88: 712 – 727.
Legendre, S. (1984). Etude odontologique des représentants actuels du groupe Tadarida,
(Chiroptera: Molossidae). Implications phylogénétiques, systématiques et zoogéographiques.
Revue Suisse de Zoologie 91: 399-442.
Lewis-Oritt, N., Porter, C. A. and Baker, R. J. (2001). Molecular systematics of the family
Mormoopidae (Chiroptera) based on cytochrome b and recombination activating gene 2
sequences. Molecular Phylogenetics and Evolution 20:426–436.
Li, G., Jones, G., Rossiter, S. J., Chen, S-F., Parsons, S. and Zhang, S. (2006). Phylogenetics of
small horseshoe bats from east Asia based on mitochondrial DNA sequence variation. Journal of
Mammalogy 87: 1234- 1240.
Lim, B. K., Engstrom, M. D., Bickham, J. W. and Patton, J. C. (2008). Molecular phylogeny of
New World sheath-tailed bats (Emballonuridae: Diclidurini) based on loci from the four genetic
transmission systems in mammals. Biological Journal of the Linnean Society London 93:189–
209.
Lincoln, R., Boxshall G. and Clark, P. (1998). A dictionary of ecology, evolution and systematics,
second edition. Cambridge University Press, Cambridge. Pp 371.
Lovejoy, N.R. and Collette, B.B. (2001). Phylogenetic relationships of New World needlefishes
(Teleostei: Belonidae) and the biogeography of transitions between marine and freshwater
habitats. Copeia 2: 324-338.
Mayr, E. (1996). What is a species, and what is not? Philosophy of Science 63: 262-277.
Miller-Butterworth, C.M., Eick, G., Jacobs, D.S., Schoeman, C. and Harley, E.H. (2005). Genetic
and phenotypic differences between South African long-fingered bats with a global Miniopterine
phylogeny. Journal of Mammalogy 86: 1121-1135.
Miyamoto, M. M., Porter, C. A. and Goodman, M. (2000). c-Myc gene sequences and the
phylogeny of bats and other eutherian mammals. Systematic Biology 49: 501-514.
Monadjem, A., Taylor, P.J., Cotterill, F.P.D.and Schoeman, M.C. (2010). Bats of Southern and
Central Africa: A Biogeographic and Taxonomic Synthesis. Wits University Press, South Africa.
Pp. 596.
Nagy, M., Heckel, G., Voigt, C.C. and Mayer, F. (2007). Female-biased dispersal and patrilocal kin
groups in a mammal with resource-defence polygyny. Proceedings of the Royal Society of
London Series B 274: 3019-3025.
15
O’Brien, S.J. (1994). A role for molecular genetics in biological conservation. Proceedings of the
National Academy of Sciences of the United States of America 91: 5748-5755.
Olson, L., Goodman, S.M. and Yoder, A.D. (2004). Illumination of cryptic species boundaries in
long-tailed shrew tenrecs (Mammalia: Tenrecidae; Microgale), with new insights into
geographic variation and distributional constraints. Biological Journal of the Linnean Society 83:
1–22.
Omland, K.E., Tarr, C.L., Boarman, W.I., Marzluff, J.M. and Fleischer, R.C. (2000). Cryptic
genetic variation and paraphyly in ravens. Proceedings of the Royal Society of London, B:
Biological Sciences 267: 2475-2482.
Palsson, S. (2000). Microsatellite variation in Daphnia pulex from both sides of the Baltic Sea.
Molecular Ecology 9: 1075–1088.
Peppers, L.L. and Bradley, R.D. (2000). Cryptic species in Sigmodon hispidus: Evidence from
DNA sequences. Journal of Mammalogy 81: 332-343.
Pfenninger, M. and Schwenk, K. (2007). Cryptic animal species are homogeneously distributed
among taxa and biogeographical regions. BMC Evolutionary Biology, 7 (121) doi:
10.1186/1471-2148-7-121.
Peterson, R.L., Eger, J.L. and Mitchell, L. (1995). Chiroptères. Faune De Madagascar. Muséum
national d’Histoire naturelle, vol.84, Paris. Pp.152-167.
Pettigrew, J. D. (1986). Flying primates? Megabats have the advanced pathways from eye to
midbrain. Science 231: 1304–1306.
Pettigrew, J. D., Jammieson, B. G., Robson, S. K., Hall, L. S., McAnally, K. I. and Cooper, H. M.
(1989). Phylogenetic relations between microbats, megabats and primates
(Mammalia: Chiroptera and Primates). Philosophic Transaction of the Royal Society of London
B 325: 489–559.
Pettigrew, J. D., and Kirsch, J.A.W. (1995). Flying primates revisited – DNA hybridization with
fractionated, GC enriched DNA. South African Journal of Science 91:477–482.
Porter, C.A. and Baker, R.J. (2004). Systematics of Vampyressa and related genera of phyllostomid
bats as determined by cytochrome-b sequences. Journal of Mammalogy 85:126-132.
Ramasindrazana, B., Goodman, S.M., Schoeman, M.C. and Appleton, B. (2011). Identification of
cryptic species of Miniopterus bats (Chiroptera: Miniopteridae) from Madagascar and the
Comoros using bioacoustic overlaid on molecular genetic and morphological characters.
Biological Journal of the Linnean Society 104: 284-302.
16
Ratrimomanarivo, F. H., Vivian, J., Goodman, S.M., and Lamb, J. (2007). Morphological and
molecular assessment of the specific status of Mops midas (Chiroptera: Molossidae) from
Madagascar and Africa. African Zoology 42: 237-253.
Ratrimomanarivo, F. H., Goodman, S. M., Hoosen, N., Taylor, P. J. and Lamb, J. (2008).
Morphological and molecular variation in Mops leucostigma (Chiroptera: Molossidae) of
Madagascar and the Comoros: Phylogeny, phylogeography and geographic variation.
Mitteilungen aus dem Hamburgischen Zoologischen Museum 105: 57-101.
Ratrimomanarivo, F.H., Goodman, S.M., Taylor, P.J., Bronwyn, M. and Lamb, J. (2009a).
Morphological and genetic variation in Mormopterus jugularis (Chiroptera: Molossidae) in
different bioclimatic regions of Madagascar with natural history notes. Mammalia 73: 110-129.
Ratrimomanarivo, F. H., Goodman, S.M., Stanley, W., Naidoo, T., Taylor, P.J. and Lamb, J.
(2009b). Geographic and phylogeographic variation in Chaerephon leucogaster (Chiroptera:
Molossidae) of Madagascar and the western Indian Ocean islands of Mayotte and Pemba. Acta
Chiropterologica 11:25-52.
Ravaoarimanana, I.B., Tiedemann, R., Montagnon, D. and Rumpler, Y. (2004). Molecular and
cytogenetic evidence for cryptic speciation within a rare endemic Malagasy lemur, the Northern
Sportive Lemur (Lepilemur septentrionalis). Molecular Phylogenetics and Evolution 31: 440-
448.
Rodriguez, R.M. and Ammerman, L.K. (2004). Mitochondrial DNA divergence does not reflect
morphological difference between Myotis californicus and Myotis ciliolabrum. Journal of
Mammalogy 85: 842-851.
Roehrs, Z. P., Lack, J. B. and Van Den Bussche, R. A. (2010). Tribal phylogenetic relationships
within Vespertilioninae (Chiroptera: Vespertilionidae) based on mitochondrial and nuclear
sequence data. Journal of Mammalogy 91:1073–1092.
Rubinoff, D. and Holland, B.S. (2005). Between two extremes: Mitochondrial DNA is neither the
panacea nor the nemesis of phylogenetic and taxonomic inference. Systematic Biology 54: 952-
961.
Russell, A.L., Turmelle, A.S., Brown, V.A. and McCracken, G.F. (2005).Extremely variable di- and
tetranucleotide microsatellite lociin Brazilian free-tailed bats (Tadarida brasiliensis). Molecular
Ecology Notes 5: 669-671.
Russo, D. and Jones, G. (2000). The two cryptic species of Pipistrellus (Chiroptera:
Vespertilionidae) occur in Italy: Evidence from echolocation calls. Mammalia 62: 187-197.
17
Rydell, J., Arita, H.T., Santos, M. and Granados, J. (2002). Acoustic identification of
insectivorousbats (Order Chiroptera) of Yucatan, Mexico. Journal of Zoology 257:27–36.
Salgueiro, P., Palmeirim, J.M., Ruedi, M. and Coelho, M.M. (2008). Gene flow and population
structure of the endemic Azorean bat (Nyctalus azoreum) based on microsatellites: implications
for conservation. Conservation Genetics 9:1163–1171.
Simmons, N. B. (1994). The case for chiropteran monophyly. American Museum Novitates 3103: 1-
54.
Simmons, N. B. (1995). Bat relationships and the origin of flight. In: Ecology, Evolution and
Behaviour of Bats. (eds. P. A. Racey and S. M. Swift). Symposia of the Zoological Society of
London No 67. Pp. 27-43.
Simmons, N. B. and Geisler, J. H. (1998). Phylogenetic relationship of Icaronycteris,
Archaeonycteris, Hassianycteris, and Palaeochiropteryx to extant bat lineages, with
comment on the evolution of echolocation and foraging strategies in Microchiroptera.
Bulletin of American Museum of Natural History 235: 1–185.
Simmons, N.B. (2005). Order Chiroptera. In Mammal Species of the World: A Taxonomic and
Geographic Reference, 3rd edition, (eds D.E. Wilson and D.M. Reeder). The John Hopkins
University Press, Baltimore. Pp 434-435.
Smith, J. D. and Madkour, G. (1980). Penial morphology and the question of chiropteran
phylogeny. In Proceedings of the Fifth International Bat Research Conference (eds D. E. Wilson
and A. L. Gardner). Texas. Pp 347-365.
Springer, M.S., DeBry, R.W., Douady, C., Amrine, H.M., Madsen, O., de Jong, W.W. and
Stanhope, M.J. (2001). Mitochondrial versus nuclear gene sequences in deep-level mammalian
phylogeny reconstruction. Molecular Biology and Evolution 18: 132-143.
Stearns, S.C. and Hoekstra, R.F. (2000). Evolution: An Introduction. Oxford University Press,
Oxford. Pp. 381.
Steppan, S.J., Storz, B.L. and Hoffmann, R.S. (2004). Nuclear DNA phylogeny of the squirrels
(Mammalia: Rodentia) and the evolution of aboreality from c-myc and RAG1. Molecular
Phylogenetics and Evolution 30: 703-719.
Taylor, P.J. (1999). Problems with the identification of southern African Chaerephon (Molossidae),
and the possibility of a cryptic species from South Africa and Swaziland. Acta Chiropterologica
1: 191-200.
18
Taylor, P.J., Lamb, J., Reddy, D., Naidoo, T., Ratrimomanarivo, F. and Goodman, S.M. (2009).
Cryptic lineages of little free-tailed bats, Chaerephon pumilus (Chiroptera: Molossidae) from
southern Africa and the western Indian Ocean islands. African Zoology 44: 55-70.
Teeling, E. C., Scally, M., Kao, D. J., Romagnoll, M. L., Springer, M. S. and Stanhope, M. J.
(2000). Molecular evidence regarding the origin of echolocation and flight in bats. Nature
403:188–192.
Teeling, E. C., Madsen, O., Van den Bussche, R. A., de Jong, W. W., Stanhope, M. J. and Springer,
M. S. (2002). Microbat paraphyly and convergent evolution of a key innovation in Old World
rhinolophid microbats. Proceedings of the National Academy of Sciences 99:1431– 1436.
Teeling, E. C., Springer, M. S., Madsen, O., Bates, P., O’ Brien, S. J. and Murphy, W. J.
(2005). A molecular phylogeny for bats illuminates biogeography and the fossil record.
Science 307:580584.
Thabah, A., Rositer, S.J., Kingston, T., Zhang, S., Parsons, S., Mya Mya, K., Zubaid, A. and Jones,
G. (2006). Genetic divergence and echolocation call frequency in cryptic species of
Hipposideros larvatus s.l (Chiroptera: Hipposideridae) from the Indo-Malayan region.
Biological Journal of the Linnean Society 88: 119-130.
Tian, L., Liang, B., Maeda, K., Metzner, W. and Zhang, S. (2004). Molecular studies on the
classification of Miniopterus schreibersii (Chiroptera: Vespertilionidae) inferred from
mitochondrial cytochrome b sequences. Folia Zoologica 53: 303-311.
Tiedemann, R., Hardy, O., Vekemans, X. and Milinkovitch, M.C. (2000). Higher impact of female
than male migration on population structure in large mammals. Molecular Ecology 9:1159–
1163.
Towes, D.P.L and Irwin, D.E. (2008). Cryptic speciation in a Holarctic passerine revealed by
genetic and bioacoustic analyses. Molecular Ecology 17: 2691-2705.
Van de Bussche, R.A. and Baker, R.J. (1993). Molecular phylogenetics of the New World bat genus
Phyllostomus based on cytochrome b DNA sequence variation. Journal of Mammalogy 74: 793-
802.
Vences, M. and Glaw, F. (2005). A new cryptic frog of the genus Boophis from the north-western
rainforests of Madagascar. African Journal of Herpetology 54: 77–84.
Weyeneth, N., Goodman, S.M., Stanley, W.T. and Ruedi, M. (2008). The biogeography of
Miniopterus bats (Chiroptera: Miniopteridae) from the Comoro Archipelago inferred from
mitochondrial DNA. Molecular Ecology 17: 5205-5219.

19
Yoder, A.D., Olson, L.E., Hanley, C., Heckman, K., and Rasoloarison, R. et al. (2005). A
multidimensional approach for detecting species patterns in Malagasy vertebrates. Proceedings
of the National Academy of Sciences of the United States of America 102: 6587–6594.
20
CHAPTER ONE Analysis of the Genetic Diversity of Chaerephon leucogaster
(Chiroptera: Molossidae) of Madagascar and from the western
Indian Ocean islands of Mayotte and Pemba
ABSTRACT
Chaerephon leucogaster, Grandidier’s free-tailed bat, belongs to the family Molossidae.
Chaerephon leucogaster was regarded as synonymous with C. pumilus. Current taxonomic
classification ranks C. leucogaster and C. pumilus as separate species. This study was
conducted to provide information on the genetic diversity of C. leucogaster and to resolve
issues concerning its taxonomic classification.
DNA sequencing of the mitochondrial cytochrome b (863 nucleotides, n = 39) and D-loop
(338 nucleotides, n = 71) regions was used to estimate the genetic diversity of C.
leucogaster individuals from Madagascar, Mayotte (Comoros Archipelago) and Pemba (an
off-shore island of Tanzania). Chaerephon leucogaster from these islands formed a
monophyletic clade with respect to the outgroups (Mops leucostigma and Mops midas).
This was supported by congruent results from Bayesian (posterior probability 1.00),
maximum parsimony (bootstrap 99 %) and neighbor-joining (bootstrap 100 %) analyses.
Chaerephon pumilus (Madagascar) formed a sister taxon to the C. leucogaster clade
(bootstrap 98 %; posterior probability 0.95).
Cytochrome b genetic distances among C. leucogaster samples were low (maximum 0.35
%). Genetic distances between C. leucogaster and C. pumilus ranged from 1.77 % to 2.62
%. Together, phylogenetic and distance analyses supported the classification of C.
leucogaster and C. pumilus (Madagascar) as separate species.
21
For cytochrome b and the D-loop, haplotype diversity (h) was high, whilst nucleotide
diversity (п) was low (cytochrome b - 0.718, 0.0011; D-loop - 0.870, 0.00737). D-loop data
for Malagasy samples revealed significant but shallow phylogeographic structuring into
three latitudinal groups (13º S, 15 - 17º S, 22 - 23º S) showing exclusive haplotypes which
correlated with regions of suitable habitat defined by ecological niche modelling. Analysis
of Molecular Variance indicated that 40.44 % of the variance occurred among the three
groups.
The Mozambique Channel is suggested to be an insignificant barrier to gene flow. Africa is
considered to be the origin of dispersal for C. leucogaster populations on Madagascar,
Mayotte and Pemba. Population genetic analysis of D-loop sequences indicated that
populations from Madagascar have been expanding since 5 842 - 11 143 years BP.
22
1. INTRODUCTION 1.1 BACKGROUND INFORMATION ON CHAEREPHON
1.1.1 THE FAMILY MOLOSSIDAE The family name Molossidae is derived from the Greek term “molossos” for an ancient Greek wolf-
dog (Rosevear, 1965). Bats belonging to this family have acquired this name because of the mastiff
appearance of the face and head. Other characteristic features are the exceptionally large ears of
some species and the tail, which projects well beyond the interfemoral membrane – hence the term
free-tailed bat (Rosevear, 1965).
Molossidae are widely distributed in the warmer parts of the world. According to Hill and Smith
(1984), members of this family are strong and fast-flying bats which feed largely on insects and
other invertebrates. Molossids frequently inhabit human dwellings, outbuildings, caves, tunnels,
rocks and hollow trees (Hill and Smith, 1984). These bats are gregarious or semi-gregarious and
often live in large colonies. Males and females occasionally live as separate groups.
Molossidae were considered a sub-group of Vespertilionidae or Emballonuridae, until established as
a separate family by Gervais in 1856 (Rosevear, 1965). Molossidae is a large family, comprising 16
genera (Chaerephon, Cheiromeles, Cynomops, Eumops, Molossops, Molossus, Mops, Mormopterus,
Myopterus, Nyctinomops, Otomops, Platymops, Promops, Sauromys, Tadarida, Tomopeas)
(Simmons, 2005). In Madagascar, Molossidae comprise five genera and eight species; Mormopterus
jugularis, Otomops madagascariensis, Mops midas, M. leucostigma, Tadarida fulminans,
Chaerephon pumilus, C. jobimena and C. leucogaster (Goodman and Cardiff, 2004).
1.1.2 CURRENT TAXONOMIC STATUS The genus Nyctinomus was proposed by Geoffroy St Hilaire (1813) and was used extensively in the
taxonomic classification of molossid bats (Rosevear, 1965). In 1814, Rafinesque suggested a new
genus name Tadarida. Nyctinomus was still used by many authors (Dobson, 1878), whilst Tadarida
was accepted and also used in the literature. Dobson (1874) first proposed Chaerephon as a
subgenus of Nyctinomus/Tadarida. It was later raised to generic status by Andersen in 1907
(McLellan, 1986). In 1951, Ellerman et al. once again proposed Chaerephon as a subgenus of
23
Tadarida. Freeman (1981) divided the African members of the genus Tadarida into four genera
(Mormopterus, Tadarida, Chaerephon and Mops), thus ranking Chaerephon as a genus – this is a
conclusion not followed by several other bat taxonomists (e.g. Corbet and Hill, 1986; Legendre,
1984; Meester et al., 1986; Bouchard 1998). Peterson et al. (1995) regarded Chaerephon as a
subgenus of Tadarida on the basis of certain morphological characters that are shared by a few
species of both Chaerephon and Mops (Bouchard, 1998). Currently, Simmons (2005) has adopted
the generic classification proposed by Freeman (1981) whereby Chaerephon is given generic status.
There has also been much debate on the taxonomic status of C. leucogaster (Allen 1939; Hill and
Carter, 1941; Rosevear, 1965; Hayman and Hill, 1971; Ansell, 1978; Freeman, 1981; Happold,
1987; Koopman, 1993; Peterson et al., 1995; Bouchard, 1998; Grubb, et al., 1998; Hutson et al.,
2001; Russ et al., 2001). This species of Chaerephon was initially considered to be distinct and
endemic to Madagascar (Type locality: Madagascar, Menabe). It was first named by Grandidier in
1869 as Nyctinomus leucogaster. In the 1960’s C. leucogaster and various other west African forms
of this bat were suggested to be synonyms of C. pumilus (Rosevear, 1965). C. leucogaster was
included in C. pumilus by Koopman (1993) and Bouchard (1998). More recently, Peterson et al.
(1995) gave an account of morphological and biological characteristics and Russ et al. (2001) of
echolocation frequencies; both ranked leucogaster as a species in the genus Tadarida. Hutson et al.
(2001), Goodman and Cardiff (2004), Lavrenchenko et al. (2004) and Simmons (2005) adopted the
classification whereby leucogaster is considered to be a valid species in the genus Chaerephon.
1.1.3 PREVIOUS TAXONOMIC STUDIES ON CHAEREPHON LEUCOGASTER Hutson et al. (2001) reported that C. leucogaster is endemic to Madagascar. This is inaccurate given
that there are various geographical forms recorded from the African continent (Mali, Ghana, Congo
and Ethiopia). The following review is based on previous taxonomic studies conducted on African
and Malagasy forms to illustrate the aetiology of the current taxonomic status of C. leucogaster.
Allen (1939) listed the small west African forms of Chaerephon as distinct species – C. frater
(Allen, 1917), C. gambianus (De Winton, 1901), C. leucogaster (Grandidier, 1869), C. limbatus
(Peters, 1852), C. pumilus (Cretzschmar, 1826) and C. websteri (Dollman, 1908). He therefore
considered the smallest west African forms to be conspecific with the smallest Malagasy
24
Chaerephon. In his study of the bats of west Africa, Rosevear (1965) focused on two African
species, C. pumilus and C. limbata. Aellen (1952) considered limbata as a possible synonym of C.
pumilus as these two species co-existed and differed primarily in external morphology (colour).
Rosevear (1965) adopted the taxonomic status proposed by Ellerman et al. (1951), in which these
two forms are regarded as distinct species.
The species C. websteri was created by Dollman in 1908 and was thought to differ from C.
gambiana in size and morphology (Rosevear, 1965). Aellen (1952) suggested that C. websteri and
C. gambiana were identical. Discrepancies in the taxonomic classification of C. websteri arose
when measurements were later taken of dry ‘websteri’ skins and it was found that the forearm
length and skull length measurements did not correspond to those made by Dollman (Rosevear,
1965). The external appearance of C. websteri alone was not thought to warrant species status. To
quote Rosevear (1965) “all small Chaerephon forms should be dealt with as separate entities with
the exception of websteri, which is synonymous with gambiana”. Chaerephon gambiana (which
was given species status) was found to be almost identical to C. pumilus, and it was suggested by
Monard (1939) that these two forms might belong to the same species (Rosevear, 1965). The form
nigri, although considered to be a distinct species by Hatt (1928), was found to be similar to
gambiana and websteri. Aellen (1952) later included nigri with websteri (Rosevear, 1965).
Rosevear (1965) recognised six species: pumila, limbata, gambiana, nigri, major and nigeriae.
Hayman and Hill (1971) did not recognize leucogaster as a separate species, and combined all
Chaerephon forms under the name C. pumilus. These species (cristata, elphicki, langi, limbata,
leucogaster, frater, faini, gambiana, hindei, naivashae, nigri, pusilla and websteri) were considered
synonyms of pumila. Happold (1987) and subsequently Koopman (1993) adopted this taxonomic
classification of Chaerephon.
Peterson et al. (1995) used a morphometric approach in determining whether leucogaster warrants
species status. This study included leucogaster samples from Madagascar and chapini, cristata,
frater, hindei, pumila, shortridgei and websteri from the African mainland (Ethiopia and Ghana).
Results indicated that there were two statistically-different groups based on size. Tadarida pumila
was present in the group containing the large-sized bats whereas T. leucogaster was found amongst
the smaller bats. Tadarida websteri was found to be closer in size to T. leucogaster. Concluding
remarks made by Peterson et al. (1995) suggested that leucogaster be considered as a valid species
25
in the genus Tadarida. Tadarida websteri (Dollman, 1908), cristatus (Allen, 1917), frater (Allen,
1917) and nigri (Hatt, 1928) (all West African forms) were regarded as synonymous of T.
leucogaster.
In 1998, Bouchard reviewed the classification from Freeman (1981) and Koopman (1993; 1994)
and recommended that Chaerephon leucogaster be considered a synonym of C. pumilus. Russ et al.
(2001) distinguished C. leucogaster from C. pumilus on the basis of its smaller size and different
echolocation calls. Chaerephon leucogaster was considered a valid species in the genus
Chaerephon by Hutson et al. (2001), Goodman and Cardiff (2004) and Lavrenchenko et al. (2004).
Currently, the taxonomic classification by Simmons (2005) recognizes that the genus Chaerephon
comprises 18 species and ranks C. leucogaster as a distinct species.
1.1.4 DESCRIPTION OF CHAEREPHON LEUCOGASTER 1.1.4.1 General Morphology Chaerephon leucogaster is commonly known as Grandidier’s free-tailed bat or the Madagascan
white-bellied free-tailed bat. Chaerephon leucogaster is distinguished morphologically from C.
pumilus by size, colour, dental and skull characteristics (reviewed by Peterson et al., 1995). Russ et
al. (2001) distinguished the two species based on echolocation calls. Chaerephon leucogaster is the
smallest species within the genus. Both the dorsal and ventral pelage are mid-brown whilst the mid-
ventral abdominal region is greyish white. The wing membranes are a whitish grey; this is a
defining characteristic of this species. Chaerephon leucogaster from Pemba have darker pelage
colorations and the white portion on the abdominal regions extends mid-ventrally; in this way it
differs from members of this species found on Madagascar and Mayotte (Ratrimomanarivo et al., in
press).
Ranges of external measurements of C. leucogaster are; mass 7 - 11 g, total length 75 - 91 mm,
forearm length 33 - 38 mm and wingspan 262 - 280 mm (Ratrimomanarivo et al., in press). As in
most bats belonging to this genus, the wings of C. leucogaster are long and narrow and may be
adapted for fast flight (Hutcheon, 1994). An external phenotypic feature that identifies males from
females is the postaural crest, which is less developed in adult females. C. leucogaster possesses
wrinkled lips, a small square tragus and a large square antitragus (Peterson et al., 1995). The ears
26
are large and round relative to the size of the head. The muzzle is usually short and broad. Bristles
occur on the outer-most toes.
Individuals of the species are high-flying aerial hawkers with distinctive calls (Russ et al., 2001).
They produce a long and steep FM call which has a maximum energy of 28 kHz, an inter-pulse
interval of 72 ms and duration of 9 ms (Russ et al., 2001).
1.1.4.2 Distribution Chaerephon leucogaster has been recorded over much of western and eastern Africa (Simmons,
2005). This species has been reported from the north of Nigeria, where it inhabits public buildings
and high forests which have undergone degradation to woodlands (Rosevear, 1965). Its range
extends to the northwest (Mali) and to the west (Ghana). In Ghana, these bats roosts naturally in
crevices of trees and are also found in large numbers under roofs of buildings (Grubb et al., 1998).
Chaerephon leucogaster is also known to roost in areas of the Congo Basin (Democratic Republic
of Congo) and Ethiopia (Dollman, 1908; Allen, 1917; Hatt, 1928; Simmons, 2005). In the DRC
they roost in open woodlands and more arid areas, as well as swampy gallery forest (Rosevear,
1965).
Chaerephon leucogaster is distributed along the western portion of Madagascar. It is found mainly
at lower elevations (< 900 m). Individuals were obtained from a locality at a higher elevation from
the other sampled localities, 870 m above sea level (Sakaraha). One individual was collected from a
locality (Manakara) on the eastern side of Madagascar. Its range extends to the northwest offshore
islands of Nosy Be and Nosy Komba as well as to the island of Mayotte in the Comoros
Archipelago and the offshore Tanzanian island of Pemba in the western Indian Ocean. All source
material of C. leucogaster from these areas was collected from synanthropic settings (Peterson et
al., 1995; Eger and Mitchell, 2003; Goodman et al., 2005; Rakotonandrasana and Goodman, 2007).
Goodman and Cardiff (2004) suggested that this colonization and speciation on distant oceanic
islands could be due the capability of these bats to disperse over water.
1.1.4.3 Habitat, Ecology, Social Structure and Dietary Requirements Chaerephon leucogaster is partly synanthropic (Peterson et al., 1995; Eger and Mitchell, 2003;
Goodman et al., 2005; Rakotonandrasana and Goodman, 2007), inhabiting man-made shelters such

27
as old buildings, as well as natural roosts such as trees and deep canyons (Goodman and Cardiff,
2004). Ratrimomanarivo et al. (in press) highlight the physical settings of the synanthropic day
roosts of C. leucogaster from Madagascar. These bats are found in roofs and attics of old buildings,
particularly under metal roofs with false ceilings in schools and hospitals that have been recently
constructed but possess the architectural features of older colonial-style buildings. Typically, these
buildings are less than 6 meters high. Bats from Pemba were collected from a similar setting, the
attic of a hospital (Stanley, in press). In Madagascar, an animal was recorded roosting 5 m off the
ground under the exfoliating bark of a dead tree in a sandy valley with agricultural fields and stands
of massive baobab trees (Goodman and Cardiff, 2004).
Chaerephon leucogaster may occur in monospecific roosts or may share roosting sites with other
molossid bats such as Mormopterus jugularis, C. pumilus and Mops leucostigma (Goodman and
Cardiff, 2004). The sizes of roosting colonies of this species vary from a few bats to hundreds.
Chaerephon leucogaster is an insectivorous bat which has a dietary requirement of small soft-
bodied insects.
1.2 CONSERVATION BIOLOGY- DEFINING SPECIES AND
CONSERVATION UNITS
1.2.1 SPECIES In biology, species is the central and fundamental unit that is used for comparison and measure of
biodiversity (O’Brien, 1994; Stearns and Hoekstra, 2000). Formalized taxonomy is critical as it
provides a basis of recognition by ranking biological forms according to a hierarchical classification
into species, genus, family and order (Van Valen, 1976; Bradley and Baker, 2001; Baker and
Bradley, 2006).
1.2.2 SPECIES CONCEPTS There are a variety of approaches and methods used in different fields to define species (Agapow et
al., 2004). Some of the species concepts used are; the Morphological Species Concept (Lehman,
1967; Ruse, 1969; Mallet, 1995; Andersson, 1990; Mayr, 2000a), the Biological Species Concept
(Mayr, 1942; Van Valen, 1976), the Recognition Species Concept (Paterson, 1980; Coyne et al.,
1988; Sluys and Hazevoet, 1999; Mayr, 2000b), the Ecological Species Concept (Van Valen, 1976),
28
the Phylogenetic Species Concept (Cracraft, 1983; Nixon and Wheeler, 1990), the Evolutionary
Species Concept (Simpson, 1961; Wiley, 1978), the Cohesion Species Concept (Templeton, 1989)
and the Genetic Species Concept (Mayden, 1997; Baker and Bradley, 2006).
Early work was based on the visual recognition of an entity as being distinct. This gave rise to the
Morphological Species Concept (Lehman, 1967; Mayr, 2000a), which has been criticized as it is
subjective and unable to distinguish sibling and cryptic species as well as sexual dimorphism and
polymorphism (Andersson, 1990; Ruse, 1969; Mallet, 1995; Mayr, 2000a). Nevertheless, it formed
the basis of many concepts that were subsequently established. Current classifications of the genus
Chaerephon are based on morphological studies. This genetic study is designed to complement the
morphological characterization of Chaerephon leucogaster by Ratrimomanarivo et al. (in press).
According to the Biological Species Concept (BSC) (Mayr, 1942; Van Valen, 1976), species are
“groups of actually or potentially interbreeding natural populations which are reproductively
isolated from other such populations”. Species are therefore reproductively isolated and represent
separate evolutionary lineages. This concept is not universal as it is inapplicable to asexual
organisms. Difficulties are also encountered when hybridisation occurs (Agapow et al., 2004).
The Phylogenetic Species Concept (PSC) had gained attention due to the advancement of molecular
phylogenetics. Cracraft (1983) and Nixon and Wheeler (1990) described a species as a group of
organisms that share at least one uniquely-derived character. This species concept has been widely
accepted as it applies to asexual as well as allopatric populations. The PSC is valuable as it
emphasizes the importance of recognizing species as evolutionary lineages and is compatible with
the large amounts of sequence data currently available. However, classification under the PSC has
lead to an apparent rise in the number of endangered species due to ‘taxonomic inflation’ caused by
raising subspecies to species level (Baum, 1992; Agapow et al., 2004; Freeland, 2005).
Mayden (1997) defined genetic species in terms of “measurement of genetic differences that is used
to infer reproductive isolation and evolutionary independence”. The application of the Genetic
Species Concept (GSC) uses genetic data from both plastid and nuclear genomes in order to identify
species and species boundaries (Baker and Bradley, 2006). The GSC overlaps with the BSC, but
29
where reproductive isolation was the focus of the BSC, genetic isolation is the primary focus in the
GSC.
Baker and Bradley (2006) suggest that genetic isolation is a result of the divergence of two genomes
which are genetically distinct and share a common evolutionary history. The use of genetic data
contributes to the identification of monophyly, sister taxa and hybrid individuals. It can also provide
a perspective on types of divergence. Genetic drift is recognized as contributing to uniformity found
within populations as well as variation among separate populations (Templeton, 1989). Genetic
isolation in mammalian species can be explained using the Bateson-Dobzhansky-Muller (BDM)
model (Baker and Bradley, 2006). This model proposes that the accumulation of genetic changes in
two isolated populations results in the formation of two separate species. The implementation of the
GSC, which is useful for the identification of cryptic species, has resulted in an increase in the
number of recognised species. As this is a study of mitochondrial DNA sequences, the GSC will be
used to interpret levels of genetic isolation within and among populations and species.
1.2.3 EVOLUTIONARY SIGNIFICANT UNITS “Molecular data are critical to the shaping of management strategies and has been applied to the
identification of units of conservation” (King and Burke, 1999). Conservation units within species
are fundamentally important to prioritise and conduct management at a regional or local scale. The
Evolutionary Significant Unit (ESU) and the Management Unit (MU) aim to prioritise units of
protection below the taxonomic level of the species.
Ryder coined the term ‘Evolutionary Significant Unit’ in 1986 and defined it as “a subset of the
more inclusive entity, species, which possesses genetic attributes significant for the present and
future generations of the species in question” (Fraser and Bernatchez, 2001). Moritz (1994) defined
an ESU on the basis of historical isolation, which is known to produce a unique and inimitable
combination of genotypes (Crandall et al., 2000). This ESU definition allows conservation
biologists to apply molecular genetics and also to avoid determining how much genetic variation is
needed for a population to be allowed protection (Fraser and Bernatchez, 2001). Moritz (1994)
proposed the ‘Management Unit’ as a conservation unit below that of the ESU which is not afforded
the mandated protection that accompanies ESUs (King and Burke, 1999). MUs are involved in
short-term management, whilst ESUs are significant in long-term management.
30
Management and conservation strategies should aim to preserve adaptive diversity and evolutionary
processes across the geographic range of a species. Crandall et al. (2000) emphasized that in order
to conserve evolutionary processes; the goal should be to preserve the network of genetic
connections between the populations rather than just distinct populations. Such concepts will
become important in the context of this study should C. leucogaster, which is currently assessed as
‘data deficient’ (Chiroptera Specialist Group, 2000), be shown to contain genetically distinct
lineages occurring in geographical isolation.
1.2.4 THREATS TO BATS AND CONSERVATION IMPLICATIONS A variety of factors contribute to either the increase or reduction in size of bat populations
worldwide. Hutson et al. (2001) and Mickleburgh et al. (2002) reviewed the factors that affect bat
populations either directly or indirectly. According to Hill and Smith (1984), Fenton (1997), Hutson
et al. (2001) and Mickleburgh (2002), modification or destruction of bat habitats is one of the most
important factors that affect bat species. Habitat selection studies have revealed the importance of
several habitat classes for bat survival. These include day- and night-roosting habitat, feeding
habitat, and areas connecting roosting and feeding habitats.
In some areas caves, mines, crevices and artificial structures such as houses, churches, attic spaces
and chimneys provide ideal roost conditions for hibernation and nursing of bats, including C.
leucogaster. Depending on the species, bats may use only one roost type or vary the roost type
seasonally (Hutson et al., 2001). Structures that are used as night roosts function in conservation of
energy, predator protection, social contact/interaction with other bats and breeding (Kunz, 1982).
Fenton (1997) highlights the importance of management strategies for protection of these habitats.
In addition to roosts, foraging habitat is also an important factor in bat survival. Carmel and Safriel
(1998) assessed habitat use by seven bat species in Israel. Results identified two habitat types, scrub
and riparian vegetation, that were foraged by a number of endangered species. Previous studies
conducted by Walsh and Harris (1996) found that verspertilionid bats exhibited preferences for
broad-leaved woodlands and water bodies. Management programs were implemented to increase
the area of riparian vegetation, as it constitutes the major food source for at least three endangered
species. Agricultural growth has resulted in changes to the landscape inhabited by certain bat
species (Russ and Montgomery, 2002). Walsh and Harris (1996) determined that deciduous
31
woodland, water and linear landscapes were significant foraging areas for bats. Differences in
dietary requirements may be the cause of the difference in foraging habitats (Barlow, 1997). It has
been suggested that, for conservation purposes, semi-natural deciduous woodlands with coniferous
plantations should be increased. The preservation and improvement of water bodies should also be
considered. A study on habitat selection of Barbastella barbastellus, which is classed as Vulnerable
(Hutson et al., 2001) and Endangered in Italy (Bulgarini et al., 1998) revealed a preference for
unmanaged woodlands over open woodland and pasture. Roosts of this species were often in dead
or tall trees or beneath loose bark. Russo et al. (2004) suggested that preservation and protection of
unmanaged woodlands, which provide roosting and feeding opportunities, is essential for the
survival of this species. Human activities, such as clearing of these woodlands, decrease roosting
and feeding opportunities for these bats. Felling of trees should be avoided, or if unavoidable the
trees should be examined for the presence of bats.
The exploitation of land for agricultural purposes causes habitat reduction for many bat species.
Limpens and Kapteyn (1991), Jones et al. (1995) and Verboom (1998) highlighted the importance
of landscape elements such as treelines, hedgerows and canals that act as important connections
between roost sites and feeding areas. They recommended that the replacement of tree lines/hedges,
one of the most common foraging habitats of bats be discouraged, and that management strategies
be focused on the improvement and enhancement of highly-inhabited areas and connecting linear
habitats.
There has been major concern that anthropogenic factors threaten bats, particularly because of
habitat destruction associated with increasing human populations. Exploitation of land for
agricultural purposes plays a role in habitat reduction. Domestic livestock impacts woodlands,
grasslands and shrublands. The uncontrolled use of herbicides and pesticides is another threat (Amr
et al., 2006). Bio-accumulating organic pesticides kill both the pest and other insects (Hill and
Smith, 1984). A decrease in insect population size may result in a corresponding decline in
population size of insectivorous bats. The accumulation of certain toxins in adult bats can be the
cause of death to the nursing young.
Human activities can however, impact bat populations positively. Some bat species roost
exclusively in houses (Hutson et al., 2001). In southern Africa, molossid bats are frequently found
roosting in houses, as is the case in this study of C. leucogaster from Madagascar
32
(Rakotonandrasana and Goodman, 2007; Ratrimomanarivo et al., in press). The availability of roost
sites in buildings can lead to an increase in bat population size (Brosset, 1966; Kunz, 1982).
However, the use of houses as roosts may result in conflict with humans, who dislike bats (Hutson
et al., 2001). Fumigation is one destructive method that is used to eradicate bats. Education about
bats can result in protection of house-dwelling bats.
In 2002, Mickleburgh et al. reported the existence of 1,001 bat species globally. There are a number
of international treaties that protect fauna and flora worldwide, some which protect bats directly or
indirectly. Seven of these, which include the protection of bats, are highlighted by Hutson et al.
(2001). There are also a number of treaties that are specifically designed to protect, manage and
conserve bat populations across the world. These include: The Agreement on the Conservation of
Bats in Europe (EUROBAT) under the Bonn Convention (1994) and the Programme for the
Conservation of Migratory bats of Mexico and the United States (PCMM) (1994) (Hutson et al.,
2001). The EUROBAT Convention aims to implement strategies for the monitoring of bat
populations, the study of migratory species, the implementation of trans-boundary protection
programmes and the effective management of woodlands and underground habitats. The PCMM
Convention aims to develop programmes to research behavioral characteristics, migratory routes
and the economic value of bat populations, as well as to provide education to rural areas that are
found close to major roosting caves, and to develop formal legislation for cave conservation.
The Chiroptera Specialist Group of the IUCN’s species survival commission has two action plans to
examine conservation issues (Mickleburgh et al., 2002). This commission aims to conserve the
most threatened species and their habitats. It targets policy makers, organizations and individuals
that play a key role in promoting the conservation of bat species (Mickleburgh et al., 2002).
Madagascar is the fourth largest island in the world, situated 400 km east of Mozambique. It was
formed during the breakup of the Gondwana landmasses approximately 160 million years
(separation from Africa) and 90 million years (separation of Madagascar) ago (de Wit, 2003; Yoder
and Nowak, 2006; Ali and Aitchison, 2008). It is considered to be a biodiversity ‘hotspot’ (Myers et
al., 2000; Ganzhorn et al., 2001; Goodman and Benstead, 2005). It is an area that has a high level of
endemism coupled with severe threats to many species of flora and fauna. It is imperative that
conservation and management strategies are implemented in such areas (Ganzhorn et al., 2001;
Goodman and Benstead, 2005). Madagascar is regarded as a high priority area because endemism
33
extends to high taxonomic levels among plants and vertebrates; it is therefore regarded as a ‘critical
component of the global biological heritage’ (Myers et al., 2000; Goodman and Benstead, 2005).
Madagascar is one of the world’s poorest countries (Dostie et al., 2002; Minten and Barrett, 2008).
A large portion of the human population lives in rural settings with incomes below the poverty line
(Hutson et al., 2001). Increases in the human population cause extra demands for land, food and
other essential resources. This has led to ongoing habitat destruction.
According to Gautier and Goodman (2003), Baron (1889-90) divided the island into eastern, central
and western regions. The main vegetation type in the eastern region is dense humid forest. Littoral
forest occurs along the eastern coastal strip. A substantial amount of the original vegetation of the
eastern region was destroyed, but a significant amount still remains in protected areas (Gautier and
Goodman, 2003). Sub-humid forest and dry forest are found to the north of this region, whilst to the
south the vegetation undergoes a transition to spiny thicket. The central region covers
approximately 40 % of the island (Gautier and Goodman, 2003) and comprises land above 1000 m.
The central highlands are defined by moist montane forest. There are a number of major mountains,
such as Tsaratanana, Marojejy, Anjanaharibe-Sud, Ankaratra and Andringitra, which are
characterized by the presence of forest moss and lichens. Forest habitat in this region exists in a few
isolated and highly-fragmented areas. The western region is made up of dry deciduous forest; spiny
bush is the principal vegetation type in the southwest. Important forested areas are still present in
this region.
The major factors that threaten and contribute to the threat and destruction of the flora and fauna of
Madagascar are deforestation, agricultural fires, conversion of natural habitats into pasture and
over-exploitation of living resources (Hutson et al., 2001).
Deforestation can be attributed to three main factors:
(a) Slash and Burn (vernacular term: Tavy). This predominant land-use practice is the major
cause of degradation and deforestation, particularly in eastern Madagascar (Oxby and
Boerboom, 1985; Gade, 1996; Hutson et al., 2001; Marcus, 2001; Goodman, 2006; Styger
et al., 2007). It is used for the conversion of tropical rainforest to agricultural lands (rice
fields) and for wood exploitation (Gautier and Goodman, 2003). Fires kill native and
regenerating tree species (Styger et al., 2007). According to Green and Sussman (1990), the

34
extent of the eastern rainforest was reduced from 68 % to 63 % between 1950 and 1985.
Tavy also causes endemic biodiversity loss in Madagascar (Styger et al., 2007). Many bat
species, including C. leucogaster, that use tree crevices as roost sites are threatened or
killed by this practice.
(b) Charcoal/Fuelwood production. The spiny forests of Madagascar are being destroyed for
the production of charcoal, which is an important source of income in the southwestern
portion of Madagascar.
(c) Logging for Timber. Illegal logging poses a significant problem in some protected areas.
The current rate of deforestation in the western region is comparable to that in the east
(Gautier and Goodman, 2003).
The conservation status of bat species, such as C. leucogaster, which are found primarily in western
Madagascar, should be carefully assessed as their combined viability may be affected by the
deforestation described above. There is also over-exploitation of Madagascar’s fauna. In the
southwestern portions of Madagascar cave-dwelling bats are consumed during periods of famine
(Goodman, 2006). Lemurs and tenrecs are hunted, whilst reptiles and amphibians are collected for
international trade (Stiles, 1998; Schlaepfer et al., 2005; Andreone et al., 2008).
Madagascar has a protected area system which is classified into three different reserve types
(Randrianandianina et al., 2003). The Strict Nature Reserve protects fauna and flora within a
specified boundary, the National Park protects and preserves natural history and is used for
educational purposes, whilst the Special Reserve is involved in the protection of a specific
ecosystem. This network of protected areas was managed by a government organization known as
ANGAP (National Association for the Management of Protected Areas in Madagascar)
(Randrianandianina et al., 2003). A new park management system known as SAPM (the System of
Protected Areas of Madagascar) replaced ANGAP in 2006. One of the aims of this management
system is to simplify the process of creating protected areas and to contribute to sustainable
development and poverty reduction.
Madagascar became a member of other international agreements and treaties. The following include
the protection of bats:
(a) Convention on Biological Diversity (CBD - Rio Conference).
(b) Convention on protection of Wetlands (Ramsar).
35
(c) African Convention on the Conservation of Nature’s Natural Resources.
(d) Protocol concerning Protected Areas and Wild Fauna and Flora in the Eastern African
Region.
Sixty percent of Malagasy bat species are endemic (Goodman and Benstead, 2005). This can be
attributed to the geographic isolation of this island (Eger and Mitchell, 2003; Goodman and
Benstead, 2005). According to Eger and Mitchell (2003) and Goodman et al. (2005), the western
region of Madagascar has the greatest species richness and the highest density of bat species.
Vegetation type, food supply and roosting sites are suggested to be the factors which determine bat
distribution.
According to the 2008 IUCN (The World Conservation Union) Red List of threatened species
(Chiroptera Specialist Group, 2000), C. leucogaster is classified as data deficient (DD*). This
applies to species with uncertain species status (newly described or insufficient material available).
One of the aims of this study is to provide data on the genetic diversity of this species for use in
determining its conservation status.
1.3 METHODS OF STUDYING GENETIC DIVERSITY
1.3.1 RATIONALE FOR THIS STUDY Systematic data from morphological and behavioural studies have been traditionally used as
indicators of the diversity that exists between populations and species (Savage, 1995; Onarici and
Sumer, 2003). DNA analysis has increasingly been used to generate systematic data and provide
insight into diversity within ecosystems (Hillis and Davis, 1988). The Polymerase Chain Reaction
(PCR) and DNA sequencing are molecular methods that are commonly used to study phylogenetic
relationships (Innis et al., 1988; Kocher et al., 1989; Erlich et al., 1991; Onarici and Sumer, 2003).
The mitochondrial genome has been a marker of choice in animals owing to its variability. Coding
(cytochrome b) and non-coding (D-loop) mitochondrial DNA sequences were used in this study to
determine phylogenetic and phylogeographic patterns for C. leucogaster.
36
1.3.2 CHOICE OF REGIONS TO SEQUENCE Mitochondrial DNA sequences are an important tool and have been used to provide insight
into the evolutionary histories of animals and in population genetic and phylogeographic
studies (Moritz et al., 1987). The mitochondrial genome is a small, double-stranded
covalently-closed molecule, which ranges in size from 16 - 18 kb (Boore, 1999; Onarici
and Sumer, 2001; Freeland 2005) and contains 37 genes. It is maternally-inherited and is
therefore an apt indicator of female-mediated gene flow (Moritz et al., 1987; Kondo et al.,
1990; Gyllestein et al., 1991). Mitochondrial DNA contains no introns, repetitive DNA or
pseudogenes (Avise et al., 1987; Moritz et al., 1987). A unique characteristic is the lack of
recombination, which allows for transmission of a single haplotype from mother to
offspring (Clayton, 1982, 1992; Hayashi et al., 1985). Mitochondrial DNA is present in
multiple copies in each cell (Pereira, 2000; Michaels et al., 1992; Robin and Wong, 1998).
The mitochondrial genome has a higher mutation rate than the nuclear genome and may
evolve 5 - 10 times faster than single copy nuclear DNA (Brown et al., 1979). Transitions
outnumber transversions and base substitutions are found to be more common than
insertions or deletions (Avise et al., 1987). Although, on average, the mutation rate of the
mitochondrial genome is faster than that of the nuclear genome, the gene arrangement of
the mitochondrial genome is constant over long periods (Boore, 1999).
Mitochondrial DNA sequences have been used successfully in numerous studies to address
systematic questions at the level of both genus and species (Van Den Bussche et al. 1998; Avise
and Walker 1999). The phylogenetic utility of this gene for resolving species-level relationships in
bat genera has been well documented (Sudman et al. 1994; Wilkinson et al. 1997; Cooper et al.
1998; Wright et al. 1999; Bastian et al. 2001; Lewis-Oritt et al. 2001; Kawai et al. 2003;
Stadelmann et al. 2004; Hoofer et al. 2006; Li et al. 2006; Pulvers & Colgan 2007; Russell et al.
2007; Stadelmann et al. 2007). Furthermore, the use of this mitochondrial region permits the
comparison of my results with those from published data.
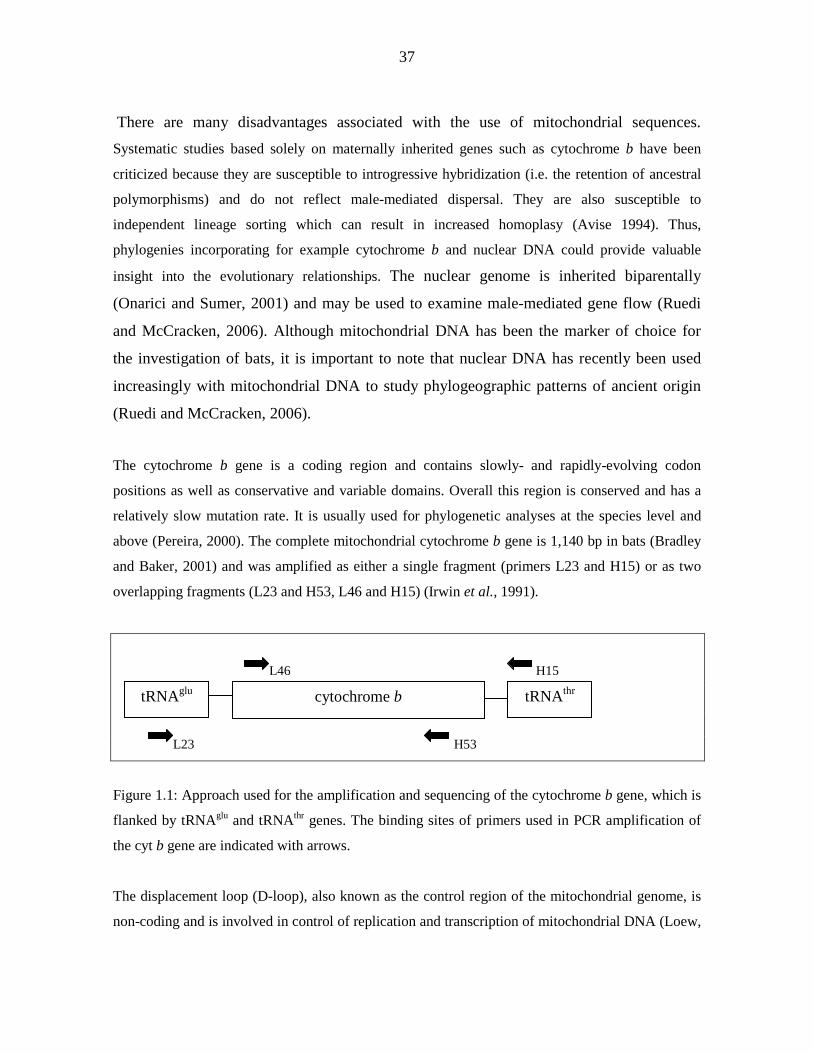
37
There are many disadvantages associated with the use of mitochondrial sequences. Systematic studies based solely on maternally inherited genes such as cytochrome b have been
criticized because they are susceptible to introgressive hybridization (i.e. the retention of ancestral
polymorphisms) and do not reflect male-mediated dispersal. They are also susceptible to
independent lineage sorting which can result in increased homoplasy (Avise 1994). Thus,
phylogenies incorporating for example cytochrome b and nuclear DNA could provide valuable
insight into the evolutionary relationships. The nuclear genome is inherited biparentally
(Onarici and Sumer, 2001) and may be used to examine male-mediated gene flow (Ruedi
and McCracken, 2006). Although mitochondrial DNA has been the marker of choice for
the investigation of bats, it is important to note that nuclear DNA has recently been used
increasingly with mitochondrial DNA to study phylogeographic patterns of ancient origin
(Ruedi and McCracken, 2006).
The cytochrome b gene is a coding region and contains slowly- and rapidly-evolving codon
positions as well as conservative and variable domains. Overall this region is conserved and has a
relatively slow mutation rate. It is usually used for phylogenetic analyses at the species level and
above (Pereira, 2000). The complete mitochondrial cytochrome b gene is 1,140 bp in bats (Bradley
and Baker, 2001) and was amplified as either a single fragment (primers L23 and H15) or as two
overlapping fragments (L23 and H53, L46 and H15) (Irwin et al., 1991).
L46 H15
L23 H53
Figure 1.1: Approach used for the amplification and sequencing of the cytochrome b gene, which is
flanked by tRNAglu and tRNAthr
genes. The binding sites of primers used in PCR amplification of
the cyt b gene are indicated with arrows.
The displacement loop (D-loop), also known as the control region of the mitochondrial genome, is
non-coding and is involved in control of replication and transcription of mitochondrial DNA (Loew,
cytochrome b tRNAglu tRNAthr
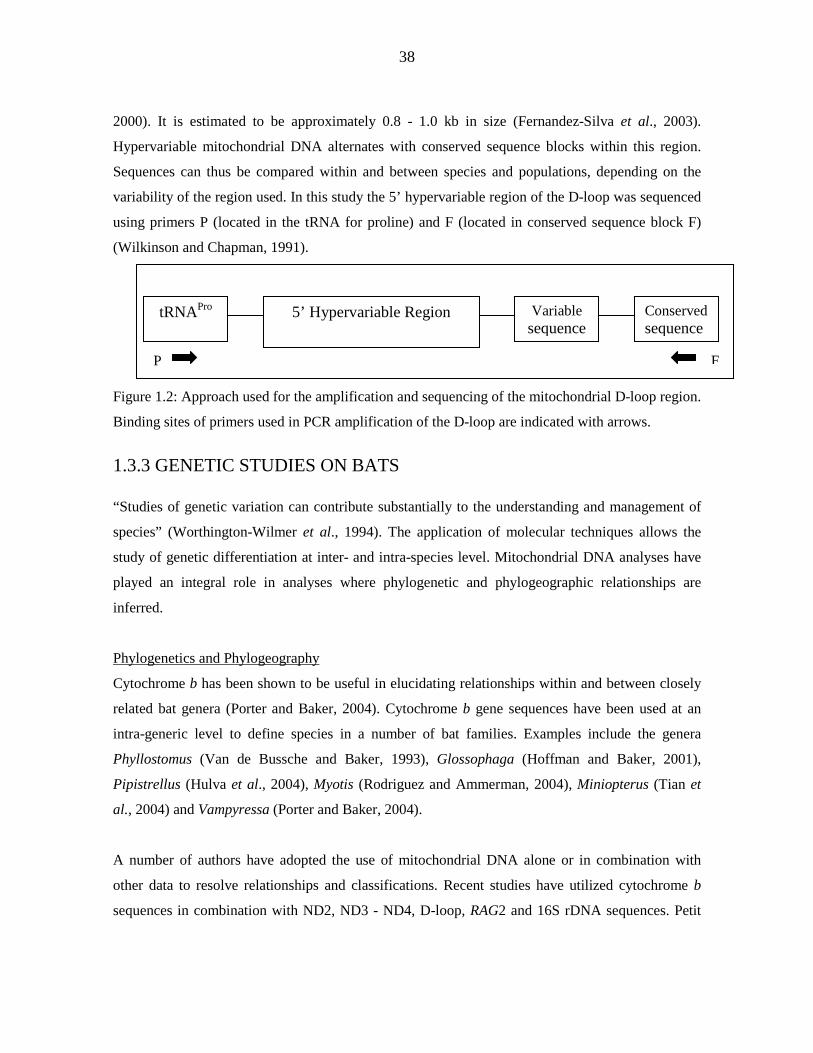
38
2000). It is estimated to be approximately 0.8 - 1.0 kb in size (Fernandez-Silva et al., 2003).
Hypervariable mitochondrial DNA alternates with conserved sequence blocks within this region.
Sequences can thus be compared within and between species and populations, depending on the
variability of the region used. In this study the 5’ hypervariable region of the D-loop was sequenced
using primers P (located in the tRNA for proline) and F (located in conserved sequence block F)
(Wilkinson and Chapman, 1991).
Figure 1.2: Approach used for the amplification and sequencing of the mitochondrial D-loop region.
Binding sites of primers used in PCR amplification of the D-loop are indicated with arrows.
1.3.3 GENETIC STUDIES ON BATS “Studies of genetic variation can contribute substantially to the understanding and management of
species” (Worthington-Wilmer et al., 1994). The application of molecular techniques allows the
study of genetic differentiation at inter- and intra-species level. Mitochondrial DNA analyses have
played an integral role in analyses where phylogenetic and phylogeographic relationships are
inferred.
Phylogenetics and Phylogeography
Cytochrome b has been shown to be useful in elucidating relationships within and between closely
related bat genera (Porter and Baker, 2004). Cytochrome b gene sequences have been used at an
intra-generic level to define species in a number of bat families. Examples include the genera
Phyllostomus (Van de Bussche and Baker, 1993), Glossophaga (Hoffman and Baker, 2001),
Pipistrellus (Hulva et al., 2004), Myotis (Rodriguez and Ammerman, 2004), Miniopterus (Tian et
al., 2004) and Vampyressa (Porter and Baker, 2004).
A number of authors have adopted the use of mitochondrial DNA alone or in combination with
other data to resolve relationships and classifications. Recent studies have utilized cytochrome b
sequences in combination with ND2, ND3 - ND4, D-loop, RAG2 and 16S rDNA sequences. Petit
5’ Hypervariable Region tRNAPro Variable sequence
Conserved sequence
P F
39
and Mayer (2000) used mitochondrial D-loop sequences to differentiate between populations of
Nyctalus noctula (Vespertilionidae); Cooper et al. (2001) analysed the cytochrome b and ND2
regions from populations of Myotis to reveal a single species of Myotis (large-footed) that occurs in
Australia (M. macropus) that is genetically distinct from the Indonesian M. adversus; Kiefer and
Veith (2001) revealed a new species of Plecotus (Vespertilionidae) using the D-loop and 16S
regions; Lim et al. (2003) used the ND3 - ND4 and cytochrome b regions to show that the genus
Ectophylla is closely related to Mesophylla; Hoffmann et al. (2003) compared cytochrome b
sequence variation with chromosomal and geographic variation in Uroderma bilobatum of the
family Phyllostomidae; Stadelmann et al. (2004) used cytochrome b sequences to determine the
phylogenetic relationships of eight Myotis species from Ethiopia relative to other Myotis samples
from across the globe in an attempt to resolve the contentious position of M. vivesi; Davalos (2005)
used cytochrome b and nuclear Rag2 genes to define eight species in the genus Natalus (Natalidae);
Piaggio and Perkins (2005) used cytochrome b and D-loop sequences to reveal the existence of
three distinct species in the genus Corynorhinus and Goodman et al. (2006) used morphological and
cytochrome b sequence data to describe a new species of bat of the genus Emballonura
(Emballonuridae) from Madagascar.
Phylogeography involves characterization of the distribution of phylogenetic lineages across the
geographical landscape. Ditchfield (2000) revealed low cytochrome b divergence (less than 4 %)
between bat species with little phylogeographic structure. Hoffmann and Baker (2003) suggested
that the uplift of the Andes and Panamanian contributed significantly to biodiversity in the
Neotropical genus Carollia (Phyllostomidae). Lloyd (2003) used cytochrome b sequences to
determine the intraspecific phylogeny of Mystacina tuberculata (Mystacinidae), an endemic to New
Zealand. Lineages of this bat are geographically structured, reinforcing the presence of a barrier to
inward gene flow on the South Island. Worthington-Wilmer et al. (1994) showed geographic
structuring of genes in Macroderma gigas, of the family Megadermatidae (Ghost bats), as a result
of long-term isolation of populations and female philopatry.
Cryptic species
Genetic data has become a powerful tool in the detection of cryptic species (Ruedi and McCracken,
2006), which may be morphologically similar but genetically distinct or morphologically distinct
but genetically similar (Pfenninger and Schwenk, 2007). It is therefore wise to use both
morphological and genetic data to identify species. Jacobs et al. (2004) analysed mitochondrial
40
cytochrome b sequences and proposed that two forms of C. pumilus (light- and dark-winged), which
showed a 0.9 % average sequence divergence were a single species. In 2006, Jacobs et al.
conducted a study on the bat species Scotophilus dinganii, which comprises two types that are
similar in size and share a yellow venter but differ in echolocation frequency. The two types were
found to be reciprocally-monophyletic and suggested to be sibling species. These studies indicate
the complexity of identifying species genetically, as a wide range of cytochrome b divergences are
found between morphologically-defined species (Baker and Bradley, 2006).
Barriers to dispersal on islands
Like other mammals, bats exhibit different responses to geographic barriers. Barriers that are
narrow can result in restriction of dispersal, while large bodies of water may not be a barrier to
dispersal (Ruedi and McCracken, 2006). Pestano et al. (2003) used mitochondrial 16S rRNA and
cytochrome b sequences to investigate the genetic differentiation and evolutionary relationships of
P. teneriffae from Tenerife, La Palma and El Hierro islands in the Canarys. Levels of divergence of
the cytochrome b gene between populations on Tenerife and those on El Hierro and La Palma were
1.1 % and 1.5 % respectively. Haplotype analysis indicated that gene flow had occurred from
Tenerife to the other two islands. These authors also reported that Barbastellus barbastellus on the
Canary Islands shows a 4.0 % divergence from populations of the same species found on mainland
Spain.
A study on the bat Myotis myotis by Castella et al. (2000) examined whether the Gibraltar Strait
was a geographical barrier that lead to genetic discontinuities in bat populations on either side. They
found using cytochrome b and nuclear data that the two populations on either side of this strait were
genetically distinct. A similar study by Juste et al. (2004) showed a 20 % sequence divergence
between Plecotus auristus and P. austriacus. The Strait of Gibraltar was proposed as a geographic
barrier which led to the separation of these lineages.
Carstens et al. (2004) used cytochrome b sequence analysis to explore the colonization history of
the phyllostomid bats (Ardops nichollsi, Brachyphylla cavernarum and Artibeus jamaicensis) in the
Lesser Antilles. Ardops nichollsi and B. cavernarum each comprised a single well-supported clade
which exhibited little genetic variation within species across islands, whilst Artibeus jamaicensis
comprised two highly-divergent clades. It was suggested that the two divergent haplotypes of
Artibeus jamaicensis were a result of inter-island migration and vicariance (Carstens et al., 2004).
41
Tadarida brasiliensis (Brazilian free-tailed bat) of the family Molossidae occurs in Central and
South America as well as North America. Russell et al. (2005) analysed D-loop sequences of T.b
mexicana from four groups of migratory and non-migratory bat populations. Sequence divergence
values within and among groups ranged from 0.2 - 7.1 %. Bayesian inference showed no structuring
of mitochondrial lineages according to migratory behaviour. These authors found that high
haplotype diversity in T. b mexicana may be the result of female gene flow, as well as the retention
of ancestral polymorphisms.
Russell et al. (2006), Emerson (2002); Raxworthy et al. (2002) and Evans et al. (2003) highlight the
need to incorporate biogeographical studies with phylogenetic studies. This approach was used to
determine the biogeographical history of Triaenops from Madagascar (Russell et al., 2006).
Bayesian analysis of cytochrome b sequence variation in Triaenops species from Madagascar and
Africa indicates that there were possibly two independent, unidirectional dispersal events from
Africa to Madagascar.
1.4 DATA ANALYSIS
1.4.1 INFERENCE OF PHYLOGENETIC TREES The use of morphological characteristics enabled biologists to examine and estimate relationships
between and among taxa. Molecular data are now also widely used to investigate evolutionary
relationships of organisms (Irwin et al., 1991; Whelan et al., 2001; Vandamme, 2003). The
inference of a phylogeny, based on molecular data, is achieved by the comparison of homologous
residues (Vandamme, 2003).
There are a number of methods and criteria for phylogenetic tree construction (Jin et al., 2007).
Methods using molecular data can use discrete character states (cladistic approach) or a distance
matrix of pairwise similarities (phenetic approach) to infer phylogenetic trees. The phenetic
approach does not consider historical relationships of organisms. It is used to measure the genetic
distances between species and thereby construct a tree by a hierarchical clustering method. Cladistic
methods differ from phenetic methods in that they can provide information on ancestral
relationships.
42
1.4.2 NUCLEOTIDE SUBSTITUTION MODELS Sequences that are derived from a common ancestor eventually diverge from each other due to
accumulation of nucleotide substitutions. As sequence divergence increases, so does the likelihood
of multiple substitutions at a single site. Observed genetic distances may be an underestimate of the
true distance where there have been multiple substitutions at the same site. According to Page and
Holmes (1998), statistical models may be implemented to estimate the corrected distance from the
observed difference. Some of the more commonly-used models are outlined below.
The Jukes-Cantor model was proposed in 1969 [JC69]. It is the simplest model of sequence
evolution and assumes that the four bases have equal frequencies and that the frequency of
transitions is equal to that of transversions (Strimmer and von Haesler, 2003). The disadvantage of
this model is that it is seldom applicable to real sequence data sets.
The Kimura-2-parameter [K2P] model differs from the JC69 model in that it allows for variation in
the rate of transitions and transversions although it still assumes that the four bases occur with equal
frequency. The Felsenstein model [F81] was proposed in 1981. This allows the four base
frequencies to vary and assumes that transitions and transversions occur at equal rates (Page and
Holmes, 1998; Strimmer and von Haesler, 2003).
Hasegawa et al. (1985) proposed the HKY85 model, which is a combination of the K2P and F81
models (Strimmer and von Haesler, 2003). It takes into account both transitional/transversional and
GC content biases.
The most comprehensive model is the General Time Reversible Model [GTR]. It considers two
independent rate parameters i.e. the ratio of transitions and transversions and the ratio of two types
of transitions. Each possible substitution has its own probability (Page and Holmes, 1998).
The models described above are among the most well known and frequently-used in phylogenetic
studies. The gamma distribution (G) of rate variation across sites and the proportion of invariable
sites (I) in a sequence data set may also be taken into account.
43
1.4.3 MODELTEST Modeltest (Posada and Crandall, 1998) is a program that determines the nucleotide substitution
model which best fits a sequence data set. It is used in conjunction with the programme
Phylogenetic Analysis Using Parsimony (PAUP) (Swofford, 2002) and allows for comparisons to
be drawn between 56 models of substitution. Mr Modeltest (Nylander, 2004) is a simplified version
of Modeltest which fits the data to a smaller set (24) of substitution models.
The Akaike Information Criterion (AIC) selects a chosen model that has a good fit. Akaike weights
are used in model averaging and selection as described by Burnham and Anderson (2002).
1.4.4 DISTANCE MATRIX METHODS Genetic distances reflect the dissimilarity between sequences (Strimmer and von Haeseler, 2003).
Distance matrix methods examine the dissimilarity of pairs of Operational Taxonomic Units
(OTUs) and produce a pairwise distance matrix from which a tree may be generated (Vandamme,
2003). The most commonly-used methods to infer distance-based trees are the Unweighted Pair
Group Method with Arithmetic Means (UPGMA) and the Neighbour-Joining (NJ) method, which
will be used in this study.
The Neighbour-Joining method was developed by Saitou and Nei (1987). It constructs a tree by
finding pairs of taxa that are connected by a single interior node (Vandamme, 2003). This algorithm
requires that all internal branches be minimized, a condition which would ultimately lead to the
shortest tree length (Nei and Kumar, 2000; Vandamme, 2003). The advantages of this method are
that it is not computer-intensive and produces a tree quickly. The disadvantage lies in the loss of
information about the ancestral nodes, as distance methods do not consider the character state of
taxa (van de Peer, 2003). The NJ method is most commonly used to infer distance-based trees.
Minimum evolution is also a distance based method that uses the minimum sum of branch lengths
and is based on the assumption that the topology with the least total branch length score best
represents the evolutionary relationship. I did explore minimum evolution however it produced
many trees of equal score.
44
1.4.5 CHARACTER STATE METHODS These are cladistic methods that are based on shared derived characters. Examples of character state
methods include maximum parsimony, maximum likelihood and Bayesian analysis
Parsimony is used extensively in phylogenetic studies. Taxa are grouped if they share a common
characteristic which is different from that of a common ancestor. The Maximum Parsimony method
chooses the tree that requires the fewest evolutionary changes (Page and Holmes, 1998). This
algorithm evaluates each tree possible at every informative site (Nei and Kumar, 2000; Vandamme,
2003; Kolaczlowski and Thornton, 2004). A disadvantage of this method is that it is time-
consuming and does not allow for the use of models to correct for multiple substitutions at the same
site (Page and Holmes, 1998).
Bayesian inference is based on posterior probabilities. Bayesian analysis uses the Markov Chain
Monte Carlo (MCMC) process to sample trees from a distribution of posterior probabilities
(Huelsenbeck et al., 2001). Trees are sampled at fixed intervals and the posterior probability of a
tree is expressed by the proportion of time spent there by the chains. Bayesian Analysis is similar to
Maximum Likelihood in that it requires an approximate model of evolution. A major advantage of
this method is that it is more efficient due to improvements in hardware and speed than the as well
as the lack of calibration in common hiearchial settings in Maximum Likelihood method (Karol et
al., 2001), and, for this reason, is used in this study in preference to Maximum Likelihood (Browne
and Draper, 2006).
1.4.6 ESTIMATING RELIABILITY OF PHYLOGENETIC TREES Bootstrap Analysis
This method was first applied by Felsenstein in 1985. Bootstrapping is described by Efron et al.
(1996) as a computer-based technique that is used to evaluate the measure of confidence of clades
within a phylogenetic tree. It involves resampling from the original data set (Lanyon, 1987). The
resampled data are termed pseudoreplicates and these matrices are identical in size to the original
matrices (Alfaro et al., 2003). Statistics are calculated from each pseudoreplicate. This is a measure
of the sampling error. The process may be repeated 100 to 1000 times, thus resulting in the
generation of bootstrapped trees (Lanyon, 1987; Page and Holmes, 1998). An advantage of using
45
bootstrap analysis is that it is an effective technique and it can be utilized in most tree-construction
methods. A disadvantage of this method is that it is time-consuming. According to Hillis and Bull
(1993), branches/taxa that are supported with a greater than 70 % bootstrap support are reliable
whilst a value less than 70 % should be treated with care.
Posterior Probabilities
Inference of phylogeny using Bayesian analysis is based on posterior probabilities (Huelsenbeck et
al., 2001). The Markov Chain Monte Carlo algorithm is used to estimate the posterior probabilities
of nodes in phylogenetic trees (Erixon et al., 2003). These probabilistic measures of support are
used to determine how likely it is that a certain clade is accurate.
1.4.7 PHYLOGEOGRAPHY The concept of phylogeography was first introduced by Avise et al. in 1987. It provides an insight
into events that may have occurred over a few million years (Hewitt, 2004). Phylogeographic
analysis can identify historically and evolutionary independent geographical regions. Nested Clade
Analysis (NCA) is a statistical method that uses haplotype trees to define a nested series of clades
which allow the evolutionary nested analysis of the geographic distribution of the genetic variation
in a dataset at intra- and inter-species level (Templeton, 1998). Although publications criticizes
the use of this method (Knowles, 2008), the rebuttal by Templeton (2009) discusses the
validation for the use of this method.
The programme TCS (Clement et al., 2000) is used to construct a haplotype network from the
sequence data. A nested cladogram is created from the haplotype network. Geodis (Posada et al.,
2000) is used to carry out permutational contingency analysis to test for statistically significant
associations of haplotypes with geographical location. The results are interpreted according to
Templeton’s key (Templeton et al., 1995). NCA is implemented using the automated method of
Panchal (2007). NCA examines various other issues such as gene flow, bottlenecks and population
expansion.
46
1.4.8 METHODS USED IN THIS STUDY This study contains both phenetic and phylogenetic analyses. Appropriate genetic distance models
were estimated with either Modeltest (Posada and Crandall, 1998) or Mr Modeltest (Nylander,
2004) (for Bayesian analysis). Distance-based trees were constructed using the neighbour-joining
method. The reliability of nodes in both neighbour-joining and maximum parsimony trees was
estimated by bootstrapping. The reliability of nodes in Bayesian trees was indicated as posterior
probabilities. Population demography was estimated using neutrality statistics and mismatch
analysis. Nested Clade analysis of the geographical distribution of genetic haplotypes was carried
out using the automated method of Panchal (2007). MaxEnt Ecological Niche Modelling (Phillips et
al., 2006) was used for predicted distribution.
1.5 AIMS AND OBJECTIVES OF THIS STUDY The aim of this project was to investigate the genetic diversity of Chaerephon leucogaster
populations from Madagascar and the islands of Mayotte and Pemba in the western Indian Ocean. A
further aim was to investigate the relationship of C. leucogaster to C. pumilus from Madagascar and
to draw conclusions on the implications of my study for conservation. The scope of this study is
limited by the non-availability of African samples, so the conspecificity of the small west African
forms is not addressed.
The objectives of this project were:
(i) To assess genetic diversity by sequencing the mitochondrial cytochrome b and D-loop
regions from representative samples.
(ii) To analyse sequence variation using phenetic (Neighbour-Joining) and cladistic
(Bayesian Analysis and Maximum Parsimony) methods.
(iii) To establish the number of haplotypes present in the sample, to characterize them, and
to search for the presence of statistically-significant phylogeographic structure among
haplotypes.
47
(iv) To carry out a study of the population demography of C. leucogaster using diversity
and neutrality statistics and mismatch distribution analysis of D-loop sequence data.
(v) To create a predicted distribution for C. leucogaster in Madagascar using MaxEnt
Ecological Niche Modelling (Phillips et al., 2006).
(vi) To make inferences about the number of species, Evolutionary Significant Units
(ESUs) and/or Management Units (MUs) present in the sample.
(vii) To make recommendations about the conservation and management of genetic diversity
of Chaerephon leucogaster in Madagascar and the neighbouring islands of Mayotte and
Pemba.
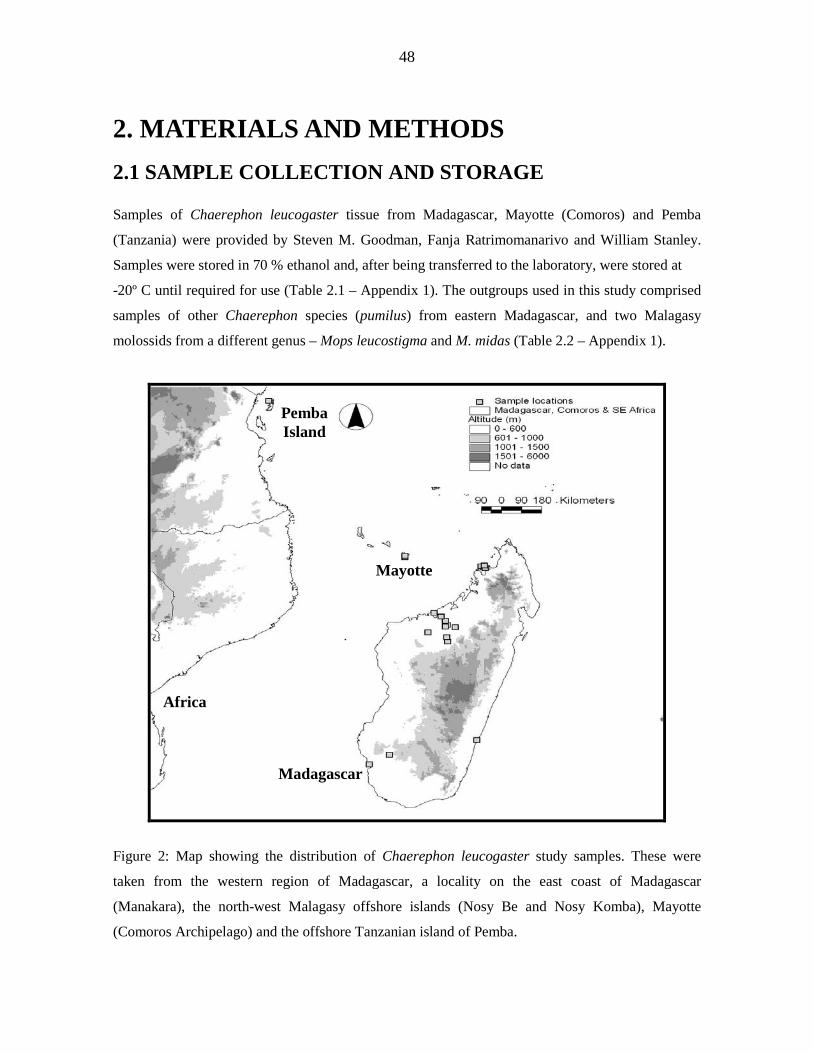
48
2. MATERIALS AND METHODS
2.1 SAMPLE COLLECTION AND STORAGE Samples of Chaerephon leucogaster tissue from Madagascar, Mayotte (Comoros) and Pemba
(Tanzania) were provided by Steven M. Goodman, Fanja Ratrimomanarivo and William Stanley.
Samples were stored in 70 % ethanol and, after being transferred to the laboratory, were stored at
-20º C until required for use (Table 2.1 – Appendix 1). The outgroups used in this study comprised
samples of other Chaerephon species (pumilus) from eastern Madagascar, and two Malagasy
molossids from a different genus – Mops leucostigma and M. midas (Table 2.2 – Appendix 1).
Figure 2: Map showing the distribution of Chaerephon leucogaster study samples. These were
taken from the western region of Madagascar, a locality on the east coast of Madagascar
(Manakara), the north-west Malagasy offshore islands (Nosy Be and Nosy Komba), Mayotte
(Comoros Archipelago) and the offshore Tanzanian island of Pemba.
Africa
Pemba Island
Madagascar
Mayotte
49
2.2 DNA ISOLATION DNA was extracted using the Qiagen® DNeasy Extraction Kit (250) according to the manufacturer’s
instructions. Sample stocks in buffer AE (Qiagen) were stored at -20º C. Working stocks were
stored at 4º C.
2.3 DNA CONCENTRATION AND MOLECULAR WEIGHT
ASSESSMENT
2.3.1 FLUOROMETRY The isolated DNA was quantified using a Hoefer TM DyNA Quant® 200 Fluorometer. The blank
solution consisted of 9 ml of water mixed with 1 ml 10X TNE and 1 µL H33258 dye stock. 2 ml of
the blank solution was added to a cuvette and the fluorometer was zeroed. Two microlitres (2 µl) of
the DNA standard (calf thymus – 1 mg ml-1) was then added to 2 ml of blank solution and the
fluorometer was calibrated to 100 ng µl-1. The machine was zeroed, after which 2 µl DNA solution
was added and the concentration measured.
2.3.2 SPECTROPHOTOMETRY Spectrophotometry was also used to quantify DNA samples. One microlitre (1 µl) of double-
deionised water was used to zero the Nanodrop spectrophotometer. One microlitre (1 µl) of blank
solution (AE buffer from Qiagen) was then added to calibrate the instrument, after which 1 µl DNA
solution was added and the concentration measured.
2.3.3 AGAROSE GEL ELECTROPHORESIS Agarose gel electrophoresis was conducted to ensure that the isolated DNA was not degraded. A
1 % (w/v) gel of agarose in 0.5X TBE buffer was cast. One hundred microlitres (100 µl) ethidium
bromide (0.05 mg ml-1) was added to the gel to allow visualization of the DNA bands. Five
micolitres (5 µl) of each DNA sample was mixed with 3 µL loading dye prior to loading into the
well. Five microlitres (5 µl) molecular weight marker III (Roche, Germany) or O’Gene Ladder
(100 bp) (Fermentas) were co-electrophoresed on each gel as a molecular weight marker.
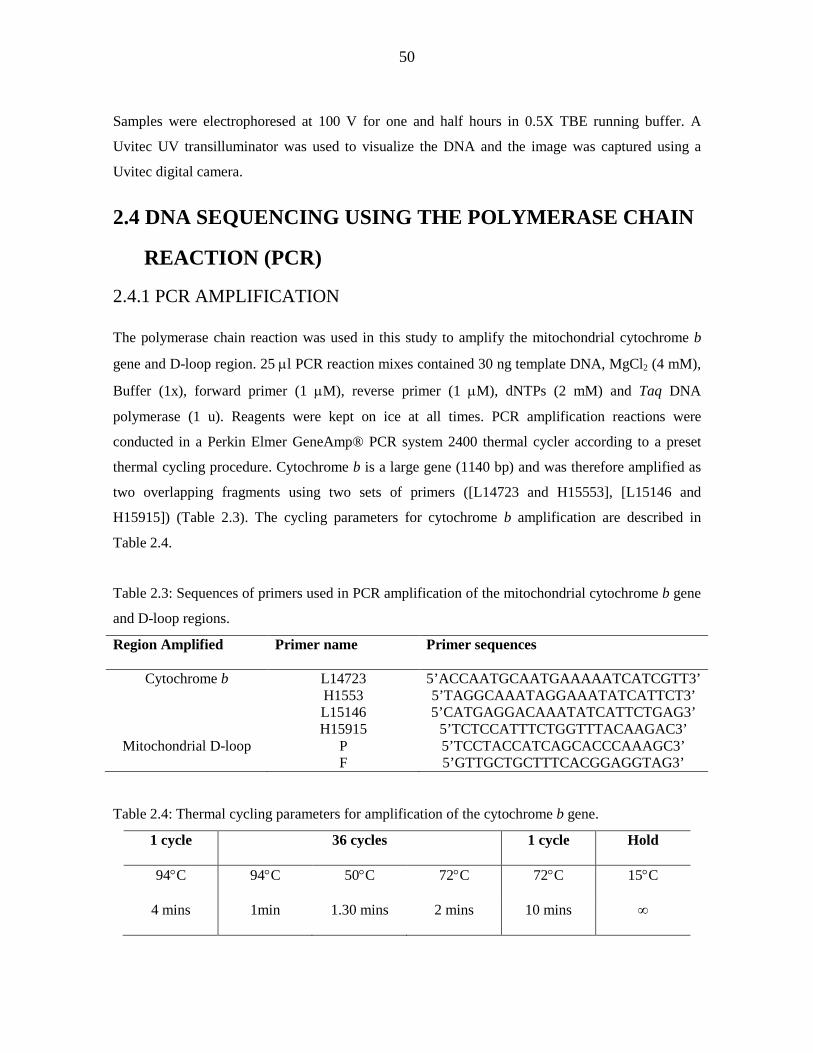
50
Samples were electrophoresed at 100 V for one and half hours in 0.5X TBE running buffer. A
Uvitec UV transilluminator was used to visualize the DNA and the image was captured using a
Uvitec digital camera.
2.4 DNA SEQUENCING USING THE POLYMERASE CHAIN
REACTION (PCR)
2.4.1 PCR AMPLIFICATION The polymerase chain reaction was used in this study to amplify the mitochondrial cytochrome b
gene and D-loop region. 25 µl PCR reaction mixes contained 30 ng template DNA, MgCl2 (4 mM),
Buffer (1x), forward primer (1 µM), reverse primer (1 µM), dNTPs (2 mM) and Taq DNA
polymerase (1 u). Reagents were kept on ice at all times. PCR amplification reactions were
conducted in a Perkin Elmer GeneAmp® PCR system 2400 thermal cycler according to a preset
thermal cycling procedure. Cytochrome b is a large gene (1140 bp) and was therefore amplified as
two overlapping fragments using two sets of primers ([L14723 and H15553], [L15146 and
H15915]) (Table 2.3). The cycling parameters for cytochrome b amplification are described in
Table 2.4.
Table 2.3: Sequences of primers used in PCR amplification of the mitochondrial cytochrome b gene
and D-loop regions.
Region Amplified Primer name Primer sequences
Cytochrome b L14723 H1553
5’ACCAATGCAATGAAAAATCATCGTT3’ 5’TAGGCAAATAGGAAATATCATTCT3’
L15146 H15915
5’CATGAGGACAAATATCATTCTGAG3’ 5’TCTCCATTTCTGGTTTACAAGAC3’
Mitochondrial D-loop P F
5’TCCTACCATCAGCACCCAAAGC3’ 5’GTTGCTGCTTTCACGGAGGTAG3’
Table 2.4: Thermal cycling parameters for amplification of the cytochrome b gene.
1 cycle 36 cycles 1 cycle Hold
94°C 94°C 50°C 72°C 72°C 15°C
4 mins 1min 1.30 mins 2 mins 10 mins ∞
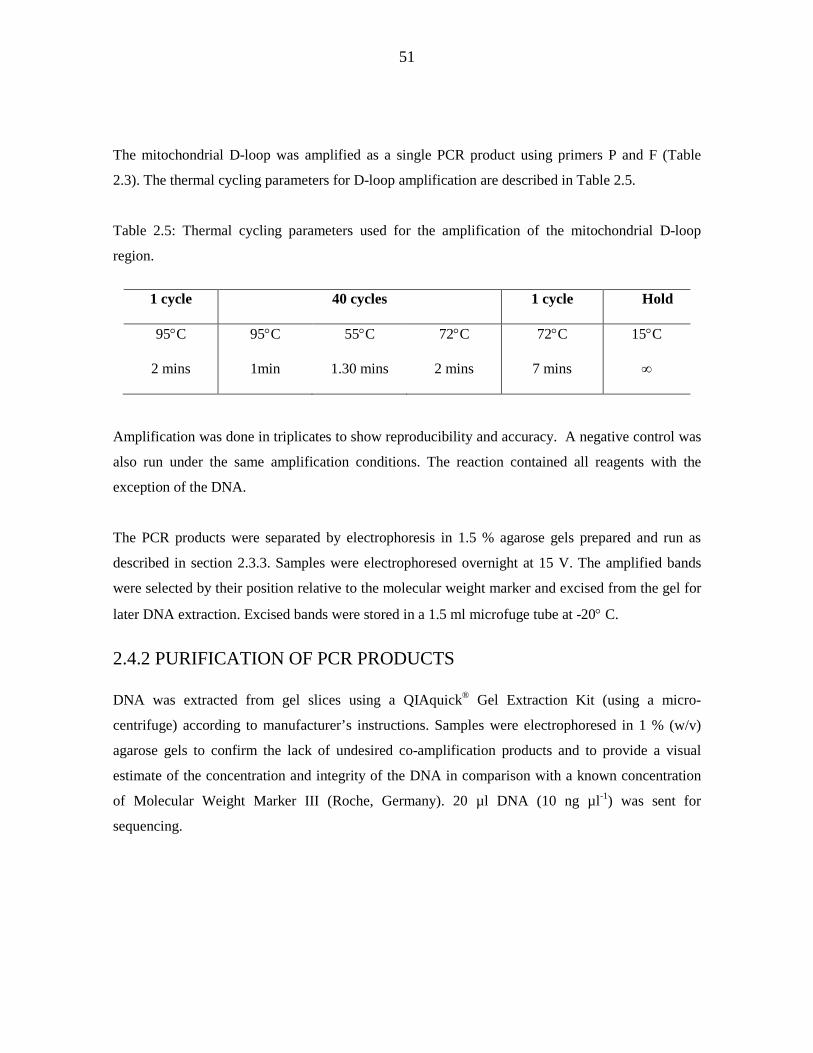
51
The mitochondrial D-loop was amplified as a single PCR product using primers P and F (Table
2.3). The thermal cycling parameters for D-loop amplification are described in Table 2.5.
Table 2.5: Thermal cycling parameters used for the amplification of the mitochondrial D-loop
region.
1 cycle 40 cycles 1 cycle Hold
95°C 95°C 55°C 72°C 72°C 15°C
2 mins 1min 1.30 mins 2 mins 7 mins ∞
Amplification was done in triplicates to show reproducibility and accuracy. A negative control was
also run under the same amplification conditions. The reaction contained all reagents with the
exception of the DNA.
The PCR products were separated by electrophoresis in 1.5 % agarose gels prepared and run as
described in section 2.3.3. Samples were electrophoresed overnight at 15 V. The amplified bands
were selected by their position relative to the molecular weight marker and excised from the gel for
later DNA extraction. Excised bands were stored in a 1.5 ml microfuge tube at -20° C.
2.4.2 PURIFICATION OF PCR PRODUCTS DNA was extracted from gel slices using a QIAquick® Gel Extraction Kit (using a micro-
centrifuge) according to manufacturer’s instructions. Samples were electrophoresed in 1 % (w/v)
agarose gels to confirm the lack of undesired co-amplification products and to provide a visual
estimate of the concentration and integrity of the DNA in comparison with a known concentration
of Molecular Weight Marker III (Roche, Germany). 20 µl DNA (10 ng µl-1) was sent for
sequencing.
52
2.4.3 DNA SEQUENCING Sequencing of PCR products were conducted at Inqaba Biotechnical Industries Pty. Ltd. Samples
were sequenced in the forward and reverse directions using the primers used in the initial
amplifications. Electropherograms of the sequences generated were inspected with Chromas
software (version 1.45; Technelysium Pty. Ltd., Helensvale, Queensland, Australia).
2.4.4 DATA ANALYSES 2.4.4.1 Construction of consensus sequences Consensus sequences were constructed by comparing forward and reverse sequences using the
Bioedit Sequence Alignment Editor, version 5.0.9 for windows 95/98 NT (Hall, 1999). The Clustal
W function of Bioedit (version 5.0.9) (Hall, 1999) was used to perform a multiple alignment which
was then further edited by visual inspection. Sequences were trimmed to a uniform length. Aligned
and trimmed files were imported into Clustal X, version 1.81 (Thompson et al., 1997), and re-saved
as nexus (.nxs) files.
2.4.4.2 Data Saturation The programme DAMBE (Xia and Xie, 2001) was used to check for saturation of the data by
plotting transitions and transversions versus genetic distance. Xia’s test of substitution saturation
(Xia et al., 2003) was conducted to provide insight into the level of saturation of the data.
2.4.4.3 Molecular Model Modeltest (Posada and Crandall, 1998) using the AIC criterion was applied to determine the model
of substitution which best fits the sequence data. The model selected for cytochrome b was the
HKY+I+G model and the model selected for the D-loop dataset was the GTR model.
The models were selected using AIC. This approach has several advantages as highlighted by
Posada and Buckley (2004) they are able to simultaneously comparemultiple nested or nonnested
models account for model selection uncertainty, and allow for model-averaged inference.
53
2.4.4.4 Bayesian analysis Bayesian analysis (Mr Bayes, version 3.0B4, Ronquist and Huelsenbeck, 2001) utilized four
Markov chains, which were run for five million generations each, with sampling every 1000
generations, resulting in a sample of 50 000 trees and using default priors. We assessed convergence
by measuring the standard deviation of the split frequency among parallel chains. Chains were
considered to have converged once the average split frequency was lower than 0.01. We
summarized results by discarding the first 5000 trees and doing a majority-rule consensus from the
remaining 45 000 trees. The burn-in value was estimated by plotting likelihood values against
number of generations to determine where the likelihood plateaued.
Parallel analyses were conducted however we did not present the results as they were congruent.
2.4.4.5 Parsimony and Genetic Distance Analyses PAUP4.0b10 for Macintosh (Swofford, 2002) was used to create neighbour joining and maximum
parsimony trees. For parsimony analysis, the random additions sequence option (n = 100) for
discrete, unordered characters was used. The heuristic search option was used to search for the
shortest tree using the tree bisection-reconnection (TBR) branch swapping option. Bootstrap
support was calculated by using bootstrap re-sampling analysis (1000 iterations) (Felsenstein, 1985;
Felsenstein and Kishino, 1993; Hillis and Bull, 1993).
2.4.4.6 Analysis of Molecular Variance Arlequin 3.01 (Excoffier et al., 2005) was used to test for significant molecular variance between
the groups defined by phylogeographic analysis. Individuals were separated into three groups i.e.
the 13º S latitude band, the 15-17º S latitude band and the 22-23º S latitude band. Fixation indices
were calculated and their significance tested using a non-parametric permutation approach
described in Excoffier et al. (1992), consisting of permuting haplotypes, individuals or populations
among individuals, populations or groups of populations. After each permutation round, all statistics
were recomputed to obtain their null distributions.
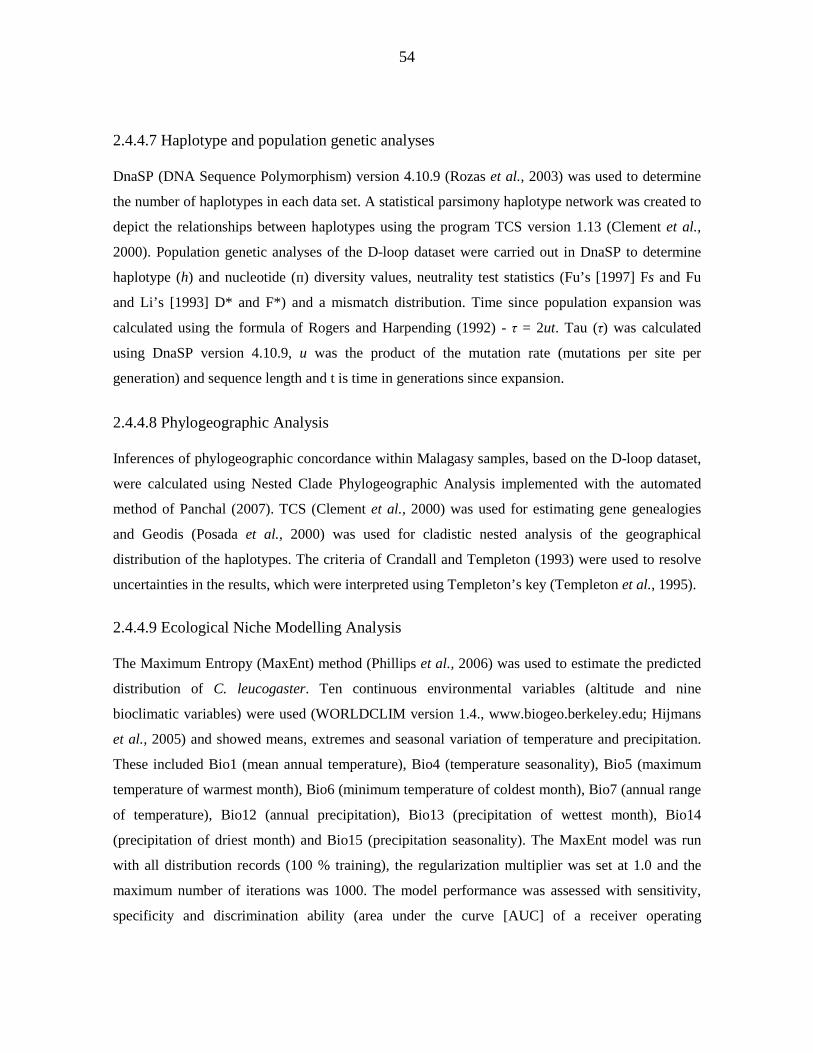
54
2.4.4.7 Haplotype and population genetic analyses DnaSP (DNA Sequence Polymorphism) version 4.10.9 (Rozas et al., 2003) was used to determine
the number of haplotypes in each data set. A statistical parsimony haplotype network was created to
depict the relationships between haplotypes using the program TCS version 1.13 (Clement et al.,
2000). Population genetic analyses of the D-loop dataset were carried out in DnaSP to determine
haplotype (h) and nucleotide (п) diversity values, neutrality test statistics (Fu’s [1997] Fs and Fu
and Li’s [1993] D* and F*) and a mismatch distribution. Time since population expansion was
calculated using the formula of Rogers and Harpending (1992) - τ = 2ut. Tau (τ) was calculated
using DnaSP version 4.10.9, u was the product of the mutation rate (mutations per site per
generation) and sequence length and t is time in generations since expansion.
2.4.4.8 Phylogeographic Analysis Inferences of phylogeographic concordance within Malagasy samples, based on the D-loop dataset,
were calculated using Nested Clade Phylogeographic Analysis implemented with the automated
method of Panchal (2007). TCS (Clement et al., 2000) was used for estimating gene genealogies
and Geodis (Posada et al., 2000) was used for cladistic nested analysis of the geographical
distribution of the haplotypes. The criteria of Crandall and Templeton (1993) were used to resolve
uncertainties in the results, which were interpreted using Templeton’s key (Templeton et al., 1995).
2.4.4.9 Ecological Niche Modelling Analysis The Maximum Entropy (MaxEnt) method (Phillips et al., 2006) was used to estimate the predicted
distribution of C. leucogaster. Ten continuous environmental variables (altitude and nine
bioclimatic variables) were used (WORLDCLIM version 1.4., www.biogeo.berkeley.edu; Hijmans
et al., 2005) and showed means, extremes and seasonal variation of temperature and precipitation.
These included Bio1 (mean annual temperature), Bio4 (temperature seasonality), Bio5 (maximum
temperature of warmest month), Bio6 (minimum temperature of coldest month), Bio7 (annual range
of temperature), Bio12 (annual precipitation), Bio13 (precipitation of wettest month), Bio14
(precipitation of driest month) and Bio15 (precipitation seasonality). The MaxEnt model was run
with all distribution records (100 % training), the regularization multiplier was set at 1.0 and the
maximum number of iterations was 1000. The model performance was assessed with sensitivity,
specificity and discrimination ability (area under the curve [AUC] of a receiver operating

55
characteristic [ROC] plot of sensitivity versus 1-specificity). The continuous model output was
transformed to a map representing probabilities. The jack-knife procedure that is implemented in
MaxEnt was used to evaluate the contribution of each explanatory variable.
3. RESULTS 3.1 DNA PURITY, CONCENTRATION AND MOLECULAR WEIGHT High molecular weight DNA was required as the substrate for PCR amplification. Agarose gel
electrophoresis indicated the presence of high molecular weight bands (Fig 3.1). 200 µl DNA was
extracted for each sample, and ranged in concentration from 30 to 90 ng µl-1. There were no
extensive smears produced, indicating that there was little degradation.
M3 1 2 3 4 5 6 7 8 9 10
Figure 3.1: Electropherogram of DNA isolated from Chaerephon leucogaster and separated by
electrophoresis in a 1 % agarose gel stained with ethidium bromide. Lane M3 contains molecular
marker III (Roche). Lanes 1-5 show DNA isolated from Mahajanga samples and Lanes 6-10 show
DNA isolated from Andranofasika samples. High molecular weight DNA is marked with an arrow.
3.2 PCR AMPLIFICATION PCR amplification of the cytochrome b gene using the primer combinations L23 with H53 and L46
with H15 was successful (Figure 3.2). The PCR product produced bright bands representing the
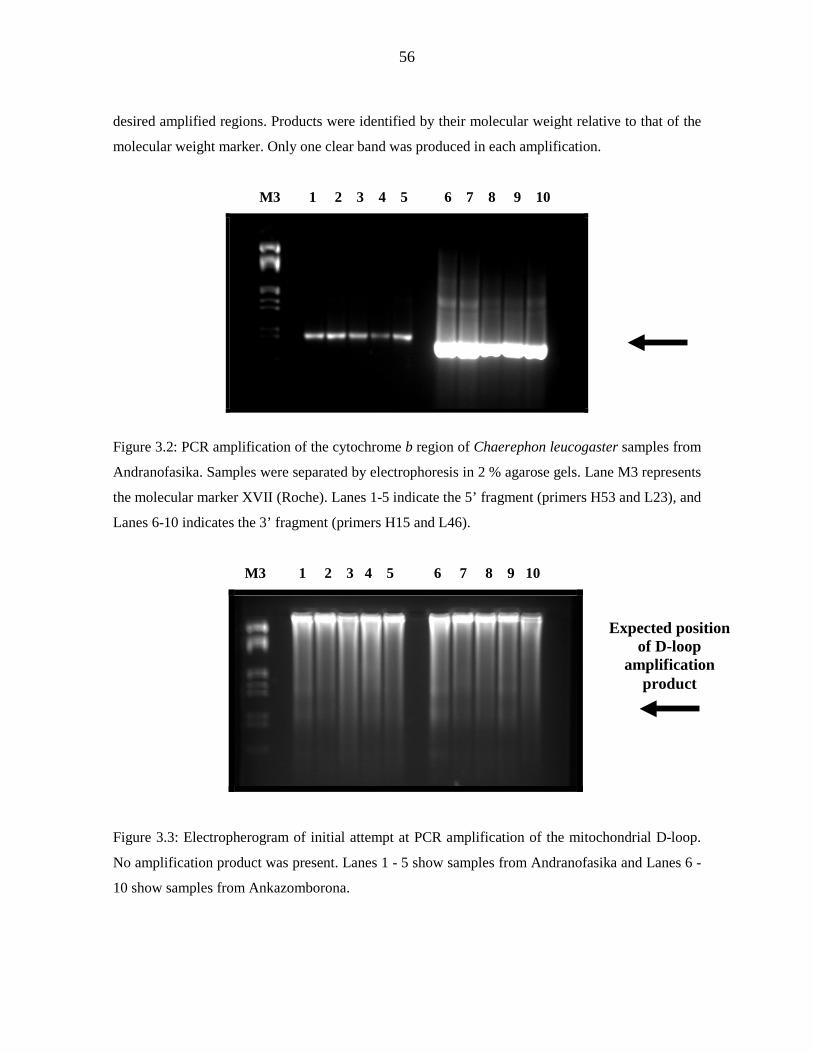
56
desired amplified regions. Products were identified by their molecular weight relative to that of the
molecular weight marker. Only one clear band was produced in each amplification.
M3 1 2 3 4 5 6 7 8 9 10
Figure 3.2: PCR amplification of the cytochrome b region of Chaerephon leucogaster samples from
Andranofasika. Samples were separated by electrophoresis in 2 % agarose gels. Lane M3 represents
the molecular marker XVII (Roche). Lanes 1-5 indicate the 5’ fragment (primers H53 and L23), and
Lanes 6-10 indicates the 3’ fragment (primers H15 and L46).
M3 1 2 3 4 5 6 7 8 9 10
Figure 3.3: Electropherogram of initial attempt at PCR amplification of the mitochondrial D-loop.
No amplification product was present. Lanes 1 - 5 show samples from Andranofasika and Lanes 6 -
10 show samples from Ankazomborona.
Expected position of D-loop
amplification product
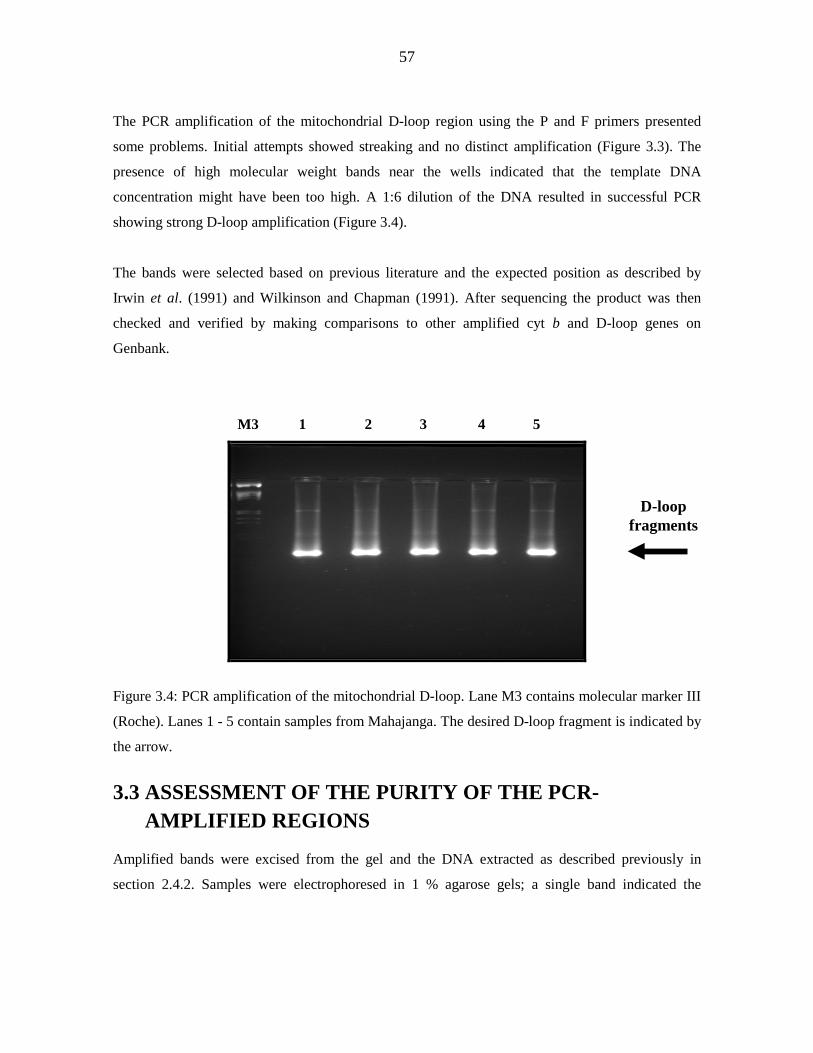
57
The PCR amplification of the mitochondrial D-loop region using the P and F primers presented
some problems. Initial attempts showed streaking and no distinct amplification (Figure 3.3). The
presence of high molecular weight bands near the wells indicated that the template DNA
concentration might have been too high. A 1:6 dilution of the DNA resulted in successful PCR
showing strong D-loop amplification (Figure 3.4).
The bands were selected based on previous literature and the expected position as described by
Irwin et al. (1991) and Wilkinson and Chapman (1991). After sequencing the product was then
checked and verified by making comparisons to other amplified cyt b and D-loop genes on
Genbank.
M3 1 2 3 4 5
Figure 3.4: PCR amplification of the mitochondrial D-loop. Lane M3 contains molecular marker III
(Roche). Lanes 1 - 5 contain samples from Mahajanga. The desired D-loop fragment is indicated by
the arrow.
3.3 ASSESSMENT OF THE PURITY OF THE PCR- AMPLIFIED REGIONS Amplified bands were excised from the gel and the DNA extracted as described previously in
section 2.4.2. Samples were electrophoresed in 1 % agarose gels; a single band indicated the
D-loop fragments
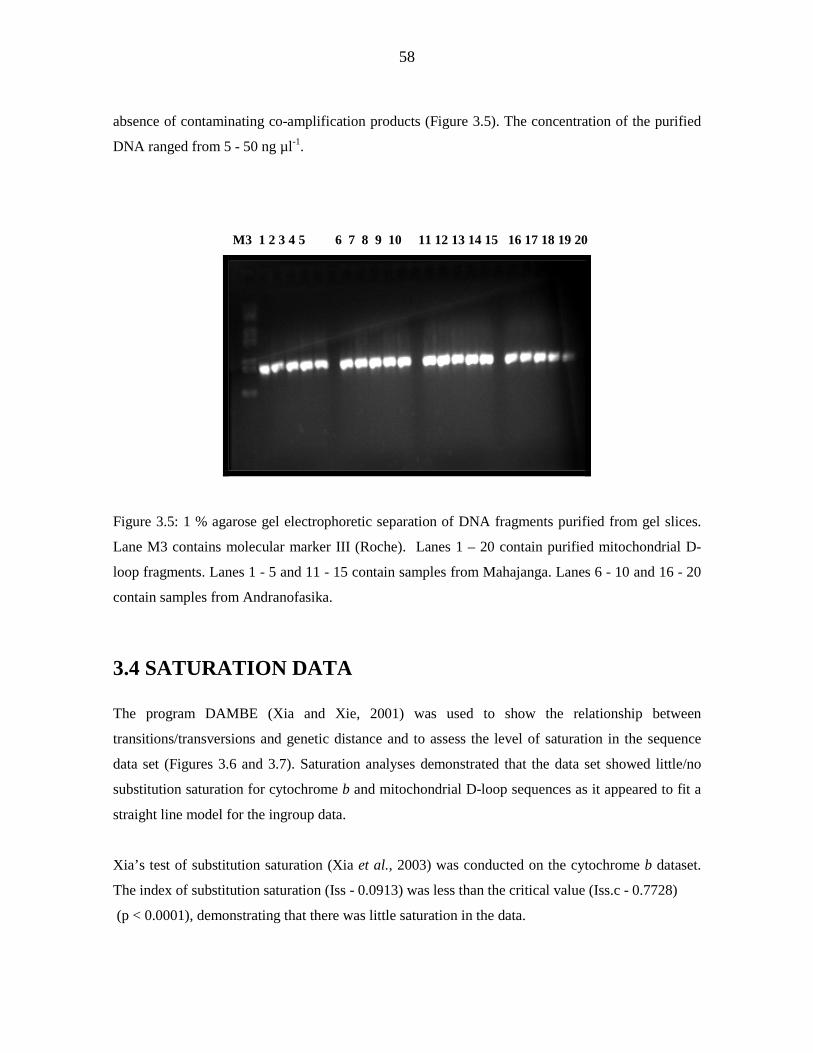
58
absence of contaminating co-amplification products (Figure 3.5). The concentration of the purified
DNA ranged from 5 - 50 ng µl-1.
M3 1 2 3 4 5 6 7 8 9 10 11 12 13 14 15 16 17 18 19 20
Figure 3.5: 1 % agarose gel electrophoretic separation of DNA fragments purified from gel slices.
Lane M3 contains molecular marker III (Roche). Lanes 1 – 20 contain purified mitochondrial D-
loop fragments. Lanes 1 - 5 and 11 - 15 contain samples from Mahajanga. Lanes 6 - 10 and 16 - 20
contain samples from Andranofasika.
3.4 SATURATION DATA The program DAMBE (Xia and Xie, 2001) was used to show the relationship between
transitions/transversions and genetic distance and to assess the level of saturation in the sequence
data set (Figures 3.6 and 3.7). Saturation analyses demonstrated that the data set showed little/no
substitution saturation for cytochrome b and mitochondrial D-loop sequences as it appeared to fit a
straight line model for the ingroup data.
Xia’s test of substitution saturation (Xia et al., 2003) was conducted on the cytochrome b dataset.
The index of substitution saturation (Iss - 0.0913) was less than the critical value (Iss.c - 0.7728)
(p < 0.0001), demonstrating that there was little saturation in the data.
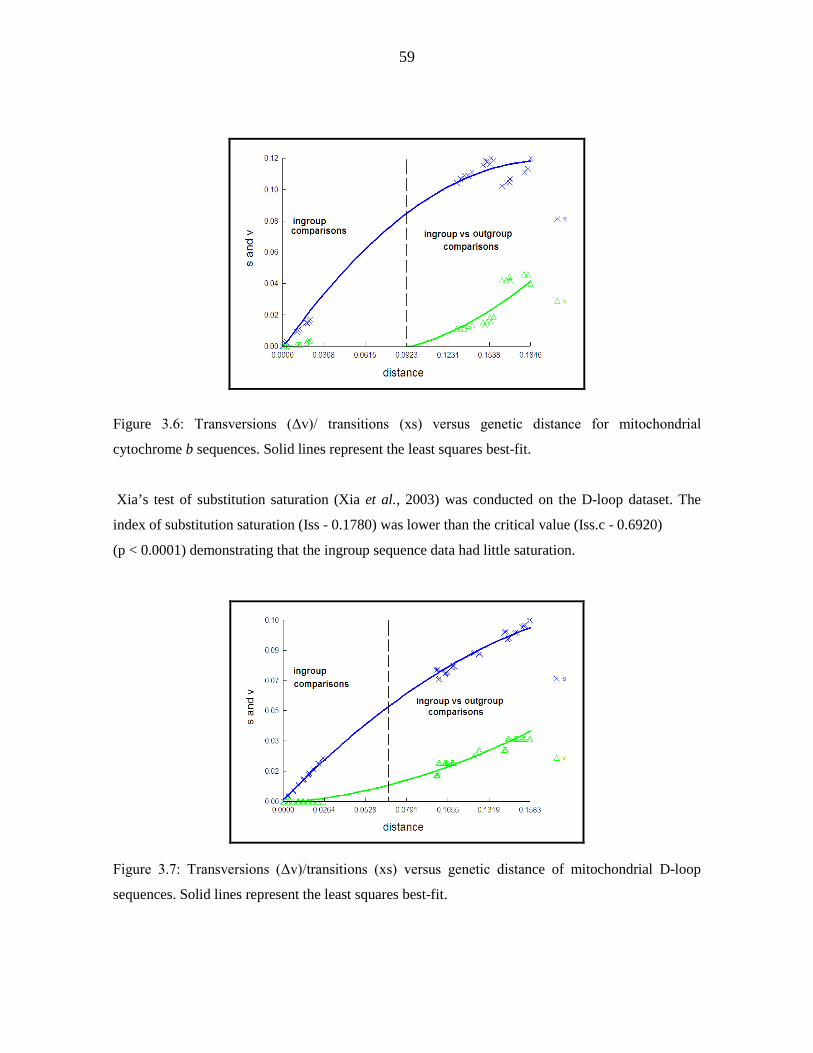
59
Figure 3.6: Transversions (Δv)/ transitions (xs) versus genetic distance for mitochondrial
cytochrome b sequences. Solid lines represent the least squares best-fit.
Xia’s test of substitution saturation (Xia et al., 2003) was conducted on the D-loop dataset. The
index of substitution saturation (Iss - 0.1780) was lower than the critical value (Iss.c - 0.6920)
(p < 0.0001) demonstrating that the ingroup sequence data had little saturation.
Figure 3.7: Transversions (Δv)/transitions (xs) versus genetic distance of mitochondrial D-loop
sequences. Solid lines represent the least squares best-fit.
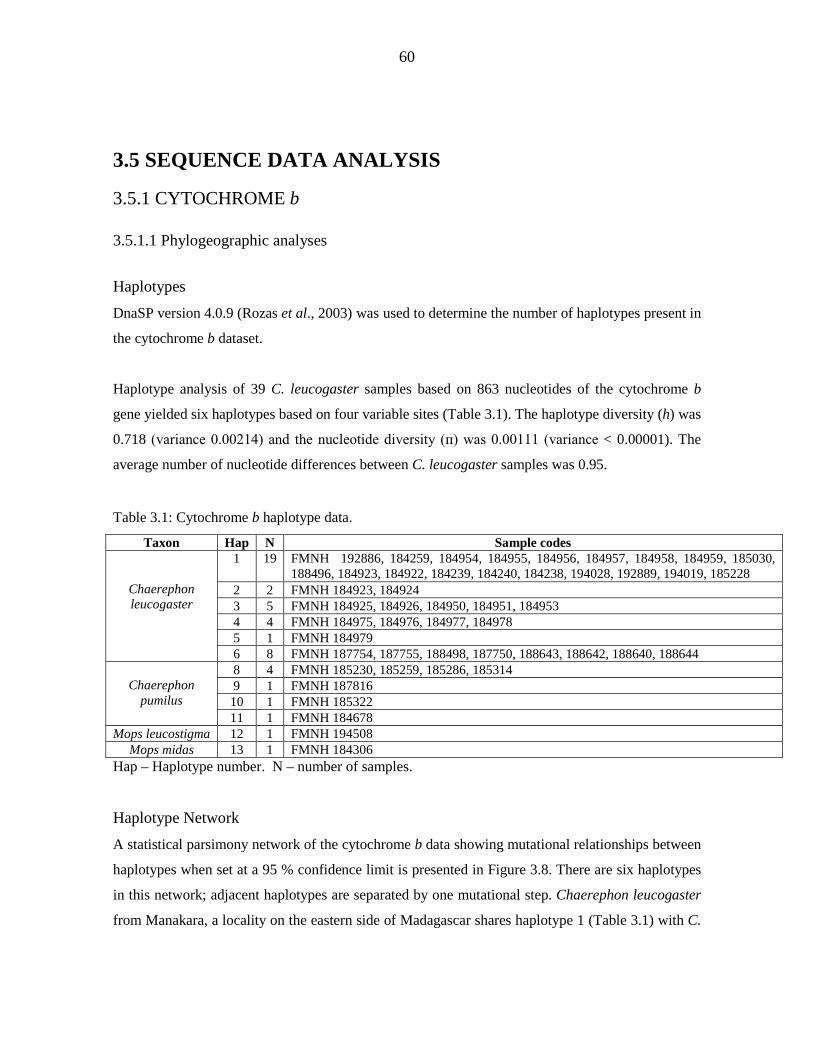
60
3.5 SEQUENCE DATA ANALYSIS
3.5.1 CYTOCHROME b 3.5.1.1 Phylogeographic analyses
Haplotypes DnaSP version 4.0.9 (Rozas et al., 2003) was used to determine the number of haplotypes present in
the cytochrome b dataset.
Haplotype analysis of 39 C. leucogaster samples based on 863 nucleotides of the cytochrome b
gene yielded six haplotypes based on four variable sites (Table 3.1). The haplotype diversity (h) was
0.718 (variance 0.00214) and the nucleotide diversity (п) was 0.00111 (variance < 0.00001). The
average number of nucleotide differences between C. leucogaster samples was 0.95.
Table 3.1: Cytochrome b haplotype data.
Taxon Hap N Sample codes
Chaerephon leucogaster
1 19 FMNH 192886, 184259, 184954, 184955, 184956, 184957, 184958, 184959, 185030, 188496, 184923, 184922, 184239, 184240, 184238, 194028, 192889, 194019, 185228
2 2 FMNH 184923, 184924 3 5 FMNH 184925, 184926, 184950, 184951, 184953 4 4 FMNH 184975, 184976, 184977, 184978 5 1 FMNH 184979 6 8 FMNH 187754, 187755, 188498, 187750, 188643, 188642, 188640, 188644
Chaerephon
pumilus
8 4 FMNH 185230, 185259, 185286, 185314 9 1 FMNH 187816 10 1 FMNH 185322 11 1 FMNH 184678
Mops leucostigma 12 1 FMNH 194508 Mops midas 13 1 FMNH 184306
Hap – Haplotype number. N – number of samples.
Haplotype Network A statistical parsimony network of the cytochrome b data showing mutational relationships between
haplotypes when set at a 95 % confidence limit is presented in Figure 3.8. There are six haplotypes
in this network; adjacent haplotypes are separated by one mutational step. Chaerephon leucogaster
from Manakara, a locality on the eastern side of Madagascar shares haplotype 1 (Table 3.1) with C.
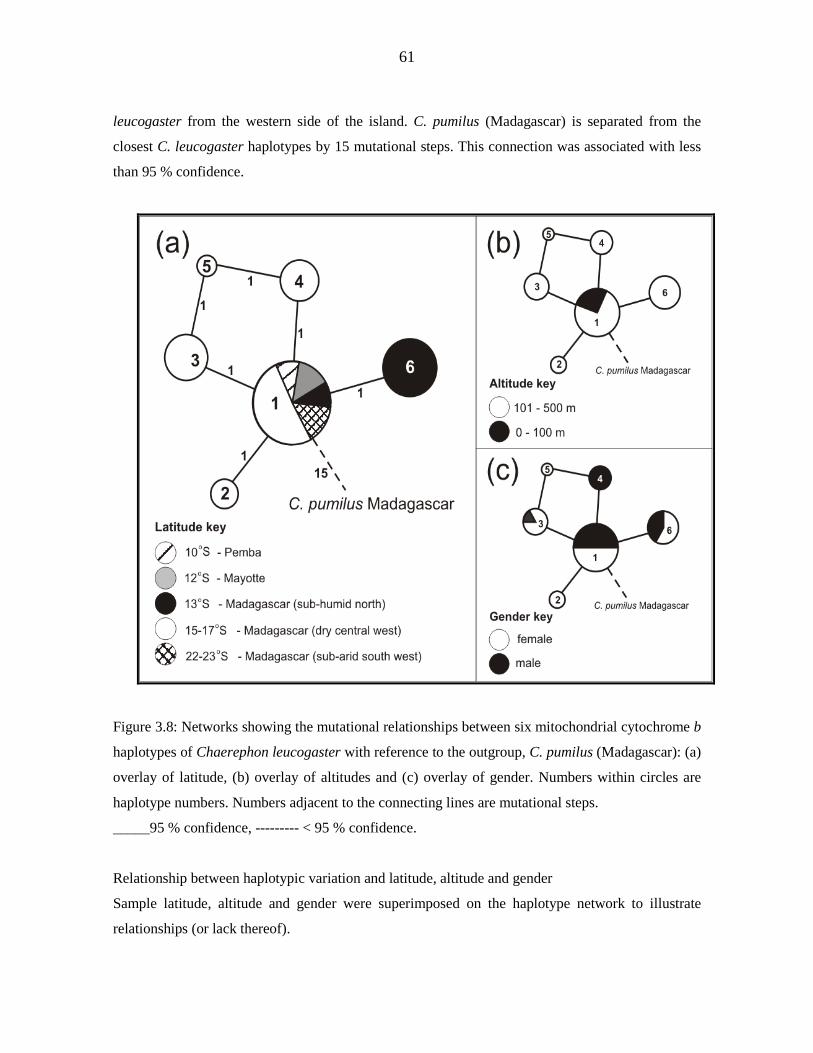
61
leucogaster from the western side of the island. C. pumilus (Madagascar) is separated from the
closest C. leucogaster haplotypes by 15 mutational steps. This connection was associated with less
than 95 % confidence.
Figure 3.8: Networks showing the mutational relationships between six mitochondrial cytochrome b
haplotypes of Chaerephon leucogaster with reference to the outgroup, C. pumilus (Madagascar): (a)
overlay of latitude, (b) overlay of altitudes and (c) overlay of gender. Numbers within circles are
haplotype numbers. Numbers adjacent to the connecting lines are mutational steps.
_____95 % confidence, --------- < 95 % confidence.
Relationship between haplotypic variation and latitude, altitude and gender
Sample latitude, altitude and gender were superimposed on the haplotype network to illustrate
relationships (or lack thereof).
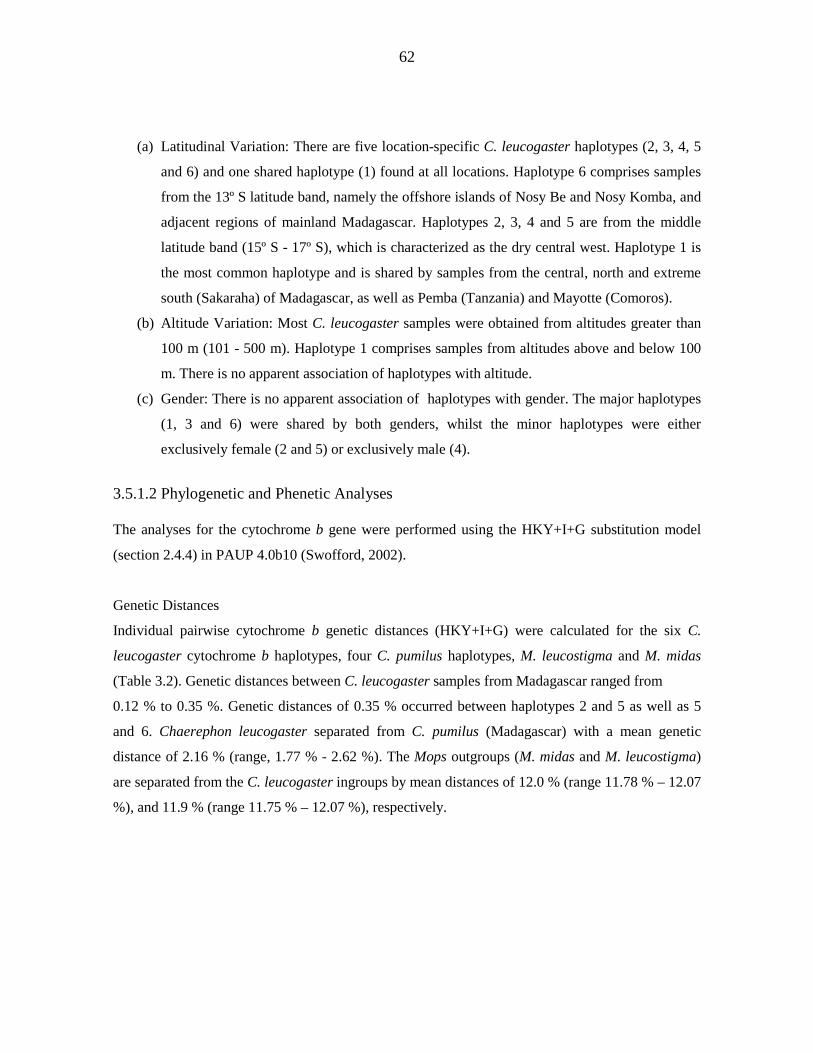
62
(a) Latitudinal Variation: There are five location-specific C. leucogaster haplotypes (2, 3, 4, 5
and 6) and one shared haplotype (1) found at all locations. Haplotype 6 comprises samples
from the 13º S latitude band, namely the offshore islands of Nosy Be and Nosy Komba, and
adjacent regions of mainland Madagascar. Haplotypes 2, 3, 4 and 5 are from the middle
latitude band (15º S - 17º S), which is characterized as the dry central west. Haplotype 1 is
the most common haplotype and is shared by samples from the central, north and extreme
south (Sakaraha) of Madagascar, as well as Pemba (Tanzania) and Mayotte (Comoros).
(b) Altitude Variation: Most C. leucogaster samples were obtained from altitudes greater than
100 m (101 - 500 m). Haplotype 1 comprises samples from altitudes above and below 100
m. There is no apparent association of haplotypes with altitude.
(c) Gender: There is no apparent association of haplotypes with gender. The major haplotypes
(1, 3 and 6) were shared by both genders, whilst the minor haplotypes were either
exclusively female (2 and 5) or exclusively male (4).
3.5.1.2 Phylogenetic and Phenetic Analyses The analyses for the cytochrome b gene were performed using the HKY+I+G substitution model
(section 2.4.4) in PAUP 4.0b10 (Swofford, 2002).
Genetic Distances
Individual pairwise cytochrome b genetic distances (HKY+I+G) were calculated for the six C.
leucogaster cytochrome b haplotypes, four C. pumilus haplotypes, M. leucostigma and M. midas
(Table 3.2). Genetic distances between C. leucogaster samples from Madagascar ranged from
0.12 % to 0.35 %. Genetic distances of 0.35 % occurred between haplotypes 2 and 5 as well as 5
and 6. Chaerephon leucogaster separated from C. pumilus (Madagascar) with a mean genetic
distance of 2.16 % (range, 1.77 % - 2.62 %). The Mops outgroups (M. midas and M. leucostigma)
are separated from the C. leucogaster ingroups by mean distances of 12.0 % (range 11.78 % – 12.07
%), and 11.9 % (range 11.75 % – 12.07 %), respectively.
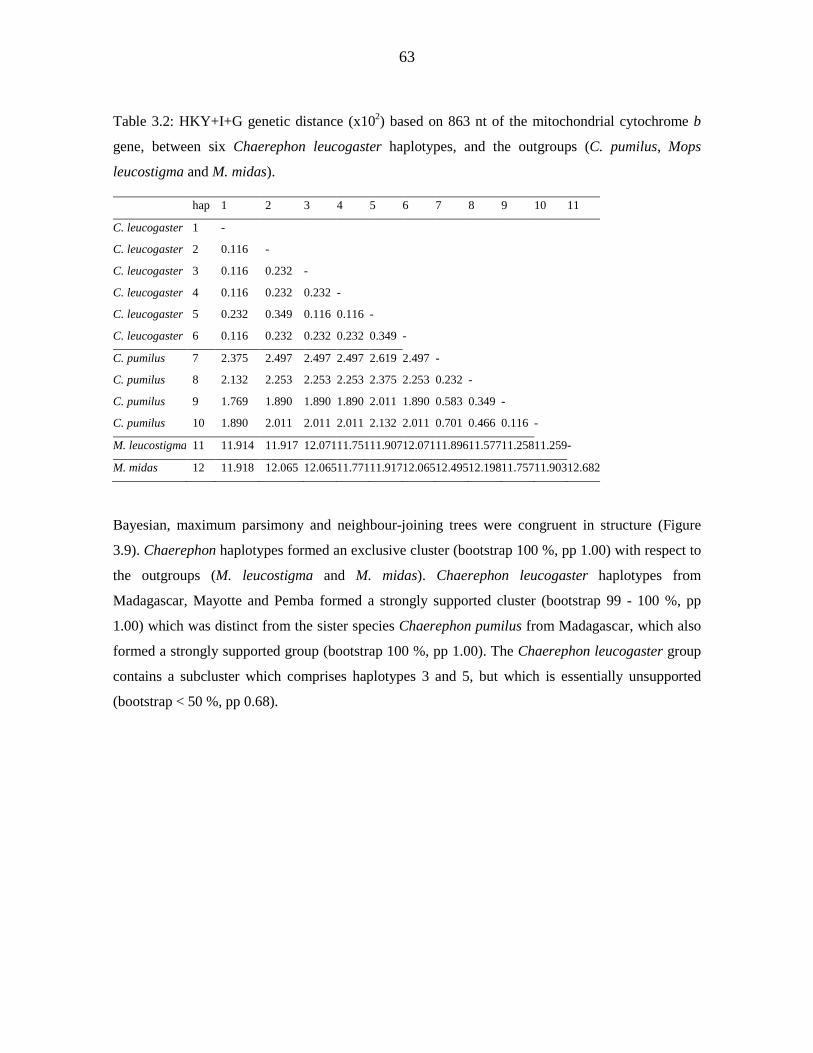
63
Table 3.2: HKY+I+G genetic distance (x102
) based on 863 nt of the mitochondrial cytochrome b
gene, between six Chaerephon leucogaster haplotypes, and the outgroups (C. pumilus, Mops
leucostigma and M. midas).
Bayesian, maximum parsimony and neighbour-joining trees were congruent in structure (Figure
3.9). Chaerephon haplotypes formed an exclusive cluster (bootstrap 100 %, pp 1.00) with respect to
the outgroups (M. leucostigma and M. midas). Chaerephon leucogaster haplotypes from
Madagascar, Mayotte and Pemba formed a strongly supported cluster (bootstrap 99 - 100 %, pp
1.00) which was distinct from the sister species Chaerephon pumilus from Madagascar, which also
formed a strongly supported group (bootstrap 100 %, pp 1.00). The Chaerephon leucogaster group
contains a subcluster which comprises haplotypes 3 and 5, but which is essentially unsupported
(bootstrap < 50 %, pp 0.68).
hap 1 2 3 4 5 6 7 8 9 10 11
C. leucogaster 1 -
C. leucogaster 2 0.116 -
C. leucogaster 3 0.116 0.232 -
C. leucogaster 4 0.116 0.232 0.232 -
C. leucogaster 5 0.232 0.349 0.116 0.116 -
C. leucogaster 6 0.116 0.232 0.232 0.232 0.349 -
C. pumilus 7 2.375 2.497 2.497 2.497 2.619 2.497 -
C. pumilus 8 2.132 2.253 2.253 2.253 2.375 2.253 0.232 -
C. pumilus 9 1.769 1.890 1.890 1.890 2.011 1.890 0.583 0.349 -
C. pumilus 10 1.890 2.011 2.011 2.011 2.132 2.011 0.701 0.466 0.116 -
M. leucostigma 11 11.914 11.917 12.071 11.751 11.907 12.071 11.896 11.577 11.258 11.259 -
M. midas 12 11.918 12.065 12.065 11.771 11.917 12.065 12.495 12.198 11.757 11.903 12.682
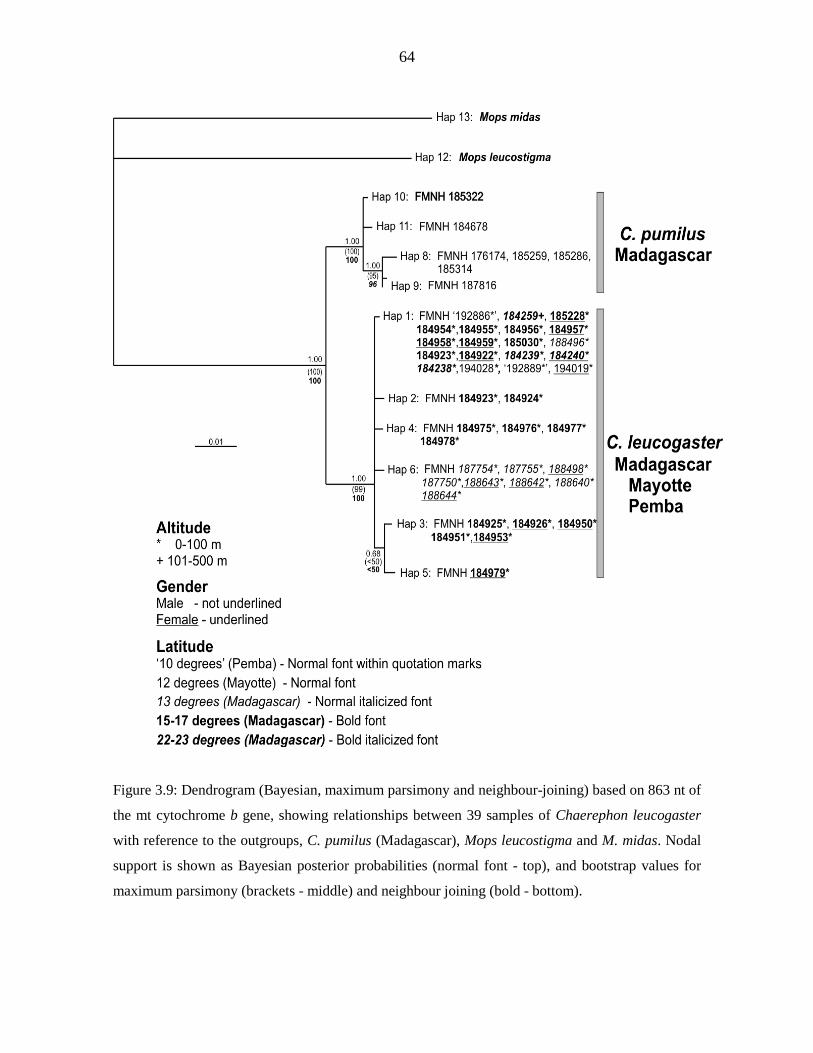
64
Figure 3.9: Dendrogram (Bayesian, maximum parsimony and neighbour-joining) based on 863 nt of
the mt cytochrome b gene, showing relationships between 39 samples of Chaerephon leucogaster
with reference to the outgroups, C. pumilus (Madagascar), Mops leucostigma and M. midas. Nodal
support is shown as Bayesian posterior probabilities (normal font - top), and bootstrap values for
maximum parsimony (brackets - middle) and neighbour joining (bold - bottom).
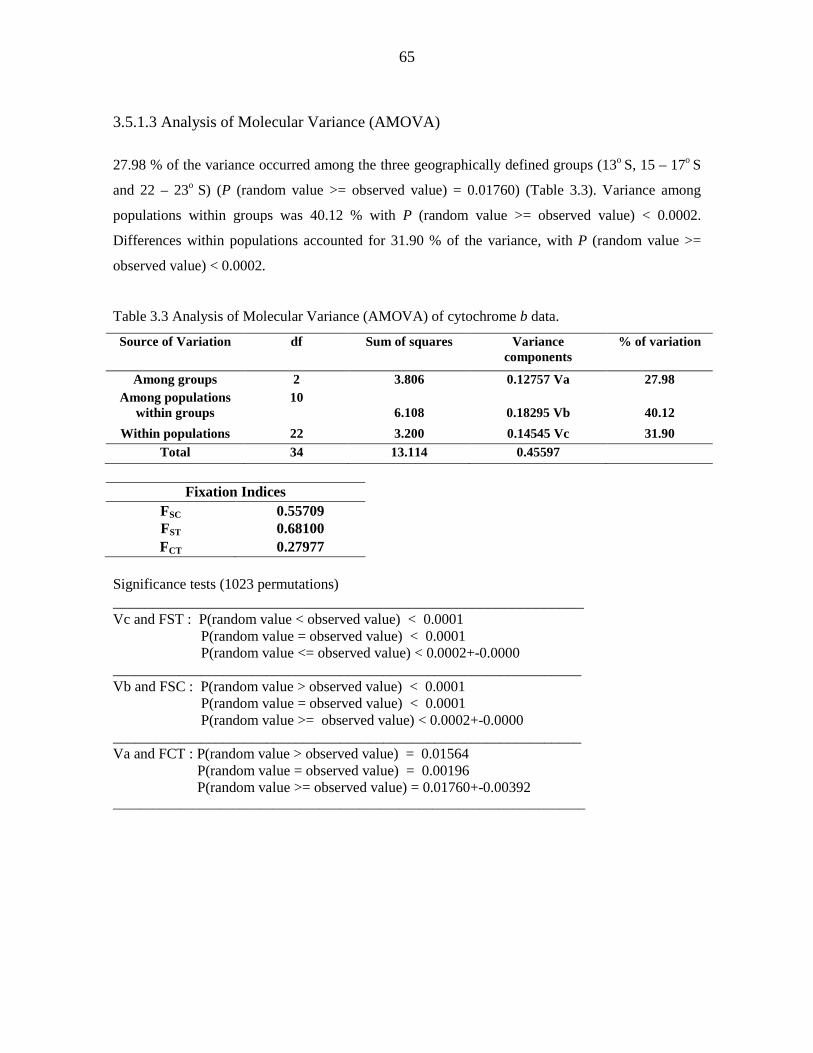
65
3.5.1.3 Analysis of Molecular Variance (AMOVA)
27.98 % of the variance occurred among the three geographically defined groups (13o S, 15 – 17o S
and 22 – 23o S) (P (random value >= observed value) = 0.01760) (Table 3.3). Variance among
populations within groups was 40.12 % with P (random value >= observed value) < 0.0002.
Differences within populations accounted for 31.90 % of the variance, with P (random value >=
observed value) < 0.0002.
Table 3.3 Analysis of Molecular Variance (AMOVA) of cytochrome b data.
Source of Variation df Sum of squares Variance components
% of variation
Among groups 2 3.806 0.12757 Va 27.98 Among populations
within groups 10
6.108
0.18295 Vb
40.12 Within populations 22 3.200 0.14545 Vc 31.90
Total 34 13.114 0.45597
Fixation Indices FSC 0.55709 FST 0.68100 FCT 0.27977
Significance tests (1023 permutations) ___________________________________________________________ Vc and FST : P(random value < observed value) < 0.0001 P(random value = observed value) < 0.0001 P(random value <= observed value) < 0.0002+-0.0000 ________________________________________________________________ Vb and FSC : P(random value > observed value) < 0.0001 P(random value = observed value) < 0.0001 P(random value >= observed value) < 0.0002+-0.0000 ________________________________________________________________ Va and FCT : P(random value > observed value) = 0.01564 P(random value = observed value) = 0.00196 P(random value >= observed value) = 0.01760+-0.00392 _______________________________________________________________________
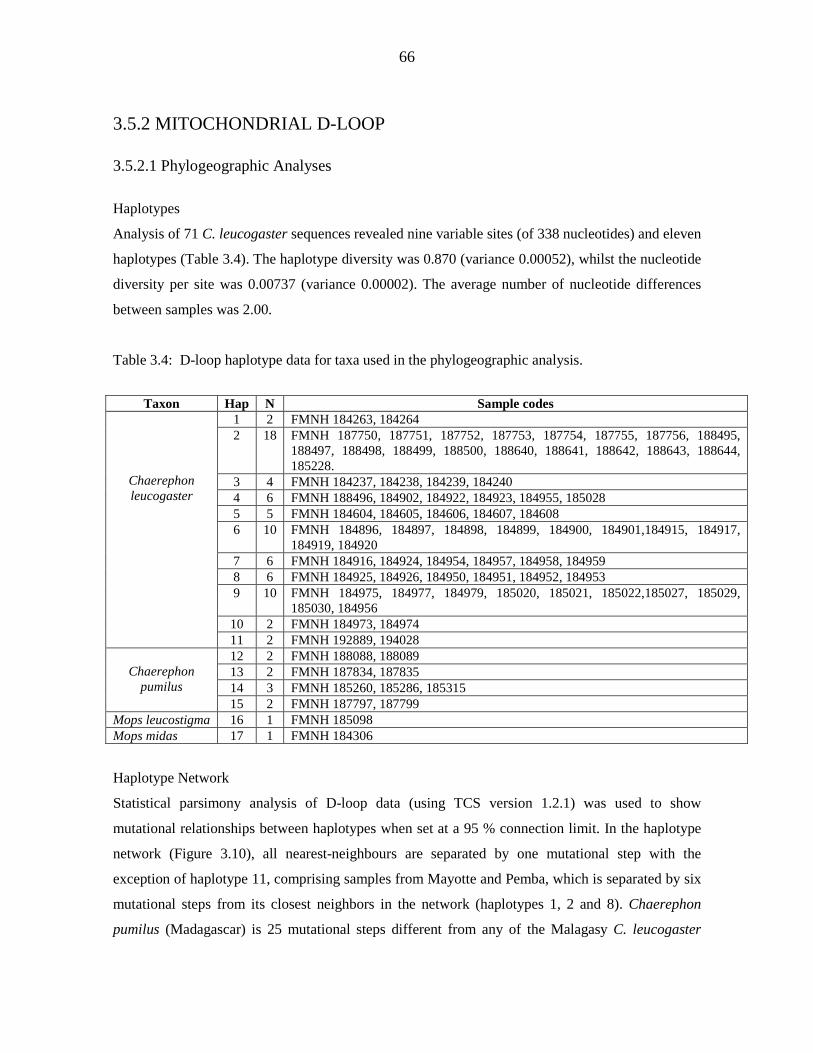
66
3.5.2 MITOCHONDRIAL D-LOOP 3.5.2.1 Phylogeographic Analyses
Haplotypes
Analysis of 71 C. leucogaster sequences revealed nine variable sites (of 338 nucleotides) and eleven
haplotypes (Table 3.4). The haplotype diversity was 0.870 (variance 0.00052), whilst the nucleotide
diversity per site was 0.00737 (variance 0.00002). The average number of nucleotide differences
between samples was 2.00.
Table 3.4: D-loop haplotype data for taxa used in the phylogeographic analysis.
Taxon Hap N Sample codes
Chaerephon leucogaster
1 2 FMNH 184263, 184264 2 18 FMNH 187750, 187751, 187752, 187753, 187754, 187755, 187756, 188495,
188497, 188498, 188499, 188500, 188640, 188641, 188642, 188643, 188644, 185228.
3 4 FMNH 184237, 184238, 184239, 184240 4 6 FMNH 188496, 184902, 184922, 184923, 184955, 185028 5 5 FMNH 184604, 184605, 184606, 184607, 184608 6 10 FMNH 184896, 184897, 184898, 184899, 184900, 184901,184915, 184917,
184919, 184920 7 6 FMNH 184916, 184924, 184954, 184957, 184958, 184959 8 6 FMNH 184925, 184926, 184950, 184951, 184952, 184953 9 10 FMNH 184975, 184977, 184979, 185020, 185021, 185022,185027, 185029,
185030, 184956 10 2 FMNH 184973, 184974 11 2 FMNH 192889, 194028
Chaerephon
pumilus
12 2 FMNH 188088, 188089 13 2 FMNH 187834, 187835 14 3 FMNH 185260, 185286, 185315 15 2 FMNH 187797, 187799
Mops leucostigma 16 1 FMNH 185098 Mops midas 17 1 FMNH 184306
Haplotype Network
Statistical parsimony analysis of D-loop data (using TCS version 1.2.1) was used to show
mutational relationships between haplotypes when set at a 95 % connection limit. In the haplotype
network (Figure 3.10), all nearest-neighbours are separated by one mutational step with the
exception of haplotype 11, comprising samples from Mayotte and Pemba, which is separated by six
mutational steps from its closest neighbors in the network (haplotypes 1, 2 and 8). Chaerephon
pumilus (Madagascar) is 25 mutational steps different from any of the Malagasy C. leucogaster
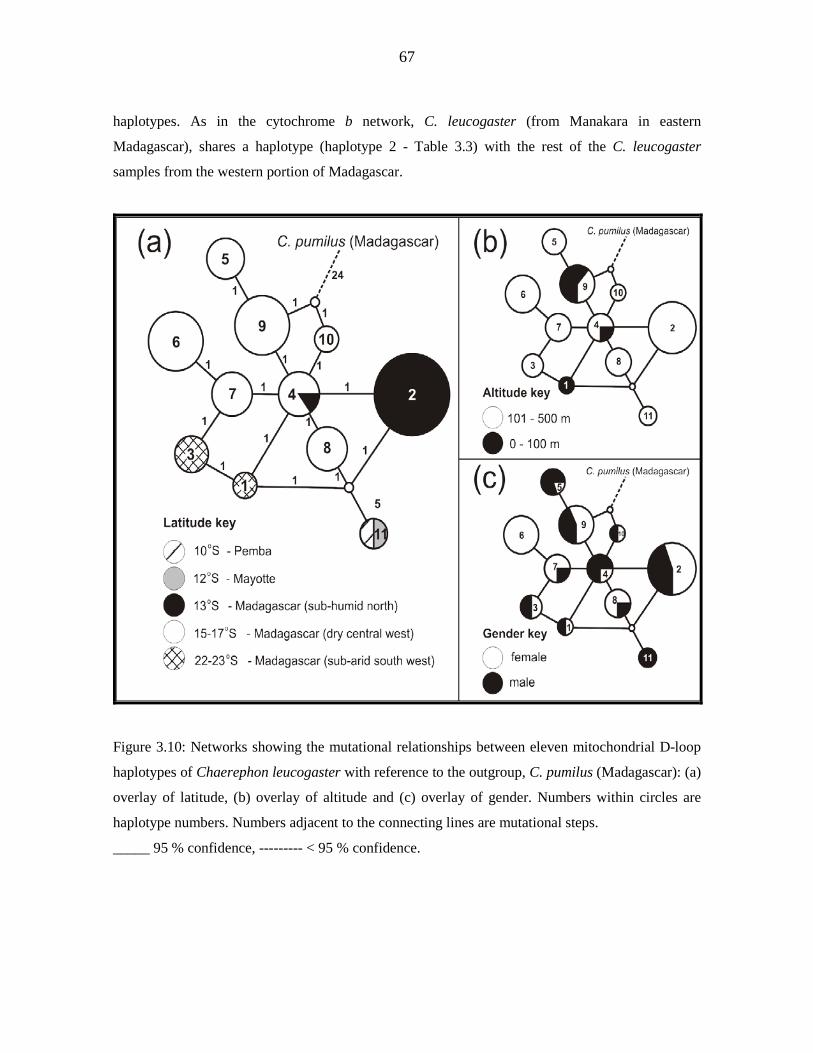
67
haplotypes. As in the cytochrome b network, C. leucogaster (from Manakara in eastern
Madagascar), shares a haplotype (haplotype 2 - Table 3.3) with the rest of the C. leucogaster
samples from the western portion of Madagascar.
Figure 3.10: Networks showing the mutational relationships between eleven mitochondrial D-loop
haplotypes of Chaerephon leucogaster with reference to the outgroup, C. pumilus (Madagascar): (a)
overlay of latitude, (b) overlay of altitude and (c) overlay of gender. Numbers within circles are
haplotype numbers. Numbers adjacent to the connecting lines are mutational steps.
_____ 95 % confidence, --------- < 95 % confidence.
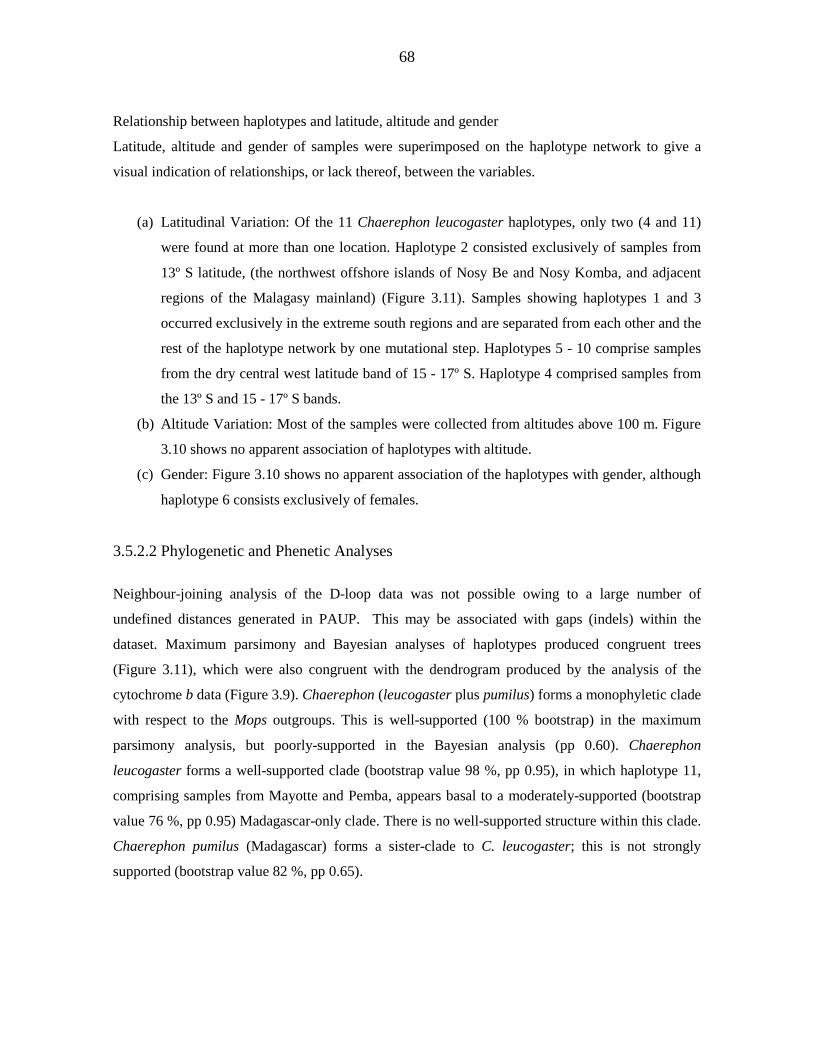
68
Relationship between haplotypes and latitude, altitude and gender
Latitude, altitude and gender of samples were superimposed on the haplotype network to give a
visual indication of relationships, or lack thereof, between the variables.
(a) Latitudinal Variation: Of the 11 Chaerephon leucogaster haplotypes, only two (4 and 11)
were found at more than one location. Haplotype 2 consisted exclusively of samples from
13º S latitude, (the northwest offshore islands of Nosy Be and Nosy Komba, and adjacent
regions of the Malagasy mainland) (Figure 3.11). Samples showing haplotypes 1 and 3
occurred exclusively in the extreme south regions and are separated from each other and the
rest of the haplotype network by one mutational step. Haplotypes 5 - 10 comprise samples
from the dry central west latitude band of 15 - 17º S. Haplotype 4 comprised samples from
the 13º S and 15 - 17º S bands.
(b) Altitude Variation: Most of the samples were collected from altitudes above 100 m. Figure
3.10 shows no apparent association of haplotypes with altitude.
(c) Gender: Figure 3.10 shows no apparent association of the haplotypes with gender, although
haplotype 6 consists exclusively of females.
3.5.2.2 Phylogenetic and Phenetic Analyses
Neighbour-joining analysis of the D-loop data was not possible owing to a large number of
undefined distances generated in PAUP. This may be associated with gaps (indels) within the
dataset. Maximum parsimony and Bayesian analyses of haplotypes produced congruent trees
(Figure 3.11), which were also congruent with the dendrogram produced by the analysis of the
cytochrome b data (Figure 3.9). Chaerephon (leucogaster plus pumilus) forms a monophyletic clade
with respect to the Mops outgroups. This is well-supported (100 % bootstrap) in the maximum
parsimony analysis, but poorly-supported in the Bayesian analysis (pp 0.60). Chaerephon
leucogaster forms a well-supported clade (bootstrap value 98 %, pp 0.95), in which haplotype 11,
comprising samples from Mayotte and Pemba, appears basal to a moderately-supported (bootstrap
value 76 %, pp 0.95) Madagascar-only clade. There is no well-supported structure within this clade.
Chaerephon pumilus (Madagascar) forms a sister-clade to C. leucogaster; this is not strongly
supported (bootstrap value 82 %, pp 0.65).
69
Figure 3.11: Dendrogram (Bayesian and maximum parsimony) based on 338 nt of the
mitochondrial D-loop showing relationships between 71 samples of Chaerephon leucogaster with
reference to the outgroups, C. pumilus (Madagascar), Mops leucostigma and M. midas. Nodal
support is indicated as Bayesian posterior probabilities (normal font - top) and bootstrap values for
maximum parsimony (brackets - bottom).
70
3.5.2.3 Analysis of Molecular Variance (AMOVA) 40.44 % of the variance occurred among the three geographically defined groups (13o S, 15 – 17o S
and 22 – 23o S) (P (random value >= observed value) = 0.00098) (Table 3.5). Variance among
populations within groups was 42.27 % with P (random value >= observed value) < 0.0002.
Differences within populations accounted for 17.29 % of the variance, with P (random value >=
observed value) < 0.0002.
Table 3.5: Analysis of Molecular Variance (AMOVA) of D-loop.
Source of Variation df Sum of squares Variance components
% of variation
Among groups 2 28.920 0.64186 Va 40.44 Among populations
within groups 14 43.134 0.67090 Vb 42.27
Within populations 54 14.819 0.27443 Vc 17.29
Total 70 86.873 1.58719
Fixation Indices
FSC 0.70970 FST 0.82710 FCT 0.40440
_____________________________________________________________ Vc and FST: P(random value < observed value) < 0.0001 P(random value = observed value) < 0.0001 P(random value <= observed value) < 0.0002+-0.0000 ___________________________________________________________________ Vb and FSC: P(random value > observed value) < 0.0001 P(random value = observed value) < 0.0001 P(random value >= observed value) < 0.0002+-0.0000 ___________________________________________________________________ Va and FCT: P(random value > observed value) = 0.00098 P(random value = observed value) < 0.0001 P(random value >= observed value) = 0.00099+-0.00098 __________________________________________________________________________ 3.5.2.4 Demographic Analysis Diversity tests, neutrality tests and mismatch distribution analysis were conducted on D-loop data to
examine the demographic history (Russell et al., 2005) of C. leucogaster. Results are presented in
Table 3.6 and Figure 3.12. Two different methods had been conducted to show support that the
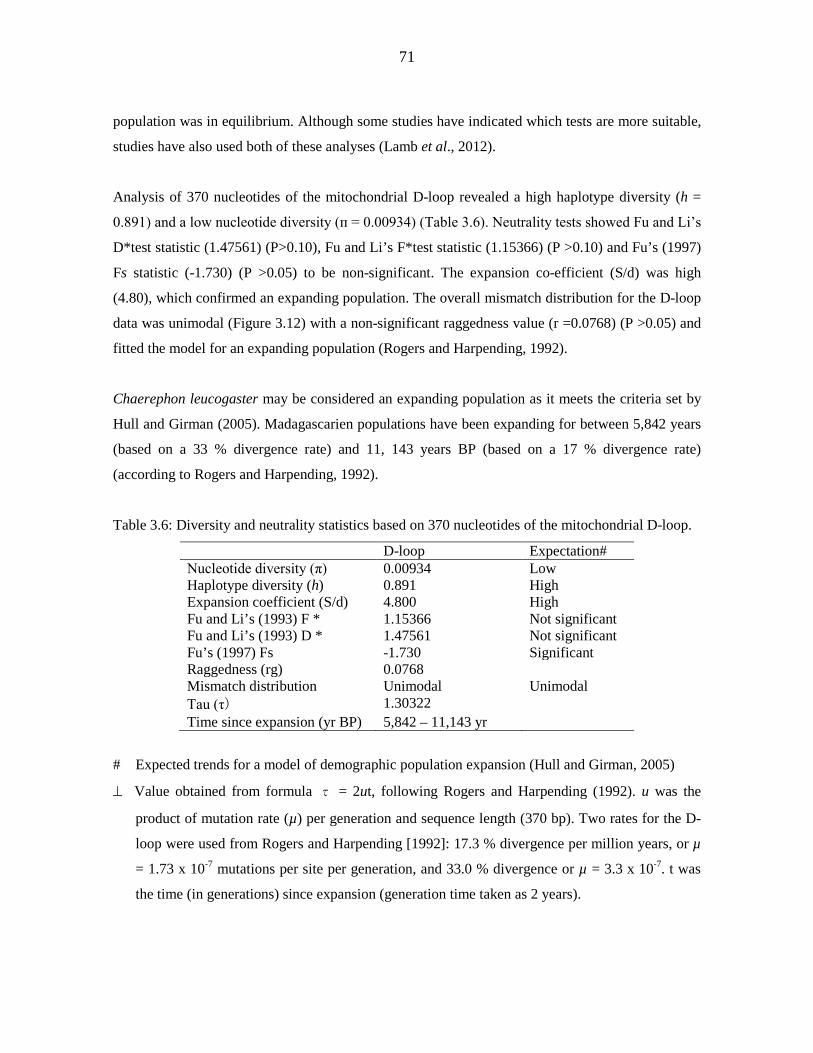
71
population was in equilibrium. Although some studies have indicated which tests are more suitable,
studies have also used both of these analyses (Lamb et al., 2012).
Analysis of 370 nucleotides of the mitochondrial D-loop revealed a high haplotype diversity (h =
0.891) and a low nucleotide diversity (п = 0.00934) (Table 3.6). Neutrality tests showed Fu and Li’s
D*test statistic (1.47561) (P>0.10), Fu and Li’s F*test statistic (1.15366) (P >0.10) and Fu’s (1997)
Fs statistic (-1.730) (P >0.05) to be non-significant. The expansion co-efficient (S/d) was high
(4.80), which confirmed an expanding population. The overall mismatch distribution for the D-loop
data was unimodal (Figure 3.12) with a non-significant raggedness value (r =0.0768) (P >0.05) and
fitted the model for an expanding population (Rogers and Harpending, 1992).
Chaerephon leucogaster may be considered an expanding population as it meets the criteria set by
Hull and Girman (2005). Madagascarien populations have been expanding for between 5,842 years
(based on a 33 % divergence rate) and 11, 143 years BP (based on a 17 % divergence rate)
(according to Rogers and Harpending, 1992).
Table 3.6: Diversity and neutrality statistics based on 370 nucleotides of the mitochondrial D-loop.
D-loop Expectation# Nucleotide diversity (π) 0.00934 Low Haplotype diversity (h) 0.891 High Expansion coefficient (S/d) 4.800 High Fu and Li’s (1993) F * 1.15366 Not significant Fu and Li’s (1993) D * 1.47561 Not significant Fu’s (1997) Fs -1.730 Significant Raggedness (rg) 0.0768 Mismatch distribution Unimodal Unimodal Tau (τ) 1.30322 Time since expansion (yr BP) 5,842 – 11,143 yr
# Expected trends for a model of demographic population expansion (Hull and Girman, 2005)
⊥ Value obtained from formula τ = 2ut, following Rogers and Harpending (1992). u was the
product of mutation rate (µ) per generation and sequence length (370 bp). Two rates for the D-
loop were used from Rogers and Harpending [1992]: 17.3 % divergence per million years, or µ
= 1.73 x 10⁻⁷ mutations per site per generation, and 33.0 % divergence or µ = 3.3 x 10⁻⁷. t was
the time (in generations) since expansion (generation time taken as 2 years).
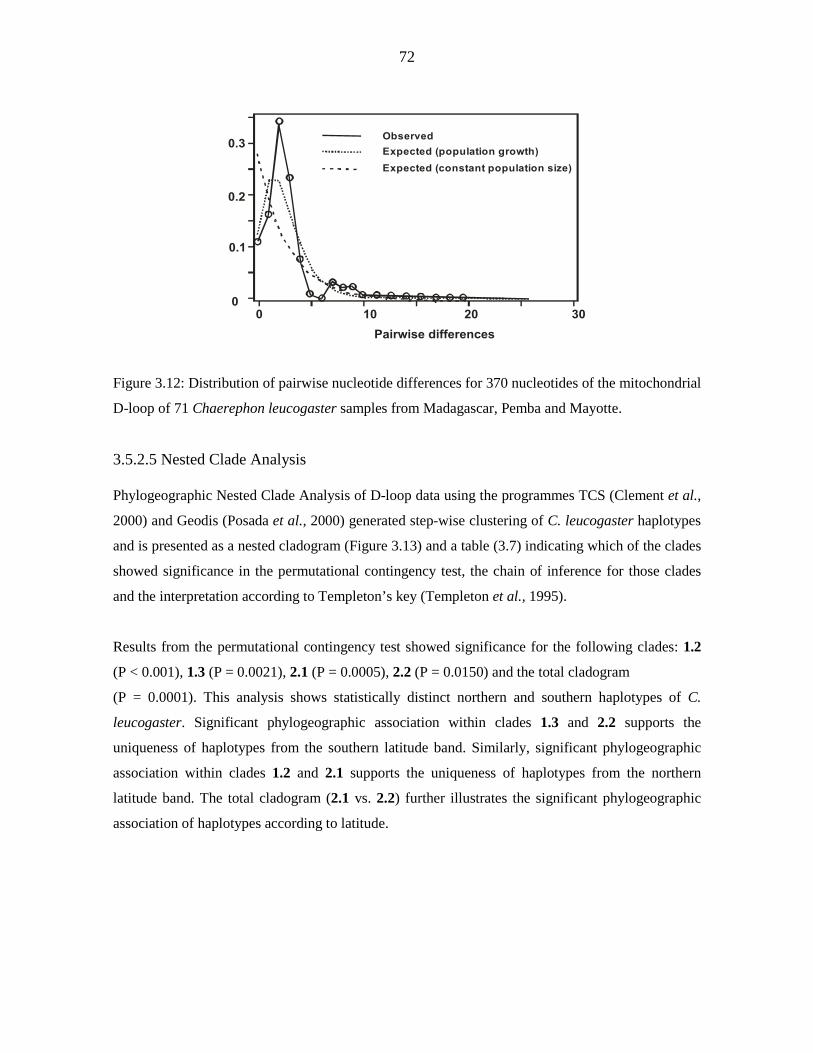
72
Pairwise differences
ObservedExpected (population growth)Expected (constant population size)
0
0.1
0.2
0.3
0 10 20 30
Figure 3.12: Distribution of pairwise nucleotide differences for 370 nucleotides of the mitochondrial
D-loop of 71 Chaerephon leucogaster samples from Madagascar, Pemba and Mayotte.
3.5.2.5 Nested Clade Analysis Phylogeographic Nested Clade Analysis of D-loop data using the programmes TCS (Clement et al.,
2000) and Geodis (Posada et al., 2000) generated step-wise clustering of C. leucogaster haplotypes
and is presented as a nested cladogram (Figure 3.13) and a table (3.7) indicating which of the clades
showed significance in the permutational contingency test, the chain of inference for those clades
and the interpretation according to Templeton’s key (Templeton et al., 1995).
Results from the permutational contingency test showed significance for the following clades: 1.2
(P < 0.001), 1.3 (P = 0.0021), 2.1 (P = 0.0005), 2.2 (P = 0.0150) and the total cladogram
(P = 0.0001). This analysis shows statistically distinct northern and southern haplotypes of C.
leucogaster. Significant phylogeographic association within clades 1.3 and 2.2 supports the
uniqueness of haplotypes from the southern latitude band. Similarly, significant phylogeographic
association within clades 1.2 and 2.1 supports the uniqueness of haplotypes from the northern
latitude band. The total cladogram (2.1 vs. 2.2) further illustrates the significant phylogeographic
association of haplotypes according to latitude.
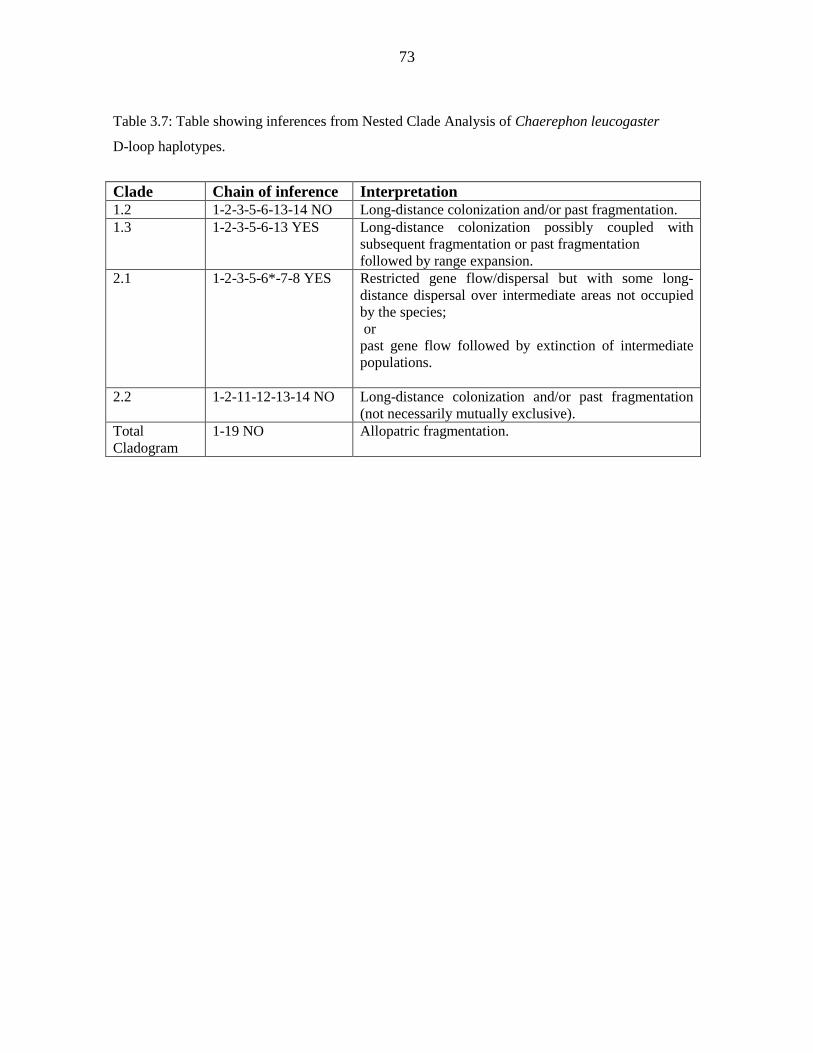
73
Table 3.7: Table showing inferences from Nested Clade Analysis of Chaerephon leucogaster
D-loop haplotypes.
Clade Chain of inference Interpretation 1.2 1-2-3-5-6-13-14 NO Long-distance colonization and/or past fragmentation. 1.3 1-2-3-5-6-13 YES Long-distance colonization possibly coupled with
subsequent fragmentation or past fragmentation followed by range expansion.
2.1 1-2-3-5-6*-7-8 YES Restricted gene flow/dispersal but with some long-distance dispersal over intermediate areas not occupied by the species; or past gene flow followed by extinction of intermediate populations.
2.2 1-2-11-12-13-14 NO Long-distance colonization and/or past fragmentation (not necessarily mutually exclusive).
Total Cladogram
1-19 NO Allopatric fragmentation.

74
Figure 3.13: Nested cladogram based on the network showing relationships between haplotypes
derived from 69 D-loop sequences of Chaerephon leucogaster from Madagascar generated using
the program TCS (Clement et al., 2000).
75
3.6 Ecological Niche Modelling
The MaxEnt method (Phillips et al., 2006) was used to estimate the predicted distribution of C.
leucogaster (Figure 3.14). The MaxEnt algorithm converged after 1,200 iterations with a
regularized training gain of 1.833. Model performance as assessed by the area under the curve
(AUC) was very high (0.95), indicating efficient classification of suitable versus unsuitable habitats.
. Temperature seasonality (bio_4) was the environmental variable that exhibited the highest
explanatory power. Annual mean temperature (bio_1), when removed, was shown to decrease the
overall gain of the model. Results from the model revealed clear occurrence, between C.
leucogaster populations from the northwest, central west and southwest, of regions of unsuitable
habitat.
Suitable habitat was sparsely distributed in the northwest (sub-humid forest), east (humid forests)
and central west (deciduous forest), whilst it was more widely distributed in the south (semi-arid
forest). According to the MaxEnt model, C. leucogaster recorded on the southeastern side of
Madagascar at Manakara occupies unsuitable habitat.
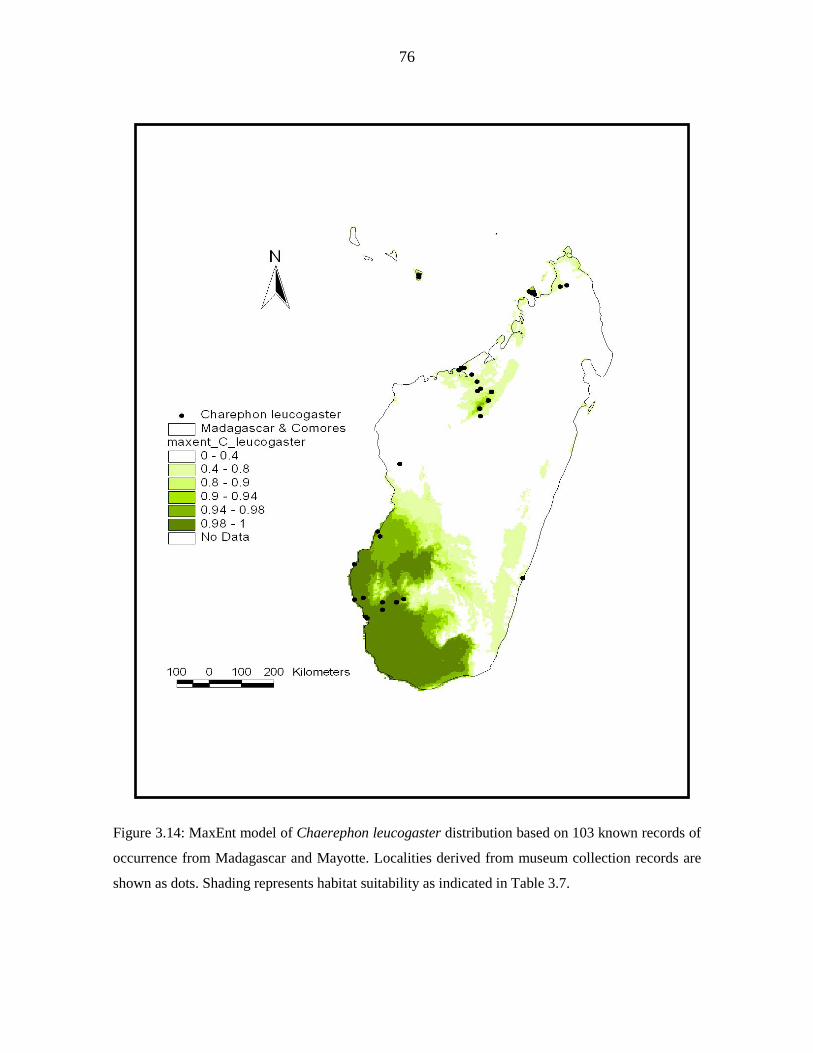
76
Figure 3.14: MaxEnt model of Chaerephon leucogaster distribution based on 103 known records of
occurrence from Madagascar and Mayotte. Localities derived from museum collection records are
shown as dots. Shading represents habitat suitability as indicated in Table 3.7.
77
4. DISCUSSION 4.1 TAXONOMY, PHYLOGENY AND PHYLOGEOGRAPHY OF CHAEREPHON LEUCOGASTER Phylogenetic and phenetic analysis of cytochrome b sequences shows strong support for the
monophyly of Chaerephon leucogaster from the western Indian Ocean region (Madagascar,
Mayotte and Pemba). The topologies of neighbour-joining, maximum parsimony and Bayesian
cytochrome b gene trees (Figure 3.9) and maximum parsimony and Bayesian D-loop gene trees
(Figure 3.11), which support this monophyly, are congruent.
The low genetic variability of C. leucogaster cytochrome b sequences was also apparent in the
haplotype network (Figure 3.8), which reflects six haplotypes for 39 samples, with adjacent
haplotypes separated by only a single mutation. The low genetic variability is also reflected in the
sharing of haplotypes between individuals from Madagascar, Pemba and Mayotte, despite the
separation of these islands by distances of up to 1300 km.
The mean cytochrome b genetic distance between C. leucogaster samples from Madagascar,
Mayotte and Pemba was low (0.20 %). According to Baker and Bradley (2006), the mean inter-
population cytochrome b distance for bats is 1.7 % (range 1.4 % to 1.9 %, based on 2 studies),
whilst the mean intraspecific distance is 1.6 % (range 0.6 % to 2.3 %, 10 studies) and the mean
inter-species difference is 8.3 % (range 3.3 % to 14.7 %, 10 studies). As the genetic distance
between C. leucogaster samples is less than both the inter-population and intra-specific distances
reported by Baker and Bradley (2006), this suggests that C. leucogaster from Madagascar, Mayotte
and Pemba maybe a single species group and that the different islands may contain different
populations, or, but less likely, one panmictic population. Although C. leucogaster is one of the
smallest Molossidae, evidence suggests that all Molossids are capable of long-distance flight, and
that C. leucogaster is capable of crossing the Mozambique Channel. It should be noted that the
cytochrome b distances in this study (HKY+I+G) are not strictly comparable to those reported in
Baker and Bradley (2006), as their report was compiled from a number of studies and did not
include any Molossidae. Additionally, their inter-population estimate was based on only two
studies, and might change considerably should further studies (for example this one) be included in
the dataset.
78
Analysis of both cytochrome b and D-loop sequence data shows low variation within C. leucogaster
relative to some other molossid bats. Haplotype diversity for cytochrome b and the D-loop (0.718,
0.870) is low compared to that of populations of Otomops madagascariensis (0.945, 0.968), O.
martiensseni (0.876, 0.952) (Lamb et al., 2008) and Tadarida brasiliensis (0.987, 0.998) (Russell et
al., 2005), although higher than that calculated for Mops midas (0.608, 0.468) (Ratrimomanarivo et
al., 2007) and M. leucostigma (0.367, 0.758) (Ratrimomanarivo et al., 2008).
Phylogenetic (Figure 3.8) analyses indicate that C. leucogaster and C. pumilus from the eastern side
of Madagascar are reciprocally-monophyletic sister taxa. The congruency of cytochrome b and D-
loop analyses (Figures 3.9 and 3.11) lends support to this conclusion. The genetic distances between
C. leucogaster and C. pumilus range from 1.8 % to 2.7 % (Table 3.2). Baker and Bradley (2006)
reported mean inter-species distances for ten bat species of 1.6 % (range 0.6 % - 2.3 %) and for ten
sister species pairs of 8.3 %, (range 3.3 % -14.7 %). The leucogaster/pumilus (Madagascar) distance
values of 1.8 % - 2.7 % are not within the sister species range reported by Baker and Bradley (2006)
for ten studies on (non – Molossid) bats.
Examples of groups that have been recognized as species even though separated by relatively low
genetic distances include Mops leucostigma and M. condylurus, sister molossid taxa separated by a
2.5 % genetic distance (Ratrimomanarivo et al., 2008). Lower levels of sequence divergence could
separate valid species which may have recently diverged and still manifest incomplete lineage
sorting and a low level of ongoing gene flow (Ditchfield 2000; Mayer and von Helversen 2001;
Hoffman and Baker 2003; Juste et al., 2003; Russell et al., 2005). The genetic distance means and
ranges reported by Baker and Bradley (2006) are based on a defined number of comparisons of non-
Molossid data. The ranges are great and there is overlap between the inter-population and intra-
specific data. Nabholz et al. (2008) reported a wide variation in mitochondrial DNA substitution
rates in mammals, and that bats, which, themselves exhibit wide variation; evolve slower than many
non-flying mammals. Data should be interpreted holistically, particularly where a point falls at the
lower end of or just below a reported range, in combination with phylogenetic patterns (reciprocal
monophyly) and morphological data.
The well-supported reciprocal monophyly of both cytochrome b and D-loop sequences of C.
leucogaster and C. pumilus on Madagascar coupled with the morphological distinction
(Ratrimomanarivo et al., in press) between them appear to support their status as separate species.
79
The Chaerephon leucogaster animal collected from Manakara, a locality on the east coast of
Madagascar and outside the acknowledged range of C. leucogaster, exhibits no genetic or
morphological variation from other C. leucogaster specimens (Ratrimomanarivo et al., in press)
from the west coast. It may indicate a recent colonization of the east of Madagascar by C.
leucogaster. This population on the east coast occurs in sympatry with C. pumilus in its
acknowledged range, which lends further support to the notion that these are distinct sister species
between which gene exchanges does not seem to occur.
4.1.1 GENETIC VARIATION OF CHAEREPHON LEUCOGASTER SAMPLES FROM MAYOTTE AND PEMBA Analysis of cytochrome b sequences reveals no genetic separation between Chaerephon leucogaster
samples from Mayotte and Pemba even though Pemba and Mayotte are 1300 km and 320 km
(respectively) from the closest coast of Madagascar. These results can be attributed to the relatively
low variability of the C. leucogaster cytochrome b region and are consistent with the finding that
large bodies of water may not be a barrier to dispersal of bats (Ruedi and McCracken, 2006).
D-loop data, however, shows some genetic differentiation of samples from mainland Madagascar
and the islands of Mayotte and Pemba (1.4 % - a minimum of six mutational steps). This difference
is not unexpected as the D-loop is known to evolve around three times faster than the cytochrome b
gene and the latter is therefore more likely to reveal low levels of genetic differentiation.
This relative lack of genetic variability between C. leucogaster populations from Madagascar,
Mayotte and Pemba contrasts with the results of many other studies on bats separated by large
bodies of water. Castella et al. (2000) found that the Straits of Gibraltar formed a geographical
barrier which separated two genetically distinct populations of Myotis myotis which occur on either
side of it. In 2003, Pestano et al. reported an insignificant amount of gene flow between populations
of Plecotus teneriffae on Canary Island and those from the western portion of this archipelago
(Tenerife, La Palma and El Hierro), and also reported a 4 % cytochrome b divergence between
Barbastella barbastellus populations on Canary island and mainland Spain.
The genetic similarity of C. leucogaster on Madagascar, Mayotte and Pemba may be attributed to
inter-island dispersal. Genetic structure has been noted in bats with low dispersal capabilities and
not within more wide-ranging species (Worthington-Wilmer et al., 1994; Webb and Tidemann,
80
1996; Burland et al., 1999; Russell et al., 2005). The flight capability of molossid bats suggests that
C. leucogaster is capable of long distance dispersal (Goodman and Cardiff, 2004).
Morphologically, C. leucogaster from Pemba was found to be larger than C. leucogaster found in
Madagascar and Mayotte, and to have darker pelage coloration and a more extensive white
coloration of the ventral region (Ratrimomanarivo et al., in press). These population-level
differences are not reflected in the cytochrome b and D-loop sequences of this study; this, insofar as
variation in these sequences is a measure of general genetic isolation, indicates that these
morphological differences may not be genetically based. The distinctive size and coloration of these
bats could be due to environmental factors such as differences in the ecological niche these bats
inhabit. The lack of concordance between morphological and genetic variation of C. leucogaster
from Madagascar, Mayotte and Pemba parallels the results of a study conducted by
Ratrimomanarivo et al. (in press). Mops leucostigma exhibits morphological but not genetic
variation between the eastern and western slopes of Madagascar, which exhibit different bioclimatic
conditions. Therefore, as with C. leucogaster, these morphological differences may be attributed to
dietary, climatic or other factors.
4.1.2 GENETIC VARIATION WITHIN MALAGASY CHAEREPHON LEUCOGASTER SAMPLES Genetic distinctiveness of animals from the 13º S latitude band
This region of sub-humid forest includes the northwest offshore islands of Nosy Be and Nosy
Komba, which are situated 14 km from the Madagascan mainland. It is separated from the
15º - 17º S latitude band of dry deciduous forest by a region of habitat predicted, based on the
current sample distribution, to be unsuitable for C. leucogaster by MaxEnt ecological niche
modelling.
Analysis of cytochrome b sequences indicates that eight out of nine sample animals from the 13º S
zone show a unique haplotype (Figure 3.8). This is supported by the D-loop data, where 17 out of
18 samples reflect a distinct haplotype (Figure 3.10). Only one animal from the northwest offshore
islands shared a haplotype with Malagasy samples from more southerly regions. Thus samples from
the 13º S latitude band show strong phylogeographic structure. These results are supported by
Nested Clade Phylogeographic Analysis (Table 3.7, Figure 3.13), which displays similar
81
associations and provides statistical support for the phylogeographic distinctness of samples from
the 13º S latitude band.
One possible interpretation, according to Templeton’s key (Templeton et al., 1995) is restricted
gene flow, but with some long distance dispersal over intermediate areas not occupied by the
species. The region separating the 13º S zone from 15º - 17º S zone is unoccupied by C. leucogaster
and comprises unsuitable habitat (MaxEnt modeling). C. leucogaster, which feeds on insects
(unknown species), is capable of flying between these regions. Its feeding ecology is, however,
largely unstudied. It is likely that it would restrict its feeding to a narrower range around the area of
its day roosts. If this is the case, animals living in the 13º S zone would be likely to feed on insects
found within that zone, possibly in the sub-humid forests where its night roosts may be located,
although, again, this is not known. Unless food is unavailable with the 13º S zone, it would seem
unlikely (energetically unfavorable) that a bat would forage several hundred kilometers south across
a region of habitat that is predicted as unsuitable. Thus the effective range of C. leucogaster might
be much more restricted that its flight capability suggests, which may account for the development
of genetically-isolated populations in this region. As the vegetation in this 13º S zone, sub-humid
forest, differs from that in the more southerly zones (dry deciduous forest and spiny bush), the type
of insects available as food may differ, leading to a degree of specialization and thus regional
isolation. Studies on the feeding ecology of C. leucogaster are necessary to provide further insight.
Such studies are difficult, however, as these high-flying bats are seldom trapped in flight.
Other explanations of the phylogeographic structure observed in this region include past gene flow
followed by extinction of intermediate populations, long-distance colonization or past
fragmentation. Without detailed specific information on past climate and vegetation change in these
regions of Madagascar, it is difficult to comment on whether there were intermediate populations,
which perhaps foraged and roosted in the regions which are currently predicted to comprise
unsuitable habitat, and are now extinct. There is no evidence in the fossil record to support this.
Genetic distinctiveness of animals from the 15º S to 17º S latitude band
Both cytochrome b and D-loop data show haplotypes exclusive to this central region of dry
deciduous forest, which is separated from the habitat zones in the north (13º S) and south (22º S -
23º S) by unoccupied regions of unsuitable habitat predicted by MaxEnt ecological niche modelling.
82
Genetic distinctiveness of animals from the 22º S to 23º S latitude band
Animals sampled from the southwest region of Madagascar came from Toliara and Sakaraha. This
region is separated from the 15º S to 17º S latitude band by an area of unsuitable habitat (predicted
by MaxEnt ecological niche modelling). Analysis of cytochrome b sequences reveals no genetic
differentiation of samples from this region relative to areas from further north. Mitochondrial D-
loop data however, is more variable and reveals the existence of two exclusive haplotypes within
this area (Figure 3.10). These haplotypes are separated by one mutational step from each other and
the closest haplotype is separated by one mutational step from the rest of the haplotype network.
This genetic distinctiveness is supported by Nested Clade Phylogeographic Analysis (Figure 3.13,
Table 3.7) which reflects significant phylogeographic associations in clades 1.3, 2.2 and the total
cladogram.
Long distance colonization, possibly coupled with past fragmentation, were the processes inferred
to explain these geographical associations of haplotypes (Table 3.7). Much of the discussion above,
relating to the distinctiveness of animals from the 13º S latitude zone applies here. Distinctiveness
of C. leucogaster from the 22º S to 23º S latitude band may relate to vegetation and feeding
ecology. Chaerephon leucogaster may have specialized by feeding on insects that are found in the
spiny bush characteristic of this region, which is separated from the 15º S to 17º S habitat zone by
more than 500 km. The lack of suitable vegetation (for night roosts) and food in this region of
predicted unsuitable habitat may have resulted in the confinement and specialization of C.
leucogaster populations to the southern zone. Overall, it appears that the confinement of exclusive
haplotypes to specific latitude and vegetation zones is consistent with allopatric fragmentation and
that habitat vicariance may be involved in the current evolution of significant phylogeographically-
structured groups of C. leucogaster. Although the regions between the three latitude bands are
predicted to contain unsuitable habitat by MaxEnt ecological niche modeling, it is possible that
more intensive sampling in the gap areas might reveal the existence there of populations of C.
leucogaster. These samples, if included in the niche modeling might change the areas of predicted
suitable habitat. This could account for the apparent genetic and ecological gaps. If this is the case,
sampling in these largely unsampled areas might provide links which would result in genetic and
ecological clines which fit a model of isolation by distance.
83
Morphological analysis of C. leucogaster reveals variation in size of animals from the different
latitude (and vegetation) bands (Ratrimomanarivo et al., in press) as discussed in the section on
genetic analysis. Animals from the extreme south, southwest and northern regions are larger in
certain morphological characters than those from the central western zone (Ratrimomanarivo et al.,
in press). Nested Clade analysis of D-loop data shows that animals from the northern and southern
latitude bands are genetically distinct. AMOVA analysis further supports this conclusion (Table 3.3
and Table 3.5). It is not clear, though, that there is any causative relationship between this genetic
and morphological distinctness.
The explanations for current patterns of genetic diversity may lie in historical, climatic and habitat
variation. Frequent changes in climate led to the ice ages of the Quaternary (2.4 Myr to the present)
(Hewitt, 2000), which may have influenced speciation and the geographic distribution of species,
including C. leucogaster or its ancestors. The expansion and contraction of species’ ranges reflected
the change in suitable habitats of species. Expansion would have allowed individuals to broaden
their range and this would have involved selection and adaptation to different environmental
conditions (Hewitt, 2000). Wilme et al. (2006) examined the effects of paleoclimatic changes on
patterns of dispersal and vicariance at intra-island level. In Madagascar, it was proposed that the
riverine habitats acted as refugia for retreat to higher altitude zones. This led to fragmentation of
ancestral populations, which in turn led to allopatric differentiation or extinction of populations, and
later recolonization (Hewitt, 2000; Burney et al., 2004; Wilme et al., 2006). During glacial minima,
species used the riverine corridors to expand their geographical ranges. Burney et al. (2004)
suggested that the lowland forests were restricted to refugia along the east coast and in the
northwest of the island. This could explain the origin (during an earlier Pleistocene glacial
maximum) of C. pumilus (adapted to the east cost conditions) and C. leucogaster (adapted to the
west coast conditions), as well as the latitudinal genetic variation shown in the D-loop data for C.
leucogaster. During the last glacial maximum, 18,000 years ago, C. leucogaster populations may
have retreated into the northwestern refugium and subsequently extended their geographical range
southwards along the western portion of Madagascar.
Origin of C. leucogaster populations on Madagascar
Current fossil records for mammals do not extend much earlier than the late Cretaceous/early
Paleocene (Alroy 1999; Foote et al., 1999). For most bat species the fossil record is insufficient; this
poses a problem in determining the origin and dispersal patterns of bat species (Jones et al., 2005).
84
Determining the population structure of bats at macrogeographic level aids in resolving patterns of
dispersal and colonization (Burland and Worthington-Wilmer, 2001; Abbott and Double, 2003).
According to Russell et al. (2006) the theories that relate to the origin of Malagasy fauna involve
biogeographical scenarios of dispersal because the isolation of Madagascar from the African
mainland (165 Mya) occurred before the evolution of Chiropterans (71 - 58 Mya). Some species
may have arrived via aerial dispersal from the neighboring landmasses (Steven and Heesy, 2006).
According to Goodman and Cardiff (2004), “members of the genus Chaerephon are capable of
dispersal over water and subsequent colonization and speciation on distant oceanic islands”. Island
hopping was suggested to have occurred across the Mozambique Channel during the uplift along
the Davie Ridge in the Channel (Forster, 1975; Houle, 1998; Wells, 2003).
The results from this study of cytochrome b and D-loop data indicate that C. leucogaster from
Madagascar, Mayotte and Pemba form a single, genetically rather uniform group, which is
consistent with suggestions that large bodies of water such as the Mozambique Channel (minimum
300 km wide) are not a significant barrier to dispersal and hence gene flow of C. leucogaster
between Madagascar, the Comoros, Pemba, and, it would seem, mainland Africa, approximately 20
km distant from Pemba. Although molossid bats appear capable of crossing large expanses of water,
the frequency with which this happens is not clear.
Most species that are found on Madagascar and other islands in the western Indian Ocean are
suggested to have African origins (Yoder et al., 2004; Vences et al., 2004; Rabinowitz and Woods,
2006; Ratrimomanarivo et al., 2008; Lamb et al., 2008; Ratrimomanarivo et al., in press). The
Malagasy population of Mops leucostigma is suggested to have been derived from African stock of
M. condylurus, and to have been sufficiently isolated for speciation to have occurred
(Ratrimomanarivo et al., 2008). A study done by Russell et al. (2006) found that phylogenies of the
genus Triaenops are paraphyletic with respect to the African species. They suggested that there
were two dispersal events between Africa and Madagascar.
Certain bat species show evidence of relatively recent migration from founder populations in
Africa. The Malagasy and African populations of Mops midas show little morphological or genetic
variation, which suggests that there is some recent or regular gene flow between them
(Ratrimomanarivo et al., 2007). A study conducted by Taylor et al. (in press), shows paraphyly in
85
C. pumilus from southern Africa and C. leucogaster, thus also supporting the findings of possible
and regular gene flow between Africa and Madagascar. Although the current sample does not
include animals from mainland Africa, owing to lack of availability, an African origin of C.
leucogaster appears likely.
4.2 POPULATION EXPANSION Haplotype diversity and expansion coefficients values, and a unimodal mismatch distribution
indicate that populations of Chaerephon leucogaster on Madagascar may have been expanding over
the last 5 842 - 11 143 years (Table 3.6). Neutrality tests of the D-loop region also show support for
expanding C. leucogaster populations, as Fu’s (1997) Fs is significant and Fu and Li’s (1993) D*
and F* are not significant (Hingston et al., 2005; Russell et al., 2005).
According to Burney et al. (2004), human colonization of Madagascar dated back to about 2300
BP. The expansion of C. leucogaster is therefore likely to have begun before this colonization and
the construction of buildings which have been used by C. leucogaster for day roosting. This implies
that the roost sites used during the first several thousand years of the expansion were not
synanthropic, as they are today, and raises the question of what roost sites were used during the
early expansion period, although it is likely that they were natural. Burney (1997, 1999) highlighted
the change in climate and vegetation since the late Pleistocene and Holocene in Madagascar. It was
reported that the most noticeable vegetation changes occurred in the western portion of Madagascar,
where C. leucogaster is currently found. It is clear that, before the expansion of C. leucogaster,
these bats inhabited natural day roost sites (Goodman and Cardiff, 2004). The change in roosting
habitat from natural to synanthropic sites within the past hundred years may have contributed
further to the expansion of the effective population size of C. leucogaster, as well as to the possible
expansion of its range.
Although the current use of synanthropic sites as roosts by C. leucogaster may have led to an
increase in population sizes of this bat, it still is puzzling why this species abandoned the original
day roosts. In this regard it may be important that anthropogenic factors have reduced forest cover
in the lowland region of Madagascar (Green and Sussman, 1990; Smith, 1997; Harper et al., 2007).
If Chaerephon leucogaster used trees of the native forests to roost, their disappearance may have
86
influenced the population structure of this species and contributed to its migration to anthropogenic
day roost sites.
4.3 CONSERVATION IMPLICATIONS AND MANAGEMENT Islands are considered to be biodiversity ‘hotspots’ and are important in the conservation of our
global biological heritage. Madagascar is particularly rich in biodiversity and endemic taxa (Myers
et al., 2000; Ganzhorn et al., 2001; Goodman and Benstead, 2005), many of which are not well
studied. According to the current classification by the IUCN (Chiroptera Specialist Group, 2000), C.
leucogaster is ‘Data Deficient’ (DD*). This category is applied to species that are newly described
or to those for which there is insufficient research material available (Hutson et al., 2001). Based on
this study, it contributes to other body of work to alleviate the DD* status of C. leucogaster. This
study provides information on the genetic diversity of C. leucogaster populations on Madagascar,
Mayotte and Pemba, which supports morphological analysis conducted by Ratrimomanarivo et al.
(in press). It also provides evidence that C. leucogaster populations are expanding, are
geographically-structured into three different latitudinal groups on Madagascar, and that a further
genetically distinct group occurs on the islands of Pemba and Mayotte.
It is recommended that the status of this species be re-assessed today with other significant data
points. Results from genetic analyses can contribute for C. leucogaster to be considered under the
Lower Risk category. This study highlights that C. leucogaster is an expanding population and that
no rare genotypes exists that require special attention. Chaerephon leucogaster is commonly-found
within the range from which it has been collected (except at Manakara) and, in some cases, is
regarded as a ‘pest species’. Although there are genetically-distinct ‘northern’, ‘middle’ and
‘southern’ forms these are not rare genotypes which warrant special preservation. However, Pullin
(2002) indicates that all genetic lineages require preservation as together they represent the future
evolutionary potential of a species. The sample from Manakara, although morphologically similar
to western samples of C. leucogaster, and genetically identical to the most common ‘western’
haplotype, may warrant further attention owing to the unusual niche which it occupies. Samples
from Pemba and Mayotte are genetically distinct at D-loop but not cytochrome b levels, and are also
not rare.
87
The haplotypes that are found in the three latitude bands (13º S, 15º S to 17º S and 22º S to 23º S)
are possibly separated by unsuitable habitat (depending on future studies which need to sample the
gap areas extensively). Management actions should focus on the preservation of the different
classes of vegetation in these habitat zones, as phylogeographically distinct groups of C.
leucogaster may be dependent on different sets of insect species supported by different habitats (see
Crandall et al., 2000). The southwest portion of Madagascar has been shown by MaxEnt Modelling
to contain the most suitable habitat for C. leucogaster. Destruction of vegetation by slash and burn,
logging and charcoal production in such areas may negatively influence the population size and
dispersal of these bats as it may affect the availability of foods. Although C. leucogaster is
insectivorous, it is not known which insect species it feeds on, or what factors affect the prevalence
of these species. This points to the importance of initiating studies of the feeding ecology of this
species. These may establish the insect species on which these bats preferentially feed, and the
habitats in which these species are found. Depending on status, these areas may then be targets for
conservation.
Management and conservation strategies should aim to preserve adaptive diversity and evolutionary
processes across the geographic range of a species (Crandall et al., 2000). The genetic diversity that
does exist within these populations should be maintained by continuous assessment and monitoring,
particularly at established key roost sites. The availability of day roosts is not a constraint for this
species. Human colonization has resulted in the construction of buildings which are used by C.
leucogaster as day roosts and has thus allowed the expansion of this species. Bats living in
synanthropic settings can however, be affected by negative practices and perceptions on the part of
humans (Hutson et al., 2001; Mickleburgh et al., 2002; Knight, 2008). Public awareness is therefore
vital to protect synanthropic bats from destruction by practices such as fumigation, which is used to
eradicate synanthropic bats from buildings (Hutson et al., 2001). The presence of bats may also
trigger fears about the possible risk from diseases such as rabies. Other concerns from residents
include noise, smell and the accumulation of bat droppings. It is therefore, however, important to
recognize the key day roosts for this species and legislate their protection into local, regional and
national policies to prevent decline in numbers of C. leucogaster (Hutson et al., 2001).
Threats to bats are related to ignorance of the roles of these mammals in ecosystems (Hutson et al.,
2001; Mickleburgh et al., 2002). Educational campaigns need to be developed and implemented and
should ideally target the general public as well as interest groups that may influence or have an
88
impact on bat colonies. Appropriate systems need to be developed to resolve the conflicts that could
arise between humans and bats. Bat interest groups should be established to promote the
understanding and diversity of these mammals.
Madagascar is a member of a number of international agreements and treaties that protect bat
species. These conventions would be required to protect C. leucogaster through legislation.
Government organizations (i.e. SAPM) need to focus management strategies on conservation of
haplotypes of this species in Madagascar and the western Indian Ocean islands of Mayotte and
Pemba, as these identified haplotypes of C. leucogaster represent its genetic evolutionary potential.
4.4 FUTURE RESEARCH Genetic variation is an important component of biodiversity. The conservation of biodiversity
requires knowledge of the origins, distribution, dispersal and feeding behavior of mammals. This
study examined the genetic diversity of C. leucogaster from Madagascar, Mayotte and Pemba.
Results suggested that C. leucogaster can be considered a separate species from C. pumilus (east
Madagascar) and that populations on Madagascar are phylogeographically structured on the basis of
latitude. This structuring may reflect the occurrence on Madagascar of climatically- and
vegetationally-suitable regions which harbour the insects upon which C. leucogaster feeds. These
regions are likely to be separated by regions of unsuitable habitat. Further studies are essential to
understand the ecology and feeding behavior of C. leucogaster populations.
This study has focused on C. leucogaster from Madagascar (from where the type specimen
originates), Mayotte and Pemba islands. It is important that future studies include C. leucogaster
collected from the rest of its range, which extends into west-central Africa. Chaerephon leucogaster
from the study region is suggested to be a sister species to C. pumilus from Madagascar. This
scenario is likely to be more complex if C. pumilus and C. leucogaster from mainland Africa are
included in the analysis.
Nuclear DNA is able to provide substantial systematic and phylogenetic information. It is inherited
bi-parentally and so would provide more information on male-mediated gene flow and mating
systems (Ruedi and McCraken, 2006). If DNA sequencing of nuclear genes is to provide
phylogenetic and phylogeographic information relevant to this study, a region which evolves at

89
least as fast as the mitochondrial D-loop would need to be utilized (Porter et al., 2003; Hoofer et al.,
2003). Simple sequence repeats (microsatellites) are variable enough to give fine-scale information
on population and colony structure, and would provide information or male-mediated gene flow and
the potential contribution of male versus female philopatry to population and colony structure
(Kerth et al., 2002).
90
5. REFERENCES Abbott, C.L. and Double, M.C. (2003). Genetic structure, conservation genetics and evidence
of speciation by range expansion in shy and white-capped albatrosses. Molecular Ecology 12:
2953-2962.
Aellen, V. (1952). Contribution a l’etude des chiropters du Cameroun. Memoires de la Societe
Neuchateloise des Sciences Naturelles 8: 1-121.
Agapow, P.M., Bininda-Emonds O.R.P., Crandall, K.A., Gittleman, J.L., Mace, G.M., Marshal,
L J.C. and Purvis, A. (2004). The impact of species concepts on biodiversity studies. The Quarterly
Review of Biology 79: 161-179.
Alfaro, M.E., Zoller, S. and Lutzoni, F. (2003). Bayes or Bootstrap? A simulation study comparing
the performance of Bayesian Markov Chain Monte Carlo sampling and Bootstrapping in assessing
phylogenetic confidence. Molecular Biology and Evolution 20(2): 255-266.
Ali, J.R. and Aitchison, J.C. (2008). Gondwana to Asia: Plate tectonics, paleogeography and the
biological connectivity of the Indian sub-continent from the Middle Jurassic through latest Eocene
Earth-Science Reviews 88: 145-166.
Allen, J.A. (1917). The American Museum Congo expedition collection of bats. Bulletin American
Museum of Natural History 37: 405-478.
Allen, G.M. (1939). A Checklist of African Mammals. Bulletin of the Museum of Comparative
Zoology 83: 1-763.
Alroy, J. (1999). The fossil record of North American mammals: evidence for a paleocene
evolutionary radiation. Systematic Biology 48: 107-118.
91
Amr, Z.S., Abu Baker, M.A. and Qumsiyeh, M.B. (2006). Bat diversity and Conservation in Jordan.
Turkish Journal of Zoology 30: 235-244.
Andersen, K. (1907). Chiropteran notes. Annali del Museo Civico di Storia Naturale di Genova
3(3): 1-41.
Andersson, L. (1990). The driving force: species concepts and ecology. Taxon 39: 375-382.
Andreone, F., Carpenter, A.I., Cox, N., du Preez, L., Freeman, K., Furrer, S., Garcia, G., Glaw, F.,
Glos, J., Knox, D., Köhler, J., Mendelson, J.R. III., Mercurio, V., Mittermeier, R.A., Moore, R.D.,
Rabibisoa, N.H.C., Randriamahazo, H., Randrianasolo, H., Raminosoa, N.R., Ramilijaona, O.R.,
Raxworthy, C.J., Vallan, D., Vences, M., Vieites, D.R., Weldon, C. (2008). The challenge of
conserving amphibian megadiversity in Madagascar. PLoS Biology 6(5): 0943-0946.
Ansell, W.F.H. (1978). The Mammals of Zambia. The National Parks and Wildlife Service,
Chilanga. Pp 27.
Avise, J.C., Arnold, J., Ball, R.M., Bermingham, E., Lamb, T., Neigel, J.E., Reeb, C.A. and
Saunders, N.C. (1987). Intraspecific Phylogeography: The mitochondrial DNA bridge between
population genetics and systematics. Annual Review of Ecology and Systematics 18: 489-522.
Avise, J. C. and Walker, D. 1999. Species realities and numbers in vertebrates: perspectives from an
asexually transmitted genome. Proceedings of the National Academy of Science USA 96: 992-995.
Baker, R.J. and Bradley, R.D. (2006). Speciation in mammals and the genetic species concept.
Journal of Mammalogy 87(4): 643-662.
Barlow, K.E. (1997). The diets of two phonic types of the bat Pipistrellus pipistrellus in Britian.
Journal of Zoology 243: 597-609.
Baron, R. (1889-90). The flora of Madagascar. The Linnean Society of London 25: 15-29.

92
Bastian, S. T., Tanaka, K., Anunciado, R. V. P., Natural, N. G., Sumalde, A.C. and Namikawa, T.
2001. Phylogenetic relationships among megachiropteran species from the two major islands of the
Philippines, deduced from DNA sequences of the cytochrome b gene. Canadian Journal of Zoology
79: 1671-1677.
Baum, D. (1992). Phylogenetic species concepts. Trends in Ecology and Evolution 7: 1-2.
Boore, J.L. (1999). Animal mitochondrial genome. Nucleic Acids Research 27(8): 1767-1780.
Bouchard, S. (1998). Chaerephon pumilus. Mammalian Species 574: 1-6.
Bradley, R.D. and Baker, R.J. (2001). A test of the genetic species concept: Cytochrome-b
sequences and mammals. Journal of Mammalogy 84(2): 960-973.
Brosset, A. (1966). La Biologie Des Chiropters. Masson et Cie, Paris, France. Pp 237.
Brown, W.M., George Jr., M. and Wilson, A.C. (1979). Rapid evolution of animal mitochondrial
DNA. Proceedings of the National Academy of Sciences, United States of America 76(4): 1967-
1971.
Bulgarini, F., Calvario, E., Fraticelli, F., Petretti, F. and Sarrocco, S. (1998). Libro Rosso degli
Animali d’Italia Vertebrati. WWF Italia, Rome. Pp 210.
Burland, T.M., Barratt, E.M., Beaumont, M.A. and Racey, P.A. (1999). Population genetic
structure and gene flow in a gleaning bat, Plecotus auritus. Proceedings of the Royal Society
of London, Series B 266: 975-980.
Burland, T.M. and Worthington Wilmer, J. (2001). Seeing in the dark: molecular approaches
to the study of bat populations. Biological Review 76: 389-409.
Burney, D.A. (1997). Theories and facts regarding Holocene environmental change before and after
human colonization. In: Goodman, S.M. and Patterson, B.D. (eds.), Natural change and human
impact in Madagascar. Smithsonian Institution Press, Washington, DC. Pp 432.
93
Burney, D.A. (1999). Rates, patterns, and processes of landscape transformation and extinction in
Madagascar. In: MacPhee, R.D.E., Extinctions In Near Time. Kluwer Academic/Plenum, New
York. Pp 384.
Burney, D.A., Burney, L.P., Godfrey, L.R., Jungers, W.L., Goodman, S.M., Wright, H.T. and
Timothy Jull, A.J. (2004). A chronology for late prehistoric Madagascar. Journal of Human
Evolution 47: 25-63.
Burnham, K.P. and Anderson, D.R. 2002. Model selection and multimodel inference: a
practical information-theoretic approach. Springer, New York.
Carmel, Y. and Safriel, U. (1998). Habitat use by bats in a Mediterranean ecosystem in Israel-
conservation implications. Biological Conservation 84 (3): 245-250.
Carstens, B.C., Sullivan, J., Davalos, L.M., Larsen, P.A. and Pedersen, S.C. (2004). Exploring
population genetic structure in three species of Lesser Antillean bats. Molecular Ecology 13: 2557-
2566.
Castella, V., Ruedi, M., Excoffier, L., Ibanez, C., Arlettaz, R. and Hausser, J. (2000). Is the
Gibraltar Strait a barrier to gene flow for the bat Myotis Myotis (Chiroptera: Vespertilionidae)?
Molecular Ecology 9: 1761-1772.
Chiroptera Specialist Group (2000). Chaerephon leucogaster. In: IUCN 2008. 2008 IUCN Red List
of Threatened Species. www.iucnredlist.org. Accessed: 08 August 2008.
Clayton, D.A. (1982). Replication of animal mitochondrial DNA. Cell 28: 693-705.
Clayton, D.A. (1992). Structure and function of the mitochondrial genome. Journal of Inherited
Metabolic Disease 15: 439-447.
Clement, M., Posada, D. and Crandall, K.A. (2000). TCS: a computer program to estimate gene
genealogies. Molecular Ecology 9: 1657-1660.
94
Cooper, S. J. B., Reardon, T. B. and Skilins, J. 1998. Molecular systematics of Australian
rhinolophid bats (Chiroptera: Rhinolophidae). Australian Journal of Zoology 46:203-220.
Cooper, S.J.B., Day, P.R., Reardon, T.B. and Schulz, M. (2001). Assessment of species
boundaries in Australian Myotis (Chiroptera: Vespertilionidae) using mitochondrial DNA.
Journal of Mammalogy 82: 328-338.
Corbet, G.B. and Hill, J.E. (1986). A world list of mammalian species, 2nd edition. Facts on File
Publications, New York. Pp 254.
Coyne, J.A., Orr, H.A. and Futuyma, D.J. (1988). Do we need a new species concept? Systematic
Zoology 37: 190-200.
Cracraft, J. (1983). Species concept and speciation analysis. Current Ornithology 1:159-187.
Crandall, K.A. and Templeton, A.R. (1993). Empirical tests of some predictions from coalescent
theory with applications to intraspecific phylogeny reconstructions. Genetics 134: 959-969.
Crandall, K.A., Bininda-Emonds, O.R.P., Mace, G.M. and Wayne, R.K. (2000). Considering
evolutionary processes in conservation biology. Tree 15(7): 290-295.
Cretzschmar, P.J. (1826). Dysopes pumilus. In: Ruppell, E (ed.), Atlas Zu Der Reise im Nordlichen
Afrika. Senckenbergischen Naturforschende Gesellschaft, Frankfurt am Main. Pp 78.
Davalos, L.M. (2005). Molecular phylogeny of Funnel-eared bats (Chiroptera: Natalidae), with
notes on biogeography and conservation. Molecular Phylogenetics and Evolution 37: 91-103.
Ditchfield, A.D. (2000). The comparative phylogeography of Neotropical mammals: patterns of
intraspecific mitochondrial DNA variation among bats contrasted to nonvolant small animals.
Molecular Ecology 9: 1307-1318.
de Winton, W.E. (1901). Notes on bats of the genus Nyctinomus found in Africa. Annals and
Magazine of Natural History 7 (37): 36 - 42.
95
de Wit, M.J. (2003). Madagascar: Heads it’s a continent, Tails it’s an island. Annual Review of
Earth and Planetary Sciences 31: 213-248.
Dobson, G.E. (1874). On the Asiatic species of Molossidae. Journal of the Asiatic Society of Bengal
43(2): 142-144.
Dobson, G.E. (1878). Catalogue of the Chiroptera in the collection of the British Museum. British
Museum, London. Pp 567.
Dollman, G. (1908). On a collection of bats from Yola, northern Nigeria, collected by Mr. GW.
Webster. Annals and Magazine of Natural History 2(8): 545-547.
Dostie, B., Haggblade, S. and Randriamamonjy, J. (2002). Seasonal poverty in Madagascar:
magnitude and solutions. Food Policy 27: 493-518.
Efron, B., Halloran, E. and Holmes, S. (1996). Bootstrap confidence levels for phylogenetic trees.
Proceedings of the National Academy of Sciences of the United States of America 93: 7085-7090.
Eger, J.L. and Mitchell, L. (2003). Chiroptera, Bats. In: Goodman, S.M. and Benstead, J.P. (eds.),
Natural History of Madagascar. The University of Chicago Press, Chicago. Pp 1709.
Ellerman, J.R., Morrison-Scott, T.C.S. and Hayman, R.W. (1951). Checklist of Palearctic and
Indian mammals, 1758-1946. London, British Museum of Natural History. Pp 810.
Emerson, B.C. (2002). Evolution on oceanic islands: molecular phylogenetic approaches to
understanding pattern and process. Molecular Ecology 11: 951-966.
Erlich, H.A., Gelfand, D. and Sninsky, J.J. (1991). Recent advances in the Polymerase Chain
Reaction. Science 252: 1643-1651.
96
Erixon, P., Svennblad, B., Britton, T. and Oxelman, B. (2003). Reliability of bayesian posterior
probabilities and bootstrap frequencies in phylogenetics. Systematic Biology 52(5): 665-673.
Evans, B.J., Brown, R.M., McGuire, J.A., Supriatha, J., Andayani, N., Diesmos, A., Iskandar, D.,
Melnick, D.J. and Cannatella, D.C. (2003). Phylogenetics of fanged frogs: testing biogeographical
hypotheses at the interface of the Asian and Australian faunal zones. Systematic Biology 52: 794-
819.
Excoffier, L., Smouse, P.E. and Quattro, J.M. (1992). Analysis of molecular variance inferred from
metric distances among DNA haplotypes: application to human mitochondrial DNA restriction data.
Genetics 131: 479-491.
Excoffier, L., Laval, G. and Schneider, S. (2005). Arlequin version 3.0: An integrated software
package for population genetics data analysis. Evolutionary Bioinformatics Online 1:47-50.
Felsenstein, J. (1985). Confidence limits on phylogenies: An approach using bootstrap. Evolution
39: 783-791.
Felsenstein, J. and Kishino, H. (1993). Is there something wrong with the bootstrap on phylogenies?
A reply to Hillis and Bull. Systematic Biology 42: 193-200.
Fenton, M.B. (1997). Science and conservation of bats. Journal of Mammalogy 78(1): 1-14.
Fernandez-Silva, P., Enriquez, J.A. and Montoya, J. (2003). Replication and transcription of
mammalian mitochondrial DNA. Experimental Physiology 88(1): 41-56.
Fraser, D.J. and Bernatchez, L. (2001). Adaptive evolutionary conservation: Towards a unified
concept for defining conservation units. Molecular Ecology 10: 2741-2752.
Freeland, J.R. (2005). Molecular Ecology. John Wiley and Sons Ltd, United Kingdom. Pp. 388.
Freeman, P.W. (1981). A multivariate study of the family Molossidae (Mammalia: Chiroptera)
morphology, ecology, evolution. Fieldiana Zoology 57 (i-viii): 1-173.
97
Foote, M., Hunter, J.P., Janis, C.M. and Sepkoski, J.J., Jr. (1999). Evolutionary and preservational
constraints on origins of biologic groups: divergence times of eutherian mammals. Science 283:
1310-1314.
Förster, R. (1975). The geological history of the sedimentary basin of Southern Mozambique,
and some aspects of the origin of the Mozambique Channel. Palaeogeography,
Palaeoclimatology, Palaeoecology 17: 267-287.
Fu, Y.X. (1997). Statistical tests of neutrality of mutations against population growth,
hitchhiking and background selection. Genetics 147: 915–925.
Fu, Y.X. and Li, W.H. (1993). Statistical tests of neutrality of mutations. Genetics 133: 693–
709.
Gade, D.W. (1996). Deforestation and its effects in highland Madagascar. Mountain Research and
Development 16: 101-116.
Ganzhorn, J.U., Lowry, P.P. II., Schatz, G.E. and Sommer, S. (2001). The biodiversity of
Madagascar: one of the world’s hottest hotspots on its way out. Oryx 35(4): 346-348.
Gautier, L. and Goodman, S.M. (2003). Introduction to the flora of Madagascar. In: Goodman, S.M
and Benstead, J.P (eds.), The Natural History of Madagascar. University of Chicago Press,
Chicago. Pp 229-250.
Geoffroy Saint-Hilaire, E. (1813). De l'organisation et de la détermination des Nyctères, une des
familles de Chauves-souris. Annales du Musée d'Histoire naturelle de Paris 20: 11-20.
Gervais, P. (1856). Molossidae. In: Compte de Castelnau, Expedition dans les parties centrals de l’
Amerique du Sud, Zoologie (Sec. 7), 1: 2 (Mammiferes): 53 footnote.
Goodman, S.M. (2006). Hunting of microchiroptera in south-western Madagascar. Oryx 40(2):
225-228.
98
Goodman, S.M. and Benstead, J.P. (2005). Updated estimates of biotic diversity and endemism for
Madagascar. Oryx 39: 73-77.
Goodman, S.M. and Cardiff, S.G. (2004). A new species of Chaerephon (Molossidae) from
Madagascar with notes on other members of the family. Acta Chiropterologica 6(2): 227-248.
Goodman, S.M., Andriafidison, D., Andrianaivoarivelo, R., Cardiff, S.G., Ifticene, E., Jenkins,
R.K.B., Kofoky, A., Mbohoahy, T., Rakotondravony, D., Ranivo, J., Ratrimomanarivo, F.,
Razafimanahaka, J. and Racey, P.A. (2005). The distribution and conservation of bats in the dry
regions of Madagascar. Animal Conservation 8: 153-165.
Goodman, S.M., Cardiff, S.G., Ranivo, J., Russell, A.L. and Yoder, A.D. (2006). A new species of
Emballonura (Chiroptera: Emballonuridae) from the dry regions of Madagascar. American Museum
of Natural History 3538: 1-24.
Grandidier, A. (1869). Nyctinomus leucogaster. Revue et Magasin de Zoologie 21: 337.
Green, G.M. and Sussman, R.W. (1990). Deforestation history of the eastern rain forests of
Madagascar from satellite images. Science 248: 212-215.
Grubb, P., Jones, T.S., Davies, A.G., Edberg, E., Starin, E.D. and Hill, J.E. (1998). Mammals of
Ghana, Sierra Leone and the Gambia. Trendrine Press, Great Britian. Pp 263.
Gyllestein, U., Wharton, D., Josefsson, A. and Wilson, A.C. (1991). Paternal inheritance of
mitochondrial DNA in mice. Nature 352: 255-257.
Hall, T.A. (1999). BioEdit: a user-friendly biological sequence alignment editor and analysis
program for Windows 95/98/NT. Nucleic Acids Symposium Series 41: 95-98.
Happold, D.C.D. (1987). The Mammals of Nigeria. Claredon Press, Oxford. Pp 81.
99
Harper, G.J., Steininger, M.K., Tucker, C.J., Juhn, D. and Hawkins, F. (2007). Fifty years of
deforestation and fragmentation in Madagascar. Environmental Conservation 34(4): 1-9.
Hasegawa, M., Kishino, H. and Yano, T. (1985). Dating the human-ape splitting by a molecular
clock of mitochondrial DNA. Journal of Molecular Evolution 22: 160-174.
Hatt, R.T. (1928). Note sur un cheiroptere nouveau du Soudan Francais. Bulletin de la Societe
Zoologique de France 53: 374-376.
Hayashi, J.I., Tagashira, Y. and Yoshida, M.C. (1985). Absence of extensive recombination
between interspecies and intraspecies mitochondrial DNA in mammalian cells. Experimental Cell
Research 160: 387-395.
Hayman, R.W. and Hill, J.E. (1971). Order Chiroptera. In: Meester, J. and Setzer, H.W. (eds.), The
Mammals of Africa- An Identification Manual. Smithsonian Institution Press, Washington. Pp 63-
64.
Hewitt, G.M. (2000). The genetic legacy of the Quaternary ice ages. Nature 405: 907-913.
Hewitt, G.M. (2004). The structure of biodiversity – insights from molecular phylogeography.
Frontiers in Zoology 1: 4.
Hijmans, R.J., Cameron, S.E., Parra, J.L., Jones, P.G. and Jarvis, A. (2005). Very high resolution
interpolated climate surfaces for global land areas. International Journal of Climatology 25: 1965-
1978.
Hill, J.E. and Carter, T.D. (1941). The mammals of Angola, Africa. Bulletin of the American
Museum of Natural History 78: 1-211.
Hill, J.E. and Smith, J.D. (1984) Bats: A Natural History. British Museum (Natural History)
London. Pp 33-184.
100
Hillis, D.M. and Bull, J.J. (1993). An empirical test of bootstrapping as a method for assessing
confidence in phylogenetic analysis. Systematic Biology 42: 182-192.
Hillis, D.M. and Davis, S.K. (1988). Ribosomal DNA: Intraspecific polymorphism, concerted
evolution, and phylogeny reconstruction. Systematic Zoology 37(1): 63-66.
Hingston, M., Goodman, S., Ganzhorn, J.U. and Simone, S. (2005). Reconstruction of the
colonization of southern Madagascar by introduced Rattus rattus. Journal of Biogeography
32: 1549-1559.
Hoffmann, F.G. and Baker, R.J. (2001). Systematics of bats of the genus Glossophaga (Chiroptera:
Phyllostomidae) and phylogeography in G. soricina based on cytochrome-b gene. Journal of
Mammalogy 82(4): 1092-1101.
Hoffman, F.G. and Baker, R.J. (2003). Comparative phylogeography of short-tailed bats
(Carollia: Phyllostomidae). Molecular Ecology 12: 3403-3414.
Hoffmann, F.G., Owen, J.G. and Baker, R.J. (2003). mtDNA perspective of chromosomal
diversification and hybridization in Peters’ tent-making bat (Uroderma bilobatum: Phyllostomidae).
Molecular Ecology 12: 2981-2993.
Hoofer, S.R. and Van Den Bussche, R.A. (2003). Molecular phylogenetics of the chiropteran
family Vespertilionidae. Acta Chiropterologica 5 (supplement): 1-63.
Houle, A. (1998). Floating islands: a mode of long-distance dispersal for small and medium-sized
terrestrial vertebrates. Diversity and Distribution 4: 201-216.
Hoofer, S. R., Van Den Bussche, R. A. and Horáček, I. 2006. Generic status of the American
pipistrelles (Vespertilionidae) with the description of a new genus. Journal of Mammalogy 87: 981-
992.
Huelsenbeck, J.P., Ronquist, F., Nielsen, R. and Bollback, J.P. (2001). Bayesian inference of
phylogeny and its impact on evolutionary biology. Science 249: 2310-2314.
101
Hull, J.M. and Girman, D.J. (2005). Effects of Holocene climate change on the historical
demography of migrating sharp-shinned hawks (Accipiter striatus velox) in North America.
Molecular Ecology 14: 159-170.
Hulva, P., Horacek, I., Strelkov, P.P., Benda, P. (2004). Molecular architecture of Pipistrellus
pipistrellus/Pipistrellus pygmaeus complex (Chiroptera: Vespertilionidae): further cryptic species
and Mediterranean origin of the divergence. Molecular Phylogenetics and Evolution 32: 1023-1035.
Hutcheon, J. (1994). The great red island: a future for its bats? Bats 12: 10-13.
Hutson, A.M., Mickleburgh, S.P. and Racey, P.A. (2001). Global status survey and conservation
action plan: Microchiropteran bats. IUCN/SSC Chiroptera Specialist Group- Gland, Switzerland
and Cambridge, i-x, Pp. 259.
Innis, M.A., Myambo, K.B., Gelfand, D.H. and Brow, M.A. (1988). DNA sequencing with
Thermus aquaticus DNA polymerase and direct sequencing of polymerase chain
reaction-amplified DNA. Proceedings of the National Academy of Sciences 85: 9436-9440.
Irwin, D.M., Kocher, T.D. and Wilson, A.C. (1991). Evolution of the cytochrome b gene of
mammals. Journal of Molecular Evolution 32: 128-144.
Jacobs, D.S., Eick, G.N., Richardson, E.J. and Taylor, P.J. (2004). Genetic similarity amongst
phenotypically diverse little free-tailed bats, Chaerephon pumilus. Acta Chiropterologica 6(1):
13-21.
Jacobs, D.S., Eick, G.N., Schoeman, C. and Mathee, C.A. (2006). Cryptic species in an
insectivorous bat, Scotophilus Dinganii. Journal of Mammology 87(1): 161-170.
Jin, G., Nakhleh, L., Snir, S. and Tuller, T. (2007). Inferring phylogenetic networks by the
Maximum Parsimony criterion: A case study. Molecular Biology and Evolution 24(1): 324-337.
102
Jones, G., Duverge, P.L. and Ransome, R.D. (1995). Conservation biology of an endangered
species: field studies of greater horseshoe bats. Symposia of the Zoological Society of London 67:
309-324.
Jones, K.E., Bininda-Emonds, O.R.P. and Gittleman, J.L. (2005). Bats, clocks, and rocks:
diversification patterns in Chiroptera. Evolution 59: 2243-2255.
Juste, J., Ibáñez, C., Trujillo, D., Muñoz, J. and Ruedi, M. (2003). Phylogeography of
Barbastelle bats (Barbastella barbastellus) in the western Mediterranean and the Canary
islands. Acta Chiropterologica 5: 165-175.
Juste, J., Ibanez, C., Munoz, J., Trujillo, D., Benda, P., Karatas, A. and Ruedi, M. (2004).
Mitochondrial phylogeography of the long-eared (Plecotus) in the Mediterranean Palaearctic and
Atlantic islands. Molecular Phylogenetics and Evolution 31: 1114-1126.
Karol, K.G., McCourt, R.M., Cimino, M.T. and Delwiche, C.F. (2001). The closest living relatives
of land plants. Science 294: 2351-2353.
Kawai, K., Nikaido, M., Harada, M., Matsumura, S., Lin, L-K., Wu, Y., Hasegawa, M., and
Okada, N. 2003. The status of the Japanese and East African bats of the genus Myotis
(Vespertilionidae) based on mitochondrial sequences. Molecular Phylogenetics and Evolution 28:
297-307
Kerth, G., Safi, K. and König, B. (2002). Mean colony relatedness is a poor predictor of
colony structure and female philopatry in the communally breeding Bechstein’s bat (Myotis
bechsteini). Behaviour Ecology and Sociobiology 52: 203-210.
Kiefer, A. and Veith, M. (2001). A new species of long eared bat from Europe.
(Chiroptera:Vespertilionidae). Myotis 39: 5-16.
King, T.L. and Burke, T. (1999). Special issue on gene conservation: identification and
management of genetic diversity. Molecular Ecology 8(s1): S1-S3.
103
Knight, A.J. (2008). “Bats, snakes and spiders, Oh my!” How aesthetic and negativistic attitudes,
and other concepts predict support for species protection. Journal of Environmental Psychology 28:
94-103.
Knowles, L.L. (2008). Why does a method that fails continue to be used? Evolution 62: 2713-2717.
Kocher, T.D., Thomas, W.K., Meyer, A., Edwards, S.V., Paabo, S., Villablanca, F.X. and Wilson,
A.C. (1989). Dynamics of mitochondrial DNA evolution in animals: Amplification and sequencing
with conserved primers. Proceedings of the National Academy of Sciences of the United States of
America 86: 6196-6200.
Kolaczkowski, B. and Thornton, J.W. (2004). Performance of maximum parsimony and likelihood
phylogenetics when evolution is heterogeneous. Nature 431: 980-984.
Kondo, R., Satta, Y., Matsuura, E.T., Ishiwa, H., Takahata, N. and Chigusa, S.I. (1990). Incomplete
maternal transmission of mitochondrial DNA in Drosophila. Genetics 126: 657-663.
Koopman, K.F. (1993). Order Chiroptera. In: Wilson, D.E. and Reeder, D.M. (eds.), Mammal
Species of the World: A Taxonomic and Geographic Reference, 2nd edition. The Johns Hopkins
University Press, Baltimore. Pp. 233.
Koopman, K.F. (1994). Chiroptera: Systematics. In: Niethammer, J., Schliemann, H. and Starck, D.
(eds.), Handbook of Zoology, Volume 8. Walter de Gruyter, Berlin. Pp. 217.
Kunz, T.H. (1982). Roosting ecology. In: Kunz, T.H., Ecology of bats. Plenum Publishing
Corporation, New York. Pp 425.
Lamb, J.L., Ralph, T.M.C., Goodman, S.M., Bogdanowicz, W., Fahr, J., Gajewska, M., Bates,
P.J.J., Eger, J., Benda, P. and Taylor, P.J. (2008). Phylogeography and predicted distribution of
African-Arabian and Malagasy populations of giant mastiff bats, Otomops (Chiroptera:
Molossidae). Acta Chiropterologica 10(1): 21-40.

104
Lamb J.M., Naidoo, T., Taylor, P. J., Napier, M., Ratrimomanarivo, F., Goodman, S.M. (2012).
Genetically and geographically isolated lineages of a tropical bat (Chiroptera, Molossidae) show
demographic stability over the late Pleistocene. Biological Journal of the Linnean Society 106: 18-
40.
Lanyon, S.M. (1987). Jackknifing and Bootstrapping: Important “New” statistical techniques for
ornithologists. Auk 104: 144-146.
Lavrenchenko, L.A., Kruskop, S.V. and Morozov, P.N. (2004). Notes on bats (Chiroptera) collected
by joint Ehiopian-Russian biological expedition with remarks on their systematics, distribution and
ecology. Bonner Zoologische Beitrage 52 (1/2): 127-147.
Legendre, S. (1984). Etude odontologique des representants actuels du groupe Tadarida,
(Chiroptera: Molossidae). Implications phylogenetiques, systematiques et zoogeographiques. Revue
Suisse de Zoologie 91: 399-442.
Lehman, H. (1967). Are Biological Species Real? Philosophy of Science 34: 157-167. Lewis-Oritt, N., Potter, C. A. and Baker, R. J. 2001. Molecular systematics of the family
Mormoopidae (Chiroptera) based on cytochrome b and recombination activating gene 2 sequences.
Molecular Phylogenetics and Evolution 20: 426-436.
Li, G., Jones, G., Rossiter, S. J., Chen, S-F., Parsons, S. and Zhang, S. 2006. Phylogenetics of small
horseshoe bats from East Asia based on mitochondrial DNA sequence variation. Journal of
Mammalogy 87: 1234-1240.
Lim, B.K., Pedro, W.A. and Passos, F.C. (2003). Differentiation and species status of the
Neotropical yellow-eared bats Vampyressa pusilla and V. thyone (Phyllostomidae) with molecular
phylogeny and review of the genus. Acta Chiropterologica 5: 15-29.
Limpens, H.J.G.A. and Kapteyn, K. (1991). Bats, their behaviour and linear landscape elements.
Myotis 29: 63-71.
105
Lloyd, B.D. (2003). Intraspecific phylogeny of the New Zealand short-tailed bat Mystacina
tuberculate inferred from multiple mitochondrial gene sequences. Systematic.Biology 52(4): 460-
476.
Loew, S.S. (2000). Role of genetics in Conservation Biology. In: Ferson, S. and Burgman, M.
(eds.), Quantitative Methods for Conservation Biology. Springer-Verlag, New York. Pp. 322.
Lyons-Weiler, J. and Milinkovitch, M. C. 1997. A phylogenetic approach to the problem of
differential lineage sorting. Molecular Biology and Evolution 14: 968-975.
Mallet, J. (1995). A species definition for the Modern Synthesis. Trends in Ecology and Evolution
10: 294-299.
Marcus, R.R. (2001). Seeing the forest for the trees: integrated conservation and development
projects and local perceptions of conservation in Madagascar. Journal of Human Ecology 29: 381-
396.
Mayden, R.L. (1997). A hierarchy of species concepts: the denouement in the saga of the
species problem. In: Claridge, M.F., Dawah, H.A. and Wilson, M.R. (eds.), Species: the units
of biodiversity. Chapman and Hall, London. Pp. 381-424.
Mayr, E. (1942). Systematics and the origin of species. Columbia University Press, New York.
Mayr, E. (2000 a). A critique from the biological species concept perspective: what is a species, and
what is not? In: Wheeler, Q.D. and Meier, R. (eds.), Species concepts and phylogenetic theory: a
debate. Columbia University Press, New York. Pp. 91-100.
Mayr, E. (2000 b). The biological species concept. In: Wheeler, Q.D. and Meier, R. (eds.), Species
concepts and phylogenetic theory: a debate. Columbia University Press, New York. Pp. 15-29.
Mayer, F. and von Helversen, O. (2001). Cryptic diversity in European bats. Proceedings of the
Royal Society London Series B 268: 1825-1832.
106
McLellan, L.J. (1986). Notes on bats of Sudan. American Museum Novitates (2839), American
Museum of Natural History, New York. Pp 1-12.
Meester, J.A.J., Rautenbach, I.L., Dippenaar, N.J. and Baker, C.M. (1986). Classification of
Southern African Mammals. Transvaal Museum, Monograph No.5, Pretoria. Pp. 359.
Michaels, G.S., Hauswirth, W.W. and Laipis, P.J. (1982). Mitochondrial DNA copy number in
bovine oocytes and somatic cells. Journal of Developmental Biology 94: 246-251.
Mickleburgh, S.P., Hutson, A.M. and Racey, P.A. (2002). A review of the global conservation
status of bats. Oryx 36: 18-34.
Minten, B. and Barrett, C.B. (2008). Agricultural technology, productivity, and poverty in
Madagascar. World Development 36(5): 797-822.
Monard, A. (1939). Résultats de la mission scientifique du Dr. Monard en Guinée Portugaise 1937-
38. III. Chiroptères. Arquivos do Museu Bocage 10: 49 - 80.
Moritz, C., Dowling, T.E. and Brown, W.M. (1987). Evolution of animal mitochondrial DNA:
Relevance for Population Biology and Systematics. Annual Review of Ecology and Systematics 18:
269-292.
Moritz, C. (1994). Defining ‘evolutionary significant units’ for conservation. Trends in Ecology and
Evolution 9: 373-375.
Moritz, C. and Hillis, D. M. 1996. Molecular systematics: context and controversies. In Molecular
Systematics Second edition (eds D. M. Hillis, C. Moritz, and B. K. Mable), pp.1-13. Sinauer
Associates Inc., Massachusetts
Myers, N., Mittermeier, R.A., Mittermeier, C.G., da Fonseca, G.A.B and Kent, J. (2000).
Biodiversity hotspots for conservation priorities. Nature 403: 853-858.
107
Nabholz, B., Glemin, S. and Galtier, N. (2008). Strong variations of mitochondrial mutation rate
across mammals-the longevity hypothesis. Molecular Biology and Evolution 25(1): 120-130.
Nei, M. and Kumar, S. (2000). Molecular Evolution and Phylogenetics. Oxford University Press,
New York. Pp 333.
Nixon, K.C. and Wheeler, Q.D. (1990). An amplification of the phylogenetic species concept.
Cladistics 6: 211-223.
Nylander, J. A. A. (2004). MrModeltest v2. Program distributed by the author. Evolutionary
Biology Centre, Uppsala University.
O’Brien, S.J. (1994). A role for molecular genetics in biological conservation. Proceedings of the
National Academy of Sciences of the United States of America 91: 5748-5755.
Onarici, S.G. and Sumer, S. (2003). Protein and DNA in Systematic Biology. Turkish Journal of
Biology 27: 47-55.
Oxby, C. and Boerboom, J.H.A. (1985). Alternatives and improvements to shifting cultivation on
the east coast of Madagascar. In: Food and Agriculture Organization of the United Nations (eds.),
Changes in shifting cultivation in Africa. Rome, Italy. Pp. 109-139.
Page, R. and Holmes, E. (1998). Molecular Evolution: A phylogenetic approach. Blackwell
Publishing, USA. Pp. 346.
Pamilo, P. and Nei, M. 1988. The relationships between gene trees and species trees. Molecular
Biology and Evolution 5: 568-583.
Panchal, M. (2007). The automation of Nested Clade Phylogeographic analysis. Bioinformatics 23:
509-510.
Paterson, H.E. (1980). A comment on “mate recognition systems”. Evolution 34: 330-331.
108
Pereira, S.L. (2000). Mitochondrial genome organization and vertebrate phylogenetics. Genetics
and Molecular Biology 23(4): 745-752.
Pestano, J., Brown, R.P., Suarez, N.M., Benzal, J. and Fajardo, S. (2003). Intraspecific evolution of
Canary Island Plecotine bats, based on mtDNA sequences. Heredity 90: 302-307.
Peters, W.C.H. (1852). Naturwissenschaftliche Reise nach Mossambique, Zoologie:1. Saugethiere,
Berlin. Pp. 202.
Peterson, R.L., Eger, J.L. and Mitchell, L. (1995). Chiropteres. Faune de Madagascar. Museum
National d’Histoire Naturelle, vol.84, Paris. Pp.152-167.
Petit, E. and Mayer, F. (2000). A population genetic analysis of migration: the case of the Noctule
bat (Nyctalus noctula). Molecular Ecology 9: 683-690.
Pfenninger, M. and Schwenk, K. 2007. Cryptic animal species are homogeneously distributed
among taxa and biogeographical regions. BMC Evolutionary Biology 7 (121) doi: 10.1186/1471-
2148-7-121.
Phillips, S.J., Anderson, R.P. and Schapire, R.E. (2006). Maximum entropy modelling of species
geographic distributions. Ecological Modelling 190: 231-259.
Piaggio, A.J. and Perkins, S.L. (2005). Molecular phylogeny of North American long-eared bats
(Vespertilionidae: Corynorhinus); inter- and intraspecific relationships inferred from mitochondrial
and nuclear DNA sequences. Molecular Phylogenetics and Evolution 37: 762-775.
Porter, C.A. and Baker, R.J. (2004). Systematics of Vampyressa and related genera of Phyllostomid
bats as determined by cytochrome-b sequences. Journal of Mammalogy 85(1): 126-132.
Porter, C.A., Hoofer, S.R., Van Den Bussche, R.A., Lee, T.E. Jr. and Baker, R.J. (2003).
Systematics of round-eared bats (Tonatia and Lophostoma) based on nuclear and
mitochondrial DNA sequences. Journal of Mammalogy 84: 791-808.
109
Posada, D. and Crandall, K.A. (1998). Modeltest: testing the model of DNA substitution.
Bioinformatics 14: 817-818.
Posada, D., Crandall, K.A. and Templeton, A.R. (2000). GeoDis: A program for the cladistic nested
analysis of the geographical distribution of genetic haplotypes. Molecular Ecology 9: 487-488.
Posada, D. And Buckley, T.R. 2004. Model Selection and Model Averaging in Phylogenetics: Advantages of Akaike Information Criterion and Bayesian Approaches Over Likelihood Ratio
Tests. Systematic Biology 53: 793-808.
Pullin, A.S. (2002). Conserving the evolutionary process (a longer-term view of conservation). In:
Conservation Biology. Cambridge University Press, United Kingdom. Pp. 271-284.
Pulvers, J. N. and Colgan, D. J. 2007. Molecular phylogeography of the fruit bat genus
Melonycteris in northern Melanesia. Journal of Biogeography 34: 713-723.
Rabinowitz, P.D. and Woods, S. (2006). The Africa-Madagascar connection and mammalian
migrations. Journal of African Earth Sciences 44: 270-276.
Rafinesque-Schmaltz, C.S. (1814). Tadarida. Precis des descouvertes et travaux somiologiques:
54-55.
Rakotonandrasana, E.N. and Goodman, S.M. (2007). Bat inventories of the Madagascar offshore
islands of Nosy Be, Nosy Komba and Ile Sainte-Marie. African Bat Conservation News 12: 6-10.
Randrianandianina, B.N., Andriamahaly, L.R., Harisoa, F.M. and Nicoll, M.E. (2003). The
role of the protected areas in the management of the island’s biodiversity. In: Goodman, S.M.
and Benstead, J. (eds.), The Natural History of Madagascar. University of Chicago Press,
Chicago. Pp. 1423–1432.
110
Ratrimomanarivo, F.H., Goodman, S.M., Hoosen, N., Taylor, P.J. and Lamb, J. (2008).
Morphological and molecular variation in Mops leucostigma (Chiroptera: Molossidae) of
Madagascar and the Comoros: phylogeny, phylogeography and geographic variation. Mitteilungen
aus dem Hamburgischen Zoologischen Museum (in press*).
Ratrimomanarivo, F.H., Goodman, S.M., Stanley, W.T., Naidoo, T., Taylor, P.J. and Lamb, J. (in
press). Patterns of geographic and phylogeographic variation in Chaerephon leucogaster
(Chiroptera:Molossidae) of Madagascar and the western Indian Ocean islands of Mayotte and
Pemba. Acta Chiropterologica.
Ratrimomanarivo, F.H., Vivian, J., Goodman, S.M. and Lamb, J.M. (2007). Morphological and
molecular assessment of the specific status of Mops midas (Chiroptera: Molossidae) from
Madagascar and Africa. African Zoology 42: 237-263.
Raxworthy, C.J., Forstner, M.R.J. and Nussbaum, R.A. (2002). Chameleon radiation by oceanic
dispersal. Nature 415: 784-787.
Robin, E.D. and Wong, R. (1988). Mitochondrial DNA molecules and virtual number of
mitochondrial per cell in mammalian cells. Journal of Cell Physiology 136: 507-513.
Rodriguez, R.M. and Ammerman, L.K. (2004). Mitochondrial DNA divergence does not reflect
morphological difference between Myotis californicus and Myotis ciliolabrum. Journal of
Mammalogy 85(5): 842-851.
Rogers, A.R. and Harpending, H. (1992). Population growth makes waves in the distribution of
pairwise genetic differences. Molecular Biology and Evolution 9: 552-569.
Ronquist, F. and Huelsenbeck, J.P. (2001). MRBAYES: A Bayesian inference of phylogeny.
Bioinformatics 17: 754-755.
Rosevear, D.R. (1965). The Bats of West Africa. British Museum (Natural History), London. Pp.
418.
111
Rozas, J., Sanchez del Barrio, J.C., Messeguer, X. and Rozas, R. (2003). DnaSP, DNA
polymorphism analyses by the coalescent and other methods. Bioinformatics 19: 2496-2497.
Ruedi, M. and McCracken, G.F. (2006). Genetics and evolution: phylogeographic analysis. In:
Kunz, T.H. and Parsons, S. (eds.), Ecological and Behavioural Methods for the Study of Bats. John
Hopkins University Press, Boston.
Ruse, M. (1969). Definitions of species in biology. The British Journal for the Philosophy of
Science 20: 97-119.
Russ, J., Bennett, D., Ross, K. and Kofuky, A. (2001). A Guide to the Bats of Madagascar. Viper
Press, Glossop. Pp. 96.
Russ, J.M. and Montgomery, W.I. (2002). Habitat associations of bats in Northern Ireland:
implications for conservation. Biological Conservation 108: 49-58.
Russell, A.L., Medellín, R.A. and McCracken, G.F. (2005). Genetic variation and migration in the
Mexican free-tailed bat (Tadarida brasiliensis mexicana). Molecular Ecology 14: 2207-2222.
Russell, A.L., Ranaivo, J., Palkovacs, E.P., Goodman, S.M. and Yoder, A.D. (2006). Working at the
interface of phylogenetics and population genetics: a biogeographical analysis of Triaenops spp.
(Chiroptera: Hipposideridae). Molecular Ecology 16(4): 839-851.
Russo, D., Cistrone, L., Jones, G. and Mazzoleni, S. (2004). Roost selection by barbastelle bats
(Barbastella barbastellus, Chiroptera: Vespertilionidae) in beech woodlands of central Italy:
consequences for conservation. Biological Conservation 17: 73-81.
Ryder, O.A. (1986). Species conservation and systematics: the dilemma of subspecies. Trends in
Ecology and Evolution 1: 9-10.
Saitou, N. and Nei, M. (1987). The Neighbor-Joining Method: A new method for reconstructing
phylogenetic trees. Molecular Biology and. Evolution 4(4): 406-425.
112
Savage, J.M. (1995). Systematics and the biodiversity crisis. Bioscience 45: 673-679.
Schlaepfer, M.A., Hoover, C. and Dodd, C.K., Jr. (2005). Challenges in evaluating the impact of the
trade in amphibians and reptiles on wild populations. Bioscience 55(3): 256-264.
Schober, W. (1984). The Lives of Bats. Croom Helm Ltd, London. Pp. 25-174. Simmons, N.B. (2005). Order Chiroptera. In: Wilson, D.E. and Reeder, D.M. (eds.), Mammal
Species of the World: A Taxonomic and Geographic Reference, 3rd edition. The John Hopkins
University Press, Baltimore. Pp.434-435.
Simpson, G.G. (1961). Principles of Animal Taxonomy. Columbia University Press, New York.
Pp.247.
Sluys, R. and Hazevoet, C.J. (1999). Pluralism in species concepts: dividing nature at its diverse
joints. Species Diversity 4: 243-256.
Smith, A.P. (1997). Deforestation, fragmentation, and reserve design in western Madagascar. In:
Laurance, W.F. and Bierregaard, R.O.W. Jr., (eds.), Tropical Forest Remnants: Ecology,
Management, and Conservation of Fragmented Communities. The University of Chicago Press,
Chicago. Pp 632.
Stadelmann, B., Jacobs, D.S., Schoeman, C. and Ruedi, M. (2004). Phylogeny of African Myotis
bats (Chiroptera, Vespertilionidae) inferred from cytochrome b sequences. Acta Chiropterologica
6(2): 177-192.
Stadelmann, B., Herrera, L. G., Arroyo-Cabrales, J., Flores-Martinez, J. J., May, B. P., and Ruedi,
M. 2004. Molecular systematics of the fishing bat Myotis (Pizonyx) vivesi. Journal of Mammalogy
85: 133-139.
Stadelmann, B., Lin, L.-K., Kunz, T. H., and Ruedi, M. 2007. Molecular phylogeny of New World
Myotis (Chiroptera: Vespertilionidae) inferred from mitochondrial and nuclear DNA genes.
Molecular Phylogenetics and Evolution 43: 32-48
113
Stanley, W.T. (in press). A new species of Mops (Molossidae) from Pemba Island, Tanzania. Acta
Chiropterologica.
Stearns, S.C. and Hoekstra, R.F. (2000). Evolution: An Introduction. Oxford University Press,
Oxford. Pp. 381.
Stevens, N.J. and Heesy, C.P. (2006). Malagasy primate origins: Phylogenies, fossils, and
biogeographic reconstructions. Folia Primatologica 77: 419-433.
Stiles, D. (1998). The Mikea Hunter-gatherers of southwest Madagascar: Ecology and
socioeconomics. African Study Monographs 19(3): 127-148.
Strimmer, K. and Haeseler, A. (2003). Nucleotide substitution models. In: Salemi, M. and
Vandamme, A. (eds.), The Phylogenetic Handbook: A Practical Approach to DNA and Protein
Phylogeny. Cambridge University Press, New York. Pp.72-85.
Styger, E., Rakotondramasy, H.M., Pfeffer, M.J., Fernandes, E.C.M. and Bates, D.M. (2007).
Influence of slash-and-burn farming practices on fallow succession and land degradation in the
rainforest region of Madagascar. Agriculture, Ecosystems and Environment 119: 257-269.
Sudman, P.D., Barkley, L.J. and Hafner, M.S. 1994. Familial affinity of Tomopeas ravus
(Chiroptera) based on protein electrophoretic and cytochrome b sequence data. Journal of
Mammalogy 75: 365-377.
Swofford, D.L. (2002). PAUP*: phylogenetic analysis using parsimony (*and other methods),
version 4.0b10. Sinauer Associates, Sunderland.
Taylor, P.J., Lamb, J., Reddy, D., Naidoo, T., Ratrimomanarivo, F., Richardson, E. and Goodman,
S.M. (in press). Cryptic lineages of little free-tailed bats, Chaerephon pumilus
(Chiroptera:Molossidae) from southern Africa and the western Indian Ocean islands. African
Zoology.
114
Templeton, A.R. (1989). The meaning of species and speciation: a genetic perspective. In: Otte, E.
and Endler, J.A. (eds.), Speciation and its Consequences. Sinauer Associates, Sunderland. Pp. 3-27.
Templeton, A.R., Routman E., Phillips, C.A. (1995). Separating population structure of population
history: a cladistic analysis of the geographical distribution of mitochondrial DNA haplotypes in the
tiger salamander, Ambystoma tigrinum. Genetics. 140: 767-782.
Templeton, A.R. (1998). Nested Clade analyses of phylogeographic data: testing hypotheses about
gene flow and population history. Molecular Ecology 7: 381-397.
Templeton, A.R. (2009). Why does a method that fails continue to be used: The Answer. Evolution
63: 807-813.
Thompson, J.D., Gibson, T.J., Plewniak, F., Jeanmougin, F. and Higgins, D.G. (1997). The Clustal
X windows interface: flexible strategies for multiple sequence alignment aided by quality analysis
tools. Nucleic Acids Research 24: 4876-4882.
Tian, L., Liang, B., Maeda, K., Metzner, W. and Zhang, S. (2004). Molecular studies on the
classification of Miniopterus schreibersii (Chiroptera: Vespertilionidae) inferred from
mitochondrial cytochrome b sequences. Folia Zoologica 53(3): 303-311.
Tupinier, D. (1989). La chauve-souris et l’homme. Editiona L’Harmattan, Paris, France. Pp 218.
Vandamme, A.M. (2003). Basic concepts of molecular evolution. In: Salemi, M. and Vandamme,
A-M. (eds.), The Phylogenetic Handbook. A Practical Approach to DNA and Protein Phylogeny.
Cambridge University Press, Cambridge. Pp. 1-23.
Van de Bussche, R.A. and Baker, R.J. (1993). Molecular Phylogenetics of the New World bat
Genus Phyllostomus based on cytochrome b DNA sequence variation. Journal of Mammalogy
74(3): 793-802.
Van de Peer, Y. (2003). Phylogeny inference based on distance methods: theory. In: Salemi, M. and
115
Vandamme, A-M. (eds.), The phylogenetic handbook. A practical approach to DNA and protein
phylogeny. Cambridge University Press, Cambridge. Pp. 115-118.
Van Valen, L. (1976). Ecological species, multispecies, and oaks. Taxon 25(2/3): 233-239.
Vences, M., Kosuch, J., Rodel, M.O., Lotters, S., Channing, A., Glaw, F. and Bohme, W. (2004).
Phylogeography of Ptychadena mascareniensis suggests transoceanic dispersal in a widespread
African-Malagasy frog lineage. Journal of Biogeography 31: 593-601.
Verboom, B. (1998). The use of Edge Habitats by commuting and foraging bats. IBN Scientific
Contributions 10. DLO Institute for Forestry and Nature Research (IBN-DLO), Wageningen.
Walsh, A.L. and Harris, S. (1996). Foraging habitat preferences of vespertilionid bats in Britian.
Journal of Applied Ecology 33: 508-518.
Webb, N. J. and Tidemann, C. R. (1996). Mobility of Australian flying–foxes, Pteropus spp.
(Megachiroptera): evidence from genetic variation. Proceedings of Royal Society of London
Series B 263: 497–502.
Wells, N.A. (2003). Some hypotheses on the Mesozoic and Cenozoic paleoenvironmental history of
Madagascar. In: Goodman, S.M. and Benstead, J.P. (eds.), The Natural History of Madagascar.
University of Chicago Press, Chicago. Pp 16-34.
Whelan, S., Pietro, L. and Goldman, N. (2001). Molecular phylogenetics: state-of-the-art methods
for looking into the past. Trends in Genetics 17(5): 262-272.
Wiley, E.O. (1978). The evolutionary species concept reconsidered. Systematic Zoology 27(1):
17-26
Wilkinson, G.S. and Chapman, A.M. (1991). Length and sequence variation in evening bat D-loop
mtDNA. Genetics 128: 607-617.
116
Wilme, L., Goodman, S.M. and Ganzhorn, J.U. (2006). Biogeographic evolution of Madagascar’s
microendemic biota. Science 312: 1063-1065.
Worldclim version 1.4. http:/www.biogeo.berkely.edu/worldclim/. Accessed: 12 November 2007.
Worthington-Wilmer, J., Moritz, C., Hall, L. and Toop, J. (1994). Extreme population structuring in
the threatened ghost bat, Macroderma gigas: evidence from mitochondrial DNA. Proceedings of
the Royal Society 257: 193-198.
Xia, X., and Xie, Z. (2001). DAMBE: Data analysis in molecular biology and evolution. Journal of
Heredity. 92: 371-373.
Xia, X., Xie, Z. and Salemi, M. (2003). An index of substitution saturation and its application.
Molecular Phylogenetics and Evolution 26: 1-7.
Yoder, A.D., Burns, M.M., Zehr, S., Delefosse, T., Veron, G., Goodman, S.M. and Flynn, J.J.
(2004). Single origin of Malagasy Carnivora from an African ancestor. Nature 421: 734-737.
Yoder, A.D. and Nowak, M.D. (2006). Has vicariance or dispersal been the predominant
biogeographic force in Madagascar? Only time will tell. Annual Review of Ecology, Evolution, and
Systematics 37: 405-431.
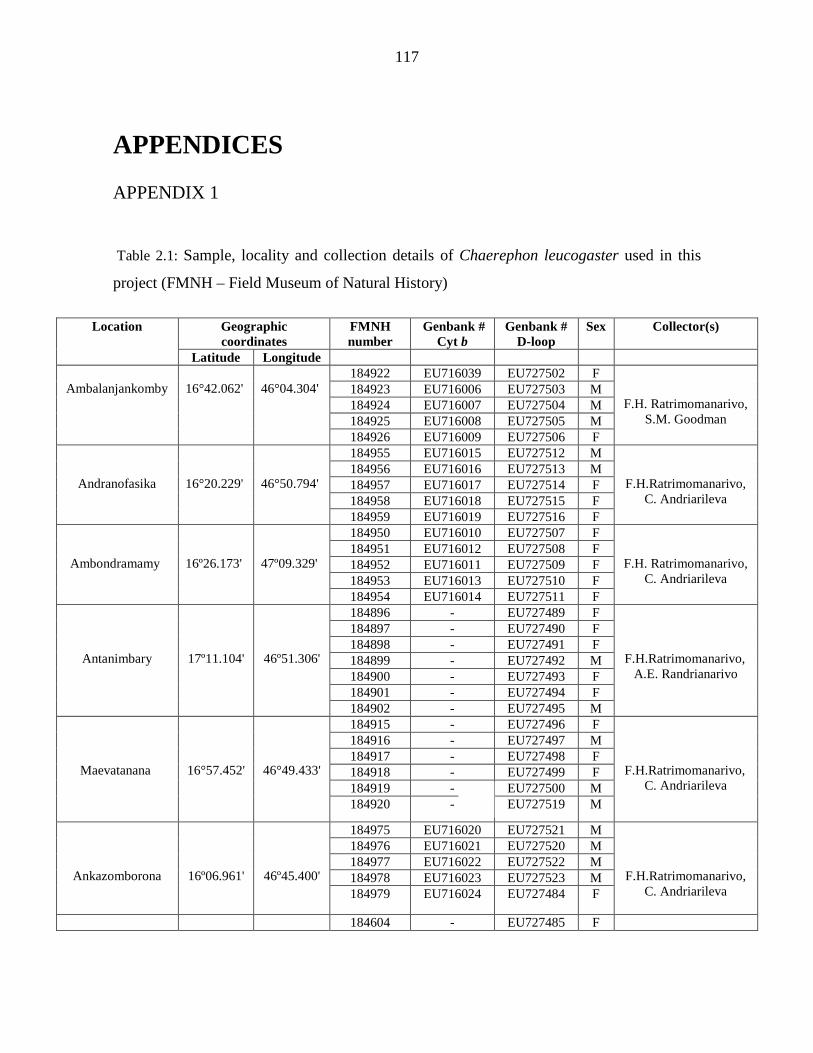
117
APPENDICES APPENDIX 1
Table 2.1: Sample, locality and collection details of Chaerephon leucogaster used in this
project (FMNH – Field Museum of Natural History)
Location Geographic
coordinates FMNH number
Genbank # Cyt b
Genbank # D-loop
Sex Collector(s)
Latitude Longitude
Ambalanjankomby 16°42.062'
46°04.304'
184922 EU716039 EU727502 F
F.H. Ratrimomanarivo, S.M. Goodman
184923 EU716006 EU727503 M 184924 EU716007 EU727504 M 184925 EU716008 EU727505 M 184926 EU716009 EU727506 F
Andranofasika
16°20.229'
46°50.794'
184955 EU716015 EU727512 M
F.H.Ratrimomanarivo, C. Andriarileva
184956 EU716016 EU727513 M 184957 EU716017 EU727514 F 184958 EU716018 EU727515 F 184959 EU716019 EU727516 F
Ambondramamy
16º26.173'
47º09.329'
184950 EU716010 EU727507 F
F.H. Ratrimomanarivo, C. Andriarileva
184951 EU716012 EU727508 F 184952 EU716011 EU727509 F 184953 EU716013 EU727510 F 184954 EU716014 EU727511 F
Antanimbary
17º11.104'
46º51.306'
184896 - EU727489 F F.H.Ratrimomanarivo,
A.E. Randrianarivo
184897 - EU727490 F 184898 - EU727491 F 184899 - EU727492 M 184900 - EU727493 F 184901 - EU727494 F 184902 - EU727495 M
Maevatanana
16°57.452'
46°49.433'
184915 - EU727496 F F.H.Ratrimomanarivo,
C. Andriarileva
184916 - EU727497 M 184917 - EU727498 F 184918 - EU727499 F 184919 - EU727500 M 184920 - EU727519 M
Ankazomborona
16º06.961'
46º45.400'
184975 EU716020 EU727521 M
F.H.Ratrimomanarivo, C. Andriarileva
184976 EU716021 EU727520 M 184977 EU716022 EU727522 M 184978 EU716023 EU727523 M 184979 EU716024 EU727484 F
184604 - EU727485 F
27
48
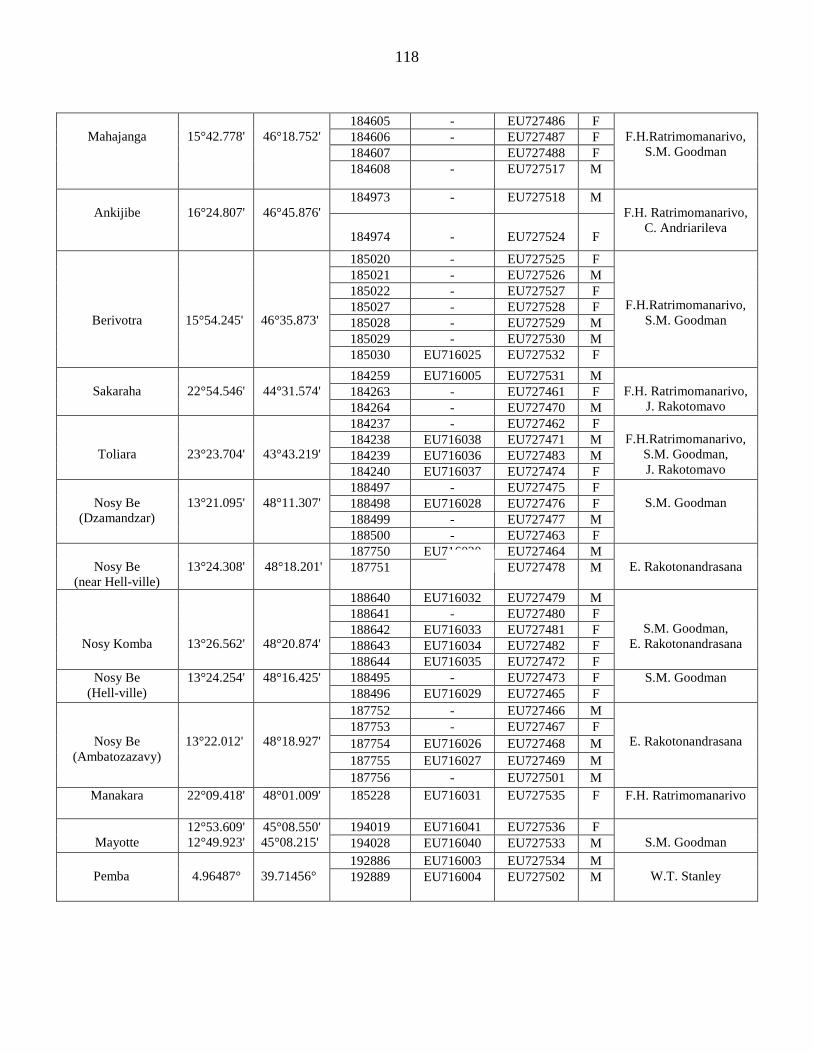
118
Mahajanga
15°42.778'
46°18.752'
184605 - EU727486 F F.H.Ratrimomanarivo,
S.M. Goodman 184606 - EU727487 F 184607 EU727488 F 184608 - EU727517 M
Ankijibe
16°24.807'
46°45.876'
184973 - EU727518 M F.H. Ratrimomanarivo,
C. Andriarileva
184974
-
EU727524
F
Berivotra
15°54.245'
46°35.873'
185020 - EU727525 F
F.H.Ratrimomanarivo, S.M. Goodman
185021 - EU727526 M 185022 - EU727527 F 185027 - EU727528 F 185028 - EU727529 M 185029 - EU727530 M 185030 EU716025 EU727532 F
Sakaraha
22°54.546'
44°31.574'
184259 EU716005 EU727531 M F.H. Ratrimomanarivo,
J. Rakotomavo 184263 - EU727461 F 184264 - EU727470 M
Toliara
23°23.704'
43°43.219'
184237 - EU727462 F F.H.Ratrimomanarivo,
S.M. Goodman, J. Rakotomavo
184238 EU716038 EU727471 M 184239 EU716036 EU727483 M 184240 EU716037 EU727474 F
Nosy Be
(Dzamandzar)
13°21.095'
48°11.307'
188497 - EU727475 F S.M. Goodman 188498 EU716028 EU727476 F
188499 - EU727477 M 188500 - EU727463 F
Nosy Be
(near Hell-ville)
13°24.308'
48°18.201'
187750 EU716030 EU727464 M E. Rakotonandrasana 187751 - EU727478 M
Nosy Komba
13°26.562'
48°20.874'
188640 EU716032 EU727479 M
S.M. Goodman, E. Rakotonandrasana
188641 - EU727480 F 188642 EU716033 EU727481 F 188643 EU716034 EU727482 F 188644 EU716035 EU727472 F
Nosy Be (Hell-ville)
13°24.254'
48°16.425'
188495 - EU727473 F S.M. Goodman 188496 EU716029 EU727465 F
Nosy Be (Ambatozazavy)
13°22.012'
48°18.927'
187752 - EU727466 M
E. Rakotonandrasana 187753 - EU727467 F 187754 EU716026 EU727468 M 187755 EU716027 EU727469 M 187756 - EU727501 M
Manakara 22°09.418' 48°01.009'
185228 EU716031 EU727535 F F.H. Ratrimomanarivo
Mayotte
12°53.609' 12°49.923'
45°08.550' 45°08.215'
194019 EU716041 EU727536 F S.M. Goodman 194028 EU716040 EU727533 M
Pemba
4.96487°
39.71456°
192886 EU716003 EU727534 M W.T. Stanley 192889 EU716004 EU727502 M
28 29
27
28
49 50
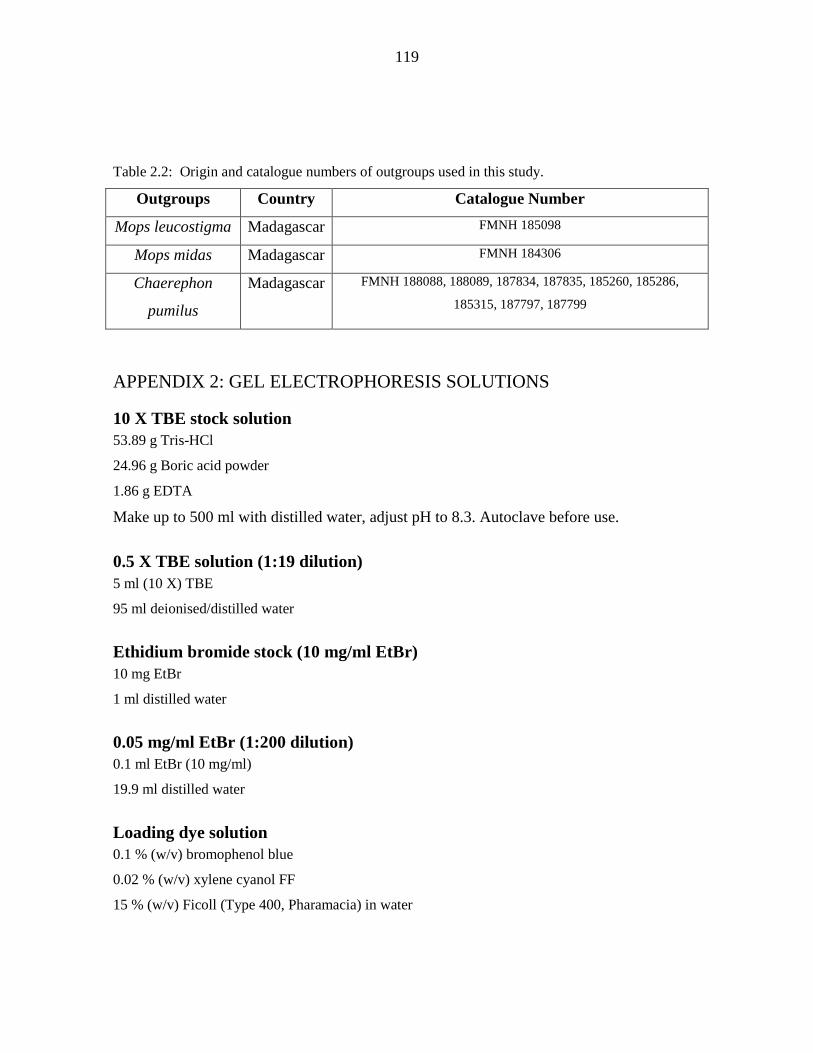
119
Table 2.2: Origin and catalogue numbers of outgroups used in this study.
Outgroups Country Catalogue Number
Mops leucostigma Madagascar FMNH 185098
Mops midas Madagascar FMNH 184306
Chaerephon
pumilus
Madagascar FMNH 188088, 188089, 187834, 187835, 185260, 185286,
185315, 187797, 187799
APPENDIX 2: GEL ELECTROPHORESIS SOLUTIONS
10 X TBE stock solution 53.89 g Tris-HCl
24.96 g Boric acid powder
1.86 g EDTA
Make up to 500 ml with distilled water, adjust pH to 8.3. Autoclave before use.
0.5 X TBE solution (1:19 dilution) 5 ml (10 X) TBE
95 ml deionised/distilled water
Ethidium bromide stock (10 mg/ml EtBr) 10 mg EtBr
1 ml distilled water
0.05 mg/ml EtBr (1:200 dilution) 0.1 ml EtBr (10 mg/ml)
19.9 ml distilled water
Loading dye solution 0.1 % (w/v) bromophenol blue
0.02 % (w/v) xylene cyanol FF
15 % (w/v) Ficoll (Type 400, Pharamacia) in water

120
APPENDIX 3: FLUOROMETRY SOLUTIONS
10 X TNE buffer stock solution 12.11 g Tris (100 mM)
3.72 g EDTA Na2.2H2O (10 mM)
116.89 g NaCl (2 M)
Dissolve in approximately 800 ml distilled water. Adjust pH to 7.4 with concentrated hydrochloric
acid. Made up to 1000 ml with distilled water. Autoclave and store in a dark bottle at 4 °C for up to
3 months.
Hoechst 33258 stock dye solution (1 mg/ml) 10 mg Hoechst 33258 dye
10 ml sterile H2O
Stored in a dark bottle for a maximum of 6 months
Low Range Assay Solution 1 µl H 33258 stock solution (Hoeschst dye)
1 ml 10 X TNE
9 ml filtered distilled water
The assay solution was prepared fresh before use at room temperature.
Calf Thymus DNA (100 ng/µl) 12.5 µl calf thymus DNA standard (8 ng/ml)
12.5 µl 10 X TNE
75 µl distilled water
121
CHAPTER TWO Stable Pleistocene-era populations of Chaerephon pumilus
(Chiroptera: Molossidae) in south eastern Africa do not use
different echolocation calls
ABSTRACT
Our extension of the phylogenetic study of Taylor et al. (2009) on a larger, more
geographically representative sample confirmed their finding of genetically distinct
sympatric lineages of bats currently referred to as Chaerephon pumilus sensu lato (s.l.)
(Family Molossidae) in south eastern Africa. Chaerephon pumilus s.l. comprised two
cytochrome b lineages separated by a mean genetic distance of 0.7% (0.1% - 1.4%),
consistent with intraspecific variability. The C. pumilus s.l. clade was paraphyletic,
containing a nested C. leucogaster (Madagascar) clade. As well as the expected four
mitochondrial control region lineages, we identified a new strongly-supported clade from
the Durban area. Indices of diversity and neutrality, combined with a ragged multimodal
mismatch distribution, are inconsistent with demographic expansion of a single C. pumilus
s.l. population in south eastern Africa, and suggest that the control region lineages are
stable units at demographic equilibrium. Dating analyses suggest that these lineages were
established during the late Pleistocene, between 60 000 and 13 000 years ago. We found no
evidence to support our hypothesis that the sympatric genetic lineages of C. pumilus s.l. are
associated with distinct sonotypes, as Discriminant Function Analysis based on four
122
echolocation parameters could not discriminate between the four clades. We hypothesise
that the different genetic lineages may be distinguished by differences in social
communication and behaviour.
Keywords: Chaerephon pumilus, mitochondrial DNA, differentiation, cryptic species, echolocation
123
INTRODUCTION
Molecular phylogenetic techniques have proven to be a powerful tool in revealing cryptic
lineages in different biological groups (Pfenninger & Schwenk 2007) including large mammals
(Birungi & Arctander 2000; Ravaoarimanana et al. 2004; Brown et al. 2007), small mammals
(Peppers & Bradley 2000; Olson et al. 2004; Yoder et al. 2005), amphibians (Vences & Glaw 2005)
and birds (Omland et al. 2000; Brambilla et al. 2008; Towes & Irwin 2008). Cryptic species may go
undetected because diagnostic features of individuals usually involve sensory modalities very
different from our own. For example, bats navigate, forage and communicate in an acoustic
environment that is largely beyond human hearing (Kingston et al. 2001). Advances in technology
to record and analyse echolocation calls have unmasked many cryptic lineages based on differences
in their calls. In southern Africa, Taylor et al. (2012) described four new species in the Rhinolophus
hildebrandtii species-complex of horseshoe bats, whose evolution has entailed adaptive shifts in
species-specific peak frequencies representing the allometric effect of adaptive divergence in skull
size. Stoffberg et al. (2012) found five geographic groups in Rhinolophus clivosus sensu lato
supported by genetic data, echolocation characteristics and wing morphology, and suggested
diversification may have been facilitated by glaciation events in the Plio-Pleistocene. Bioacoustic
information combined with genetic data have provided insight into speciation and cladogenesis
amongst many families of insectivorous bats (Russo & Jones 2000; Rydell et al. 2002; Kingston &
Rossiter 2004; Thabah et al. 2006; Ramasindrazana et al. 2011), except the Molossidae.
As classically defined, the little free-tailed bat, Chaerephon pumilus (Cretzchmar 1830-31),
is a synanthropic molossid that is widely distributed across sub Saharan Africa, extending to Arabia
(Peterson et al. 1995; Bouchard 1998; Simmons 2005). Accompanying the wide geographic
distribution is variation in morphology, including wing and pelage colour, size, degree of
development of the male aural crest and the extent of palatal emargination (Bouchard 1998; Taylor
124
et al. 1999a). This has contributed to a number of differing taxonomic designations, for C. pumilus
(Simmons 2005), which currently includes nine synonyms.
Five forms of C. pumilus have been named from the eastern and southern portions of the
African continent, namely C. limbata (Peters, 1852), C. naivashae (Hollister, 1916), C. hindei
(Thomas, 1904), C. elphicki (Roberts, 1926) and C. langi (Roberts, 1932). A further four forms
have been named from western Indian Ocean islands. Chaerephon individuals from western
Madagascar were assigned to C. leucogaster (Ratrimomanarivo et al. 2009). Two forms of C.
pumilus were found by Goodman et al. (2010) to be genetically distinct from samples of this species
originating from the type locality (Massawa, Eritrea); the eastern Malagasy form was named as a
new species, Chaerephon atsinanana, whereas C. pumilus from the western Seychelles and the
Comoros archipelago was referred to C. pusillus. A morphologically distinct Malagasy form was
found to warrant species status and named C. jobimena, (Goodman & Cardiff 2004), although more
recent molecular studies have shown this form to be too divergent to be included in Chaerephon
(Lamb et al. 2011). As our unpublished results show that C. pumilus from the southern portion of
the African continent is genetically distinct from individuals obtained from the type locality of this
species (Massawa, Eritrea) (Goodman et al. 2010), we refer to these specimens from here on as C.
pumilus sensu lato (s.l.).
There have been several studies of genetic divergence in forms of Chaerephon from
mainland Africa. Jacobs et al. (2004) found < 0.9% genetic divergence in mitochondrial
cytochrome b sequences between light-winged C. pumilus s.l. from Zambia and Tanzania and dark-
winged forms from South Africa, suggesting that these two forms are not distinct species. Taylor et
al. (2009) found genetically distinct lineages within animals currently referred to as C. pumilus s.l.
in eastern South Africa and neighbouring Swaziland. Analyses of the mitochondrial cytochrome b
and control regions show at least four clades from the greater Durban area, separated by low inter-
clade genetic distances (0.6–0.9%, cytochrome b). Two of the clades appeared to have undergone
125
Pleisocene-era population expansions 60000 – 14700 and 13000 – 3300 years before present,
lending support to the idea that these clades are independently-evolving genetic units. Interestingly,
Malagasy C. leucogaster, although morphologically distinct (Ratrimomanarivo et al. 2009), is
nested within C. pumilus s.l. from the Durban area and is separated from two clades by cytochrome
b genetic distances of 0.7% and 0.6% respectively. Taylor et al. (2009) hypothesised that the C.
pumilus s.l. clades may represent cryptic species with distinct echolocation characteristics.
The bioacoustic characteristics of C. pumilus s.l. from eastern and southern Africa are
varied. Aspetsberger et al. (2003) reported ultrasonic frequencies of 19–23 kHz, with a peak
echolocation frequency (PF) of 21.0 kHz in a population in Tanzania. Taylor (2005) recorded
similar PFs (~25 kHz) in populations from Kenya and South Africa. Echolocation frequencies are
also varied in the Durban (KwaZulu-Natal) region. Taylor (1999b) and Fenton et al. (2004) both
reported two distinct sonotypes ascribed to C. pumilus s.l. (PFs 23.9 and 16.3 kHz), and Schoeman
& Waddington (2011) recorded PFs of ~28.2 kHz at two rivers in Durban.
Our aim in this study was to investigate genetic and sensory patterns of cryptic diversity in
south eastern African C. pumilus. We examine phylogenetic structure in C. pumilus s.l. based on
published data (Taylor et al. 2009) and new cytochrome b and control region sequences, thus more
than doubling the previous sample size and expanding the geographic sampling to include a wider
area of southern and northern KwaZulu-Natal (KZN). Further, we investigated the possible
relationships between the genetic data and recorded echolocation call data to test if genetic lineages
can be identified by distinct echolocation characteristics. Finally, we examine the historical
demography of C. pumilus s.l. in this region in order to determine whether this species behaves as a
single population, or several distinct populations.
126
MATERIALS & METHODS
Study sites Individuals of Chaerephon pumilus s.l. were captured using mist nets placed at their points
of entry to and exit from house roofs and in their flight paths over rivers. The captured bats were
kept in cotton bags overnight and released the following evening where they were caught. The
South African sampling locations were (acronyms for sites and geographical coordinates in
parentheses): Chatsworth (CH, 29.930S, 30.925E), Effingham Heights (EF, 29.769S, 31.010E),
Pinetown (PNT, 29.828S, 30.866E), Umbilo River at the Umbilo Waste Water Works (UWWW,
29.846S, 30.890E), Paradise Valley (URPV, 29.831S, 30.892E), Queensburgh (QB, 29.857S,
30.899E), and the Phinda Nature Reserve situated in northern KZN (PH, 27.695S, 32.356E)
(Appendix). Genetic analyses included 35 individuals utilized by Taylor et al. (2009) and an
additional 60 individuals captured during the present study. All manipulation of living animals was
carried out in accordance with guidelines of the American Society of Mammalogists (Sikes et al.
2011) and was approved by the Animal Ethics Committee of the University of Kwa-Zulu Natal.
Tissue sampling Two biopsies of skin were taken from the membrane of each wing using a 3 mm diameter
medical biopsy punch (Wilkinson et al. 1997). Biopsies were taken from areas with no visible large
blood vessels and placed in 1.5 mL microfuge tubes containing 90% ethanol.
Molecular analysis Total genomic DNA was isolated from wing biopsies using a DNeasy® Blood and Tissue
Kit (QIAGEN Inc.). Polymerase Chain Reaction (PCR) amplifications were performed in 25 μl
volumes. Each reaction contained 9 μl DNA (3 ng μl-1), 0.8 μl sterile water, 2.5 μl 10 X reaction
buffer (Super-Therm), 4 μl 25 mM MgCl2 (Super-Therm), 0.5 μl 10 mM deoxynucleoside-
127
triphosphate mixture (dNTPs) (Fermentas), 0.2 μl Taq polymerase (5 u/μl) (Super-Therm) and 4 μl
of each primer (6 μM) (forward and reverse) per reaction.
The cytochrome b gene was PCR-amplified as two overlapping double-stranded fragments
using 2 primer pairs. The 5’ fragment was amplified using primers L14723 (5’-
ACCAATGCAATGAAAAATCATCGTT-3’) and H15553 (5’-
TAGGCAAATAGGAAATATCATTCTGGT -3’) whilst the 3’ fragment was amplified using
L15146 (5’-CATGAGGACAAATATCATTCT GAG-3’) and H15915 (5’-TCTCCATTTCTGGT
TTACAAGAC-3’) (Irwin et al. 1991). The thermal cycling parameters used were: 94°C for 4
minutes, followed by 36 cycles of (94°C for 40 s, 50°C for 45 s and 72°C for 40 s) and followed by
72°C for 10 minutes. The control region was PCR-amplified as a single fragment using primers P
(5’-TCCTACCATCAGCACCCAAAG C –3’) and E (5’- CCTGAAGTAGGAACCAGA TG -3’)
(Wilkinson & Chapman 1991). The thermal cycling parameters used were: 94°C for 4 minutes,
followed by 40 cycles of (94°C for 1 minute, 55°C for 1.30 minutes and 72 °C for 2 minutes) and
followed by 72 °C for 7 minutes.
Target fragments were purified from excised gel bands using the ZymoClean Gel
Extraction Kit (Zymogen Inc.) and sequenced at Inqaba Biotechnical Industries, Hatfield, Pretoria,
South Africa.
Sequences were aligned using the CLUSTAL W option (Thompson et al. 1994) in BioEdit
v 5.0.9 (Hall 1999) and by visual inspection. Aligned sequences were cut to a common length of
306 base pairs (bp) for the control region, 830 base pairs for cytochrome b and 1178 base pairs for
the concatenated cytochrome b – control region dataset. Sequences were deposited in GenBank
(Appendix).
128
Sequence analysis
DnaSP 5.10 (Librado & Rozas 2009) was used to generate haplotype data files from the
cytochrome b and control regions. The genetic results are presented as haplotype trees for the
cytochrome b and control region datasets. jModelTest (Posada 2008) was used to select the most
appropriate model of nucleotide substitution under the AIC criterion. The model selected for all
datasets was the HKY sequence-evolution model (Hasegawa et al. 1985) with invariant sites
(HKY+I). Maximum parsimony (MP) and neighbour-joining (NJ) trees were generated using
PAUP* 4.0 (Swofford 2002). Nodal support of the MP and NJ trees was estimated by bootstrap
resampling analysis using 1000 pseudoreplicates.
Bayesian analysis was implemented in MrBayes version 3.1.2 (Ronquist & Huelsenbeck
2001). Four Markov chains were run (three hot and one cold) for 15 million generations, and the
first 500 000 trees were discarded as burn-in. The priors for the five active parameters were:
transition/transversion ratio = Beta (1.00, 1.00), state frequency = dirichlet (1,1,1,1), proportion of
invariant sites = uniform (0.00, 1.00), topology = all topologies equally probable a priori, and
branch lengths were unconstrained = exponential (10.0). The phylograms were 50% majority-rule
consensus trees with nodal support indicated as posterior probabilities. Chaerephon atsinanana,
Mops leucostigma and M. midas were used as outgroups (Appendix).
Population genetic analyses
The control region dataset was used for population genetic analyses as it is more variable
than the cytochrome b gene. Analyses were carried out in DnaSP to determine haplotype and
nucleotide diversity values and neutrality test statistics (Fs and Fu & Li’s [1993] D* and F* (Fu
1997)). Mismatch distribution analysis was used to examine the mutational profile of the C. pumilus
s.l. samples from south eastern Africa, and to determine whether they behave as a single overall
population, and if so, whether it is expanding. Past population sizes were also estimated using a
129
Bayesian skyline plot, implemented in BEAST v.1.5.4 (Drummond et al. 2005). The number of
grouped intervals (m) was set to five and the prior to 4E-4. The chains were run for 10 000 000
generations, sampling once per 1000 iterations. The Bayesian skyline plot was created using Tracer
v.1.5 (Rambaut & Drummond 2009).
Molecular dating analysis
A time-scale for the divergence of C. pumilus s.l. clades was calculated using Bayesian
inference as implemented in BEAST version 1.5.4 (Drummond & Rambaut 2010) with the 307bp
control region alignment. The substitution model was set to HKY with a gamma distribution of rate
heterogeneity. The analysis consisted of 50 million generations with a 10% burnin. A relaxed
molecular clock (uncorrelated lognormal) was employed and a Yule species prior was used to
calibrate the analysis with data for the expansion of Clade 1.1 (13000 – 3300 years before present
(BP); Taylor et al. 2009). Time estimates were calculated based on an XML file from BEAST in
TreeAnnotator version 1.5.4 (Drummond & Rambaut 2010). The dated tree was then viewed and
edited in FigTree v.1.3.1. The Bayesian skyline plot was based on a mutation rate of 1.73 x 10⁻⁷
mutations per site per generation.
Network analysis
Statistical parsimony haplotype networks were constructed for the cytochrome b and
control region datasets in TCS (Clement et al. 2000). The program implements the estimation of
gene genealogies from DNA sequences as described by Templeton et al. (1992).
Echolocation and body size
Body mass was measured to the nearest 0.5 g using a Pesola scale. Forearm length was
measured using digital callipers (to the nearest 0.1 mm). Echolocation calls of 36 captured bats were
recorded directly onto a laptop computer (Hewlett Packard Pavilion 6210 notebook) connected to an
130
Avisoft Ultrasound 116 bat detector (Avisoft Bioacoustics, Berlin, Germany) as they were hand-
released back into open habitat. The sampling rate was set at 500 000 Hz (16 bits, mono) with a
threshold of 16. Bats were released at dusk the day after capture and followed for as long as
possible after release to ensure that the search-phase calls were recorded (O’Farrell et al. 1999).
Peak echolocation frequency (PF in kHz), maximum frequency (Fmax in kHz) and
minimum frequency (Fmin in kHz) were measured from the power spectrum (Obrist 1995). Fmax
and Fmin were measured at ± 18 dB from the peak frequency on the power spectrum, call duration
(Dur in ms) was measured from the time amplitude display (Biscardi et al. 2004), and bandwidth
(BW in kHz) was the difference between Fmax and Fmin (Fullard et al. 2003). To avoid
pseudoreplication, a single high quality search-phase call was selected on the basis of a high signal
to noise ratio (bat signal at least three times stronger than background noise).
Statistical analyses
SPSS, version 19.0 (SPSS Inc. 2010) was used for statistical analysis. Data were screened
for normality using the Kolmogorov-Smirnov test (Dytham 2003; all P> 0.2). A t-test was
performed to check for sexual dimorphism. A multivariate ANOVA (MANOVA) and post-hoc
Tukey’s tests were performed to identify differences in bioacoustic variables among the four south
eastern African C. pumilus s.l. lineages. In order to determine whether these lineages showed
distinct echolocation characteristics, Discriminant Function Analysis (DFA) was used on PF, Dur,
BW, Fmin and Fmax. The parameters were set to ‘all groups equal’ within the prior probabilities to
circumvent the problem of unequal sample sizes.
131
RESULTS
Genetic analysis
We present three trees illustrating the phylogenetic structure of Chaerephon pumilus s.l.
from south eastern Africa. Figures 1 (cytochrome b) and 2 (control region), which include present
experimental samples and samples from Taylor et al. (2009) (n = 95), are included for phylogeny
estimation. Figure 3 (concatenated cytochrome b and control region) includes 36 recently collected
samples for which echolocation data were obtained, and which are included in the Discriminant
Function Analysis. In all cases, maximum parsimony (MP), neighbour-joining (NJ) and Bayesian
inference (BI) analyses were largely congruent and are presented as single figures (Figs 1, 2 and 3)
(Nodal support ≥ 95% (BV) or 0.98 (PP) is strongly supported, ≥ 70% - 94% (BV) or ≥ 0.90 – 0.97
(pp) is well supported, < 70% (BV) or < 0.90 (pp) is weakly supported). In these analyses, the
Chaerephon haplotypes formed a strongly-supported monophyletic clade with respect to the Mops
outgroups; (MP - 100% bootstrap value (BV); NJ - 100% BV; BI - 1.00 posterior probability (PP)).
Chaerephon atsinanana (Madagascar) formed a sister clade to the other Chaerephon samples
included in this study; this was strongly supported (MP - 100% BV; NJ - 100% BV; BI - 1.00 PP)
in the cytochrome b (Fig. 1) and control region analyses (Fig. 2). The C. pumilus s.l. clade was
paraphyletic, containing the nested C. leucogaster Clade 2.3 (Fig. 1: MP - 97% BV; NJ - 70% BV;
BI - 0.94 (<0.98 PP) (Fig. 2: MP - 98% BV; NJ - 97% BV; BI - 0.94 (<0.98 PP)).
The aligned, trimmed cytochrome b dataset (830 bp) comprised 76 individuals and 17
haplotypes. The nucleotide diversity was 0.014 and the haplotype diversity 0.822. The C. pumilus
s.l. clade comprised well-supported subclades (Clade 2.1 and Clade 2.2; Fig. 1) (≥ 70% (BV) and ≥
0.90 (pp)). HKY+I genetic distances among C. pumilus s.l. haplotypes ranged from 0.1% to 1.4%
(Table 1). The mean genetic distance between C. pumilus s.l. clades (1, 2.1 and 2.2) was 0.7%
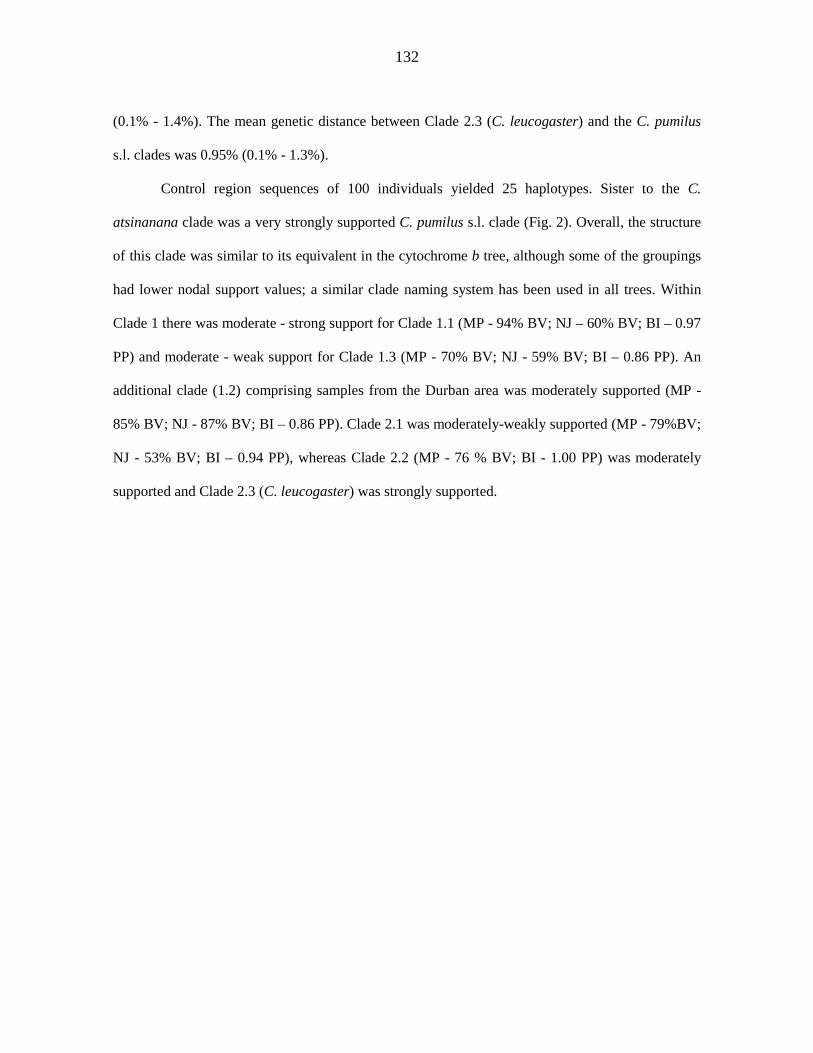
132
(0.1% - 1.4%). The mean genetic distance between Clade 2.3 (C. leucogaster) and the C. pumilus
s.l. clades was 0.95% (0.1% - 1.3%).
Control region sequences of 100 individuals yielded 25 haplotypes. Sister to the C.
atsinanana clade was a very strongly supported C. pumilus s.l. clade (Fig. 2). Overall, the structure
of this clade was similar to its equivalent in the cytochrome b tree, although some of the groupings
had lower nodal support values; a similar clade naming system has been used in all trees. Within
Clade 1 there was moderate - strong support for Clade 1.1 (MP - 94% BV; NJ – 60% BV; BI – 0.97
PP) and moderate - weak support for Clade 1.3 (MP - 70% BV; NJ - 59% BV; BI – 0.86 PP). An
additional clade (1.2) comprising samples from the Durban area was moderately supported (MP -
85% BV; NJ - 87% BV; BI – 0.86 PP). Clade 2.1 was moderately-weakly supported (MP - 79%BV;
NJ - 53% BV; BI – 0.94 PP), whereas Clade 2.2 (MP - 76 % BV; BI - 1.00 PP) was moderately
supported and Clade 2.3 (C. leucogaster) was strongly supported.
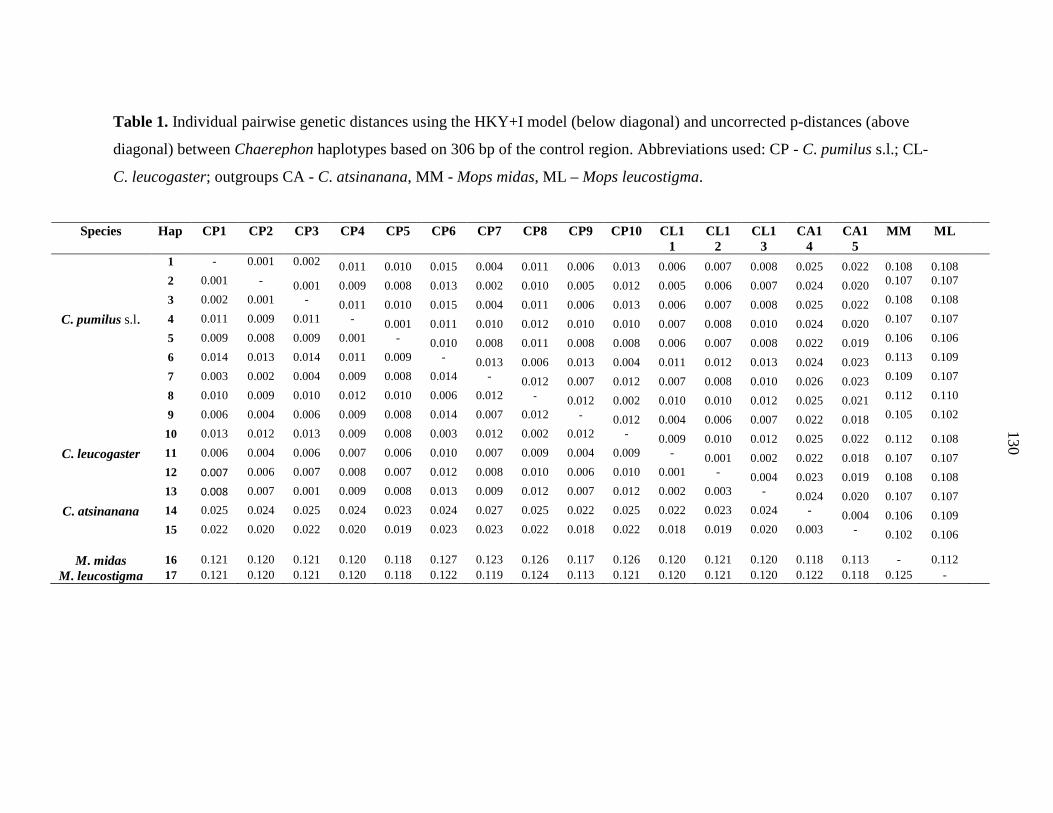
133
Table 1. Individual pairwise genetic distances using the HKY+I model (below diagonal) and uncorrected p-distances (above
diagonal) between Chaerephon haplotypes based on 306 bp of the control region. Abbreviations used: CP - C. pumilus s.l.; CL-
C. leucogaster; outgroups CA - C. atsinanana, MM - Mops midas, ML – Mops leucostigma.
Species Hap CP1 CP2 CP3 CP4 CP5 CP6 CP7 CP8 CP9 CP10 CL1
1 CL1
2 CL1
3 CA1
4 CA1
5 MM ML
C. pumilus s.l.
1 - 0.001 0.002 0.011 0.010 0.015 0.004 0.011 0.006 0.013 0.006 0.007 0.008 0.025 0.022 0.108 0.108 2 0.001 - 0.001 0.009 0.008 0.013 0.002 0.010 0.005 0.012 0.005 0.006 0.007 0.024 0.020 0.107 0.107 3 0.002 0.001 - 0.011 0.010 0.015 0.004 0.011 0.006 0.013 0.006 0.007 0.008 0.025 0.022 0.108 0.108 4 0.011 0.009 0.011 - 0.001 0.011 0.010 0.012 0.010 0.010 0.007 0.008 0.010 0.024 0.020 0.107 0.107 5 0.009 0.008 0.009 0.001 - 0.010 0.008 0.011 0.008 0.008 0.006 0.007 0.008 0.022 0.019 0.106 0.106 6 0.014 0.013 0.014 0.011 0.009 - 0.013 0.006 0.013 0.004 0.011 0.012 0.013 0.024 0.023 0.113 0.109 7 0.003 0.002 0.004 0.009 0.008 0.014 - 0.012 0.007 0.012 0.007 0.008 0.010 0.026 0.023 0.109 0.107 8 0.010 0.009 0.010 0.012 0.010 0.006 0.012 - 0.012 0.002 0.010 0.010 0.012 0.025 0.021 0.112 0.110 9 0.006 0.004 0.006 0.009 0.008 0.014 0.007 0.012 - 0.012 0.004 0.006 0.007 0.022 0.018 0.105 0.102 10 0.013 0.012 0.013 0.009 0.008 0.003 0.012 0.002 0.012 - 0.009 0.010 0.012 0.025 0.022 0.112 0.108
C. leucogaster 11 0.006 0.004 0.006 0.007 0.006 0.010 0.007 0.009 0.004 0.009 - 0.001 0.002 0.022 0.018 0.107 0.107 12 0.007 0.006 0.007 0.008 0.007 0.012 0.008 0.010 0.006 0.010 0.001 - 0.004 0.023 0.019 0.108 0.108 13 0.008 0.007 0.001 0.009 0.008 0.013 0.009 0.012 0.007 0.012 0.002 0.003 - 0.024 0.020 0.107 0.107
C. atsinanana 14 0.025 0.024 0.025 0.024 0.023 0.024 0.027 0.025 0.022 0.025 0.022 0.023 0.024 - 0.004 0.106 0.109 15 0.022 0.020 0.022 0.020 0.019 0.023 0.023 0.022 0.018 0.022 0.018 0.019 0.020 0.003 - 0.102 0.106
M. midas 16 0.121 0.120 0.121 0.120 0.118 0.127 0.123 0.126 0.117 0.126 0.120 0.121 0.120 0.118 0.113 - 0.112 M. leucostigma 17 0.121 0.120 0.121 0.120 0.118 0.122 0.119 0.124 0.113 0.121 0.120 0.121 0.120 0.122 0.118 0.125 -
130
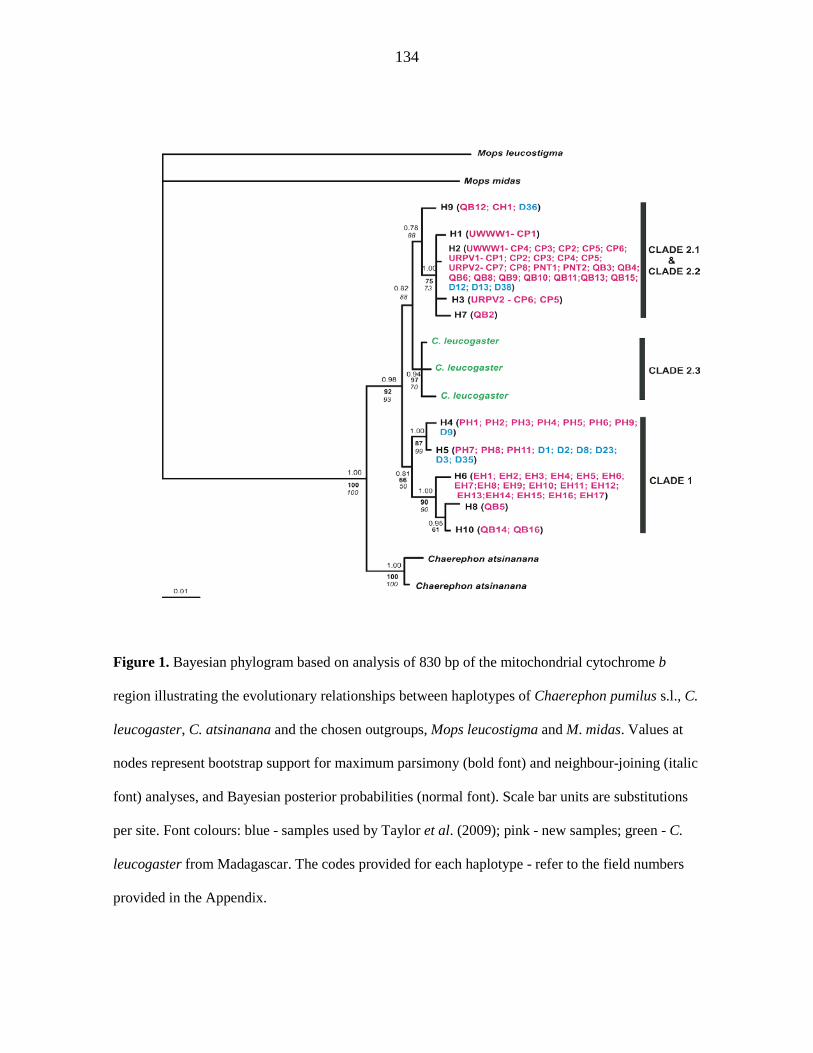
134
Figure 1. Bayesian phylogram based on analysis of 830 bp of the mitochondrial cytochrome b
region illustrating the evolutionary relationships between haplotypes of Chaerephon pumilus s.l., C.
leucogaster, C. atsinanana and the chosen outgroups, Mops leucostigma and M. midas. Values at
nodes represent bootstrap support for maximum parsimony (bold font) and neighbour-joining (italic
font) analyses, and Bayesian posterior probabilities (normal font). Scale bar units are substitutions
per site. Font colours: blue - samples used by Taylor et al. (2009); pink - new samples; green - C.
leucogaster from Madagascar. The codes provided for each haplotype - refer to the field numbers
provided in the Appendix.
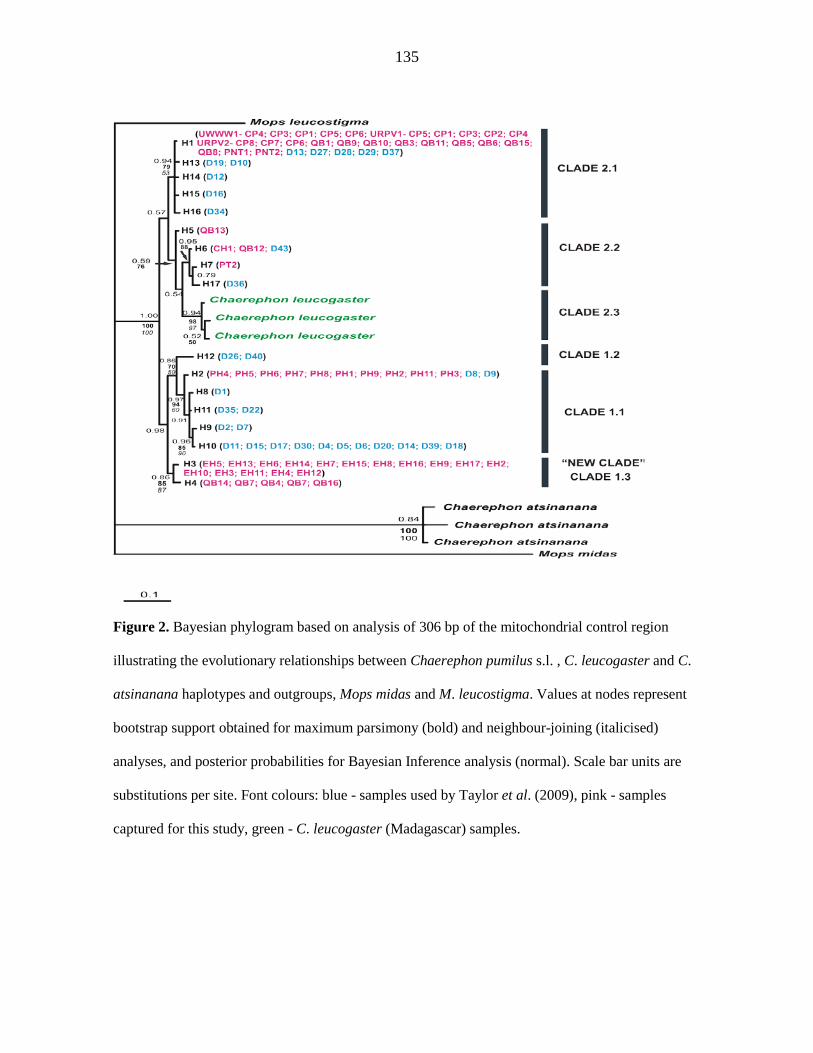
135
Figure 2. Bayesian phylogram based on analysis of 306 bp of the mitochondrial control region
illustrating the evolutionary relationships between Chaerephon pumilus s.l. , C. leucogaster and C.
atsinanana haplotypes and outgroups, Mops midas and M. leucostigma. Values at nodes represent
bootstrap support obtained for maximum parsimony (bold) and neighbour-joining (italicised)
analyses, and posterior probabilities for Bayesian Inference analysis (normal). Scale bar units are
substitutions per site. Font colours: blue - samples used by Taylor et al. (2009), pink - samples
captured for this study, green - C. leucogaster (Madagascar) samples.
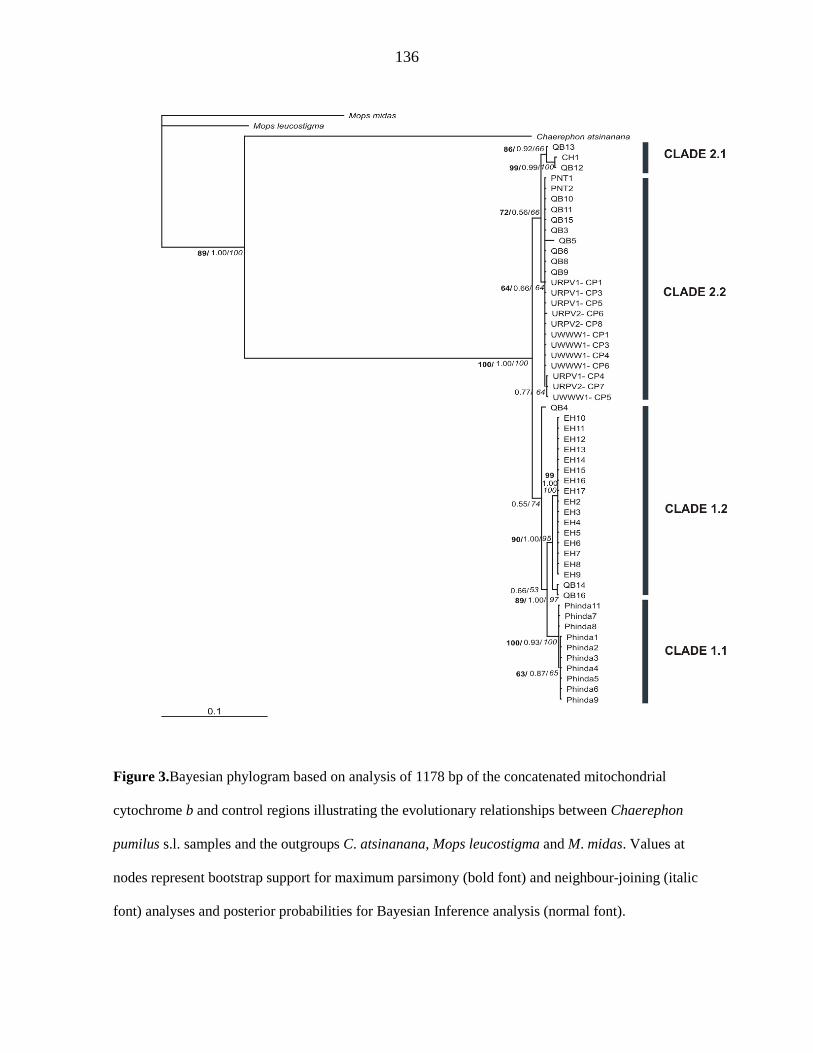
136
Figure 3.Bayesian phylogram based on analysis of 1178 bp of the concatenated mitochondrial
cytochrome b and control regions illustrating the evolutionary relationships between Chaerephon
pumilus s.l. samples and the outgroups C. atsinanana, Mops leucostigma and M. midas. Values at
nodes represent bootstrap support for maximum parsimony (bold font) and neighbour-joining (italic
font) analyses and posterior probabilities for Bayesian Inference analysis (normal font).
137
Population analyses
Analysis of 306 bp of the control region of 92 C. pumilus s.l. individuals yielded 242
variable sites of which 78 were parsimony informative. The ingroup dataset comprised 17
haplotypes; the haplotype diversity was 0.839 and nucleotide diversity 0.036. Consistent with the
expectation of an expanding population (Russell et al. 2005), Fu and Li’s (1993) F* and D* were
not significant. However contrary to this expectation, Fu and Li’s (1997) Fs was not significant
(Table 2) and the mismatch distribution was ragged. Thus overall the data were inconsistent with
the profile of an expanding population. The multimodal C. pumilus s.l. mismatch distribution (Fig.
4) was consistent with a sample that had differentiated into stable subdivisions (Rogers &
Harpending 1992). The shape of the Bayesian skyline plot indicated a constant population size from
~500 000 - ~40 000 years before present. The apparent decrease in size from ~40 000 years ago to
the present has a high degree of uncertainty in the 95% credibility range of the plot and should be
viewed with caution (Fig. 5).
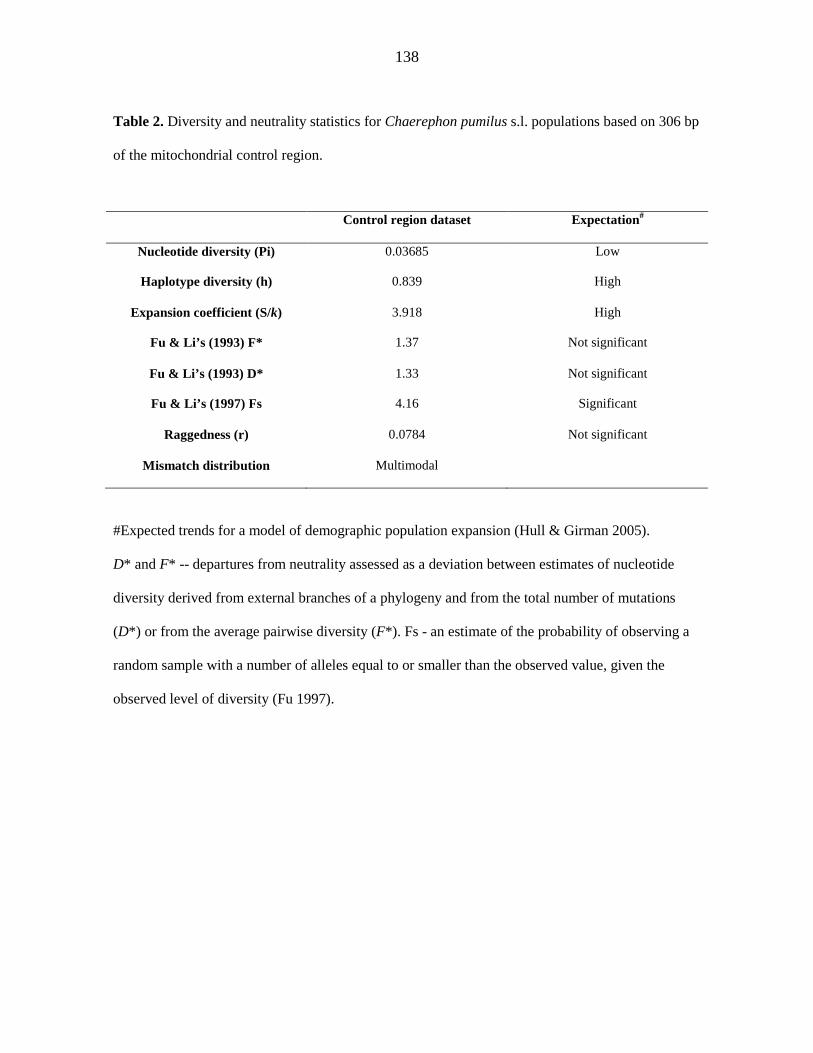
138
Table 2. Diversity and neutrality statistics for Chaerephon pumilus s.l. populations based on 306 bp
of the mitochondrial control region.
#Expected trends for a model of demographic population expansion (Hull & Girman 2005).
D* and F* -- departures from neutrality assessed as a deviation between estimates of nucleotide
diversity derived from external branches of a phylogeny and from the total number of mutations
(D*) or from the average pairwise diversity (F*). Fs - an estimate of the probability of observing a
random sample with a number of alleles equal to or smaller than the observed value, given the
observed level of diversity (Fu 1997).
Control region dataset Expectation#
Nucleotide diversity (Pi) 0.03685 Low
Haplotype diversity (h) 0.839 High
Expansion coefficient (S/k) 3.918 High
Fu & Li’s (1993) F* 1.37 Not significant
Fu & Li’s (1993) D* 1.33 Not significant
Fu & Li’s (1997) Fs 4.16 Significant
Raggedness (r) 0.0784 Not significant
Mismatch distribution Multimodal
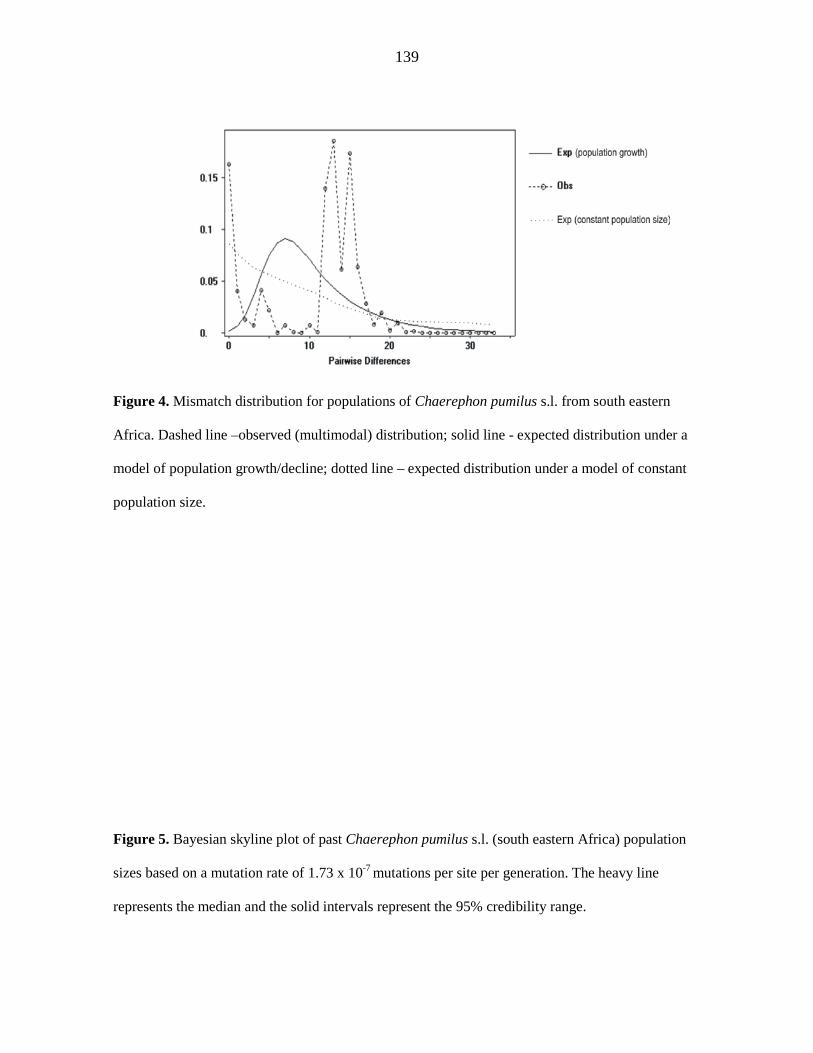
139
Figure 4. Mismatch distribution for populations of Chaerephon pumilus s.l. from south eastern
Africa. Dashed line –observed (multimodal) distribution; solid line - expected distribution under a
model of population growth/decline; dotted line – expected distribution under a model of constant
population size.
Figure 5. Bayesian skyline plot of past Chaerephon pumilus s.l. (south eastern Africa) population
sizes based on a mutation rate of 1.73 x 10⁻⁷ mutations per site per generation. The heavy line
represents the median and the solid intervals represent the 95% credibility range.
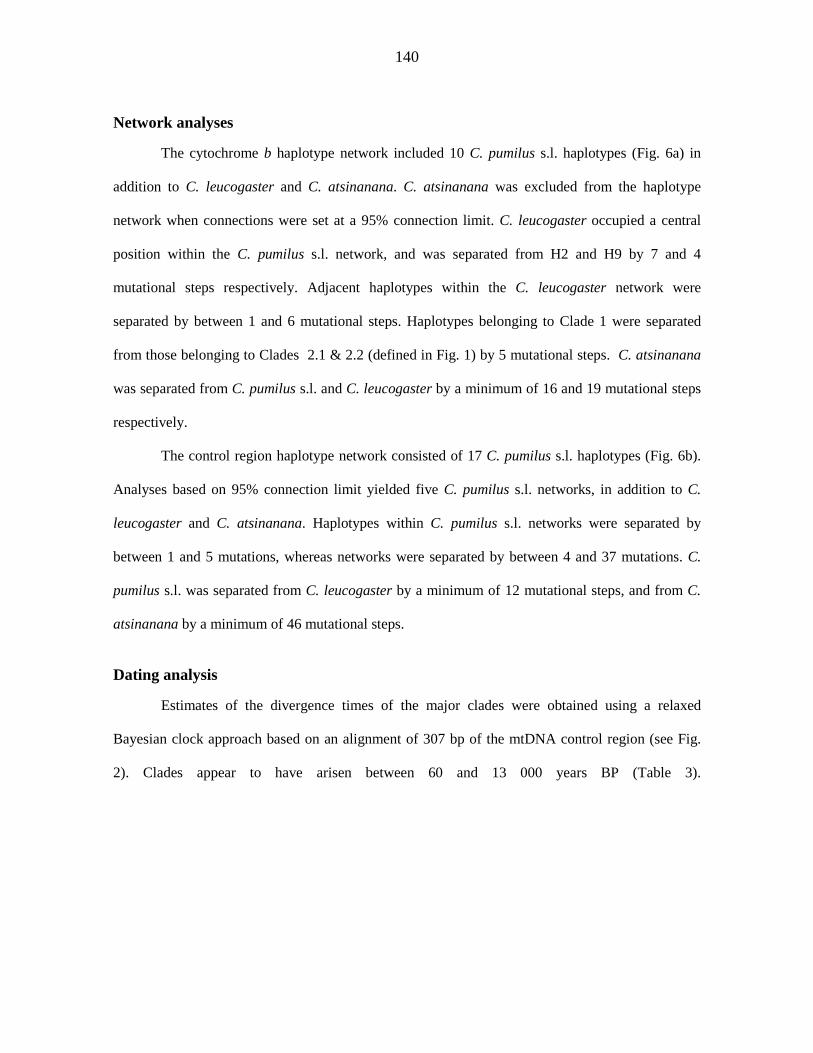
140
Network analyses
The cytochrome b haplotype network included 10 C. pumilus s.l. haplotypes (Fig. 6a) in
addition to C. leucogaster and C. atsinanana. C. atsinanana was excluded from the haplotype
network when connections were set at a 95% connection limit. C. leucogaster occupied a central
position within the C. pumilus s.l. network, and was separated from H2 and H9 by 7 and 4
mutational steps respectively. Adjacent haplotypes within the C. leucogaster network were
separated by between 1 and 6 mutational steps. Haplotypes belonging to Clade 1 were separated
from those belonging to Clades 2.1 & 2.2 (defined in Fig. 1) by 5 mutational steps. C. atsinanana
was separated from C. pumilus s.l. and C. leucogaster by a minimum of 16 and 19 mutational steps
respectively.
The control region haplotype network consisted of 17 C. pumilus s.l. haplotypes (Fig. 6b).
Analyses based on 95% connection limit yielded five C. pumilus s.l. networks, in addition to C.
leucogaster and C. atsinanana. Haplotypes within C. pumilus s.l. networks were separated by
between 1 and 5 mutations, whereas networks were separated by between 4 and 37 mutations. C.
pumilus s.l. was separated from C. leucogaster by a minimum of 12 mutational steps, and from C.
atsinanana by a minimum of 46 mutational steps.
Dating analysis
Estimates of the divergence times of the major clades were obtained using a relaxed
Bayesian clock approach based on an alignment of 307 bp of the mtDNA control region (see Fig.
2). Clades appear to have arisen between 60 and 13 000 years BP (Table 3).
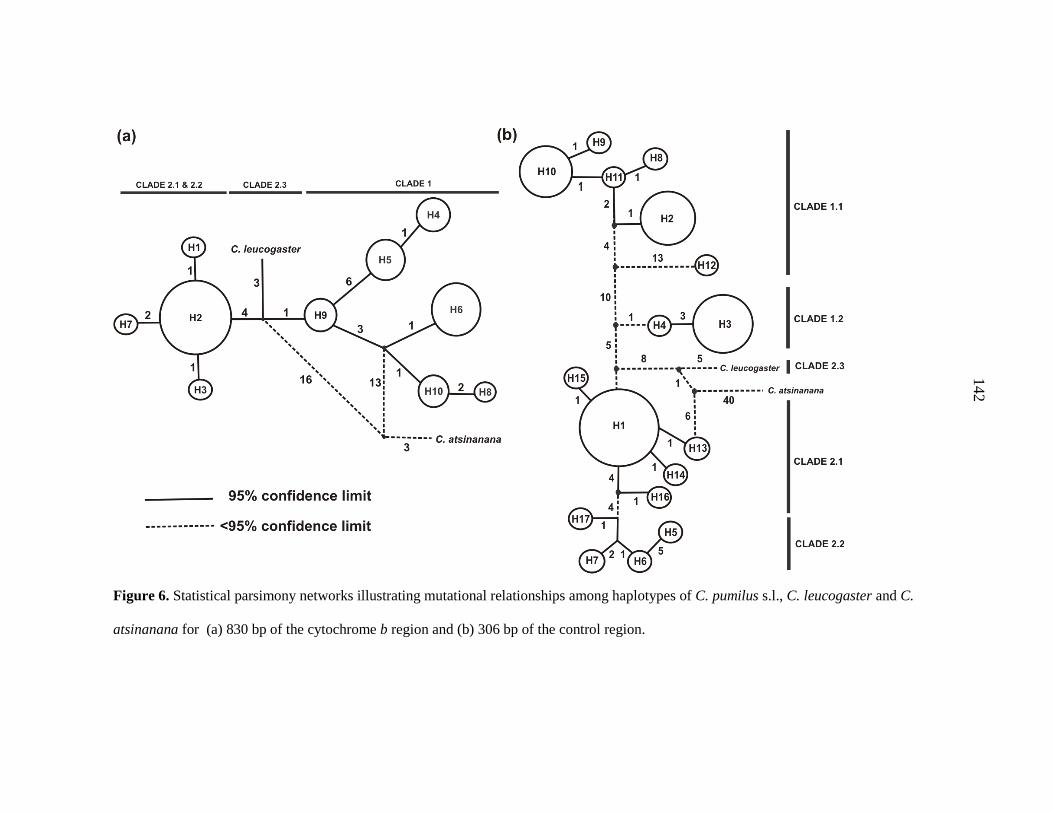
141
Figure 6. Statistical parsimony networks illustrating mutational relationships among haplotypes of C. pumilus s.l., C. leucogaster and C.
atsinanana for (a) 830 bp of the cytochrome b region and (b) 306 bp of the control region.
138
142
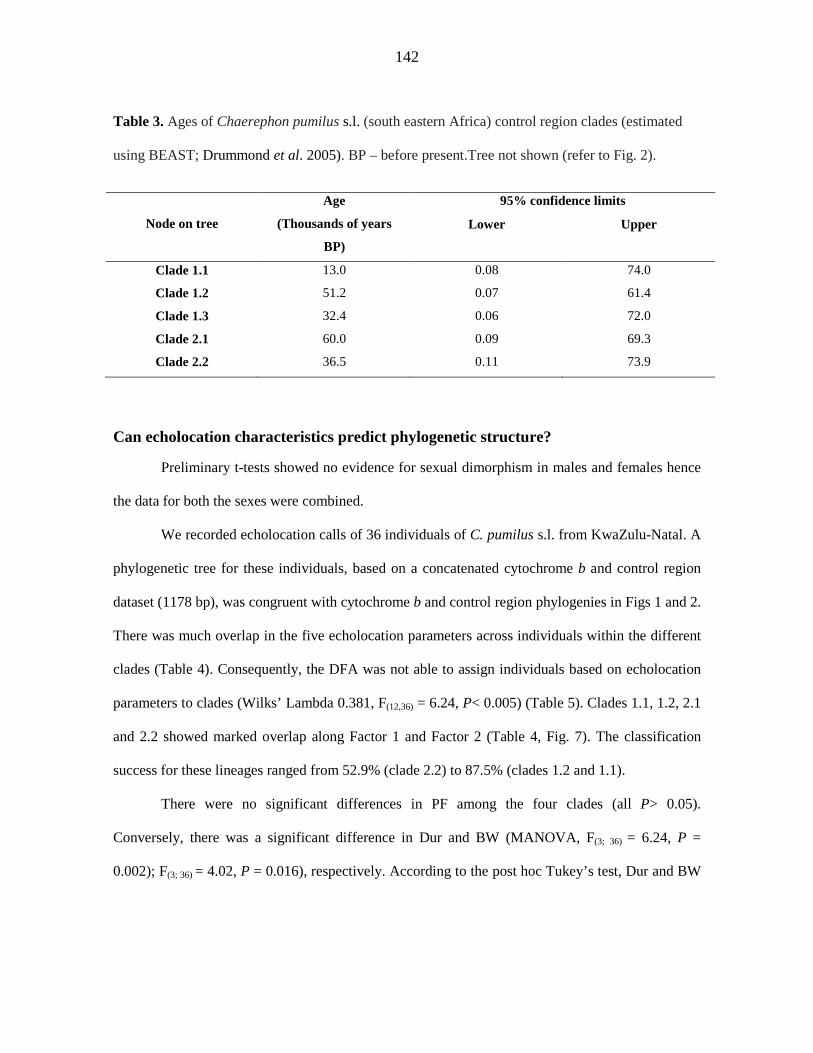
142
Table 3. Ages of Chaerephon pumilus s.l. (south eastern Africa) control region clades (estimated
using BEAST; Drummond et al. 2005). BP – before present.Tree not shown (refer to Fig. 2).
Can echolocation characteristics predict phylogenetic structure?
Preliminary t-tests showed no evidence for sexual dimorphism in males and females hence
the data for both the sexes were combined.
We recorded echolocation calls of 36 individuals of C. pumilus s.l. from KwaZulu-Natal. A
phylogenetic tree for these individuals, based on a concatenated cytochrome b and control region
dataset (1178 bp), was congruent with cytochrome b and control region phylogenies in Figs 1 and 2.
There was much overlap in the five echolocation parameters across individuals within the different
clades (Table 4). Consequently, the DFA was not able to assign individuals based on echolocation
parameters to clades (Wilks’ Lambda 0.381, F(12,36) = 6.24, P< 0.005) (Table 5). Clades 1.1, 1.2, 2.1
and 2.2 showed marked overlap along Factor 1 and Factor 2 (Table 4, Fig. 7). The classification
success for these lineages ranged from 52.9% (clade 2.2) to 87.5% (clades 1.2 and 1.1).
There were no significant differences in PF among the four clades (all P> 0.05).
Conversely, there was a significant difference in Dur and BW (MANOVA, F(3; 36) = 6.24, P =
0.002); F(3; 36) = 4.02, P = 0.016), respectively. According to the post hoc Tukey’s test, Dur and BW
Node on tree
Age
(Thousands of years
BP)
95% confidence limits
Lower Upper
Clade 1.1 13.0 0.08 74.0
Clade 1.2 51.2 0.07 61.4
Clade 1.3 32.4 0.06 72.0
Clade 2.1 60.0 0.09 69.3
Clade 2.2 36.5 0.11 73.9
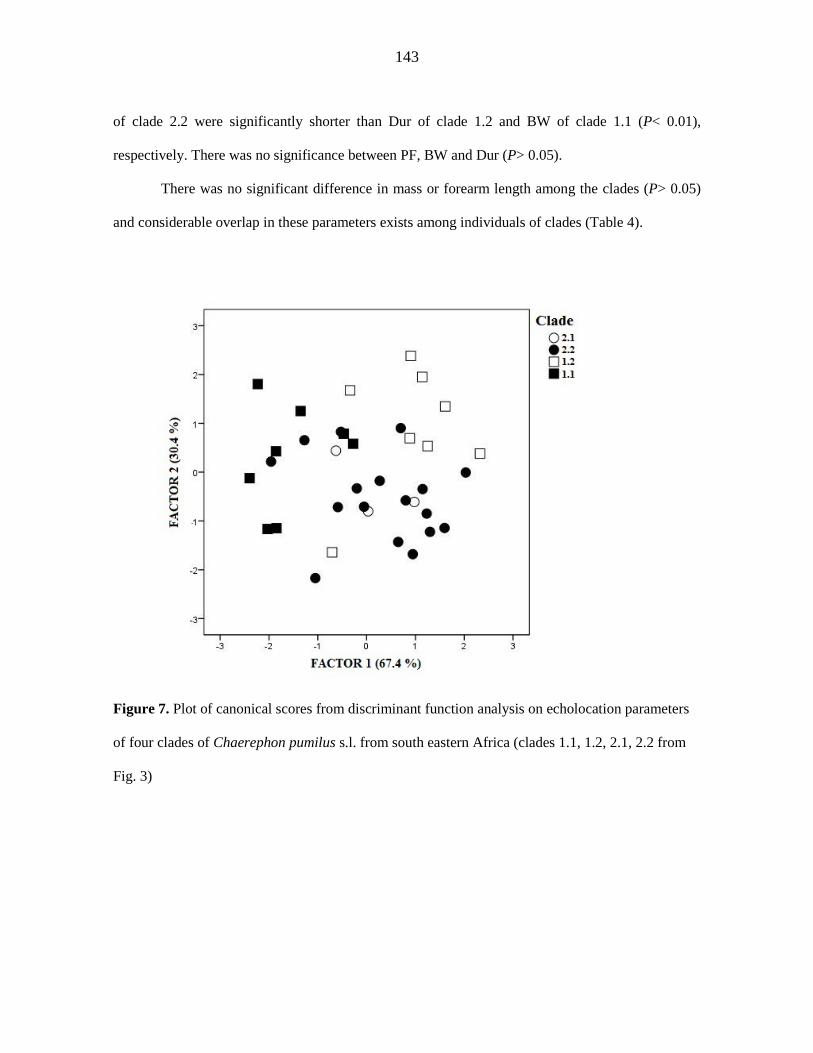
143
of clade 2.2 were significantly shorter than Dur of clade 1.2 and BW of clade 1.1 (P< 0.01),
respectively. There was no significance between PF, BW and Dur (P> 0.05).
There was no significant difference in mass or forearm length among the clades (P> 0.05)
and considerable overlap in these parameters exists among individuals of clades (Table 4).
Figure 7. Plot of canonical scores from discriminant function analysis on echolocation parameters
of four clades of Chaerephon pumilus s.l. from south eastern Africa (clades 1.1, 1.2, 2.1, 2.2 from
Fig. 3)
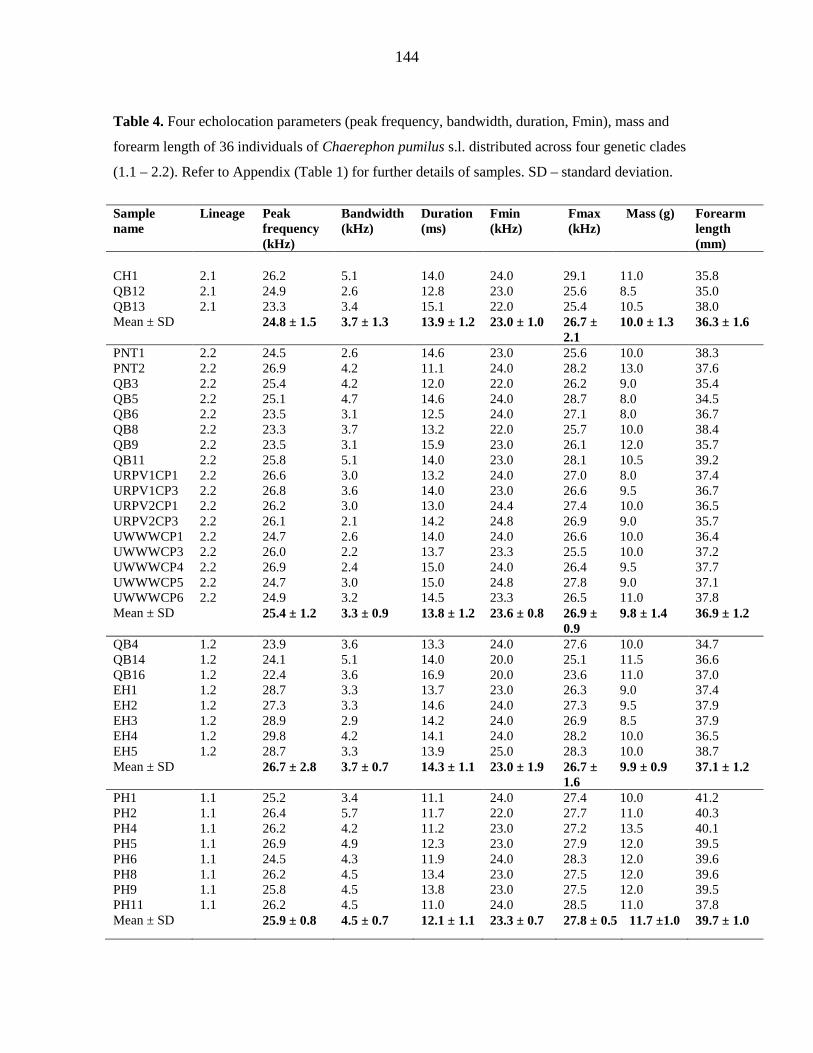
144
Table 4. Four echolocation parameters (peak frequency, bandwidth, duration, Fmin), mass and
forearm length of 36 individuals of Chaerephon pumilus s.l. distributed across four genetic clades
(1.1 – 2.2). Refer to Appendix (Table 1) for further details of samples. SD – standard deviation.
Sample name
Lineage Peak frequency (kHz)
Bandwidth (kHz)
Duration (ms)
Fmin (kHz)
Fmax (kHz)
Mass (g) Forearm length (mm)
CH1 2.1 26.2 5.1 14.0 24.0 29.1 11.0 35.8 QB12 2.1 24.9 2.6 12.8 23.0 25.6 8.5 35.0 QB13 2.1 23.3 3.4 15.1 22.0 25.4 10.5 38.0 Mean ± SD 24.8 ± 1.5 3.7 ± 1.3 13.9 ± 1.2 23.0 ± 1.0 26.7 ±
2.1 10.0 ± 1.3 36.3 ± 1.6
PNT1 2.2 24.5 2.6 14.6 23.0 25.6 10.0 38.3 PNT2 2.2 26.9 4.2 11.1 24.0 28.2 13.0 37.6 QB3 2.2 25.4 4.2 12.0 22.0 26.2 9.0 35.4 QB5 2.2 25.1 4.7 14.6 24.0 28.7 8.0 34.5 QB6 2.2 23.5 3.1 12.5 24.0 27.1 8.0 36.7 QB8 2.2 23.3 3.7 13.2 22.0 25.7 10.0 38.4 QB9 2.2 23.5 3.1 15.9 23.0 26.1 12.0 35.7 QB11 2.2 25.8 5.1 14.0 23.0 28.1 10.5 39.2 URPV1CP1 2.2 26.6 3.0 13.2 24.0 27.0 8.0 37.4 URPV1CP3 2.2 26.8 3.6 14.0 23.0 26.6 9.5 36.7 URPV2CP1 2.2 26.2 3.0 13.0 24.4 27.4 10.0 36.5 URPV2CP3 2.2 26.1 2.1 14.2 24.8 26.9 9.0 35.7 UWWWCP1 2.2 24.7 2.6 14.0 24.0 26.6 10.0 36.4 UWWWCP3 2.2 26.0 2.2 13.7 23.3 25.5 10.0 37.2 UWWWCP4 2.2 26.9 2.4 15.0 24.0 26.4 9.5 37.7 UWWWCP5 2.2 24.7 3.0 15.0 24.8 27.8 9.0 37.1 UWWWCP6 2.2 24.9 3.2 14.5 23.3 26.5 11.0 37.8 Mean ± SD 25.4 ± 1.2 3.3 ± 0.9 13.8 ± 1.2 23.6 ± 0.8 26.9 ±
0.9 9.8 ± 1.4 36.9 ± 1.2
QB4 1.2 23.9 3.6 13.3 24.0 27.6 10.0 34.7 QB14 1.2 24.1 5.1 14.0 20.0 25.1 11.5 36.6 QB16 1.2 22.4 3.6 16.9 20.0 23.6 11.0 37.0 EH1 1.2 28.7 3.3 13.7 23.0 26.3 9.0 37.4 EH2 1.2 27.3 3.3 14.6 24.0 27.3 9.5 37.9 EH3 1.2 28.9 2.9 14.2 24.0 26.9 8.5 37.9 EH4 1.2 29.8 4.2 14.1 24.0 28.2 10.0 36.5 EH5 1.2 28.7 3.3 13.9 25.0 28.3 10.0 38.7 Mean ± SD 26.7 ± 2.8 3.7 ± 0.7 14.3 ± 1.1 23.0 ± 1.9 26.7 ±
1.6 9.9 ± 0.9 37.1 ± 1.2
PH1 1.1 25.2 3.4 11.1 24.0 27.4 10.0 41.2 PH2 1.1 26.4 5.7 11.7 22.0 27.7 11.0 40.3 PH4 1.1 26.2 4.2 11.2 23.0 27.2 13.5 40.1 PH5 1.1 26.9 4.9 12.3 23.0 27.9 12.0 39.5 PH6 1.1 24.5 4.3 11.9 24.0 28.3 12.0 39.6 PH8 1.1 26.2 4.5 13.4 23.0 27.5 12.0 39.6 PH9 1.1 25.8 4.5 13.8 23.0 27.5 12.0 39.5 PH11 1.1 26.2 4.5 11.0 24.0 28.5 11.0 37.8 Mean ± SD 25.9 ± 0.8 4.5 ± 0.7 12.1 ± 1.1 23.3 ± 0.7 27.8 ± 0.5 11.7 ±1.0 39.7 ± 1.0
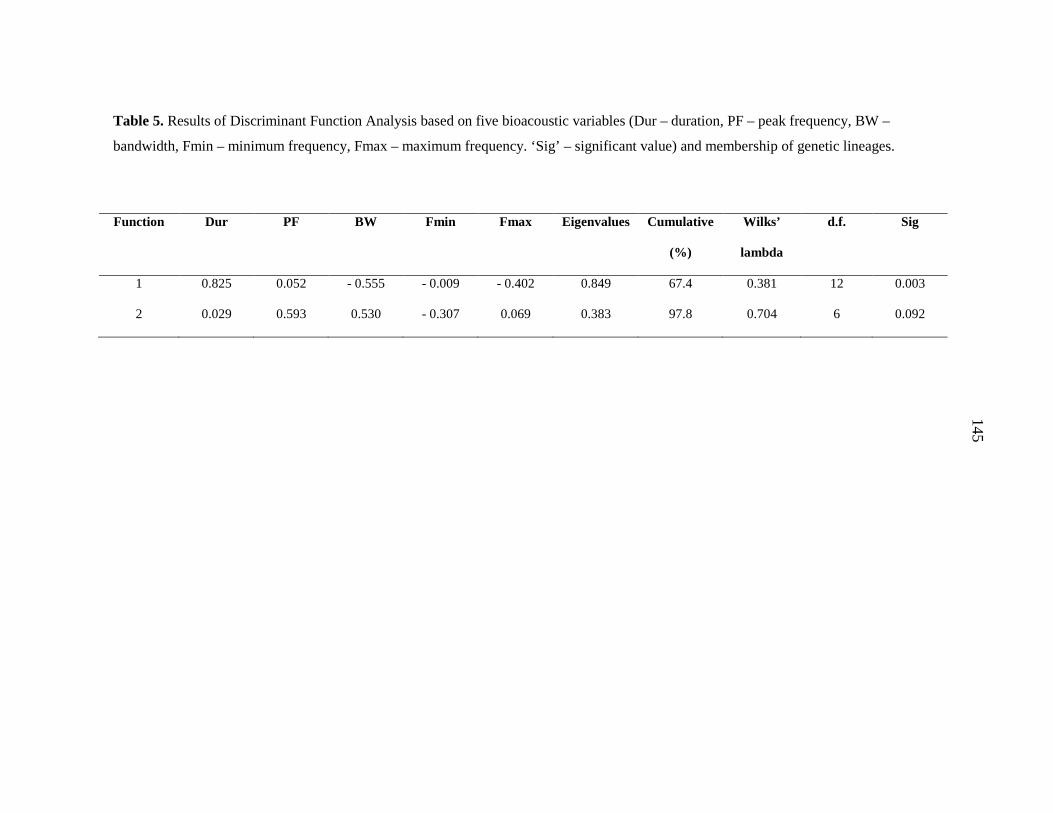
145
Table 5. Results of Discriminant Function Analysis based on five bioacoustic variables (Dur – duration, PF – peak frequency, BW –
bandwidth, Fmin – minimum frequency, Fmax – maximum frequency. ‘Sig’ – significant value) and membership of genetic lineages.
Function Dur PF BW Fmin Fmax Eigenvalues Cumulative
(%)
Wilks’
lambda
d.f. Sig
1 0.825 0.052 - 0.555 - 0.009 - 0.402 0.849 67.4 0.381 12 0.003
2 0.029 0.593 0.530 - 0.307 0.069 0.383 97.8 0.704 6 0.092
142
145
146
DISCUSSION
Molossid bats from south eastern Africa, referred to as Chaerephon pumilus s.l., are
taxonomically complicated as they comprise a number of well-supported sympatric genetic
lineages, and exhibit paraphyly, with the Malagasy C. leucogaster nested among them. Individuals
of C. pumilus s.l. have been reported to echolocate at peak frequencies between 16.3 kHz and 23.9
kHz (Taylor 1999b; Fenton et al. 2004), leading to the hypothesis that it comprises a number of
cryptic ‘sono’ species (Taylor et al. 2009) or lineages.
One of the aims of this study was to re-examine the phylogenetic structure of C. pumilus s.l.
from south eastern Africa by extending the sample set used in the phylogenetic study of Taylor et
al. (2009) both numerically and geographically. Overall, our phylogenetic analyses are congruent
with those previously reported. The cytochrome b sequence data revealed two major clades
separated by a genetic distance of 0.7% (0.1% - 1.4%), consistent with intraspecific distances for
bats (Baker and Bradley, 2006). In addition to the four control region lineages identified by Taylor
et al. (2009), we identified an additional clade comprising samples from the greater Durban area in
KwaZulu-Natal. This well-supported lineage, comprising two haplotypes and 20 samples, was not
fully resolved in the cytochrome b analyses. We conclude that C. pumilus s.l. from south eastern
Africa comprises a number of sympatric mitochondrial lineages, representative of intraspecific
variation.
However the C. pumilus s.l. clade, whilst well-supported, is paraphyletic, consistent with
Taylor et al. (2009), as it contains a nested C. leucogaster lineage separated by a mean genetic
distance of 0.95% (0.9% - 1.0%). This is consistent with intraspecific level distances reported by
Baker and Bradley (2006), making the classification of C. leucogaster and C. pumilus s.l. as distinct
genetic species somewhat questionable.
147
We investigated the hypothesis of Taylor et al. (2009) that the mitochondrial lineages of C.
pumilus s.l. are distinguishable by different echolocation calls, and were unable to predict cladal
designation based on a DFA of the echolocation calls. A wide range of PFs (23 – 29 kHz) was
recorded in individuals of all four clades, and this range was consistent with published frequencies,
except the 16 kHz sonotype was not recorded (Taylor 1999b; Fenton et al. 2004; Schoeman &
Waddington 2011).We also found no significant difference in mean size of bats among lineages,
which is consistent with the strong correlation between PF and body size observed in many species
of insectivorous bats (Jones 1996). Although we found a significant difference in Dur between
clades 1.2 and 1.1, acoustic divergence among cryptic species and populations typically involves PF
or BW rather than Dur (Heller & von Helversen 1989; Russo & Jones 2000; Kingston et al. 2001;
Jacobs et al. 2006, 2007; Furman et al. 2010; Ramasindrazana et al. 2011). However; none of these
examples include molossid taxa. The difference of ~2.7 ms in Dur between lineages reduces the
minimum detection range of prey by 45.9 cm for clade 1.2 (Schnitzler & Kalko 2001), and, hence,
is unlikely to be important from an ecological or sensory perspective, especially for a fast-flying
open-air forager. Instead, the Dur differences might be attributed to different recording conditions
where bats from clade 1.1 perceived the habitats of release as more cluttered, despite our efforts to
control for this by releasing the bats in open habitat.
This, in combination with the low inter-clade genetic distances, leads us to reject the
hypothesis of Taylor et al. (2009) that these clades represent cryptic sono-species. Thus, based on
current data, C. pumilus s.l. from south eastern Africa represents a single species with distinct
lineages identified at the intraspecific level.
Indices of diversity and neutrality combined with a ragged multimodal mismatch
distribution are inconsistent with the notion of demographic expansion of a single overall C.
pumilus s.l. population in south eastern Africa (Hull & Girman 2005), and are consistent with a
number of ancient stable populations at demographic equilibrium (Slatkin & Hudson 1991; Rogers
148
& Harpending 1992; Schneider & Excoffier 1999). Further, mismatch distributions based on both
cytochrome b and the control region do not show the characteristic star-shape expected of an
expanding population (Excoffier et al. 2009). Rather they are consistent with the existence of a
number of stable co-existing lineages, as revealed by the phylogenetic analyses. There was some
evidence of ancestor/descendant relationships; haplotype 2 (Fig. 6a, cytochrome b) appeared to be
ancestral to haplotypes 1 and 3; haplotype 1 (Fig. 6b, control region) appeared ancestral to
haplotypes 13, 14 and 15, and haplotype 10 to haplotypes 9 and 11. However many of the
haplotypes were separated by more than one mutational step, and could not easily be inferred as
ancestors or descendants of other haplotypes. A similarly-structured haplotype network has been
reported for C. atsinanana from eastern Madagascar (Lamb et al. 2012), consistent with the
existence of ancient stable populations of this Chaerephon species. These authors hypothesise that
the highly structured populations of C. atsinanana are maintained by female philopatry, a possible
explanation for the similar structuring in C. pumilus s.l. observed here. Our Bayesian skyline
analysis indicates that the population size of C. pumilus s.l. has been constant for the last ~ 400 000
years of the Quaternary. Although there is an apparent decrease in size from ~40 000 years ago to
the present, the 95% credibility range in this part of the plot indicates a high degree of uncertainty
and should be viewed with caution. Dating analyses indicate that the independent C. pumilus s.l.
lineages were established during the late Pleistocene, between 60 000 and 13 000 years ago.
Consistent with this, Taylor et al. (2009) suggested that two lineages (Clade 1.1 and 2.1 in our
analyses) underwent population expansion 12 956 - 3 360 yr BP and 59 434 - 14 726 yr BP,
respectively, possibly associated with expansion from Pleistocene glacial refugia, a process shown
to be influential in shaping patterns of genetic diversification among different taxa (Matthee &
Robinson 1997; Hewitt 2000; Flagstad et al. 2001; Muwanika et al. 2003; Hewitt 2004; Anthony et
al. 2007; Brown et al. 2007; Voelker et al. 2010; Miller et al. 2011).
149
The timing of the origin of the south eastern African C. pumilus s.l. lineages corresponds to
the existence of scarp forests along the eastern seaboard (10-15 km inland), which may have acted
as major refugia for a number of organisms during the last glacial maximum (Lawes et al. 2007).
These forests could have acted as refugia for C. pumilus s.l. directly by providing roosts in narrow
cracks of trees, or indirectly by influencing the distribution of their insect prey. Open-air bats
including Chaerephon will forage on insects above the trees in the forests. Forest habitats probably
harbour more insect abundance and diversity than more homogenous grassland habitats.Water
bodies and rivers may also have facilitated the maintenance and expansion of lineages as they
would have acted as corridors to suitable foraging areas, but our data do not distinguish between
these hypotheses.
To conclude, we confirmed that Chaerephon pumilus s.l. comprises a number of stable
sympatric lineages whose demographic history may have been shaped by behavioural and/or
climatic factors. We found that the balance of evidence does not support the existence of cryptic
lineages of C. pumilus s.l. with distinct echolocation characteristics. We confirmed that Chaerephon
pumilus s.l. comprises a number of stable sympatric lineages whose demographic history may have
been shaped by behavioural and/or micro-climatic factors rather than geographic processes. One
potential explanation for these stable sympatric lineages is that they reflect a behavioural system of
female philopatry, or roost faithfulness, as revealed by the maternally-inherited mitochondrial
markers, consistent with similar findings for the Australian ghost bat, Macroderma gigas
(Worthington-Wilmer et al. 1999). Further, in the Durban area C. pumilus s.l. has been observed to
emit social calls during emergence from roosts and in flight (M. Corrie Schoeman & Peter J.
Taylor, unpubl. data). We hypothesise that the C. pumilus s.l. populations are characterised by
differing social calling systems, however this will need to be verified by detailed ecological work
on the social dynamics of these bats.
150
ACKNOWLEDGEMENTS
We thankfully acknowledge financial support from the Volkswagen Foundation. We thank
Samantha Naidoo, Shivani Moonsamy, Kirby Waddington and Leigh Richards for assistance in the
field and we also thank the management of Paradise Valley Nature Reserve for permission to work
in the reserve.
REFERENCES ANTHONY, N.M., JOHNSON-BAWE, M., JEFFERY, K., CLIFFORD, S.L., ABERNETHY, K.A., TUTIN,
C.E., LAHM, S.A., WHITE, L.J.T., UTLEY, J.F., WICKINGS, E.J. & BRUFORD, M.W. 2007. The
role of Pleistocene refugia and rivers in shaping gorilla genetic diversity in central Africa.
Proceedings of the National Academy of Science 104: 20432–20436.
ARTYUSHIN, I.V., BANNIKOVA, A.A., LEBEDEV, V.S. & KRUSKOP, S.V. 2009. Mitochondrial DNA
relationships among North Palaearctic Eptesicus (Vespertilionidae, Chiroptera) and past
hybridization between common serotine and northern bat. Zootaxa 2262: 40-52.
ASPETSBERGER, F., BRANDSEN, D. & JACOBS, D.S. 2003. Geographic variation in the morphology,
echolocation and diet of the little free-tailed bat, Chaerephon pumilus (Molossidae). African
Zoology 38: 245-254.
BAKER, R.J. & BRADLEY, R.D. 2006. Speciation in mammals and the genetic species concept.
Journal of Mammalogy 87: 643-662.
BIRUNGI, J. & ARCTANDER, P. 2000. Large sequence divergence of mitochondrial DNA
genotypes of the control region within populations of the African antelope, kob (Kobus kob).
Molecular Ecology 9: 1997-2008.
BISCARDI, S., ORPRECIO, J., FENTON, M.B., TSOAR, A. & RATCLIFFE, J.M. 2004. Recognition of
species by their echolocation calls. Acta Chiropterologica 6: 347–363.
BOUCHARD, S. 1998. Chaerephon pumilus. Mammalian Species 574: 1–6.
BRAMBILLA, M., VITULANO, S., SPINA, F., BACCETTI, N., GABRIEL GARGALLO, G., FABBRI, E.,
GUIDALI, F. & RANDI, E. 2008. A molecular phylogeny of the Sylvia cantillans complex:
Cryptic species within the Mediterranean basin. Molecular Phylogenetics and Evolution 48:
461-472.
151
BROWN, D.M., BRENNEMAN, R.A., KOEPFLI, K.-P., POLLINGER, J.P., MILA, B., GEORGIADIS, N.J.,
LOUIS JR, E.E., GRETHER, G.F., JACOBS, D.K. & WAYNE, R.K. 2007. Extensive population
genetic structure in the giraffe. BMC Biology 5 doi: 10.1186/1741-7007-5-57.
CLEMENT, M., POSADA, D.&CRANDALL, K. A. 2000. TCS: a computer program to estimate gene
genealogies. Molecular Ecology 9: 1657-1660.
CRETZSCHMAR, P. J. 1826. Saügethiere. In: Atlas zu der Reise im nördlichen Afrika, (ed)E. Rüppell.
Senckenbergische naturforschende Gesellschaft, Frankfurt am Main.
DRUMMOND, A.J. & RAMBAUT, A. 2010. BEAST: Bayesian evolutionary analysis sampling trees,
version 1.5.4. http://code.google.com/p/beast-mcmc/downloads/list.
DRUMMOND, A. J., RAMBAUT, A., SHAPIRO, B. & PYBUS, O. G. 2005. Bayesian coalescent inference
of past population dynamics from molecular sequences. Molecular Biology and Evolution
22(5): 1185-1192.
DYTHAM, C. 2003. Choosing and using statistics: a biologist’s guide. Blackwell Publishing,
Malden.
EXCOFFIER, L., FOLL, M. & PETIT, R.J. 2009.Genetic consequences of range expansions. Annual
Review of Ecology, Evolution, andSystematics 40: 481–501.
FLAGSTAD, O., SYVERTSEN, P.O., STENSETH, N.C. & JAKOBSEN, K.S. 2001. Environmental change
and rates of evolution: the phylogeographic pattern within the hartebeest complex as related to
climatic variation. Proceedings of the Royal Society B: Biological Sciences 268: 667-677.
FENTON, M.B., JACOBS, D.S., RICHARDSON, E.R., TAYLOR, P.J. & WHITE, W. 2004. Individual
signatures in the frequency modulated sweep calls of African large-eared free-tailed bats
(Otomops martiensseni) (Chiroptera: Molossidae). Journal of Zoology 262:11-19.
FU, X.Y. 1997. Statistical tests of neutrality of mutations against population growth, hitchhiking
and background selection. Genetics 147: 915-925.
FULLARD, J. H., DAWSON, J. W. & JACOBS, D. S. 2003. Auditory encoding during the last moment
of a moth’s life. The Journal of Experimental Biology 206: 281–294.
FURMAN, A., OZTUNC, T. & CORAMAN, E. 2010. On the phylogeny of Miniopterus schreibersii
schreibersii and Miniopterus schreibersii pallidus from Asia Minor in reference to other
Miniopterus taxa (Chiroptera: Vespertilionidae). Acta Chiropterologica 12: 61-72.
GOODMAN, S.M., BUCCAS, W., NAIDOO,T., RATRIMOMANARIVO, F., TAYLOR, P.J. & LAMB, J.
2010. Patterns of morphological and genetic variation in western Indian Ocean members of the
Chaerephon leucogaster/C. pumilus complex (Chiroptera: Molossidae) with the description of a
new species from Madagascar. Zootaxa 2551: 1-36.
152
HALL, T. A. 1999. BioEdit: a user-friendly biological sequence alignment editor and analysis
program for Windows 95/98/NT. Nucleic Acids Symposium Series 41:95-98.
HASEGAWA, M., KISHINO, H. & YANO, T. 1985. Dating of the human-ape splitting by a molecular
clock of mitochondrial DNA. Journal of Molecular Evolution 21: 160-174
HELLER, K. G. & VON HELVERSEN, O. 1989. Resource partioning of sonar frequency bands in
rhinolophoid bats. Oecologia 80: 178-186.
HEWITT, G. 2000. The genetic legacy of the Quaternary ice ages. Nature 405: 907-913
HEWITT, G. 2004. The structure of biodiversity – insights from molecular phylogeography.
Frontiers in Zoology 4 doi: 10.1186/1742-9994-1-4.
HULL, J. M. & GIRMAN, D. J. 2005. Effects of Holocene climate change on the historical
demography of migrating sharp-shinned hawks (Accipiter striatus velox) in North America.
Molecular Ecology 14:159-170.
IRWIN, D. M., KOCHER, T. D. & WILSON, A. C. 1991. Evolution of Cytochrome b gene in mammals.
Journal of Molecular Evolution 32:128-144.
JACOBS, D. S., RICHARDSON, E. J. & TAYLOR, P. 2004. Genetic similarity amongst phenotypically
diverse little free-tailed bats, Chaerephon pumilus. Acta Chiropterologica 6: 13-21.
JACOBS, D. S., EICK, G. E., SCHOEMAN, M. C. & MATTHEE, C. A. 2006. Cryptic species in an
insectivorous bat, Scotophilus dinganii. Journal of Mammalogy 87:161-170.
JACOBS D.S., BARCLAY, R.M.R. & WALKER, M.H. 2007.The allometry of echolocation call
frequencies of insectivorous bats: why do some species deviate from the pattern? Oecologia
152: 583–594.
JONES, G. 1996. Does echolocation constrain the evolution of body size in bats? In: Minature
vertebrates: the implications of small vertebrates, (ed) P.J. Miller. Symposia of the Zoological
Society of London 69: 111-128.
KINGSTON, T. & ROSSITER, S.J. 2004. Harmonic-hopping in Wallacea’s bats. Nature 429: 654–657.
KINGSTON, T., LARA, M.C., JONES, G., AKBAR, Z., KUNZ, T.H. & SCHNEIDER, C.J. 2001. Acoustic
divergence in two cryptic Hipposideros species: a role for social selection? Proceedings of the
Royal Society B 268: 1381-1386.
LAMB, J.M., NAIDOO, T., TAYLOR, P.J., NAPIER, M., RATRIMOMANARIVO, F. & GOODMAN, S.M.
2012. Genetically and geographically isolated lineages of a tropical bat (Chiroptera,
Molossidae) show demographic stability over the late Pleistocene. Biological Journal of the
Linnean Society 106: 18-40.
153
LAMB, J.M., RALPH, T.M.C., NAIDOO, T., TAYLOR, P.J., RATRIMOMANARIVO, F., STANLEY,W.T. &
GOODMAN, S.M. 2011. Toward a molecular phylogeny for the Molossidae (Chiroptera) of the
Afro-Malagasy region. Acta Chiropterologica 13: 1-16.
LAWES, M. J., EELEY, H. A. C., FINDLAY, N. J. & FORBES, D. 2007. Resilient forest faunal
communities in South Africa: a legacy of palaeoclimatic change and extinction filtering?
Journal of Biogeography 34:1246-1264.
LIBRADO, P. & ROZAS, J. 2009. DnaSP v5: a software for comprehensive analysis of DNA
polymorphism data. Bioinformatics 25: 1451-1452.
MATTHEE, C.A. & ROBINSON, T.J. 1997. Mitochondrial DNA phylogeography and comparative
cytogenetics of the springhare, Pedetes capensis (Mammalia: Rodentia). Journal of Molecular
Evolution 4: 53-73.
MILLER, J.M., HALLAGER, S., MONFORT, S.L., NEWBY, J., BISHOP, K., TIDMUS, S.A., BLACK, P.,
HOUSTON, B., MATTHEE, C.A. & FLEISCHER, R.C. 2011. Phylogeographic analysis of nuclear
and mtDNA supports subspecies designations in the ostrich (Struthio camelus). Conservation
Genetics 12: 423-431.
MUWANIKA, V.B., NYAKAANA, S., SIEGISMUND, H.R. & ARCTANDER, P. 2003. Phylogeography
and population structure of the common warthog (Phacochoerus africanus) inferred from
variation in mitochondrial DNA sequences and microsatellite loci. Heredity 1: 361-372.
NEUBAUM, M.A., DOUGLAS, M.R., DOUGLAS, M.E. & O’SHEA, T.J. 2007. Molecular ecology of the
big brown bat (Eptesicus fuscus): genetic and natural history variation in a hybrid zone. Journal
of Mammalogy 88: 1230-1238.
OBRIST, M.K. 1995. Flexible bat echolocation: the influence of individual, habitat and conspecifics
on sonar signal design. Behavioral Ecology and Sociobiology 36: 207-219.
O’FARRELL, M.J., MILLER, B.W. & GANNON, W.L. 1999. Qualitative identification of free-flying
bats using Anabat detector. Journal of Mammology 80: 11-23.
OMLAND, K.E., TARR, C.L., BOARMAN, W.I., MARZLUFF, J.M. & FLEISCHER, R.C. 2000. Cryptic
genetic variation and paraphyly in ravens. Proceedings of the Royal Society of London, B:
Biological Sciences 267: 2475-2482.
OLSON, L., GOODMAN, S.M. & YODER, A.D. 2004. Illumination of cryptic species boundaries in
long-tailed shrew tenrecs (Mammalia: Tenrecidae; Microgale), with new insights into
geographic variation and distributional constraints. Biological Journal of the Linnean Society
83: 1–22.
154
PEPPERS, L.L. & BRADLEY, R.D. 2000. Cryptic species in Sigmodon hispidus: evidence from DNA
sequences. Journal of Mammalogy 81: 332-343.
PETERSON, R. L., EGER, J.L. & MITCHELL, L. 1995. Chiroptères. Faune de Madagascar, Vol. 84.
Muséum national d’Histoire naturelle, Paris.
PFENNINGER, M. & SCHWENK, K. 2007. Cryptic animal species are homogeneously distributed
among taxa and biogeographical regions. BMC Evolutionary Biology7 (121) doi: 10.1186/1471-
2148-7-121.
POSADA, D. 2008. jModelTest: Phylogenetic Model Averaging. Molecular Biology and Evolution
25 (7): 1253-1256.
RAMASINDRAZANA, B., GOODMAN, S.M., SCHOEMAN, M.C. & APPLETON, B. 2011. Identification
of cryptic species of Miniopterus bats (Chiroptera: Miniopteridae) from Madagascar and the
Comoros using bioacoustic overlaid on molecular genetic and morphological characters.
Biological Journal of the Linnean Society 104: 284-302.
RAMBAUT, A. & DRUMMOND, A.J. 2009. Tracer v. 1.5: Mcmc trace file analyser. Available at
http://tree.bio.ed.ac.uk/software/tracer/.
RATRIMOMANARIVO, F. H., GOODMAN, S., STANLEY, W., NAIDOO, T., TAYLOR, P.J. & LAMB, J.
2009. Geographic and phylogeographic variation in Chaerephon leucogaster (Chiroptera:
Molossidae) of Madagascar and the western Indian Ocean islands of Mayotte and Pemba. Acta
Chiropterologica 11: 25-52.
RAVAOARIMANANA, I.B., TIEDEMANN, R., MONTAGNON, D. & RUMPLER, Y. 2004. Molecular and
cytogenetic evidence for cryptic speciation within a rare endemic Malagasy lemur, the Northern
Sportive Lemur (Lepilemur septentrionalis). Molecular Phylogenetics and Evolution 31: 440-
448.
ROGERS, A.R. & HARPENDING, H. 1992. Population growth makes waves in the distribution of
pairwise genetic differences. Molecular Biology and Evolution 9: 552-569.
RONQUIST, F. & HUELSENBECK, J.P. 2001. MRBAYES: A Bayesian inference of phylogeny.
Bioinformatics 17: 754-755.
RUSSELL, A. L, MEDELLIN, R. A. & MCCRACKEN, G. F. 2005. Genetic variation and migration in
the Mexican free-tailed bat (Tadarida brasiliensis mexicana). Molecular Ecology 14: 2207-
2222.
RUSSO, D. & JONES, G. 2000. The two cryptic species of Pipistrellus (Chiroptera: Vespertilionidae)
occur in Italy: evidence from echolocation calls. Mammalia 62: 187-197.
155
RYDELL, J., ARITA, H.T., SANTOS, M. & GRANADOS, J. 2002. Acoustic identification of
insectivorous bats (order Chiroptera) of Yucatan, Mexico. Journal of Zoology 257:27–36.
SCHNEIDER, S. & EXCOFFIER, L. 1999. Estimation of past demographic parameters from the
distribution of pairwise divergences when the mutation rates vary among sites: application to
human mitochondrial DNA. Genetics 152: 1079-1089.
SCHNITZLER, H-U. & KALKO, E.V.K. 2001. Echolocation by insect-eating bats. BioScience 51: 557-
569.
SCHOEMAN, M.C. & WADDINGTON, K.J. 2011. Do deterministic processes influence the phenotypic
patterns of animalivorous bat ensembles at urban rivers? African Zoology 46: 288–301.
SIKES, R.S., GANNON, W.L. & THE ANIMAL CARE AND USE COMMITTEE OF THE AMERICAN
SOCIETY MAMMALOGISTS. 2011. Guidelines of the American Society of Mammologists for the
use of wild animals in research. Journal of Mammalogy 92: 235-253.
SIMMONS, N. B. 2005. Order Chiroptera. In: Mammal Species of the World: a taxonomic and
geographic reference, (eds)D. E. Wilson & D. M. Reeder. Pp 312-529.The John Hopkins
University Press, Baltimore, Maryland.
SLATKIN, M. & HUDSON, R.R. 1991. Pairwise comparisons of mitochondrial DNA sequences in
stable and exponentially growing populations. Genetics 129: 555-562.
SPSS INC. 2010. SPSS release 19.0 for windows. SPSS Inc., Chicago, Illinois.
STOFFBERG, S., SCHOEMAN, M.C. & MATTHEE, C.A. 2012. Correlated genetic and ecological
diversification in a widespread southern African horseshoe bat. PLoS ONE 7(2): e31946
SWOFFORD, D.L. 2002. PAUP*: Phylogenetic analysis using parsimony (*and other methods),
version 4.0b10. Sinauer Associates Inc., Sunderland, MA USA.
TAYLOR, P. J. 1999a. Problems with the identificationof southern African Chaerephon
(Molossidae), and the possibility of a cryptic species from South Africa and Swaziland. Acta
Chiropterologica 1: 191–200.
TAYLOR, P. J. 1999b. Echolocation calls of twenty southern African bat species. South African
Journal of Zoology 33: 114-124.
TAYLOR, P. J. 2005. Order Chiroptera, Bats. In: The mammals of the southern African subregion,
(eds) J.D. Skinner & C.T. Chimimba, pp. 256-352. Cambridge University Press, Cambridge.
TAYLOR, P.J., LAMB, J., REDDY, D., NAIDOO, T., RATRIMOMANARIVO, F.& GOODMAN, S.M. 2009.
Cryptic lineages of little free-tailed bats, Chaerephon pumilus (Chiroptera: Molossidae) from
southern Africa and the western Indian Ocean islands. African Zoology 44: 55-70.
156
TAYLOR, P.J., STOFFBERG, S., MONADJEM, A., SCHOEMAN, M.C., BAYLISS, J.& COTTERILL, F. P.D.
2012. Four New Bat Species (Rhinolophus hildebrandtii Complex) Reflect Plio Pleistocene
Divergence of Dwarfs and Giants across an Afromontane Archipelago. PLoS ONE 7 (9):
e41744.
TEMPLETON, A. R., CRANDALL, K. A.&SING, C. F. 1992. A cladistic analysis of the phenotypic
associations with haplotypes inferred from restriction endonuclease mapping and DNA sequence
data. III. Cladogram estimation. Genetics 132: 619-633.
THABAH, A., ROSITER, S.J., KINGSTON, T., ZHANG, S., PARSONS, S., MYA MYA, K., ZUBAID, A. &
JONES, G. 2006. Genetic divergence and echolocation call frequency in cryptic species of
Hipposideros larvatus s.l. (Chiroptera: Hipposideridae) from the Indo-Malayan region.
Biological Journal of the Linnean Society 88: 119-130.
THOMPSON, J. D., HIGGINS, D. G. & GIBSON, T. J. 1994. CLUSTAL W: improving thesensitivity of
progressive multiple sequence alignment through sequence weighting, position specific gap
penalties and weight matrix choice. Nucleic Acids Research 22: 4673-4680.
TOWES, D.P.L. & IRWIN, D.E. 2008. Cryptic speciation in a Holarctic passerine revealed by genetic
and bioacoustic analyses. Molecular Ecology 17: 2691-2705.
VENCES, M. & GLAW, F. 2005. A new cryptic frog of the genus Boophis from the north-western
rainforests of Madagascar. African Journal of Herpetology 54: 77–84.
VOELKER, G., OUTLAW, R.K. & BOWIE, R.C.K. 2010. Pliocene forest dynamics as a primary driver
of African bird speciation. Global Ecology and Biogeography 19: 111-121.
WILKINSON, G. S. & CHAPMAN, A. M. 1991. Length and sequence variation in evening bat D-loop
mtDNA. Genetics 128: 607-61.
WILKINSON, G.S., MAYER, F., KERTH, G. & PETRI, B. 1997. Evolution of repeated sequence arrays
in the D-loop region of bat mitochondrial DNA. Genetics 146: 1035-1048.
WORTHINGTON-WILMER, J., HALL, L., BARRATT, E. & MORITZ, C. 1999. Genetic structure and
male-mediated gene flow in the ghost bat (Macrodermagigas). Evolution 53: 1582-1591.
YODER, A.D., OLSON, L.E., HANLEY, C., HECKMAN, K., RASOLOARISON, R., RUSSELL, A.L.,
RANIVO, J., SOARIMALALA, V., KARANTH, K.P., RASELIMANANA, A.P. & GOODMAN, S.M.
2005. A multidimensional approach for detecting species patterns in Malagasy vertebrates.
Proceedings of the National Academy of Sciences of the United States of America 102: 6587–
6594.
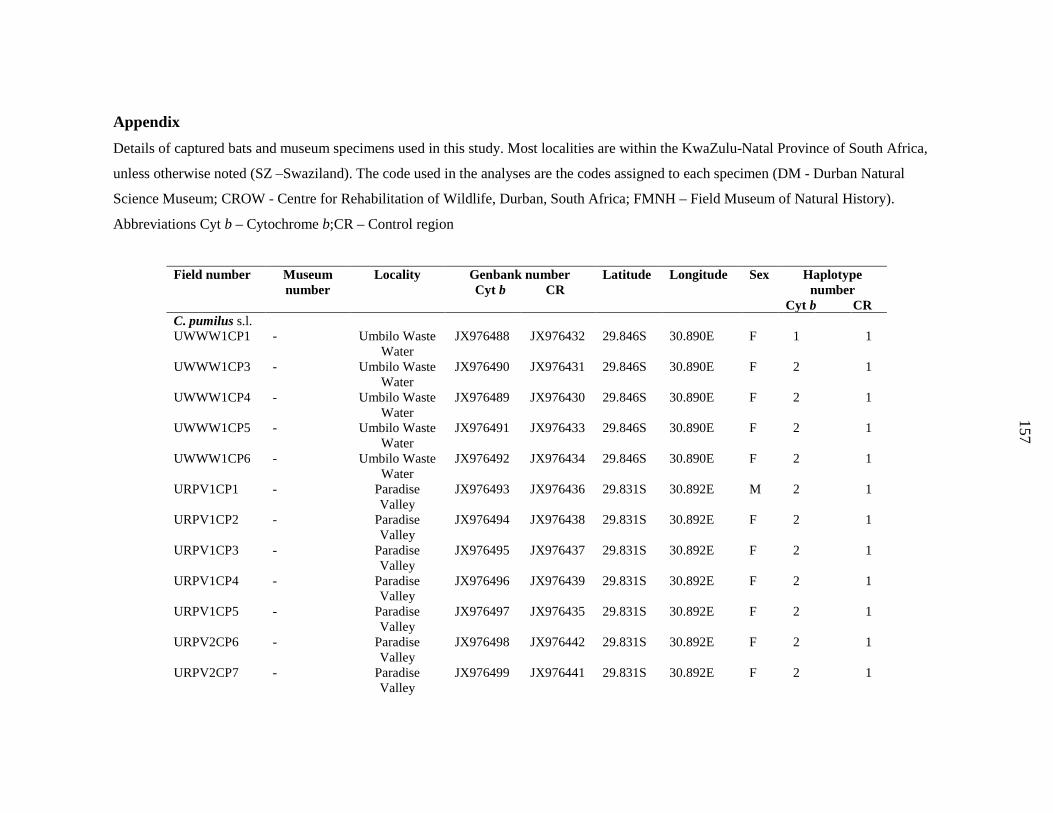
157
Appendix Details of captured bats and museum specimens used in this study. Most localities are within the KwaZulu-Natal Province of South Africa,
unless otherwise noted (SZ –Swaziland). The code used in the analyses are the codes assigned to each specimen (DM - Durban Natural
Science Museum; CROW - Centre for Rehabilitation of Wildlife, Durban, South Africa; FMNH – Field Museum of Natural History).
Abbreviations Cyt b – Cytochrome b;CR – Control region
Field number Museum number
Locality Genbank number Cyt b CR
Latitude Longitude Sex Haplotype number
Cyt b CR C. pumilus s.l. UWWW1CP1 - Umbilo Waste
Water JX976488 JX976432 29.846S 30.890E F 1 1
UWWW1CP3 - Umbilo Waste Water
JX976490 JX976431 29.846S 30.890E F 2 1
UWWW1CP4 - Umbilo Waste Water
JX976489 JX976430 29.846S 30.890E F 2 1
UWWW1CP5 - Umbilo Waste Water
JX976491 JX976433 29.846S 30.890E F 2 1
UWWW1CP6 - Umbilo Waste Water
JX976492 JX976434 29.846S 30.890E F 2 1
URPV1CP1 - Paradise Valley
JX976493 JX976436 29.831S 30.892E M 2 1
URPV1CP2 - Paradise Valley
JX976494 JX976438 29.831S 30.892E F 2 1
URPV1CP3 - Paradise Valley
JX976495 JX976437 29.831S 30.892E F 2 1
URPV1CP4 - Paradise Valley
JX976496 JX976439 29.831S 30.892E F 2 1
URPV1CP5 - Paradise Valley
JX976497 JX976435 29.831S 30.892E F 2 1
URPV2CP6 - Paradise Valley
JX976498 JX976442 29.831S 30.892E F 2 1
URPV2CP7 - Paradise Valley
JX976499 JX976441 29.831S 30.892E F 2 1
154
157
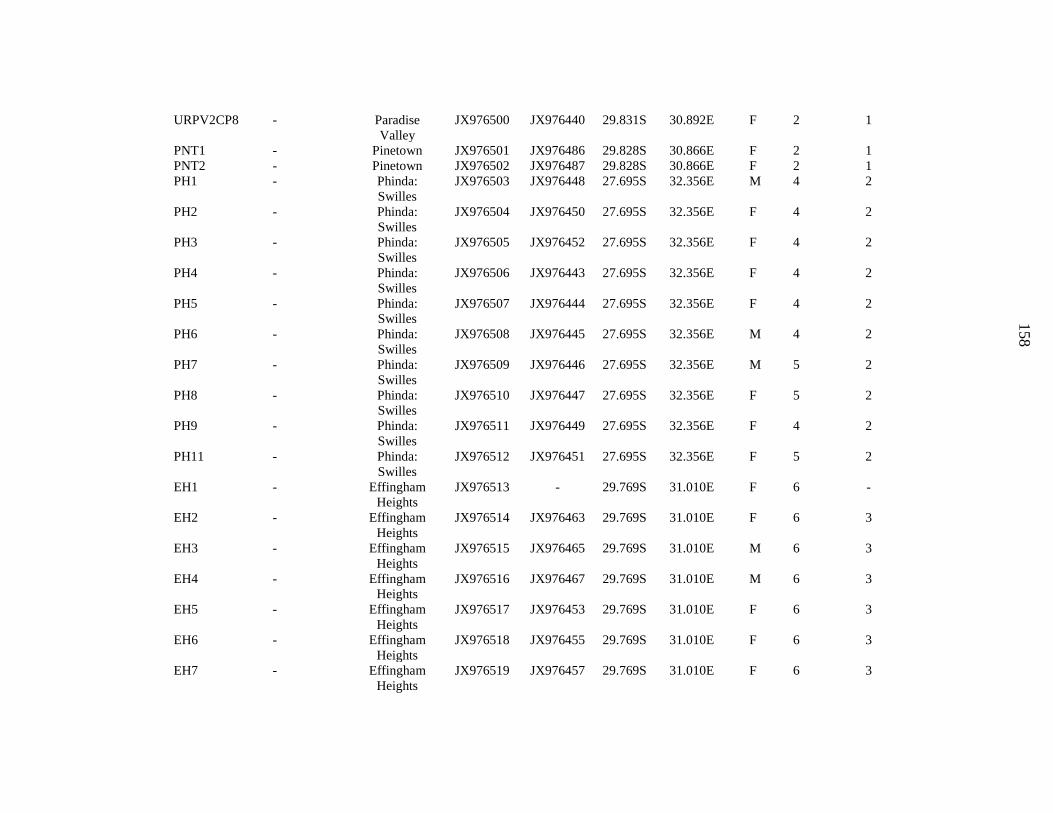
158
URPV2CP8 - Paradise Valley
JX976500 JX976440 29.831S 30.892E F 2 1
PNT1 - Pinetown JX976501 JX976486 29.828S 30.866E F 2 1 PNT2 - Pinetown JX976502 JX976487 29.828S 30.866E F 2 1 PH1 - Phinda:
Swilles JX976503 JX976448 27.695S 32.356E M 4 2
PH2 - Phinda: Swilles
JX976504 JX976450 27.695S 32.356E F 4 2
PH3 - Phinda: Swilles
JX976505 JX976452 27.695S 32.356E F 4 2
PH4 - Phinda: Swilles
JX976506 JX976443 27.695S 32.356E F 4 2
PH5 - Phinda: Swilles
JX976507 JX976444 27.695S 32.356E F 4 2
PH6 - Phinda: Swilles
JX976508 JX976445 27.695S 32.356E M 4 2
PH7 - Phinda: Swilles
JX976509 JX976446 27.695S 32.356E M 5 2
PH8 - Phinda: Swilles
JX976510 JX976447 27.695S 32.356E F 5 2
PH9 - Phinda: Swilles
JX976511 JX976449 27.695S 32.356E F 4 2
PH11 - Phinda: Swilles
JX976512 JX976451 27.695S 32.356E F 5 2
EH1 - Effingham Heights
JX976513 - 29.769S 31.010E F 6 -
EH2 - Effingham Heights
JX976514 JX976463 29.769S 31.010E F 6 3
EH3 - Effingham Heights
JX976515 JX976465 29.769S 31.010E M 6 3
EH4 - Effingham Heights
JX976516 JX976467 29.769S 31.010E M 6 3
EH5 - Effingham Heights
JX976517 JX976453 29.769S 31.010E F 6 3
EH6 - Effingham Heights
JX976518 JX976455 29.769S 31.010E F 6 3
EH7 - Effingham Heights
JX976519 JX976457 29.769S 31.010E F 6 3
155
158
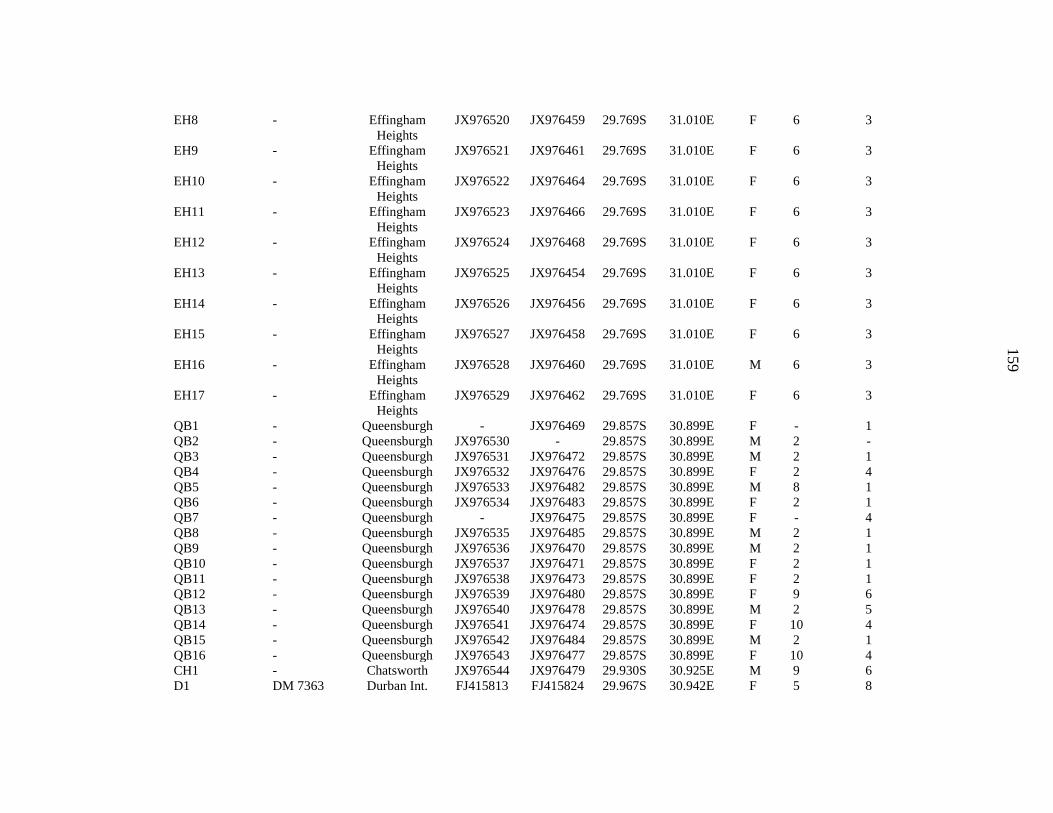
159
EH8 - Effingham Heights
JX976520 JX976459 29.769S 31.010E F 6 3
EH9 - Effingham Heights
JX976521 JX976461 29.769S 31.010E F 6 3
EH10 - Effingham Heights
JX976522 JX976464 29.769S 31.010E F 6 3
EH11 - Effingham Heights
JX976523 JX976466 29.769S 31.010E F 6 3
EH12 - Effingham Heights
JX976524 JX976468 29.769S 31.010E F 6 3
EH13 - Effingham Heights
JX976525 JX976454 29.769S 31.010E F 6 3
EH14 - Effingham Heights
JX976526 JX976456 29.769S 31.010E F 6 3
EH15 - Effingham Heights
JX976527 JX976458 29.769S 31.010E F 6 3
EH16 - Effingham Heights
JX976528 JX976460 29.769S 31.010E M 6 3
EH17 - Effingham Heights
JX976529 JX976462 29.769S 31.010E F 6 3
QB1 - Queensburgh - JX976469 29.857S 30.899E F - 1 QB2 - Queensburgh JX976530 - 29.857S 30.899E M 2 - QB3 - Queensburgh JX976531 JX976472 29.857S 30.899E M 2 1 QB4 - Queensburgh JX976532 JX976476 29.857S 30.899E F 2 4 QB5 - Queensburgh JX976533 JX976482 29.857S 30.899E M 8 1 QB6 - Queensburgh JX976534 JX976483 29.857S 30.899E F 2 1 QB7 - Queensburgh - JX976475 29.857S 30.899E F - 4 QB8 - Queensburgh JX976535 JX976485 29.857S 30.899E M 2 1 QB9 - Queensburgh JX976536 JX976470 29.857S 30.899E M 2 1 QB10 - Queensburgh JX976537 JX976471 29.857S 30.899E F 2 1 QB11 - Queensburgh JX976538 JX976473 29.857S 30.899E F 2 1 QB12 - Queensburgh JX976539 JX976480 29.857S 30.899E F 9 6 QB13 - Queensburgh JX976540 JX976478 29.857S 30.899E M 2 5 QB14 - Queensburgh JX976541 JX976474 29.857S 30.899E F 10 4 QB15 - Queensburgh JX976542 JX976484 29.857S 30.899E M 2 1 QB16 - Queensburgh JX976543 JX976477 29.857S 30.899E F 10 4 CH1 - Chatsworth JX976544 JX976479 29.930S 30.925E M 9 6 D1 DM 7363 Durban Int. FJ415813 FJ415824 29.967S 30.942E F 5 8
156
159
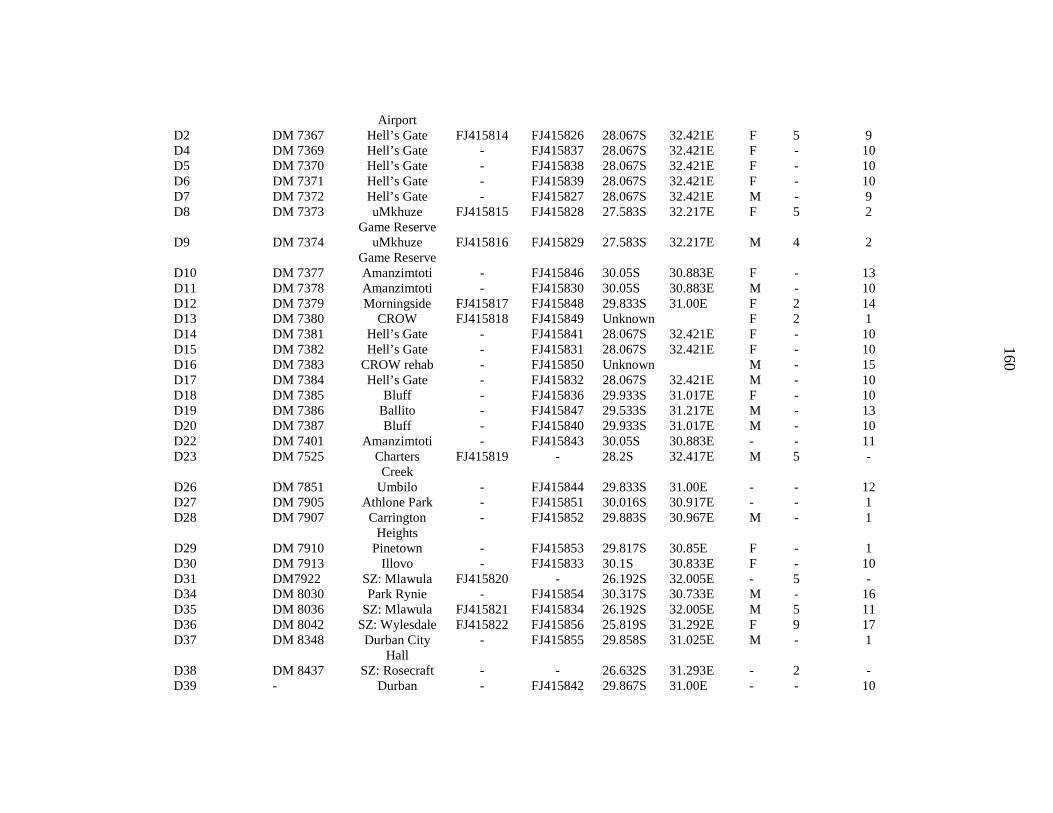
160
Airport D2 DM 7367 Hell’s Gate FJ415814 FJ415826 28.067S 32.421E F 5 9 D4 DM 7369 Hell’s Gate - FJ415837 28.067S 32.421E F - 10 D5 DM 7370 Hell’s Gate - FJ415838 28.067S 32.421E F - 10 D6 DM 7371 Hell’s Gate - FJ415839 28.067S 32.421E F - 10 D7 DM 7372 Hell’s Gate - FJ415827 28.067S 32.421E M - 9 D8 DM 7373 uMkhuze
Game Reserve FJ415815 FJ415828 27.583S 32.217E F 5 2
D9 DM 7374 uMkhuze Game Reserve
FJ415816 FJ415829 27.583S 32.217E M 4 2
D10 DM 7377 Amanzimtoti - FJ415846 30.05S 30.883E F - 13 D11 DM 7378 Amanzimtoti - FJ415830 30.05S 30.883E M - 10 D12 DM 7379 Morningside FJ415817 FJ415848 29.833S 31.00E F 2 14 D13 DM 7380 CROW FJ415818 FJ415849 Unknown F 2 1 D14 DM 7381 Hell’s Gate - FJ415841 28.067S 32.421E F - 10 D15 DM 7382 Hell’s Gate - FJ415831 28.067S 32.421E F - 10 D16 DM 7383 CROW rehab - FJ415850 Unknown M - 15 D17 DM 7384 Hell’s Gate - FJ415832 28.067S 32.421E M - 10 D18 DM 7385 Bluff - FJ415836 29.933S 31.017E F - 10 D19 DM 7386 Ballito - FJ415847 29.533S 31.217E M - 13 D20 DM 7387 Bluff - FJ415840 29.933S 31.017E M - 10 D22 DM 7401 Amanzimtoti - FJ415843 30.05S 30.883E - - 11 D23 DM 7525 Charters
Creek FJ415819 - 28.2S 32.417E M 5 -
D26 DM 7851 Umbilo - FJ415844 29.833S 31.00E - - 12 D27 DM 7905 Athlone Park - FJ415851 30.016S 30.917E - - 1 D28 DM 7907 Carrington
Heights - FJ415852 29.883S 30.967E M - 1
D29 DM 7910 Pinetown - FJ415853 29.817S 30.85E F - 1 D30 DM 7913 Illovo - FJ415833 30.1S 30.833E F - 10 D31 DM7922 SZ: Mlawula FJ415820 - 26.192S 32.005E - 5 - D34 DM 8030 Park Rynie - FJ415854 30.317S 30.733E M - 16 D35 DM 8036 SZ: Mlawula FJ415821 FJ415834 26.192S 32.005E M 5 11 D36 DM 8042 SZ: Wylesdale FJ415822 FJ415856 25.819S 31.292E F 9 17 D37 DM 8348 Durban City
Hall - FJ415855 29.858S 31.025E M - 1
D38 DM 8437 SZ: Rosecraft - - 26.632S 31.293E - 2 - D39 - Durban - FJ415842 29.867S 31.00E - - 10
157
160
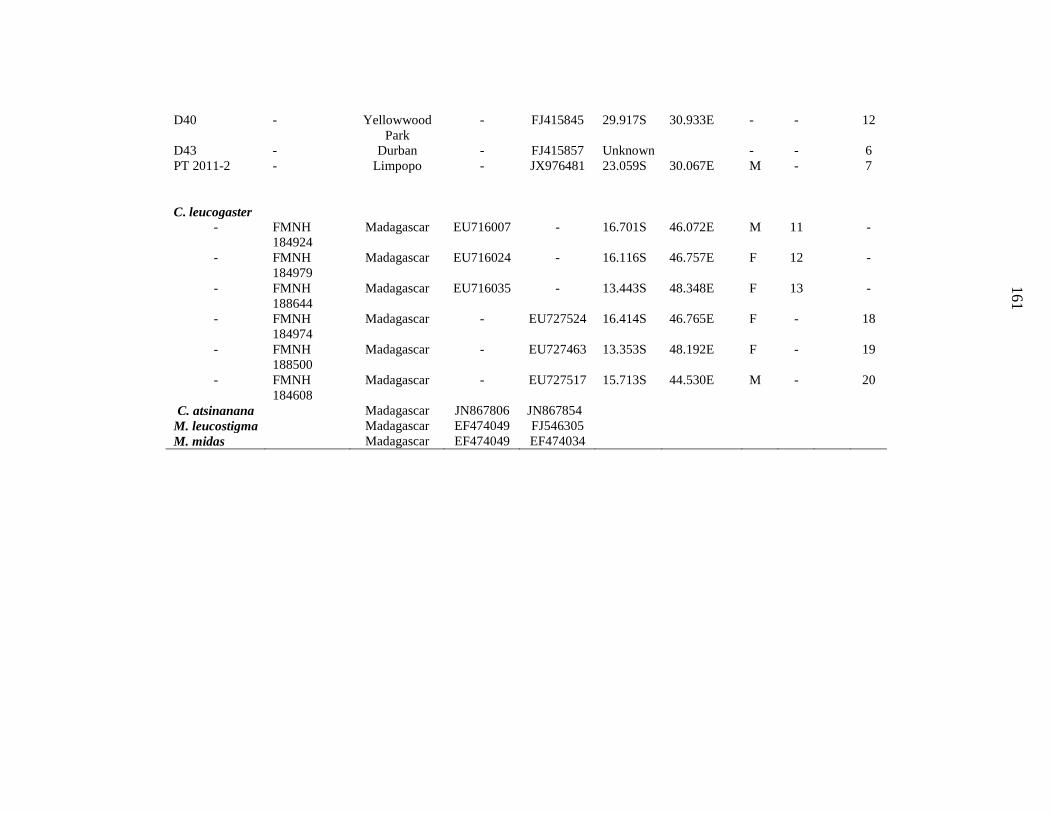
161
D40 - Yellowwood Park
- FJ415845 29.917S 30.933E - - 12
D43 - Durban - FJ415857 Unknown - - 6 PT 2011-2 - Limpopo - JX976481 23.059S 30.067E M - 7 C. leucogaster
- FMNH 184924
Madagascar EU716007 - 16.701S 46.072E M 11 -
- FMNH 184979
Madagascar EU716024 - 16.116S 46.757E F 12 -
- FMNH 188644
Madagascar EU716035 - 13.443S 48.348E F 13 -
- FMNH 184974
Madagascar - EU727524 16.414S 46.765E F - 18
- FMNH 188500
Madagascar - EU727463 13.353S 48.192E F - 19
- FMNH 184608
Madagascar - EU727517 15.713S 44.530E M - 20
C. atsinanana Madagascar JN867806 JN867854 M. leucostigma Madagascar EF474049 FJ546305 M. midas Madagascar EF474049 EF474034
158
161
162
CHAPTER THREE Discordance between mitochondrial and nuclear genetic structure
in the bat, Chaerephon pumilus s. l. (Chiroptera: Molossidae)
from South Africa
ABSTRACT
The aim of this study was to investigate the evolutionary determinants of genetic structure in
the molossid bat, C. pumilus s.l. from South Africa based on 306 nucleotides of the
mitochondrial control region and 6 microsatellite markers. We recovered strong
mitochondrial genetic structure, with 90% of the molecular variance occurring among four
phylogenetically-defined groups, and a high significant Fst (0.897). Mismatch distributions
and Bayesian skyline analyses of mitochondrial data indicated that the sample comprised
subgroups which were at demographic equilibrium over the Late Pleistocene era. Analyses
based on microsatellite data contrasted strongly with the mitochondrial data, as three admixed
populations were recovered. Only 3% of the nuclear variance occurred among populations,
and global (Fst=0.037) and pairwise Fst values among populations were low and not
significant. This is indicative of little nuclear genetic structure among the groups of C.
pumilus s.l., which appear to comprise a single interbreeding population. We recovered
significant Fis values for three of the six microsatellite markers, but not globally, indicative
of some population inbreeding. Such high levels of mitochondrial genetic structure in the
absence of significant nuclear structure are consistent with social isolation mechanisms such
as female philopatry.
Keywords: microsatellites, mitochondrial, population structure, genetic variation
163
Introduction The use of molecular genetic tools offers a powerful approach for elucidating the
historical (i.e. isolation in geographic refugia, bottlenecks, range expansion and colonization
events) and contemporary (i.e. gene flow, breeding structure and reproductive success)
processes that might influence the genetic variation and population genetic structure of taxa
(Neubaum et al., 2007). These tools are particularly useful in bats, which are difficult to
observe due to their nocturnal nature and high mobility (Bryja et al., 2009). Recent work
within the Order Chiroptera has revealed patterns of cryptic diversity (e.g. Kingston &
Rossiter, 2004; Thabah et al., 2006; Racey et al., 2007; Ramasindrazana et al., 2011) as well
the existence of distinct species (Li et al., 2006; Larsen et al., 2007; Baker et al., 2009;
Goodman et al., 2009; Goodman et al., 2010) using mitochondrial DNA markers.
Understanding the relative roles of historical and contemporary processes requires comparing
phylogenetic patterns across a multitude of genetic characters which evolve at different rates
(Karl & Avise, 1992; Palumbi & Baker, 1994; Ballard et al., 2002; Wiens & Penkrot, 2002).
For example, Turmelle (2002) discovered two divergent mitochondrial lineages of the big
brown bat (Eptesicus fuscus) occurring in sympatry in North America, but subsequent work
using nuclear DNA demonstrated hybridization between these two lineages (Neubaum et al.,
2007). Several other studies have also found greater population differentiation using
mitochondrial markers (Wilmer et al. 1999; Piertney et al. 2000; Wirth & Bernatchez 2001).
The little free-tailed bat, Chaerephon pumilus (Cretzchmar 1830-31) (Chiroptera:
Molossidae), has a broad distribution across sub-Saharan Africa, extending to the Arabian
Peninsula and islands in the western Indian Ocean (Peterson et al., 1995; Bouchard, 1998;
Simmons, 2005). Goodman et al. (2010) used mitochondrial sequence data to show that C. p.
pumilus from Massawa formed a separate clade from other forms of this species elsewhere on
the African continent, henceforth referred to as C. pumilus sensu lato (s.l.). Mitochondrial

164
DNA analyses have revealed several well supported, morphologically homogeneous,
sympatric clades within C. pumilus s.l. in eastern South Africa and neighbouring Swaziland,
separated by cytochrome b genetic distances of ~0.7 % (Naidoo et al., 2013). These are likely
to reflect intraspecific genetic variability (Baker & Bradley, 2006) even though divergence
values between molossid bat species (Lamb et al. 2008, Ratrimomanarivo et al. 2008,
Goodman et al. 2010) are often lower than the range of interspecific values (3.3% - 14.7%)
reported by Baker & Bradley (2006).
There are a number of potential explanations for the existence of discrete sympatric
mitochondrial lineages of C.pumilus s.l. in South Africa. Although many bat populations
show near panmixia, there is always some degree of population structure due to behavioural
barriers such as those created by female philopatry (Worthington-Wilmer et al., 1994; Lowe,
Harris & Ashton, 2004). Worthington-Wilmer (1994) reported control region divergences of
up to 6% among populations of the Australian Ghost Bat, Macroderma gigas, with 8% of the
variance occurring among divergent lineages. This extreme structuring is proposed to be the
result of long-term isolation accentuated by female philopatry. Lamb et al. (2012) reported
similar levels of structuring of the control region in the recently described C. atsinanana from
eastern Madagascar, with female philopatry as a potential explanation.
Alternatively, the observed mitochondrial genetic structuring in C. pumilus s.l. may
have been the result of expansion from glacial refugia. During the glacial cycles of the late
Pleistocene southern Africa experienced cooler, drier conditions that could have lead to
refugial use by regional biodiversity. Glaciation events were influential in shaping patterns of
genetic diversification among taxa (Matthee & Robinson 1997; Hewitt 2000; Flagstad et al.
2001; Muwanika et al. 2003; Hewitt 2004; Anthony et al. 2007; Brown et al. 2007; Voelker
et al. 2010; Miller et al. 2011). Cyclical periods of glaciation would have resulted in animals
retreating into refugia, from which recolonisation of partially genetically differentiated

165
populations may have occurred. Mitochondrial and microsatellite data have provided
information on how post-glacial events have influenced current population structure in a
range of species (Heckel et al. 2005; Howes et al. 2006; Jadwiszczak et al. 2006; Brito,
2007). Furthermore, refugia may have indirectly influenced the distribution of insect prey.
This may have facilitated the maintenance and expansion of C. pumilus s.l. lineages in South
Africa (Naidoo et al., 2013).
Introgression of mitochondrial DNA resulting from past hybridization events may
also account for the presence of genetically diverse clades (Bachtrog et al., 2006); this has
been documented in several bat genera, but not yet within the Molossidae (Hoffman, Owen &
Baker, 2003; Berthier, Excoffier & Ruedi, 2006; Neubaum et al., 2007; Artyushin et al.,
2009; Mao et al., 2010; Sztencel-Jablonka & Bogdanowicz, 2012).
Hypervariable markers such as nuclear microsatellites, which evolve faster than
mitochondrial sequences such as control region sequences are useful in determining
differences in allele frequencies within and between populations and inferring the mode and
frequency of dispersal and gene flow in highly mobile mammals (Proctor et al., 2004).
Microsatellites have been used inter alia to study the effects of geographic barriers (Castella
et al., 2000; Bilgin et al., 2008), dispersal patterns (Castella, Ruedi & Excoffier, 2001; Kerth
et al., 2002; Bryja et al., 2009) and philopatry (Weyandt et al., 2005; Dixon et al., 2011;
Kerth & Van Schaik, 2012) on the population genetic structure of bats.
Our aim is to investigate population genetic structure in South African C. pumilus s.l.
based on the maternally-inherited mitochondrial control region and biparentally-inherited
microsatellite markers, with a view to identifying the evolutionary determinants of genetic
structure. Interpretation of the results is complicated by the different mutation rates of
mitochondrial sequences vs microsatellites, a problem in all studies based on more than one
marker type. A finding of strong mitochondrial genetic structure and little nuclear structure
166
would be consistent with female philopatry or introgression. Significant mitochondrial and
nuclear structure could be explained by incipient speciation, expansion from Pleistocene-era
glacial refugia or ecological factors such as prey selection.
Materials and Methods
Collection of samples
A total of 92 Chaerephon pumilus s.l. individuals were genotyped. Our sample of 57
bats was supplemented with tissues from 35 individuals captured by Taylor et al. (2009). C.
pumilus s.l. individuals were captured for this study using mist nets placed at their points of
entry to and exit from house roofs and in their flight paths over rivers. Groups of bats
sampled from a single roof space were regarded as potential colonies. The South African
sampling included various localities in the Durban area (KwaZulu-Natal Province),
Mpumalanga Province and neighbouring Swaziland (Appendix 1) (Fig. 1). Tissue samples
were obtained using a non-lethal method described by Worthington-Wilmer & Barratt (1996),
and preserved in 90% ethanol. All procedures were in accordance with the guidelines of the
American Society of Mammalogists (Sikes et al., 2011) and approved by the Animal Ethics
Committee of the University of Kwa-Zulu Natal.
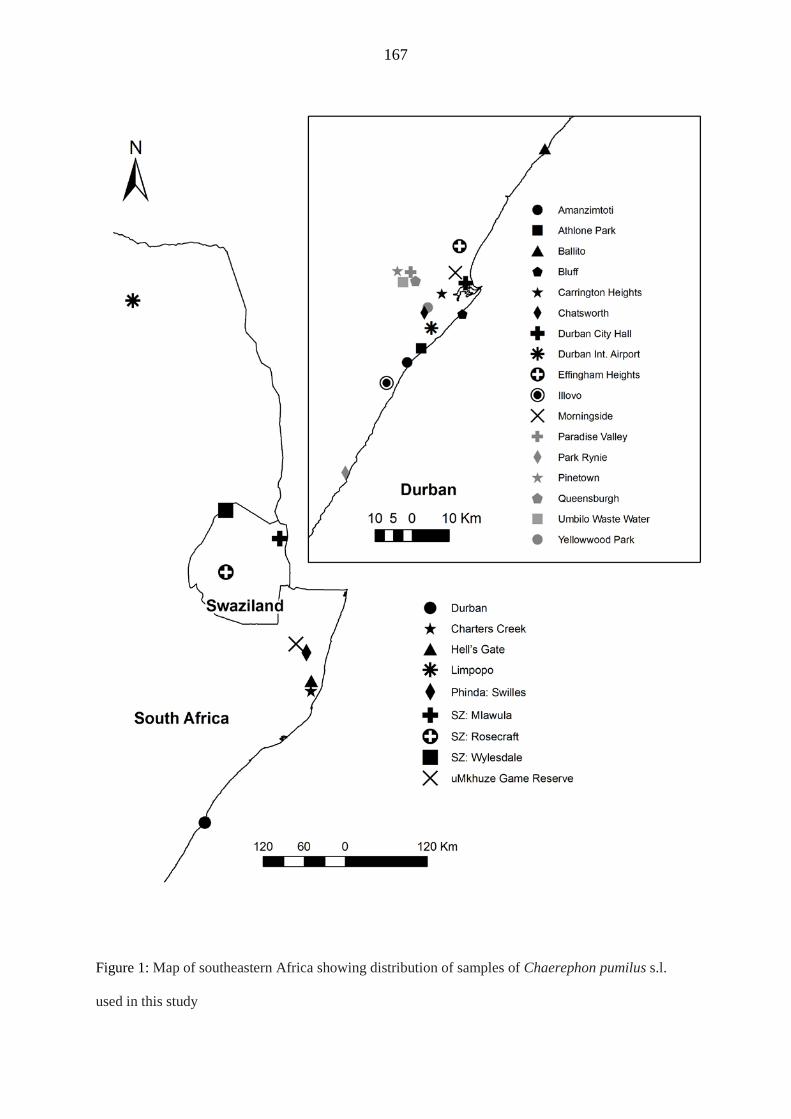
167
Figure 1: Map of southeastern Africa showing distribution of samples of Chaerephon pumilus s.l.
used in this study
168
Isolation of DNA and amplification of the mtDNA control region
The DNeasy® Blood and Tissue Kit (QIAGEN Inc.) was used to isolate genomic
DNA. Polymerase Chain Reaction (PCR) amplifications were performed in 25 μl volumes
with each reaction containing: 3 ngμl-1DNA, 1.0mM 10 X reaction buffer (Super-Therm),
25 mM MgCl2 (Super-Therm), 10 mM deoxynucleoside-triphosphate mixture (dNTPs)
(Fermentas), 5 u/μlTaq polymerase (Super-Therm) and 6 μM of each primer (forward and
reverse) per reaction.
The mitochondrial control region was PCR-amplified as a single fragment using
primers P (5’-TCCTACCATCAGCACCCAAAG C –3’) and E (5’-
CCTGAAGTAGGAACCAGA TG -3’) (Wilkinson & Chapman, 1991; Wilkinson et al.,
1997). The thermal cycling parameters used were: 94°C for 4 min, followed by 94°C for 1
min, 55°C for 1.30 min and 72°C for 2 min (40 cycles) and followed by 72°C for 7 min.
Amplified fragments were purified from excised gel bands using the ZymoClean Gel
Extraction Kit (Zymogen Inc.) and sequenced at Inqaba Biotechnical Industries, Muckleneuk,
Pretoria, South Africa. Sequences were aligned using the CLUSTAL W option
(Thompson,Higgins & Gibson, 1994) of the BioEdit programme (Hall, 1999) and further
adjusted by eye. Aligned sequences were cut to a common length of 306 base pairs. All new
sequences were deposited in GenBank (Appendix 1).
Network analysis of control region sequences
A statistical parsimony analysis of haplotypes was carried out in TCS version 1.13
(Clement, Posada & Crandall, 2000) to determine the number of networks formed at a 95%
parsimony connection. Networks were overlaid with information relating to roost
membership. In order to look for patterns consistent with possible female philopatry,
separate networks were created for each roost, overlaid with gender composition.
169
Sequence analysis of the control region
Phylogenetic analyses were carried out on haplotype data generated in DnaSP 5.10
(Librado & Rozas, 2009). The HKY sequence-evolution model (Hasegawa, Kishino& Yano,
1985) with invariant sites (HKY+I) was selected as the most appropriate model of sequence
evolution under the AIC criterion in jModelTest (Posada, 2008). PAUP* 4.0 (Swofford,
2002) was used to generate maximum likelihood (ML), maximum parsimony (MP) and
neighbour-joining (NJ) trees. Nodal support was estimated by bootstrap resampling analysis
using 1000 pseudoreplicates. The molossid bats Chaerephon atsinanana (FMNH 185315)
and Mops leucostigma (FMNH 185098) were used as outgroups.
Mismatch distributions and Bayesian skyline analysis of the control region
Mismatch distributions and Bayesian Skyline analyses were carried out for each of the
mitochondrially-defined sample groups in order to search for evidence of past population
expansion, possibly from Pleistocene-era glacial refugia. Mismatch distributions were plotted
with DnaSP version 5.1.0 (Librado & Rozas, 2009) and compared with the expectations for
populations in growth/decline or stasis. Past population dynamics of C. pumilus s. l. were also
estimated with a Bayesian skyline plot implemented in BEAST 1.5.4 (Drummond &
Rambaut, 2010). The parameter m (the number of grouped intervals) was set to five in order
not to over-parameterise the model. The Markov Chain Monte Carlo (MCMC) analysis was
run for 10 000 000 generations (sampled every 1000 iterations), of which the first 10% was
discarded as burn-in. The substitution model used was HKY. The plot was created using
TRACER 1.2.1 (Rambaut & Drummond, 2009).
170
Microsatellite amplification
Microsatellite analysis was carried out in order to investigate genetic structure in C.
pumilus s.l. based on biparentally-inherited nuclear data, to compare with patterns generated
using maternally-inherited mitochondrial control region data. We used 6 microsatellites
originally developed for the American molossid, Tadarida brasiliensis (Russell et al., 2005)
and optimised for use in C. pumilus s.l. (Naidoo, MacDonald & Lamb, 2013). All loci were
amplified under reaction conditions specified above for the control region. The thermal
cycling parameters were: 95̊ C for 1 min, followed by 95˚C for 30 sec, annealing temperature
for 30 sec, 72̊C for 2 min (for 39 cycles), followed by 72˚C for 10 min (optimal annealing
temperature for each primer in Table 1). STRs, labelled with the dyes 5’ 6-FAM and 5’
HEX, were genotyped on an ABI 3500 Genetic Analyzer (Applied Biosystems) at the South
African Sugar Research Institute (SASRI), Mount Edgecombe, South Africa. The presence
of simple sequence repeats was confirmed by sequencing of microsatellite bands.
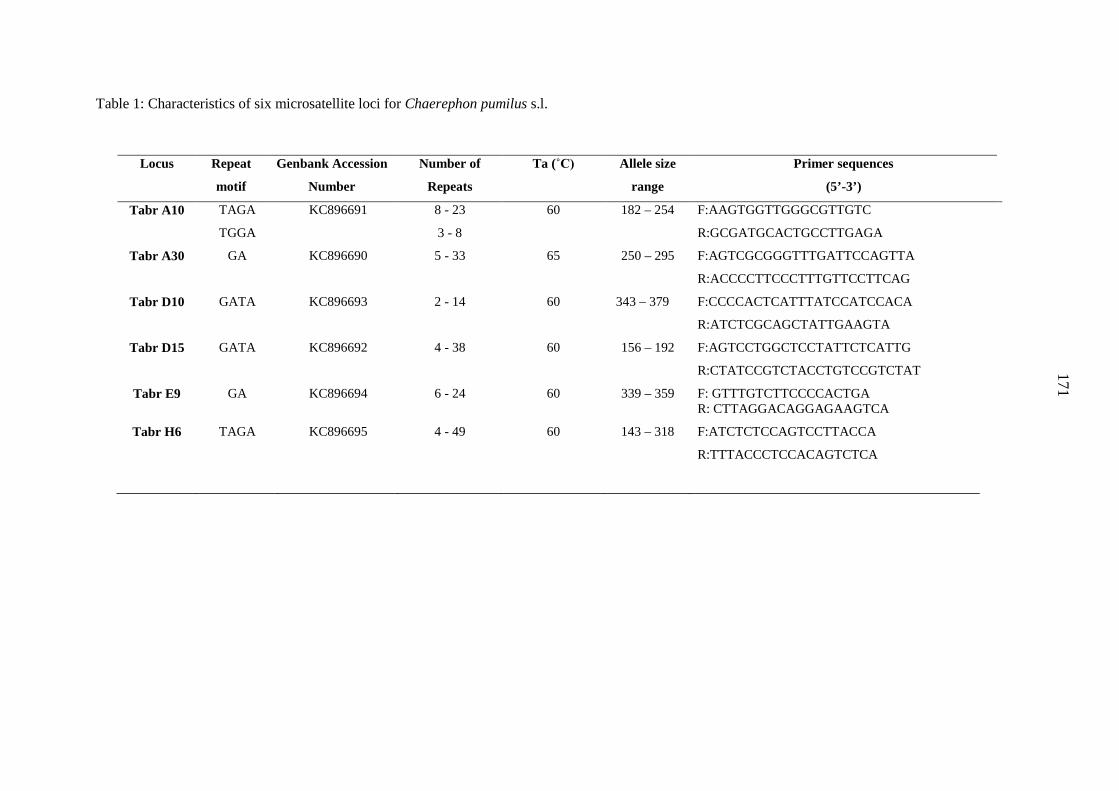
171
Table 1: Characteristics of six microsatellite loci for Chaerephon pumilus s.l.
Locus Repeat
motif
Genbank Accession
Number
Number of
Repeats
Ta (˚C) Allele size
range
Primer sequences
(5’-3’)
Tabr A10 TAGA
TGGA
KC896691 8 - 23
3 - 8
60 182 – 254 F:AAGTGGTTGGGCGTTGTC
R:GCGATGCACTGCCTTGAGA
Tabr A30 GA KC896690 5 - 33 65 250 – 295 F:AGTCGCGGGTTTGATTCCAGTTA
R:ACCCCTTCCCTTTGTTCCTTCAG
Tabr D10 GATA KC896693 2 - 14 60 343 – 379 F:CCCCACTCATTTATCCATCCACA
R:ATCTCGCAGCTATTGAAGTA
Tabr D15 GATA KC896692 4 - 38 60 156 – 192 F:AGTCCTGGCTCCTATTCTCATTG
R:CTATCCGTCTACCTGTCCGTCTAT
Tabr E9 GA KC896694 6 - 24 60 339 – 359 F: GTTTGTCTTCCCCACTGA R: CTTAGGACAGGAGAAGTCA
Tabr H6 TAGA KC896695 4 - 49 60 143 – 318 F:ATCTCTCCAGTCCTTACCA
R:TTTACCCTCCACAGTCTCA
171
172
Microsatellite Analysis
Microsatellites from 74 individuals were successfully amplified and analysed
according to groups defined in the control region sequence analysis. Data were scored
manually using STRand v. 2.2.30 (Locke, Baacke & Toone, 2000) and checked for errors in
scoring due to stuttering, large allele dropout or null alleles using Micro-checker (van
Oosterhout et al., 2004). Data were further explored using GenAlex 6 (Peakall & Smouse,
2006). Microsatellite analyser (Dieringer & Schlotterer, 2003) and Genepop (Raymond &
Rousset, 1995) were used to calculate genetic diversity, including the number of alleles (N),
the mean (Na) and effective (Ne) number of alleles per population, the Shannon-information
index (I), the expected (He) and observed (Ho) heterozygosity, departures from Hardy-
Weinberg equilibrium (HWE) and pairwise G’st values. Allelic Richness (R), pairwise Fsts
and linkage disequilibrium amongst populations were determined in F-Stat version 2.9.3
(Goudet, 1995).
Population structure was inferred using a model-based clustering method
implemented in STRUCTURE v2.2.4 (Pritchard, Stephens & Donnelly, 2000). The
programme determines the most likely number of genetic clusters (K) in the dataset by using
a Markov Chain Monte Carlo procedure to estimate Pr(X/K), the posterior probability that the
data fit the hypothesis of K clusters. The fractional membership of each individual in each
cluster is calculated. As there are complexities in determining the optimal value of K, we
calculated ∆K, a measure of the second order rate of change in the likelihood of K (Evanno,
Regnaut & Goudet, 2005). The modal value of ∆K corresponds to the most apparent genetic
subdivision present in the dataset. Burnin length was fixed to 100 000 and 1500 000
iterations were computed for each value of K (the number of populations) from1 to 5.
Indirect methods of measuring gene flow are often inappropriate because natural sets
of populations may not be at equilibrium (Whitlock & McCauley, 1999). Therefore,
173
GENECLASS 2.0 (Piry et al. 2004) was used to conduct self-assignment and population
simulations to test for first generation migrants. The assignment test was performed using the
Bayesian method of Rannala and Mountain (1997). The detection of migrants was conducted
using the L_home/L_home_max criterion with Monte Carlo resampling (Paetkau et al. 2004)
and an alpha level of 0.01.
AMOVA
Analysis of molecular variance was carried out in Arlequin 3.11 (Excoffier, Laval &
Schneider, 2005) for both mitochondrial and microsatellite datasets in order to determine
levels of genetic structuring among groups identified in phylogenetic analysis of the control
region dataset. Fixation indices were calculated and significance tested using a 1000
permutation approach described by Excoffier, Smouse & Quattro (1992), consisting of
permuting haplotypes and loci among groups and within groups.
Results
Mitochondrial control region
The control region alignment was trimmed to a length of 306 base pairs. Of the 242
variable sites, 46 were parsimony informative and 77 were singletons. Control region
sequences of 92 individuals yielded 19 haplotypes – 10 samples that did not sequence
correctly were excluded from the analysis. The ingroup dataset comprised 17 haplotypes with
a haplotype diversity of 0.837 and nucleotide diversity of 0.036 (Appendix 1).
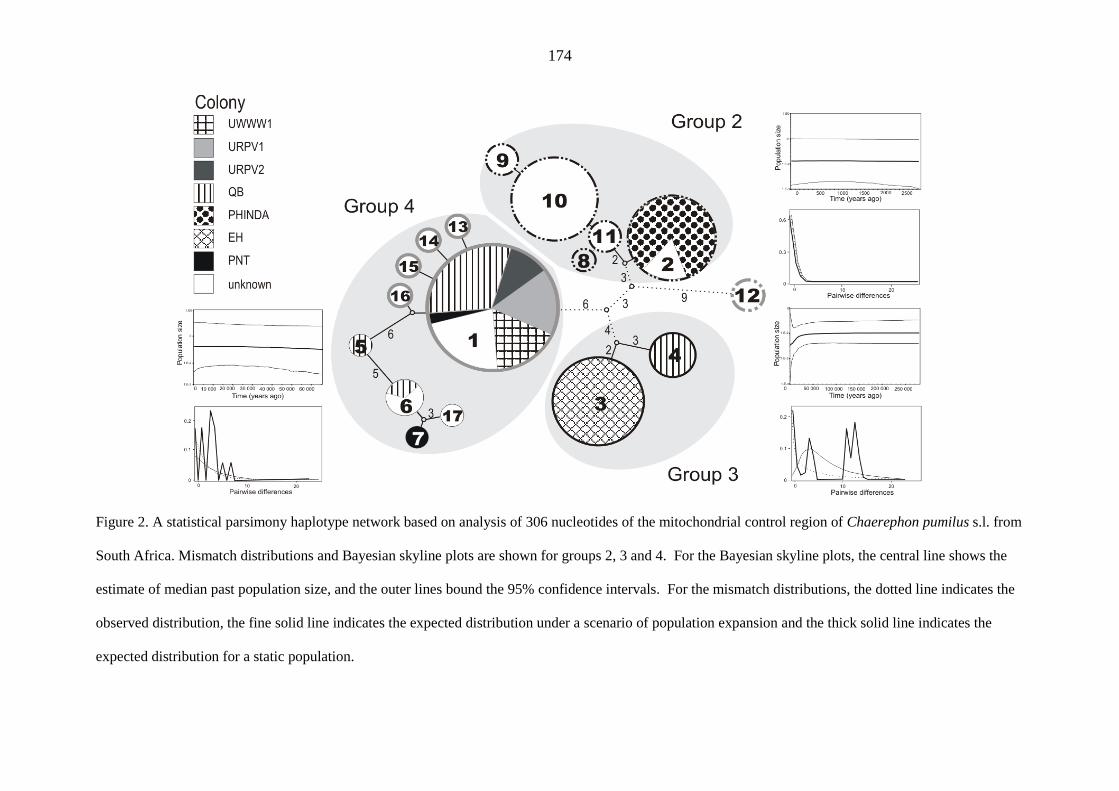
174
Figure 2. A statistical parsimony haplotype network based on analysis of 306 nucleotides of the mitochondrial control region of Chaerephon pumilus s.l. from
South Africa. Mismatch distributions and Bayesian skyline plots are shown for groups 2, 3 and 4. For the Bayesian skyline plots, the central line shows the
estimate of median past population size, and the outer lines bound the 95% confidence intervals. For the mismatch distributions, the dotted line indicates the
observed distribution, the fine solid line indicates the expected distribution under a scenario of population expansion and the thick solid line indicates the
expected distribution for a static population.
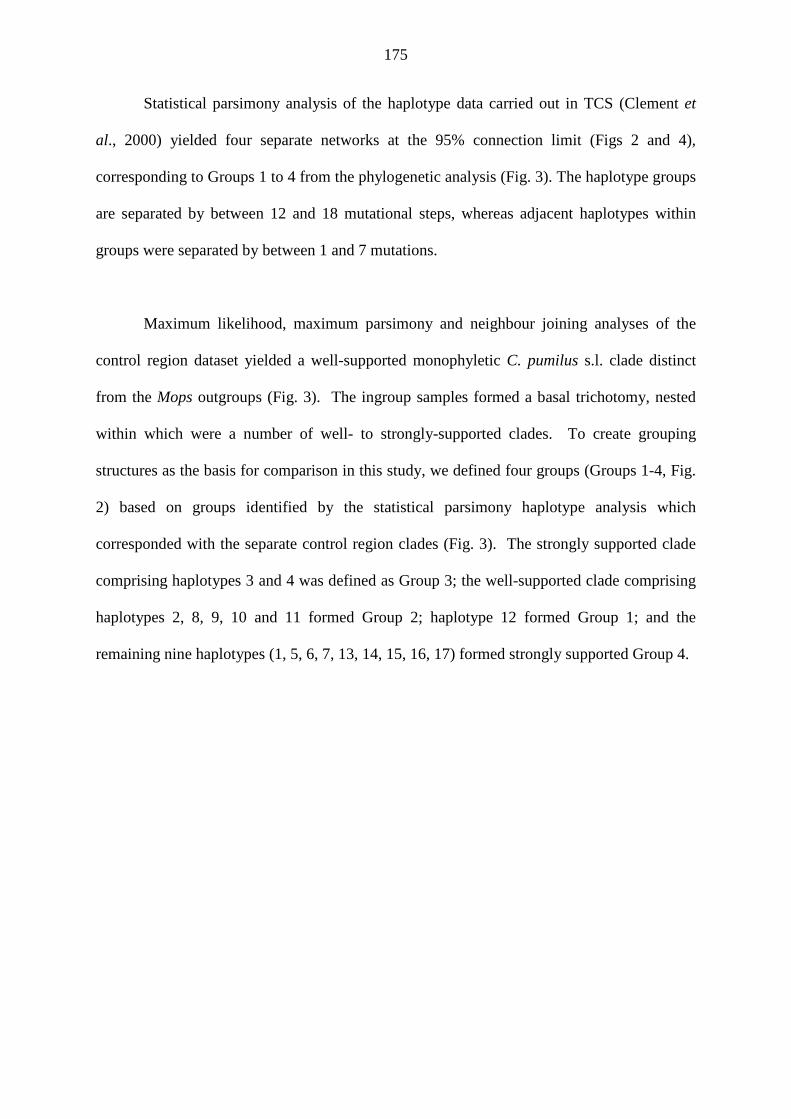
175
Statistical parsimony analysis of the haplotype data carried out in TCS (Clement et
al., 2000) yielded four separate networks at the 95% connection limit (Figs 2 and 4),
corresponding to Groups 1 to 4 from the phylogenetic analysis (Fig. 3). The haplotype groups
are separated by between 12 and 18 mutational steps, whereas adjacent haplotypes within
groups were separated by between 1 and 7 mutations.
Maximum likelihood, maximum parsimony and neighbour joining analyses of the
control region dataset yielded a well-supported monophyletic C. pumilus s.l. clade distinct
from the Mops outgroups (Fig. 3). The ingroup samples formed a basal trichotomy, nested
within which were a number of well- to strongly-supported clades. To create grouping
structures as the basis for comparison in this study, we defined four groups (Groups 1-4, Fig.
2) based on groups identified by the statistical parsimony haplotype analysis which
corresponded with the separate control region clades (Fig. 3). The strongly supported clade
comprising haplotypes 3 and 4 was defined as Group 3; the well-supported clade comprising
haplotypes 2, 8, 9, 10 and 11 formed Group 2; haplotype 12 formed Group 1; and the
remaining nine haplotypes (1, 5, 6, 7, 13, 14, 15, 16, 17) formed strongly supported Group 4.
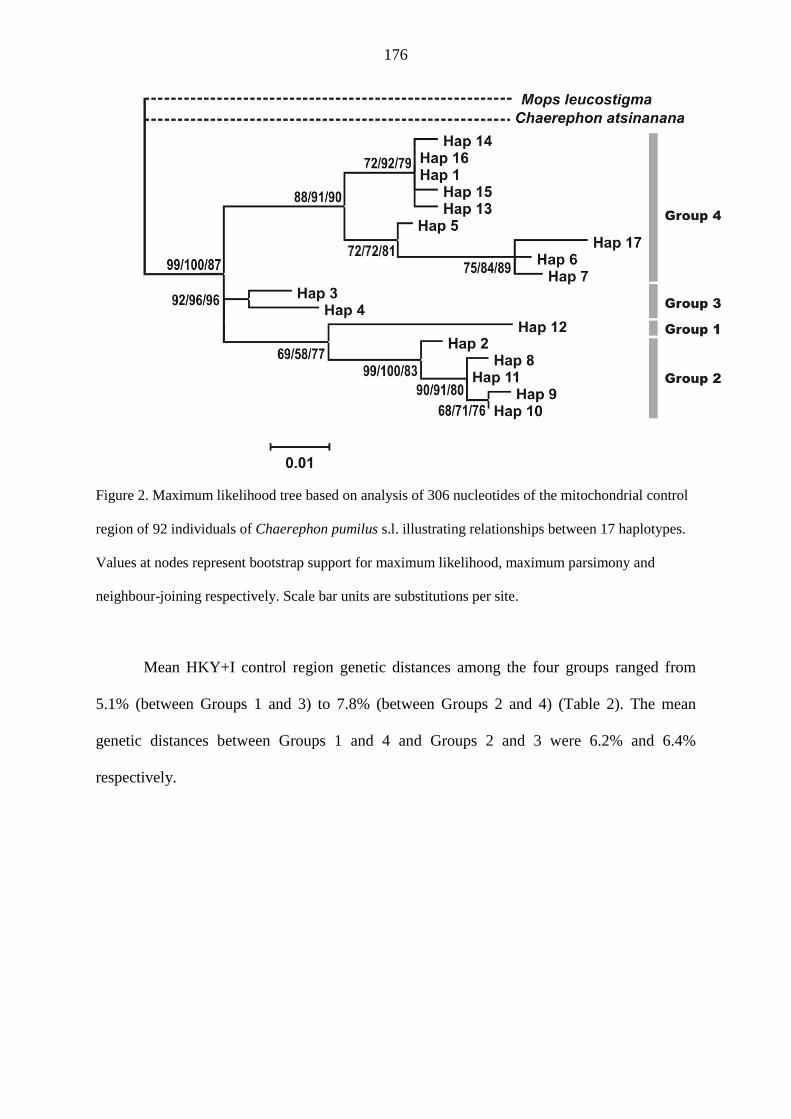
176
Figure 2. Maximum likelihood tree based on analysis of 306 nucleotides of the mitochondrial control
region of 92 individuals of Chaerephon pumilus s.l. illustrating relationships between 17 haplotypes.
Values at nodes represent bootstrap support for maximum likelihood, maximum parsimony and
neighbour-joining respectively. Scale bar units are substitutions per site.
Mean HKY+I control region genetic distances among the four groups ranged from
5.1% (between Groups 1 and 3) to 7.8% (between Groups 2 and 4) (Table 2). The mean
genetic distances between Groups 1 and 4 and Groups 2 and 3 were 6.2% and 6.4%
respectively.
177
Table 2. Mean pairwise genetic distances using the HKY+I model among the four phylogenetically
defined groups of Chaerephon haplotypes based on 306 bp of the control region.
Groups 1 2 3 4
1 -
2 0.055 -
3 0.051 0.064 -
4 0.062 0.078 0.056 -
Information on colony membership was available only for the samples trapped
specifically for this study (Appendix 1). Individual haplotypes represented between one and
29 samples. The most common haplotype (H1) was present in five colonies, whereas all other
haplotypes were restricted to only one of our sampled colonies. Whereas most colonies
(UWWW1, URPV1, URPV2, PH, EH) comprised only one haplotype, colonies QB and PNT
comprised three and two haplotypes, respectively (Figs. 2 and 4). With the exception of one
juvenile, all of the colony members trapped for this study were adults; 75% were females and
25% males. Individuals sampled from colonies UWWW1, URPV2 and PNT were all female,
whereas URPV1, PH, EH were predominantly female and QB contained similar proportions
of both males and females. A female-bias could be an indication of a system of female
philopatry.
Mismatch distributions and Bayesian skylines were plotted for sample groups 2, 3 and
4 (Fig. 3). The mismatch distributions for groups 3 and 4 were multimodal and ragged, but
not significantly so (Table 3), and conformed neither to the pattern expected for populations
in growth/decline or stasis. Such patterns are indicative of ancient, stable population
subdivisions (Rogers & Harpending, 1992). The corresponding Bayesian skyline plots were
consistent with an essentially constant past population size for the past 250 000 (Group 3) or
60 000 (Group 4) years, and showed no evidence of past population expansion. The mismatch
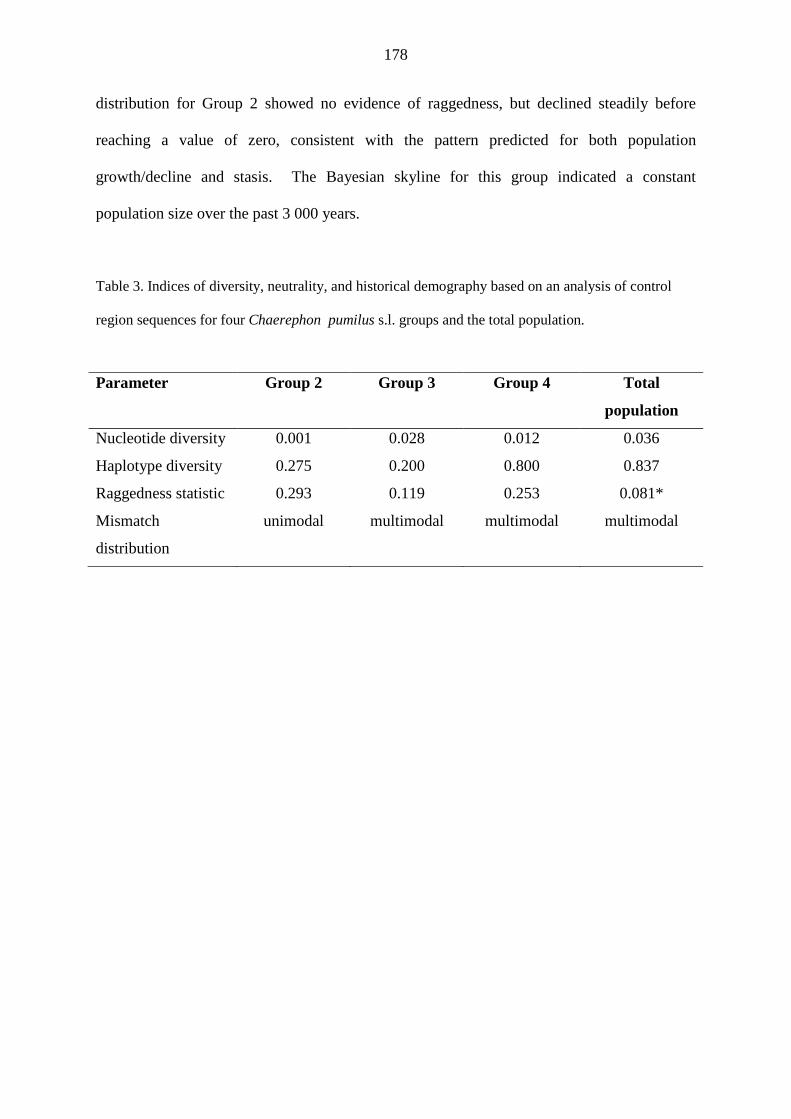
178
distribution for Group 2 showed no evidence of raggedness, but declined steadily before
reaching a value of zero, consistent with the pattern predicted for both population
growth/decline and stasis. The Bayesian skyline for this group indicated a constant
population size over the past 3 000 years.
Table 3. Indices of diversity, neutrality, and historical demography based on an analysis of control
region sequences for four Chaerephon pumilus s.l. groups and the total population.
Parameter Group 2 Group 3 Group 4 Total
population
Nucleotide diversity 0.001 0.028 0.012 0.036
Haplotype diversity 0.275 0.200 0.800 0.837
Raggedness statistic 0.293 0.119 0.253 0.081*
Mismatch
distribution
unimodal multimodal multimodal multimodal
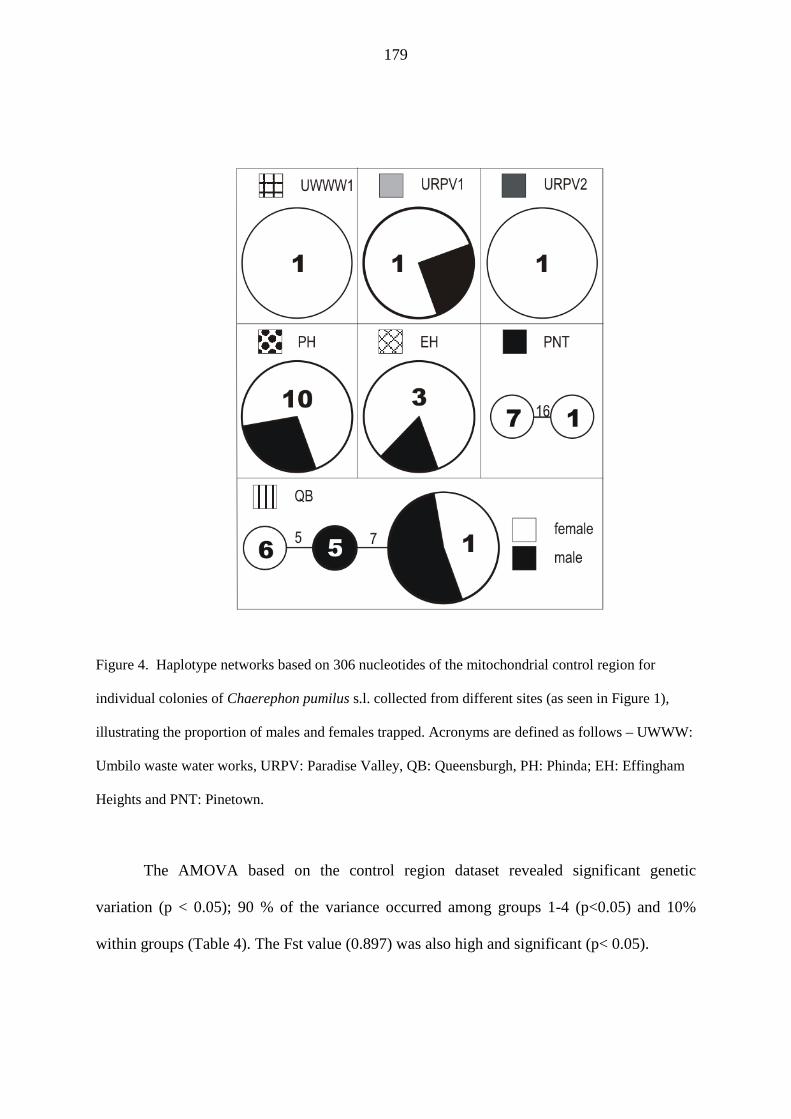
179
Figure 4. Haplotype networks based on 306 nucleotides of the mitochondrial control region for
individual colonies of Chaerephon pumilus s.l. collected from different sites (as seen in Figure 1),
illustrating the proportion of males and females trapped. Acronyms are defined as follows – UWWW:
Umbilo waste water works, URPV: Paradise Valley, QB: Queensburgh, PH: Phinda; EH: Effingham
Heights and PNT: Pinetown.
The AMOVA based on the control region dataset revealed significant genetic
variation (p < 0.05); 90 % of the variance occurred among groups 1-4 (p<0.05) and 10%
within groups (Table 4). The Fst value (0.897) was also high and significant (p< 0.05).
178
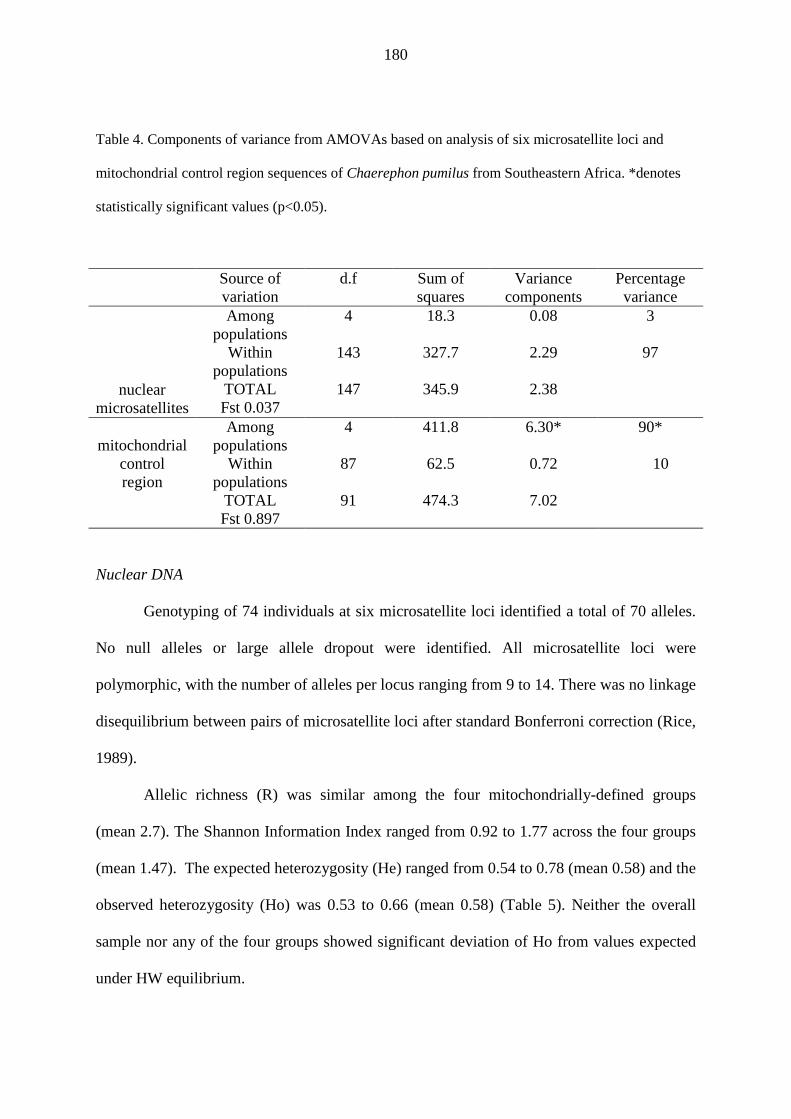
180
Table 4. Components of variance from AMOVAs based on analysis of six microsatellite loci and
mitochondrial control region sequences of Chaerephon pumilus from Southeastern Africa. *denotes
statistically significant values (p<0.05).
Source of variation
d.f Sum of squares
Variance components
Percentage variance
nuclear microsatellites
Among populations
4 18.3 0.08 3
Within populations
143 327.7 2.29 97
TOTAL 147 345.9 2.38 Fst 0.037
mitochondrial
control region
Among populations
4 411.8 6.30* 90*
Within populations
87 62.5 0.72 10
TOTAL 91 474.3 7.02 Fst 0.897
Nuclear DNA
Genotyping of 74 individuals at six microsatellite loci identified a total of 70 alleles.
No null alleles or large allele dropout were identified. All microsatellite loci were
polymorphic, with the number of alleles per locus ranging from 9 to 14. There was no linkage
disequilibrium between pairs of microsatellite loci after standard Bonferroni correction (Rice,
1989).
Allelic richness (R) was similar among the four mitochondrially-defined groups
(mean 2.7). The Shannon Information Index ranged from 0.92 to 1.77 across the four groups
(mean 1.47). The expected heterozygosity (He) ranged from 0.54 to 0.78 (mean 0.58) and the
observed heterozygosity (Ho) was 0.53 to 0.66 (mean 0.58) (Table 5). Neither the overall
sample nor any of the four groups showed significant deviation of Ho from values expected
under HW equilibrium.
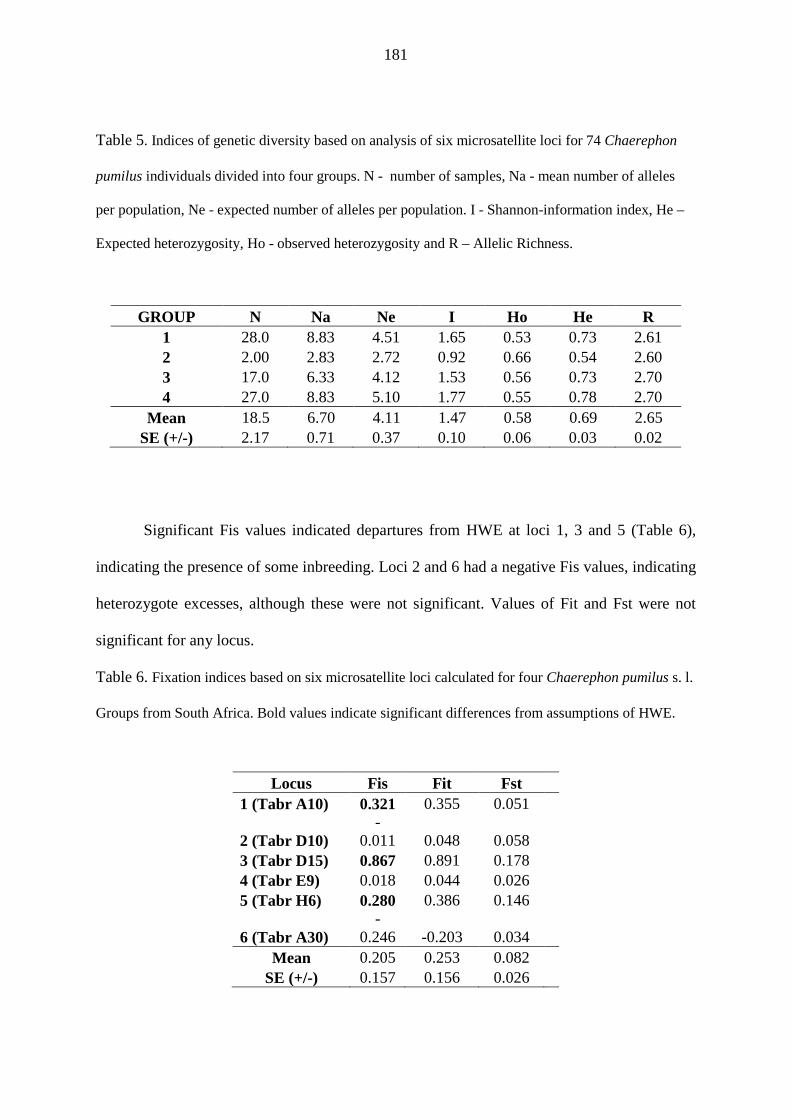
181
Table 5. Indices of genetic diversity based on analysis of six microsatellite loci for 74 Chaerephon
pumilus individuals divided into four groups. N - number of samples, Na - mean number of alleles
per population, Ne - expected number of alleles per population. I - Shannon-information index, He –
Expected heterozygosity, Ho - observed heterozygosity and R – Allelic Richness.
GROUP N Na Ne I Ho He R 1 28.0 8.83 4.51 1.65 0.53 0.73 2.61 2 2.00 2.83 2.72 0.92 0.66 0.54 2.60 3 17.0 6.33 4.12 1.53 0.56 0.73 2.70 4 27.0 8.83 5.10 1.77 0.55 0.78 2.70
Mean 18.5 6.70 4.11 1.47 0.58 0.69 2.65 SE (+/-) 2.17 0.71 0.37 0.10 0.06 0.03 0.02
Significant Fis values indicated departures from HWE at loci 1, 3 and 5 (Table 6),
indicating the presence of some inbreeding. Loci 2 and 6 had a negative Fis values, indicating
heterozygote excesses, although these were not significant. Values of Fit and Fst were not
significant for any locus.
Table 6. Fixation indices based on six microsatellite loci calculated for four Chaerephon pumilus s. l.
Groups from South Africa. Bold values indicate significant differences from assumptions of HWE.
Locus Fis Fit Fst 1 (Tabr A10) 0.321 0.355 0.051
2 (Tabr D10) -
0.011 0.048 0.058 3 (Tabr D15) 0.867 0.891 0.178 4 (Tabr E9) 0.018 0.044 0.026 5 (Tabr H6) 0.280 0.386 0.146
6 (Tabr A30) -
0.246 -0.203 0.034 Mean 0.205 0.253 0.082
SE (+/-) 0.157 0.156 0.026
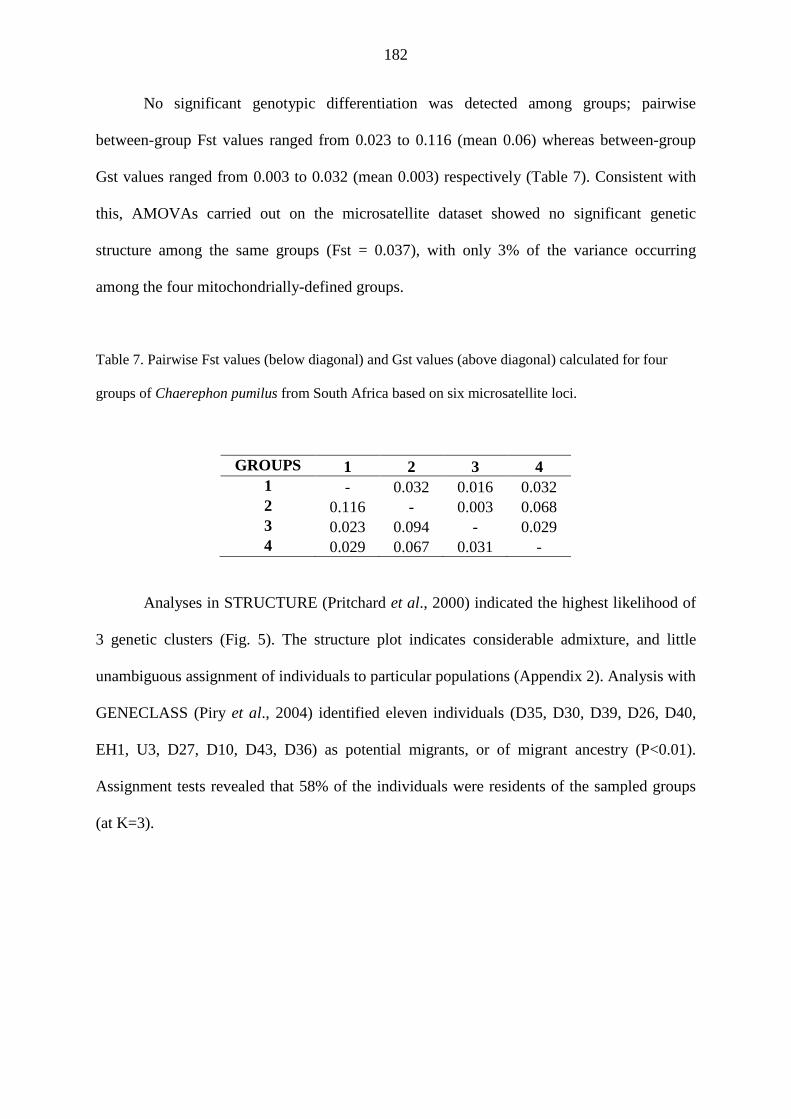
182
No significant genotypic differentiation was detected among groups; pairwise
between-group Fst values ranged from 0.023 to 0.116 (mean 0.06) whereas between-group
Gst values ranged from 0.003 to 0.032 (mean 0.003) respectively (Table 7). Consistent with
this, AMOVAs carried out on the microsatellite dataset showed no significant genetic
structure among the same groups (Fst = 0.037), with only 3% of the variance occurring
among the four mitochondrially-defined groups.
Table 7. Pairwise Fst values (below diagonal) and Gst values (above diagonal) calculated for four
groups of Chaerephon pumilus from South Africa based on six microsatellite loci.
GROUPS 1 2 3 4 1 - 0.032 0.016 0.032 2 0.116 - 0.003 0.068 3 0.023 0.094 - 0.029 4 0.029 0.067 0.031 -
Analyses in STRUCTURE (Pritchard et al., 2000) indicated the highest likelihood of
3 genetic clusters (Fig. 5). The structure plot indicates considerable admixture, and little
unambiguous assignment of individuals to particular populations (Appendix 2). Analysis with
GENECLASS (Piry et al., 2004) identified eleven individuals (D35, D30, D39, D26, D40,
EH1, U3, D27, D10, D43, D36) as potential migrants, or of migrant ancestry (P<0.01).
Assignment tests revealed that 58% of the individuals were residents of the sampled groups
(at K=3).
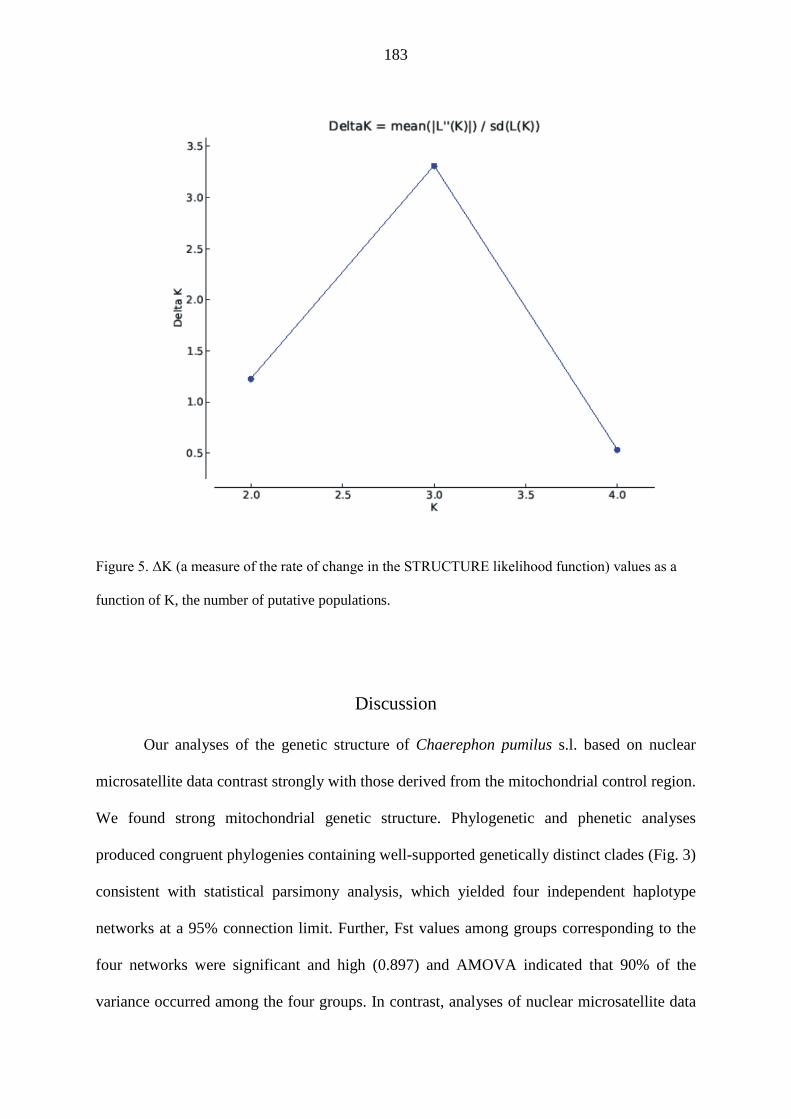
183
Figure 5. ΔK (a measure of the rate of change in the STRUCTURE likelihood function) values as a
function of K, the number of putative populations.
Discussion
Our analyses of the genetic structure of Chaerephon pumilus s.l. based on nuclear
microsatellite data contrast strongly with those derived from the mitochondrial control region.
We found strong mitochondrial genetic structure. Phylogenetic and phenetic analyses
produced congruent phylogenies containing well-supported genetically distinct clades (Fig. 3)
consistent with statistical parsimony analysis, which yielded four independent haplotype
networks at a 95% connection limit. Further, Fst values among groups corresponding to the
four networks were significant and high (0.897) and AMOVA indicated that 90% of the
variance occurred among the four groups. In contrast, analyses of nuclear microsatellite data
184
recovered a likely three admixed populations with low and non-significant among-population
pairwise Fst values (0.023 – 0.116). Consistently, AMOVA revealed only 3% of the nuclear
variance among the four mitochondrially-defined groups. This low level of nuclear genetic
structure is consistent with a single interbreeding population of C. pumilus s.l. from South
Africa and Swaziland. These data are less likely to be explained by incipient speciation,
expansion from Pleistocene-era glacial refugia or ecological factors such as prey selection,
unless very recent, these are likely to manifest as significant mitochondrial and nuclear
genetic structure.
The haplotype network based on the mitochondrial control region formed a pattern in
which generally fewer mutational steps separated haplotypes within network groups than
between them, characteristic of a subdivided overall population and opposite to the star-
shaped structure expected of a single expanding population (Excoffier, Foll & Petit, 2009).
Consistent with this, neither the Bayesian skyline analyses nor the mismatch distribution
analyses produced clear evidence of past population expansion, either of the overall
population or of any of the four mitochondirally-defined subgroups. Both global (Naidoo et
al. 2013) and subgroup-based Bayesian skyline analyses revealed a constant population size
over the Late Pleistocene. Furthermore, the ragged mismatch distributions (overall and for
groups 3 and 4) were characteristic of subdivided populations at demographic equilibrium
(Slatkin & Hudson, 1991; Rogers & Harpending, 1992; Schneider & Excoffier, 1999). The
absence of signatures of past population expansion in C. pumilus s.l. from South Africa
contrasts with the findings of Taylor et al. (2009), who suggested that populations of this bat
underwent cycles of contraction into and expansion from refugia, corresponding with glacial
and interglacial periods in the Late Pleistocene. This difference may be due to the larger
sample sizes used in this study. Our finding based on mitochondrial data of subdivided South
African C. pumilus s.l. populations at demographic equilibrium contrasts with that of
185
Stoffberg, Schoeman & Matthee (2012), who found Pleistocene-era population expansions in
populations of the southern African bat Rhinolophus clivosus s.l. Thus the observed strong
genetic structuring in C. pumilus s.l., is unlikely to be a result of postglacial expansion, and
suggests that different processes are driving the evolution of population structure in these two
bat species despite their overlapping ranges.
Analyses of the nuclear dataset using STRUCTURE indicated the presence of three
weak genetic clusters of C. pumilus s. l., whereas four strongly subdivided populations were
revealed by analyses of the maternally-inherited mitochondrial dataset. Because one-half of
the nuclear DNA is maternally-inherited, some congruence between mitochondrial and
nuclear genetic structure is to be expected (Ramos Pereira et al., 2009). Assignment tests in
GENECLASS assigned 58% of the individuals to the group of origin, but also identified
several individuals with migrant ancestry or as potential migrants, providing direct genetic
evidence of individual dispersal events between groups (Paetkau et al. 2004; Bergl &
Vigilant 2007).
Strong mitochondrial genetic structure combined with weak or absent nuclear
structure suggests female philopatry and male-biased dispersal (Greenwood, 1980), and has
been found in C. atsinanana (Lamb et al., 2012), Nyctalus noctula (Petit & Mayer, 1999),
Plecotus auritus (Burland et al., 2001), Myotis myotis (Castellaet al., 2001), M. bechsteinii
(Kerth, Mayer & Petit,2002) and M. septentrionalis (Arnold et al., 2007). Mean control
region genetic distances between groups of C. pumilus s.l. ranged from 5.1% - 7.8%, similar
to values reported for other bats such as Malagasy Myotis goudoti (mean 4.2%, maximum
9%; Weyeneth et al., 2011), Macroderma gigas (maximum 6%; Worthington-Wilmer et al.
1994) and Chaerephon atsinanana (4.95% – 8.14%; Lamb et al. 2012), suggested to show
female philopatry. Natal female philopatry, if present in C. pumilus s.l., may be explained by
advantages associated with social structure, including the use of familiar and successful roost
186
sites, and long-term associations with colony members, which may or may not be genetically
related (Wilkinson, 1985; Boughman & Wilkinson, 1998; Kerth, Wagner & Konig, 2001).
Further, male-biased natal dispersal may lower levels of inbreeding or competition for mates
via extra-colony copulation and low male reproductive skew (Burland et al., 2001).
However, little is known about the roosting ecology of C. pumilus s l.
Five of the seven C. pumilus s.l. colonies that we sampled contained a single control
region haplotype (Fig. 4). Under a system of female philopatry, it may be that the males are
sub-adult progeny of the females, sharing their mitochondrial genomes. Bats sampled at site
PNT comprised two divergent female haplotypes, which may suggest the presence of two
separate colonies within this single roost. Bats sampled at site QB comprised 17 individuals
exhibiting three divergent control region haplotypes, one of which was all male, one all
female, and one of mixed gender. We propose that this might reflect the presence of more
than one colony, and of genetically divergent males within this single roost space. In
addition, we recovered significant Fis values for three of the six microsatellite markers, but
not globally, which indicates a degree of inbreeding. More detailed analyses on larger
complete samples of groups of bats roosting in different colonies, in combination with
behavioural, echolocation and radio-tracking experiments are necessary to confirm a social
structure based on female philopatry.
Low levels of nuclear genetic structure in C. pumilus s.l. are an indication of high
levels of gene flow and panmixia over the sampled region, such as may be expected strong-
flying bats capable of covering considerable distances. Generally, there is a trend showing
less phylogeographic structure in more vagile bat species that fly greater distances, such as
members of the Molossidae (McCracken, McCracken & Vawter, 1994; Webb & Tidemann,
1996; Russell et al., 2005). Within the Molossidae, there is evidence of a positive correlation
between dispersal ability (quantified as wing loading) and gene flow (Fst-Slatkin, 1987;
187
Slatkin & Barton, 1989) (Taylor et al., 2012). Because its wing loading values fall at the
intermediate range, C. pumilus s.l. might be expected to show more genetic structure than
large molossids such as Otomops, but less structure than the similarly sized C. atsinanana,
whose wing loading values are smaller than those of C. pumilus s.l. (Taylor et al., 2012).
Incomplete lineage sorting and retention of ancestral polymorphisms or gene flow
after secondary contact of diverged lineages are possibly better explanations than ‘past
hybridisation‘, which would have needed to occur between distinct species.
To summarize, we found significantly differentiated sympatric mitochondrial
lineages, in combination with limited nuclear differentiation in C. pumilus s.l. in South
Africa. These contrasting genetic patterns may indicate social isolation mechanisms such as
female philopatry and male dispersal, or possibly introgression of mitochondrial genes due to
past hybridisation events with mitochondrially-distinct taxa from outside the sampled area.
Alternatively, C. pumilus s.l. lineages may be in the early stages of speciation, as
mitochondrial lineages are usually not affected by recombination and achieve reciprocal
monophyly in about one quarter the time of the average nuclear gene in diploid sexual
organisms (Birky, 2013). Regardless, these results reinforce the notion that assessments of
genetic structure based on a single marker should be treated with caution.
Acknowledgements
We thankfully acknowledge financial support from the Volkswagen Foundation, The John D.
and Catherine T. MacArthur Foundation, and the National Research Foundation (South
Africa) for both fieldwork and laboratory work.
188
References
Anthony NM, Johnson-Bawe M, Jeffery K, Clifford SL, Abernethy KA, Tutin CE,
Lahm SA, White LJT, Utley JF, Wickings EJ, Bruford MW. 2007. The role of
Pleistocene refugia and rivers in shaping gorilla genetic diversity in central Africa.
Proceedings of the National Academy of Science 104: 20432–20436.
Arnold B. 2007. Population structure and sex-biased dispersal in the forest dwelling
vespertilionid bat, Myotis septentrionalis. American Midland Naturalist 157: 374-384.
Artyushin IV, Bannikova AA, Lebedev VS, Kruskop SV.2009. Mitochondrial DNA
relationships among North Palaearctic Eptesicus (Vespertilionidae, Chiroptera) and past
hybridization between common serotine and northern bat. Zootaxa 2262: 40-52.
Bachtog D, Thornton K, Clark A, Andolfatto P. 2006. Extensive introgression of
mitochondrial DNA relative to nuclear genes in the Drosphilayakuba species group.
Evolution 60: 292-302.
Baker RJ, Bradley RD.2006.Speciation in mammals and the genetic species concept.
Journal of Mammalogy 87: 643-662
Baker RJ, McDonough MM, Swier VJ, Larsen PA, Carrera JP, Ammerman LK. 2009.
New species of bonneted bat, Genus Eumops (Chiroptera: Molossidae) from the lowlands
of western Ecuador and Peru. Acta Chiropterologica 11: 1-13.
Ballard JW, Chernoff B, James AC. 2002. Divergence of mitochondrial DNA is not
corroborated by nuclear DNA, morphology, or behaviour in Drosophila simulans.
Evolution 56: 527-545.
Bergl RA, Vigilant L. 2007. Genetic analysis reveals population structure and recent
migration within the highly fragmented range of the Cross River gorilla (Gorilla gorilla
diehli). Molecular Ecology 16: 501-516.
Berthier P, Excoffier L, Ruedi M. 2006. Recurrent replacement of mtDNA and cryptic
hybridization between two sibling bat species Myotis myotis and Myotis blythii.
Proceedings of the Royal Society B 273: 3101-3123.
Bilgin R, Karatas A, Coraman E, Disotell T, Morales JC. 2008. Regionally and
climatically restricted patterns of distribution of genetic diversity in a migratory bat
species, Miniopterus schreibersii (Chiroptera: Vespertilionidae). BMC Evolutionary
Biology 8: 209.
189
Birky CW JR. 2013. Species detection and identification in sexual organisms using population
genetic theory and DNA sequences. PLoS ONE 8: e52544.
Bouchard S. 1998. Chaerephon pumilus. Mammalian Species 574: 1–6.
Boughman JW, Wilkinson GS. 1998.Greater spear-nosed bats discriminate group mates by
vocalisations. Animal Behaviour 55: 1717–1732.
Brito PH, 2007. Contrasting patterns of mitochondrial and microsatellite genetic structure
among Western European populations of tawny owls (Strix aluco). Molecular Ecology 16:
3423-3437.
Brown DM, Brenneman RA, Koepfli KP, Pollinger JP, Mila B, Georgiadis NJ, Louis Jr
EE, Grether GF, Jacobs DK, Wayne RK. 2007. Extensive population genetic structure
in the giraffe. BMC Biology 5 doi: 10.1186/1741-7007-5-57.
Bryant D, MoultonV.2004.Neighbor-Net: an agglomerative method for the construction of
phylogenetic networks. Molecular Biology and Evolution 21: 255–265.
Bryja J, Kanuch P, Fornuskova A, Bartonicka T, Rehak, Z. 2009. Low population genetic
structuring of two cryptic bat species suggests their migratory behaviour in continental
Europe. Biological Journal of the Linnean Society 96: 103-114.
Burland TM, Baratt EM, NIchols RA, Racey PA. 2001. Mating patterns, relatedness and
the basis of natal philopatry in the brown long-eared bat, Plecotus auritus. Molecular
Ecology 10: 1309-1321.
Castella V, Ruedi M, Excoffier L. 2001.Contrasted patterns of mitochondrial and nuclear
structure among nursery colonies of the bat Myotis myotis. Journal of Evolutionary
Biology 14: 708-720.
Castella V, Ruedi M, Excoffier L, Ibanez C, Arlettaz R,Hausser J. 2000. Is the Gibraltar
Strait a barrier to gene flow for the bat Myotis myotis (Chiroptera: Vespertilionidae)?
Molecular Ecology 9: 1761-1772.
Clement M, Posada D, Crandall KA.2000. TCS: a computer program to estimate gene
genealogies. Molecular Ecology 9: 1657-1660.
Dieringer C, Schlotterer C. 2003. Microsatellite Analyser (MSA): a platform independent
analysis tool for large microsatellite datasets. Molecular Ecology Notes 3: 167-169.
Dixon MD. 2011. Population genetic structure and natal philopatry in the widespread North
American bat Myotis lucifugus. Journal of Mammalogy 92: 1343-1351.
Drummond AJ, Rambaut A. 2010. BEAST: Bayesian evolutionary analysis sampling trees,
version 1.5.4.http://code.google.com/p/beast-mcmc/downloads/list.
190
Evanno G, Regnaut S, Goudet J. 2005. Detecting the number of clusters of individuals
using the software STRUCTURE: a simulation study. Molecular Ecology 14: 2611-2620.
Excoffier L, Smouse PE, Quattro JM. 1992. Analysis of molecular variance inferred from
metric distances among DNA haplotypes: Application to human mitochondrial DNA
restriction data. Genetics 131: 479-491.
Excoffier L, Laval G, Schneider S. 2005. ARLEQUIN (version 3.0): An integrated software
package for population genetics data analysis. Evolutionary Bioinformatics Online 1: 47-
50.
Excoffier L, Foll M, Petit RJ. 2009. Genetic consequences of range expansions. Annual
Review of Ecology, Evolution, and Systematics 40: 481–501.
Flagstad, O, Syvertsen PO, Stenseth NC, Jakobsen KS. 2001. Environmental change and
rates of evolution: the phylogeographic pattern within the hartebeest complex as related to
climatic variation. Proceedings of the Royal Society B: Biological Sciences 268: 667-677.
Greenwood PJ.1980. Mating systems, philopatry and dispersal in birds and mammals.
Animal Behaviour 28: 1140-1162.
Goodman SM, Buccas W, Naidoo T, Ratrimomanarivo F, Taylor PJ, Lamb JM. 2010.
Patterns of morphological and genetic variation in western Indian Ocean members of the
Chaerephon ‘pumilus’ complex (Chiroptera: Molossidae), with the description of a new
species from Madagascar. Zootaxa 2551: 1-36.
Goodman SM, Maminirina CP, Weyeneth N, Bradman HM, Christidis L, Ruedi M,
Appleton B. 2009. The use of molecular and morphological characters to resolve the
taxonomic identity of cryptic species: The case of Miniopterus manavi (Chiroptera,
Miniopteridae). Zoologica Scripta 38: 339–363.
Goudet J. 1995. FSTAT, version 1.2: a computer program to calculate F-statistics. Journal of
Heredity 86: 485-486.
Hall TA. 1999. BioEdit: a user-friendly biological sequence alignment editor and analysis
program for Windows 95/98/NT. Nucleic Acids Symposium Series 41:95-98.
Hasegawa M, Kishino H, Yano T. 1985. Dating of the human-ape splitting by a molecular
clock of mitochondrial DNA. Journal of Molecular Evolution 21: 160-174.
Heckel G, Burri R, Fink S, Desmet J, Excoffier L. 2005. Genetic structure and
colonization processes in European populations of the common vole, Microtus arvalis.
Evolution 59: 2231-2242.
Hewitt G. 2000. The genetic legacy of the Quaternary ice ages. Nature 405: 907-913.
191
Hewitt G. 2004. The structure of biodiversity – insights from molecular phylogeography.
Frontier Zoology 4 doi: 10.1186/1742-9994-1-4.
Hoffmann FG, Owen JG, Baker RJ. 2003. mtDNA perspective of chromosomal
diversification and hybridization in Peters’ tent-making bat (Uroderma bilobatum:
Phyllostomidae). Molecular Ecology 12: 2981-2993.
Howes BJ, Lindsay B, Lougheed SC. 2006. Range-wide phylogeography of a temperate
lizard, the five-lined skink (Eumeces fasciatus). Molecular Phylogenetics and Evolution
40: 183-194.
Huson DH. 1998. SplitsTree: a program for analyzing and visualizing evolutionary data.
Bioinformatics 14: 68–73.
Huson DH, Bryant D. 2006. Application of phylogenetic networks in evolutionary
studies.Molecular Biology and Evolution 23: 254–267.
Jadwiszczak KA, Ratkiewicz M, Banaszek A. 2006. Analysis of molecular differentiation
in a hybrid zone between chromosomally distinct races of the common shrew Sorex
araneus (Insectivora: Soricidae) suggests their common ancestry. Biological Journal of
the Linnean Society 89: 79-90.
Karl SA, Avise, JC. 1992. Balancing selection at allozyme loci in oysters: implications from
nuclear RFLPs. Science 256: 100-102.
Kerth G, Mayer F, Petit E. 2002. Extreme sex-biased dispersal in the communally breeding,
nonmigratory Bechstein’s bat (Myotis bechsteinii).Molecular Ecology 11: 1491-1498.
Kerth G, Wagner M, König B. 2001. Roosting together, foraging apart: information transfer
about food is unlikely to explain sociality in female Bechstein’s bats. Behavioral Ecology
and Sociobiology 50: 283–291.
Kerth G, Van Schaik J. 2012. Causes and consequences of living in closed societies:
lessons from a long-term socio-genetic study on Bechstein's bats. Molecular Ecology 21:
633-646.
Kingston T, Rossiter, SJ. 2004. Harmonic-hopping in Wallacea’s bats. Nature 429: 654–
657.
Lamb JM, Naidoo T, Taylor PJ, Napier M, Ratrimomanarivo F, Goodman SM. 2012.
Genetically and geographically isolated lineages of a tropical bat (Chiroptera,
Molossidae) show demographic stability over the late Pleistocene. Biological Journal of
the Linnean Society 106: 18-40.
Lamb JM, Ralph TMC, Goodman SM, Bogdanowicz W, Fahr J, Gajewska M,Bates
PJJ, Eger J, Benda P, Taylor PJ. 2008. Phylogeography and predicted distribution of
192
African-Arabian and Malagasy populations of giant mastiff bats, Otomops spp.
(Chiroptera: Molossidae). Acta Chiropterologica 10: 21-40.
Larsen PA, Hoofer SR, Bozeman MC, Pedersen SC, Genoways HH, Phillips CJ, Pumo
DE, Baker, RJ. 2007. Phylogenetics and phylogeography of the Artibeus jamaicensis
complex based on cytochrome b DNA sequences. Journal of Mammalogy 88: 712 – 727.
Li G, Jones G, Rossiter SJ, Chen SF, Parsons S, Zhang S. 2006. Phylogenetics of small
horseshoe bats from east Asia based on mitochondrial DNA sequence variation. Journal of
Mammalogy 87: 1234- 1240.
Librado P, Rozas J. 2009. Dnasp v5: a software for comprehensive analysis of DNA
polymorphism data. Bioinformatics 25: 1451-1452.
Locke M, Baacke E, Toone R. 2000. Veterinary genetics lab STRand version
2.2.30.software programme. Regents of the University of California.
Lowe A, Harris S, Ashton P. 2004. Ecological Genetics. Blackwell Publishing, Oxford, UK.
Mao X, Zhang J, Zhang S, Rossiter SJ.2010. Historical male-mediated introgression in
horseshoe bats revealed by multilocus DNA sequence data. Molecular Ecology 19: 1352-
1366.
Matthee CA, Robinson TJ. 1997. Mitochondrial DNA phylogeography and comparative
cytogenetics of the springhare, Pedetescapensis (Mammalia: Rodentia). Journal of
Molecular Evolution 4: 53-73.
Mayr E. 1942. Systematics and the origin of species. Dover Publications. New York.
Mayer F, Dietz C, Kiefer A.2007. Molecular species identification boosts bat diversity.
Frontiers in Zoology 4: 4.
McCracken GF, McCracken MK, Vawter AT. 1994. Genetic structure in migratory
populations of the bat Tadarida brasiliensis mexicana. Journal of Mammalogy 75: 500-
514.
Miller JM, Hallager S, Monfort SL, Newby J, Bishop K, Tidmus SA, Black P, Houston
B, Matthee CA, Fleischer RC. 2011. Phylogeographic analysis of nuclear and mtDNA
supports subspecies designations in the ostrich (Struthio camelus). Conservation Genetics
12: 423-431.
Muwanika VB, Nyakaana S, Siegismund HR, Arctander P. 2003. Phylogeography and
population structure of the common warthog (Phacochoerus africanus) inferred from
variation in mitochondrial DNA sequences and microsatellite loci. Heredity 1: 361-372.
193
Naidoo T, McDonald A, Lamb JM. 2013. Cross-genus amplification and characterisation of
microsatellite loci in the little free tailed bat, Chaerephon pumilus s.l. (Molossidae) from
South Eastern Africa. African Journal of Biotechnology 12: 3143-3147.
Naidoo T, Schoeman MC, Taylor PJ, Goodman SM, Lamb JM. 2013. Stable Pleistocene-
era populations of Chaerephon pumilus (Chiroptera: Molossidae) in south eastern Africa
do not use different echolocation calls. African Zoology 48: 125-142
Neubaum MA, Douglas MR, Douglas ME, O’Shea TJ. 2007. Molecular ecology of the big
brown bat (Eptesicus fuscus): genetic and natural history variation in a hybrid zone.
Journal of Mammalogy 88: 1230-1238.
Paetkau D, Slade R, Burden M, Estoup A. 2004. Genetic assignment methods for the
direct, real-time estimation of migration rate: a simulation-based exploration of accuracy
and power. Molecular Ecology 13: 55-65.
Palumbi, SR, Baker, CS. 1994. Contrasting population structure from nuclear intron
sequences and mtDNA of humpback whales. Molecular Biology and Evolution 11: 426-
435.
Peakall R, Smouse PE. 2006. GENELAX 6: genetic analysis in excel. Population genetic
software for teaching and research. Molecular Ecology Notes 6: 288-295.
Peterson RL, Eger JL, Mitchell L. 1995. Chiroptères. Faune de Madagascar, Vol. 84.
Muséum national d’Histoirenaturelle, Paris.
Petit E, Mayer F. 1999. Male dispersal in the noctule bat (Nyctalus noctula): where are the
limits? Proceedings of the Royal Society B: Biological Sciences 266: 1717-1722.
Pfalzer G, Kusch J. 2003. Structure and variability of bat social calls: implications for
specificity and individual recognition. Journal of Zoology 261: 21-33.
Piertney SB, MacColl ADC, Bacon PJ, Racey PA, Lambin X, Dallas JF. 2000.
Matrilineal genetic structure and female-mediated gene flow in red grouse (Lagopus
lagopus scoticus): an analysis using mitochondrial DNA. Evolution 54: 279-289.
Piry S, Alapetite A, Cornuet JM, Paetkau D, Baudouin L, Estoup A. 2004.
GENECLASS2: a software for genetic assignment and first-generation migrant detection.
Journal of Heredity 95: 536-539.
Posada D. 2008. jModelTest: Phylogenetic Model Averaging. Molecular Biology and
Evolution 25: 1253-1256.
Pritchard JK, Stephens M, Donnelly P. 2000. Inference of population structure using
multilocus genotype data.Genetics 155: 945-959.
194
Proctor MF, Mclellan BN, Strobeck C, Barclay RMR. 2004. Gender-specific dispersal
distances of grizzly bears estimated by genetic analysis. Canadian Journal of Zoology-
Revue Canadienne De Zoologie 82: 1108-1118.
Racey PA, Barratt EM, Burland TM, Deaville R, Gotelli D, Jones G, Piertney SB. 2007.
Microsatellite DNA polymorphism confirms reproductive isolation and reveals
differences in population genetic structure of cryptic pipistrelle bat species. Biological
Journal of the Linnean Society 90: 539-550.
Ramasindrazana B, Goodman SM, Schoeman MC, Appleton B. 2011. Identification of
cryptic species of Miniopterus bats (Chiroptera: Miniopteridae) from Madagascar and the
Comoros using bioacoustic overlaid on molecular genetic and morphological characters.
Biological Journal of the Linnean Society 104: 284-302.
Rambaut A, Drummond AJ. 2009. Tracer v. 1.5: Mcmc trace file analyser. Available at
http://tree.bio.ed.ac.uk/software/tracer/.
Ramos Pereira MJ, Salgueiro P, Rodrigues P, Coelho MM, Palmeirim JM. 2009.
Population structure of a cave-dwelling bat, Miniopterus schreibersii: does it reflect
history and social organization? Journal of Heredity 100: 533-544.
Rannala B, Mountain JL. 1997. Detecting immigration by using multilocus
genotypes.Proceedings of the National Academy of Sciences, USA 94: 9197-9201.
Ratrimomanarivo FH, Goodman SM, Hoosen N, Taylor PJ, Lamb J. 2008.
Morphological and molecular variation in Mops leucostigma (Chiroptera: Molossidae) of
Madagascar and the Comoros: Phylogeny, phylogeography and geographic variation.
Mitteilungenausdem Hamburgischen Zoologischen Museum 105: 57-101.
Raymond M, Rousset F.1995. Genepop (version 1.2): population genetics software for exact
tests and ecumenicism. Journal of Heredity 86: 248-249.
Rice WR. 1989. Analyzing tables of statistical tests. Evolution 43: 223–225.
Rogers AR, Harpending H. 1992 .Population growth makes waves in the distribution of
pairwise genetic differences. Molecular Biology and Evolution 9:552–569.
Russell AL, Turmelle AS, Brown A, McCracken GF.2005. Extremely variable di- and
tetranucleotide microsatellite loci in Brazilian free-tailed bats (Tadarida
brasiliensis).Molecular Ecology Notes 5: 669-671.
Schneider S, Excoffier L. 1999. Estimation of past demographic parameters from the
distribution of pairwise divergences when the mutation rates vary among sites: application
to human mitochondrial DNA.Genetics 152: 1079–1089.
195
Sikes RS, Gannon WL, The Animal Care and Use Committee of the American Society
Mammalogists. 2011. Guidelines of the American Society of Mammologists for the use
of wild animals in research. Journal of Mammalogy 92: 235-253.
Simmons NB. 2005. Order Chiroptera. In: Mammal Species of the World: a taxonomic and
geographic reference, (eds. D. E. Wilson & D. M. Reeder).The John Hopkins University
Press, Baltimore, Maryland.
Slatkin M, Hudson RR. 1991. Pairwise comparisons of mitochondrial DNA sequences in
stable and exponentially growing populations. Genetics 129: 555–562.
Stoffberg S, Schoeman MC, Matthee CA. 2012. Correlated genetic and ecological
diversification in a widespread southern African horseshoe bat. PLoS ONE 7: e31946
Swofford DL. 2002. Paup*: Phylogenetic analysis using parsimony (*and other methods),
version 4.0b10. Sinauer Associates Inc., Sunderland, MA USA.
Sztencel-Jablonka A, Bogdanowicz W. 2012. Population genetics study of common
(Pipistrellus pipistrellus) and soprano (Pipistrellus pygmaeus) pipistrelle bats from central
Europe suggests interspecific hybridization. Canadian Journal of Zoology 90: 1251-1260.
Taylor PJ, Goodman SM, Schoeman MC, Ratrimomanarivo FH, Lamb JM. 2012. Wing
loading correlates negatively with genetic structuring in eight species of Afro-Malagasy
bats (Molossidae). Acta Chiropterologica 14: 53-62.
Taylor PJ, Lamb J, Reddy D, Naidoo T, Ratrimomanarivo F, Goodman SM. 2009.
Cryptic lineages of little free-tailed bats, Chaerephon pumilus (Chiroptera: Molossidae)
from southern Africa and the western Indian Ocean islands. African Zoology 44: 55-70.
Thabah A, Rositer SJ, Kingston T, Zhang S, Parsons S, MyaMya K, Zubaid A, Jones G.
2006. Genetic divergence and echolocation call frequency in cryptic species of
Hipposideros larvatus s.l. (Chiroptera: Hipposideridae) from the Indo-Malayan region.
Biological Journal of the Linnean Society 88: 119-130.
Thompson JD, Higgins DG, Gibson TJ. 1994. CLUSTAL W: improving the sensitivity of
progressive multiple sequence alignment through sequence weighting, position specific
gap penalties and weight matrix choice. Nucleic Acids Research 22: 4673-4680.
Turmelle AS.2002. Phylogeography and population structure of the big brown bat (Eptesicus
fuscus). Honors thesis, Boston University, Boston, Massachusetts.
VanOosterhout C, Hutchinson WF, Wills DPM, Shipley P. 2004. MICRO-CHECKER:
software for identifying and correcting genotyping errors in microsatellite data. Molecular
Ecology Notes 4: 535-538.
196
Voelker G, Outlaw RK, Bowie RCK. 2010. Pliocene forest dynamics as a primary driver of
African bird speciation. Global Ecology and Biogeography 19: 111-121.
Webb NJ, Tidemann CR. 1996. Mobility of Australian flying foxes, Pteropus spp.
(Megachiroptera): evidence from genetic variation. Proceedings of the Royal Society of
London Series B 263: 497-502.
Weyandt SE, Van DenBussche RA, Hamilton MJ, Leslie JR DM. 2005. Unraveling the
effects of sex and dispersal: Ozark big-eared bat (Corynorhinus townsendiiingens)
conservation genetics. Journal of Mammalogy 86: 1136-1143.
Weins JJ, Penkrot TA. 2002. Delimiting species using DNA and morphological variation
and discordant species limits in spiny lizards (Sceloporus). Systematic Biology 51: 69-91.
Whitlock MC, McCauley DE. 1999. Indirect measures of gene flow and migration: Fst not
equal 1/(4Nm+1). Heredity 82: 117-125.
Wilkinson GS, Chapman AM. 1991. Length and sequence variation in evening bat D-loop
mtDNA. Genetics 128:607-61.
Wilkinson GS. 1985. The social organization of the common vampire bat.I. Pattern and
cause of association. Behavioral Ecology and Sociology 17: 111–121.
Wirth T, Bernatchez L. 2001. Genetic evidence against panmixia in the European eel.
Nature 409: 1037-1040.
Worthington-Wilmer JM, Barratt EM. 1996. A non-lethal method of tissue sampling for
genetic studies of chiropterans. Bat Research News 37: 1-3.
Worthington-Wilmer JM, Hall L, Barratt E, Moritz C. 1999. Genetic structure and male-
mediated gene flow in the ghost bat (Macroderma gigas). Evolution 53: 1582-1591.
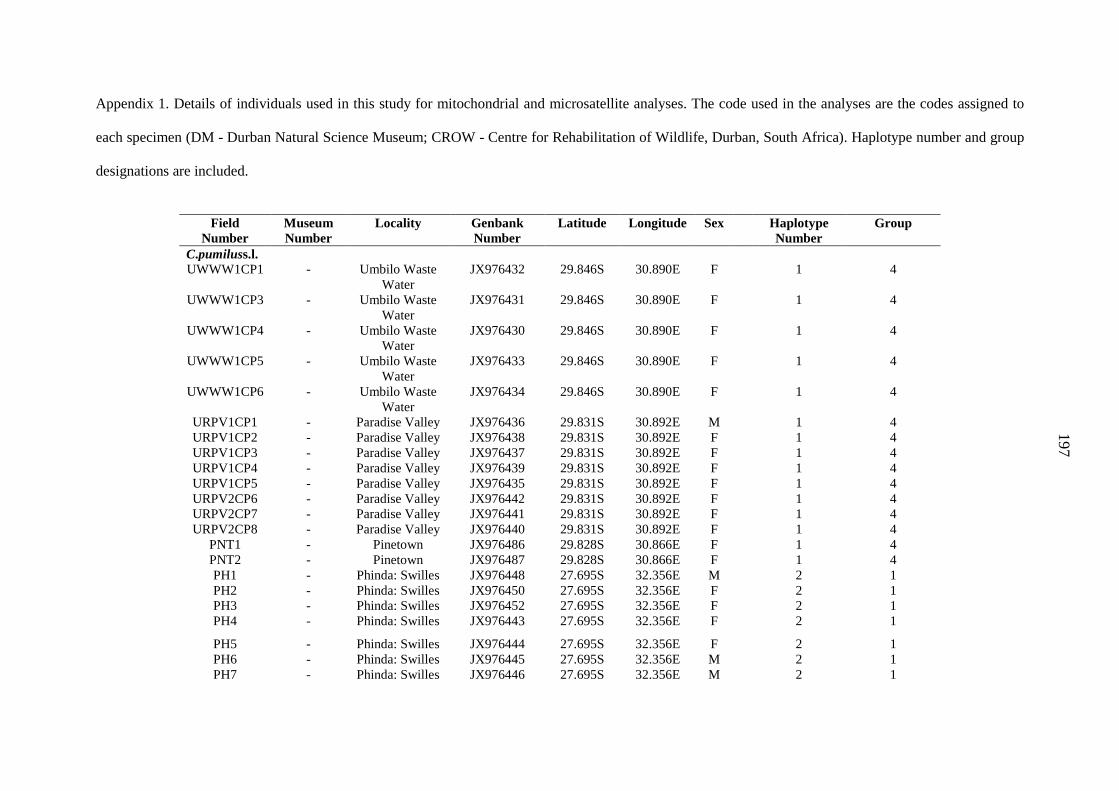
197
Appendix 1. Details of individuals used in this study for mitochondrial and microsatellite analyses. The code used in the analyses are the codes assigned to
each specimen (DM - Durban Natural Science Museum; CROW - Centre for Rehabilitation of Wildlife, Durban, South Africa). Haplotype number and group
designations are included.
Field
Number Museum Number
Locality Genbank Number
Latitude Longitude Sex Haplotype Number
Group
C.pumiluss.l. UWWW1CP1 - Umbilo Waste
Water JX976432 29.846S 30.890E F 1 4
UWWW1CP3 - Umbilo Waste Water
JX976431 29.846S 30.890E F 1 4
UWWW1CP4 - Umbilo Waste Water
JX976430 29.846S 30.890E F 1 4
UWWW1CP5 - Umbilo Waste Water
JX976433 29.846S 30.890E F 1 4
UWWW1CP6 - Umbilo Waste Water
JX976434 29.846S 30.890E F 1 4
URPV1CP1 - Paradise Valley JX976436 29.831S 30.892E M 1 4 URPV1CP2 - Paradise Valley JX976438 29.831S 30.892E F 1 4 URPV1CP3 - Paradise Valley JX976437 29.831S 30.892E F 1 4 URPV1CP4 - Paradise Valley JX976439 29.831S 30.892E F 1 4 URPV1CP5 - Paradise Valley JX976435 29.831S 30.892E F 1 4 URPV2CP6 - Paradise Valley JX976442 29.831S 30.892E F 1 4 URPV2CP7 - Paradise Valley JX976441 29.831S 30.892E F 1 4 URPV2CP8 - Paradise Valley JX976440 29.831S 30.892E F 1 4
PNT1 - Pinetown JX976486 29.828S 30.866E F 1 4 PNT2 - Pinetown JX976487 29.828S 30.866E F 1 4 PH1 - Phinda: Swilles JX976448 27.695S 32.356E M 2 1 PH2 - Phinda: Swilles JX976450 27.695S 32.356E F 2 1 PH3 - Phinda: Swilles JX976452 27.695S 32.356E F 2 1 PH4 - Phinda: Swilles JX976443 27.695S 32.356E F 2 1
PH5 - Phinda: Swilles JX976444 27.695S 32.356E F 2 1 PH6 - Phinda: Swilles JX976445 27.695S 32.356E M 2 1 PH7 - Phinda: Swilles JX976446 27.695S 32.356E M 2 1
170
186 197
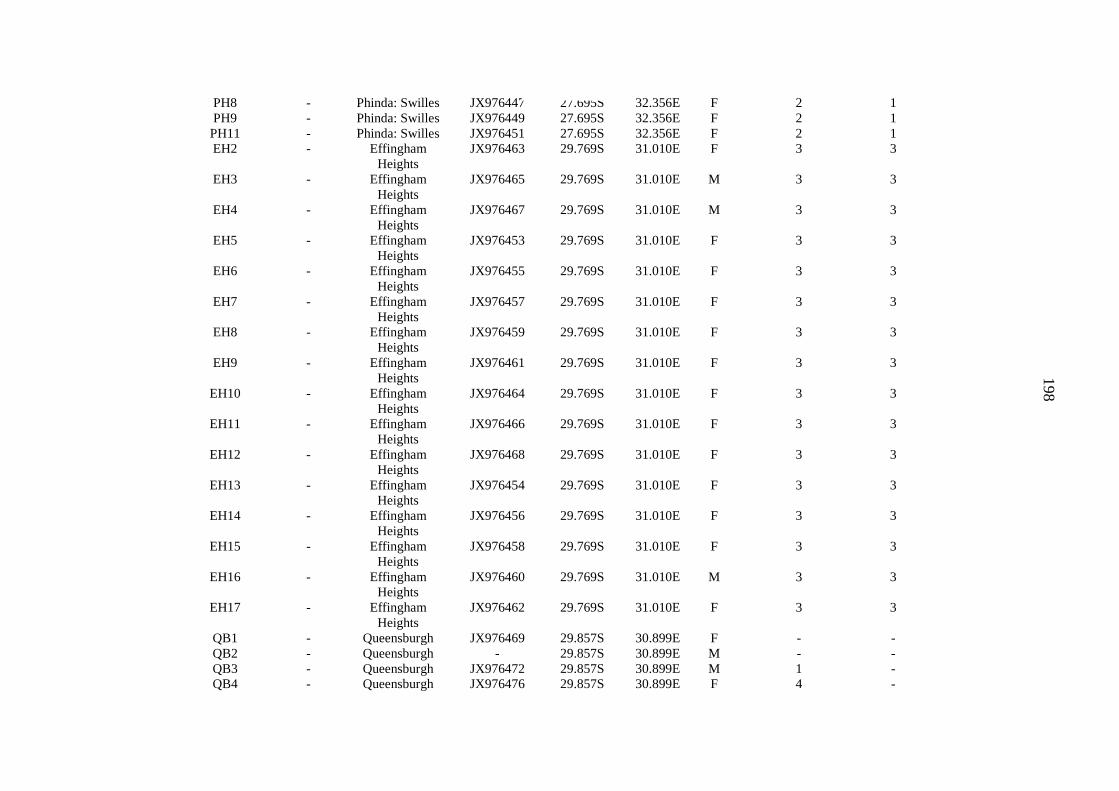
198
PH8 - Phinda: Swilles JX976447 27.695S 32.356E F 2 1 PH9 - Phinda: Swilles JX976449 27.695S 32.356E F 2 1
PH11 - Phinda: Swilles JX976451 27.695S 32.356E F 2 1 EH2 - Effingham
Heights JX976463 29.769S 31.010E F 3 3
EH3 - Effingham Heights
JX976465 29.769S 31.010E M 3 3
EH4 - Effingham Heights
JX976467 29.769S 31.010E M 3 3
EH5 - Effingham Heights
JX976453 29.769S 31.010E F 3 3
EH6 - Effingham Heights
JX976455 29.769S 31.010E F 3 3
EH7 - Effingham Heights
JX976457 29.769S 31.010E F 3 3
EH8 - Effingham Heights
JX976459 29.769S 31.010E F 3 3
EH9 - Effingham Heights
JX976461 29.769S 31.010E F 3 3
EH10 - Effingham Heights
JX976464 29.769S 31.010E F 3 3
EH11 - Effingham Heights
JX976466 29.769S 31.010E F 3 3
EH12 - Effingham Heights
JX976468 29.769S 31.010E F 3 3
EH13 - Effingham Heights
JX976454 29.769S 31.010E F 3 3
EH14 - Effingham Heights
JX976456 29.769S 31.010E F 3 3
EH15 - Effingham Heights
JX976458 29.769S 31.010E F 3 3
EH16 - Effingham Heights
JX976460 29.769S 31.010E M 3 3
EH17 - Effingham Heights
JX976462 29.769S 31.010E F 3 3
QB1 - Queensburgh JX976469 29.857S 30.899E F - - QB2 - Queensburgh - 29.857S 30.899E M - - QB3 - Queensburgh JX976472 29.857S 30.899E M 1 - QB4 - Queensburgh JX976476 29.857S 30.899E F 4 -
187
198
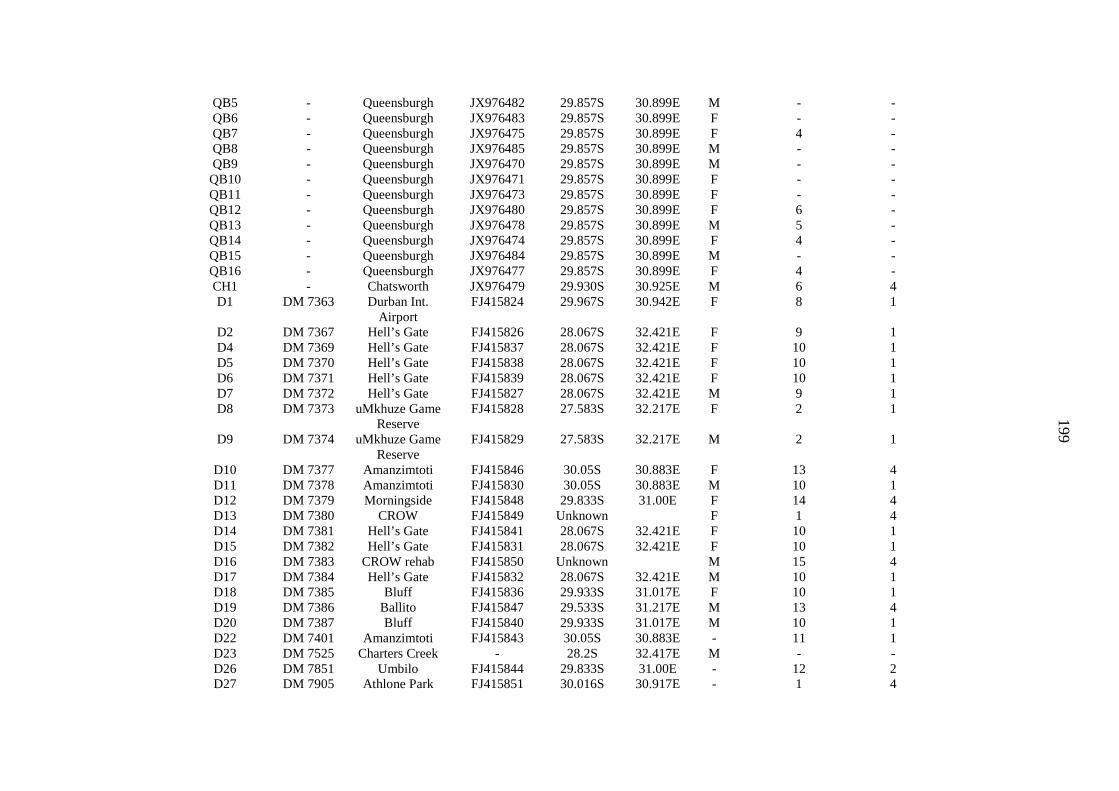
199
QB5 - Queensburgh JX976482 29.857S 30.899E M - - QB6 - Queensburgh JX976483 29.857S 30.899E F - - QB7 - Queensburgh JX976475 29.857S 30.899E F 4 - QB8 - Queensburgh JX976485 29.857S 30.899E M - - QB9 - Queensburgh JX976470 29.857S 30.899E M - -
QB10 - Queensburgh JX976471 29.857S 30.899E F - - QB11 - Queensburgh JX976473 29.857S 30.899E F - - QB12 - Queensburgh JX976480 29.857S 30.899E F 6 - QB13 - Queensburgh JX976478 29.857S 30.899E M 5 - QB14 - Queensburgh JX976474 29.857S 30.899E F 4 - QB15 - Queensburgh JX976484 29.857S 30.899E M - - QB16 - Queensburgh JX976477 29.857S 30.899E F 4 - CH1 - Chatsworth JX976479 29.930S 30.925E M 6 4 D1 DM 7363 Durban Int.
Airport FJ415824 29.967S 30.942E F 8 1
D2 DM 7367 Hell’s Gate FJ415826 28.067S 32.421E F 9 1 D4 DM 7369 Hell’s Gate FJ415837 28.067S 32.421E F 10 1 D5 DM 7370 Hell’s Gate FJ415838 28.067S 32.421E F 10 1 D6 DM 7371 Hell’s Gate FJ415839 28.067S 32.421E F 10 1 D7 DM 7372 Hell’s Gate FJ415827 28.067S 32.421E M 9 1 D8 DM 7373 uMkhuze Game
Reserve FJ415828 27.583S 32.217E F 2 1
D9 DM 7374 uMkhuze Game Reserve
FJ415829 27.583S 32.217E M 2 1
D10 DM 7377 Amanzimtoti FJ415846 30.05S 30.883E F 13 4 D11 DM 7378 Amanzimtoti FJ415830 30.05S 30.883E M 10 1 D12 DM 7379 Morningside FJ415848 29.833S 31.00E F 14 4 D13 DM 7380 CROW FJ415849 Unknown F 1 4 D14 DM 7381 Hell’s Gate FJ415841 28.067S 32.421E F 10 1 D15 DM 7382 Hell’s Gate FJ415831 28.067S 32.421E F 10 1 D16 DM 7383 CROW rehab FJ415850 Unknown M 15 4 D17 DM 7384 Hell’s Gate FJ415832 28.067S 32.421E M 10 1 D18 DM 7385 Bluff FJ415836 29.933S 31.017E F 10 1 D19 DM 7386 Ballito FJ415847 29.533S 31.217E M 13 4 D20 DM 7387 Bluff FJ415840 29.933S 31.017E M 10 1 D22 DM 7401 Amanzimtoti FJ415843 30.05S 30.883E - 11 1 D23 DM 7525 Charters Creek - 28.2S 32.417E M - - D26 DM 7851 Umbilo FJ415844 29.833S 31.00E - 12 2 D27 DM 7905 Athlone Park FJ415851 30.016S 30.917E - 1 4
188
199

200
D28 DM 7907 Carrington Heights
FJ415852 29.883S 30.967E M 1 -
D29 DM 7910 Pinetown FJ415853 29.817S 30.85E F 1 4 D30 DM 7913 Illovo FJ415833 30.1S 30.833E F 10 1 D31 DM7922 SZ: Mlawula - 26.192S 32.005E - - - D34 DM 8030 Park Rynie FJ415854 30.317S 30.733E M 16 4 D35 DM 8036 SZ: Mlawula FJ415834 26.192S 32.005E M 11 1 D36 DM 8042 SZ: Wylesdale FJ415856 25.819S 31.292E F 17 4 D37 DM 8348 Durban City
Hall FJ415855 29.858S 31.025E M 1 4
D38 DM 8437 SZ: Rosecraft - 26.632S 31.293E - - - D39 - Durban FJ415842 29.867S 31.00E - 10 1 D40 - Yellowwood
Park FJ415845 29.917S 30.933E - 12 2
D43 - Durban FJ415857 Unknown - 6 4 PT 2011-2 - Limpopo JX976481 23.059S 30.067E F 7 -
Appendix 2.
Figure 6. Structure plot v 2.2.4 (Pritchard et al. 2004) based on the analysis of six microsatellite loci for Chaerephon pumilus s.l. from South Africa which
defined three metapopulations (K = 3). The y-axis illustrates the proportion of the genotype of an individual attributed to each genetic cluster.
189
200
201
CHAPTER FOUR The Chaerephon pumilus species complex (Chiroptera:
Molossidae) from south eastern Africa and the western Indian
Ocean islands is not a classical ring species
ABSTRACT
We examined phylogenetic and phylogeographic relationships (cyt b, control region, Rag2)
among members of the Chaerephon pumilus species complex from eastern Africa and islands
in the western Indian Ocean, as well as samples from south eastern Africa and the topotype
(C. naivashae), holotypes (C. elphicki and C. langi) and syntypes (C. limbatus) of taxa
considered junior synonyms of C. pumilus. We found that C. pumilus from south eastern
Africa is specifically distinct from the nominate C. pumilus sensu stricto (s.s.) from Massawa,
Eritrea, and forms part of the C. pumilus species complex defined by Goodman et al. (2010).
Our molecular evidence does not support that the syntype of C. limbatus and the holotypes of
C. elphicki and C. langi and topotype of C. naivashae are specifically distinct from C.
pumilus s.s.
Chaerephon pumilus s.s. (Eritrea and Yemen) diverged from the other members of the
C. pumilus species complex about 6.24 million years ago (MYA); of these, C. atsinanana
diverged approximately 5.01 MYA from a well supported but unresolved clade (B1)
comprising subclades which appear to have arisen between 1.07 and 2.39 MYA: C. pusillus
(Comoros and Aldabra; 1 clade); C. leucogaster (western Madagascar, Pemba, Zanzibar,
Comoros; 2 clades); C. pumilus s.l. (south eastern Africa; 3 clades); and C. pumilus s.l.
(Tanzania; 1 clade). There is evidence of introgression of both C. pusillus and C. pumilus s.l.
(south eastern Africa) mitochondrial haplotypes into C. leucogaster. Clade B1 of the C.
pumilus species complex has several attributes of a ring species, but appears to differ from
this model in some important respects. It occurs on the African mainland and western Indian
Ocean Islands, including Madagascar, ringing a potential barrier to gene flow, the
Mozambique Channel. The taxa within the species complex form a ring in which the
differentiated terminal forms, C. pusillus and C. leucogaster, occur in sympatry on Mayotte
(Comoro Islands). Although there is evidence of isolation by distance around the ring, there is
also a relatively high degree of genetic structure and limited gene flow. It appears that the

202
island-based component species may have differentiated in allopatry, with some gene flow by
over water dispersal, whereas the African mainland species may have differentiated through
isolation by distance.
Key words: Chaerephon, taxonomy, mitochondrial, Africa, Madagascar, Comoros
203
INTRODUCTION
Phylogenetic relationships among species within the Old World genus Chaerephon Dobson,
1874 (Family Molossidae, Suborder Vespertilioniformes) remain poorly resolved. Chaerephon is
distributed across mainland Africa, its offshore and nearshore islands (Zanzibar, Pemba and
Mozambique Island), Madagascar and surrounding western Indian Ocean islands (Anjouan, Mayotte,
Mohéli, Grande Comore and Aldabra). There are currently 21 recognized species of Chaerephon
(Simmons, 2005; Goodman and Cardiff, 2004; Goodman et al., 2010). Here we examine relationships
among members of the C. pumilus Cretzschmar 1830-1831 species complex (Goodman et al., 2010),
and include samples from south eastern Africa, as well as certain holotypes (C. elphicki and C. langi),
topotype (C. naivashae) and a syntype (C. limbatus) of taxa considered junior synonyms of C.
pumilus. Analyses are based primarily on mitochondrial markers (cytochrome b [cyt b] and control
region), with some inference from a nuclear marker (Rag2). In the earlier literature this species was
referred to C. pumila, but the correct species epithet is pumilus (Simmons, 2005); hence, inconsistent
endings have appeared in the literature.
The systematic arrangement of Chaerephon is based on initial studies of cranial and dental
morphology (Freeman, 1981; Legendre, 1984) and more recent molecular phylogenetic studies
(Ratrimomanarivo et al., 2009; Goodman et al., 2010; Lamb et al., 2011; Ammerman et al., 2012).
Six of the 21 recognized Chaerephon species occur in the southern African subregion - C. pumilus; C.
bivittatus Heuglin 1861; C. major Trouessart 1897; C. ansorgei Thomas 1913; C. nigeriae Thomas
1913 and C. chapini Allen 1917-(Monadjem et al., 2010) and four in Madagascar and neighbouring
western Indian Ocean islands (C. atsinanana Goodman et al. 2010; C. leucogaster Grandidier 1869,
C. pusillus Miller 1902 and C. jobimena Goodman and Cardiff 2004).
The Malagasy form, C. jobimena, initially described based on morphological characteristics
(Goodman and Cardiff, 2004), is not monophyletic with respect to other Chaerephon species based on
mitochondrial and nuclear sequence data (Lamb et al., 2011). Chaerephon populations found in
western Madagascar, characterised by pronounced white areas on the wing membrane, are referred to
C. leucogaster (Ratrimomanarivo et al., 2009). Populations on the eastern side of Madagascar,
formerly considered C. pumilus, were described as a new species, C. atsinanana (Goodman et al.,
2010). The authors of this latter paper also transferred individuals previously considered as C. pumilus
from the western Seychelles and Comoros Archipelago to C. pusillus.
Specimens referred to C. pumilus s.l. comprise both lighter- and dark-winged forms (Hayman
and Hill, 1971; Meester and Setzer, 1971). The former were originally described as C. p. limbata
(Koopman, 1965), while C. p. pumilus was used for individuals with dark wings. These two forms
were considered identical in shape, size and cranial and dental features (Hayman and Hill, 1971). The
lighter-winged morph was later classified as C. limbatus and considered a distinct species (Rosevear,
204
1965; Peterson et al., 1995), whilst other taxonomists felt that limbatus was conspecific with pumilus
(Meester and Setzer, 1971; Meester et al., 1986; Jacobs et al., 2004) and regarded C. limbatus as a
synonym of C. pumilus (Koopman, 1993). Jacobs et al. (2004) found less than 0.9% genetic
divergence in cyt b sequences between light-winged animals from Zambia and Tanzania and dark-
winged forms from South Africa, concluding that these two forms are not distinct species. More
recent work has helped to elucidate relationships between different members of the C. pumilus species
complex.
Using mitochondrial data from a specimen of C. p. pumilus collected at the type locality
(Massawa, Eritrea; USNM 38032), Goodman et al. (2010) concluded that this sequence, as well as
specimens obtained in the neighbouring Yemen, represented the nominate form, referred to in this
report as C. pumilus s.s. Naidoo et al. (2013) reported five mitochondrial clades C. pumilus s.l. from
south eastern Africa, separated by a low mean inter-clade genetic distance (0.7%, cyt b). Several
authors (Taylor, 1999; Aspetsberger et al., 2003; Fenton et al., 2004; Schoeman and Jacobs, 2008;
Schoeman and Waddington, 2011) have reported variation in echolocation calls of C. pumilus s.l.
from mainland Africa. A subsequent study addressed the question of correlations between genetic
lineages and acoustic sonotypes from south eastern Africa and found no support for this hypothesis
(Naidoo et al., 2013).
Simmons (2005) listed nine synonyms of C. pumilus - dubius Peters 1852; limbatus Peters
1852; gambianus de Winton 1901; C. pusillus; hindei Thomas 1904; naivashae Hollister 1916;
elphicki Roberts 1926; langi Roberts 1932; and faini Hayman 1951. Peterson et al. (1995) had
previously proposed based on skull morphology, that three of these (hindei, limbata and naivashae)
should be elevated to full species rank.
Phylogenetic inference based on mitochondrial DNA has been commonly used in the
taxonomic evaluation of mammal species, including bats (Baker and Bradley, 2006; Goodman et al.,
2010). Mitochondrial genes are useful in detecting early stages of speciation, because they are usually
not affected by recombination and achieve reciprocal monophyly in about one quarter the time of the
average nuclear gene in diploid sexual organisms (Birky, 2013). However, as hybridization of bats is
likely to result in the introgression of mitochondrial DNA between taxa (Berthier et al., 2006, Mayer
and von Helversen, 2001; Artyushin et al., 2009; Vallo et al., 2012), results obtained from
mitochondrial data alone should be viewed with caution.
The C. pumilus species complex was defined by Goodman et al. (2010) to include C. pumilus
s.s. (Eritrea and Yemen), C. atsinanana (eastern Madagascar), C. pusillus (Comoros and Aldabra), C.
leucogaster (western Madagascar, Pemba, Zanzibar, Comoros) and C. pumilus s.l. from eastern
Africa. These species separated by mean genetic distances of 1.31% - 2.98%, occupy parts of
continental Africa and islands separated by a potential barrier to gene flow, the Mozambique Channel.
This geographical configuration leads to the hypothesis that they may represent a ring species (Irwin
et al., 2001).
205
Ring species comprise two reproductively isolated populations connected by a chain or circle
of intergrading populations (Mayr, 1942). These complexes are proposed to have arisen by expansion
of a single species in two directions around a geographical barrier, accompanied by gradual
divergence into two forms, which, when they eventually meet, behave as separate species (Stegnejer
in Jordan (1905) in Irwin et al., 2001). Debate over the nature of variation around the ring has led to
discussion as to whether the relatively small number (± 23) of proposed cases qualify as ring species
(Irwin et al., 2001). Various forms of the large tree finch (Camarhynchus psittacula), distributed on
several Galapagos Islands (a situation similar to the distribution of the C. pumilus species complex
discussed herein) have been proposed as a ring species (Lack, 1947).
The aim of this study was to further resolve the evolutionary history and taxonomy of the C.
pumilus species complex by extending the mitochondrial DNA study of Goodman et al. (2010), using
broader geographical and taxonomic sampling, including new material from previously unrepresented
areas, namely Kenya, Botswana, Mozambique, South Africa, Swaziland, Zanzibar and additional
samples from the Comoros Archipelago. We include sequences of the syntype of C. limbatus,
holotypes of C. elphicki and C. langi, and topotype of C. naivashae, all of which are considered junior
synonyms of C. pumilus (Simmons, 2005). We address the following hypotheses: (1) The junior
synonyms of C. pumilus, namely C. limbatus, C. naivashae, C. elphicki and C. langi, are not
genetically distinct at the species level from the nominate form, C. pumilus s.s. from Massawa,
Eritrea; (2) C. pumilus from south eastern Africa is specifically distinct from the nominate form, C.
pumilus s.s. from Massawa, Eritrea; (3) The C. pumilus species complex, which is distributed across a
sphere of landmasses surrounding the Mozambique Channel, represents an example of a ring species.
MATERIALS AND METHODS
Specimens Used in this Study Tissue samples of Chaerephon used in this study were obtained from various regions on
Madagascar, neighbouring western Indian Ocean islands and the African mainland. These specimens
are housed in Field Museum of Natural History (FMNH) – Chicago; Durban Natural Science Museum
(DM) – Durban; l’Université d’Antananarivo, Département de Biologie Animale (UADBA) –
Antananarivo; The National Museum of Natural History (formerly United States National Museum –
USNM) – Washington, D.C; Museum für Naturkunde - Humboldt Universitat zu Berlin (formerly
Zoologisches Museum Berlin – ZMB) – Berlin; and The Ditsong National Museum of Natural
History (formerly Transvaal Museum – TM) – Pretoria. Genetic analyses included 138 individuals
utilized by Goodman et al. (2010) and an additional 316 individuals for the present study (Appendix
1).
Tissue samples were obtained from wing punches and liver, heart, kidney or muscle tissue
stored in 80% ethanol or lysis buffer. Genetic diversity in Chaerephon species was examined using
206
two mitochondrial DNA regions: cyt b (n = 230) and control region (n = 416) (Appendix 1). Outgroup
taxa used in the analyses were as follows: Mops condylurus (A. Smith, 1833), M. leucostigma (G.M.
Allen, 1918), M. midas (Sundevall, 1843), Otomops martiensseni (Matschie, 1897) and O.
madagascariensis (Dorst, 1953).
DNA Extraction, Amplification and Sequencing
DNA extraction, PCR amplification and sequencing were carried out according to previously-
published procedures: mitochondrial cytochrome b and control regions after Lamb et al. (2012) and
nuclear Rag2 region after Lamb et al. (2011).
DNA extraction from syntypes, topotype and holotypes Skull scrapings obtained for each holotype specimen of C. elphicki and C. langi, topotype of
C. naivashae and syntype of C. limbatus were sent to a Paleo-DNA Laboratory Genetic Testing
Service at Lakehead University (Thunder Bay, Ontario, Canada) for cyt b sequencing. This was
carried out according to the protocol used for the 120-year-old syntype of C. p. pumilus from
Massawa, Eritrea (Goodman et al., 2010).
Sequence Analysis All sequences were assembled and edited manually and aligned using the Clustal W option
(Thompson et al., 1997) of the BioEdit program (Hall, 1999). Aligned sequences were trimmed to a
common length of 296 nucleotides for the control region. Two cyt b alignments were created: the
shorter alignment was trimmed to 206 nucleotides in order to include the syntype material of C.
limbatus, holotype material of C. elphicki and C. langi and topotype material of C. naivashae, and a
longer alignment (830 nucleotides) was created to study in more detail the relationships among study
samples.
jModeltest (Posada, 2008) was used to select the most appropriate model of nucleotide
substitution under the AIC information criterion. The model selected for all datasets was the HKY+I
sequence-evolution model (Hasegawa et al., 1985). Haplotypes for each alignment were inferred with
DnaSP 5.10 (Librado and Rozas, 2009). The phylogenetic trees presented here are based on
haplotypes.
Maximum parsimony (MP) and neighbour-joining (NJ) trees were generated using PAUP*
4.0 (Swofford, 2002). Nodal support was estimated using 1000 bootstrap pseudoreplicates. Bayesian
analysis was implemented in MRBAYES version 3.1.2 (Ronquist and Huelsenbeck, 2001). Four
Markov chains (three hot and one cold) were run for 50 million generations, until the standard
deviation of the split frequencies was less than 0.01. The first 5000 000 trees were discarded as
207
burnin, after an initial run to check that this was sufficient to achieve stationarity. The phylograms
were 50% majority-rule consensus trees with nodal support indicated as posterior probabilities.
A statistical parsimony haplotype network was constructed for the control region dataset in
TCS (Clement et al., 2000). SplitsTree version 4.8 (Huson, 1998; Huson and Bryant, 2006) was used
to generate a Neighbour-net network (Bryant and Moulton, 2004) using programme defaults.
Indices of diversity and neutrality (nucleotide diversity, haplotype diversity, mismatch
distributions and the raggedness statistic) were estimated in DnaSP 5.10 (Librado and Rozas, 2009)
based on the control region. For these analyses, samples were divided into the following groups: C.
atsinanana -- eastern Madagascar, C. leucogaster -- western Madagascar, C. pumilus s.l. -- south
eastern Africa and Mozambique Island, C. pusillus -- Comoros and C. pumilus s.s. -- Yemen. There
were too few samples from Aldabra, Pemba, Zanzibar and Tanzania to include genetic data from these
localities in these analyses.
An analysis of molecular variance (AMOVA; Excoffier et al., 1992) implemented in Arlequin
v.3.11. (Excoffier et al., 2005) was used to analyse the apportionment of genetic variance within and
among populations from the above regions. Pairwise Fst’s among populations from these regions
were also computed in Arlequin v.3.11 (Excoffier et al., 2005). Mantel tests were used to test for a
significant correlation between geographic and genetic distances among populations from the sample
regions using GenAlex 6 (Peakall and Smouse, 2006).
Molecular Dating Analysis A time-scale for the divergence of Chaerephon species was calculated using a Bayesian
inference as implemented in BEAST version 1.5.4 (Drummond and Rambaut, 2007). This was based
on the shorter 206 nucleotide cyt b alignment, as it included more taxa. The HKY substitution model
was used in an analysis that was run for 50 million generations with a 10% burnin. A relaxed
molecular clock (uncorrelated lognormal) was employed in conjunction with a Yule species prior. The
analysis was calibrated with fossil data for the first known occurrence of Mops (11.2-16.4 MYA:
Bohme, 2003) – a single calibration point due to unavailability of fossil data. The dates are vague
under these circumstances. Time estimates were calculated based on an XML file from BEAST in
TreeAnnotator version 1.5.4 (Drummond and Rambaut, 2007). The dated tree viewed and edited in
FigTree v.1.3.1.
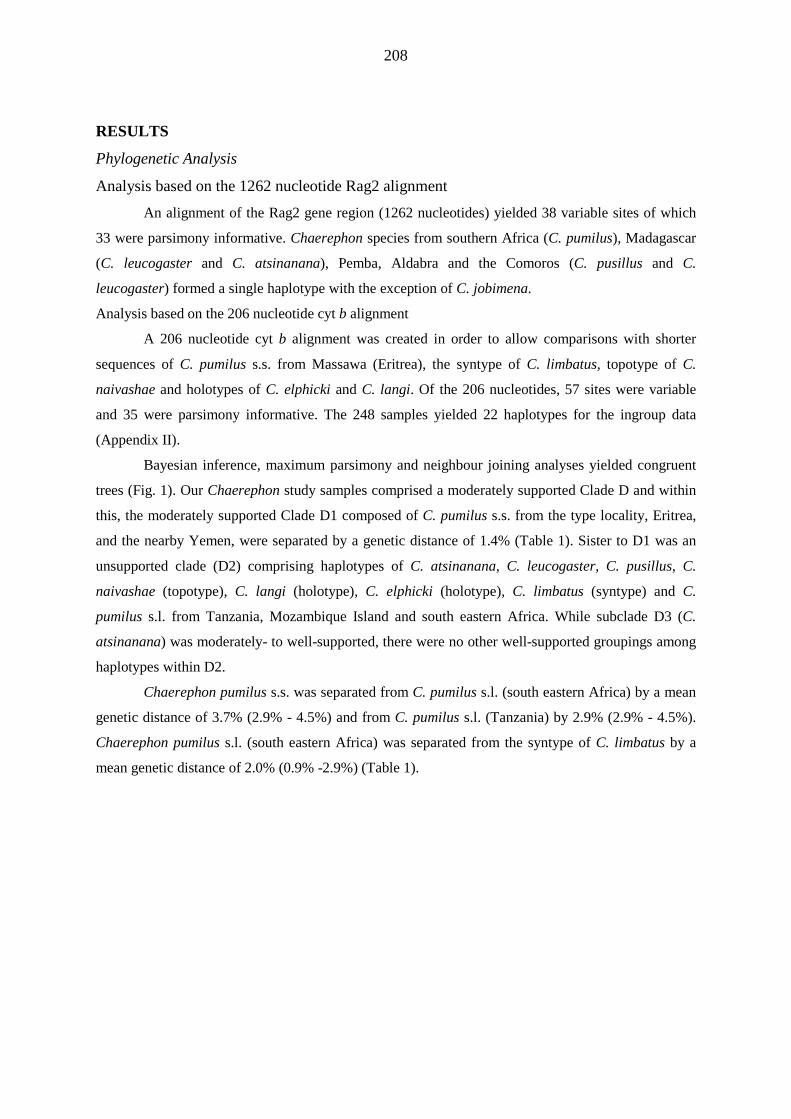
208
RESULTS
Phylogenetic Analysis
Analysis based on the 1262 nucleotide Rag2 alignment
An alignment of the Rag2 gene region (1262 nucleotides) yielded 38 variable sites of which
33 were parsimony informative. Chaerephon species from southern Africa (C. pumilus), Madagascar
(C. leucogaster and C. atsinanana), Pemba, Aldabra and the Comoros (C. pusillus and C.
leucogaster) formed a single haplotype with the exception of C. jobimena.
Analysis based on the 206 nucleotide cyt b alignment
A 206 nucleotide cyt b alignment was created in order to allow comparisons with shorter
sequences of C. pumilus s.s. from Massawa (Eritrea), the syntype of C. limbatus, topotype of C.
naivashae and holotypes of C. elphicki and C. langi. Of the 206 nucleotides, 57 sites were variable
and 35 were parsimony informative. The 248 samples yielded 22 haplotypes for the ingroup data
(Appendix II).
Bayesian inference, maximum parsimony and neighbour joining analyses yielded congruent
trees (Fig. 1). Our Chaerephon study samples comprised a moderately supported Clade D and within
this, the moderately supported Clade D1 composed of C. pumilus s.s. from the type locality, Eritrea,
and the nearby Yemen, were separated by a genetic distance of 1.4% (Table 1). Sister to D1 was an
unsupported clade (D2) comprising haplotypes of C. atsinanana, C. leucogaster, C. pusillus, C.
naivashae (topotype), C. langi (holotype), C. elphicki (holotype), C. limbatus (syntype) and C.
pumilus s.l. from Tanzania, Mozambique Island and south eastern Africa. While subclade D3 (C.
atsinanana) was moderately- to well-supported, there were no other well-supported groupings among
haplotypes within D2.
Chaerephon pumilus s.s. was separated from C. pumilus s.l. (south eastern Africa) by a mean
genetic distance of 3.7% (2.9% - 4.5%) and from C. pumilus s.l. (Tanzania) by 2.9% (2.9% - 4.5%).
Chaerephon pumilus s.l. (south eastern Africa) was separated from the syntype of C. limbatus by a
mean genetic distance of 2.0% (0.9% -2.9%) (Table 1).
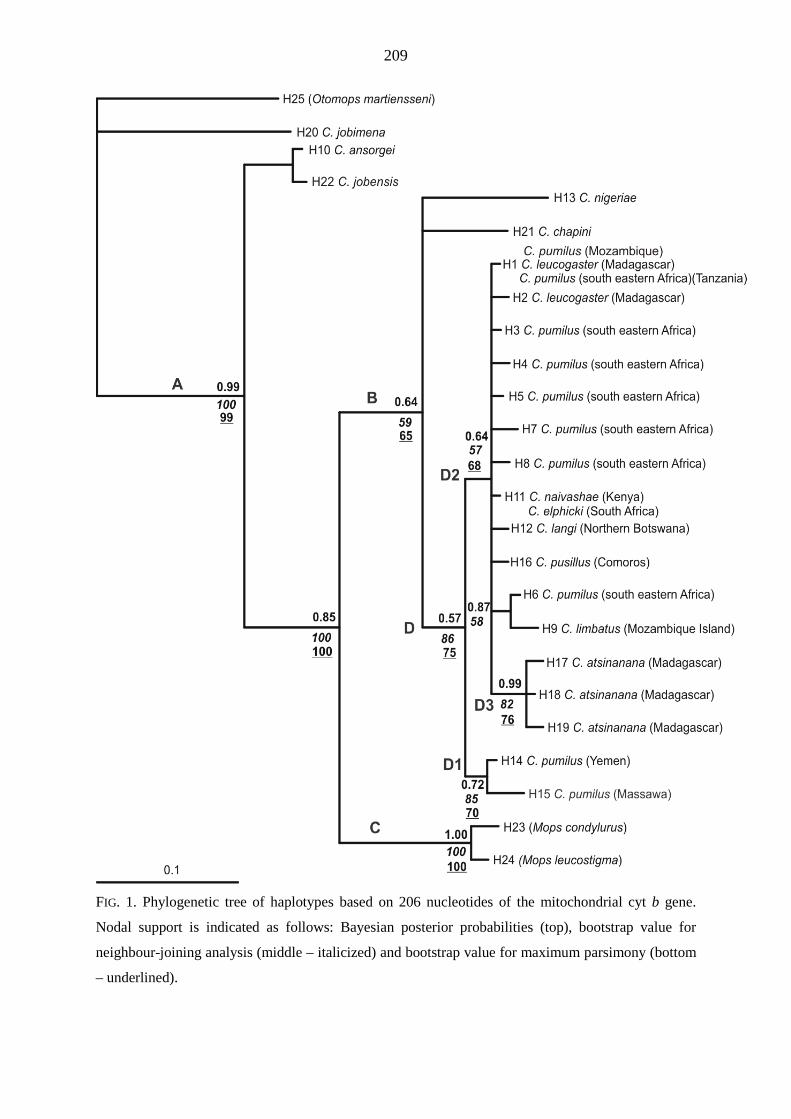
209
FIG. 1. Phylogenetic tree of haplotypes based on 206 nucleotides of the mitochondrial cyt b gene.
Nodal support is indicated as follows: Bayesian posterior probabilities (top), bootstrap value for
neighbour-joining analysis (middle – italicized) and bootstrap value for maximum parsimony (bottom
– underlined).

210
Table 1: HKY+I genetic distances (%) between haplotypes of the Chaerephon ingroup taxa based on 206 nucleotides of the cyt b region.
Species Hap 1 2 3 4 5 6 7 8 9 10 11 12 13 14 15 16 17 18 19 20 21 C. leucogaster/ C. pumilus s.l. (SEA) 1 -
C. leucogaster 2 0.4 -
C. pumilus s.l. (SEA) 3 0.4 0.9 -
C. pumilus s.l. (SEA) 4 0.9 1.4 0.4 -
C. pumilus s.l. (SEA) 5 0.4 0.9 0.9 1.4 -
C. pumilus s.l. (SEA) 6 0.9 1.4 1.4 1.9 0.4 -
C. pumilus s.l. (SEA) 7 1.4 1.9 0.9 1.4 0.9 1.4 -
C. pumilus s.l. (SEA) 8 0.9 1.4 0.4 0.9 1.4 0.9 1.4 -
C. limbatus (syntype) 9 1.9 2.4 2.4 2.9 1.4 0.9 2.4 1.9 -
C. ansorgei 10 10.7 11.3 11.3 11.9 11.3 11.2 12.5 11.2 12.4 -
C. elphicki/C. naivashae (holotype/topotype)
11 0.0 0.4 0.4 0.9 0.4 0.9 1.4 0.9 1.9 10.7 -
C. langi (holotype) 12 0.4 0.9 0.9 1.4 0.9 1.4 1.9 1.4 2.4 11.3 0.4 -
C. nigeriae 13 8.4 9.0 7.8 8.4 9.0 9.5 8.9 8.3 10.6 10.0 8.5 9.0 -
C. pumilus (Yemen) 14 1.4 1.9 1.9 2.4 1.9 2.4 2.9 2.4 3.4 10.1 1.4 1.9 9.0 -
C. pumilus (Massawa) 15 2.9 3.4 3.4 4.0 3.4 4.0 4.5 4.0 4.0 10.6 3.0 3.5 10.6 1.4 -
C. pusillus 16 0.4 0.9 0.9 1.4 0.9 1.4 1.9 1.4 2.4 11.3 0.4 0.9 9.0 1.9 3.4 -
C. atsinanana 17 1.9 2.4 2.4 2.9 2.4 2.4 3.4 2.4 3.4 10.6 1.9 2.4 9.5 3.5 5.0 2.4 -
C. atsinanana 18 1.4 1.9 1.9 2.4 1.9 1.9 2.9 1.9 2.9 10.0 1.4 1.9 8.9 2.9 4.5 1.9 0.4 -
C. atsinanana 19 1.9 2.4 2.4 2.9 2.4 2.4 3.4 2.4 3.4 9.5 1.9 2.4 8.3 2.4 4.0 2.4 0.9 0.4 -
C. jobimena 20 16.4 16.4 16.4 17.2 17.2 16.5 17.8 15.8 17.9 12.8 16.5 17.2 15.1 17.2 17.7 16.4 16.3 16.4 17.1 -
C. chapini 21 12.0 12.6 11.4 12.0 11.4 11.3 11.3 11.3 12.5 8.4 11.4 12.0 9.5 11.4 13.1 12.6 11.9 11.3 10.7 16.5 -
C. jobensis 22 6.7 7.3 7.3 7.9 6.2 6.7 7.3 7.8 7.2 12.5 6.8 7.3 12.6 6.7 7.8 7.3 9.0 8.4 7.8 20.0 9.5
199
210
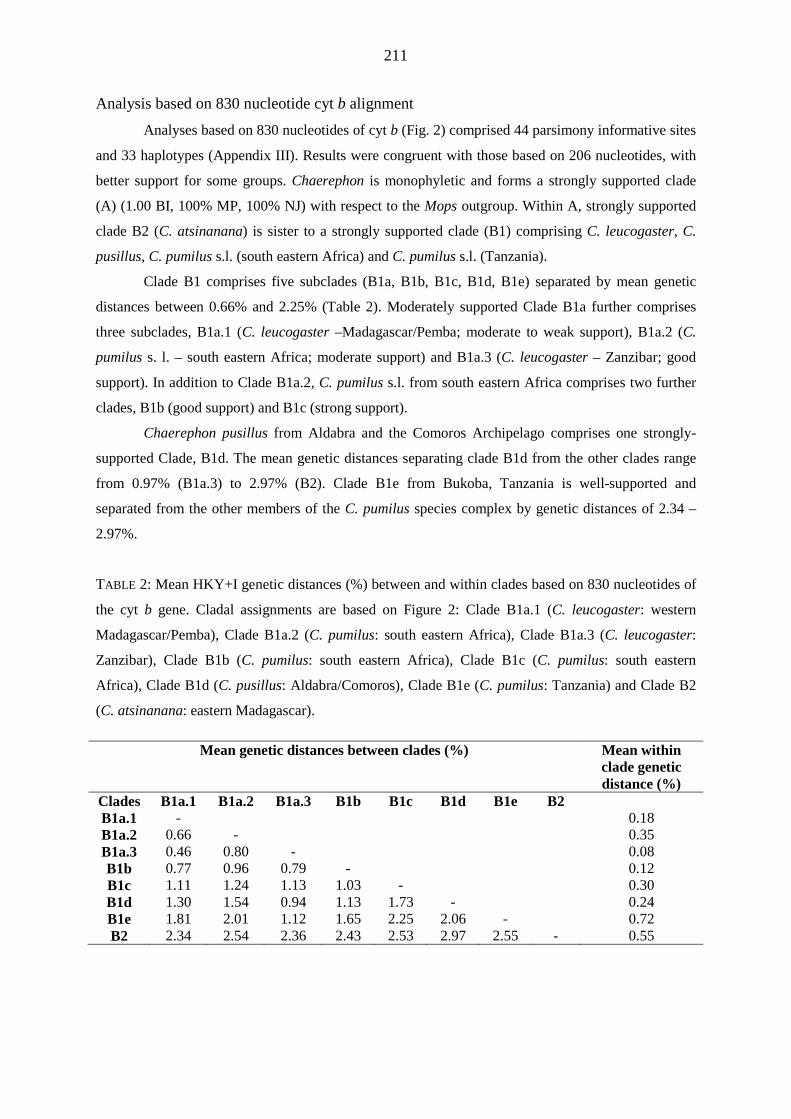
211
Analysis based on 830 nucleotide cyt b alignment Analyses based on 830 nucleotides of cyt b (Fig. 2) comprised 44 parsimony informative sites
and 33 haplotypes (Appendix III). Results were congruent with those based on 206 nucleotides, with
better support for some groups. Chaerephon is monophyletic and forms a strongly supported clade
(A) (1.00 BI, 100% MP, 100% NJ) with respect to the Mops outgroup. Within A, strongly supported
clade B2 (C. atsinanana) is sister to a strongly supported clade (B1) comprising C. leucogaster, C.
pusillus, C. pumilus s.l. (south eastern Africa) and C. pumilus s.l. (Tanzania).
Clade B1 comprises five subclades (B1a, B1b, B1c, B1d, B1e) separated by mean genetic
distances between 0.66% and 2.25% (Table 2). Moderately supported Clade B1a further comprises
three subclades, B1a.1 (C. leucogaster –Madagascar/Pemba; moderate to weak support), B1a.2 (C.
pumilus s. l. – south eastern Africa; moderate support) and B1a.3 (C. leucogaster – Zanzibar; good
support). In addition to Clade B1a.2, C. pumilus s.l. from south eastern Africa comprises two further
clades, B1b (good support) and B1c (strong support).
Chaerephon pusillus from Aldabra and the Comoros Archipelago comprises one strongly-
supported Clade, B1d. The mean genetic distances separating clade B1d from the other clades range
from 0.97% (B1a.3) to 2.97% (B2). Clade B1e from Bukoba, Tanzania is well-supported and
separated from the other members of the C. pumilus species complex by genetic distances of 2.34 –
2.97%.
TABLE 2: Mean HKY+I genetic distances (%) between and within clades based on 830 nucleotides of
the cyt b gene. Cladal assignments are based on Figure 2: Clade B1a.1 (C. leucogaster: western
Madagascar/Pemba), Clade B1a.2 (C. pumilus: south eastern Africa), Clade B1a.3 (C. leucogaster:
Zanzibar), Clade B1b (C. pumilus: south eastern Africa), Clade B1c (C. pumilus: south eastern
Africa), Clade B1d (C. pusillus: Aldabra/Comoros), Clade B1e (C. pumilus: Tanzania) and Clade B2
(C. atsinanana: eastern Madagascar).
Mean genetic distances between clades (%) Mean within clade genetic distance (%)
Clades B1a.1 B1a.2 B1a.3 B1b B1c B1d B1e B2 B1a.1 - 0.18 B1a.2 0.66 - 0.35 B1a.3 0.46 0.80 - 0.08 B1b 0.77 0.96 0.79 - 0.12 B1c 1.11 1.24 1.13 1.03 - 0.30 B1d 1.30 1.54 0.94 1.13 1.73 - 0.24 B1e 1.81 2.01 1.12 1.65 2.25 2.06 - 0.72 B2 2.34 2.54 2.36 2.43 2.53 2.97 2.55 - 0.55
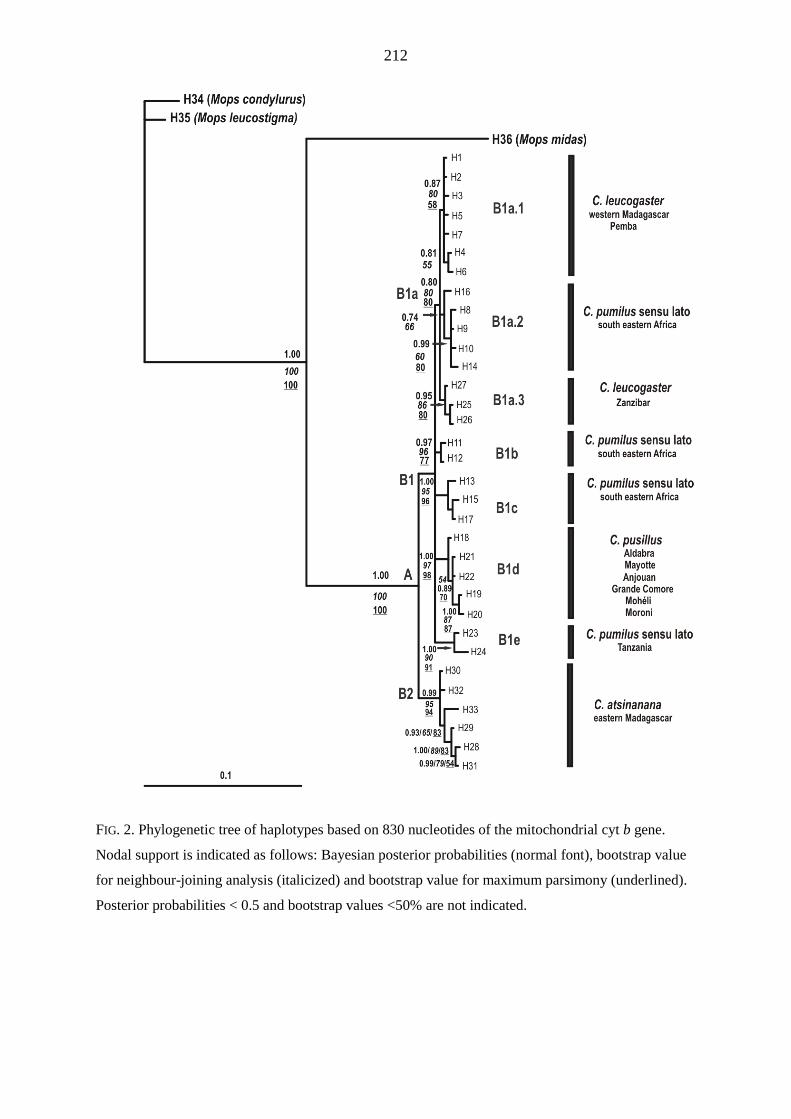
212
FIG. 2. Phylogenetic tree of haplotypes based on 830 nucleotides of the mitochondrial cyt b gene.
Nodal support is indicated as follows: Bayesian posterior probabilities (normal font), bootstrap value
for neighbour-joining analysis (italicized) and bootstrap value for maximum parsimony (underlined).
Posterior probabilities < 0.5 and bootstrap values <50% are not indicated.
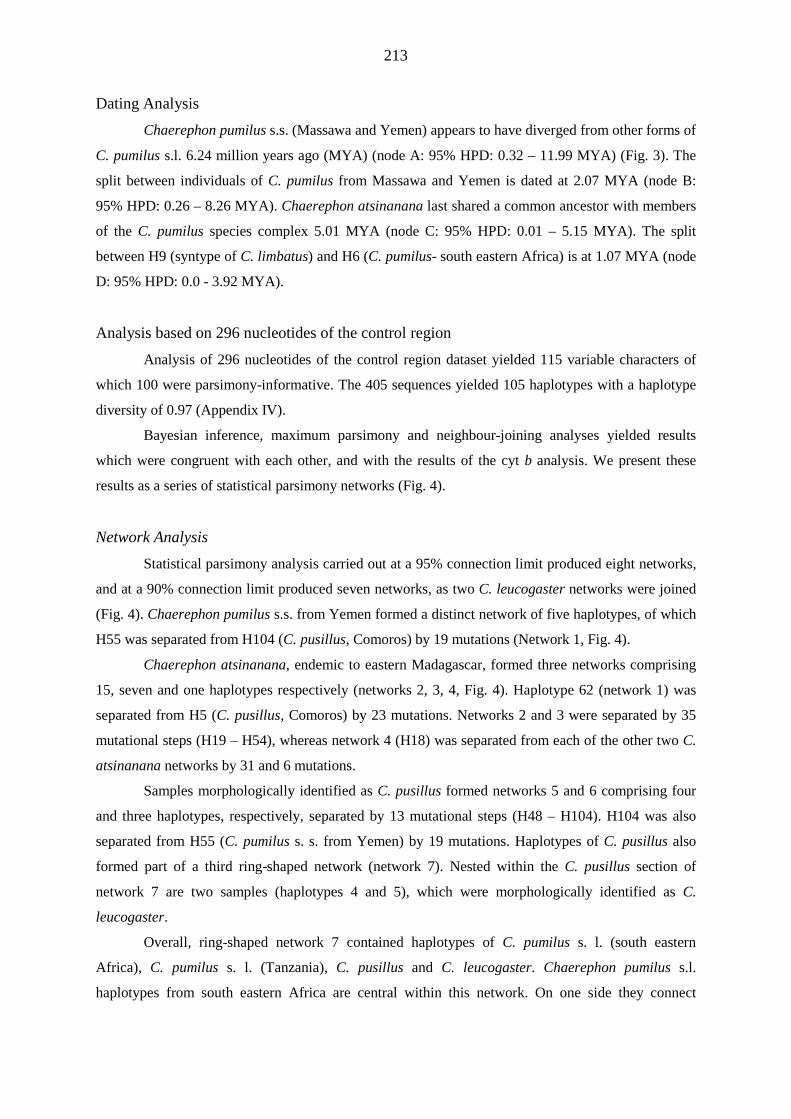
213
Dating Analysis Chaerephon pumilus s.s. (Massawa and Yemen) appears to have diverged from other forms of
C. pumilus s.l. 6.24 million years ago (MYA) (node A: 95% HPD: 0.32 – 11.99 MYA) (Fig. 3). The
split between individuals of C. pumilus from Massawa and Yemen is dated at 2.07 MYA (node B:
95% HPD: 0.26 – 8.26 MYA). Chaerephon atsinanana last shared a common ancestor with members
of the C. pumilus species complex 5.01 MYA (node C: 95% HPD: 0.01 – 5.15 MYA). The split
between H9 (syntype of C. limbatus) and H6 (C. pumilus- south eastern Africa) is at 1.07 MYA (node
D: 95% HPD: 0.0 - 3.92 MYA).
Analysis based on 296 nucleotides of the control region
Analysis of 296 nucleotides of the control region dataset yielded 115 variable characters of
which 100 were parsimony-informative. The 405 sequences yielded 105 haplotypes with a haplotype
diversity of 0.97 (Appendix IV).
Bayesian inference, maximum parsimony and neighbour-joining analyses yielded results
which were congruent with each other, and with the results of the cyt b analysis. We present these
results as a series of statistical parsimony networks (Fig. 4).
Network Analysis Statistical parsimony analysis carried out at a 95% connection limit produced eight networks,
and at a 90% connection limit produced seven networks, as two C. leucogaster networks were joined
(Fig. 4). Chaerephon pumilus s.s. from Yemen formed a distinct network of five haplotypes, of which
H55 was separated from H104 (C. pusillus, Comoros) by 19 mutations (Network 1, Fig. 4).
Chaerephon atsinanana, endemic to eastern Madagascar, formed three networks comprising
15, seven and one haplotypes respectively (networks 2, 3, 4, Fig. 4). Haplotype 62 (network 1) was
separated from H5 (C. pusillus, Comoros) by 23 mutations. Networks 2 and 3 were separated by 35
mutational steps (H19 – H54), whereas network 4 (H18) was separated from each of the other two C.
atsinanana networks by 31 and 6 mutations.
Samples morphologically identified as C. pusillus formed networks 5 and 6 comprising four
and three haplotypes, respectively, separated by 13 mutational steps (H48 – H104). H104 was also
separated from H55 (C. pumilus s. s. from Yemen) by 19 mutations. Haplotypes of C. pusillus also
formed part of a third ring-shaped network (network 7). Nested within the C. pusillus section of
network 7 are two samples (haplotypes 4 and 5), which were morphologically identified as C.
leucogaster.
Overall, ring-shaped network 7 contained haplotypes of C. pumilus s. l. (south eastern
Africa), C. pumilus s. l. (Tanzania), C. pusillus and C. leucogaster. Chaerephon pumilus s.l.
haplotypes from south eastern Africa are central within this network. On one side they connect
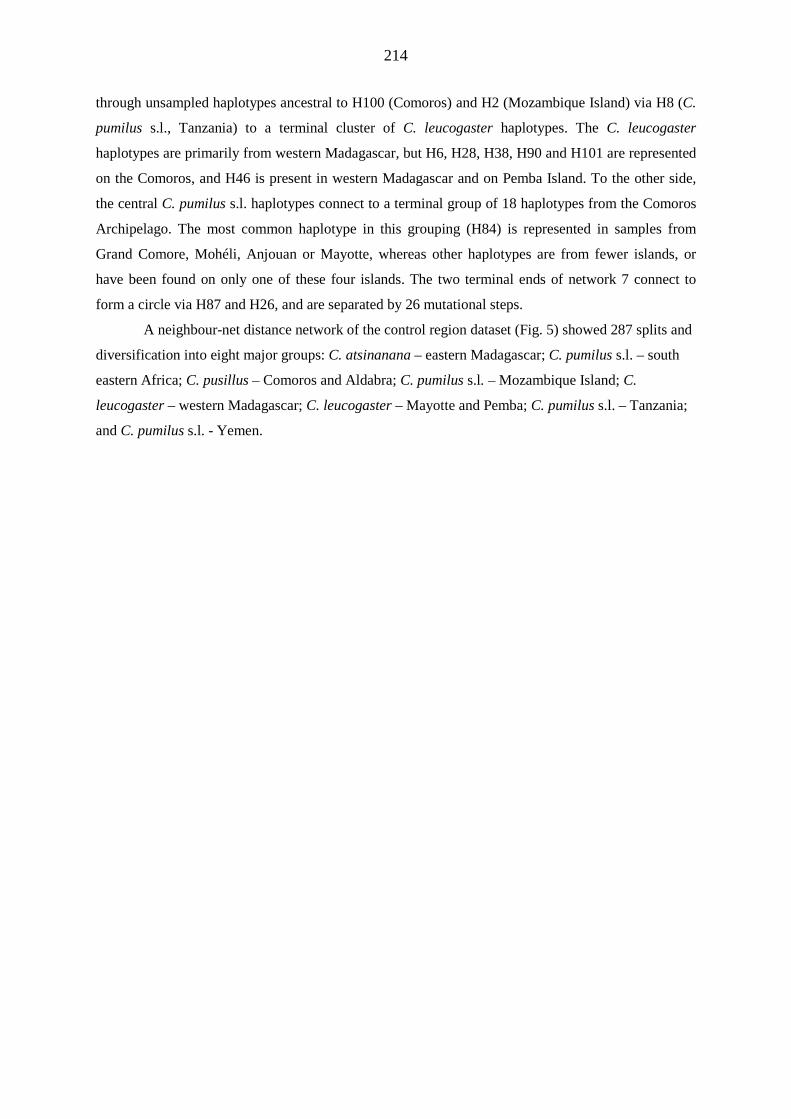
214
through unsampled haplotypes ancestral to H100 (Comoros) and H2 (Mozambique Island) via H8 (C.
pumilus s.l., Tanzania) to a terminal cluster of C. leucogaster haplotypes. The C. leucogaster
haplotypes are primarily from western Madagascar, but H6, H28, H38, H90 and H101 are represented
on the Comoros, and H46 is present in western Madagascar and on Pemba Island. To the other side,
the central C. pumilus s.l. haplotypes connect to a terminal group of 18 haplotypes from the Comoros
Archipelago. The most common haplotype in this grouping (H84) is represented in samples from
Grand Comore, Mohéli, Anjouan or Mayotte, whereas other haplotypes are from fewer islands, or
have been found on only one of these four islands. The two terminal ends of network 7 connect to
form a circle via H87 and H26, and are separated by 26 mutational steps.
A neighbour-net distance network of the control region dataset (Fig. 5) showed 287 splits and
diversification into eight major groups: C. atsinanana – eastern Madagascar; C. pumilus s.l. – south
eastern Africa; C. pusillus – Comoros and Aldabra; C. pumilus s.l. – Mozambique Island; C.
leucogaster – western Madagascar; C. leucogaster – Mayotte and Pemba; C. pumilus s.l. – Tanzania;
and C. pumilus s.l. - Yemen.

215
FIG. 3.Chronogram based on 206 nucleotides of the cyt b gene showing (x indicates the fossil date used to calibrate the tree).
215
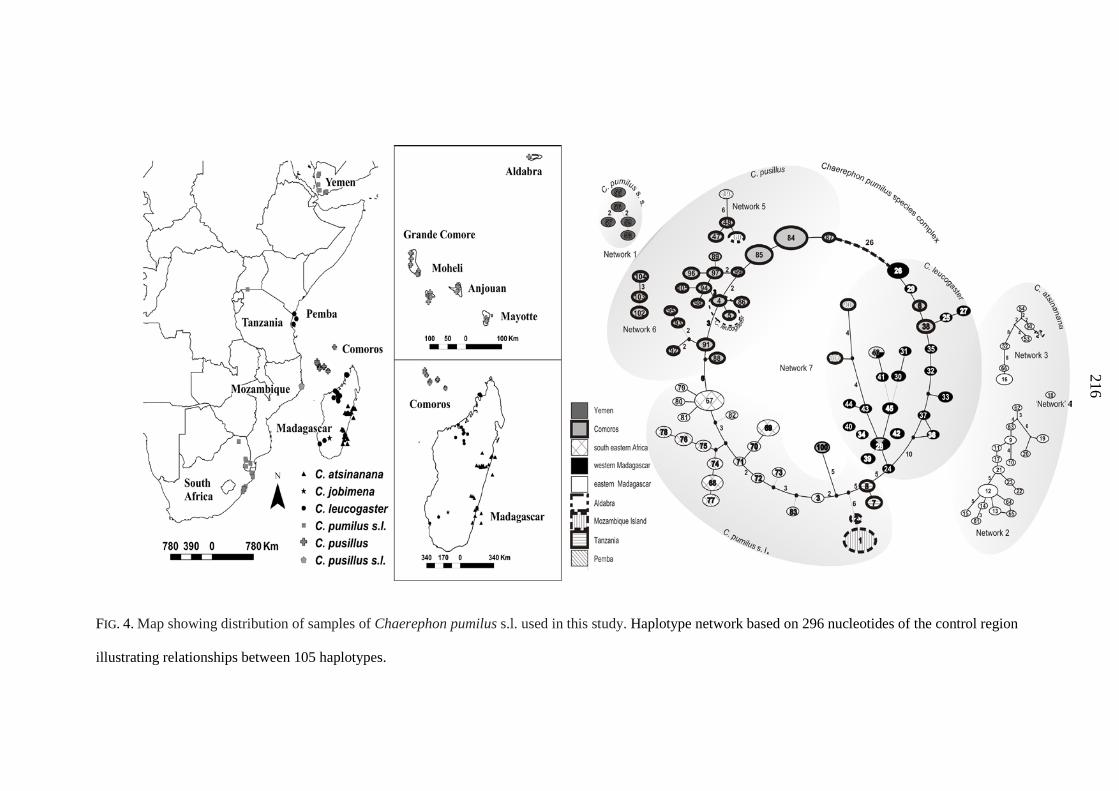
216
FIG. 4. Map showing distribution of samples of Chaerephon pumilus s.l. used in this study. Haplotype network based on 296 nucleotides of the control region
illustrating relationships between 105 haplotypes.
216
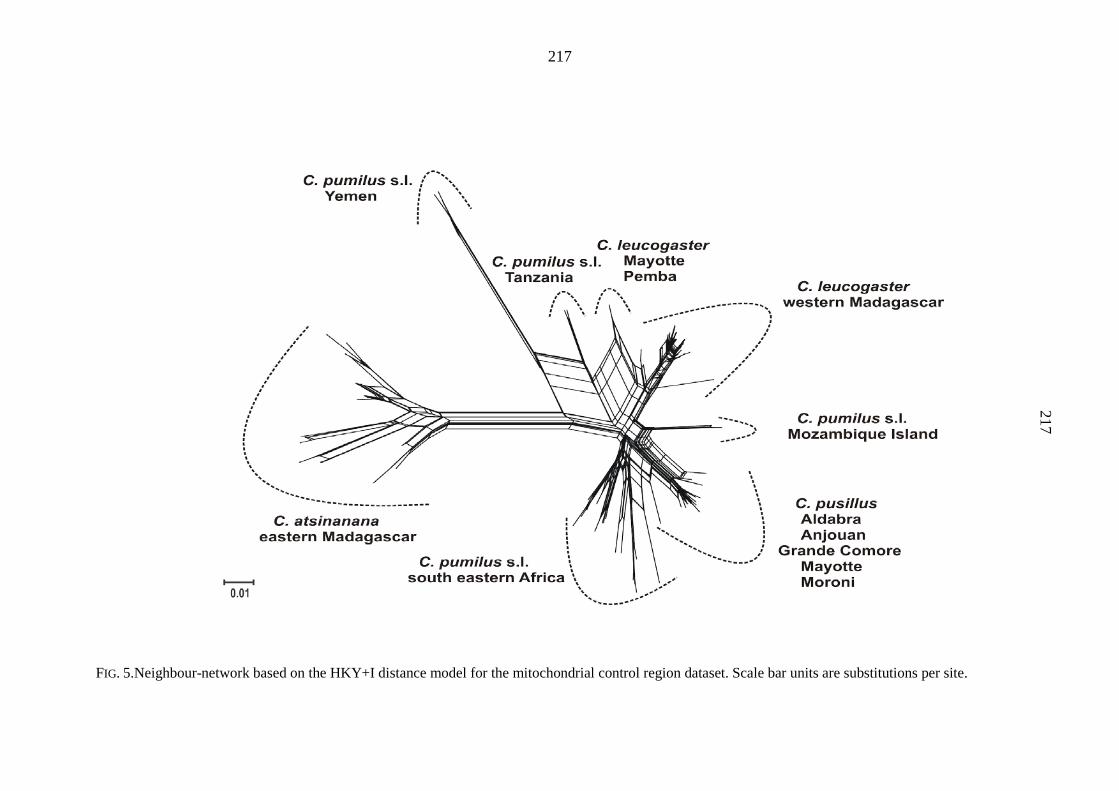
217
FIG. 5.Neighbour-network based on the HKY+I distance model for the mitochondrial control region dataset. Scale bar units are substitutions per site.
217
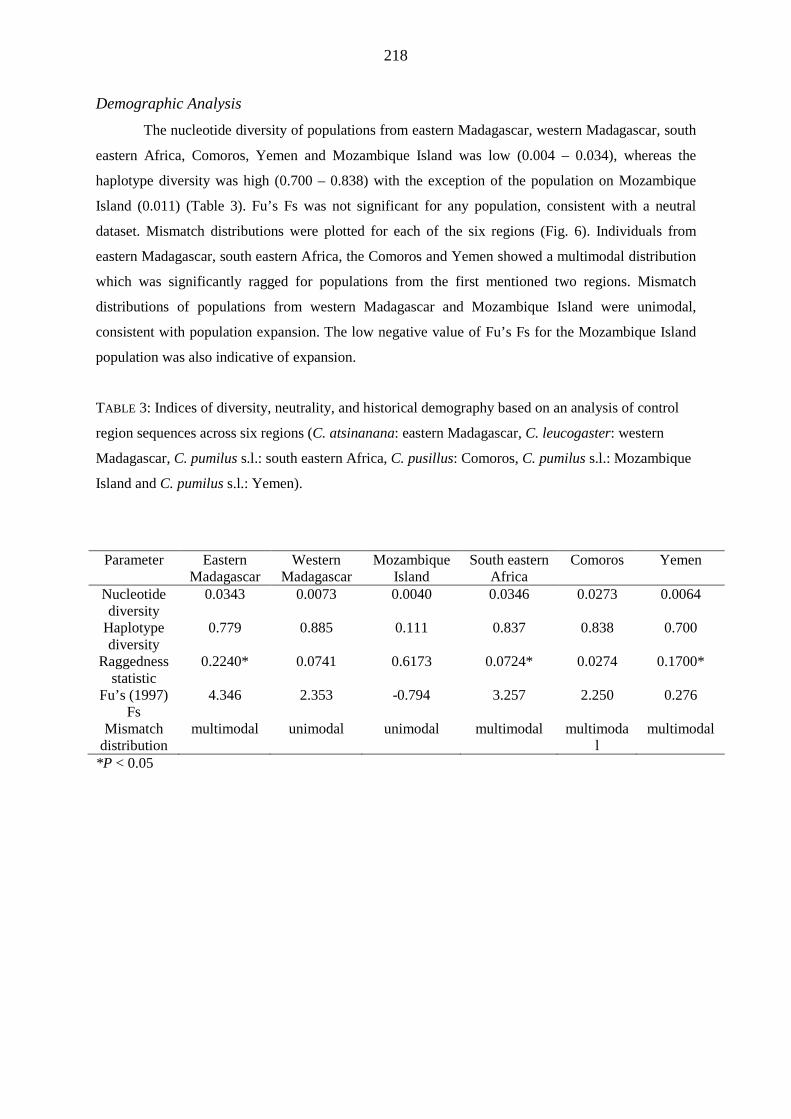
218
Demographic Analysis The nucleotide diversity of populations from eastern Madagascar, western Madagascar, south
eastern Africa, Comoros, Yemen and Mozambique Island was low (0.004 – 0.034), whereas the
haplotype diversity was high (0.700 – 0.838) with the exception of the population on Mozambique
Island (0.011) (Table 3). Fu’s Fs was not significant for any population, consistent with a neutral
dataset. Mismatch distributions were plotted for each of the six regions (Fig. 6). Individuals from
eastern Madagascar, south eastern Africa, the Comoros and Yemen showed a multimodal distribution
which was significantly ragged for populations from the first mentioned two regions. Mismatch
distributions of populations from western Madagascar and Mozambique Island were unimodal,
consistent with population expansion. The low negative value of Fu’s Fs for the Mozambique Island
population was also indicative of expansion.
TABLE 3: Indices of diversity, neutrality, and historical demography based on an analysis of control
region sequences across six regions (C. atsinanana: eastern Madagascar, C. leucogaster: western
Madagascar, C. pumilus s.l.: south eastern Africa, C. pusillus: Comoros, C. pumilus s.l.: Mozambique
Island and C. pumilus s.l.: Yemen).
Parameter Eastern Madagascar
Western Madagascar
Mozambique Island
South eastern Africa
Comoros Yemen
Nucleotide diversity
0.0343 0.0073 0.0040 0.0346 0.0273 0.0064
Haplotype diversity
0.779 0.885 0.111 0.837 0.838 0.700
Raggedness statistic
0.2240* 0.0741 0.6173 0.0724* 0.0274 0.1700*
Fu’s (1997) Fs
4.346 2.353 -0.794 3.257 2.250 0.276
Mismatch distribution
multimodal unimodal unimodal multimodal multimodal
multimodal
*P < 0.05
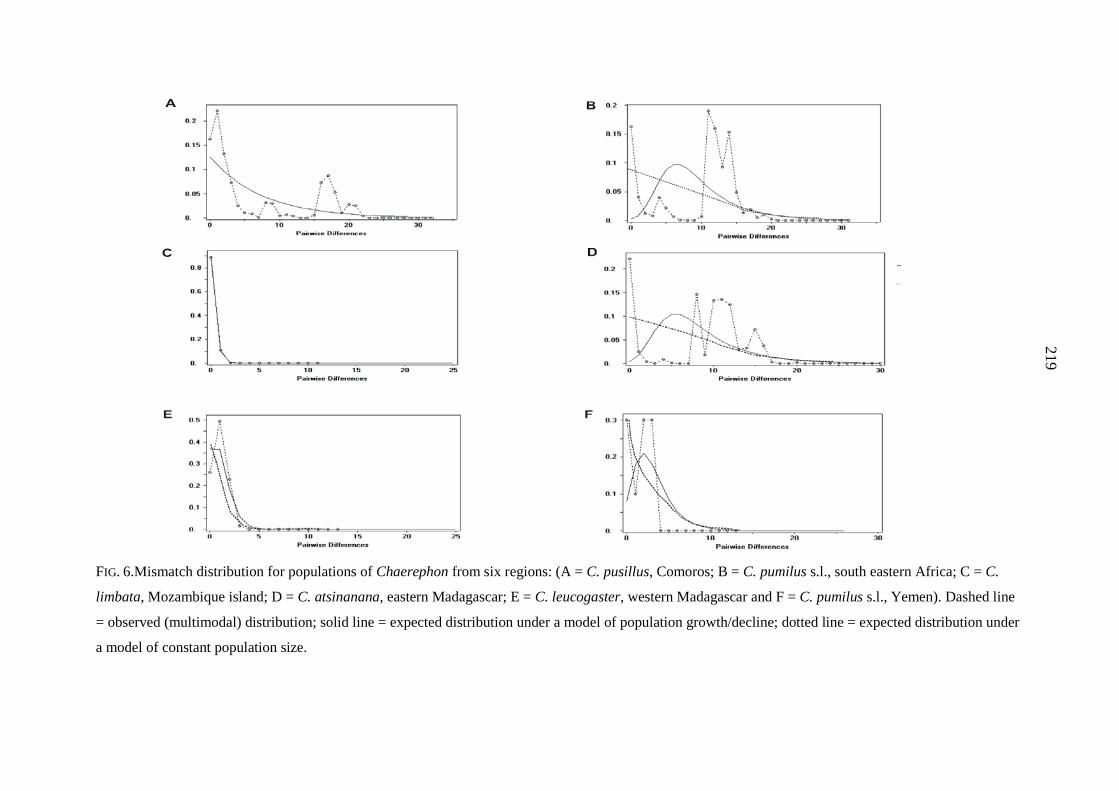
219
FIG. 6.Mismatch distribution for populations of Chaerephon from six regions: (A = C. pusillus, Comoros; B = C. pumilus s.l., south eastern Africa; C = C.
limbata, Mozambique island; D = C. atsinanana, eastern Madagascar; E = C. leucogaster, western Madagascar and F = C. pumilus s.l., Yemen). Dashed line
= observed (multimodal) distribution; solid line = expected distribution under a model of population growth/decline; dotted line = expected distribution under
a model of constant population size.
219
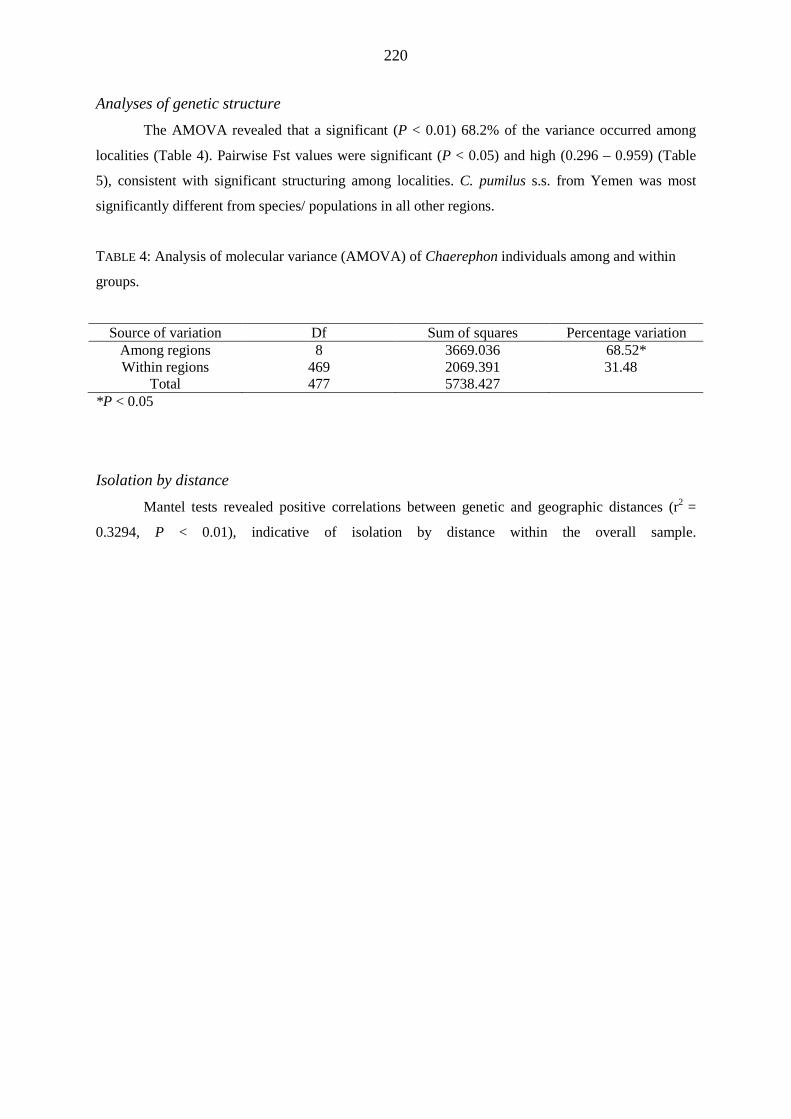
220
Analyses of genetic structure The AMOVA revealed that a significant (P < 0.01) 68.2% of the variance occurred among
localities (Table 4). Pairwise Fst values were significant (P < 0.05) and high (0.296 – 0.959) (Table
5), consistent with significant structuring among localities. C. pumilus s.s. from Yemen was most
significantly different from species/ populations in all other regions.
TABLE 4: Analysis of molecular variance (AMOVA) of Chaerephon individuals among and within
groups.
Source of variation Df Sum of squares Percentage variation Among regions 8 3669.036 68.52* Within regions 469 2069.391 31.48
Total 477 5738.427 *P < 0.05
Isolation by distance Mantel tests revealed positive correlations between genetic and geographic distances (r2 =
0.3294, P < 0.01), indicative of isolation by distance within the overall sample.
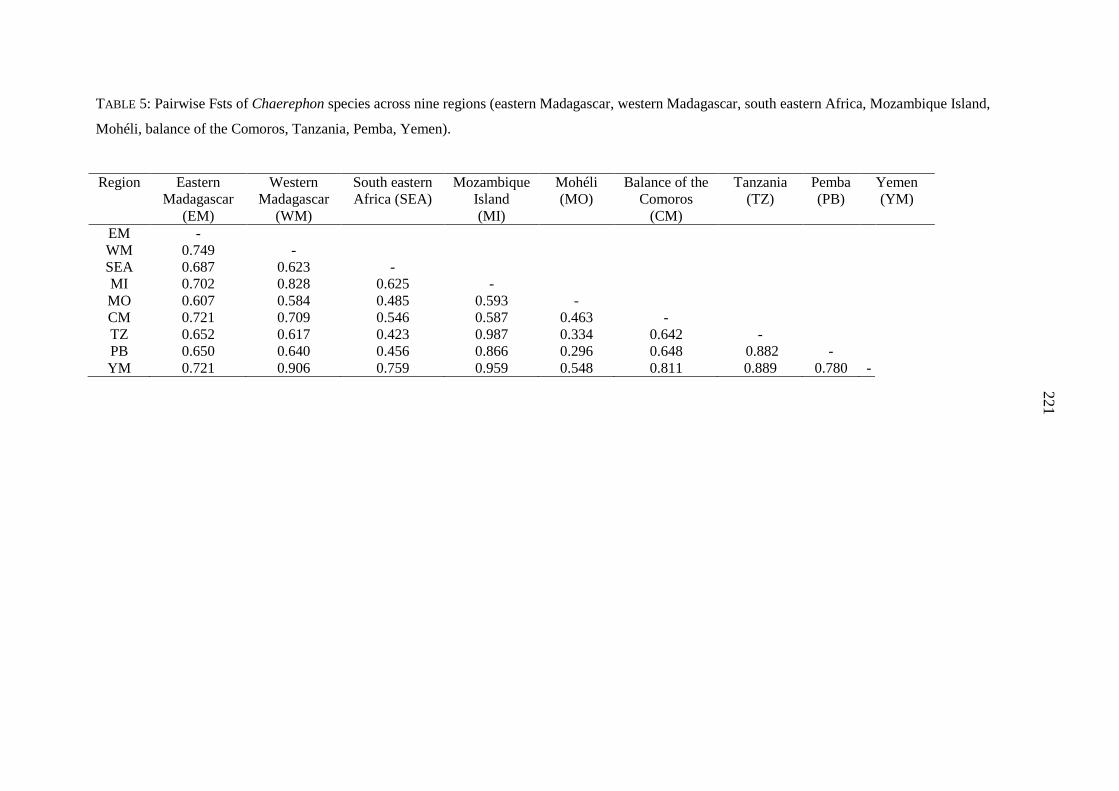
221
TABLE 5: Pairwise Fsts of Chaerephon species across nine regions (eastern Madagascar, western Madagascar, south eastern Africa, Mozambique Island,
Mohéli, balance of the Comoros, Tanzania, Pemba, Yemen).
Region Eastern Madagascar
(EM)
Western Madagascar
(WM)
South eastern Africa (SEA)
Mozambique Island (MI)
Mohéli (MO)
Balance of the Comoros
(CM)
Tanzania (TZ)
Pemba (PB)
Yemen (YM)
EM - WM 0.749 - SEA 0.687 0.623 - MI 0.702 0.828 0.625 - MO 0.607 0.584 0.485 0.593 - CM 0.721 0.709 0.546 0.587 0.463 - TZ 0.652 0.617 0.423 0.987 0.334 0.642 - PB 0.650 0.640 0.456 0.866 0.296 0.648 0.882 - YM 0.721 0.906 0.759 0.959 0.548 0.811 0.889 0.780 -
221
222
DISCUSSION This study complements that of Goodman et al. (2010) on genetic variation in members of the
Chaerephon pumilus species complex from the western Indian Ocean region, including eastern Africa
(Tanzania and Eritrea) and Yemen. We included all of the samples used by these authors, and
additional samples from south eastern Africa and nearshore and offshore islands (South Africa,
Swaziland, Mozambique Island, Zanzibar) for broader geographical coverage. Also included in our
dataset were the holotypes (C. elphicki and C. langi), topotype (C. naivashae) and syntypes (C.
limbatus) of taxa considered junior synonyms of C. pumilus.
Our findings support the genetic and phylogenetic relationships reported by Goodman et al.
(2010), specifically the distinctness of: C. atsinanana from eastern Madagascar; populations on the
Comoros and Aldabra, referred to C. pusillus; samples from western Madagascar, Pemba, and the
Comoros, referred to C. leucogaster; and samples from Tanzania, referred to C. pumilus s.l.
We recovered three clades of C. pumilus s.l. from south eastern Africa, and find that these also
form part of the C. pumilus species complex reported by Goodman et al. (2010). Consistent with
Taylor et al. (2009) and Naidoo et al. (2013), we find a clade of C. pumilus s.l. from south eastern
Africa nested within a C. leucogaster clade. In phylogenies based on mitochondrial markers,
paraphyly among species may be explained by introgression due to past hybridization. This has been
reported for several vespertillionid genera including Myotis (Berthier et al., 2006), Eptesicus (Mayer
and von Helversen, 2001; Artyushin et al., 2009) and Scotophilus (Vallo et al., 2012), but not yet for
the Molossidae. This hypothesis could be further tested by analyses based on nuclear markers such as
microsatellites.
Taylor et al. (2009) have hypothesised that the distinct cyt b clades of C. pumilus s.l. from south
eastern Africa might represent cryptic species with different echolocation characteristics, although
recent research suggests that this is not the case (Naidoo et al., 2013). Initial results of an ongoing
study examining population genetic relationships among these lineages using microsatellite markers,
indicates that the clades of C. pumilus s.l. from south eastern Africa form one interbreeding
population, and are therefore one species.
Chaerephon leucogaster consists of two cyt b clades, one located on Zanzibar and the other
on Madagascar and Pemba. In analyses based on the control region, a further clade comprising two C.
leucogaster haplotypes from Mayotte (Comoros) and Pemba (H4, H5) (Fig. 4) forms a strongly
supported group with C. pusillus from Aldabra and the Comoros. As C. leucogaster is
morphologically distinct from C. pusillus based on presumed-adaptive craniofacial and dental
characters (Goodman et al., 2010), this could be explained by introgression of C. pusillus genes into
C. leucogaster due to past hybridization between these taxa. The next step in resolving the taxonomy
of C. leucogaster, which was described from western Madagascar, would be to determine if the
various small morphologically described west African forms are genetically associated with C.
223
leucogaster, and also to carry out phylogenetic investigations based on nuclear markers to determine
the likelihood that the paraphyly observed in C. leucogaster is due to introgression.
Chaerephon langi, C. elphicki, C. limbatus and C. naivashae We investigated the taxonomic status of four forms of C. pumilus currently considered as
junior synonyms (Simmons, 2005), by including sequence data from the holotypes of C. langi (TM
6544) and C. elphicki (TM 2488) and a topotype C. naivashae (FMNH 152967), and the syntypes of
C. limbatus (ZMB 537, 538) in our analyses. Analyses show that these samples form three haplotypes
within an unresolved lineage (D2) (Fig. 1) of the C. pumilus species complex. They are separated
from C. pumilus s.s. by species level genetic distances of 3.0% - 4.0% (Baker and Bradley, 2006), and
we therefore regard them as possibly specifically distinct from C. pumilus.
Chaerephon naivashae (type locality: Naivasha Station, Kenya) and C. elphicki (type locality:
Malelane Estate, Barberton District, Mpumalanga Province, South Africa) do not appear to be
genetically distinct from each other as they fall within the same haplotype (H11) based on 206
nucleotides of cyt b. They are separated from other D2 haplotypes by distances of 0.0% to 1.9% (vs.
C. limbatus). Although Peterson et al. (1995) proposed the elevation of naivashae to species rank
based on skull morphology, its distinctness is not supported by our genetic data and it would be
premature to implement this proposed taxonomic change based on one type of evidence (Zachos et
al., 2013). Chaerephon langi (type locality: Tsotsoroga Pan, Northern Botswana) is separated from
other Clade D2 haplotypes by genetic distances of 0.4% - 2.4%).
The syntype specimen of C. limbatus (type locality: Mozambique Island) is separated from C.
leucogaster and three C. pumilus s.l. haplotypes from south eastern Africa by genetic distances of
0.9% - 2.9% and greater than the distance between C. pusillus and C. leucogaster, possibly consistent
with the description of C. limbatus as a genetic species. Chaerephon limbatus is also morphologically
distinct based on skull morphology and light-coloured wings, and therefore was considered a distinct
species by Rosevear (1965) and Peterson et al. (1995). There is thus morphological and molecular
evidence to support the status of C. limbatus as a distinct species. However in some analyses (see Fig.
3), C. limbatus is nested within C. pumilus s.l. lineages from south eastern Africa, from which it is
separated by a genetic distance of 0.9%. It would therefore seem unwarranted to regard this syntype
as clearly representative of an independent species, and perhaps more appropriate to regard it as a
genetic variant of C. pumilus s.l. from south eastern Africa.
Is the C. pumilus species complex a ring species?
The distribution of network 7 of the C. pumilus species complex is suggestive of a ring
species. Haplotype groups are distributed on a series of islands and continental landmasses
surrounding the Mozambique Channel, which, at 1600 km long and 400-950 km wide between
mainland Africa and Madagascar and the Comoros Archipelago, forms a putative geographic barrier
224
to dispersal of these bats. The Comoros Archipelago is situated toward the north of the channel,
equidistant from northern Mozambique and north western Madagascar, and separated from each of
them by ~ 300 km. The Comoro islands have been reported for bats to act as ‘stepping stones’ across
the channel (Weyeneth et al., 2011).
It is proposed that ring species arise by expansion of a single species in two directions around
a geographical barrier, accompanied by gradual divergence into two forms, which, when they
eventually meet, behave as separate species (Stegnejer in Jordan (1905) in Irwin et al., 2001). Afro-
Malagasy molossids share a wing morphology adapted for fast-flying aerial feeding, and are capable
of covering scores of kilometres whilst foraging (Taylor et al., 2012). Based on their size, it would
appear unlikely that the smaller molossids, C. pumilus and C. leucogaster, which have relatively
weaker flight ability than larger molossids, could naturally traverse the Mozambique Channel on a
regular basis, or perhaps the inter-island gaps. Migration of these bats could be associated with
seasonal wind patterns of the Inter-Tropical Convergence Zone (ITCZ) (Dijkstra, 2007; Anderson,
2009). Recent evidence suggests that such exchanges do occur in bats (Weyeneth et al., 2008;
Goodman et al., 2009; Weyeneth et al. 2011).
Chaerephon atsinanana and the C. pumilus species complex diverged from C. pumilus s.s.
(type locality Eritrea) about 6.24 MYA (Fig. 3). Chaerephon atsinanana and its sister group,
comprising C. leucogaster, C. pusillus and C. pumilus s.l. from south eastern Africa and Tanzania,
last shared a common ancestor 5.01 MYA. As the predominant pattern of dispersal of bats is from the
African mainland to Madagascar and not vice versa (Eger and Mitchell, 2003; Ratrimomanarivo et al.,
2007; Russell et al., 2007), it is likely that the lineage which led to C. atsinanana, whose current
range is eastern Madagascar, colonised this island by over-water dispersal from the mainland.
The C. pumilus species complex appears to have diversified primarily during the Pleistocene
era of the Quaternary (Fig. 3). Although Pleistocene era glacial cycling may have played a role, we
speculate that their evolution has been strongly influenced by distribution on a ring of landmasses
bordering the Mozambique Channel, as discussed below.
An ‘ideal’ ring species would have the following characteristics (Irwin et al., 2001): (1) The
chain forms a complete ring; (2) The two distinct terminal forms occur in sympatry; (3) Gene flow
through a chain of populations has connected them before sympatry; and (4) The terminal
differentiates are connected by gradual geographical differentiation. To determine if the C. pumilus
species complex represents such a ring species, we evaluate it based on these four criteria.
Criterion 1: All members of network 7 of the C. pumilus species complex are part of the same
90% parsimony network (Fig. 4). Although there are some missing (unsampled) haplotypes, they
form a genetic ring in which the terminal taxa are C. pusillus (Comoros and Aldabra) and C.
leucogaster (western Madagascar), separated by a relatively large gap of 26 nucleotides between H87
and H26 (Fig. 4). In the case of a ring species, an ancestral form should undergo a range expansion
from one side of the barrier to the other along two pathways. We postulate that the ancestral taxa were
225
forms of C. pumilus s.l., differentiated along a north/south gradient on the African continent (southern
Africa through Mozambique to Tanzania), and that these independently underwent over-water range
expansions to the Comoros and Aldabra.
One pathway appears to have been from south east Africa (H38) to the Comoros and Aldabra
(H88) (Fig. 4) resulting in colonization of the Comoros Archipelago and subsequently Aldabra and
differentiation into the terminal form C. pusillus, endemic to these islands. The other pathway appears
to have been from south east Africa (H3) via the ancestors of H100 (Mohéli) and H2 (Mozambique
Island) through Tanzania (H8) to western Madagascar (H24, C. leucogaster) (Fig. 4).
Chaerephon leucogaster appears to have diversified on Madagascar, where it underwent a
Pleistocene-era population expansion, as indicated by a unimodal mismatch distribution (Fig. 5,
Ratrimomanarivo et al., 2009). Chaerephon leucogaster haplotypes 4 and 5 are found on the
Comoros, sympatric with C. pusillus, possibly indicative of further long distance colonization from
Madagascar back to the Comoros, completing the geographic ring (Fig. 4). Chaerephon leucogaster,
although currently partially sympatric with C. pusillus on Mayotte, is likely to have diverged in
allopatry on Madagascar, an isolated landmass, rather than by circular overlap of populations without
vicariant barriers to prevent interbreeding, as in a ring species (Irwin et al., 2001).
Criterion 2. The terminal forms of the C. pumilus species complex ring, C. pusillus and C.
leucogaster, are morphologically and genetically distinct (Goodman et al., 2010), and are sympatric
on Mayotte (Fig. 4), consistent with expectations for a ring species.
Criterion 3. Significant pairwise Fst values among localities for the C. pumilus species
complex (0.296 – 0.882) are indicative of high levels of genetic structure and relatively low levels of
gene flow. Consistent with this, AMOVA reveals a significant 68.52% of the variance among
localities. Further, analyses of gene flow using Migrate indicate essentially no migration between
localities. However, there are two instances of haplotype sharing between localities (H46 - Pemba
Island and Madagascar; H28 - Madagascar and Mayotte), consistent with some contemporary gene
flow or incomplete lineage sorting. However, the overall prediction for a ring species, namely high
levels of gene flow though circular overlaps, is not supported.
Criterion 4. Contrary to the high levels of differentiation between localities, discussed above,
a significant Mantel test statistic is indicative of isolation by distance; consistent with a level of
gradual genetic differentiation between the terminal differentiates.
SUMMARY AND CONCLUSIONS Our first hypothesis is supported, as we find that the junior synonyms of C. pumilus,
represented by the syntype of C. limbatus, topotype of C. naivashae, and holotypes of C. elphicki and
C. langi, are genetically distinct at species level from the nominate form, C. pumilus s.s. from
Massawa, Eritrea.
226
Our second hypothesis is also supported, as analyses based on the mitochondrial cyt b and
control regions indicate that forms of C. pumilus s.l. from south eastern Africa are possibly distinct at
the species level from C. pumilus s.s. We further find that they form part of the C. pumilus species
complex, also comprising C. pumilus s.s., C. atsinanana, C. leucogaster, C. pusillus and C. pumilus
s.l. (Tanzania) (Goodman et al., 2010). Pending confirmation from other forms of data, we suggest
that C. pumilus s.l. from south eastern African be renamed.
With respect to our third hypothesis, we find that network 7 within the C. pumilus species
complex has several of the attributes of a ring species, although it appears to differ from this model in
some important respects. Chaerephon leucogaster, C. pumilus s.l. (south eastern Africa) and C.
pusillus form a ring in which haplotypes of the last two species represent terminally differentiated
forms occurring in sympatry on Mayotte. Although there is evidence of isolation by distance, there
was also a relatively high degree of structuring and limited gene flow around the ring; it appears that
the island based species may have differentiated in allopatry, with some gene flow associated with
over water dispersal. In contrast, differentiation of the species located along the south east coast of
Africa, from South Africa northwards to Tanzania, may have been according to the isolation by
distance model.
We conclude there are perhaps three species (see Fig. 4): 1. The ‘real’ C. pumilus
(Network 1); 2. C. atsinanana (Networks 2,3,4) and 3. the C. pumilus species complex
(Networks 5.6.7). We agree that Clade C represents at least 2 species, one of which is C.
atsinanana. Reference to Figure 2 indicates that there is significant support not only for
Clade C (Fig. 4.), but also for most subclades within Clade C. Thus, based on the
Phylogenetic Species Concept, there are likely to be a number of distinct species within
Clade C (C. atsinanana, C. pumilus (south eastern Africa), C. leucogaster and C. pusillus).
The genetic distance between C. pumilus (south eastern Africa), C. leucogaster and C.
pusillus are low (<1.7%), which might indicate that they are really subspecies or incipient
species. However, there are morphological differences which are consistent with their being
distinct species (Goodman et al. 2010). Without additional evidence from nuclear markers, it
is not possible to resolve the issue of the number of species present in this complex.
ACKNOWLEDGEMENTS Fieldwork for this study was supported by grants from Conservation International (CABS),
Fondation Française pour la Recherche sur la Biodiversité, The John T. and Catherine D. MacArthur
Foundation and the Volkswagen Foundation; genetic analyses were financed by the latter
organization. On Madagascar, we are grateful to the Direction des Eaux et Forêts and Association
National pour la Gestion des Aires Protégées and on Aldabra, The Seychelles Island Foundation and
227
Ministry of Environment, Natural Resources and Transport, Division of Nature Conservation for
issuing permits to conduct faunal surveys and aid in numerous ways. For assistance in the field, we
thank Eddy Rakotonandrasana, Julie Ranivo, Jirot Rakotomavo, Beza Ramasindrazana, Jacobin
Ranaivo and Fanja Ratrimomanarivo on Madagascar; Manuel Ruedi, Nicole Weyeneth, and Yahaya
Ibrahim in the Comoros; and Gérard Rocamora and Vincent Robert on Aldabra. We are grateful to
Teresa Kearny at the Ditsong Museum for access to holotype material used in the analyses.
REFERENCES AMMERMAN, L.K., D.N. LEE, and T.M. Tipps. 2012. First molecular phylogenetic insights into the
evolution of free-tailed bats in the subfamily Molossinae (Molossidae, Chiroptera). Journal of
Mammalogy, 93: 12-28.
ANDERSON, R.C. 2009. Do dragonflies migrate across the western Indian Ocean? Journal of Tropical
Ecology, 25: 347-358.
ARTYUSHIN, I.V., A.A. BANNIKOVA, V.S. LEBEDEV, and S.V. KRUSKOP. 2009. Mitochondrial DNA
relationships among North Palaeartic Eptesicus (Vespertilionidae, Chiroptera) and past
hybridization between Common Serotine and Northern Bat. Zootaxa, 2262: 40-52.
ASPETSBERGER, F., D. BRANDSEN, and D.S. JACOBS. 2003. Geographic variation in the morphology,
echolocation and diet of the little free-tailed bat, Chaerephon pumilus (Molossidae). African
Zoology, 38: 245-254.
BAKER, R.J. and R.D. BRADLEY. 2006. Speciation in mammals and the genetic species concept.
Journal of Mammalogy, 87: 643-662.
BERTHIER, P., L. EXCOFFIER, and M. RUEDI. 2006. Recurrent replacement of mtDNA and cryptic
hybridization between two sibling bat species Myotis myotis and Myotis blythii. Proceedings of the
Royal Society B: Biological Sciences, 273: 3101-3109.
BIRKY, C.W. JR. 2013. Species detection and identification in sexual organisms using population
genetic theory and DNA sequences. PLoS ONE, 8: e52544. doi: 10.1371/journal.pone.0052544.
BOHME, M. 2003. The Miocene climatic optimum: evidence from ectothermic vertebrates of central
Europe. Palaeogeography, Palaeoclimatology, Palaeoecology, 195: 389-401.
BRYANT, D., and V. MOULTON. 2004. Neighbor-Net: an agglomerative method for the construction
of phylogenetic networks. Molecular Biology and Evolution, 21: 255–265.
CLEMENT, M., D. POSADA, and K.A. CRANDALL. 2000. TCS: a computer program to estimate gene
genealogies. Molecular Ecology, 9: 1657-1660.
DIJKSTRA, K.D.B. 2007. Gone with the wind: westward dispersal across the Indian Ocean and island
speciation in Hemicordulina dragonflies (Ordonata: Corduliidae). Zootaxa, 1438: 27-48.
DRUMMOND, A.J., and A. RAMBAUT. 2007. BEAST v 1.5.4. BEAST: Bayesian evolutionary analysis
sampling trees, version 1.5.4.http://code.google.com/p/beast-mcmc/downloads/list.
228
EGER, J.L., and L. MITCHELL. 2003. Chiroptera. Pp. 1709, in: The natural History of Madagascar,
(S.M. Goodman and J.P. Benstead, eds.). The University Chicago Press, Chicago.
EXCOFFIER, L., P.E. SMOUSE, and J.M. QUATTRO. 1992. Analysis of molecular variance inferred from
metric distances among DNA haplotypes: application to human mitochondrial DNA restriction
data. Genetics, 131: 479-491.
EXCOFFIER, L., G. LAVAL, and S. SCHNEIDER. 2005. Arlequin version 3.0: An integrated software
package for population genetic analysis. Evolutionary Bioinformatics Online, 1: 47-50.
FENTON, M. B., D.S. JACOBS, E.R. RICHARDSON, P.J. TAYLOR, and W. WHITE. 2004. Individual
signatures in the frequency modulated sweep calls of African large-eared free-tailed bats (Otomops
martiensseni) (Chiroptera: Molossidae). Journal of Zoology, 262:11-19.
FREEMAN, P.W. 1981. A multivariate study of the family Molossidae (Mammalia: Chiroptera)
morphology, ecology, evolution. Fieldiana: Zoology (N.S.), 7: 1-173.
GOODMAN, S.M., and S.G. CARDIFF. 2004. A new species of Chaerephon (Molossidae) from
Madagascar with notes on other members of the family. Acta Chiropterologica, 6: 227-248.
GOODMAN, S.M., W. BUCCAS, T. NAIDOO, F. RATRIMOMANARIVO, P.J. TAYLOR, and J.M. LAMB.
2010. Patterns of morphological and genetic variation in western Indian Ocean members of the
Chaerephon ‘pumilus’ complex (Chiroptera: Molossidae), with the description of a new species
from Madagascar. Zootaxa, 2551: 1-36.
GOODMAN, S.M., C.P. MAMINIRINA, N. WEYENETH, H.M. BRADMAN, L. CHRISTIDIS, M. RUEDI, and
B. APPLETON. 2009. The use of molecular and morphological characters to resolve the taxonomic
identity of cryptic species: the case of Miniopterus manavi (Chiroptera, Miniopteridae). Zoologica
Scripta, 38: 339-363.
HALL, T.A. 1999. BioEdit: a user-friendly biological sequence alignment editor and analysis program
for Windows 95/98/NT. Nucleic Acids Symposium Series, 41: 95-98.
HASEGAWA, M., H. KISHINO, and T. YANO. 1985. Dating the human-ape splitting by a molecular
clock of mitochondrial DNA. Journal of Molecular Evolution, 22: 160-174.
HAYMAN, R.W., and J.E. HILL. 1971. Order Chiroptera. Pp 63-64, in: The mammals of Africa - An
identification manual. (J. Meester and H.W. Setzer, eds.). Smithsonian Institution Press,
Washington, D.C.
HUSON, D.H. 1998. SplitsTree: a program for analyzing and visualizing evolutionary data.
Bioinformatics, 14: 68–73.
HUSON, D.H. and D, BRYANT.2006. Application of phylogenetic networks in evolutionary studies.
Molecular Biology and Evolution, 23: 254–267.
IRWIN, D.E., J.H. IRWIN, and T.D. PRICE. 2001. Ring species as bridges between microevolution and
speciation. Genetica, 112-113: 223-243.
JACOBS, D.S., G.N. EICK, E.J. RICHARDSON, and P.J. TAYLOR. 2004. Genetic similarity amongst
phenotypically diverse little free-tailed bats, Chaerephon pumilus. Acta Chiropterologica, 6:13-21.
229
KINGMAN, J. 1982. The coalescent. Stochastic Processes and Their Applications, 13: 235-248.
KOOPMAN, K.F. 1965. Status of forms described or recorded by J. A. Allen in ‘The American
Museum Congo Expedition Collection of Bats’. American Museum Novitates, 2219: 1–34.
KOOPMAN, K.F. 1993. Order Chiroptera. Pp., x in: Mammalian species of the world: a taxonomic and
geographic reference (D.E. Wilson and D.M. Reeder, eds.). Smithsonian Institution Press,
Washington, D.C.
LACK, D., 1947. Darwin’s finches. Cambridge University Press, Cambridge.
LAMB, J.M., T.M.C. RALPH, T. NAIDOO, P.J. TAYLOR, F. RATRIMOMANARIVO, W.T. STANLEY, and
S.M. GOODMAN. 2011. Toward a molecular phylogeny for the Molossidae (Chiroptera) of the
Afro-Malagasy region. Acta Chiropterologica, 13: 1-16.
LAMB, J.M., T. NAIDOO, P.J. TAYLOR, M. NAPIER, F. RATRIMOMANARIVO, and S.M. GOODMAN.
2012. Genetically and geographically isolated lineages of a tropical bat (Chiroptera: Molossidae)
show demographic stability over the late Pleistocene. Biological Journal of the Linnean Society,
106: 18-40.
LEGENDRE, S. 1984. Etude odontologique des représentants actuels du groupe Tadarida, (Chiroptera:
Molossidae). Implications phylogénétiques, systématiques et zoogéographiques. Revue Suisse de
Zoologie, 91: 399-442.
LIBRADO, P., and J. ROZAS. 2009. Dnasp v5: a software for comprehensive analysis of DNA
polymorphism data. Bioinformatics, 25: 1451-1452.
MAYR, E. 1942. Systematics and the origin of species. Dover Publications, New York.
MAYER, F., and O. VON HELVERSEN.2001. Cryptic diversity in European bats. Proceedings of the
Royal Society B: Biological Sciences, 268: 1825-1832.
MEESTER, J.A.J., I.L. RAUTENBACH, N.J. DIPPENAAR, and C.M. BAKER. 1986. Classification of
Southern African Mammals (Monograph No. 5). Transvaal Museum.
MEESTER, J., and H.W. SETZER. 1971. The mammals of Africa: an identification manual. Smithsonian
Institution Press, Washington, D.C.
MONADJEM, A., P.J. TAYLOR, F.P.D. COTTERILL, and M.C. SCHOEMAN. 2010. Bats of southern and
central Africa: a biogeographic and taxonomic synthesis. Wits University Press, South Africa.
NAIDOO, T., M.C. SCHOEMAN, P.J. TAYLOR, S.M. GOODMAN, and J.M. LAMB. 2013. Stable
Pleistocene-era populations of Chaerephon pumilus (Chiroptera: Molossidae) in south eastern
Africa do not use different echolocation calls. African Zoology, 48: 125-142.
PEAKALL, R., and P.E. SMOUSE. 2006. GENALEX 6: genetic analysis in excel. Population genetic
software for teaching and research. Molecular Ecology Notes, 6: 288-295.
PETERSON, R.L., J.L. EGER, and L. MITCHELL. 1995. Chiroptères. Volume 84. Faune de Madagascar.
Muséum National d’Histoire Naturelle, Paris. 204 pp.
POSADA, D. 2008.jModelTest: phylogenetic model averaging. Molecular Biology and Evolution, 25:
1253-1256.
230
RATRIMOMANARIVO, F. H., J. VIVIAN, S.M. GOODMAN, and J. LAMB. 2007. Morphological and
molecular assessment of the specific status of Mops midas (Chiroptera: Molossidae) from
Madagascar and Africa. African Zoology, 42: 237-253.
RATRIMOMANARIVO, F.H., S.M. GOODMAN, W.T. STANLEY, T. NAIDOO, P.J. TAYLOR, and J. LAMB.
2009. Patterns of geographic and phylogeographic variation in Chaerephon leucogaster
(Chiroptera: Molossidae) of Madagascar and the western Indian Ocean islands of Mayotte and
Pemba. Acta Chiropterologica, 11: 25-52.
RONQUIST, F., and J.P. HUELSENBECK. 2001. MRBAYES: A Bayesian inference of phylogeny.
Bioinformatics, 17: 754-755.
ROSEVEAR, D.R. 1965. The bats of West Africa. British Museum (Natural History), London.
RUSSELL, A.L., J. RANIVO, E.P. PALKOVACS, S.M. GOODMAN, and A.D. YODER. 2007. Working at
the interface of phylogenetics and population genetics: a biogeographical analysis of Triaenops
spp. (Chiroptera: Hipposideridae). Molecular Ecology, 16: 839-851.
SCHOEMAN, M.C. and D.S. JACOBS. 2008. The relative influence of competition and prey
defences on the phenotypic structure of insectivorous bat ensembles in southern Africa. PLoS
ONE, 3: e3715
SCHOEMAN, M.C. and K.J. WADDINGTON. 2011. Do deterministic processes influence the
phenotypic patterns of animalivorous bat ensembles at urban rivers? African Zoology, 46: 288–
301.
SIMMONS, N.B. 2005. Order Chiroptera. Pp.434-435, in: Mammal species of the world: A taxonomic
and geographic reference, 3rd edition. (D.E. Wilson and D.M. Reeder, eds.).The John Hopkins
University Press, Baltimore.
SWOFFORD, D.L. 2002. PAUP*: phylogenetic analysis using parsimony (*and other methods), version
4.0b10. Sinauer Associates, Sunderland.
TAYLOR, P. J. 1999. Echolocation calls of twenty southern African bat species. South African
Journal of Zoology, 33: 114-124.
TAYLOR, P.J., J. LAMB, D. REDDY, T. NAIDOO, F. RATRIMOMANARIVO, E. RICHARDSON, and S.M.
GOODMAN. 2009. Cryptic lineages of little free-tailed bats, Chaerephon pumilus (Chiroptera:
Molossidae) from southern Africa and the western Indian Ocean islands. African Zoology, 44: 55-
70.
TAYLOR, P.J., S.M. GOODMAN, M.C. SCHOEMAN, F.J. RATRIMOMANARIVO, and J.M. LAMB. 2012.
Wing loading correlates negatively with genetic structuring in eight species of Afro-Malagasy bats
(Molossidae). Acta Chiropterologica, 14: 53-62.
THOMPSON, J.D., T.J. GIBSON, F. PLEWNIAK, F. JEANMOUGIN, and D.G. HIGGINS. 1997. The Clustal
X windows interface: flexible strategies for multiple sequence alignment aided by quality analysis
tools. Nucleic Acids Research, 24: 4876-4882.
231
VALLO, P., P. BENDA, J. CERVENY, and P. KOUBEK. 2012. Conflicting mitochondrial and nuclear
paraphyly in small-sized west African house bats (Vespertilionidae). Zoologica Scripta,
doi:10.1111/j.1463-6409.2012.00563.x.
WEYENETH, N., S.M. GOODMAN., B. APPLETON., R. WOODS, and M. RUEDI. 2011. Wings or winds:
inferring bat migration in a stepping-stone archipelago. Journal of Evolutionary Biology,
doi:10.1111/j.1420-9101.2011.02262.x
WEYENETH, N., S.M. GOODMAN, W.T. STANLEY, and M. RUEDI. 2008. The biogeography of
Miniopterus bats (Chiroptera: Miniopteridae) from the Comoro Archipelago inferred from
mitochondrial DNA. Molecular Ecology, 17: 5205-5219.
ZACHOS, F.E., M. APOLLONIO, E. V. BARMANN, M. FESTA-BIANCHET, U. GOHLICH,J. C. HABEL, E.
HARING, L. KRUCKENHAUSER, S. LOVARI, A. D. MCDEVITT, C. PERTOLDI, G. E. ROSSNER, M. R.
SANCHEZ-VILLAGRA, M. SCANDURA, and F. SUCHENTRUNK. 2013. Species inflation and
taxonomic artefacts - A critical comment on recent trends inmammalian classification. Mammalian
Biology, 78: 1-6.
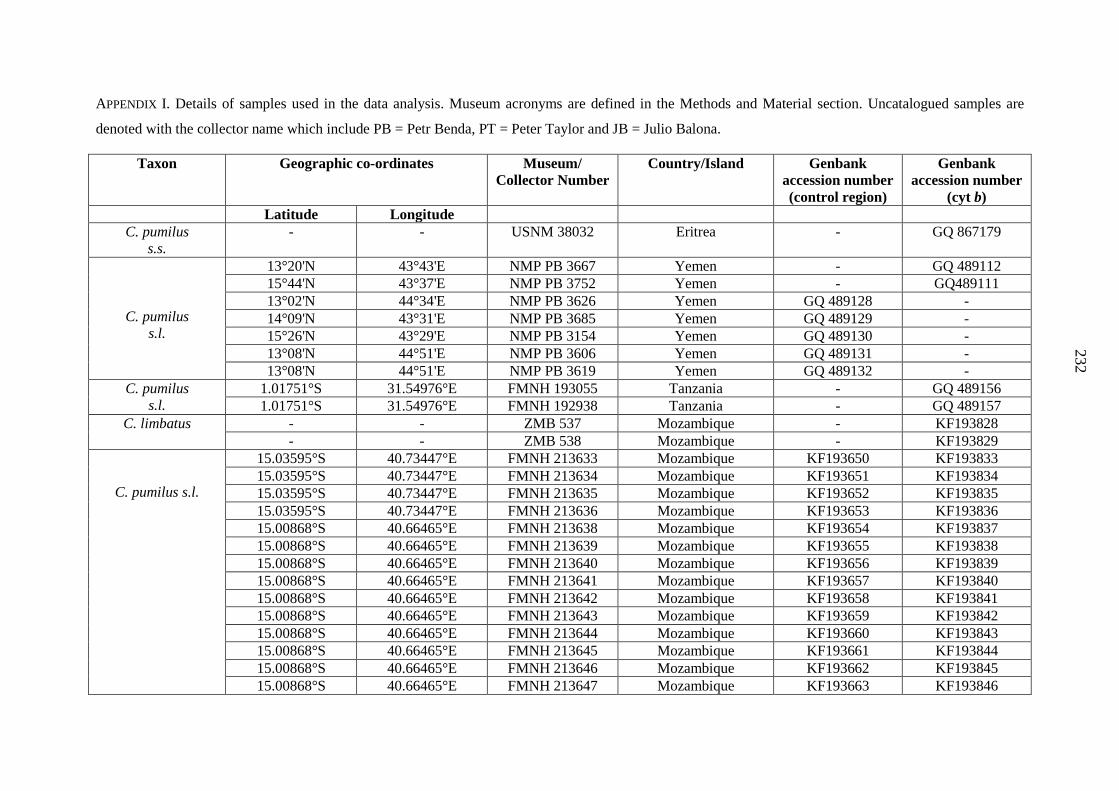
232
APPENDIX I. Details of samples used in the data analysis. Museum acronyms are defined in the Methods and Material section. Uncatalogued samples are
denoted with the collector name which include PB = Petr Benda, PT = Peter Taylor and JB = Julio Balona.
Taxon Geographic co-ordinates Museum/ Collector Number
Country/Island Genbank accession number (control region)
Genbank accession number
(cyt b) Latitude Longitude
C. pumilus s.s.
- - USNM 38032 Eritrea - GQ 867179
C. pumilus s.l.
13°20'N 43°43'E NMP PB 3667 Yemen - GQ 489112 15°44'N 43°37'E NMP PB 3752 Yemen - GQ489111 13°02'N 44°34'E NMP PB 3626 Yemen GQ 489128 - 14°09'N 43°31'E NMP PB 3685 Yemen GQ 489129 - 15°26'N 43°29'E NMP PB 3154 Yemen GQ 489130 - 13°08'N 44°51'E NMP PB 3606 Yemen GQ 489131 - 13°08'N 44°51'E NMP PB 3619 Yemen GQ 489132 -
C. pumilus s.l.
1.01751°S 31.54976°E FMNH 193055 Tanzania - GQ 489156 1.01751°S 31.54976°E FMNH 192938 Tanzania - GQ 489157
C. limbatus - - ZMB 537 Mozambique - KF193828 - - ZMB 538 Mozambique - KF193829
C. pumilus s.l.
15.03595°S 40.73447°E FMNH 213633 Mozambique KF193650 KF193833 15.03595°S 40.73447°E FMNH 213634 Mozambique KF193651 KF193834 15.03595°S 40.73447°E FMNH 213635 Mozambique KF193652 KF193835 15.03595°S 40.73447°E FMNH 213636 Mozambique KF193653 KF193836 15.00868°S 40.66465°E FMNH 213638 Mozambique KF193654 KF193837 15.00868°S 40.66465°E FMNH 213639 Mozambique KF193655 KF193838 15.00868°S 40.66465°E FMNH 213640 Mozambique KF193656 KF193839 15.00868°S 40.66465°E FMNH 213641 Mozambique KF193657 KF193840 15.00868°S 40.66465°E FMNH 213642 Mozambique KF193658 KF193841 15.00868°S 40.66465°E FMNH 213643 Mozambique KF193659 KF193842 15.00868°S 40.66465°E FMNH 213644 Mozambique KF193660 KF193843 15.00868°S 40.66465°E FMNH 213645 Mozambique KF193661 KF193844 15.00868°S 40.66465°E FMNH 213646 Mozambique KF193662 KF193845 15.00868°S 40.66465°E FMNH 213647 Mozambique KF193663 KF193846
232
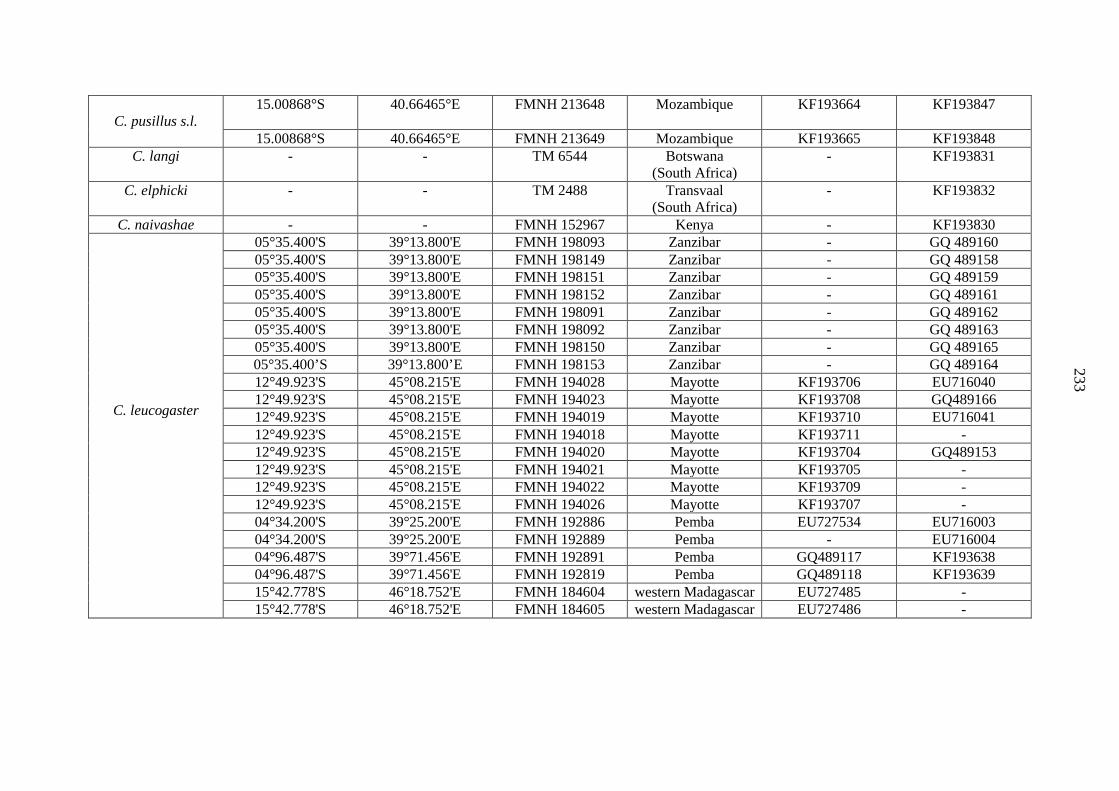
233
C. pusillus s.l.
15.00868°S 40.66465°E FMNH 213648
Mozambique KF193664 KF193847
15.00868°S 40.66465°E FMNH 213649 Mozambique KF193665 KF193848 C. langi - - TM 6544 Botswana
(South Africa) - KF193831
C. elphicki - - TM 2488 Transvaal (South Africa)
- KF193832
C. naivashae - - FMNH 152967 Kenya - KF193830
C. leucogaster
05°35.400'S 39°13.800'E FMNH 198093 Zanzibar - GQ 489160 05°35.400'S 39°13.800'E FMNH 198149 Zanzibar - GQ 489158 05°35.400'S 39°13.800'E FMNH 198151 Zanzibar - GQ 489159 05°35.400'S 39°13.800'E FMNH 198152 Zanzibar - GQ 489161 05°35.400'S 39°13.800'E FMNH 198091 Zanzibar - GQ 489162 05°35.400'S 39°13.800'E FMNH 198092 Zanzibar - GQ 489163 05°35.400'S 39°13.800'E FMNH 198150 Zanzibar - GQ 489165 05°35.400’S 39°13.800’E FMNH 198153 Zanzibar - GQ 489164 12°49.923'S 45°08.215'E FMNH 194028 Mayotte KF193706 EU716040 12°49.923'S 45°08.215'E FMNH 194023 Mayotte KF193708 GQ489166 12°49.923'S 45°08.215'E FMNH 194019 Mayotte KF193710 EU716041 12°49.923'S 45°08.215'E FMNH 194018 Mayotte KF193711 - 12°49.923'S 45°08.215'E FMNH 194020 Mayotte KF193704 GQ489153 12°49.923'S 45°08.215'E FMNH 194021 Mayotte KF193705 - 12°49.923'S 45°08.215'E FMNH 194022 Mayotte KF193709 - 12°49.923'S 45°08.215'E FMNH 194026 Mayotte KF193707 - 04°34.200'S 39°25.200'E FMNH 192886 Pemba EU727534 EU716003 04°34.200'S 39°25.200'E FMNH 192889 Pemba - EU716004 04°96.487'S 39°71.456'E FMNH 192891 Pemba GQ489117 KF193638 04°96.487'S 39°71.456'E FMNH 192819 Pemba GQ489118 KF193639
15°42.778'S 46°18.752'E FMNH 184604 western Madagascar EU727485 - 15°42.778'S 46°18.752'E FMNH 184605 western Madagascar EU727486 -
233
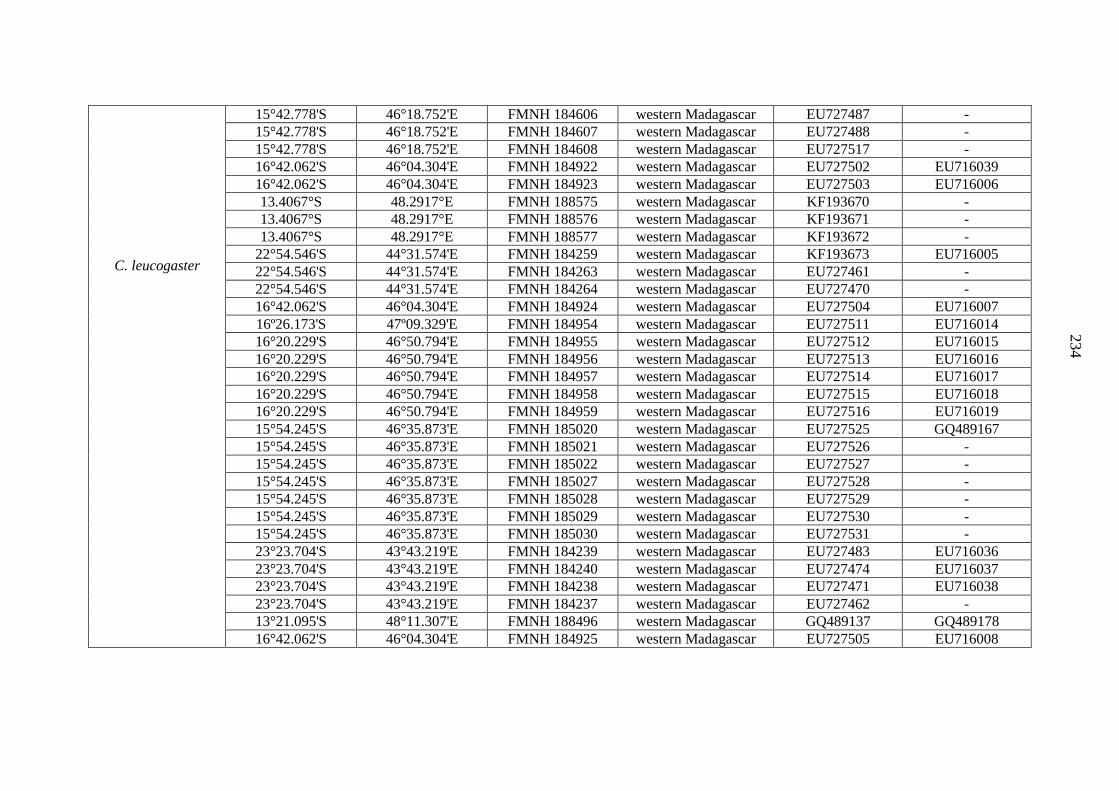
234
C. leucogaster
15°42.778'S 46°18.752'E FMNH 184606 western Madagascar EU727487 - 15°42.778'S 46°18.752'E FMNH 184607 western Madagascar EU727488 - 15°42.778'S 46°18.752'E FMNH 184608 western Madagascar EU727517 - 16°42.062'S 46°04.304'E FMNH 184922 western Madagascar EU727502 EU716039 16°42.062'S 46°04.304'E FMNH 184923 western Madagascar EU727503 EU716006 13.4067°S 48.2917°E FMNH 188575 western Madagascar KF193670 - 13.4067°S 48.2917°E FMNH 188576 western Madagascar KF193671 - 13.4067°S 48.2917°E FMNH 188577 western Madagascar KF193672 -
22°54.546'S 44°31.574'E FMNH 184259 western Madagascar KF193673 EU716005 22°54.546'S 44°31.574'E FMNH 184263 western Madagascar EU727461 - 22°54.546'S 44°31.574'E FMNH 184264 western Madagascar EU727470 - 16°42.062'S 46°04.304'E FMNH 184924 western Madagascar EU727504 EU716007 16º26.173'S 47º09.329'E FMNH 184954 western Madagascar EU727511 EU716014 16°20.229'S 46°50.794'E FMNH 184955 western Madagascar EU727512 EU716015 16°20.229'S 46°50.794'E FMNH 184956 western Madagascar EU727513 EU716016 16°20.229'S 46°50.794'E FMNH 184957 western Madagascar EU727514 EU716017 16°20.229'S 46°50.794'E FMNH 184958 western Madagascar EU727515 EU716018 16°20.229'S 46°50.794'E FMNH 184959 western Madagascar EU727516 EU716019 15°54.245'S 46°35.873'E FMNH 185020 western Madagascar EU727525 GQ489167 15°54.245'S 46°35.873'E FMNH 185021 western Madagascar EU727526 - 15°54.245'S 46°35.873'E FMNH 185022 western Madagascar EU727527 - 15°54.245'S 46°35.873'E FMNH 185027 western Madagascar EU727528 - 15°54.245'S 46°35.873'E FMNH 185028 western Madagascar EU727529 - 15°54.245'S 46°35.873'E FMNH 185029 western Madagascar EU727530 - 15°54.245'S 46°35.873'E FMNH 185030 western Madagascar EU727531 - 23°23.704'S 43°43.219'E FMNH 184239 western Madagascar EU727483 EU716036 23°23.704'S 43°43.219'E FMNH 184240 western Madagascar EU727474 EU716037 23°23.704'S 43°43.219'E FMNH 184238 western Madagascar EU727471 EU716038 23°23.704'S 43°43.219'E FMNH 184237 western Madagascar EU727462 - 13°21.095'S 48°11.307'E FMNH 188496 western Madagascar GQ489137 GQ489178 16°42.062'S 46°04.304'E FMNH 184925 western Madagascar EU727505 EU716008
234
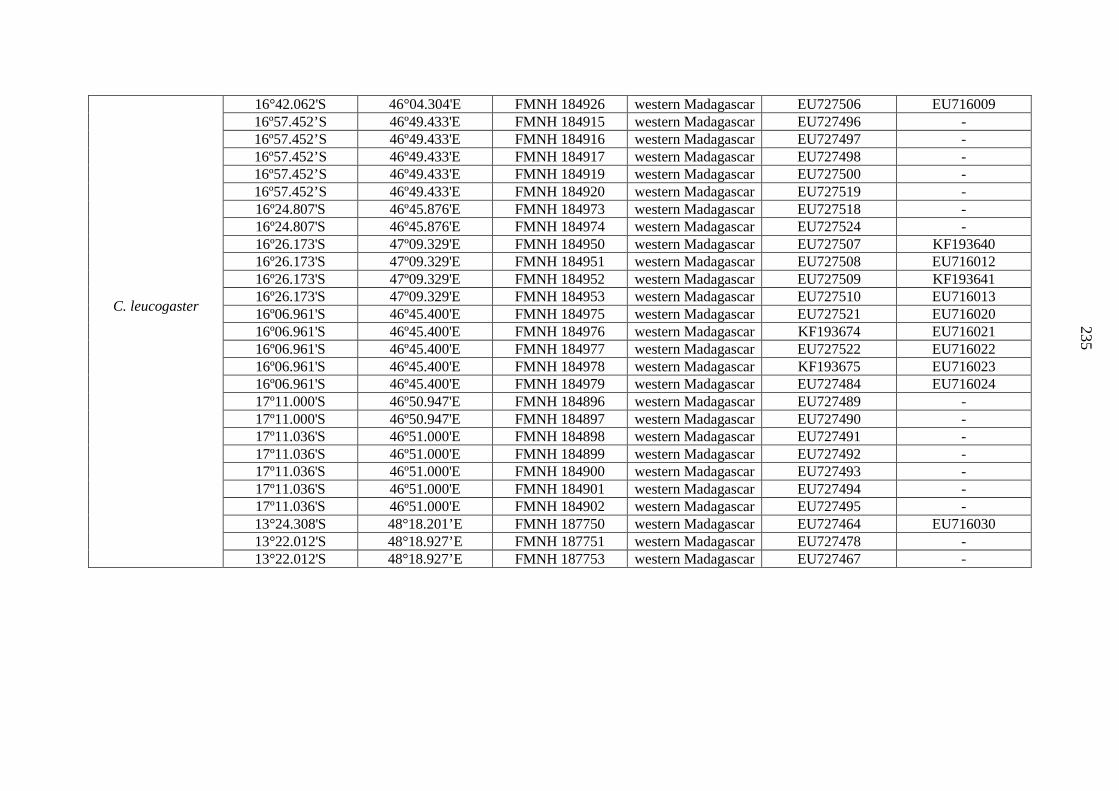
235
C. leucogaster
16°42.062'S 46°04.304'E FMNH 184926 western Madagascar EU727506 EU716009 16º57.452’S 46º49.433'E FMNH 184915 western Madagascar EU727496 - 16º57.452’S 46º49.433'E FMNH 184916 western Madagascar EU727497 - 16º57.452’S 46º49.433'E FMNH 184917 western Madagascar EU727498 - 16º57.452’S 46º49.433'E FMNH 184919 western Madagascar EU727500 - 16º57.452’S 46º49.433'E FMNH 184920 western Madagascar EU727519 - 16º24.807'S 46º45.876'E FMNH 184973 western Madagascar EU727518 - 16º24.807'S 46º45.876'E FMNH 184974 western Madagascar EU727524 - 16º26.173'S 47º09.329'E FMNH 184950 western Madagascar EU727507 KF193640 16º26.173'S 47º09.329'E FMNH 184951 western Madagascar EU727508 EU716012 16º26.173'S 47º09.329'E FMNH 184952 western Madagascar EU727509 KF193641 16º26.173'S 47º09.329'E FMNH 184953 western Madagascar EU727510 EU716013 16º06.961'S 46º45.400'E FMNH 184975 western Madagascar EU727521 EU716020 16º06.961'S 46º45.400'E FMNH 184976 western Madagascar KF193674 EU716021 16º06.961'S 46º45.400'E FMNH 184977 western Madagascar EU727522 EU716022 16º06.961'S 46º45.400'E FMNH 184978 western Madagascar KF193675 EU716023 16º06.961'S 46º45.400'E FMNH 184979 western Madagascar EU727484 EU716024 17º11.000'S 46º50.947'E FMNH 184896 western Madagascar EU727489 - 17º11.000'S 46º50.947'E FMNH 184897 western Madagascar EU727490 - 17º11.036'S 46º51.000'E FMNH 184898 western Madagascar EU727491 - 17º11.036'S 46º51.000'E FMNH 184899 western Madagascar EU727492 - 17º11.036'S 46º51.000'E FMNH 184900 western Madagascar EU727493 - 17º11.036'S 46º51.000'E FMNH 184901 western Madagascar EU727494 - 17º11.036'S 46º51.000'E FMNH 184902 western Madagascar EU727495 - 13°24.308'S 48°18.201’E FMNH 187750 western Madagascar EU727464 EU716030 13°22.012'S 48°18.927’E FMNH 187751 western Madagascar EU727478 - 13°22.012'S 48°18.927’E FMNH 187753 western Madagascar EU727467 -
235
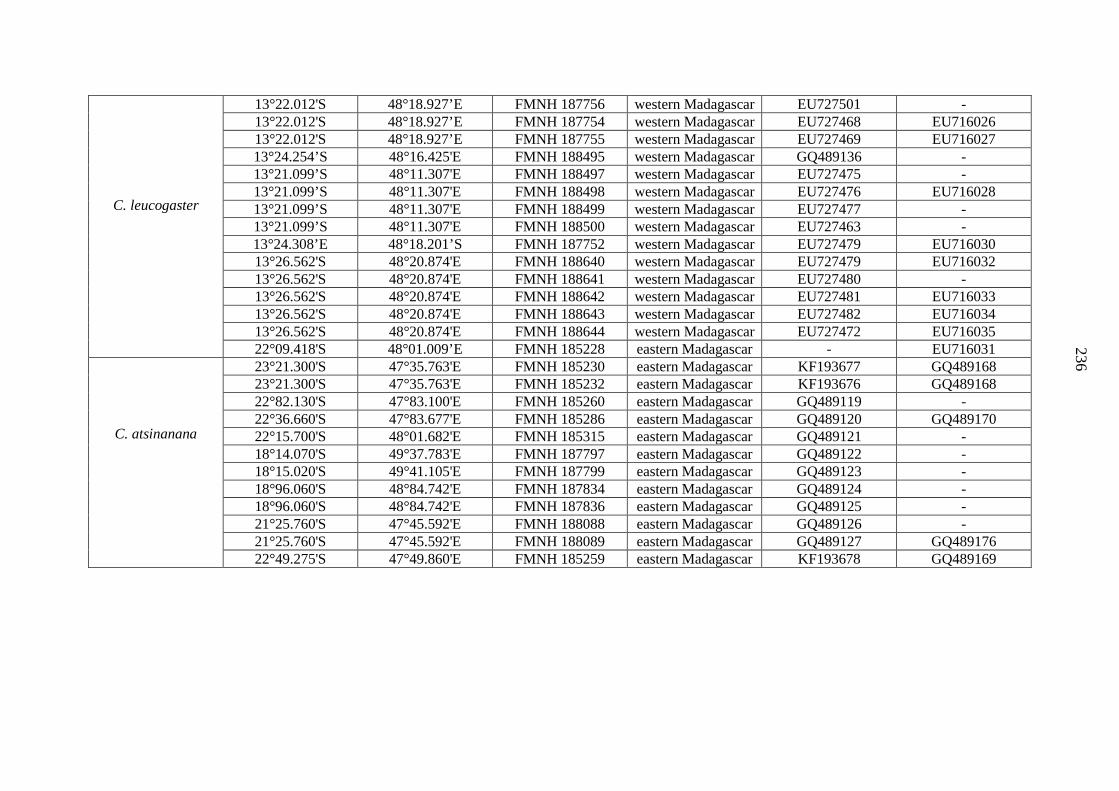
236
C. leucogaster
13°22.012'S 48°18.927’E FMNH 187756 western Madagascar EU727501 - 13°22.012'S 48°18.927’E FMNH 187754 western Madagascar EU727468 EU716026 13°22.012'S 48°18.927’E FMNH 187755 western Madagascar EU727469 EU716027 13°24.254’S 48°16.425'E FMNH 188495 western Madagascar GQ489136 - 13°21.099’S 48°11.307'E FMNH 188497 western Madagascar EU727475 - 13°21.099’S 48°11.307'E FMNH 188498 western Madagascar EU727476 EU716028 13°21.099’S 48°11.307'E FMNH 188499 western Madagascar EU727477 - 13°21.099’S 48°11.307'E FMNH 188500 western Madagascar EU727463 - 13°24.308’E 48°18.201’S FMNH 187752 western Madagascar EU727479 EU716030 13°26.562'S 48°20.874'E FMNH 188640 western Madagascar EU727479 EU716032 13°26.562'S 48°20.874'E FMNH 188641 western Madagascar EU727480 - 13°26.562'S 48°20.874'E FMNH 188642 western Madagascar EU727481 EU716033 13°26.562'S 48°20.874'E FMNH 188643 western Madagascar EU727482 EU716034 13°26.562'S 48°20.874'E FMNH 188644 western Madagascar EU727472 EU716035 22°09.418'S 48°01.009’E FMNH 185228 eastern Madagascar - EU716031
C. atsinanana
23°21.300'S 47°35.763'E FMNH 185230 eastern Madagascar KF193677 GQ489168 23°21.300'S 47°35.763'E FMNH 185232 eastern Madagascar KF193676 GQ489168 22°82.130'S 47°83.100'E FMNH 185260 eastern Madagascar GQ489119 - 22°36.660'S 47°83.677'E FMNH 185286 eastern Madagascar GQ489120 GQ489170 22°15.700'S 48°01.682'E FMNH 185315 eastern Madagascar GQ489121 - 18°14.070'S 49°37.783'E FMNH 187797 eastern Madagascar GQ489122 - 18°15.020'S 49°41.105'E FMNH 187799 eastern Madagascar GQ489123 - 18°96.060'S 48°84.742'E FMNH 187834 eastern Madagascar GQ489124 - 18°96.060'S 48°84.742'E FMNH 187836 eastern Madagascar GQ489125 - 21°25.760'S 47°45.592'E FMNH 188088 eastern Madagascar GQ489126 - 21°25.760'S 47°45.592'E FMNH 188089 eastern Madagascar GQ489127 GQ489176 22°49.275'S 47°49.860'E FMNH 185259 eastern Madagascar KF193678 GQ489169
236
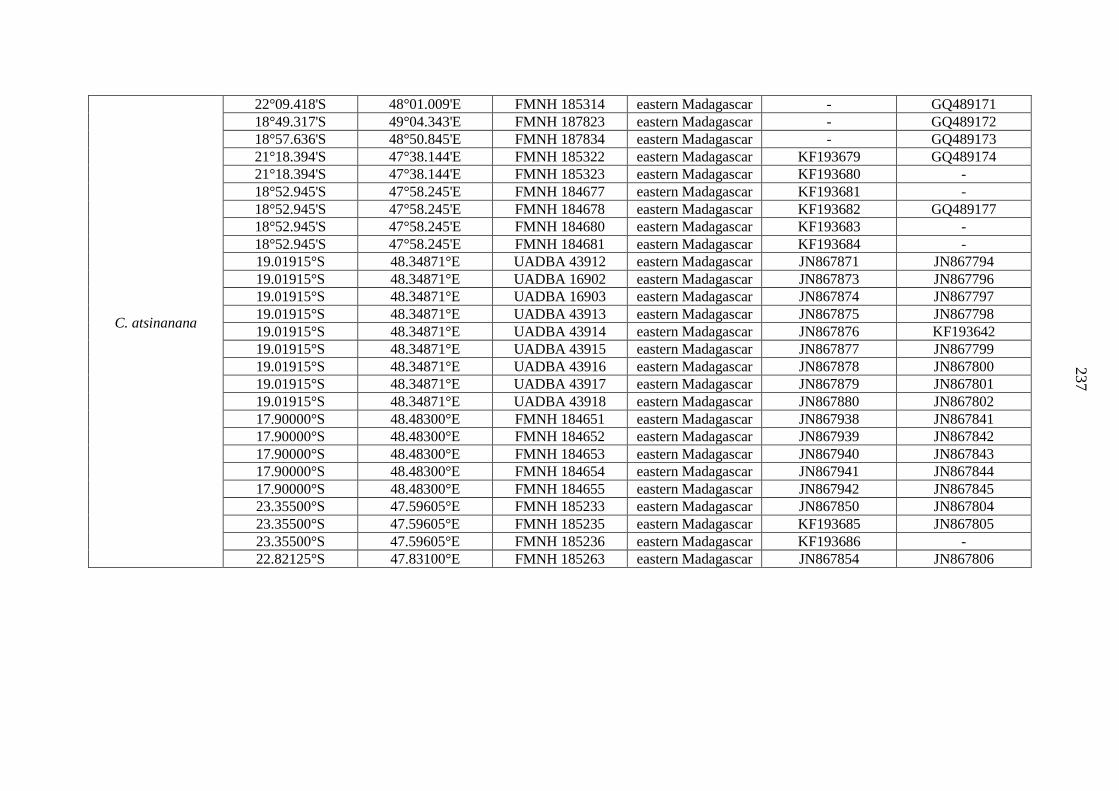
237
C. atsinanana
22°09.418'S 48°01.009'E FMNH 185314 eastern Madagascar - GQ489171 18°49.317'S 49°04.343'E FMNH 187823 eastern Madagascar - GQ489172 18°57.636'S 48°50.845'E FMNH 187834 eastern Madagascar - GQ489173 21°18.394'S 47°38.144'E FMNH 185322 eastern Madagascar KF193679 GQ489174 21°18.394'S 47°38.144'E FMNH 185323 eastern Madagascar KF193680 - 18°52.945'S 47°58.245'E FMNH 184677 eastern Madagascar KF193681 - 18°52.945'S 47°58.245'E FMNH 184678 eastern Madagascar KF193682 GQ489177 18°52.945'S 47°58.245'E FMNH 184680 eastern Madagascar KF193683 - 18°52.945'S 47°58.245'E FMNH 184681 eastern Madagascar KF193684 - 19.01915°S 48.34871°E UADBA 43912 eastern Madagascar JN867871 JN867794 19.01915°S 48.34871°E UADBA 16902 eastern Madagascar JN867873 JN867796 19.01915°S 48.34871°E UADBA 16903 eastern Madagascar JN867874 JN867797 19.01915°S 48.34871°E UADBA 43913 eastern Madagascar JN867875 JN867798 19.01915°S 48.34871°E UADBA 43914 eastern Madagascar JN867876 KF193642 19.01915°S 48.34871°E UADBA 43915 eastern Madagascar JN867877 JN867799 19.01915°S 48.34871°E UADBA 43916 eastern Madagascar JN867878 JN867800 19.01915°S 48.34871°E UADBA 43917 eastern Madagascar JN867879 JN867801 19.01915°S 48.34871°E UADBA 43918 eastern Madagascar JN867880 JN867802 17.90000°S 48.48300°E FMNH 184651 eastern Madagascar JN867938 JN867841 17.90000°S 48.48300°E FMNH 184652 eastern Madagascar JN867939 JN867842 17.90000°S 48.48300°E FMNH 184653 eastern Madagascar JN867940 JN867843 17.90000°S 48.48300°E FMNH 184654 eastern Madagascar JN867941 JN867844 17.90000°S 48.48300°E FMNH 184655 eastern Madagascar JN867942 JN867845 23.35500°S 47.59605°E FMNH 185233 eastern Madagascar JN867850 JN867804 23.35500°S 47.59605°E FMNH 185235 eastern Madagascar KF193685 JN867805 23.35500°S 47.59605°E FMNH 185236 eastern Madagascar KF193686 - 22.82125°S 47.83100°E FMNH 185263 eastern Madagascar JN867854 JN867806
237
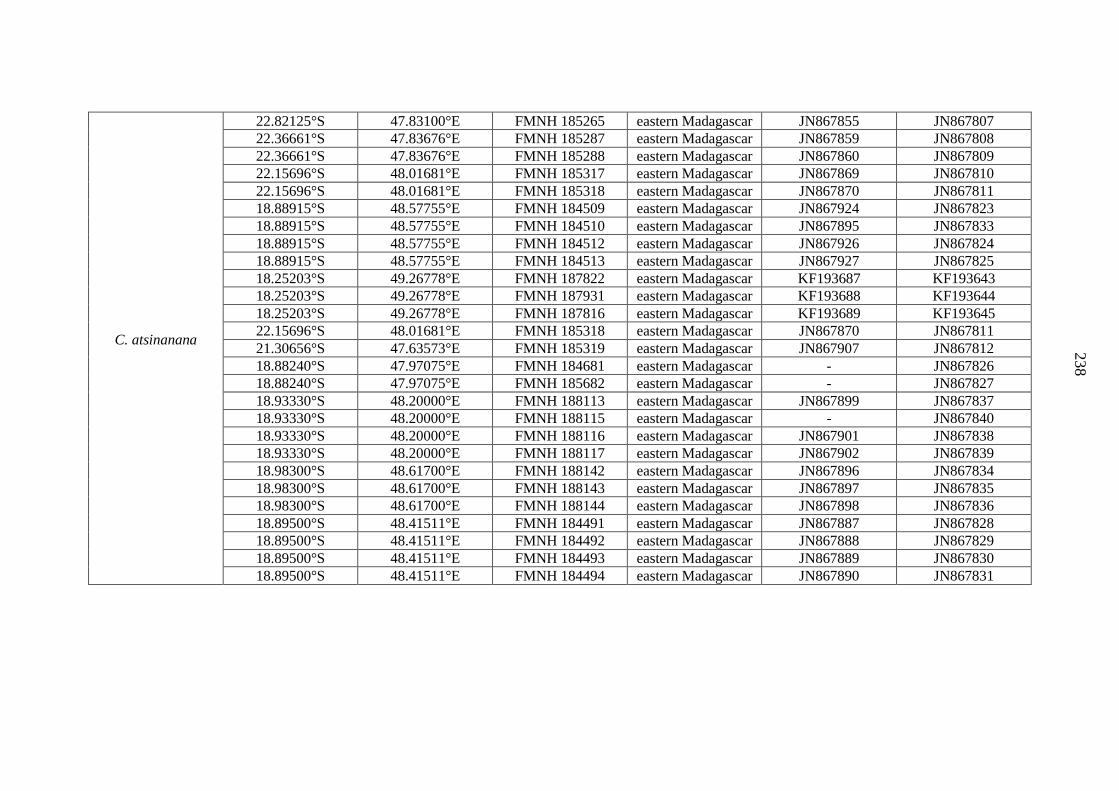
238
C. atsinanana
22.82125°S 47.83100°E FMNH 185265 eastern Madagascar JN867855 JN867807 22.36661°S 47.83676°E FMNH 185287 eastern Madagascar JN867859 JN867808 22.36661°S 47.83676°E FMNH 185288 eastern Madagascar JN867860 JN867809 22.15696°S 48.01681°E FMNH 185317 eastern Madagascar JN867869 JN867810 22.15696°S 48.01681°E FMNH 185318 eastern Madagascar JN867870 JN867811 18.88915°S 48.57755°E FMNH 184509 eastern Madagascar JN867924 JN867823 18.88915°S 48.57755°E FMNH 184510 eastern Madagascar JN867895 JN867833 18.88915°S 48.57755°E FMNH 184512 eastern Madagascar JN867926 JN867824 18.88915°S 48.57755°E FMNH 184513 eastern Madagascar JN867927 JN867825 18.25203°S 49.26778°E FMNH 187822 eastern Madagascar KF193687 KF193643 18.25203°S 49.26778°E FMNH 187931 eastern Madagascar KF193688 KF193644 18.25203°S 49.26778°E FMNH 187816 eastern Madagascar KF193689 KF193645 22.15696°S 48.01681°E FMNH 185318 eastern Madagascar JN867870 JN867811 21.30656°S 47.63573°E FMNH 185319 eastern Madagascar JN867907 JN867812 18.88240°S 47.97075°E FMNH 184681 eastern Madagascar - JN867826 18.88240°S 47.97075°E FMNH 185682 eastern Madagascar - JN867827 18.93330°S 48.20000°E FMNH 188113 eastern Madagascar JN867899 JN867837 18.93330°S 48.20000°E FMNH 188115 eastern Madagascar - JN867840 18.93330°S 48.20000°E FMNH 188116 eastern Madagascar JN867901 JN867838 18.93330°S 48.20000°E FMNH 188117 eastern Madagascar JN867902 JN867839 18.98300°S 48.61700°E FMNH 188142 eastern Madagascar JN867896 JN867834 18.98300°S 48.61700°E FMNH 188143 eastern Madagascar JN867897 JN867835 18.98300°S 48.61700°E FMNH 188144 eastern Madagascar JN867898 JN867836 18.89500°S 48.41511°E FMNH 184491 eastern Madagascar JN867887 JN867828 18.89500°S 48.41511°E FMNH 184492 eastern Madagascar JN867888 JN867829 18.89500°S 48.41511°E FMNH 184493 eastern Madagascar JN867889 JN867830 18.89500°S 48.41511°E FMNH 184494 eastern Madagascar JN867890 JN867831
238
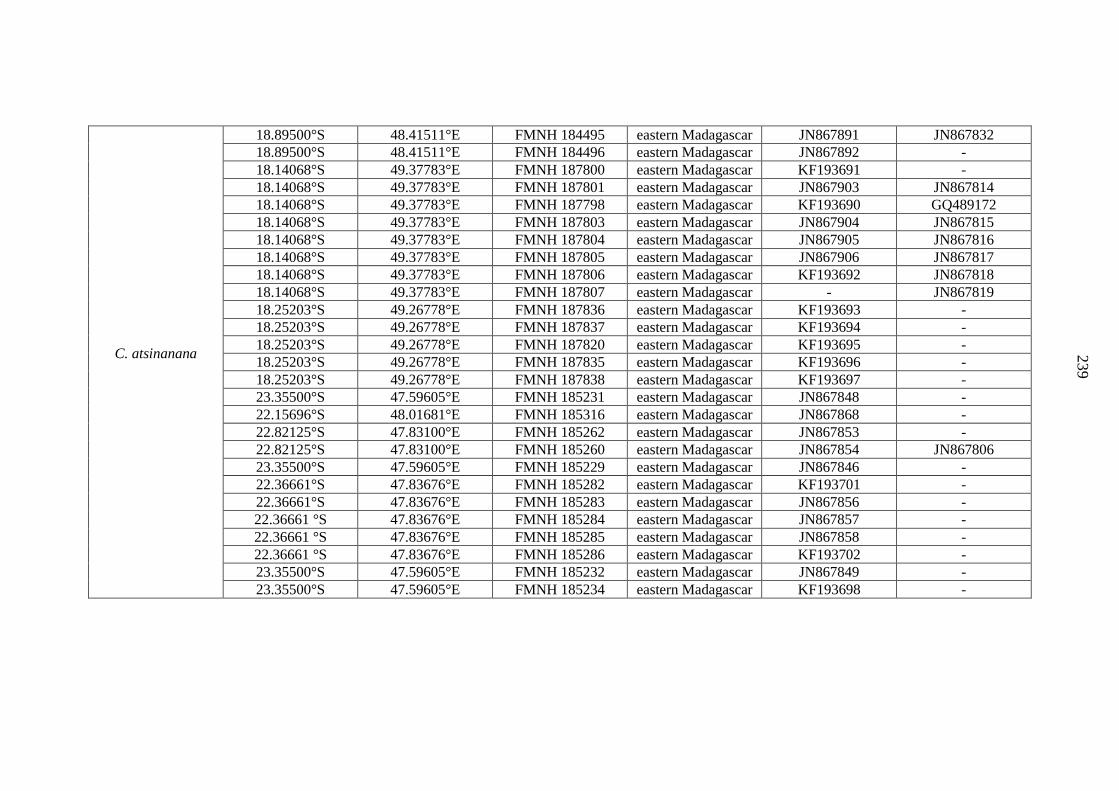
239
C. atsinanana
18.89500°S 48.41511°E FMNH 184495 eastern Madagascar JN867891 JN867832 18.89500°S 48.41511°E FMNH 184496 eastern Madagascar JN867892 - 18.14068°S 49.37783°E FMNH 187800 eastern Madagascar KF193691 - 18.14068°S 49.37783°E FMNH 187801 eastern Madagascar JN867903 JN867814 18.14068°S 49.37783°E FMNH 187798 eastern Madagascar KF193690 GQ489172 18.14068°S 49.37783°E FMNH 187803 eastern Madagascar JN867904 JN867815 18.14068°S 49.37783°E FMNH 187804 eastern Madagascar JN867905 JN867816 18.14068°S 49.37783°E FMNH 187805 eastern Madagascar JN867906 JN867817 18.14068°S 49.37783°E FMNH 187806 eastern Madagascar KF193692 JN867818 18.14068°S 49.37783°E FMNH 187807 eastern Madagascar - JN867819 18.25203°S 49.26778°E FMNH 187836 eastern Madagascar KF193693 - 18.25203°S 49.26778°E FMNH 187837 eastern Madagascar KF193694 - 18.25203°S 49.26778°E FMNH 187820 eastern Madagascar KF193695 - 18.25203°S 49.26778°E FMNH 187835 eastern Madagascar KF193696 - 18.25203°S 49.26778°E FMNH 187838 eastern Madagascar KF193697 - 23.35500°S 47.59605°E FMNH 185231 eastern Madagascar JN867848 - 22.15696°S 48.01681°E FMNH 185316 eastern Madagascar JN867868 - 22.82125°S 47.83100°E FMNH 185262 eastern Madagascar JN867853 - 22.82125°S 47.83100°E FMNH 185260 eastern Madagascar JN867854 JN867806 23.35500°S 47.59605°E FMNH 185229 eastern Madagascar JN867846 - 22.36661°S 47.83676°E FMNH 185282 eastern Madagascar KF193701 - 22.36661°S 47.83676°E FMNH 185283 eastern Madagascar JN867856 - 22.36661 °S 47.83676°E FMNH 185284 eastern Madagascar JN867857 - 22.36661 °S 47.83676°E FMNH 185285 eastern Madagascar JN867858 - 22.36661 °S 47.83676°E FMNH 185286 eastern Madagascar KF193702 - 23.35500°S 47.59605°E FMNH 185232 eastern Madagascar JN867849 - 23.35500°S 47.59605°E FMNH 185234 eastern Madagascar KF193698 -
239
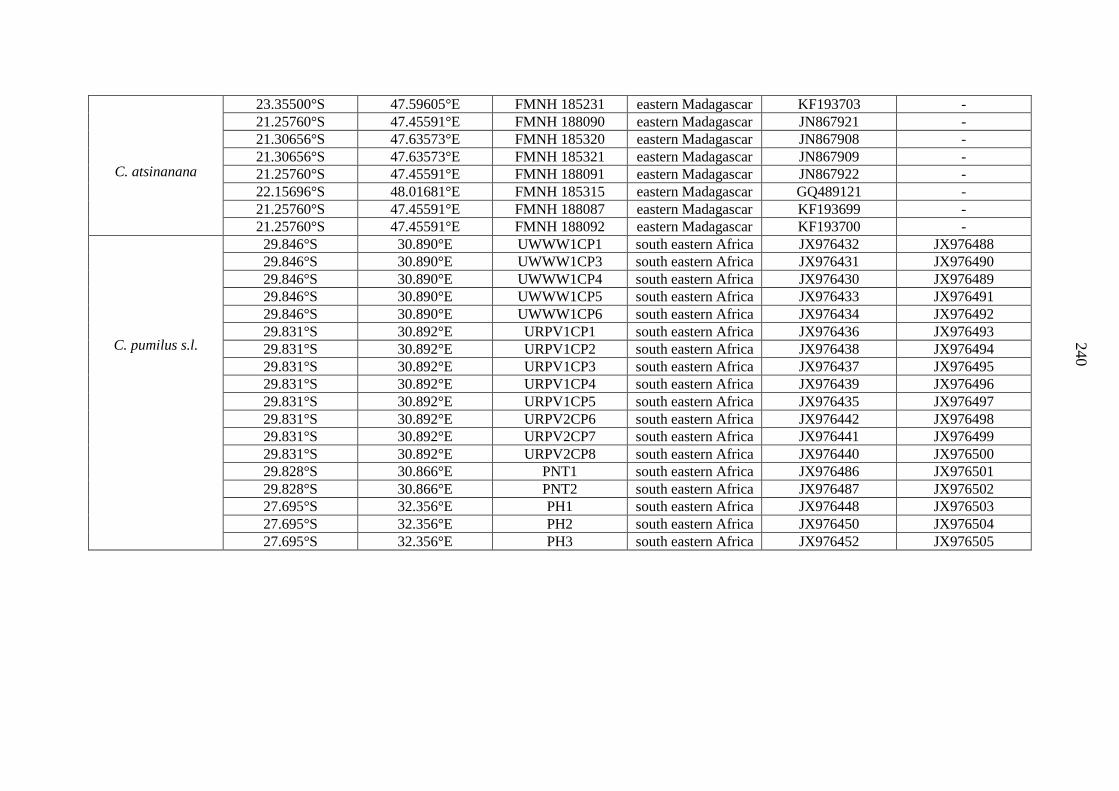
240
C. atsinanana
23.35500°S 47.59605°E FMNH 185231 eastern Madagascar KF193703 - 21.25760°S 47.45591°E FMNH 188090 eastern Madagascar JN867921 - 21.30656°S 47.63573°E FMNH 185320 eastern Madagascar JN867908 - 21.30656°S 47.63573°E FMNH 185321 eastern Madagascar JN867909 - 21.25760°S 47.45591°E FMNH 188091 eastern Madagascar JN867922 - 22.15696°S 48.01681°E FMNH 185315 eastern Madagascar GQ489121 - 21.25760°S 47.45591°E FMNH 188087 eastern Madagascar KF193699 - 21.25760°S 47.45591°E FMNH 188092 eastern Madagascar KF193700 -
C. pumilus s.l.
29.846°S 30.890°E UWWW1CP1 south eastern Africa JX976432 JX976488 29.846°S 30.890°E UWWW1CP3 south eastern Africa JX976431 JX976490 29.846°S 30.890°E UWWW1CP4 south eastern Africa JX976430 JX976489 29.846°S 30.890°E UWWW1CP5 south eastern Africa JX976433 JX976491 29.846°S 30.890°E UWWW1CP6 south eastern Africa JX976434 JX976492 29.831°S 30.892°E URPV1CP1 south eastern Africa JX976436 JX976493 29.831°S 30.892°E URPV1CP2 south eastern Africa JX976438 JX976494 29.831°S 30.892°E URPV1CP3 south eastern Africa JX976437 JX976495 29.831°S 30.892°E URPV1CP4 south eastern Africa JX976439 JX976496 29.831°S 30.892°E URPV1CP5 south eastern Africa JX976435 JX976497 29.831°S 30.892°E URPV2CP6 south eastern Africa JX976442 JX976498 29.831°S 30.892°E URPV2CP7 south eastern Africa JX976441 JX976499 29.831°S 30.892°E URPV2CP8 south eastern Africa JX976440 JX976500 29.828°S 30.866°E PNT1 south eastern Africa JX976486 JX976501 29.828°S 30.866°E PNT2 south eastern Africa JX976487 JX976502 27.695°S 32.356°E PH1 south eastern Africa JX976448 JX976503 27.695°S 32.356°E PH2 south eastern Africa JX976450 JX976504 27.695°S 32.356°E PH3 south eastern Africa JX976452 JX976505
240
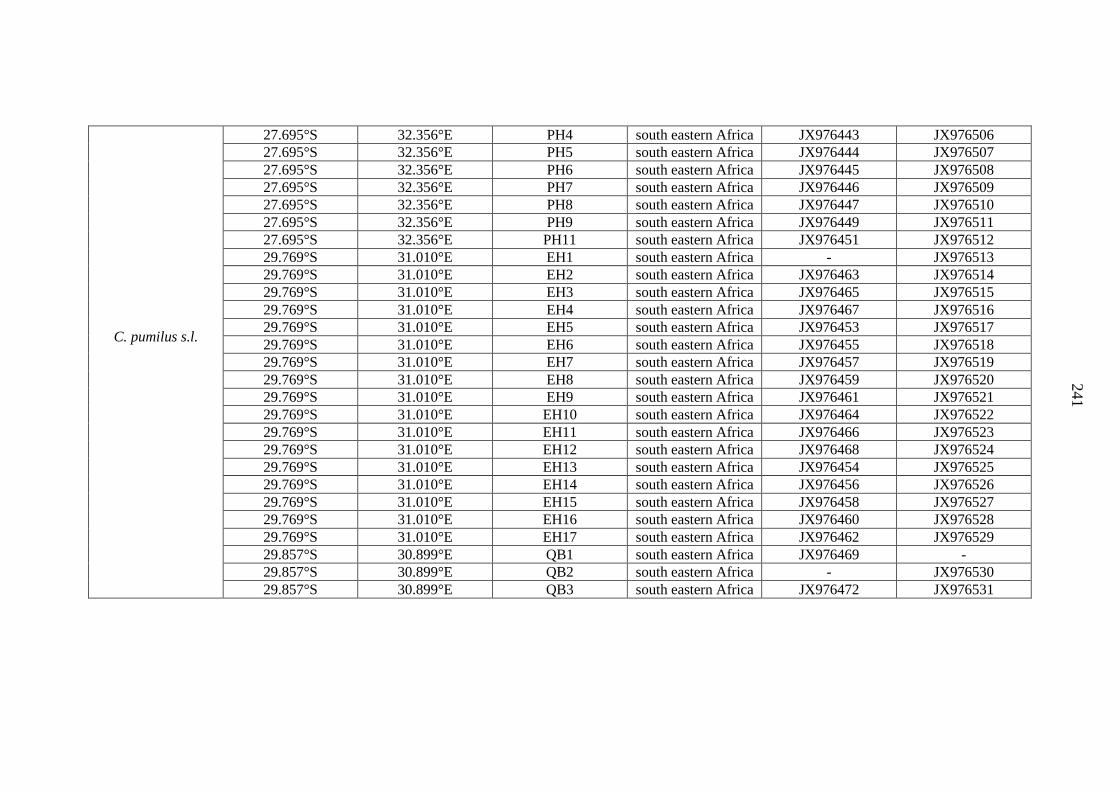
241
C. pumilus s.l.
27.695°S 32.356°E PH4 south eastern Africa JX976443 JX976506 27.695°S 32.356°E PH5 south eastern Africa JX976444 JX976507 27.695°S 32.356°E PH6 south eastern Africa JX976445 JX976508 27.695°S 32.356°E PH7 south eastern Africa JX976446 JX976509 27.695°S 32.356°E PH8 south eastern Africa JX976447 JX976510 27.695°S 32.356°E PH9 south eastern Africa JX976449 JX976511 27.695°S 32.356°E PH11 south eastern Africa JX976451 JX976512 29.769°S 31.010°E EH1 south eastern Africa - JX976513 29.769°S 31.010°E EH2 south eastern Africa JX976463 JX976514 29.769°S 31.010°E EH3 south eastern Africa JX976465 JX976515 29.769°S 31.010°E EH4 south eastern Africa JX976467 JX976516 29.769°S 31.010°E EH5 south eastern Africa JX976453 JX976517 29.769°S 31.010°E EH6 south eastern Africa JX976455 JX976518 29.769°S 31.010°E EH7 south eastern Africa JX976457 JX976519 29.769°S 31.010°E EH8 south eastern Africa JX976459 JX976520 29.769°S 31.010°E EH9 south eastern Africa JX976461 JX976521 29.769°S 31.010°E EH10 south eastern Africa JX976464 JX976522 29.769°S 31.010°E EH11 south eastern Africa JX976466 JX976523 29.769°S 31.010°E EH12 south eastern Africa JX976468 JX976524 29.769°S 31.010°E EH13 south eastern Africa JX976454 JX976525 29.769°S 31.010°E EH14 south eastern Africa JX976456 JX976526 29.769°S 31.010°E EH15 south eastern Africa JX976458 JX976527 29.769°S 31.010°E EH16 south eastern Africa JX976460 JX976528 29.769°S 31.010°E EH17 south eastern Africa JX976462 JX976529 29.857°S 30.899°E QB1 south eastern Africa JX976469 - 29.857°S 30.899°E QB2 south eastern Africa - JX976530 29.857°S 30.899°E QB3 south eastern Africa JX976472 JX976531
241
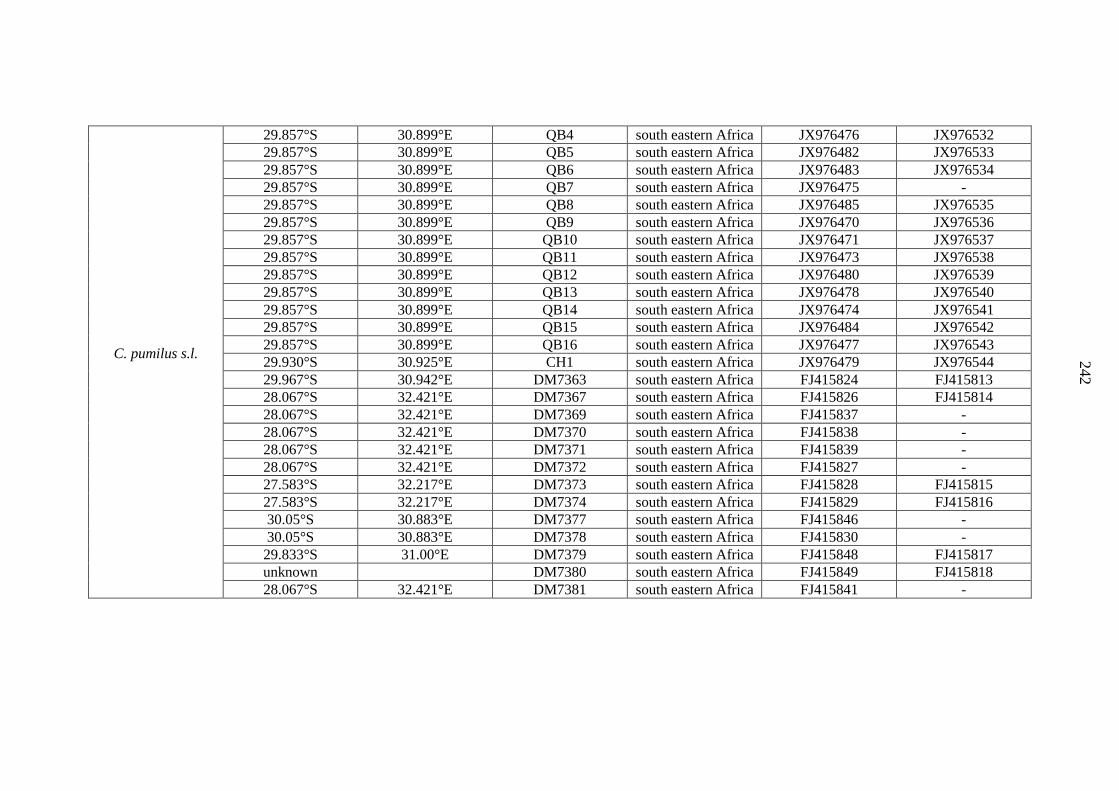
242
C. pumilus s.l.
29.857°S 30.899°E QB4 south eastern Africa JX976476 JX976532 29.857°S 30.899°E QB5 south eastern Africa JX976482 JX976533 29.857°S 30.899°E QB6 south eastern Africa JX976483 JX976534 29.857°S 30.899°E QB7 south eastern Africa JX976475 - 29.857°S 30.899°E QB8 south eastern Africa JX976485 JX976535 29.857°S 30.899°E QB9 south eastern Africa JX976470 JX976536 29.857°S 30.899°E QB10 south eastern Africa JX976471 JX976537 29.857°S 30.899°E QB11 south eastern Africa JX976473 JX976538 29.857°S 30.899°E QB12 south eastern Africa JX976480 JX976539 29.857°S 30.899°E QB13 south eastern Africa JX976478 JX976540 29.857°S 30.899°E QB14 south eastern Africa JX976474 JX976541 29.857°S 30.899°E QB15 south eastern Africa JX976484 JX976542 29.857°S 30.899°E QB16 south eastern Africa JX976477 JX976543 29.930°S 30.925°E CH1 south eastern Africa JX976479 JX976544 29.967°S 30.942°E DM7363 south eastern Africa FJ415824 FJ415813 28.067°S 32.421°E DM7367 south eastern Africa FJ415826 FJ415814 28.067°S 32.421°E DM7369 south eastern Africa FJ415837 - 28.067°S 32.421°E DM7370 south eastern Africa FJ415838 - 28.067°S 32.421°E DM7371 south eastern Africa FJ415839 - 28.067°S 32.421°E DM7372 south eastern Africa FJ415827 - 27.583°S 32.217°E DM7373 south eastern Africa FJ415828 FJ415815 27.583°S 32.217°E DM7374 south eastern Africa FJ415829 FJ415816 30.05°S 30.883°E DM7377 south eastern Africa FJ415846 - 30.05°S 30.883°E DM7378 south eastern Africa FJ415830 - 29.833°S 31.00°E DM7379 south eastern Africa FJ415848 FJ415817 unknown DM7380 south eastern Africa FJ415849 FJ415818 28.067°S 32.421°E DM7381 south eastern Africa FJ415841 -
242
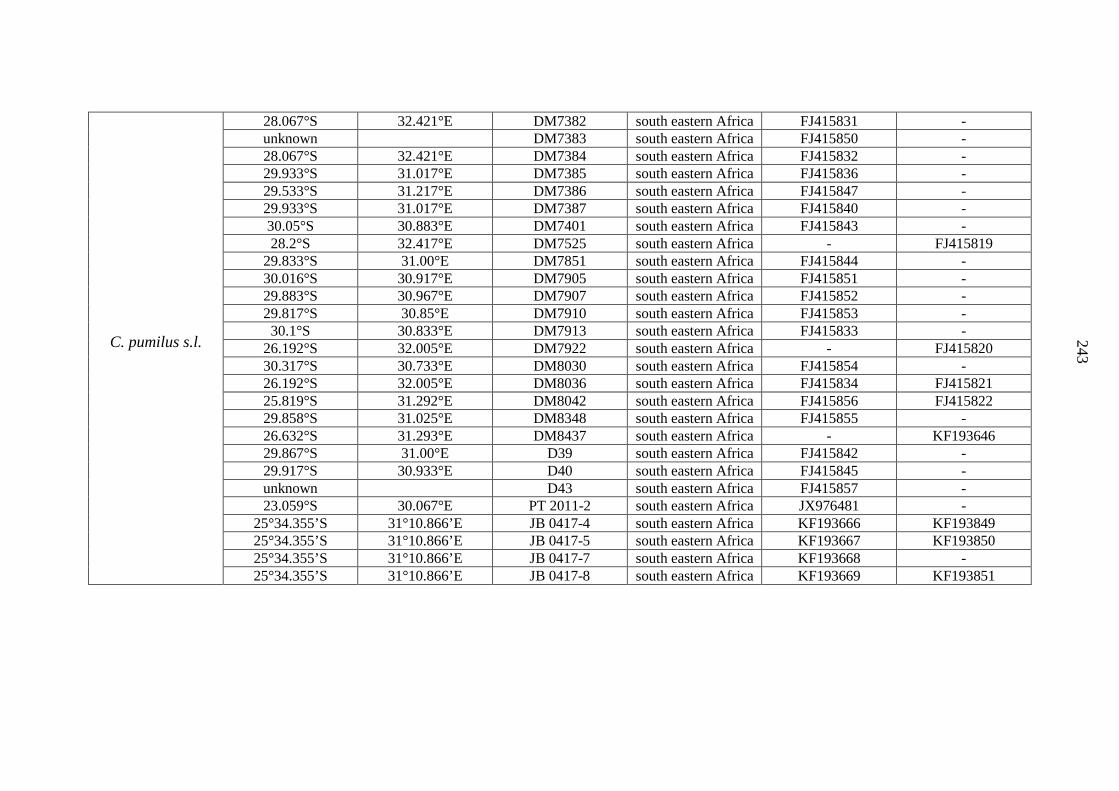
243
C. pumilus s.l.
28.067°S 32.421°E DM7382 south eastern Africa FJ415831 - unknown DM7383 south eastern Africa FJ415850 - 28.067°S 32.421°E DM7384 south eastern Africa FJ415832 - 29.933°S 31.017°E DM7385 south eastern Africa FJ415836 - 29.533°S 31.217°E DM7386 south eastern Africa FJ415847 - 29.933°S 31.017°E DM7387 south eastern Africa FJ415840 - 30.05°S 30.883°E DM7401 south eastern Africa FJ415843 - 28.2°S 32.417°E DM7525 south eastern Africa - FJ415819
29.833°S 31.00°E DM7851 south eastern Africa FJ415844 - 30.016°S 30.917°E DM7905 south eastern Africa FJ415851 - 29.883°S 30.967°E DM7907 south eastern Africa FJ415852 - 29.817°S 30.85°E DM7910 south eastern Africa FJ415853 -
30.1°S 30.833°E DM7913 south eastern Africa FJ415833 - 26.192°S 32.005°E DM7922 south eastern Africa - FJ415820 30.317°S 30.733°E DM8030 south eastern Africa FJ415854 - 26.192°S 32.005°E DM8036 south eastern Africa FJ415834 FJ415821 25.819°S 31.292°E DM8042 south eastern Africa FJ415856 FJ415822 29.858°S 31.025°E DM8348 south eastern Africa FJ415855 - 26.632°S 31.293°E DM8437 south eastern Africa - KF193646 29.867°S 31.00°E D39 south eastern Africa FJ415842 - 29.917°S 30.933°E D40 south eastern Africa FJ415845 - unknown D43 south eastern Africa FJ415857 - 23.059°S 30.067°E PT 2011-2 south eastern Africa JX976481 -
25°34.355’S 31°10.866’E JB 0417-4 south eastern Africa KF193666 KF193849 25°34.355’S 31°10.866’E JB 0417-5 south eastern Africa KF193667 KF193850 25°34.355’S 31°10.866’E JB 0417-7 south eastern Africa KF193668 - 25°34.355’S 31°10.866’E JB 0417-8 south eastern Africa KF193669 KF193851
243
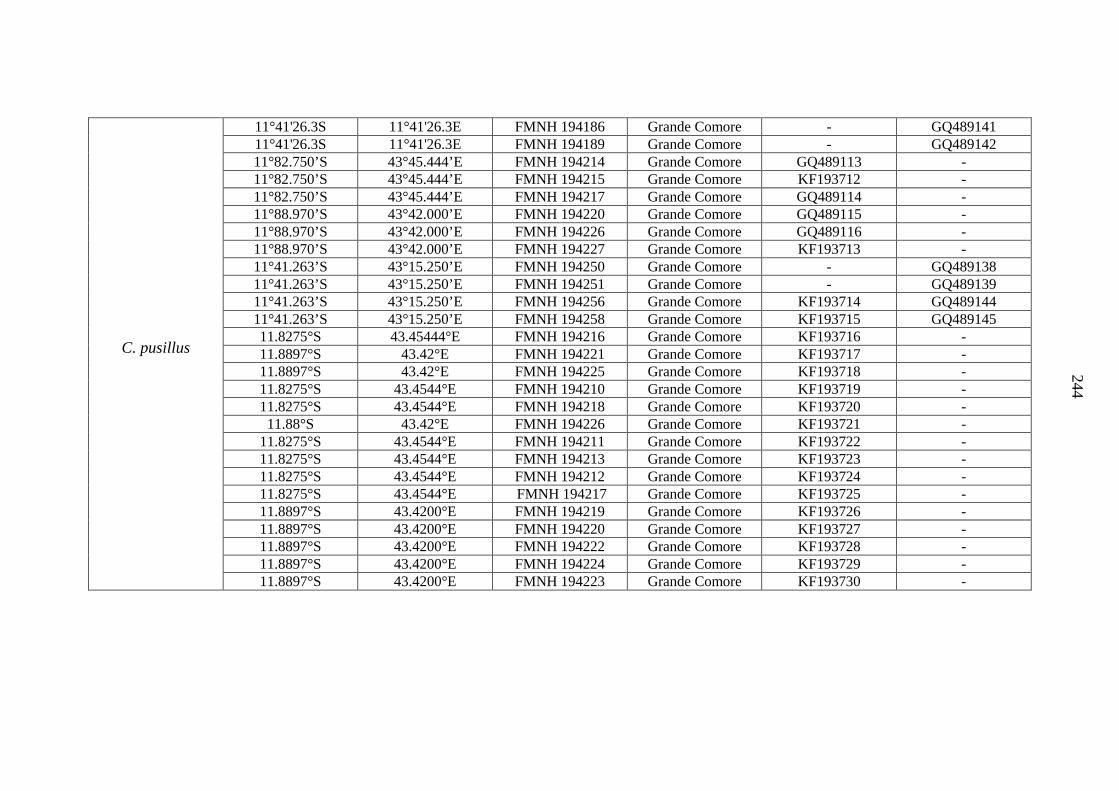
244
C. pusillus
11°41'26.3S 11°41'26.3E FMNH 194186 Grande Comore - GQ489141 11°41'26.3S 11°41'26.3E FMNH 194189 Grande Comore - GQ489142 11°82.750’S 43°45.444’E FMNH 194214 Grande Comore GQ489113 - 11°82.750’S 43°45.444’E FMNH 194215 Grande Comore KF193712 - 11°82.750’S 43°45.444’E FMNH 194217 Grande Comore GQ489114 - 11°88.970’S 43°42.000’E FMNH 194220 Grande Comore GQ489115 - 11°88.970’S 43°42.000’E FMNH 194226 Grande Comore GQ489116 - 11°88.970’S 43°42.000’E FMNH 194227 Grande Comore KF193713 - 11°41.263’S 43°15.250’E FMNH 194250 Grande Comore - GQ489138 11°41.263’S 43°15.250’E FMNH 194251 Grande Comore - GQ489139 11°41.263’S 43°15.250’E FMNH 194256 Grande Comore KF193714 GQ489144 11°41.263’S 43°15.250’E FMNH 194258 Grande Comore KF193715 GQ489145 11.8275°S 43.45444°E FMNH 194216 Grande Comore KF193716 - 11.8897°S 43.42°E FMNH 194221 Grande Comore KF193717 - 11.8897°S 43.42°E FMNH 194225 Grande Comore KF193718 - 11.8275°S 43.4544°E FMNH 194210 Grande Comore KF193719 - 11.8275°S 43.4544°E FMNH 194218 Grande Comore KF193720 - 11.88°S 43.42°E FMNH 194226 Grande Comore KF193721 -
11.8275°S 43.4544°E FMNH 194211 Grande Comore KF193722 - 11.8275°S 43.4544°E FMNH 194213 Grande Comore KF193723 - 11.8275°S 43.4544°E FMNH 194212 Grande Comore KF193724 - 11.8275°S 43.4544°E FMNH 194217 Grande Comore KF193725 - 11.8897°S 43.4200°E FMNH 194219 Grande Comore KF193726 - 11.8897°S 43.4200°E FMNH 194220 Grande Comore KF193727 - 11.8897°S 43.4200°E FMNH 194222 Grande Comore KF193728 - 11.8897°S 43.4200°E FMNH 194224 Grande Comore KF193729 - 11.8897°S 43.4200°E FMNH 194223 Grande Comore KF193730 -
244
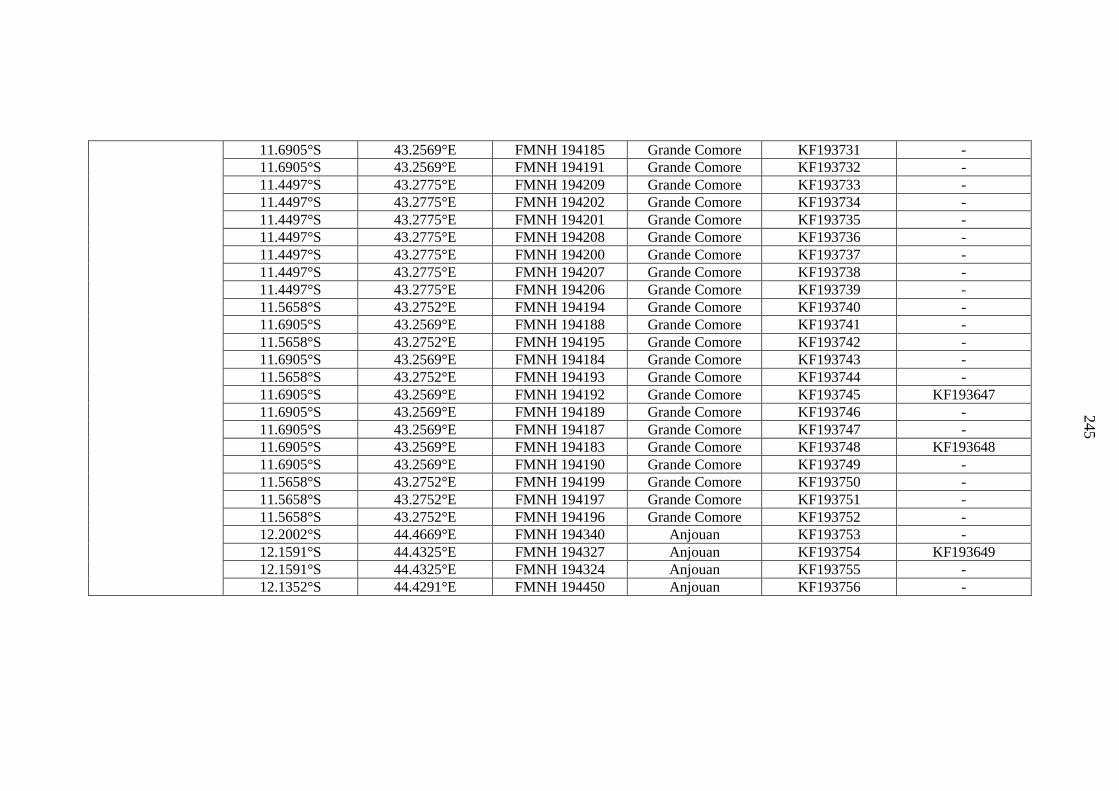
245
11.6905°S 43.2569°E FMNH 194185 Grande Comore KF193731 - 11.6905°S 43.2569°E FMNH 194191 Grande Comore KF193732 - 11.4497°S 43.2775°E FMNH 194209 Grande Comore KF193733 - 11.4497°S 43.2775°E FMNH 194202 Grande Comore KF193734 - 11.4497°S 43.2775°E FMNH 194201 Grande Comore KF193735 - 11.4497°S 43.2775°E FMNH 194208 Grande Comore KF193736 - 11.4497°S 43.2775°E FMNH 194200 Grande Comore KF193737 - 11.4497°S 43.2775°E FMNH 194207 Grande Comore KF193738 - 11.4497°S 43.2775°E FMNH 194206 Grande Comore KF193739 - 11.5658°S 43.2752°E FMNH 194194 Grande Comore KF193740 - 11.6905°S 43.2569°E FMNH 194188 Grande Comore KF193741 - 11.5658°S 43.2752°E FMNH 194195 Grande Comore KF193742 - 11.6905°S 43.2569°E FMNH 194184 Grande Comore KF193743 - 11.5658°S 43.2752°E FMNH 194193 Grande Comore KF193744 - 11.6905°S 43.2569°E FMNH 194192 Grande Comore KF193745 KF193647 11.6905°S 43.2569°E FMNH 194189 Grande Comore KF193746 - 11.6905°S 43.2569°E FMNH 194187 Grande Comore KF193747 - 11.6905°S 43.2569°E FMNH 194183 Grande Comore KF193748 KF193648 11.6905°S 43.2569°E FMNH 194190 Grande Comore KF193749 - 11.5658°S 43.2752°E FMNH 194199 Grande Comore KF193750 - 11.5658°S 43.2752°E FMNH 194197 Grande Comore KF193751 - 11.5658°S 43.2752°E FMNH 194196 Grande Comore KF193752 - 12.2002°S 44.4669°E FMNH 194340 Anjouan KF193753 - 12.1591°S 44.4325°E FMNH 194327 Anjouan KF193754 KF193649 12.1591°S 44.4325°E FMNH 194324 Anjouan KF193755 - 12.1352°S 44.4291°E FMNH 194450 Anjouan KF193756 -
245
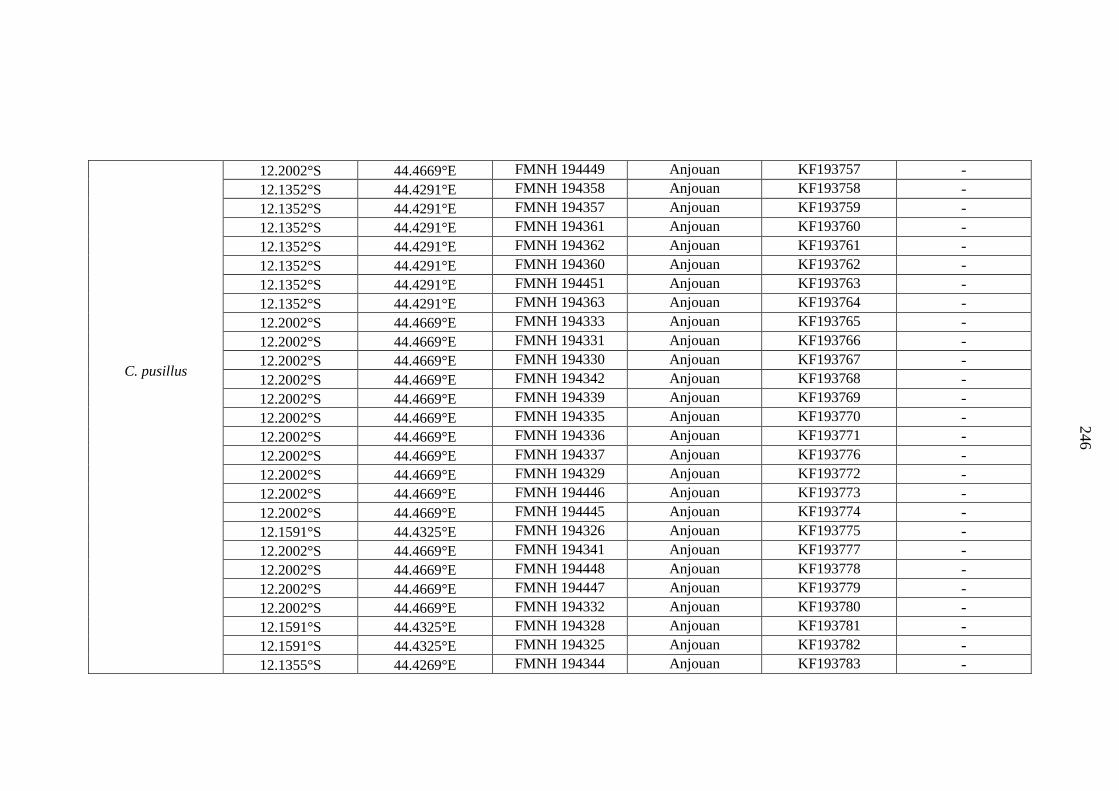
246
C. pusillus
12.2002°S 44.4669°E FMNH 194449 Anjouan KF193757 - 12.1352°S 44.4291°E FMNH 194358 Anjouan KF193758 - 12.1352°S 44.4291°E FMNH 194357 Anjouan KF193759 - 12.1352°S 44.4291°E FMNH 194361 Anjouan KF193760 - 12.1352°S 44.4291°E FMNH 194362 Anjouan KF193761 - 12.1352°S 44.4291°E FMNH 194360 Anjouan KF193762 - 12.1352°S 44.4291°E FMNH 194451 Anjouan KF193763 - 12.1352°S 44.4291°E FMNH 194363 Anjouan KF193764 - 12.2002°S 44.4669°E FMNH 194333 Anjouan KF193765 - 12.2002°S 44.4669°E FMNH 194331 Anjouan KF193766 - 12.2002°S 44.4669°E FMNH 194330 Anjouan KF193767 - 12.2002°S 44.4669°E FMNH 194342 Anjouan KF193768 - 12.2002°S 44.4669°E FMNH 194339 Anjouan KF193769 - 12.2002°S 44.4669°E FMNH 194335 Anjouan KF193770 - 12.2002°S 44.4669°E FMNH 194336 Anjouan KF193771 - 12.2002°S 44.4669°E FMNH 194337 Anjouan KF193776 - 12.2002°S 44.4669°E FMNH 194329 Anjouan KF193772 - 12.2002°S 44.4669°E FMNH 194446 Anjouan KF193773 - 12.2002°S 44.4669°E FMNH 194445 Anjouan KF193774 - 12.1591°S 44.4325°E FMNH 194326 Anjouan KF193775 - 12.2002°S 44.4669°E FMNH 194341 Anjouan KF193777 - 12.2002°S 44.4669°E FMNH 194448 Anjouan KF193778 - 12.2002°S 44.4669°E FMNH 194447 Anjouan KF193779 - 12.2002°S 44.4669°E FMNH 194332 Anjouan KF193780 - 12.1591°S 44.4325°E FMNH 194328 Anjouan KF193781 - 12.1591°S 44.4325°E FMNH 194325 Anjouan KF193782 - 12.1355°S 44.4269°E FMNH 194344 Anjouan KF193783 -
246
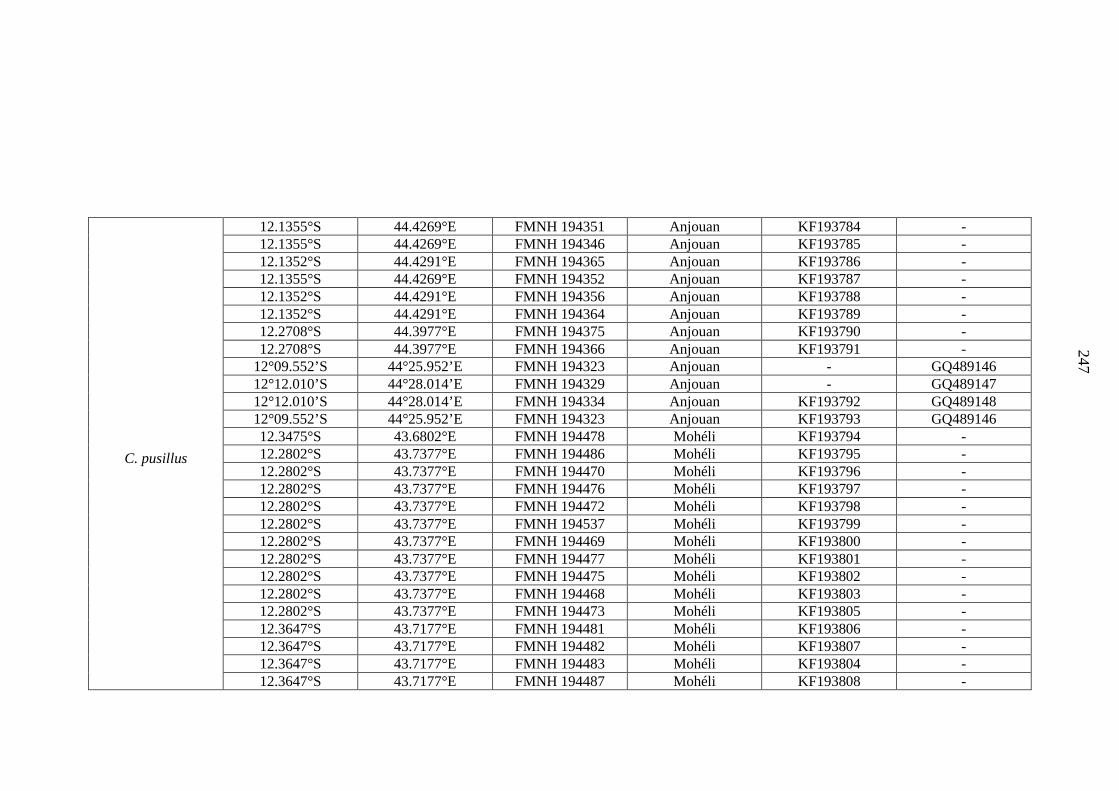
247
C. pusillus
12.1355°S 44.4269°E FMNH 194351 Anjouan KF193784 - 12.1355°S 44.4269°E FMNH 194346 Anjouan KF193785 - 12.1352°S 44.4291°E FMNH 194365 Anjouan KF193786 - 12.1355°S 44.4269°E FMNH 194352 Anjouan KF193787 - 12.1352°S 44.4291°E FMNH 194356 Anjouan KF193788 - 12.1352°S 44.4291°E FMNH 194364 Anjouan KF193789 - 12.2708°S 44.3977°E FMNH 194375 Anjouan KF193790 - 12.2708°S 44.3977°E FMNH 194366 Anjouan KF193791 -
12°09.552’S 44°25.952’E FMNH 194323 Anjouan - GQ489146 12°12.010’S 44°28.014’E FMNH 194329 Anjouan - GQ489147 12°12.010’S 44°28.014’E FMNH 194334 Anjouan KF193792 GQ489148 12°09.552’S 44°25.952’E FMNH 194323 Anjouan KF193793 GQ489146 12.3475°S 43.6802°E FMNH 194478 Mohéli KF193794 - 12.2802°S 43.7377°E FMNH 194486 Mohéli KF193795 - 12.2802°S 43.7377°E FMNH 194470 Mohéli KF193796 - 12.2802°S 43.7377°E FMNH 194476 Mohéli KF193797 - 12.2802°S 43.7377°E FMNH 194472 Mohéli KF193798 - 12.2802°S 43.7377°E FMNH 194537 Mohéli KF193799 - 12.2802°S 43.7377°E FMNH 194469 Mohéli KF193800 - 12.2802°S 43.7377°E FMNH 194477 Mohéli KF193801 - 12.2802°S 43.7377°E FMNH 194475 Mohéli KF193802 - 12.2802°S 43.7377°E FMNH 194468 Mohéli KF193803 - 12.2802°S 43.7377°E FMNH 194473 Mohéli KF193805 - 12.3647°S 43.7177°E FMNH 194481 Mohéli KF193806 - 12.3647°S 43.7177°E FMNH 194482 Mohéli KF193807 - 12.3647°S 43.7177°E FMNH 194483 Mohéli KF193804 - 12.3647°S 43.7177°E FMNH 194487 Mohéli KF193808 -
247
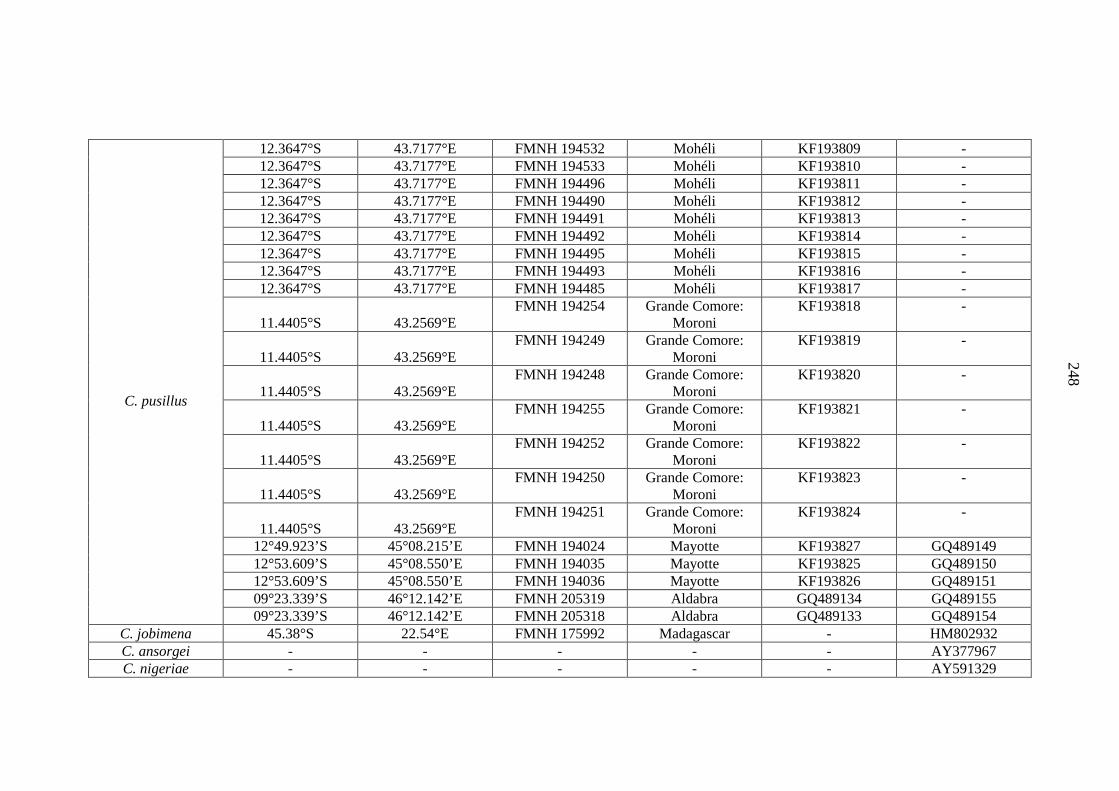
248
C. pusillus
12.3647°S 43.7177°E FMNH 194532 Mohéli KF193809 - 12.3647°S 43.7177°E FMNH 194533 Mohéli KF193810 - 12.3647°S 43.7177°E FMNH 194496 Mohéli KF193811 - 12.3647°S 43.7177°E FMNH 194490 Mohéli KF193812 - 12.3647°S 43.7177°E FMNH 194491 Mohéli KF193813 - 12.3647°S 43.7177°E FMNH 194492 Mohéli KF193814 - 12.3647°S 43.7177°E FMNH 194495 Mohéli KF193815 - 12.3647°S 43.7177°E FMNH 194493 Mohéli KF193816 - 12.3647°S 43.7177°E FMNH 194485 Mohéli KF193817 -
11.4405°S 43.2569°E FMNH 194254 Grande Comore:
Moroni KF193818 -
11.4405°S 43.2569°E FMNH 194249 Grande Comore:
Moroni KF193819 -
11.4405°S 43.2569°E FMNH 194248 Grande Comore:
Moroni KF193820 -
11.4405°S 43.2569°E FMNH 194255 Grande Comore:
Moroni KF193821 -
11.4405°S 43.2569°E FMNH 194252 Grande Comore:
Moroni KF193822 -
11.4405°S 43.2569°E FMNH 194250 Grande Comore:
Moroni KF193823 -
11.4405°S 43.2569°E FMNH 194251 Grande Comore:
Moroni KF193824 -
12°49.923’S 45°08.215’E FMNH 194024 Mayotte KF193827 GQ489149 12°53.609’S 45°08.550’E FMNH 194035 Mayotte KF193825 GQ489150 12°53.609’S 45°08.550’E FMNH 194036 Mayotte KF193826 GQ489151 09°23.339’S 46°12.142’E FMNH 205319 Aldabra GQ489134 GQ489155 09°23.339’S 46°12.142’E FMNH 205318 Aldabra GQ489133 GQ489154
C. jobimena 45.38°S 22.54°E FMNH 175992 Madagascar - HM802932 C. ansorgei - - - - - AY377967 C. nigeriae - - - - - AY591329
248

249
C. chapini - - - - - AY591329 C. jobensis - - - - - AY591331
OUTGROUPS Mops midas FMNH 184306
Mops leucostigma FMNH 185098 Mops condylurus DM 6291
Otomops martiensseni
DM 8032
Otomops madagascarensis
FMNH 166073
249
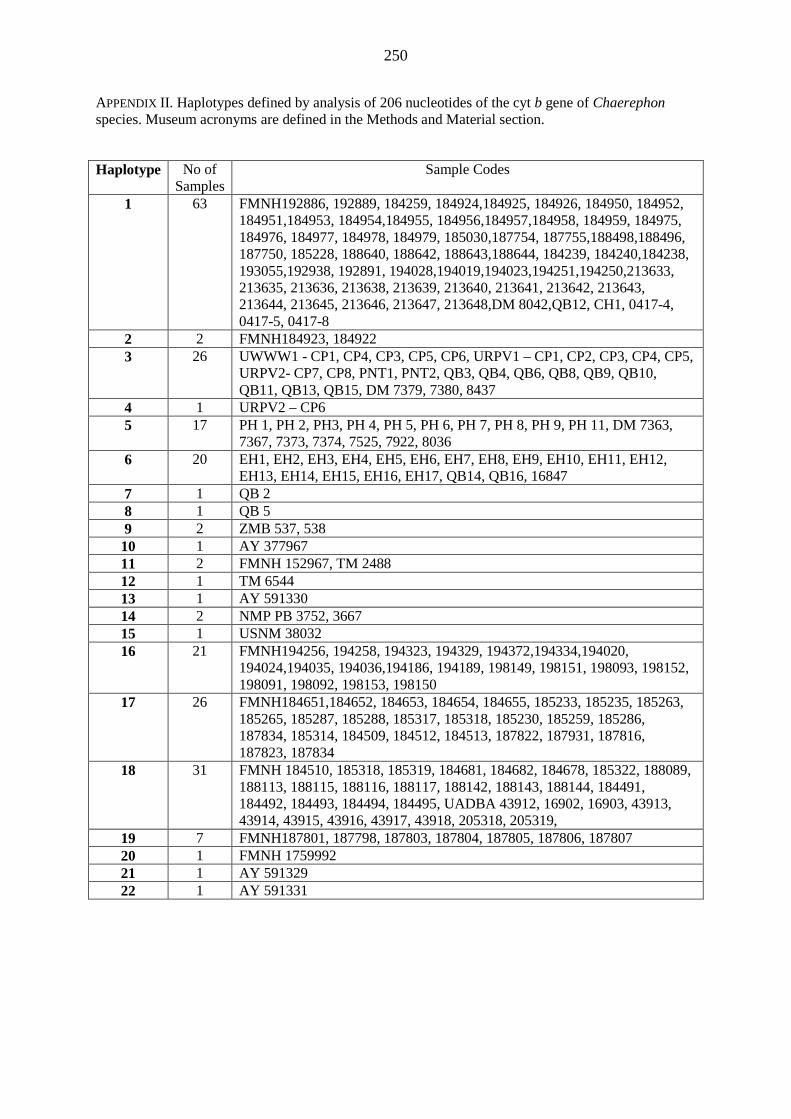
250
APPENDIX II. Haplotypes defined by analysis of 206 nucleotides of the cyt b gene of Chaerephon species. Museum acronyms are defined in the Methods and Material section.
Haplotype No of Samples
Sample Codes
1 63 FMNH192886, 192889, 184259, 184924,184925, 184926, 184950, 184952, 184951,184953, 184954,184955, 184956,184957,184958, 184959, 184975, 184976, 184977, 184978, 184979, 185030,187754, 187755,188498,188496, 187750, 185228, 188640, 188642, 188643,188644, 184239, 184240,184238, 193055,192938, 192891, 194028,194019,194023,194251,194250,213633, 213635, 213636, 213638, 213639, 213640, 213641, 213642, 213643, 213644, 213645, 213646, 213647, 213648,DM 8042,QB12, CH1, 0417-4, 0417-5, 0417-8
2 2 FMNH184923, 184922 3 26 UWWW1 - CP1, CP4, CP3, CP5, CP6, URPV1 – CP1, CP2, CP3, CP4, CP5,
URPV2- CP7, CP8, PNT1, PNT2, QB3, QB4, QB6, QB8, QB9, QB10, QB11, QB13, QB15, DM 7379, 7380, 8437
4 1 URPV2 – CP6 5 17 PH 1, PH 2, PH3, PH 4, PH 5, PH 6, PH 7, PH 8, PH 9, PH 11, DM 7363,
7367, 7373, 7374, 7525, 7922, 8036 6 20 EH1, EH2, EH3, EH4, EH5, EH6, EH7, EH8, EH9, EH10, EH11, EH12,
EH13, EH14, EH15, EH16, EH17, QB14, QB16, 16847 7 1 QB 2 8 1 QB 5 9 2 ZMB 537, 538
10 1 AY 377967 11 2 FMNH 152967, TM 2488 12 1 TM 6544 13 1 AY 591330 14 2 NMP PB 3752, 3667 15 1 USNM 38032 16 21 FMNH194256, 194258, 194323, 194329, 194372,194334,194020,
194024,194035, 194036,194186, 194189, 198149, 198151, 198093, 198152, 198091, 198092, 198153, 198150
17 26 FMNH184651,184652, 184653, 184654, 184655, 185233, 185235, 185263, 185265, 185287, 185288, 185317, 185318, 185230, 185259, 185286, 187834, 185314, 184509, 184512, 184513, 187822, 187931, 187816, 187823, 187834
18 31 FMNH 184510, 185318, 185319, 184681, 184682, 184678, 185322, 188089, 188113, 188115, 188116, 188117, 188142, 188143, 188144, 184491, 184492, 184493, 184494, 184495, UADBA 43912, 16902, 16903, 43913, 43914, 43915, 43916, 43917, 43918, 205318, 205319,
19 7 FMNH187801, 187798, 187803, 187804, 187805, 187806, 187807 20 1 FMNH 1759992 21 1 AY 591329 22 1 AY 591331
238 249
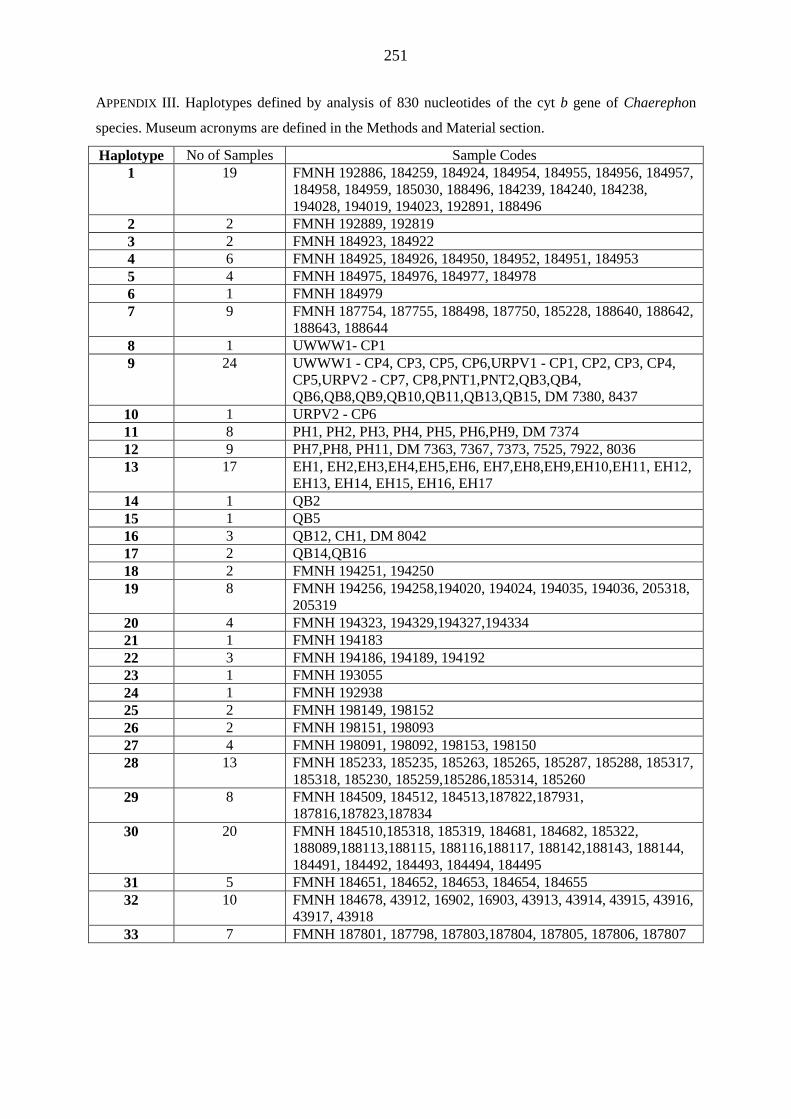
251
APPENDIX III. Haplotypes defined by analysis of 830 nucleotides of the cyt b gene of Chaerephon
species. Museum acronyms are defined in the Methods and Material section.
Haplotype No of Samples Sample Codes 1 19 FMNH 192886, 184259, 184924, 184954, 184955, 184956, 184957,
184958, 184959, 185030, 188496, 184239, 184240, 184238, 194028, 194019, 194023, 192891, 188496
2 2 FMNH 192889, 192819 3 2 FMNH 184923, 184922 4 6 FMNH 184925, 184926, 184950, 184952, 184951, 184953 5 4 FMNH 184975, 184976, 184977, 184978 6 1 FMNH 184979 7 9 FMNH 187754, 187755, 188498, 187750, 185228, 188640, 188642,
188643, 188644 8 1 UWWW1- CP1 9 24 UWWW1 - CP4, CP3, CP5, CP6,URPV1 - CP1, CP2, CP3, CP4,
CP5,URPV2 - CP7, CP8,PNT1,PNT2,QB3,QB4, QB6,QB8,QB9,QB10,QB11,QB13,QB15, DM 7380, 8437
10 1 URPV2 - CP6 11 8 PH1, PH2, PH3, PH4, PH5, PH6,PH9, DM 7374 12 9 PH7,PH8, PH11, DM 7363, 7367, 7373, 7525, 7922, 8036 13 17 EH1, EH2,EH3,EH4,EH5,EH6, EH7,EH8,EH9,EH10,EH11, EH12,
EH13, EH14, EH15, EH16, EH17 14 1 QB2 15 1 QB5 16 3 QB12, CH1, DM 8042 17 2 QB14,QB16 18 2 FMNH 194251, 194250 19 8 FMNH 194256, 194258,194020, 194024, 194035, 194036, 205318,
205319 20 4 FMNH 194323, 194329,194327,194334 21 1 FMNH 194183 22 3 FMNH 194186, 194189, 194192 23 1 FMNH 193055 24 1 FMNH 192938 25 2 FMNH 198149, 198152 26 2 FMNH 198151, 198093 27 4 FMNH 198091, 198092, 198153, 198150 28 13 FMNH 185233, 185235, 185263, 185265, 185287, 185288, 185317,
185318, 185230, 185259,185286,185314, 185260 29 8 FMNH 184509, 184512, 184513,187822,187931,
187816,187823,187834 30 20 FMNH 184510,185318, 185319, 184681, 184682, 185322,
188089,188113,188115, 188116,188117, 188142,188143, 188144, 184491, 184492, 184493, 184494, 184495
31 5 FMNH 184651, 184652, 184653, 184654, 184655 32 10 FMNH 184678, 43912, 16902, 16903, 43913, 43914, 43915, 43916,
43917, 43918 33 7 FMNH 187801, 187798, 187803,187804, 187805, 187806, 187807
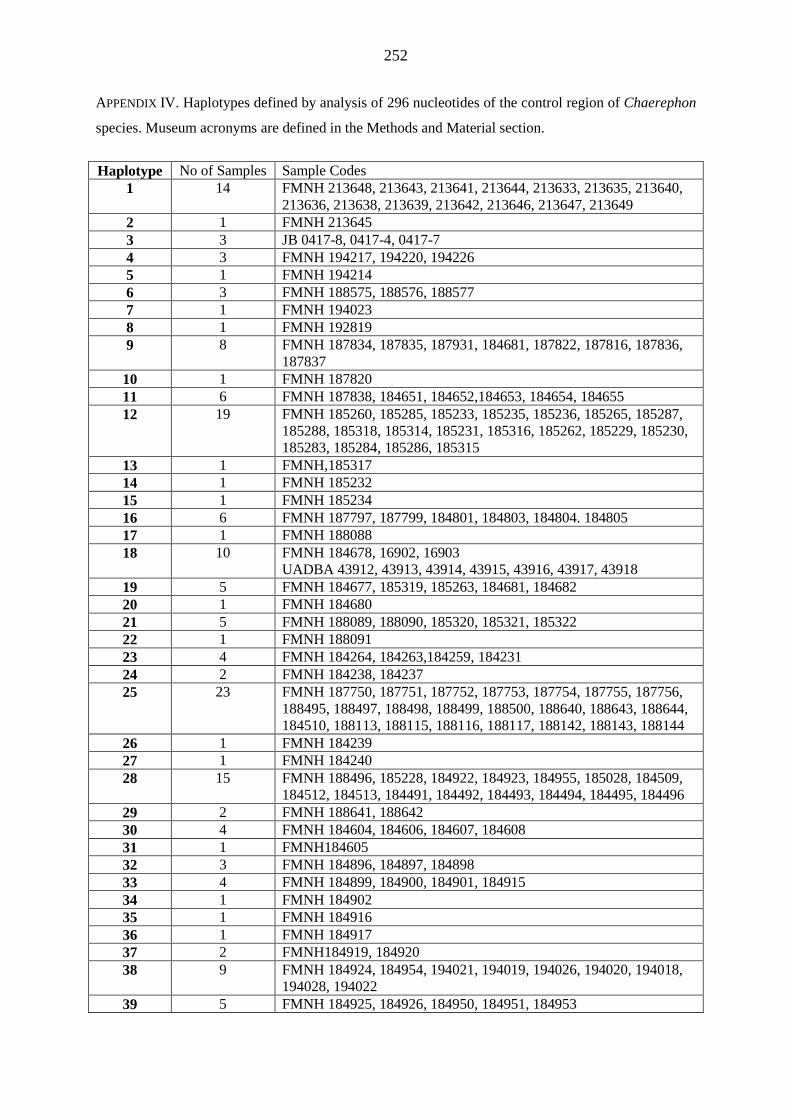
252
APPENDIX IV. Haplotypes defined by analysis of 296 nucleotides of the control region of Chaerephon
species. Museum acronyms are defined in the Methods and Material section.
Haplotype No of Samples Sample Codes
1 14 FMNH 213648, 213643, 213641, 213644, 213633, 213635, 213640, 213636, 213638, 213639, 213642, 213646, 213647, 213649
2 1 FMNH 213645 3 3 JB 0417-8, 0417-4, 0417-7 4 3 FMNH 194217, 194220, 194226 5 1 FMNH 194214 6 3 FMNH 188575, 188576, 188577 7 1 FMNH 194023 8 1 FMNH 192819 9 8 FMNH 187834, 187835, 187931, 184681, 187822, 187816, 187836,
187837 10 1 FMNH 187820 11 6 FMNH 187838, 184651, 184652,184653, 184654, 184655 12 19 FMNH 185260, 185285, 185233, 185235, 185236, 185265, 185287,
185288, 185318, 185314, 185231, 185316, 185262, 185229, 185230, 185283, 185284, 185286, 185315
13 1 FMNH,185317 14 1 FMNH 185232 15 1 FMNH 185234 16 6 FMNH 187797, 187799, 184801, 184803, 184804. 184805 17 1 FMNH 188088 18 10 FMNH 184678, 16902, 16903
UADBA 43912, 43913, 43914, 43915, 43916, 43917, 43918 19 5 FMNH 184677, 185319, 185263, 184681, 184682 20 1 FMNH 184680 21 5 FMNH 188089, 188090, 185320, 185321, 185322 22 1 FMNH 188091 23 4 FMNH 184264, 184263,184259, 184231 24 2 FMNH 184238, 184237 25 23 FMNH 187750, 187751, 187752, 187753, 187754, 187755, 187756,
188495, 188497, 188498, 188499, 188500, 188640, 188643, 188644, 184510, 188113, 188115, 188116, 188117, 188142, 188143, 188144
26 1 FMNH 184239 27 1 FMNH 184240 28 15 FMNH 188496, 185228, 184922, 184923, 184955, 185028, 184509,
184512, 184513, 184491, 184492, 184493, 184494, 184495, 184496 29 2 FMNH 188641, 188642 30 4 FMNH 184604, 184606, 184607, 184608 31 1 FMNH184605 32 3 FMNH 184896, 184897, 184898 33 4 FMNH 184899, 184900, 184901, 184915 34 1 FMNH 184902 35 1 FMNH 184916 36 1 FMNH 184917 37 2 FMNH184919, 184920 38 9 FMNH 184924, 184954, 194021, 194019, 194026, 194020, 194018,
194028, 194022 39 5 FMNH 184925, 184926, 184950, 184951, 184953
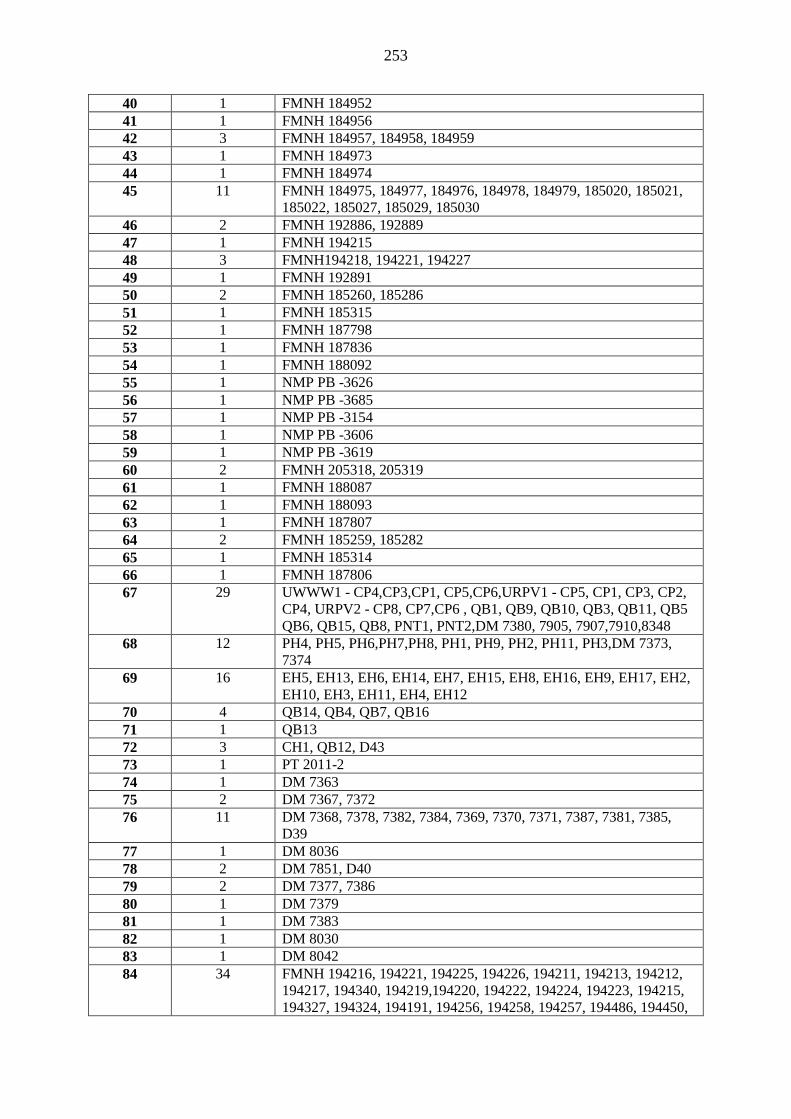
253
40 1 FMNH 184952 41 1 FMNH 184956 42 3 FMNH 184957, 184958, 184959 43 1 FMNH 184973 44 1 FMNH 184974 45 11 FMNH 184975, 184977, 184976, 184978, 184979, 185020, 185021,
185022, 185027, 185029, 185030 46 2 FMNH 192886, 192889 47 1 FMNH 194215 48 3 FMNH194218, 194221, 194227 49 1 FMNH 192891 50 2 FMNH 185260, 185286 51 1 FMNH 185315 52 1 FMNH 187798 53 1 FMNH 187836 54 1 FMNH 188092 55 1 NMP PB -3626 56 1 NMP PB -3685 57 1 NMP PB -3154 58 1 NMP PB -3606 59 1 NMP PB -3619 60 2 FMNH 205318, 205319 61 1 FMNH 188087 62 1 FMNH 188093 63 1 FMNH 187807 64 2 FMNH 185259, 185282 65 1 FMNH 185314 66 1 FMNH 187806 67 29 UWWW1 - CP4,CP3,CP1, CP5,CP6,URPV1 - CP5, CP1, CP3, CP2,
CP4, URPV2 - CP8, CP7,CP6 , QB1, QB9, QB10, QB3, QB11, QB5 QB6, QB15, QB8, PNT1, PNT2,DM 7380, 7905, 7907,7910,8348
68 12 PH4, PH5, PH6,PH7,PH8, PH1, PH9, PH2, PH11, PH3,DM 7373, 7374
69 16 EH5, EH13, EH6, EH14, EH7, EH15, EH8, EH16, EH9, EH17, EH2, EH10, EH3, EH11, EH4, EH12
70 4 QB14, QB4, QB7, QB16 71 1 QB13 72 3 CH1, QB12, D43 73 1 PT 2011-2 74 1 DM 7363 75 2 DM 7367, 7372 76 11 DM 7368, 7378, 7382, 7384, 7369, 7370, 7371, 7387, 7381, 7385,
D39 77 1 DM 8036 78 2 DM 7851, D40 79 2 DM 7377, 7386 80 1 DM 7379 81 1 DM 7383 82 1 DM 8030 83 1 DM 8042 84 34 FMNH 194216, 194221, 194225, 194226, 194211, 194213, 194212,
194217, 194340, 194219,194220, 194222, 194224, 194223, 194215, 194327, 194324, 194191, 194256, 194258, 194257, 194486, 194450,
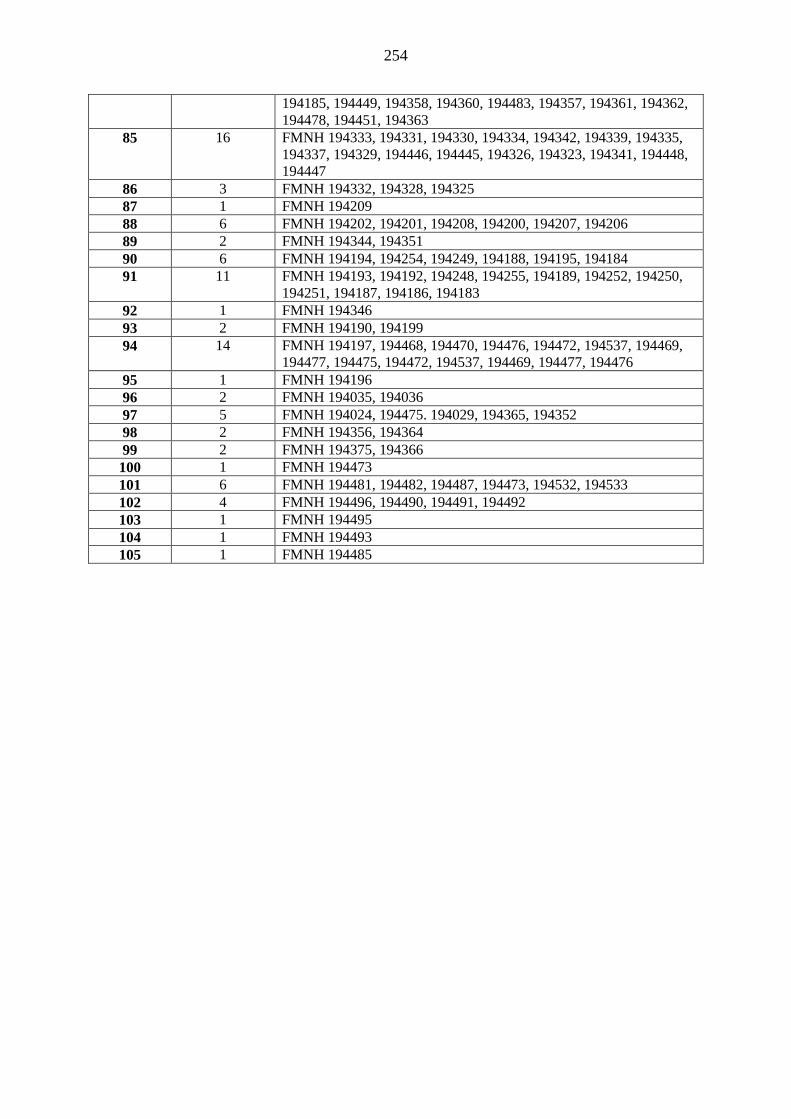
254
194185, 194449, 194358, 194360, 194483, 194357, 194361, 194362, 194478, 194451, 194363
85 16 FMNH 194333, 194331, 194330, 194334, 194342, 194339, 194335, 194337, 194329, 194446, 194445, 194326, 194323, 194341, 194448, 194447
86 3 FMNH 194332, 194328, 194325 87 1 FMNH 194209 88 6 FMNH 194202, 194201, 194208, 194200, 194207, 194206 89 2 FMNH 194344, 194351 90 6 FMNH 194194, 194254, 194249, 194188, 194195, 194184 91 11 FMNH 194193, 194192, 194248, 194255, 194189, 194252, 194250,
194251, 194187, 194186, 194183 92 1 FMNH 194346 93 2 FMNH 194190, 194199 94 14 FMNH 194197, 194468, 194470, 194476, 194472, 194537, 194469,
194477, 194475, 194472, 194537, 194469, 194477, 194476 95 1 FMNH 194196 96 2 FMNH 194035, 194036 97 5 FMNH 194024, 194475. 194029, 194365, 194352 98 2 FMNH 194356, 194364 99 2 FMNH 194375, 194366
100 1 FMNH 194473 101 6 FMNH 194481, 194482, 194487, 194473, 194532, 194533 102 4 FMNH 194496, 194490, 194491, 194492 103 1 FMNH 194495 104 1 FMNH 194493 105 1 FMNH 194485
255
SUMMARY AND SYNTHESIS
The focus of this thesis was to study the systematics and evolution of the Afro-Malagasy
genus Chaerephon (family: Molossidae) using a multifaceted approach that encompassed both
molecular and ecological perspectives. The molecular analyses, based on DNA sequence and
microsatellite data, included the use of both mitochondrial and nuclear markers, thus encompassing
different modes of inheritance and rates of evolution to provide insight into the systematics and
population structure of Chaerephon taxa (Avise 2004; Flanders et al. 2009). This was a significant
step in resolving the systematics within the C. pumilus complex distributed across Africa, the Arabian
Peninsula and the western Indian Ocean islands.
The primary aims of this study were to examine:
(1) The phylogenetics and phylogeography of a C. leucogaster, a previously unstudied member
of the C. pumilus species complex from Madagascar and the western Indian Ocean islands.
(2) Phylogenetics, population genetics and aspects of the ecology of C. pumilus sensu lato (s.l.)
from south eastern Africa.
(3) The evolutionary history and taxonomy of the Chaerephon pumilus species complex
distributed across Africa, the Arabian Peninsula and the western Indian Ocean islands.
Working at the subspecific level, Chapter 1 was a pilot study undertaken that examined the
phylogenetic and phylogeographic position of C. leucogaster from Madagascar based on the
mitochondrial cytochrome b and control regions. Cytochrome b genetic distances among individuals
tended to be low (max 0.35%). In contrast, those between C. leucogaster and another Malagasy
Chaerephon species, C. atsinanana (formerly referred to as C. pumilus), ranged from 1.77% to
2.62%. Mitochondrial D-loop data for the Malagasy samples of C. leucogaster revealed significant
but shallow phylogeographic structuring into three latitudinal groups (13˚S, 15 -17˚S, 22-23˚S)
showing exclusive haplotypes which correlated with regions of suitable habitat defined by Ecological
Niche modelling. This was supported in a combined morphological and genetic study by
Ratrimomanarivo et al. (2009a). This led to further determine the position of C. leucogaster relative
to C. pumilus from south eastern Africa.
256
A study done in a similar context was carried out by Taylor et al. (2009), focusing on C.
pumilus sensu lato (s.l.) from south eastern Africa and Swaziland and C. leucogaster from
Madagascar. Analyses of the mitochondrial cytochrome b and control regions revealed genetically
distinct lineages (at least four clades from the greater Durban area (South Africa)) separated by inter-
clade cytochrome b genetic distances of 0.6 - 0.9%. Although C. leucogaster formed a paraphyletic
clade, it was defined as a separate species based on morphological and genetic data. These authors
further hypothesised that the southern African C. pumilus clades may represent cryptic species with
distinct echolocation characteristics.
Therefore, Chapter 2 was aimed at determining if echolocation was a driving force in the
existence of these genetically distinct lineages. In re-examining the phylogeny of Taylor et al. (2009)
based on a larger sample set with a wider geographic range,we tested the hypothesis that the
sympatric lineages found in south eastern Africa represented cryptic ‘sono-species’. The previously
reported phylogenetic structure by Taylor et al. (2009) was confirmed and an additional strongly
supported control region clade was identified. However, Discriminant Function Analysis (DFA) based
on four echolocation parameters (namely: peak frequency, bandwidth, duration and Fmin) could not
discriminate between the clades. The hypothesised existence of cryptic species with distinct
echolocation characteristics was not supported. Indices of diversity and neutrality combined with a
ragged multimodal distribution were inconsistent with demographic expansion of a single C. pumilus
s.l. south eastern African population.
This led to the comparative analyses of population genetic structure of C. pumilus s.l. from
South Africa using microsatellite data (Chapter 3). Approaches that employ the use of multiple loci in
the nuclear genome (such as microsatellites) provide a comprehensive description into the levels of
gene flow thus highlighting the subdivision in genetic variation within a population as in the case of
C. pumilus s.l. (Bergl and Vigilant 2007). We found there was strong mitochondrial genetic structure
with 90% of the molecular variance occurring among the phylogenetically-defined groups with
significant Fst values in C. pumilus s.l. However, nuclear variance accounted for 3% among
populations. Pairwise Fst values among populations were low and not significant.
A study by Lamb et al. (2012) examined the different levels of population genetic and
phylogeographic structuring between C. atsinanana and C. leucogaster. The Fst (0.994) of C.
atsinanana showed this population to be highly structured whereas C. leucogaster showed lower
levels of structure with an Fst of 0.792. The level of structuring in C. atsinanana was hypothesised to
be due to female philopatry. The Fst (0.897) of C. pumilus sensu lato populations falls between those
of C. atsinanana and C. leucogaster. The C. pumilus s.l. groups appear to comprise a single
interbreeding population. The high levels of mitochondrial genetic structure in absence of significant
nuclear structure are consistent with social isolating mechanisms such as female philopatry and may
also reflect introgression of mitochondrial genes due to past hybridisation events.
257
However, the species delimitations of members of the Chaerephon pumilus species complex still
remained largely unresolved. Analyses of the cytochrome b gene was the first step that led to the
designation of a clade comprising a museum specimen from Massawa, Eritrea, as well as specimens
from neighbouring Yemen, as the nominate C. pumilus (Goodman et al. 2010) henceforth referred to
as C. pumilus sensu stricto (s.s.). This enabled other Afro-Malagasy species to be defined relative to
C. pumilus s.s. C. leucogaster occurs on western Madagascar, Pemba, Zanzibar and Comoros. C.
pusilluswas elevated to full species rank and applied initially to animals from Aldabra (Goodman and
Ratrimomanarivo 2007), and Goodman et al. (2010) assigned animals occurring on the Comoros
Archipelago, which were formerly considered C. pumilus, to C. pusillus. This study also led to the
naming of a new species, C. atsinanana, from eastern Madagascar. Animals from Tanzania,
designated C. pumilus s.l., were also identified as members of the C. pumilus species complex.
In order to further resolve the evolutionary history and taxonomy of the C. pumilus species
complex I used a broader geographical and taxonomic sample than was used in Goodman et al. (2010)
that included the syntypes of C. limbatus, holotypes of C. elphicki and langi and the topotype of C.
naivashae, all considered junior synonyms of C. pumilus (Chapter 4). Analyses based on cytochrome
b sequence data indicate that these are not distinct from C. pumilus s.l. Forms of C. pumilus s.l. from
south eastern Africa are distinct from the nominate form (C. pumilus s.s. from Massawa, Eritrea) and
form part of C. pumilus species complex comprising C. atsinanana, C. leucogaster, C. pusillus and C.
pumilus s.l. (Tanzania). C. pumilus s.s. (Eritrea and Yemen) diverged from other members of the C.
pumilus complex approximately 6.24 million years ago (MYA). C. atsinanana diverged
approximately 5.01 MYA from a well supported but unresolved clade comprising subclades which
appear to have diverged between 1.07 and 2.39 MYA: C. pusillus, C. leucogaster, C. pumilus s.l.
(south eastern Africa) and C. pumilus s.l. (Tanzania). There was evidence of introgression of C.
pusillus haplotypes into C. leucogaster and of C. leucogaster haplotypes into C. pumilus from south
eastern Africa, postulated to be the result of past hybridization within clades forming part of this
species complex. The C. pumilus species complex was found to have several of the characteristics of a
ring species: It occurs on the African mainland and western Indian Ocean islands including
Madagascar, ringing a potential barrier to gene flow, the Mozambique channel, and the terminal
forms, C. leucogaster and C. pusillus, occur in sympatry on the Comoros. However, although there is
evidence of isolation by distance around the ring, there is also high level of structuring and limited
gene flow, which are inconsistent with a ring species.
FUTURE RESEARCH
Our results show strong differentiation of mtDNA in populations of C. pumilus from south
eastern Africa, consistent with behavioural explanations such as female philopatry. A further
hypothesis, yet to be tested, is that the genetic distinctiveness of these mitochondrial clades of C.
258
pumilus s.l. is maintained by their use of different social calling systems. Further studies on social
systems could assist in better understanding the dynamics between the mitochondrially-defined
populations of C. pumilus s.l. from south eastern Africa.
We showed even stronger mitochondrially based population subdivision in C. atsinanana (Lamb et al.
2012), whereas C. leucogaster shows lower, but still significant levels of population structuring
(Ratrimomanarivo et al. 2009a). In contrast, other molossid species in Africa and the western Indian
Ocean islands show lower levels of structure (eg. Mops leucostigma, Ratrimomanarivo et al. 2008) or
panmixia (eg. Mormopterus jugularis, Ratrimomanarivo et al. 2009b). While there is some indication
that levels of structure are inversely related to the size and therefore flight ability of these bats (Taylor
et al. 2012), it would be interesting to determine what other factors might be driving population
structuring. There is very limited information on the behaviour of molossid bats of the Afro-Malagasy
region. Studies on mate choice may be informative in this regard.
Our current knowledge of the phylogenetics of members of the C. pumilus species complex is
based primarily on the maternally-inherited mitochondrial cytochrome b and control region markers.
It is vital that this information is complemented by studies based on nuclear DNA, which is
biparentally-inhertied and therefore also reflects the male contribution to gene flow. Information from
both mitochondrial and nuclear marker systems allows cases of introgresssion to be identified, and, in
combination with behavioural information, allows us to distinguish between behavioural causes of
genetic structuring, such as female vs male philopatry. While our mitochondrial studies indicate that
C. pumilus s.l. from south eastern Africa and Tanzania, both members of the C. pumilus species
complex, might warrant description as new species of Chaerephon, such a description would need to
be based on both mitochondrial and nuclear markers. A search for suitably variable nuclear markers
may be a difficult one, as our preliminary studies indicate that nuclear intron markers tend to be less
informative than cytochrome b. Further, longer length sequence data needs to be obtained from type
material or topotypic material to further resolve the taxonomy of these clades. Studies based on
nuclear microsatellites would be useful to analyse the fine-scale distribution of genetic variation, and
gene flow amongst individuals within the C. pumilus species complex located across mainland Africa.
Ecological studies (i.e. echolocation and social calls, roosting behaviour, mate choice) will further
contribute to the understanding of the dynamics within the system. This in turn will lead to a better
understanding of the diversity of Chaerephon complex across Africa and the western Indian Ocean
islands.
259
REFERENCES
Avise, J.C. (2004). Molecular markers, natural history, and evolution, 2nd edition. Sinauer Associates, Sunderland, Massachusetts. Pp. 684. Bergl, R.A. and Vigilant, L. (2007). Genetic analysis reveals population structure and recent
migration within the highly fragmented range of the Cross River gorilla (Gorilla gorilla diehli).
Molecular Ecology 16: 501-516.
Flanders, J., Jones, G., Benda, P., Dietz, C., Zhang, S., Li, G., Sharifi, M. and Rossiter, S.J. (2009).
Phylogeography of the greater horseshoe bat, Rhinolophus ferrumequinum: Contrasting results
from mitochondrial and microsatellite data. Molecular Ecology 18: 306-318.
Goodman, S.M., Buccas, W., Naidoo, T., Ratrimomanarivo, F., Taylor, P.J. and Lamb, J. (2010).
Patterns of morphological and genetic variation in western Indian Ocean members of the
Chaerephon leucogaster/C. pumilus complex (Chiroptera: Molossidae) with the description of a
new species from Madagascar. Zootaxa 2551: 1-36.
Goodman, S.M., and Ratrimomanarivo, F. (2007). The taxonomic status of Chaerephon pumilus from
the western Seychelles: resurrection of the name C. pusillus for an endemic species. Acta
Chiropterologica 9: 391-399.
Lamb, J.M., Naidoo, T., Taylor, P.J., Napier, M., Ratrimomanarivo, F. and Goodman, S.M. (2012).
Genetically and geographically isolated lineages of a tropical bat (Chiroptera: Molossidae) show
demographic stability over the late Pleistocene. Biological Journal of the Linnean Society 106: 18-
40.
Ratrimomanarivo, F. H., Goodman, S. M., Hoosen, N., Taylor, P. J. and Lamb, J. (2008).
Morphological and molecular variation in Mops leucostigma (Chiroptera: Molossidae) of
Madagascar and the Comoros: Phylogeny, phylogeography and geographic variation.
Mitteilungen aus dem Hamburgischen Zoologischen Museum 105: 57-101.
Ratrimomanarivo, F. H., Goodman, S.M., Stanley, W., Naidoo, T., Taylor, P.J. and Lamb, J. (2009a).
Geographic and phylogeographic variation in Chaerephon leucogaster (Chiroptera: Molossidae) of
Madagascar and the western Indian Ocean islands of Mayotte and Pemba. Acta Chiropterologica
11:25-52.
Ratrimomanarivo, F.H., Goodman, S.M., Taylor, P.J., Bronwyn, M. and Lamb, J. (2009b).
Morphological and genetic variation in Mormopterus jugularis (Chiroptera: Molossidae) in
different bioclimatic regions of Madagascar with natural history notes. Mammalia 73: 110-129.
Taylor, P.J., Goodman, S.M., Schoeman, M.C., Ratrimomanarivo, F.H. and Lamb, J.M. (2012). Wing
loading correlates negatively with genetic structuring in eight species of Afro-Malagasy bats
(Molossidae). Acta Chiropterologica 14: 53-62.

260
Taylor, P.J., Lamb, J., Reddy, D., Naidoo, T., Ratrimomanarivo, F. and Goodman, S.M. (2009).
Cryptic lineages of little free-tailed bats, Chaerephon pumilus (Chiroptera: Molossidae) from
southern Africa and the western Indian Ocean islands. African Zoology 44: 55-70.
261
APPENDICES
Appendix1
RATRIMOMANARIVO, F.H., S.M. GOODMAN, W.T. STANLEY, T. NAIDOO, P.J. TAYLOR, and J. LAMB.
2009. Geographic and phylogeographic variation in Chaerephon leucogaster (Chiroptera:
Molossidae) of Madagascar and the western Indian Ocean islands of Mayotte and Pemba. Acta
Chiropterologica, 11: 25-52.
Appendix 2
TAYLOR, P.J., J. LAMB, D. REDDY, T. NAIDOO, F. RATRIMOMANARIVO, E. RICHARDSON, and S.M.
GOODMAN. 2009. Cryptic lineages of little free-tailed bats, Chaerephon pumilus (Chiroptera:
Molossidae) from southern Africa and the western Indian Ocean islands. African Zoology, 44: 55-
70.
Appendix 3
LAMB, J.M., T.M.C. RALPH, T. NAIDOO, P.J. TAYLOR, F. RATRIMOMANARIVO, W.T. STANLEY, and
S.M. GOODMAN. 2011. Toward a molecular phylogeny for the Molossidae (Chiroptera) of the
Afro-Malagasy region. Acta Chiropterologica, 13: 1-16.
Appendix 4
GOODMAN, S.M., W. BUCCAS, T. NAIDOO, F. RATRIMOMANARIVO, P.J. TAYLOR, and J.M. LAMB.
2010. Patterns of morphological and genetic variation in western Indian Ocean members of the
Chaerephon ‘pumilus’ complex (Chiroptera: Molossidae), with the description of a new species
from Madagascar. Zootaxa, 2551: 1-36.
Appendix 5
NAIDOO, T., A. MCDONALD, and J. LAMB. 2013. Cross-genus amplification and characterisation
of microsatellite loci in the little free tailed bat, Chaerephon pumilus s.l. (Molossidae)
from South Eastern Africa. African Journal of Biotechnology, 12: 3143-3147.

262
Appendix 6
LAMB, J.M., T. NAIDOO, P.J. TAYLOR, M. NAPIER, F. RATRIMOMANARIVO, and S.M. GOODMAN.
2012. Genetically and geographically isolated lineages of a tropical bat (Chiroptera: Molossidae)
show demographic stability over the late Pleistocene. Biological Journal of the Linnean Society,
106: 18-40.
BioOne sees sustainable scholarly publishing as an inherently collaborative enterprise connecting authors, nonprofit publishers, academic institutions,research libraries, and research funders in the common goal of maximizing access to critical research.
Geographic and Phylogeographic Variation in Chaerephon leucogaster(Chiroptera: Molossidae) of Madagascar and the Western Indian Ocean Islandsof Mayotte and PembaAuthor(s): Fanja H. Ratrimomanarivo, Steven M. Goodman, William T. Stanley, Theshnie Naidoo,Peter J. Taylor, and Jennifer LambSource: Acta Chiropterologica, 11(1):25-52. 2009.Published By: Museum and Institute of Zoology, Polish Academy of SciencesDOI: http://dx.doi.org/10.3161/150811009X465677URL: http://www.bioone.org/doi/full/10.3161/150811009X465677
BioOne (www.bioone.org) is a nonprofit, online aggregation of core research in the biological, ecological,and environmental sciences. BioOne provides a sustainable online platform for over 170 journals and bookspublished by nonprofit societies, associations, museums, institutions, and presses.
Your use of this PDF, the BioOne Web site, and all posted and associated content indicates your acceptance ofBioOne’s Terms of Use, available at www.bioone.org/page/terms_of_use.
Usage of BioOne content is strictly limited to personal, educational, and non-commercial use. Commercialinquiries or rights and permissions requests should be directed to the individual publisher as copyright holder.
INTRODUCTION
The islands of the western Indian Ocean are ex-cellent natural laboratories to examine the history ofover-water dispersal and the colonization of bats,because of their varying size and position with re-spect to continental Africa and Asia, and very differ-ent geological ages. Given that Madagascar hasbeen separated from the African mainland for170–155 million years (de Wit, 2003), which pre-dates the origin of Chiroptera estimated to be 71–58Mya (Teeling et al., 2005), there is little doubt thatthe modern bat fauna colonized this island over water. In contrast, the land masses making up the
Comoro Archipelago are in situ volcanic islands thatrange in age from 0.5 to 10–15 million years (Nou -gier et al., 1986); given the lack of land connectionssince their formation, over water colonization is theonly tangible explanation for the presence of bats onthese islands. There is some debate as to the historyof isolation of Pemba from mainland Africa, and estimates range from as early as the Miocene(roughly 10 million years BP) to as recently as thePleistocene (1 million years BP). Current ly, a deep-water channel of up to 800 m in depth separates theisland from the mainland (Pakenham, 1979), a sepa-ration thought to be tectonic in origin (Stockley,1942). Most species of Molossidae bats occurring
Acta Chiropterologica, 11(1): 25–52, 2009PL ISSN 1508-1109 © Museum and Institute of Zoology PAS
doi: 10.3161/150811009X465677
Geographic and phylogeographic variation in Chaerephon leucogaster(Chiroptera: Molossidae) of Madagascar and the western Indian Ocean islands
of Mayotte and Pemba
FANJA H. RATRIMOMANARIVO1, 2, STEVEN M. GOODMAN2, 3, 6, WILLIAM T. STANLEY3, THESHNIE NAIDOO4,PETER J. TAYLOR5, and JENNIFER LAMB4
1Département de Biologie Animale, Faculté des Sciences, Université d’Antananarivo, BP 906, Antananarivo (101), Madagascar2Vahatra, BP 3972, Antananarivo (101), Madagascar
3Field Museum of Natural History, 1400 South Lake Shore Drive, Chicago, Illinois 60605, USA4School of Biological and Conservation Sciences, George Campbell Building, University of Kwa-Zulu Natal,
King George V Avenue, Durban, Kwa-Zulu Natal 4041, South Africa 5Durban Natural Science Museum, P.O. Box 4085, Durban, Kwa-Zulu Natal 4000, South Africa
6Corresponding author: E- mail: [email protected]
We examine patterns of morphological and genetic variation in Chaerephon leucogaster (family Molossidae) on Madagascar,Mayotte in the Comoros Archipelago, and the offshore Tanzanian island of Pemba. Five external, 10 cranial, and eight dentalmeasurements of animals from different Malagasy populations (grouped according to bioclimatic regions) show differences in thedegree of sexual dimorphism and size variation. Further, the population on Mayotte is largely identical in size to those from westernMadagascar, and animals from Pemba are notably larger than those from Madagascar and Mayotte. Cytochrome b genetic distancesacross samples from these islands were low (maximum 0.0035) and animals from Pemba and Mayotte shared cytochrome bhaplotypes with Malagasy bats. D-loop data showed some concordance between haplotype distribution, geographical position(latitude and island), and the bioclimatic zones. Animals from Pemba and Mayotte formed a unique D-loop haplotype, which was a minimum of six mutational steps different from Malagasy haplotypes. Within Madagascar, certain haplotypes were exclusive tothe north (13ºS latitude band) and arid southwest (22º and 23ºS latitudes) regions. In general, there was no clear concordancebetween variation in haplotype distribution, latitude, altitude or gender. Where concordance occurred, the genetic distances involvedwere not sufficiently high to warrant the definition of new taxonomic units. Hence, based on current genetic information, patternsof morphological variation of the Madagascar populations and differences between Pemba and Mayotte/Madagascar are bestexplained as inter-population variation and may be adaptive, associated with different climatic regimes and associated ecologicalvariables.
Key words: Chaerephon leucogaster, geographic variation, genetic variation, Madagascar, Mayotte, Pemba
on Madagascar and other islands in the westernIndian Ocean are presumed to have African originsand to have dispersed to Madagascar across the Mo -zambique Channel (Ratrimomanarivo et al., 2007,2008; Lamb et al., 2008).
Amongst African molossids, the taxon with oneof the broadest distributions is Chaerephon leuco-gaster A. Grandidier, 1869. The taxonomic historyof this species is rather complex and a number of authors have placed it as a geographical form or synonym of C. pumilus (Cretzschmar, 1830) (e.g.,Hayman and Hill, 1971; Koopman, 1994). Simmons(2005) considers C. leucogaster to be a sep a rate spe -cies from C. pumilus. Recent phylogenetic work indicates that C. leucogaster is nested within a para-phyletic species complex of animals currently as-signed to C. pumilus (Taylor et al., 2009). Nu merousgeographical forms of C. leu cogaster have beennamed from sub-Saharan Africa and this species isreported along a broad band from the northwest(Mali), south to the west (Ghana), through portionsof the Congo Basin (Democratic Republic of Congo)to the central east (Ethiopia) (Dollman, 1908; Allen,1917; Hatt, 1928; Simmons, 2005). The type speci-men of the nominate form was collected on thewestern coast of Madagascar (Grandidier, 1869).The assertion of Hutson et al. (2001) that this spe cies is endemic to Madagascar is incorrect giventhe various geographical forms recognized from theAfrican continent.
Recent morphological and phylogeographicalanalyses of other molossid bat species or sister taxawith distributions shared between Madagascar andAfrica have revealed two distinct patterns. In thecase of Mops midas (Sundevall, 1843), for example,the African and Malagasy populations show no no-table morphological or genetic differences, and thisis best explained by a recent colonization of Mada -gascar or regular exchanges between these disjunctareas (Ratrimomanarivo et al., 2007). The secondpattern, as found in the species group composed ofMops condylurus (A. Smith, 1833) and Mops leuco -stigma G. M. Allen, 1918, is one where the Mal -agasy population is derived from African stock andhas been sufficiently isolated for speciation to havetaken place (Ratrimomanarivo et al., 2008). Further,distinct morphological differences in eastern andwest ern populations of M. leucostigma on Mada-gas car are not reflected in associated genetic analy-ses of the same specimen material; these animalsshow remarkably little haplotypic and genetic diver-sity, while displaying considerable phenotypic plas-ticity. In light of these previous regional studies on
molossids and the fact that considerable new mate-rial of C. leucogaster from Madagascar and other is-lands in the western Indian Ocean has recently beencollected, we investigate levels of morphologicaland genetic divergence between populations of thisspecies across the region to examine their evolution-ary history with regards to colonization and disper-sal. Insufficient material is currently available to expand this study to C. leucogaster from the Africanmainland.
MATERIALS AND METHODS
Specimens Used in the Current Study and Geo -graphic Classification
During the course of the past decade, numerous sites onMadagascar and other islands in the western Indian Ocean havebeen inventoried for bats, and new specimens of C. leucogasterhave been obtained (Fig. 1, Appendix I). This new material,generally with associated tissue samples, provides the means tostudy patterns of geographic variation in this species on westernIndian Ocean islands. The principal project on Madagascar re-sulting in new material has been a study by FHR of synanthrop-ic bat species along transects across the island, including twosurveys in a largely east-west direction across a notable eleva-tional and longitudinal gradient: (i) from Irondro (21°24’S,47°59’E) to Toliara (23°23’S, 43°43’E) along Route Nationals(RN) 25 and 7, (ii) from Brickaville (18°49’S, 49°04’E) toMahajanga (15°43’S, 46°19’E) along RN 2 and RN 4. Two tran-sects were conducted in a north-south direction across a negli-gible altitudinal gradient and notable latitudinal gradient: (i)from Fénérive Est (17°23’S, 49°25’E) to Brickaville along RN5, and (ii) from Irondro (21°24’S, 47°59’E) to Vangaindrano(23°21’S, 47°36’E) along RN 12. With the exception of onerecord in the east, all of the individuals of C. leucogaster foundduring these transects were limited to western lowland localities(sea-level to 230 m). Further, specimens were obtained by SMGin the region between Kirindy Mite (20°53’2’’S, 44°04’8’’E)and Toliara, across the elevational range of 10 to 90 m above sealevel. Specimens have also been examined from other locali-ties on the island (Fig. 1, Appendix I). Finally, during surveys of Ma yotte, part of the Comoros Archipelago (by SMG), and Pem ba, an offshore Tan zanian island (by WTS), other speci-mens referable to C. leucogaster with associated tissues werecollected.
These new specimens are deposited in the Field Museum ofNatural History (FMNH), Chicago and a portion of theMadagascar material in the Département de Biologie Animale,Université d’Antananarivo, Antananarivo. Further material ofC. leucogaster collected on Madagascar has been examined inthe Museum of Comparative Zoology (MCZ), Harvard Uni -versity; The Natural History Museum, London [formerly TheBritish Museum of Natural History (BMNH)]; and the MuséumNational d’Histoire Naturelle (MNHN), Paris.
In the context of the current study, specimens were group-ed into seven different Operational Taxonomic Units (OTUs).The basis of the OTU classification for Madagascar conforms to Cornet’s (1974) bioclimatic classification of the island and in each of these zones the natural forest cover is different
26 F. H. Ratrimomanarivo, S. M. Goodman, W. T. Stanley, T. Naidoo, P. J. Taylor, et al.
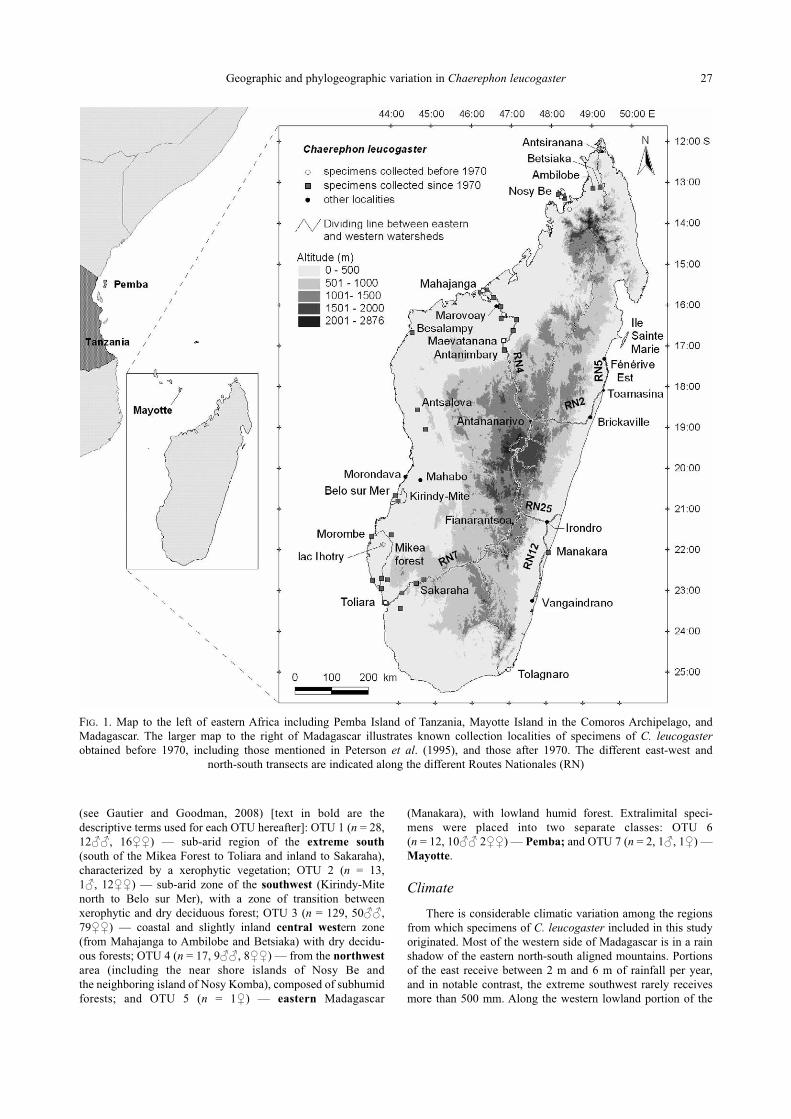
Geographic and phylogeographic variation in Chaerephon leucogaster 27
FIG. 1. Map to the left of eastern Africa including Pemba Island of Tanzania, Mayotte Island in the Comoros Archipelago, andMadagascar. The larger map to the right of Madagascar illustrates known collection localities of specimens of C. leucogasterobtained before 1970, including those mentioned in Peterson et al. (1995), and those after 1970. The different east-west and
north-south transects are indicated along the different Routes Nationales (RN)
(see Gautier and Goodman, 2008) [text in bold are the descriptive terms used for each OTU hereafter]: OTU 1 (n = 28,12♂♂, 16♀♀) — sub-arid region of the extreme south
(south of the Mikea Forest to Toliara and inland to Sakaraha),characterized by a xerophytic vegetation; OTU 2 (n = 13, 1♂, 12♀♀) — sub-arid zone of the southwest (Kirindy-Mitenorth to Belo sur Mer), with a zone of transition between xerophytic and dry deciduous forest; OTU 3 (n = 129, 50♂♂,79♀♀) — coastal and slightly inland central western zone(from Mahajanga to Ambilobe and Betsiaka) with dry decidu-ous forests; OTU 4 (n = 17, 9♂♂, 8♀♀) — from the northwest
area (including the near shore islands of Nosy Be and the neighboring island of Nosy Komba), composed of subhumidforests; and OTU 5 (n = 1♀) — eastern Madagascar
(Manakara), with lowland humid forest. Extralimital speci-mens were placed into two separate classes: OTU 6 (n = 12, 10♂♂ 2♀♀) — Pemba; and OTU 7 (n = 2, 1♂, 1♀) —Mayotte.
Climate
There is considerable climatic variation among the regionsfrom which specimens of C. leucogaster included in this studyoriginated. Most of the western side of Madagascar is in a rainshadow of the eastern north-south aligned mountains. Portionsof the east receive between 2 m and 6 m of rainfall per year, and in notable contrast, the extreme southwest rarely receives more than 500 mm. Along the western lowland portion of the
island there is increased annual rainfall following a cline fromthe extreme southwest to the northwest, with 554 mm at Be losur Mer, 780 mm at Morondava, 1,503 mm at Mahajanga, 2,193mm at Nosy Be, and 1,892 mm at Ambilobe (Donque, 1975;Chaperon et al., 1993). On Mayotte, in the zone the specimenswere collected, annual rainfall approaches 2,000 mm (Louette,1999), and on Pemba, meteorological records indicate approxi-mately 1,850 mm precipitation per year (Pakenham, 1979).
Morphological Study
From these specimens, five external measurements were taken by FHR, SMG, and WTS using a millimeter ruler, with a precision to 0.5 mm, and include: total length, tail length, hindfoot length (excluding claws, with the exception of specimensfrom Pemba), ear length, and forearm length. Body mass ingrams was also recorded with a spring balance at an accuracy of0.5 g. Herein we have only presented external measurements taken by these three collectors. The mass measurements of females in an advanced state of pregnancy were not used in thedescriptive statistics or various analyses. Only adults have beenused in the morphological analyses, defined as individuals forwhom the third molar has completely erupted and the basi-occipital-basisphenoid suture is ossified.
A series of measurements, derived largely from Freeman(1981), were made by FHR using digital calipers, accurate to the nearest 0.1 mm and include Cranial and MandibularMeasurements — GSL: greatest skull length, from posterior-most part of occipital condyle to anterior-most point of premaxillary bone; CON INCI: condyloincisive length, fromoccipital condyle to anterior-most point of incisors; ZYGO BR:greatest zygomatic breadth, width taken across zygomaticarches at the widest point; POST ORB: postorbital width, dorsal width at most constricted part of skull; MASTOID:breadth at mastoids, greatest breadth across skull at mastoidprocesses; PALATE: palatal length, from posterior border ofhard palate (not including post-palatal projection) to anterioredge of premaxillary bone; LACR WID: lacrimal width, width across rostrum dorsally at lacrimal protuberances; CONCANI: condylocanine length, from midpoint of mandibularcondyle to anterior border of alveolus of lower canine; MOM1 COR: moment arm of temporal, length from middle ofcondyle to tip of coronoid process; MOM2 ANG: moment armof masseter, length from middle of condyle to tip of angular process; and Dental Measurements — C1–C1: anterior palatalwidth, taken across the outer alveolar borders of the upper canines; M3–M3: posterior palatal width, taken across the outer alveolar borders of the third upper molars; UP MOL R:upper molariform row, length from PM2 to M3 (alveolar); MTR: maxillary toothrow, length from anterior alveolar borderof canine to posterior alveolar border of M3; UP CANIN: height upper canine, greatest length from point immediatelydorsal to cingulum to end of tooth; M3 WIDTH: width of M3,greatest lateral-medial width of tooth; LOWER TR: lower too-throw, length from posterior alveolar border of m3 to alveolarborder of c1; and LO CANIN: height lower canine, greatestlength from point immediately ventral to cingulum to end oftooth.
Statistical Analyses
In order to study patterns of latitudinal and elevational gra-dients in C. leucogaster, the statistical procedures within the
program STATISTICA AX (version 7.0) were utilized for allunivariate and multivariate analyses. Firstly, t-test comparisonswere employed to assess patterns of sexual dimorphism with-in and among OTUs. Subsequently, Analysis of Variance (ANOVA) was employed, using post-hoc Scheffé tests, to assessmorphological differences among the OTUs. In the results section, for Scheffé tests only probability values are presented,whereas for one-way ANOVA the various statistical parametersare provided. Principal Component Ana lysis (PCA), with non-log-transformed data and a correlation matrix, was used to further differentiate populations (OTUs) in three-dimensionalspace. Finally, regression analyses were conducted that utilizedthe principal component scores from the different PCAs foreach of the three different types of measurements (external, cranial, and dental) compared to different geographic variables (altitude and latitude). On the basis of an ecomorphologicalstudy of Malagasy bats (Ranivo and Goodman, 2007), cra-nial and dental variables do not always show clear patterns of covariance and herein these two variable types are presented separately.
Grandidier’s Type Specimen of Chaerephon leuco-gaster
In Grandidier’s (1869) description of Nyctinomus leuco-gaster, which is the nominate form of this taxon that was subse-quently transferred to the genus Chaerephon Dobson, 1874, thetype specimen was from the Menabe Region of western Mada -gascar; the lowland area centered around Morondava (Fig. 1). Itwas collected in 1869 at a site given as ‘Mahab’, which is mostlikely Mahabo (20°23’S, 44°40’E, about 50 m above sea level),47 km east of Morondava. A footnote to the published speciesdescription (p. 337), ‘Cette note est datée de Ménabé, 15 mai1869’, would indicate that the ms. had been sent from the fieldand the type specimen had not yet been deposited in a museum.We have extensively examined, to no avail, the collections ofthe MCZ and MNHN for this specific specimen, as both of theseinstitutions hold Grandidier types of Malagasy bats (Rode,1941; Helgen and McFadden, 2001).
The only specimen possibly fitting the details of the Gran -didier type is MCZ 45094, which is in poor condition and the original specimen label bears the following informa-tion: ‘Cote Ouest’ [= west coast], ‘Nyctinomus pumelus [sic]’,‘collection Grandidier’, and ‘1901’. Based on numerous charac-ters, including aspects of external, cranial, and dental meas-urements as well as pelage and soft part coloration, this animalis referable to C. leucogaster. However, the collection detailsare too ambiguous to clearly conclude that this specimen can beconsidered the type of C. leucogaster described by Grandidier(1869) and, further, the skull is considerably damaged.
In order to have a point of reference on what is a morpho-logical representative of C. leucogaster from Madagascar, we designate here a neotype (FMNH 176137), which was collected in the Menabe Region of western coastal Madagascar,specifically at Belo sur Mer (20°44.139’S, 44°00.266’E) at 10 m above sea level on 11 November 2002 by Vola Raza -karivony. This site is approximately 80 km southwest ofMahabo. The animal is an adult male, the body was preserved informalin and subsequently transferred to 70% ethanol, the skull has been extracted, cleaned, and is in excellent condi-tion. The designated neotype of C. leucogaster closely matchesthe diagnostic characters outlined in the original description ofGrandidier (1869: 337), which include [our translation]: dorsal
28 F. H. Ratrimomanarivo, S. M. Goodman, W. T. Stanley, T. Naidoo, P. J. Taylor, et al.
pelage, throat, and chest dark brown; central portion of wingmembranes white; lips, particularly upper, notably wrinkled andprominent; and the ears are large and attached at their base, aswell as certain of his measurements, including total length of 80 mm; ear length of 14 mm, and tail length of 30 mm.
Molecular Study
Our objectives with the genetic analyses were to evaluate (i) the distinctiveness of C. leucogaster from other regionalmembers of this genus; (ii) the phylogeographic relation-ships among different populations of this species on Mada -gascar; and (iii) the distinctiveness of recently discovered pop-ulations of C. leucogaster on Mayotte and Pemba. Genetic vari-ation in Chaerephon spp. was investigated using mitochondrialcyto chrome b (n = 39) and D-loop (n = 71) sequencing. Samplesof C. leucogaster were obtained from numerous localities onMadagascar, as well as Mayotte and Pemba (Appendix I). Othersamples, used as outgroups, included Mops leucostigma, M. mi -das, and C. pu milus from Madagascar (Appendix I).
Total genomic DNA was extracted from tissues preserved in80% ethanol or EDTA using a DNeasy® DNA isolation kit(Qiagen, Cape Town) and stored in the elution buffer provided.The cytochrome b gene was amplified as two overlapping double stranded fragments (Saiki et al., 1988). The 5’ fragmentwas amplified with primers L 14723 (5’-ACCAATGCA ATGAAAAATCATCGTT-3’) and H 15553 (5’-TAGGCAAATAGGAAATATCATTCTGGT-3’), whilst the 3’ fragment wasamplified using L15146 (5’-CATGAGGACAAATATCATTCTGAG-3’) and H15915 (5’-TCTCCATTTCTGGTTTACAAGAC-3’) (Irwin et al., 1991).
Polymerase Chain Reaction (PCR)-amplifications were per-formed in 25 μl reaction volumes each consisting of 9 μl genomic DNA solution (containing 30 ng DNA), 0.8 μl sterilewater, 2.5 μl 10 x reaction buffer (Super-Therm), 4 μl MgCl2(25 mM) (Super-Therm), 0.5 μl dNTP mix (10 mM) (RocheDiagnostics), 0.2 μl Taq polymerase (5 U/μl) (Super-Therm)and 4 μl each of forward and reverse primer (6 μM). Thermalcycling parameters consisted of an initial denaturation step at94°C for 4 min, followed by 36 cycles of denaturation at 94°Cfor 60 s, annealing at 50°C for 90 s, extension at 72°C for 2 min,and a final extension step at 72°C for 10 min.
The D-loop region was PCR-amplified as a single fragmentusing primers P (5’-TCCTACCATCAGCACCCAAAGC-3’)and F (5’-GTTGCTGGTTTCACGGAGGTAG-3’) (Wilkinsonand Chapman, 1991). Where samples failed to amplify usingthis primer set, primer set P and E (5’-CCTGAAGTAGGAACCAGATG-3’) were used, as F is nested within E (Wil kinsonand Chapman, 1991). PCR-amplifications were performed in 25 µl reaction volumes, in the manner described above. Thermalcycling parameters consisted of initial denaturation at 95°C for60 s, followed by 40 cycles of denaturation at 95°C for 60 s, annealing at 55°C for 90 s, extension 72°C for 2 minutes, and a final extension step at 72°C for 7 min.
For both cytochrome b and D-loop amplifications, tar-get fragments were purified from excised gel bands using a QIAquick® Gel Extraction Kit (Qiagen Inc.). Purified DNAfragments were sequenced in the forward and reverse directionsusing the primers used for the initial amplifications. Sequencingwas performed by Inqaba Biotechnical Industries Pty. Ltd.,South Africa.
Electropherograms of the sequences generated wereinspect ed with Chromas software (version 1.45; Technelysium
Pty. Ltd., Helensvale, Queensland, Australia). Sequence align-ments were generated with BioEdit (Version 5.0.9 for Windows95/98/NT) and its accessory CLUSTAL W alignment applica-tion (Thompson et al., 1994) and corrected manually by visualinspection for alignment errors. Sequences were trimmed to a common length of 863 bp for the cytochrome b gene and 338 bp for the D-loop.
Haplotype analysis of both the cytochrome b and D-loopdatasets was carried out using the program DnaSP4.10 (Rozaset al., 2003). Modeltest (Posada and Crandall, 1998) was usedto select the model of nucleotide substitution which best fitseach sequence dataset. The model selected for cytochrome bdataset was the HKY+I+G model, whilst the GTR model wasselected for the D-loop dataset. These models were used as ap-propriate in further distance, neighbor-joining, and Bayesiananalyses.
Bayesian analysis was implemented in Mr Bayes version3.0. Four Markov chains were run for 15 million generationseach, and the first 500 000 trees discarded as burn-in. The pri-ors for the five active parameters were: transition/transversionratio — Beta (1.00, 1.00), state frequency — dirichlet (1, 1, 1, 1), proportion of invariant sites — uniform (0.00, 1.00),topology — all topologies equally probable a priori, and branchlengths — branch lengths are unconstrained: exponential (10.0).
PAUP 4.0b10 for Macintosh (Swofford, 2002) was used toestimate nucleotide divergence and create neighbor-joining andmaximum parsimony trees. For parsimony analysis, we used the random additions sequence option (n = 100) for discrete, unordered characters. The shortest tree was searched for withthe heuristic search option using the tree bisection-reconnection(TBR) branch swapping option. The degree of character supportfor each node of the resulting tree was estimated by using boot-strap re-sampling analysis (Felsenstein, 1985; Felsenstein andKishino, 1993; Hillis and Bull, 1993). Statistical parsimonyhaplotype networks were calculated for both the cytochrome band D-loop using TCS v.1.21 (Clement et al., 2000).
Inferences of significant phylogeographic concordancewithin the Malagasy samples, based on D-loop sequences, werecreated using Nested Clade Phylogeographic Analysis imple-mented with the automated method of Panchal (2007). This uti-lizes the programs TCS (Clement et al., 2000) for estimatinggene genealogies by creating haplotype networks using the cri-teria of statistical parsimony and GeoDis (Posada et al., 2000)for the cladistic nested analysis of the geographical distributionof the genetic haplotypes in the network. An exact permutation-al contingency test is performed for any clade at each nestinglevel. A chi-square statistic is calculated from the contingencytables in which rows are genetic clades and columns are geo-graphical locations. Clades containing significant chi-squarevalues are interpreted using Templeton’s inference key (version:11 November 2005). Loops in the haplotype network were re-solved as suggested by Panchal (2007) by following the steps ofMardulyn (2001) using the criteria suggested by Crandall andTempleton (1993).
Ecological Niche Model Using MaxEnt
There are many problems inherent in using presence-onlydata (such as museum records) for estimating the predicted dis-tributions of species, and alternative models have been devel-oped and compared. The MaxEnt (Maximum Entropy) method(Phillips et al., 2006) that employs a general machine learningalgorithm, has been shown to perform well with presence-only
Geographic and phylogeographic variation in Chaerephon leucogaster 29
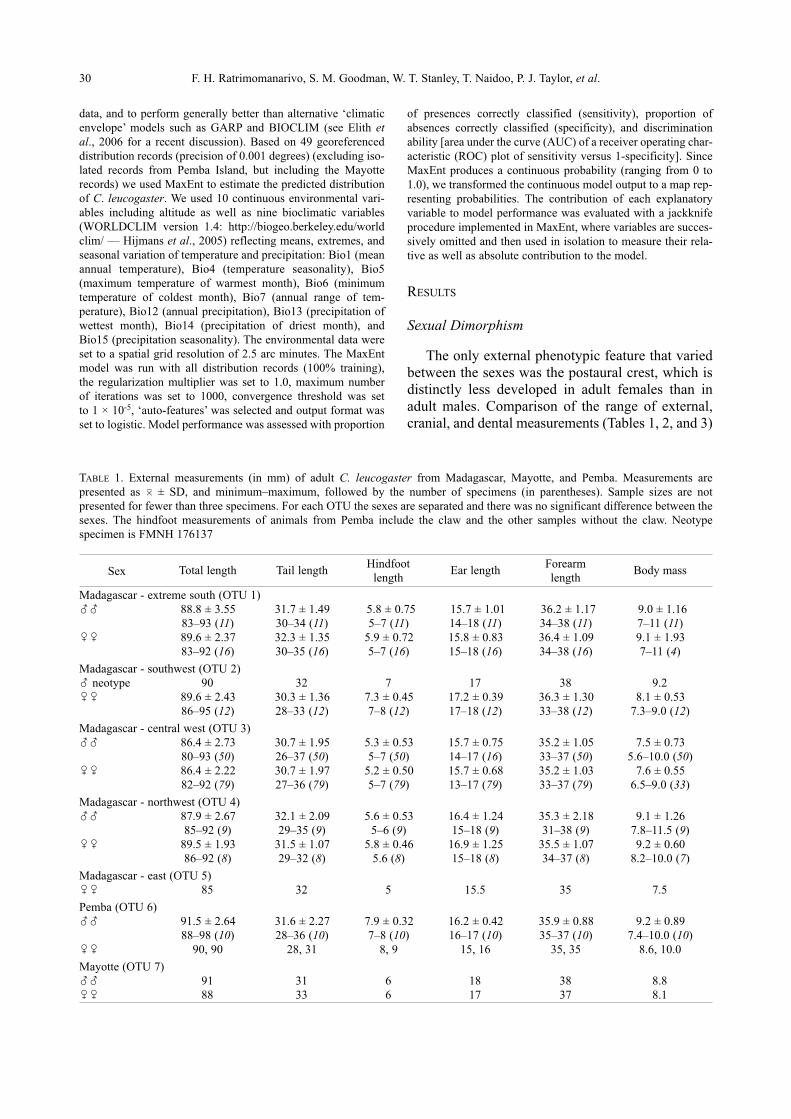
data, and to perform generally better than alternative ‘climaticenvelope’ models such as GARP and BIOCLIM (see Elith et al., 2006 for a recent discussion). Based on 49 georeferenceddistribution records (precision of 0.001 degrees) (excluding iso-lated records from Pemba Island, but including the Mayotterecords) we used MaxEnt to estimate the predicted distributionof C. leucogaster. We used 10 continuous environmental vari-ables including altitude as well as nine bioclimatic variables(WORLD CLIM version 1.4: http://biogeo.berkeley.edu/worldclim/ — Hijmans et al., 2005) reflecting means, extremes, andseasonal variation of temperature and precipitation: Bio1 (meanannual temperature), Bio4 (temperature seasonality), Bio5(maximum temperature of warmest month), Bio6 (minimumtemperature of coldest month), Bio7 (annual range of tem-perature), Bio12 (annual precipitation), Bio13 (precipitation ofwettest month), Bio14 (precipitation of driest month), andBio15 (precipitation seasonality). The environmental data wereset to a spatial grid resolution of 2.5 arc minutes. The MaxEntmodel was run with all distribution records (100% training), the regularization multiplier was set to 1.0, maximum number of iterations was set to 1000, convergence threshold was set to 1 × 10⁻⁵, ‘auto-features’ was selected and output format wasset to logistic. Model performance was assessed with proportion
of presences correctly classified (sensitivity), proportion of absences correctly classified (specificity), and discriminationability [area under the curve (AUC) of a receiver operating char-acteristic (ROC) plot of sensitivity versus 1-specificity]. SinceMaxEnt produces a continuous probability (ranging from 0 to1.0), we transformed the continuous model output to a map rep-resenting probabilities. The contribution of each explanatoryvar iable to model performance was evaluated with a jack knifepro cedure implemented in MaxEnt, where variables are succes-sively omitted and then used in isolation to measure their rela-tive as well as absolute contribution to the model.
RESULTS
Sexual Dimorphism
The only external phenotypic feature that variedbetween the sexes was the postaural crest, which isdistinctly less developed in adult females than inadult males. Comparison of the range of external,cranial, and dental measurements (Tables 1, 2, and 3)
30 F. H. Ratrimomanarivo, S. M. Goodman, W. T. Stanley, T. Naidoo, P. J. Taylor, et al.
TABLE 1. External measurements (in mm) of adult C. leucogaster from Madagascar, Mayotte, and Pemba. Measurements arepresented as 0 ± SD, and minimum–maximum, followed by the number of specimens (in parentheses). Sample sizes are notpresented for fewer than three specimens. For each OTU the sexes are separated and there was no significant difference between thesexes. The hindfoot measurements of animals from Pemba include the claw and the other samples without the claw. Neotypespecimen is FMNH 176137
Total length Tail lengthHindfoot
Ear lengthForearm
Body massSexlength length
Madagascar - extreme south (OTU 1)YY 88.8 ± 3.55 31.7 ± 1.49 5.8 ± 0.75 15.7 ± 1.01 36.2 ± 1.17 9.0 ± 1.16
83–93 (11) 30–34 (11) 5–7 (11) 14–18 (11) 34–38 (11) 7–11 (11)XX 89.6 ± 2.37 32.3 ± 1.35 5.9 ± 0.72 15.8 ± 0.83 36.4 ± 1.09 9.1 ± 1.93
83–92 (16) 30–35 (16) 5–7 (16) 15–18 (16) 34–38 (16) 7–11 (4)
Madagascar - southwest (OTU 2)Y neotype 90 32 7 17 38 9.2XX 89.6 ± 2.43 30.3 ± 1.36 7.3 ± 0.45 17.2 ± 0.39 36.3 ± 1.30 8.1 ± 0.53
86–95 (12) 28–33 (12) 7–8 (12) 17–18 (12) 33–38 (12) 7.3–9.0 (12)
Madagascar - central west (OTU 3)YY 86.4 ± 2.73 30.7 ± 1.95 5.3 ± 0.53 15.7 ± 0.75 35.2 ± 1.05 7.5 ± 0.73
80–93 (50) 26–37 (50) 5–7 (50) 14–17 (16) 33–37 (50) 5.6–10.0 (50)XX 86.4 ± 2.22 30.7 ± 1.97 5.2 ± 0.50 15.7 ± 0.68 35.2 ± 1.03 7.6 ± 0.55
82–92 (79) 27–36 (79) 5–7 (79) 13–17 (79) 33–37 (79) 6.5–9.0 (33)
Madagascar - northwest (OTU 4)YY 87.9 ± 2.67 32.1 ± 2.09 5.6 ± 0.53 16.4 ± 1.24 35.3 ± 2.18 9.1 ± 1.26
85–92 (9) 29–35 (9) 5–6 (9) 15–18 (9) 31–38 (9) 7.8–11.5 (9)XX 89.5 ± 1.93 31.5 ± 1.07 5.8 ± 0.46 16.9 ± 1.25 35.5 ± 1.07 9.2 ± 0.60
86–92 (8) 29–32 (8) 5.6 (8) 15–18 (8) 34–37 (8) 8.2–10.0 (7)
Madagascar - east (OTU 5)XX 85 32 5 15.5 35 7.5
Pemba (OTU 6)YY 91.5 ± 2.64 31.6 ± 2.27 7.9 ± 0.32 16.2 ± 0.42 35.9 ± 0.88 9.2 ± 0.89
88–98 (10) 28–36 (10) 7–8 (10) 16–17 (10) 35–37 (10) 7.4–10.0 (10)XX 90, 90 28, 31 8, 9 15, 16 35, 35 8.6, 10.0
Mayotte (OTU 7)YY 91 31 6 18 38 8.8XX 88 33 6 17 37 8.1
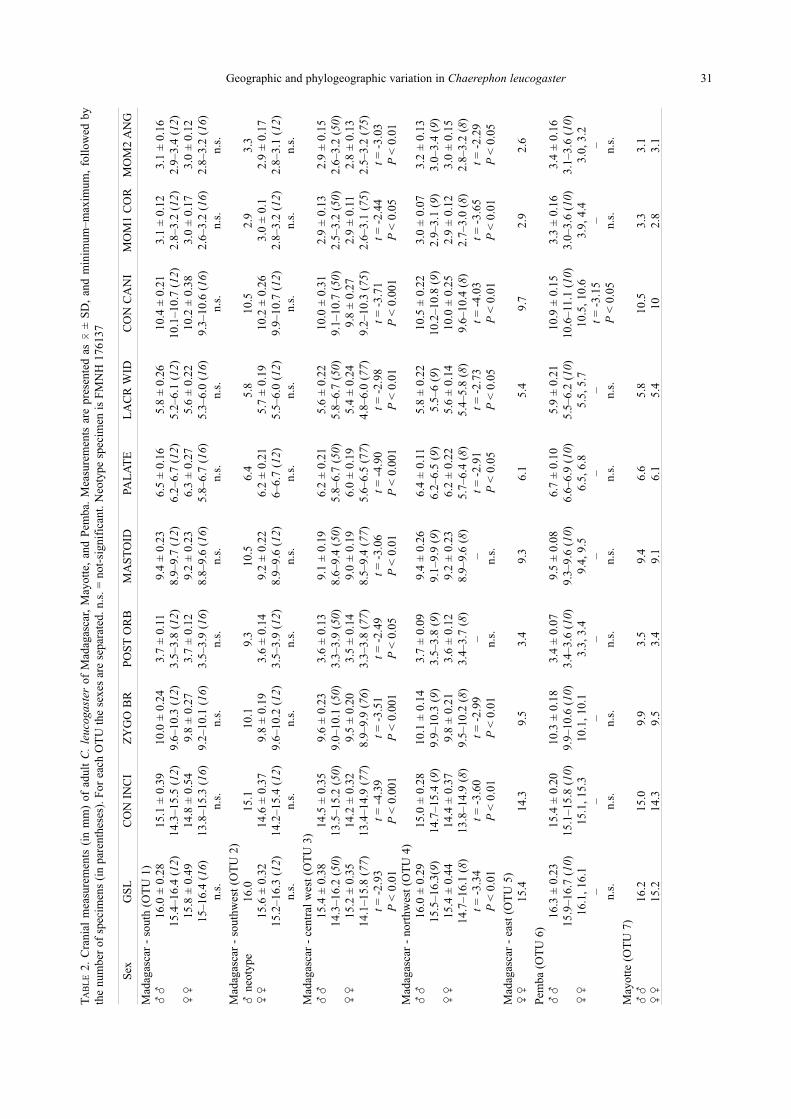
Geographic and phylogeographic variation in Chaerephon leucogaster 31T
AB
LE
2. C
rani
al m
easu
rem
ents
(in
mm
) of
adu
lt C
. leu
coga
ster
of M
adag
asca
r, M
ayot
te,
and
Pem
ba.
Mea
sure
men
ts a
re p
rese
nted
as 0
± S
D,
and
min
imum
–max
imum
, fo
llow
ed b
y th
e nu
mbe
r of
spe
cim
ens
(in
pare
nthe
ses)
. For
eac
h O
TU
the
sex
es a
re s
epar
ated
. n.s
. = n
ot-s
igni
fica
nt. N
eoty
pe s
peci
men
is
FM
NH
176
137
Sex
GS
LC
ON
IN
CI
ZY
GO
BR
PO
ST
OR
BM
AS
TO
IDPA
LA
TE
LA
CR
WID
CO
N C
AN
IM
OM
1 C
OR
MO
M2
AN
G
Mad
agas
car
- so
uth
(OT
U 1
)Y
Y16
.0 ±
0.2
815
.1 ±
0.3
910
.0 ±
0.2
43.
7 ±
0.1
19.
4 ±
0.2
36.
5 ±
0.1
65.
8 ±
0.2
610
.4 ±
0.2
13.
1 ±
0.1
23.
1 ±
0.1
615
.4–1
6.4
(12)
14.3
–15.
5 (1
2)9.
6–10
.3 (
12)
3.5–
3.8
(12)
8.9–
9.7
(12)
6.2–
6.7
(12)
5.2–
6.1
(12)
10.1
–10.
7 (1
2)2.
8–3.
2 (1
2)
2.9–
3.4
(12)
XX
15.8
± 0
.49
14.8
± 0
.54
9.8
± 0
.27
3.7
± 0
.12
9.2
± 0
.23
6.3
± 0
.27
5.6
± 0
.22
10.2
± 0
.38
3.0
± 0
.17
3.0
± 0
.12
15–1
6.4
(16)
13.8
–15.
3 (1
6)9.
2–10
.1 (
16)
3.5–
3.9
(16)
8.8–
9.6
(16)
5.8–
6.7
(16)
5.3–
6.0
(16)
9.3–
10.6
(16
)2.
6–3.
2 (1
6)2.
8–3.
2 (1
6)n.
s.n.
s.n.
s.n.
s.n.
s.n.
s.n.
s.n.
s.n.
s.n.
s.
Mad
agas
car
- so
uthw
est
(OT
U 2
)Y
neo
type
16
.015
.110
.19.
310
.56.
45.
810
.52.
93.
3X
X15
.6 ±
0.3
214
.6 ±
0.3
79.
8 ±
0.1
93.
6 ±
0.1
49.
2 ±
0.2
26.
2 ±
0.2
15.
7 ±
0.1
910
.2 ±
0.2
63.
0 ±
0.1
2.9
± 0
.17
15.2
–16.
3 (1
2)14
.2–1
5.4
(12)
9.6–
10.2
(12
)3.
5–3.
9 (1
2)8.
9–9.
6 (1
2)6–
6.7
(12)
5.
5–6.
0 (1
2)9.
9–10
.7 (
12)
2.8–
3.2
(12)
2.
8–3.
1 (1
2)
n.s.
n.s.
n.s.
n.s.
n.s.
n.s.
n.s.
n.s.
n.s.
n.s.
Mad
agas
car
- ce
ntra
l w
est
(OT
U 3
)Y
Y15
.4 ±
0.3
814
.5 ±
0.3
59.
6 ±
0.2
33.
6 ±
0.1
39.
1 ±
0.1
96.
2 ±
0.2
15.
6 ±
0.2
210
.0 ±
0.3
12.
9 ±
0.1
32.
9 ±
0.1
514
.3–1
6.2
(50)
13.5
–15.
2 (5
0)9.
0–10
.1 (
50)
3.3–
3.9
(50)
8.6–
9.4
(50)
5.8–
6.7
(50)
5.
8–6.
7 (5
0)9.
1–10
.7 (
50)
2.5–
3.2
(50)
2.6–
3.2
(50)
X
X15
.2 ±
0.3
514
.2 ±
0.3
29.
5 ±
0.2
03.
5 ±
0.1
49.
0 ±
0.1
96.
0 ±
0.1
95.
4 ±
0.2
49.
8 ±
0.2
72.
9 ±
0.1
12.
8 ±
0.1
314
.1–1
5.8
(77)
13.4
–14.
9 (7
7)8.
9–9.
9 (7
6)3.
3–3.
8 (7
7)8.
5–9.
4 (7
7)5.
6–6.
5 (7
7)4.
8–6.
0 (7
7)
9.2–
10.3
(75
) 2.
6–3.
1 (7
5)
2.5–
3.2
(75)
t =
-2.
93t =
-4.
39t =
-3.
51t =
-2.
49t =
-3.
06t =
-4.
90t =
-2.
98t =
-3.
71t =
-2.
44t =
-3.
03P
< 0
.01
P <
0.0
01P
< 0
.001
P <
0.0
5P
< 0
.01
P <
0.0
01P
< 0
.01
P <
0.0
01P
< 0
.05
P <
0.0
1M
adag
asca
r -
nort
hwes
t (O
TU
4)
YY
16.0
± 0
.29
15.0
± 0
.28
10.1
± 0
.14
3.7
± 0
.09
9.4
± 0
.26
6.4
± 0
.11
5.8
± 0
.22
10.5
± 0
.22
3.0
± 0
.07
3.2
± 0
.13
15.5
–16.
3(9)
14.7
–15.
4 (9
)9.
9–10
.3 (
9)3.
5–3.
8 (9
)9.
1–9.
9 (9
)6.
2–6.
5 (9
) 5.
5–6
(9)
10.2
–10.
8 (9
) 2.
9–3.
1 (9
) 3.
0–3.
4 (9
) X
X15
.4 ±
0.4
414
.4 ±
0.3
79.
8 ±
0.2
13.
6 ±
0.1
29.
2 ±
0.2
36.
2 ±
0.2
25.
6 ±
0.1
410
.0 ±
0.2
52.
9 ±
0.1
23.
0 ±
0.1
514
.7–1
6.1
(8)
13.8
–14.
9 (8
)9.
5–10
.2 (
8)3.
4–3.
7 (8
)8.
9–9.
6 (8
)5.
7–6.
4 (8
) 5.
4–5.
8 (8
) 9.
6–10
.4 (
8)
2.7–
3.0
(8)
2.8–
3.2
(8)
t = -
3.34
t = -
3.60
t = -
2.99
––
t = -
2.91
t = -
2.73
t = -
4.03
t = -
3.65
t = -
2.29
P <
0.0
1P
< 0
.01
P <
0.0
1n.
s.
n.s.
P <
0.0
5P
< 0
.05
P <
0.0
1P
< 0
.01
P <
0.0
5
Mad
agas
car
- ea
st (
OT
U 5
)X
X15
.414
.39.
53.
49.
36.
15.
49.
72.
92.
6
Pem
ba (
OT
U 6
)Y
Y16
.3 ±
0.2
315
.4 ±
0.2
010
.3 ±
0.1
83.
4 ±
0.0
79.
5 ±
0.0
86.
7 ±
0.1
05.
9 ±
0.2
110
.9 ±
0.1
53.
3 ±
0.1
63.
4 ±
0.1
615
.9–1
6.7
(10)
15.1
–15.
8 (1
0)
9.9–
10.6
(10
)3.
4–3.
6 (1
0)9.
3–9.
6 (1
0)6.
6–6.
9 (1
0)5.
5–6.
2 (1
0)10
.6–1
1.1
(10)
3.0–
3.6
(10)
3.1–
3.6
(10)
XX
16.1
, 16.
115
.1, 1
5.3
10.1
, 10.
13.
3, 3
.49.
4, 9
.56.
5, 6
.85.
5, 5
.710
.5, 1
0.6
3.9,
4.4
3.0,
3.2
––
––
––
–t =
-3.
15–
–n.
s.n.
s.n.
s.n.
s.n.
s.n.
s.n.
s.P
< 0
.05
n.s.
n.s.
May
otte
(O
TU
7)
YY
16.2
15.0
9.9
3.5
9.4
6.6
5.8
10.5
3.3
3.1
XX
15.2
14.3
9.5
3.4
9.1
6.1
5.4
102.
83.
1
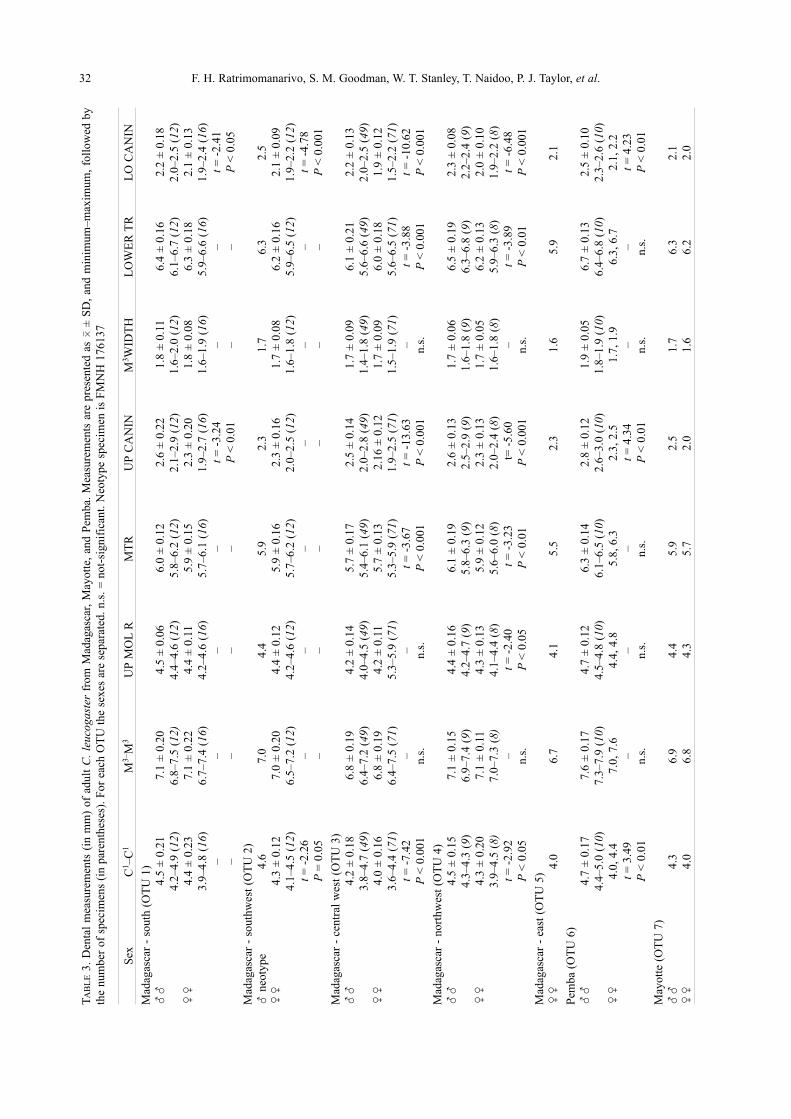
32 F. H. Ratrimomanarivo, S. M. Goodman, W. T. Stanley, T. Naidoo, P. J. Taylor, et al.T
AB
LE
3. D
enta
l m
easu
rem
ents
(in
mm
) of
adu
lt C
. leu
coga
ster
from
Mad
agas
car,
May
otte
, an
d P
emba
. M
easu
rem
ents
are
pre
sent
ed a
s 0
± S
D,
and
min
imum
–max
imum
, fo
llow
ed b
y th
e nu
mbe
r of
spe
cim
ens
(in
pare
nthe
ses)
. For
eac
h O
TU
the
sex
es a
re s
epar
ated
. n.s
. = n
ot-s
igni
fica
nt. N
eoty
pe s
peci
men
is
FM
NH
176
137
Sex
C1 –
C1
M3–
M3
UP
MO
L R
MT
RU
PC
AN
INM
3 WID
TH
LO
WE
R T
RL
O C
AN
IN
Mad
agas
car
- so
uth
(OT
U 1
)Y
Y4.
5 ±
0.2
17.
1 ±
0.2
04.
5 ±
0.0
66.
0 ±
0.1
22.
6 ±
0.2
21.
8 ±
0.1
16.
4 ±
0.1
62.
2 ±
0.1
84.
2–4.
9 (1
2)6.
8–7.
5 (1
2)4.
4–4.
6 (1
2)5.
8–6.
2 (1
2)2.
1–2.
9 (1
2)1.
6–2.
0 (1
2)6.
1–6.
7 (1
2)2.
0–2.
5 (1
2)
XX
4.4
± 0
.23
7.1
± 0
.22
4.4
± 0
.11
5.9
± 0
.15
2.3
± 0
.20
1.8
± 0
.08
6.3
± 0
.18
2.1
± 0
.13
3.9–
4.8
(16)
6.7–
7.4
(16)
4.2–
4.6
(16)
5.7–
6.1
(16)
1.9–
2.7
(16)
1.
6–1.
9 (1
6)5.
9–6.
6 (1
6)1.
9–2.
4 (1
6)
––
––
t = -
3.24
––
t = -
2.41
––
––
P <
0.0
1–
–P
< 0
.05
Mad
agas
car
- so
uthw
est
(OT
U 2
)Y
neot
ype
4.6
7.0
4.4
5.9
2.3
1.7
6.3
2.5
XX
4.3
± 0
.12
7.0
± 0
.20
4.4
± 0
.12
5.9
± 0
.16
2.3
± 0
.16
1.7
± 0
.08
6.2
± 0
.16
2.1
± 0
.09
4.1–
4.5
(12)
6.5–
7.2
(12)
4.2–
4.6
(12)
5.
7–6.
2 (1
2)2.
0–2.
5 (1
2)1.
6–1.
8 (1
2)5.
9–6.
5 (1
2)1.
9–2.
2 (1
2)t =
-2.
26–
––
––
–t =
-4.
78P
= 0
.05
––
––
––
P <
0.0
01
Mad
agas
car
- ce
ntra
l w
est
(OT
U 3
)Y
Y4.
2 ±
0.1
86.
8 ±
0.1
94.
2 ±
0.1
45.
7 ±
0.1
72.
5 ±
0.1
41.
7 ±
0.0
96.
1 ±
0.2
12.
2 ±
0.1
33.
8–4.
7 (4
9)6.
4–7.
2 (4
9)4.
0–4.
5 (4
9)5.
4–6.
1 (4
9)2.
0–2.
8 (4
9)1.
4–1.
8 (4
9)5.
6–6.
6 (4
9)2.
0–2.
5 (4
9)
XX
4.0
± 0
.16
6.8
± 0
.19
4.2
± 0
.11
5.7
± 0
.13
2.16
± 0
.12
1.7
± 0
.09
6.0
± 0
.18
1.9
± 0
.12
3.6–
4.4
(71)
6.4–
7.5
(71)
5.3–
5.9
(71)
5.3–
5.9
(71)
1.9–
2.5
(71)
1.5–
1.9
(71)
5.6–
6.5
(71)
1.5–
2.2
(71)
t =
-7.
42–
–t =
-3.
67t =
-13
.63
–t =
-3.
88t =
-10
.62
P <
0.0
01n.
s.n.
s.P
< 0
.001
P <
0.0
01n.
s.P
< 0
.001
P <
0.0
01
Mad
agas
car
- no
rthw
est
(OT
U 4
)Y
Y4.
5 ±
0.1
57.
1 ±
0.1
54.
4 ±
0.1
66.
1 ±
0.1
92.
6 ±
0.1
31.
7 ±
0.0
66.
5 ±
0.1
92.
3 ±
0.0
84.
3–4.
3 (9
)6.
9–7.
4 (9
)4.
2–4.
7 (9
)5.
8–6.
3 (9
)2.
5–2.
9 (9
)1.
6–1.
8 (9
)6.
3–6.
8 (9
)2.
2–2.
4 (9
) X
X4.
3 ±
0.2
07.
1 ±
0.1
14.
3 ±
0.1
35.
9 ±
0.1
22.
3 ±
0.1
31.
7 ±
0.0
56.
2 ±
0.1
32.
0 ±
0.1
03.
9–4.
5 (8
)7.
0–7.
3 (8
)4.
1–4.
4 (8
)5.
6–6.
0 (8
)2.
0–2.
4 (8
)1.
6–1.
8 (8
)5.
9–6.
3 (8
)1.
9–2.
2 (8
)t =
-2.
92–
t = -
2.40
t = -
3.23
t= -
5.60
– t =
-3.
89t =
-6.
48P
< 0
.05
n.s.
P <
0.0
5P
< 0
.01
P <
0.0
01n.
s.P
< 0
.01
P <
0.0
01
Mad
agas
car
- ea
st (
OT
U 5
)X
X4.
06.
74.
15.
52.
31.
65.
92.
1
Pem
ba (
OT
U 6
)Y
Y4.
7 ±
0.1
77.
6 ±
0.1
74.
7 ±
0.1
26.
3 ±
0.1
42.
8 ±
0.1
21.
9 ±
0.0
56.
7 ±
0.1
32.
5 ±
0.1
04.
4–5.
0 (1
0)7.
3–7.
9 (1
0)4.
5–4.
8 (1
0)6.
1–6.
5 (1
0)2.
6–3.
0 (1
0)1.
8–1.
9 (1
0)6.
4–6.
8 (1
0)2.
3–2.
6 (1
0)X
X4.
0, 4
.47.
0, 7
.64.
4, 4
.85.
8, 6
.32.
3, 2
.51.
7, 1
.96.
3, 6
.72.
1, 2
.2
t = 3
.49
––
–t =
4.3
4–
–t =
4.2
3P
< 0
.01
n.s.
n.s.
n.s.
P <
0.0
1n.
s.n.
s.P
< 0
.01
May
otte
(O
TU
7)
YY
4.3
6.9
4.4
5.9
2.5
1.7
6.3
2.1
XX
4.0
6.8
4.3
5.7
2.0
1.6
6.2
2.0
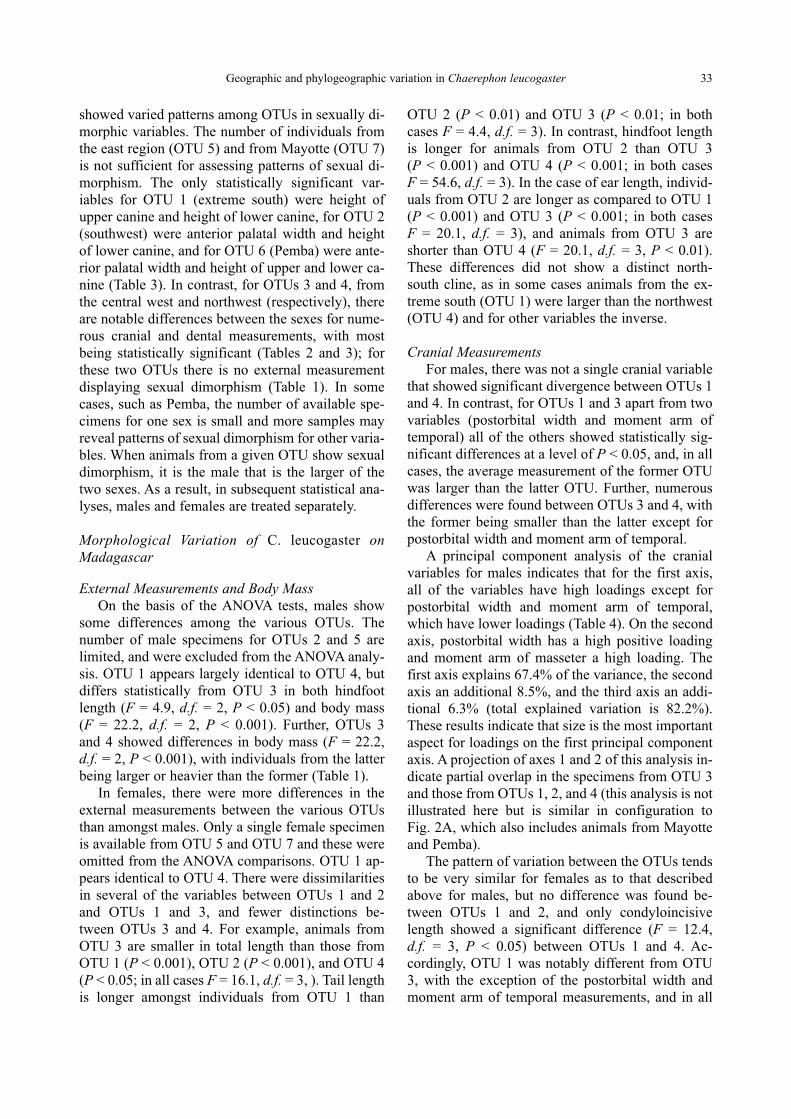
showed varied patterns among OTUs in sexually di-morphic variables. The number of individuals fromthe east region (OTU 5) and from Mayotte (OTU 7)is not sufficient for assessing patterns of sexual di-morphism. The only statistically significant var-iables for OTU 1 (extreme south) were height of upper canine and height of lower canine, for OTU 2(southwest) were anterior palatal width and heightof lower canine, and for OTU 6 (Pemba) were ante-rior palatal width and height of upper and lower ca-nine (Table 3). In contrast, for OTUs 3 and 4, fromthe central west and northwest (respectively), thereare notable differences between the sexes for nume-rous cranial and dental measurements, with mostbeing statistically significant (Tables 2 and 3); forthese two OTUs there is no external measurementdisplaying sexual dimorphism (Table 1). In somecases, such as Pemba, the number of available spe-cimens for one sex is small and more samples mayreveal patterns of sexual dimorphism for other varia-bles. When animals from a given OTU show sexualdimorphism, it is the male that is the larger of thetwo sexes. As a result, in subsequent statistical ana-lyses, males and females are treated separately.
Morphological Variation of C. leucogaster onMadagascar
External Measurements and Body MassOn the basis of the ANOVA tests, males show
some differences among the various OTUs. Thenumber of male specimens for OTUs 2 and 5 arelimited, and were excluded from the ANOVA analy-sis. OTU 1 appears largely identical to OTU 4, butdiffers statistically from OTU 3 in both hindfootlength (F = 4.9, d.f. = 2, P < 0.05) and body mass (F = 22.2, d.f. = 2, P < 0.001). Further, OTUs 3 and 4 showed differences in body mass (F = 22.2,d.f. = 2, P < 0.001), with individuals from the latterbeing larger or heavier than the former (Table 1).
In females, there were more differences in theexternal measurements between the various OTUsthan amongst males. Only a single female specimenis available from OTU 5 and OTU 7 and these wereomitted from the ANOVA comparisons. OTU 1 ap-pears identical to OTU 4. There were dissimilaritiesin several of the variables between OTUs 1 and 2and OTUs 1 and 3, and fewer distinctions be-tween OTUs 3 and 4. For example, animals fromOTU 3 are smaller in total length than those fromOTU 1 (P < 0.001), OTU 2 (P < 0.001), and OTU 4(P < 0.05; in all cases F = 16.1, d.f. = 3, ). Tail lengthis longer amongst individuals from OTU 1 than
OTU 2 (P < 0.01) and OTU 3 (P < 0.01; in both cases F = 4.4, d.f. = 3). In contrast, hindfoot lengthis longer for animals from OTU 2 than OTU 3 (P < 0.001) and OTU 4 (P < 0.001; in both cases F = 54.6, d.f. = 3). In the case of ear length, individ-uals from OTU 2 are longer as compared to OTU 1(P < 0.001) and OTU 3 (P < 0.001; in both cases F = 20.1, d.f. = 3), and animals from OTU 3 areshorter than OTU 4 (F = 20.1, d.f. = 3, P < 0.01).These differences did not show a distinct north-south cline, as in some cases animals from the ex-treme south (OTU 1) were larger than the northwest(OTU 4) and for other variables the inverse.
Cranial MeasurementsFor males, there was not a single cranial variable
that showed significant divergence between OTUs 1and 4. In contrast, for OTUs 1 and 3 apart from twovariables (postorbital width and moment arm oftemporal) all of the others showed statistically sig-nificant differences at a level of P < 0.05, and, in allcases, the average measurement of the former OTUwas larger than the latter OTU. Further, numerousdifferences were found between OTUs 3 and 4, withthe former being smaller than the latter except forpostorbital width and moment arm of temporal.
A principal component analysis of the cranialvariables for males indicates that for the first axis,all of the variables have high loadings except forpostorbital width and moment arm of temporal,which have lower loadings (Table 4). On the secondaxis, postorbital width has a high positive loadingand moment arm of masseter a high loading. Thefirst axis explains 67.4% of the variance, the secondaxis an additional 8.5%, and the third axis an addi-tional 6.3% (total explained variation is 82.2%).These results indicate that size is the most importantaspect for loadings on the first principal componentaxis. A projection of axes 1 and 2 of this analysis in-dicate partial overlap in the specimens from OTU 3and those from OTUs 1, 2, and 4 (this analysis is notillustrated here but is similar in configuration to Fig. 2A, which also includes animals from Mayotteand Pemba).
The pattern of variation between the OTUs tendsto be very similar for females as to that describedabove for males, but no difference was found be-tween OTUs 1 and 2, and only condyloincisivelength showed a significant difference (F = 12.4, d.f. = 3, P < 0.05) between OTUs 1 and 4. Ac -cordingly, OTU 1 was notably different from OTU3, with the exception of the postorbital width andmoment arm of temporal measurements, and in all
Geographic and phylogeographic variation in Chaerephon leucogaster 33
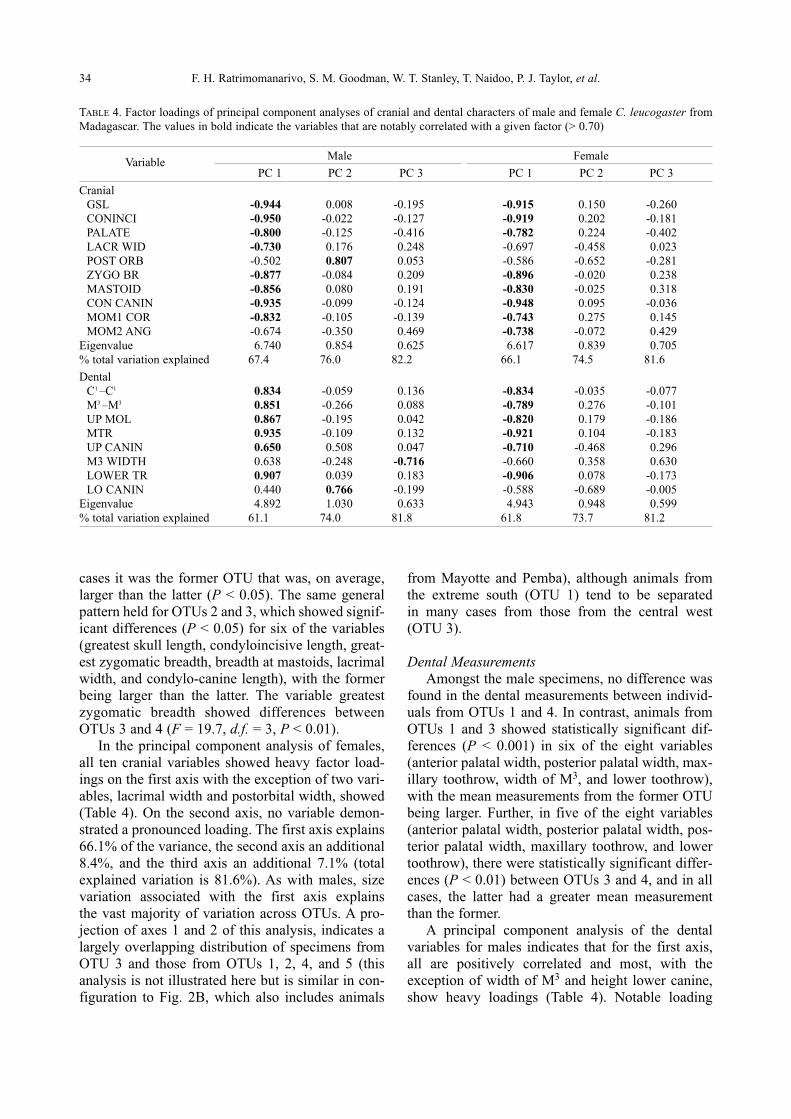
cases it was the former OTU that was, on average,larger than the latter (P < 0.05). The same generalpattern held for OTUs 2 and 3, which showed signif-icant differences (P < 0.05) for six of the variables(greatest skull length, condyloincisive length, great-est zygomatic breadth, breadth at mastoids, lacrimalwidth, and condylo-canine length), with the formerbeing larger than the latter. The variable greatest zygomatic breadth showed differences betweenOTUs 3 and 4 (F = 19.7, d.f. = 3, P < 0.01).
In the principal component analysis of females,all ten cranial variables showed heavy factor load-ings on the first axis with the exception of two vari-ables, lacrimal width and postorbital width, showed(Table 4). On the second axis, no variable demon-strated a pronounced loading. The first axis explains66.1% of the variance, the second axis an additional8.4%, and the third axis an additional 7.1% (total explained variation is 81.6%). As with males, sizevariation associated with the first axis explains the vast majority of variation across OTUs. A pro-jection of axes 1 and 2 of this analysis, indicates alargely overlapping distribution of specimens fromOTU 3 and those from OTUs 1, 2, 4, and 5 (thisanalysis is not illustrated here but is similar in con-figuration to Fig. 2B, which also includes animals
from Mayotte and Pemba), although animals fromthe extreme south (OTU 1) tend to be separated in many cases from those from the central west(OTU 3).
Dental MeasurementsAmongst the male specimens, no difference was
found in the dental measurements between individ-uals from OTUs 1 and 4. In contrast, animals fromOTUs 1 and 3 showed statistically significant dif -ferences (P < 0.001) in six of the eight variables (anterior palatal width, posterior palatal width, max-illary toothrow, width of M3, and lower toothrow),with the mean measurements from the former OTUbeing larger. Further, in five of the eight variables(anterior palatal width, posterior pal a tal width, pos-terior palatal width, maxillary tooth row, and lowertoothrow), there were statistically significant differ-ences (P < 0.01) between OTUs 3 and 4, and in allcases, the latter had a greater mean measurementthan the former.
A principal component analysis of the dentalvariables for males indicates that for the first axis,all are positively correlated and most, with the exception of width of M3 and height lower canine,show heavy loadings (Table 4). Notable loading
34 F. H. Ratrimomanarivo, S. M. Goodman, W. T. Stanley, T. Naidoo, P. J. Taylor, et al.
TABLE 4. Factor loadings of principal component analyses of cranial and dental characters of male and female C. leucogaster fromMadagascar. The values in bold indicate the variables that are notably correlated with a given factor (> 0.70)
VariableMale Female
PC 1 PC 2 PC 3 PC 1 PC 2 PC 3
CranialGSL -0.944 0.008 -0.195 -0.915 0.150 -0.260CONINCI -0.950 -0.022 -0.127 -0.919 0.202 -0.181PALATE -0.800 -0.125 -0.416 -0.782 0.224 -0.402LACR WID -0.730 0.176 0.248 -0.697 -0.458 0.023POST ORB -0.502 0.807 0.053 -0.586 -0.652 -0.281ZYGO BR -0.877 -0.084 0.209 -0.896 -0.020 0.238MASTOID -0.856 0.080 0.191 -0.830 -0.025 0.318CON CANIN -0.935 -0.099 -0.124 -0.948 0.095 -0.036MOM1 COR -0.832 -0.105 -0.139 -0.743 0.275 0.145MOM2 ANG -0.674 -0.350 0.469 -0.738 -0.072 0.429
Eigenvalue 6.740 0.854 0.625 6.617 0.839 0.705% total variation explained 67.4 76.0 82.2 66.1 74.5 81.6
DentalC1 –C1 0.834 -0.059 0.136 -0.834 -0.035 -0.077M3 –M3 0.851 -0.266 0.088 -0.789 0.276 -0.101UP MOL 0.867 -0.195 0.042 -0.820 0.179 -0.186MTR 0.935 -0.109 0.132 -0.921 0.104 -0.183UP CANIN 0.650 0.508 0.047 -0.710 -0.468 0.296M3 WIDTH 0.638 -0.248 -0.716 -0.660 0.358 0.630LOWER TR 0.907 0.039 0.183 -0.906 0.078 -0.173LO CANIN 0.440 0.766 -0.199 -0.588 -0.689 -0.005
Eigenvalue 4.892 1.030 0.633 4.943 0.948 0.599% total variation explained 61.1 74.0 81.8 61.8 73.7 81.2
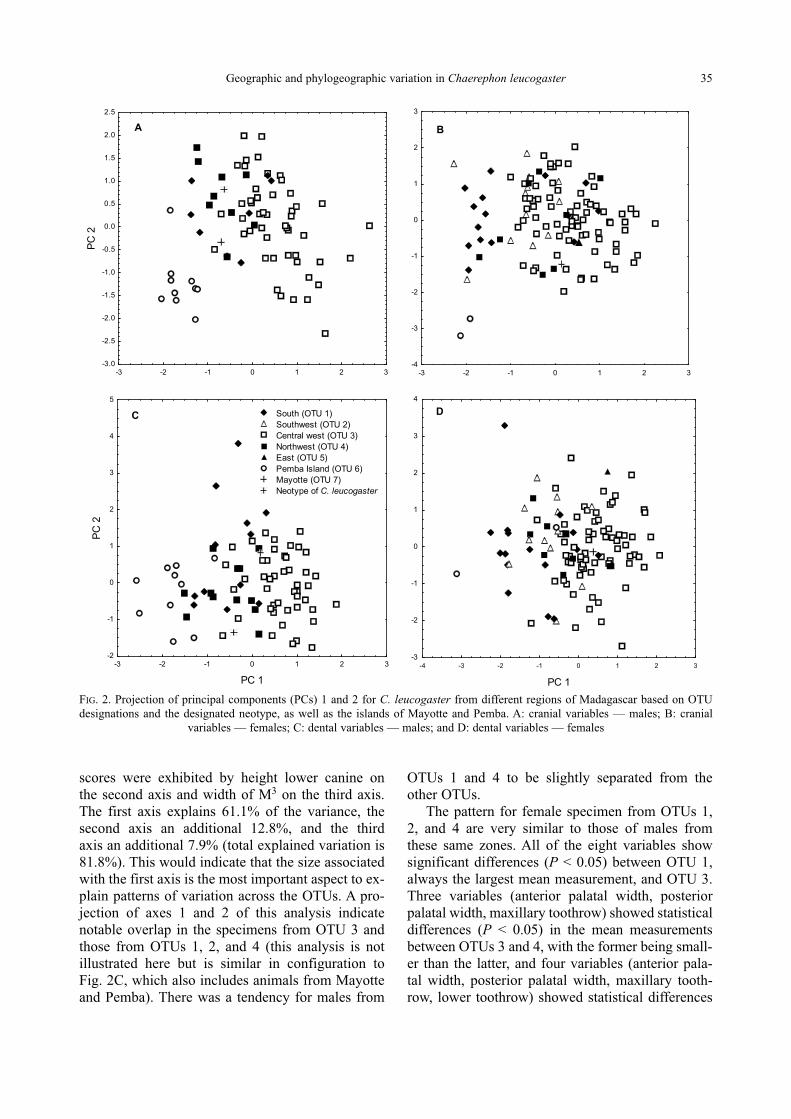
scores were exhibited by height lower canine on the second axis and width of M3 on the third axis.The first axis explains 61.1% of the variance, thesecond axis an additional 12.8%, and the third axis an additional 7.9% (total explained variation is81.8%). This would indicate that the size associatedwith the first axis is the most important aspect to ex-plain patterns of variation across the OTUs. A pro-jection of axes 1 and 2 of this analysis indicate notable overlap in the specimens from OTU 3 andthose from OTUs 1, 2, and 4 (this analysis is not illustrated here but is similar in configuration to Fig. 2C, which also includes animals from Mayotteand Pemba). There was a tendency for males from
OTUs 1 and 4 to be slightly separated from the other OTUs.
The pattern for female specimen from OTUs 1, 2, and 4 are very similar to those of males from these same zones. All of the eight variables showsignificant differences (P < 0.05) between OTU 1,always the largest mean measurement, and OTU 3.Three var iables (anterior palatal width, posteriorpalatal width, maxillary toothrow) showed statisticaldifferences (P < 0.05) in the mean measurements between OTUs 3 and 4, with the former being small-er than the latter, and four variables (anterior pala-tal width, posterior palatal width, maxillary tooth-row, lower toothrow) showed statistical differences
Geographic and phylogeographic variation in Chaerephon leucogaster 35
-3 -2 -1 0 1 2 3-3.0
-2.5
-2.0
-1.5
-1.0
-0.5
0.0
0.5
1.0
1.5
2.0
2.5
PC 2
A
-3 -2 -1 0 1 2 3-4
-3
-2
-1
0
1
2
3
B
-3 -2 -1 0 1 2 3
PC 1
-2
-1
0
1
2
3
4
5
PC 2
C
-4 -3 -2 -1 0 1 2 3
PC 1
-3
-2
-1
0
1
2
3
4
D South (OTU 1) Southwest (OTU 2) Central west (OTU 3) Northwest (OTU 4) East (OTU 5) Pemba Island (OTU 6) Mayotte (OTU 7) Neotype of C. leucogaster
FIG. 2. Projection of principal components (PCs) 1 and 2 for C. leucogaster from different regions of Madagascar based on OTUdesignations and the designated neotype, as well as the islands of Mayotte and Pemba. A: cranial variables — males; B: cranial
variables — females; C: dental variables — males; and D: dental variables — females
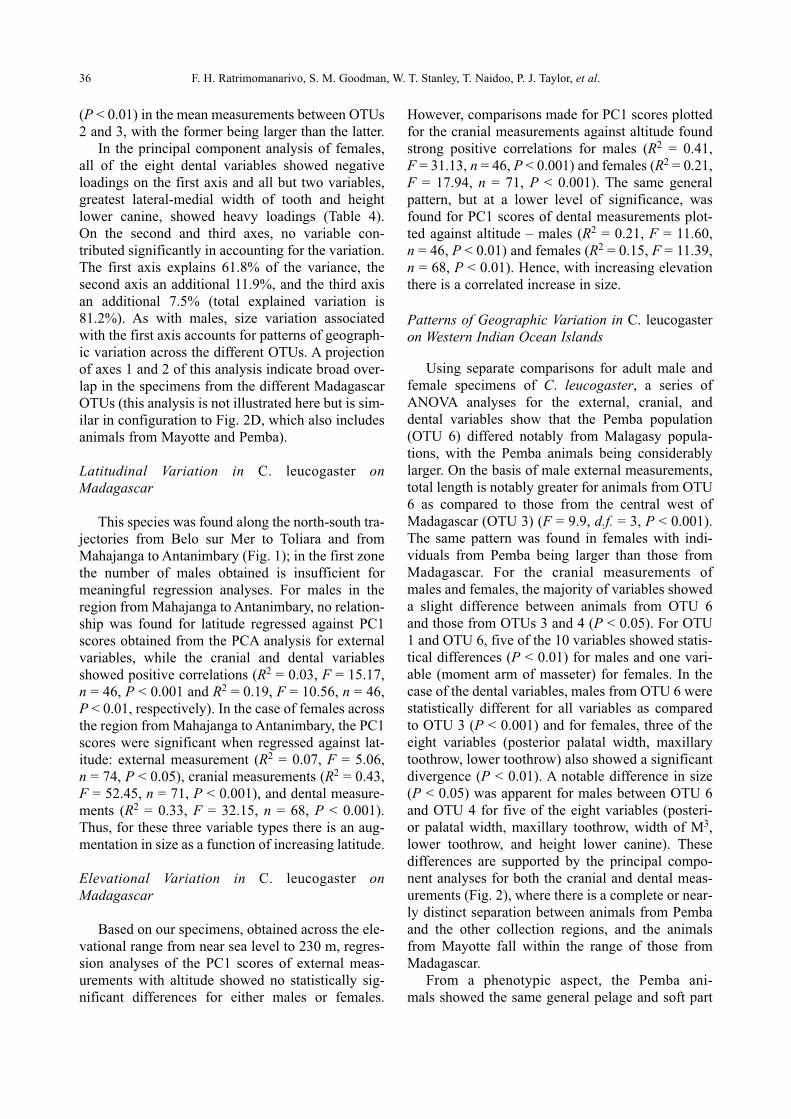
(P < 0.01) in the mean measurements between OTUs2 and 3, with the former being larger than the latter.
In the principal component analysis of females,all of the eight dental variables showed negativeloadings on the first axis and all but two variables,greatest lateral-medial width of tooth and heightlower canine, showed heavy loadings (Table 4). On the second and third axes, no variable con-tributed significantly in accounting for the variation.The first axis explains 61.8% of the variance, thesecond axis an additional 11.9%, and the third axisan additional 7.5% (total explained variation is81.2%). As with males, size variation associatedwith the first axis accounts for patterns of geograph-ic variation across the different OTUs. A projectionof axes 1 and 2 of this analysis indicate broad over-lap in the specimens from the different MadagascarOTUs (this analysis is not illustrated here but is sim-ilar in configuration to Fig. 2D, which also includesanimals from Mayotte and Pemba).
Latitudinal Variation in C. leucogaster onMadagascar
This species was found along the north-south tra-jectories from Belo sur Mer to Toliara and fromMahajanga to Antanimbary (Fig. 1); in the first zonethe number of males obtained is insufficient formeaningful regression analyses. For males in the region from Mahajanga to Antanimbary, no relation-ship was found for latitude regressed against PC1scores obtained from the PCA analysis for externalvariables, while the cranial and dental variablesshowed positive correlations (R2 = 0.03, F = 15.17,n = 46, P < 0.001 and R2 = 0.19, F = 10.56, n = 46,P < 0.01, respectively). In the case of females acrossthe region from Mahajanga to Antanimbary, the PC1scores were significant when regressed against lat-itude: external measurement (R2 = 0.07, F = 5.06, n = 74, P < 0.05), cranial measurements (R2 = 0.43,F = 52.45, n = 71, P < 0.001), and dental measure-ments (R2 = 0.33, F = 32.15, n = 68, P < 0.001).Thus, for these three variable types there is an aug-mentation in size as a function of increasing latitude.
Elevational Variation in C. leucogaster onMadagascar
Based on our specimens, obtained across the ele-vational range from near sea level to 230 m, regres-sion analyses of the PC1 scores of external meas-urements with altitude showed no statistically sig-nificant differences for either males or females.
How ever, comparisons made for PC1 scores plottedfor the cranial measurements against altitude foundstrong positive correlations for males (R2 = 0.41, F = 31.13, n = 46, P < 0.001) and females (R2 = 0.21,F = 17.94, n = 71, P < 0.001). The same general pattern, but at a lower level of significance, wasfound for PC1 scores of dental measurements plot-ted against altitude – males (R2 = 0.21, F = 11.60, n = 46, P < 0.01) and females (R2 = 0.15, F = 11.39,n = 68, P < 0.01). Hence, with increasing elevationthere is a correlated increase in size.
Patterns of Geographic Variation in C. leucogasteron Western Indian Ocean Islands
Using separate comparisons for adult male andfemale specimens of C. leucogaster, a series ofANOVA analyses for the external, cranial, and dental variables show that the Pemba population(OTU 6) differed notably from Malagasy popula-tions, with the Pemba animals being considerablylarger. On the basis of male external measurements,total length is notably greater for animals from OTU6 as compared to those from the central west ofMadagascar (OTU 3) (F = 9.9, d.f. = 3, P < 0.001).The same pattern was found in females with indi-viduals from Pemba being larger than those fromMadagascar. For the cranial measurements of males and females, the majority of variables showeda slight difference between animals from OTU 6 and those from OTUs 3 and 4 (P < 0.05). For OTU1 and OTU 6, five of the 10 variables showed statis-tical differences (P < 0.01) for males and one vari-able (moment arm of masseter) for females. In thecase of the dental variables, males from OTU 6 werestatistically different for all variables as compared to OTU 3 (P < 0.001) and for females, three of theeight variables (posterior palatal width, maxillarytoothrow, lower tooth row) also showed a significantdivergence (P < 0.01). A notable difference in size (P < 0.05) was apparent for males between OTU 6and OTU 4 for five of the eight variables (posteri-or palatal width, maxillary toothrow, width of M3, lower toothrow, and height lower canine). These differences are supported by the principal compo-nent analyses for both the cranial and dental meas-urements (Fig. 2), where there is a complete or near-ly distinct separation between animals from Pembaand the other collection regions, and the animalsfrom Mayotte fall within the range of those fromMadagascar.
From a phenotypic aspect, the Pemba ani-mals showed the same general pelage and soft part
36 F. H. Ratrimomanarivo, S. M. Goodman, W. T. Stanley, T. Naidoo, P. J. Taylor, et al.
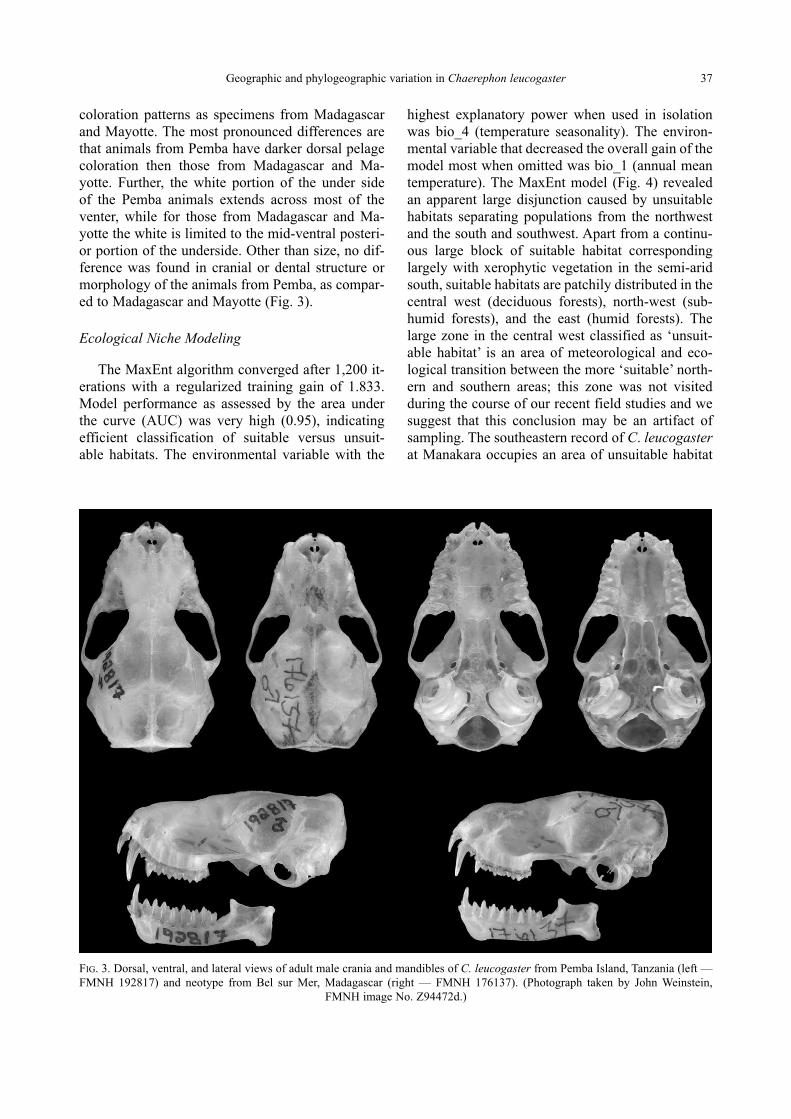
coloration patterns as specimens from Madagascarand Mayotte. The most pronounced differences arethat animals from Pemba have darker dorsal pelagecoloration then those from Madagascar and Ma -yotte. Further, the white portion of the under side of the Pemba animals extends across most of theventer, while for those from Madagascar and Ma -yotte the white is limited to the mid-ventral posteri-or portion of the underside. Other than size, no dif-ference was found in cranial or dental structure ormorphology of the animals from Pemba, as compar -ed to Mada gascar and Mayotte (Fig. 3).
Ecological Niche Modeling
The MaxEnt algorithm converged after 1,200 it-erations with a regularized training gain of 1.833.Model performance as assessed by the area underthe curve (AUC) was very high (0.95), indicatingefficient classification of suitable versus unsuit-able habitats. The environmental variable with the
highest explanatory power when used in isolationwas bio_4 (temperature seasonality). The environ-mental variable that decreased the overall gain of themodel most when omitted was bio_1 (annual meantemperature). The MaxEnt model (Fig. 4) revealedan apparent large disjunction caused by unsuitablehabitats separating populations from the northwestand the south and southwest. Apart from a continu-ous large block of suitable habitat correspondinglargely with xerophytic vegetation in the semi-aridsouth, suitable habitats are patchily distributed in thecentral west (deciduous forests), north-west (sub-humid forests), and the east (humid forests). Thelarge zone in the central west classified as ‘unsuit-able habitat’ is an area of meteorological and eco-logical transition between the more ‘suitable’ north-ern and southern areas; this zone was not visitedduring the course of our recent field studies and wesuggest that this conclusion may be an artifact ofsampling. The southeastern record of C. leu cogasterat Manakara occupies an area of unsuitable habitat
Geographic and phylogeographic variation in Chaerephon leucogaster 37
FIG. 3. Dorsal, ventral, and lateral views of adult male crania and mandibles of C. leucogaster from Pemba Island, Tanzania (left —FMNH 192817) and neotype from Bel sur Mer, Madagascar (right — FMNH 176137). (Photograph taken by John Weinstein,
FMNH image No. Z94472 d.)

in terms of the modeled bioclimatic optimum for thespecies as a whole.
Phylogeny of Malagasy and Western Indian OceanIsland Chaerephon spp.
Bayesian, maximum parsimony, and neighbor-joining analysis of cytochrome b sequences (863 nu-cleotides) (Fig. 5) showed that all Chaerephon taxaformed a strongly supported monophyletic group(bootstrap 100%) with respect to the outgroups, M. leucostigma and M. midas. Further, C. leucogas -ter from Madagascar, Mayotte, and Pemba forma well-supported monophyletic group distinct fromthe sister species C. pumilus from Madagascar. Theleucogaster group is supported by congruent resultsfrom the following analyses: Bayesian (posteriorpro bability 1.00), maximum parsimony (bootstrap
38 F. H. Ratrimomanarivo, S. M. Goodman, W. T. Stanley, T. Naidoo, P. J. Taylor, et al.
FIG. 4. Modeled potential distribution (MaxEnt) of C. leucogasterbased on 103 known records of occurrence from Madagascarand Mayotte. Localities based on museum collecting recordsshown as dots. Shading represents ranges of probability of
occurrence (i.e. habitat suitability)
99%), and neighbor-joining (bootstrap 100%). Thereis no significant support for any substructure withinthe C. leucogaster group, which comprises six hap-lo types (see section on phylogeography, below).
The structure of phylogenetic trees based on 338 nucleotides of the D-loop (Fig. 6) was congru-ent with the cytochrome b based trees. Sup port for amonophyletic C. leucogaster group, sister to C. pu -milus from Madagascar was good (maximumparsimony bootstrap 98%, Bayes ian posterior prob-ability 0.95). Neighbor-joining anal ysis is not in-cluded owing to the presence of a large number ofundefined distances. There is moderate support forthe distinctness of the haplotype 11 samples (fromPemba and Mayotte) from the Malagasy haplotypes(1–10).
Phylogeography of C. leucogaster on WesternIndian Ocean Islands
Cytochrome b Haplotype AnalysisAnalysis of 863 nucleotides of the cytochrome b
gene for 39 C. leucogaster samples yielded six hap-lotypes based on four variable sites (Appendix II).The haplotype diversity was 0.718 (variance0.00214), whilst the nucleotide diversity per site was0.00111 (variance << 0.00001). The average numberof nucleotide differences between samples was 0.95.The six C. leucogaster cytochrome b haplotypes are separated by genetic distances of between0.00116 and 0.00349 (Table 5). Genetic distancesbetween C. leucogaster and C. pumilus (Madagas -car) range from 0.01771 to 0.02619, whilst thoseobtained be tween Chaerephon taxa and the Mopsoutgroups range from 0.11903 to 0.12198. A statis-tical parsimony haplotype network, showing mutational relationships between haplotypes, with95% confidence, is presented in Fig. 7. The six cytochrome b haplotypes are separated by betweenone and three mutational steps, whilst the closest C. pumilus (Mada gascar) sample is 15 mutationalsteps different from any of the C. leucogaster haplo-types.
D-loop Haplotype AnalysisAnalysis of 338 nucleotides of the D-loop for 71
C. leucogaster samples yielded 11 haplotypes basedon nine variable sites (Appendix III). The haplotypediversity was 0.870 (variance 0.00052), whilst the nucleotide diversity per site was 0.00737 (vari-ance 0.00002). The average number of nucleotidedifferences between samples was 2.00. Genetic distances of between 0.00398 and 0.03307 separate
Madagascar & Comoros
Chaerephonleucogaster
0.00–0.409
0.41–0.809
0.81–0.909
0.91–0.949
0.95–0.989
0.99–1.000
No data
Maxent
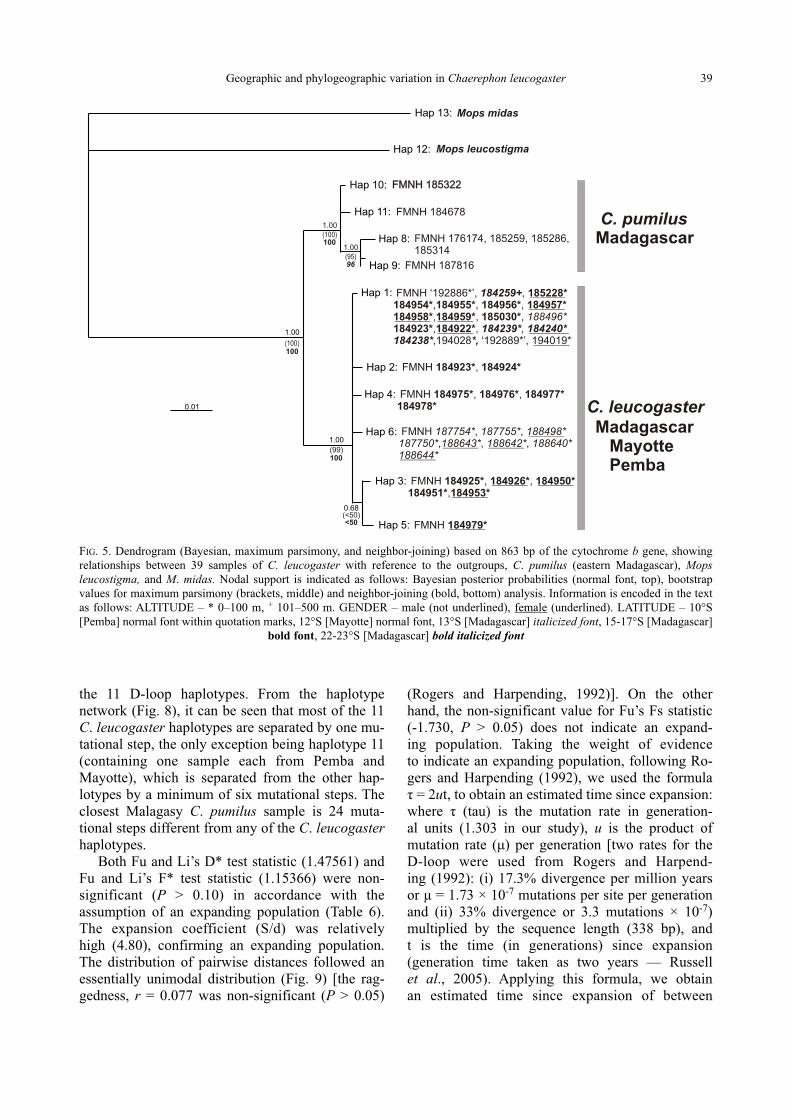
the 11 D-loop haplotypes. From the haplotype network (Fig. 8), it can be seen that most of the 11C. leucogaster haplotypes are separated by one mu-tational step, the only exception being haplotype 11(containing one sample each from Pemba andMayotte), which is separated from the other hap-lotypes by a minimum of six mutational steps. Theclosest Malagasy C. pumilus sample is 24 muta-tional steps different from any of the C. leucogasterhaplotypes.
Both Fu and Li’s D* test statistic (1.47561) andFu and Li’s F* test statistic (1.15366) were non-significant (P > 0.10) in accordance with the assumption of an expanding population (Table 6).The expansion coefficient (S/d) was relatively high (4.80), confirming an expanding population.The distribution of pairwise distances followed anessentially unimodal distribution (Fig. 9) [the rag -gedness, r = 0.077 was non-significant (P > 0.05)
(Rogers and Harpending, 1992)]. On the other hand, the non-significant value for Fu’s Fs statistic(-1.730, P > 0.05) does not indicate an expand-ing population. Taking the weight of evidence to indicate an expanding population, following Ro -gers and Har pending (1992), we used the formula τ = 2ut, to obtain an estimated time since expansion:where τ (tau) is the mutation rate in generation- al units (1.303 in our study), u is the product of mutation rate (μ) per generation [two rates for the D-loop were used from Rogers and Harpend-ing (1992): (i) 17.3% divergence per million yearsor μ = 1.73 × 10⁻⁷ mutations per site per generationand (ii) 33% divergence or 3.3 mutations × 10-7)multiplied by the sequence length (338 bp), and t is the time (in generations) since expansion (generation time taken as two years — Russell et al., 2005). Applying this formula, we obtain an estimated time since expansion of between
Geographic and phylogeographic variation in Chaerephon leucogaster 39
FIG. 5. Dendrogram (Bayesian, maximum parsimony, and neighbor-joining) based on 863 bp of the cytochrome b gene, showingrelationships between 39 samples of C. leucogaster with reference to the outgroups, C. pumilus (eastern Madagascar), Mopsleucostigma, and M. midas. Nodal support is indicated as follows: Bayesian posterior probabilities (normal font, top), bootstrapvalues for maximum parsimony (brackets, middle) and neighbor-joining (bold, bottom) analysis. Information is encoded in the textas follows: ALTITUDE – * 0–100 m, + 101–500 m. GENDER – male (not underlined), female (underlined). LATITUDE – 10°S[Pemba] normal font within quotation marks, 12°S [Mayotte] normal font, 13°S [Madagascar] italicized font, 15-17°S [Madagascar]
bold font, 22-23°S [Madagascar] bold italicized font
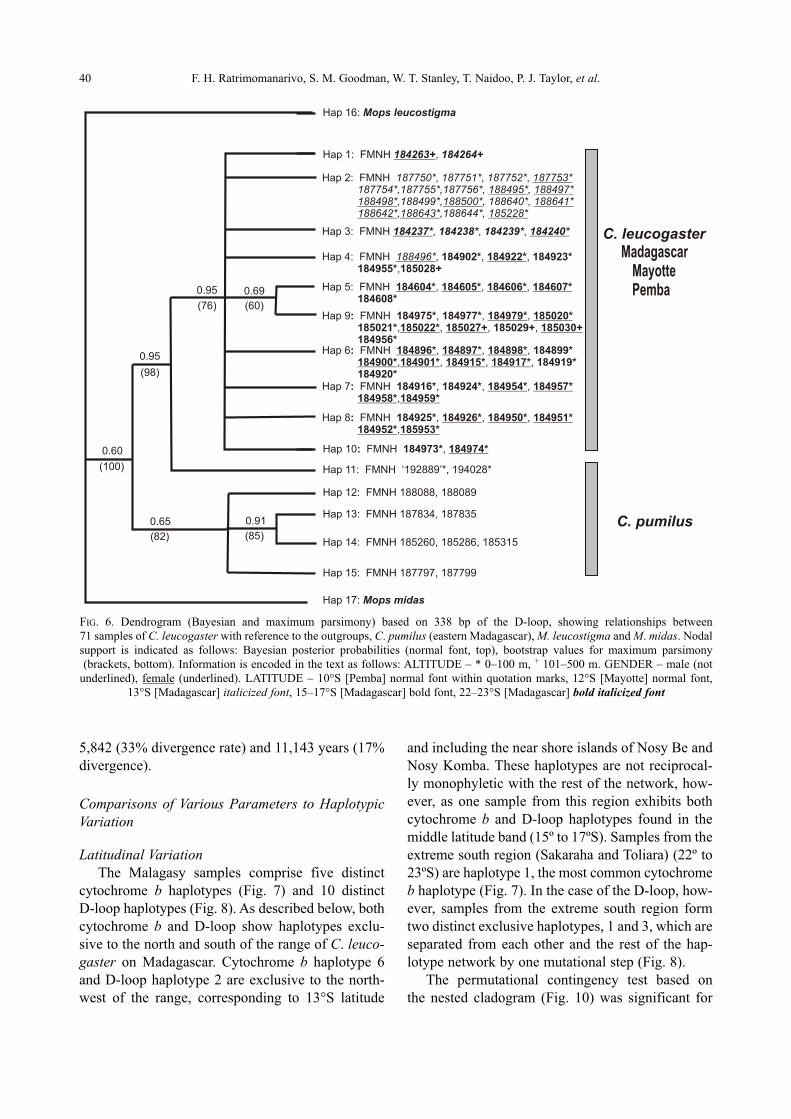
5,842 (33% divergence rate) and 11,143 years (17%divergence).
Comparisons of Various Parameters to HaplotypicVariation
Latitudinal VariationThe Malagasy samples comprise five distinct
cytochrome b haplotypes (Fig. 7) and 10 distinct D-loop haplotypes (Fig. 8). As described below, bothcytochrome b and D-loop show haplotypes ex clu -sive to the north and south of the range of C. leu co -gas ter on Madagascar. Cytochrome b haplotype 6and D-loop haplotype 2 are exclusive to the north-west of the range, corresponding to 13°S latitude
and including the near shore islands of Nosy Be andNosy Komba. These haplotypes are not reci procal-ly monophyletic with the rest of the network, how-ever, as one sample from this region exhibits bothcytochrome b and D-loop haplotypes found in themiddle latitude band (15º to 17ºS). Samples from the extreme south region (Sakaraha and Toliara) (22º to23ºS) are haplotype 1, the most common cyto chromeb haplotype (Fig. 7). In the case of the D-loop, how-ever, samples from the extreme south region formtwo distinct exclusive haplotypes, 1 and 3, which areseparated from each other and the rest of the hap-lotype network by one mutational step (Fig. 8).
The permutational contingency test based on the nested cladogram (Fig. 10) was significant for
40 F. H. Ratrimomanarivo, S. M. Goodman, W. T. Stanley, T. Naidoo, P. J. Taylor, et al.
FIG. 6. Dendrogram (Bayesian and maximum parsimony) based on 338 bp of the D-loop, showing relationships between 71 samples of C. leucogaster with reference to the outgroups, C. pumilus (eastern Madagascar), M. leucostigma and M. midas. Nodalsupport is indicated as follows: Bayesian posterior probabilities (normal font, top), bootstrap values for maximum parsimony(brackets, bottom). Information is encoded in the text as follows: ALTITUDE – * 0–100 m, + 101–500 m. GENDER – male (not
underlined), female (underlined). LATITUDE – 10°S [Pemba] normal font within quotation marks, 12°S [Mayotte] normal font, 13°S [Madagascar] italicized font, 15–17°S [Madagascar] bold font, 22–23°S [Madagascar] bold italicized font
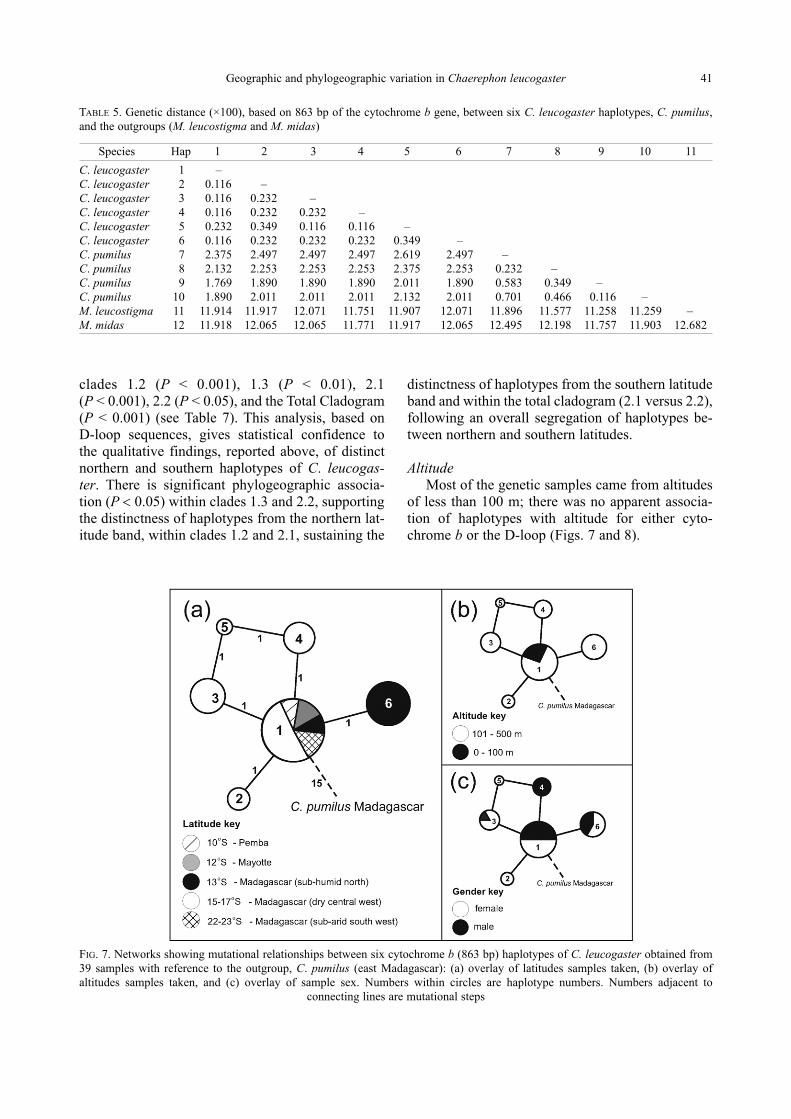
Geographic and phylogeographic variation in Chaerephon leucogaster 41
TABLE 5. Genetic distance (×100), based on 863 bp of the cytochrome b gene, between six C. leucogaster haplotypes, C. pumilus,and the outgroups (M. leucostigma and M. midas)
Species Hap 1 2 3 4 5 6 7 8 9 10 11
C. leucogaster 1 –C. leucogaster 2 0.116 –C. leucogaster 3 0.116 0.232 –C. leucogaster 4 0.116 0.232 0.232 –C. leucogaster 5 0.232 0.349 0.116 0.116 –C. leucogaster 6 0.116 0.232 0.232 0.232 0.349 –C. pumilus 7 2.375 2.497 2.497 2.497 2.619 2.497 –C. pumilus 8 2.132 2.253 2.253 2.253 2.375 2.253 0.232 –C. pumilus 9 1.769 1.890 1.890 1.890 2.011 1.890 0.583 0.349 –C. pumilus 10 1.890 2.011 2.011 2.011 2.132 2.011 0.701 0.466 0.116 –M. leucostigma 11 11.914 11.917 12.071 11.751 11.907 12.071 11.896 11.577 11.258 11.259 –M. midas 12 11.918 12.065 12.065 11.771 11.917 12.065 12.495 12.198 11.757 11.903 12.682
clades 1.2 (P < 0.001), 1.3 (P < 0.01), 2.1 (P < 0.001), 2.2 (P < 0.05), and the Total Clado gram(P < 0.001) (see Table 7). This analysis, based on D-loop sequences, gives statistical confidence to the qualitative findings, reported above, of distinctnorthern and southern haplotypes of C. leu cogas-ter. There is significant phylogeographic associa- tion (P < 0.05) within clades 1.3 and 2.2, supportingthe distinctness of haplotypes from the northern lat-itude band, within clades 1.2 and 2.1, sustaining the
distinctness of haplotypes from the southern latitudeband and within the total cladogram (2.1 versus 2.2),following an overall segregation of haplotypes be-tween northern and southern latitudes.
AltitudeMost of the genetic samples came from altitudes
of less than 100 m; there was no apparent associa-tion of haplotypes with altitude for either cyto -chrome b or the D-loop (Figs. 7 and 8).
FIG. 7. Networks showing mutational relationships between six cytochrome b (863 bp) haplotypes of C. leucogaster obtained from39 samples with reference to the outgroup, C. pumilus (east Madagascar): (a) overlay of latitudes samples taken, (b) overlay ofaltitudes samples taken, and (c) overlay of sample sex. Numbers within circles are haplotype numbers. Numbers adjacent to
connecting lines are mutational steps
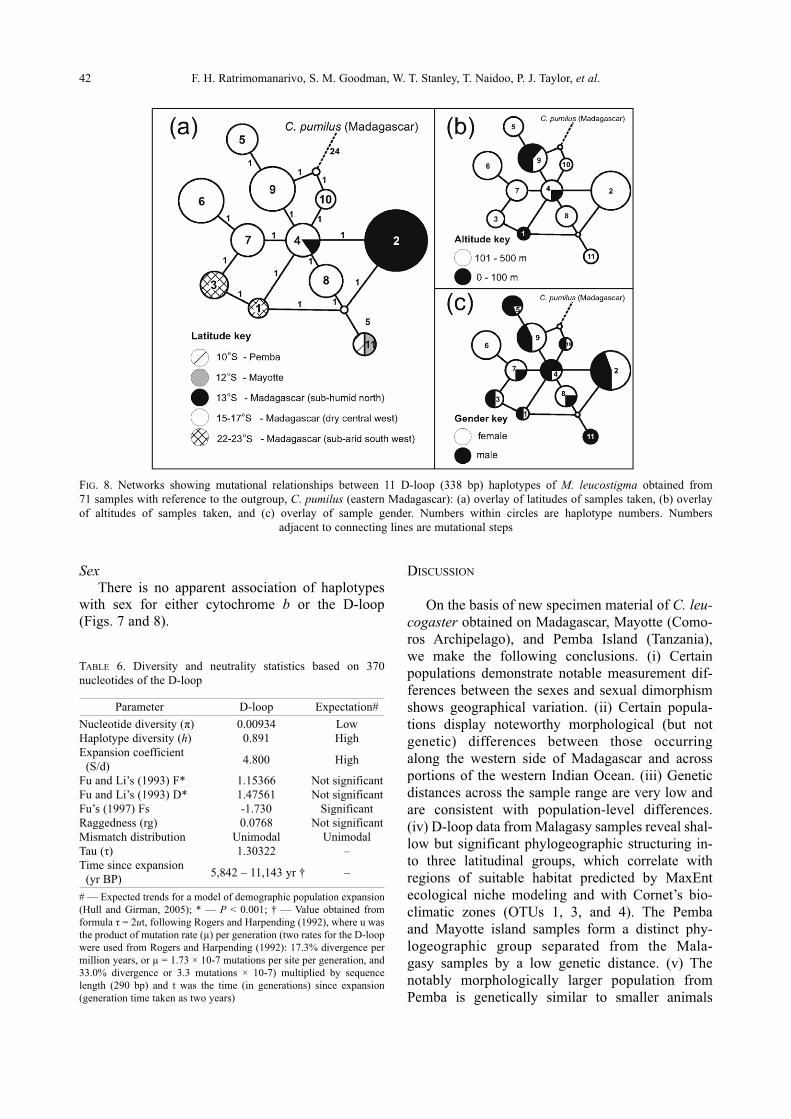
SexThere is no apparent association of haplotypes
with sex for either cytochrome b or the D-loop(Figs. 7 and 8).
42 F. H. Ratrimomanarivo, S. M. Goodman, W. T. Stanley, T. Naidoo, P. J. Taylor, et al.
FIG. 8. Networks showing mutational relationships between 11 D-loop (338 bp) haplotypes of M. leucostigma obtained from 71 samples with reference to the outgroup, C. pumilus (eastern Madagascar): (a) overlay of latitudes of samples taken, (b) overlayof altitudes of samples taken, and (c) overlay of sample gender. Numbers within circles are haplotype numbers. Numbers
adjacent to connecting lines are mutational steps
TABLE 6. Diversity and neutrality statistics based on 370nucleotides of the D-loop
Parameter D-loop Expectation#
Nucleotide diversity (π) 0.00934 LowHaplotype diversity (h) 0.891 HighExpansion coefficient
(S/d)4.800 High
Fu and Li’s (1993) F* 1.15366 Not significantFu and Li’s (1993) D* 1.47561 Not significantFu’s (1997) Fs -1.730 SignificantRaggedness (rg) 0.0768 Not significantMismatch distribution Unimodal UnimodalTau (τ) 1.30322 –Time since expansion
(yr BP)5,842 – 11,143 yr † –
# — Expected trends for a model of demographic population expansion (Hull and Girman, 2005); * — P < 0.001; † — Value obtained from formula τ = 2ut, following Rogers and Harpending (1992), where u wasthe product of mutation rate (µ) per generation (two rates for the D-loopwere used from Rogers and Harpending (1992): 17.3% divergence permillion years, or µ = 1.73 × 10⁻⁷ mutations per site per generation, and33.0% divergence or 3.3 mutations × 10-7) multiplied by sequencelength (290 bp) and t was the time (in generations) since expansion(generation time taken as two years)
DISCUSSION
On the basis of new specimen material of C. leu -cogaster obtained on Madagascar, Mayotte (Como -ros Archipelago), and Pemba Island (Tan zania), we make the following conclusions. (i) Certain populations demonstrate notable measurement dif-ferences between the sexes and sexual dimorphismshows geographical variation. (ii) Certain popula-tions display noteworthy morphological (but not genetic) differences between those occurring along the western side of Madagascar and acrossportions of the western Indian Ocean. (iii) Geneticdistances across the sample range are very low andare consistent with population-level differences. (iv) D-loop data from Malagasy samples reveal shal-low but significant phylogeographic structuring in-to three latitudinal groups, which correlate with regions of suitable habitat predicted by MaxEnt eco logical niche modeling and with Cornet’s bio-climatic zones (OTUs 1, 3, and 4). The Pemba and Ma yot te island samples form a distinct phy -logeo graphic group separated from the Mala -gasy samples by a low genetic distance. (v) The notably morphologically larger population fromPemba is genetically similar to smaller animals

from Mayotte (D-loop) and Madagascar (D-loopand cyto chrome b).
Aspects of the Natural History of C. leucogaster on Madagascar and New Information on theirDistribution in the Western Indian Ocean Islands
On the basis of information published before therecent wave of chiropterological surveys on Mada -gascar (post-1970), the distribution of C. leu co gas -ter included much of the western portion of the island, from the near shore island of Nosy Be southto Toliara (Peterson et al., 1995; Eger and Mitchell,2003; Fig. 1). More recent surveys have found thisspecies at a number of other sites (Russ et al., 2003;Goodman and Cardiff, 2004; Goodman et al., 2005;Rakotonandrasana and Goodman, 2007; Kofo-ky et al., 2007; Fig. 1). Its known distribution in-cludes most of the western length of the island. It is
a spe cies of lower elevations, although a specimenfrom the Zombitse Forest, to the east of Sakaraha,was obtained at 870 m. The prediction of theMaxEnt analysis that portions of the central westand extreme northwest comprise unsuitable habitatfor C. leucogaster is almost certainly an artifact ofsampling; these are zones not visited in the contextof the current project.
We have one recent record from the eastern low-land part of Madagascar — at Manakara (Fig. 1);this is one of the few reports from the eastern por-tion of the island. The previous record of this specieson the eastern near shore island of Isle Sainte Marie(Peterson et al., 1995) is in error and the locality ofthis specimen was Sainte Marie de Marovoay,southeast of Mahajanga (Kaudern, 1915). An addi-tional older eastern record is a specimen obtained inthe late 1800s and labeled ‘Fort Dauphin’ (To la -gnaro) (BMNH 94.2.3.2).
Geographic and phylogeographic variation in Chaerephon leucogaster 43
FIG. 9. Distribution of pairwise nucleotide differences for D-loop data of 71 C. leucogaster samples from Madagascar, Pemba, and Mayotte
Pairwise differences
Fre
quency
TABLE 7. Table showing inferences from Nested Clade Analysis in C. leucogaster. Clade refers to a group containing significant chi-square value(s), chain of inference is the path through the set of questions comprising Templeton’s key, interpretation is accordingto the chain of inference in Templeton’s key
Clade Chain of inference Interpretation
1.2 1-2-3-5-6-13-14 NO Long-distance colonization and/or past fragmentation1.3 1-2-3-5-6-13 YES Long-distance colonization possibly coupled with subsequent fragmentation or past
fragmentation followed by range expansion2.1 1-2-3-5-6*-7-8 YES Restricted gene flow/dispersal but with some long-distance dispersal over intermediate
areas not occupied by the species; or past gene flow followed by extinction of intermediatepopulations
2.2 1-2-11-12-13-14 NO Long-distance colonization and/or past fragmentation (not necessarily mutually exclusive)
Total Cladogram 1-19 NO Allopatric fragmentation
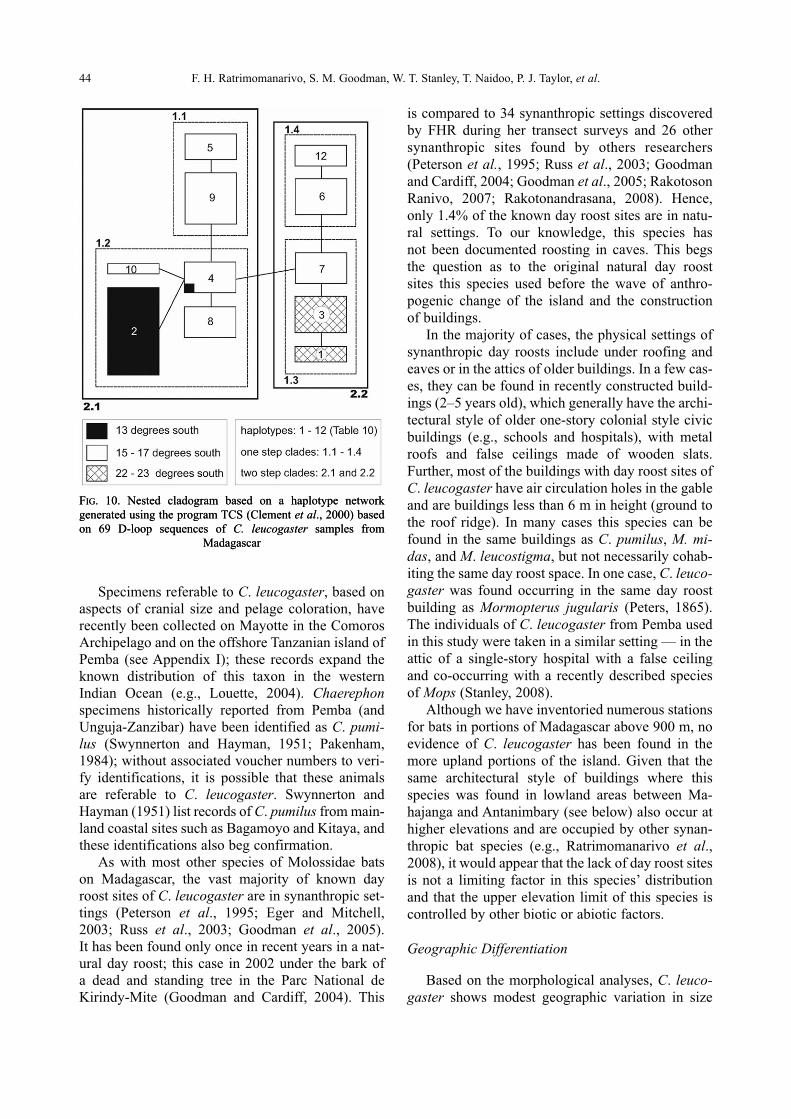
Specimens referable to C. leucogaster, based onaspects of cranial size and pelage coloration, haverecently been collected on Mayotte in the ComorosArchipelago and on the offshore Tanzanian island ofPemba (see Appendix I); these records expand theknown distribution of this taxon in the westernIndian Ocean (e.g., Louette, 2004). Chaerephon spec i mens historically reported from Pemba (andUnguja-Zanzibar) have been identified as C. pu mi -lus (Swynnerton and Hayman, 1951; Paken ham,1984); without associated voucher numbers to veri-fy identifications, it is possible that these animalsare referable to C. leucogaster. Swynnerton andHay man (1951) list records of C. pumilus from main -land coastal sites such as Bagamoyo and Ki ta ya, andthese identifications also beg confirmation.
As with most other species of Molossidae bats on Madagascar, the vast majority of known dayroost sites of C. leucogaster are in synanthropic set-tings (Peterson et al., 1995; Eger and Mitchell,2003; Russ et al., 2003; Goodman et al., 2005). It has been found only once in recent years in a nat-ural day roost; this case in 2002 under the bark of a dead and standing tree in the Parc National deKirindy-Mite (Goodman and Cardiff, 2004). This
44 F. H. Ratrimomanarivo, S. M. Goodman, W. T. Stanley, T. Naidoo, P. J. Taylor, et al.
FIG. 10. Nested cladogram based on a haplotype networkgenerated using the program TCS (Clement et al., 2000) basedon 69 D-loop sequences of C. leucogaster samples from
Madagascar
is compared to 34 synanthropic settings discoveredby FHR during her transect surveys and 26 othersynanthropic sites found by others researchers(Peterson et al., 1995; Russ et al., 2003; Goodmanand Cardiff, 2004; Goodman et al., 2005; RakotosonRanivo, 2007; Ra ko tonandrasana, 2008). Hence,only 1.4% of the known day roost sites are in natu-ral settings. To our knowledge, this species has not been documented roosting in caves. This begsthe question as to the original natural day roost sites this species used before the wave of anthro-pogenic change of the island and the construction of buildings.
In the majority of cases, the physical settings ofsynanthropic day roosts include under roofing andeaves or in the attics of older buildings. In a few cas-es, they can be found in recently constructed build-ings (2–5 years old), which generally have the archi-tectural style of older one-story colonial style civicbuildings (e.g., schools and hospitals), with metalroofs and false ceilings made of wooden slats.Further, most of the buildings with day roost sites ofC. leucogaster have air circulation holes in the gableand are buildings less than 6 m in height (ground tothe roof ridge). In many cases this species can befound in the same buildings as C. pumilus, M. mi-das, and M. leucostigma, but not necessarily cohab-iting the same day roost space. In one case, C. leuco-gaster was found occurring in the same day roostbuilding as Mormopterus jugularis (Peters, 1865).The individuals of C. leucogaster from Pemba usedin this study were taken in a similar setting — in theattic of a single-story hospital with a false ceilingand co-occurring with a recently described speciesof Mops (Stanley, 2008).
Although we have inventoried numerous stationsfor bats in portions of Madagascar above 900 m, noevidence of C. leucogaster has been found in themore upland portions of the island. Given that thesame architectural style of buildings where thisspecies was found in lowland areas between Ma-ha janga and Antanimbary (see below) also occur athigher elevations and are occupied by other synan-thropic bat species (e.g., Ratrimomanarivo et al., 2008), it would appear that the lack of day roost sitesis not a limiting factor in this species’ distributionand that the upper elevation limit of this species iscontrolled by other biotic or abiotic factors.
Geographic Differentiation
Based on the morphological analyses, C. leuco-gaster shows modest geographic variation in size
FIG. 10. Nested cladogram based on a haplotype networkgenerated using the program TCS (Clement et al., 2000) basedon 69 D-loop sequences of C. leucogaster samples from
Madagascar
in portions of western Madagascar. Using the biocli-matic zones of Cornet (1974), which was used here-in to classify the OTUs, animals from the sub-aridarea of the island in the extreme south and southwest(OTUs 1 and 2) and the sub-humid region of NosyBe (OTU 4), are larger in certain measurements thanthose of the dry deciduous forest zones of the centralwest (OTU 3). These patterns of geographical varia-tion are not in agreement with simple clines in cer-tain meteorological data, although they are concor-dant with D-loop data (see below).
Although a large number of villages were sur-veyed in the eastern portion of Madagascar forsynanthropic bats, we found across the vast area ofOTU 5 only a single individual of C. leucogaster;this is an adult female at Manakara (FMNH185228). Based on PCA analyses for cranial anddental measurements, this individual falls within thespread of points of animals obtained in the westernportion of the island. This is supported by moleculardata, as both cytochrome b and D-loop analysesplace this sample with the most common westernhaplotypes (1 and 2, respectively). Whether theMana kara animal represents some rare or periodicmovement between western or eastern portions ofMadagascar or a recently colonizing population inthe east is unknown. However, the morphologicaland genetic analyses indicate that this individualcannot be distinguished from those obtained in thewestern portion of the island.
The population of C. leucogaster on the island ofMayotte, about 300 km from the coast of Mada -gascar at the level of Mahajanga, is not distinguish-able in morphological or genetic aspects from ani-mals obtained in the western portion of Madagascar(see Fig. 2). In contrast, the population of C. leuco-gaster on Pemba, 1,000 km direct flight distancefrom the northwestern (Nosy Be) coast of Mada -gascar, shows notable morphological divergencefrom the Mala gasy populations of this taxon (Fig.2). How ever, genetically they are very similar (seediscussion below).
Genetic Variation in C. leucogaster
Analysis of cytochrome b sequence data pro-vides strong support for the monophyly of C. leuco-gaster across a region including Madagascar,Mayotte, and Pemba. This monophyly is also sup-ported by D-loop data, which shows more variationthan cytochrome b. Genetic variability within the C. leucogaster group is low: cytochrome b sequen -ces from 39 individuals yielded only six haplotypes,
Geographic and phylogeographic variation in Chaerephon leucogaster 45
each separated by no more than one mutational step.Samples from Pemba and Mayotte shared a cyto -chrome b haplotype with Malagasy samples, high-lighting their lack of genetic distinctness. The max-imum genetic distance between C. leucogasterhaplotypes was 0.35%, which is considerably lowerthan the mean inter-population distance of 1.7% reported for bats by Baker and Bradley (2006). Thissupports the idea that there may be a single, geneti-cally rather uniform C. leucogaster group across thestudy region, and that large bodies of water, such asthe Mozambique Channel, are not significant barri-ers to dispersal and gene flow.
The outgroup, C. pumilus from the eastern sideof Madagascar, forms a well-supported reciprocally-monophyletic group, sister to C. leucogaster andseparated from it by cytochrome b genetic (GTR-corrected) distances ranging from 1.8 to 2.7%.These distances appear to be more representative of the intraspecific (mean 1.6%, range 0.6–2.3%, n = 10) or even interpopulation (mean 1.7%, range1.4–1.9%, n = 2) values reported for bats by Bakerand Bradley (2006) than the values reported for sis-ter species (mean 8.3%, range 3.3–14.7%, n = 10),although it should be noted that no molossid bats areincluded in their sample. The maximum intraspecif-ic genetic distance between 49 M. leucostigma sam-ples from across Madagascar is 0.4% whilst the dis-tance (HKY85-corrected) between M. leucostigmaand its morphologically well-differentiated sisterspecies, M. condylurus, is 2.5% (Ratrimomanarivoet al., 2008). Similarly, the maximum cytochrome bdistance between 22 M. midas samples fromMadagascar and South Africa was 0.1% (Ratrimo -manarivo et al., 2007), whilst the distance (GTR-corrected) between sister species of Otomops mar-tiensseni (Matschie, 1897) and O. madagascariensisDorst, 1953, from Africa and Madagascar is 4.4%(Lamb et al., 2008). Thus, the leucogaster/pumilus(Madagascar) distance values of 1.8% to 2.7%,com bined with the well-supported reciprocal mono-phyly of each group, are consistent with the designa-tion of these taxa as separate species.
Genetic Variability in Molossids
Genetic variability within equivalent bat taxa ap-pears to vary greatly (4.45-fold at the species level— Baker and Bradley, 2006) and it appears that vari-ability in C. leucogaster is lower than that seen inthe non-molossid taxa analyzed by these authors.Further, there is a range of genetic variability with-in molossids, and C. leucogaster appears to fall
somewhere in the middle of this. Analysis of bothcytochrome b and D-loop sequence data showsmoderate variation within C. leucogaster relative toother molossid species groups. Haplotype diversityfor both cytochrome b and the D-loop (0.718, 0.870)is higher than that found for M. leucostigma (0.367,0.758) (authors’ unpublished data) and M. midas(0.608, 0.468), which has been reported to be veryconservative (Ratrimomanarivo et al., 2007). It islow, however, compared to values for comparablepopulations such as: Otomops madagascariensis(0.945, 0.968), O. martiensseni (0.876, 0.952) (authors’ unpublished data), and Tadarida brasilien-sis (0.987, 0.998) (Russell et al., 2005). Nucleotidediversity per site in C. leucogaster (0.0011, 0.0073)follows a similar trend, and is generally higher thanthat for the conservative M. leucostigma (0.0005,0.0009) and M. midas (0.0008, 0.0035), but lowcompared to values for comparable populations ofO. madagascariensis (0.0072, 0.0196) and O. mar-tiensseni (0.0036, 0.0302) (authors’ unpublisheddata).
Genetic Variation of C. leucogaster Samples fromMayotte and Pemba
Chaerephon leucogaster samples from Pembaand Mayotte, islands located 1,300 and 320 km (re-spectively) from the nearest coast of Madagascar,are identical to each other and not distinct frommainland Malagasy animals in their cytochrome bsequences. As expected, the faster-evolving D-loopprovides greater resolution and shows a degree ofdifferentiation, as the identical Pemba and Mayottesamples are a minimum of six mutational steps(1.4%) different from the mainland Madagascarsamples. The genetic similarity of animals fromPemba, Mayotte, and Madagascar might be an indi-cation of relatively frequent movement of C. leuco-gaster between these islands. The size difference be-tween the notably larger animals from Pemba andthe smaller animals from Mayotte and Madagascaris not reflected in the cytochrome b and D-loop sequences generated in this study.
Genetic Variation within Malagasy C. leucogasterSamples
Distinctiveness of Animals from the 13º Latitude BandThis sub-humid region, to the north of Mada -
gascar, includes the adjacent near shore islands ofNosy Be and Nosy Komba, the former approximate-ly 12 km distant from the Malagasy mainland. It is
separated from the mid-latitude dry deciduous forestzone (15º to 17ºS) (Cornet’s Bioclimatic Zone 3) bya region of habitat classified by the MaxEnt eco-logical niche modeling as ‘unsuitable’ for C. leu-cogaster (Fig. 4) and corresponds to Cornet’s Bio -climatic Zone 4.
Eight out of nine sample animals from the 13ºSzone exhibit a unique cytochrome b haplotype. Thispattern is repeated with the D-loop, where 17 out of18 samples show a unique haplotype. Thus, samplesfrom this region appear to show a level of phylogeo-graphic concordance. Although the genetic distancesseparating the 13ºS sample group from the nearesthaplotype in the network are low (one mutationalstep — 0.1% and 0.3% for cytochrome b and D-loop, respectively) they are significant, as isdemonstrated by the Nested Clade PhylogeographicAnalysis of the D-loop data (Fig. 10, Table 7), whichshows significant associations within clades 1.2,2.1, and the total cladogram.
The 12 km distance between Nosy Be and themainland does not appear to be a barrier to geneflow, given the genetic identity of the island andmainland samples within the 13°S region. This isnot surprising, as samples from Mayotte and Pemba,which are separated by a far greater distance (980km), have common cytochrome b and D-loop haplo-types.
Distinctiveness of Animals from the 22° to 23°S Latitudinal Band
This region, in the sub-arid southwest of Mada -gascar, includes samples from Toliara and Sakaraha.It is separated from the mid-latitude band contain-ing dry deciduous forest (15º to 17ºS) (Cornet’sBioclimatic Zone 3) by a region classified by theMaxent ecological niche modeling as ‘unsuitable’for C. leucogaster (Fig. 4) and corresponds to Cor -net’s Bioclimatic Zones 1 and 2.
Cytochrome b data shows no difference betweensamples from this region and those from areas to the north. However, analysis of the more variable D-loop data shows that samples from this regionform two exclusive haplotypes, one mutational stepdistinct from each other and the rest of the network(Fig. 8). Samples from this region are thus genetical-ly distinct, although the difference is shallow. Thisdistinction is supported by the results of the NestedClade Phylogeographic Analysis (Fig. 10, Table 7),which show significant associations within clades1.3, 2.2, and the total cladogram. These may be at-tributed to the exclusive location of certain D-loophaplotypes in the sub-arid 22º to 23ºS latitude zone.
46 F. H. Ratrimomanarivo, S. M. Goodman, W. T. Stanley, T. Naidoo, P. J. Taylor, et al.
Concordance of Morphological and GeneticVariation of C. leucogaster within Madagascar
As mentioned previously, C. leucogaster showsgeographic variation in size in portions of westernMadagascar. Animals from the sub-arid area of the island in the extreme south and southwest(OTUs 1 and 2) and the northerly sub-humid regionat 13º (OTU 4), are larger in certain measurementsthan those of the dry deciduous forest zones of the central west (OTU 3). These patterns of geo-graphical variation are concordant with genetic data,which indicate that samples from OTUs 1 and 2 andOTU 4 exhibit unique D-loop haplotypes, eventhough the genetic distance separating them fromthe rest of the network is low (one mutational step in each case). The D-loop data are also concor-dant with the results of the MaxEnt modeling (Fig. 4).
Nested Clade Analysis gives several interpreta-tions, which might explain these concordances. Inthe case of the genetically distinct samples fromOTUs 1 and 2 and OTU 4, these include apparentlong distance colonization (across the regions of‘unsuitable habitat’) (Table 7). Other explanationsinclude restricted gene flow with some dispersalover intermediate areas not occupied by the speciesor past gene flow followed by extinction of interme-diate populations. Another explanation is that thereis some clinal genetic variation between the south-western and northwestern regions, and the lack ofsamples from this intermediate zone has yielded a certain artificial separation of populations fromthese different regions.
Expansion of C. leucogaster populations
Analysis of diversity and neutrality statistics forC. leucogaster from Madagascar, Mayotte, andPemba indicate that it is likely that this populationhas been expanding for between 5,842 and 11,143years. These values, in the absence of suitable chi-ropteran D-loop substitution rates in the literature,were based on rates reported by Rogers and Harp -ending (1992) for primates, given the similarity ofchiropteran and primate cytochrome b substitutionrates (Nabholz et al., 2008). Allowing for this as-sumption, it is still likely that the C. leucogasterpopulation expansion began long before human colonization of the island, dated at about 2,300 BP(Burney et al., 2004), and the subsequent con-struction of building architectural styles primarilyused over the past century by this species for day
roosting. Chaerephon leucogaster populations havethus been expanding roughly since the last glacialmaximum, although whether this could have caused a population bottleneck, perhaps due to the preva-lence of cooler, drier conditions, vegetation changes,and consequent loss of suitable habitat for roostingremains a matter for speculation, but certain aspectscan be addressed.
Few precise details are available on changes invegetational types in lowland areas of the westernhalf of the island, the region this bat species isfound, but, in general, the late Pleistocene and Hol -ocene of Madagascar saw a shift to drier climatesand more arid natural vegetational types (Burney,1997, 1999). These changes were most notable inthe extreme southwest portion of the island, the zonethe MaxEnt analysis indicates as the most suitablehabitat for this species; a result that is contradictivewith regards to Holocene climatic changes creatingpopulation genetic bottlenecks. At the beginning ofthis projected period of population expansion (5,842and 11,143 years ago), C. leucogaster occupied nat-ural day roost sites. The apparent recent shift fromnatural sites to synanthropic sites within the pastcentury may have allowed for a massive expansionof the effective population size of C. leucogaster aswell as presumed expansion of its geographic distri-bution. However, based on our calculations, as theexpansion appears to have begun before synanthrop-ic sites were available, this begs the question as tothe nature of the original day roost sites, and the rea-son for their abandonment in favor of synanthropicsites. It is important to mention that over the pastfew hundred years forest cover in the lowland portions of the island has been massively reducedassociated with anthropogenic actions (Green andSussman, 1990; Smith, 1997; Har per et al., 2007)and, as this species is known to roost in trees of na-tive forest, these changes may have had a consider-able impact on population structure.
Recently Peterson and Nyári (2008) found usingan overlay of ecological niche model reconstruc-tions of Pleistocene late glacial maxima on previ-ously hypothesized molecular phylogroups, that in a genus of South American bird there is consider-able concordance between patterns of speciation andLate Pleistocene geography associated with climaticchanges. This study highlights that signals of inter-preted population expansion dates to the late glacialmaximum may not be ‘population bottlenecks’ butrather actual speciation events.
In many ways the patterns of morphological andgenetic variation in C. leucogaster across the islands
Geographic and phylogeographic variation in Chaerephon leucogaster 47
in the western Indian Ocean shows parallels withthose found in M. leucostigma (Ratrimomanarivo etal., 2008) on Madagascar. This species shows no-table morphological differences between the easternand western slopes of the island, under very dif-ferent bioclimatic regimes. However, these differentpopulations, as well as on two islands in the Como -ros (Mohéli and Anjouan), show remarkably littlehaplotypic or genetic distinctiveness. Hence, as inC. leucogaster, an adaptive aspect associated withmeteorological, dietary or other factors seems thebest means to explain the morphological patterns inthese taxa. We are currently conducting parallelstudies with the other synanthropic molossids onMadagascar to determine if this is a common patternamongst them.
ACKNOWLEDGEMENTS
Field research associated with this paper has been generous-ly supported by Conservation International (CABS and CEPF),The John T. and Catherine D. MacArthur Foundation, and theVolkswagen Foundation; genetic analyses were financed by thelatter organization. On Madagascar, we are grateful to theDirection des Eaux et Forêts and Association National pour laGestion des Aires Protégées, on Mayotte to Direction del’Agriculture, and on Pemba to Bakari Asseid, Department ofCommercial Crops, Fruits and Forestry, Zanzibar, for issuingpermits to conduct faunal surveys and aid in numerous ways.The Critical Ecosystem Partnership Fund supported the work onPemba. The Critical Ecosystem Partnership Fund is a joint initiative of Conservation International, the Global Environ -ment Facility, the Government of Japan, the MacArthurFoundation, and the World Bank. A fundamental goal is to ensure civil society is engaged in biodiversity conservation. Forassistance in the field, we thank Eddy Rakotonandrasana, Julie Ranivo, Jirot Rakotomavo, Vola Razakarivony, andJacobin Ranaivo in Mad a gascar; Fabien Barthelat on Mayotte;and Philip Kihaule and Maiko Munissi on Pemba. JL and PJT acknowledge financial assistance of the South AfricanNational Research Found ation (NRF). For access to specimensunder their care, we are indebted to Jean-Marc Pons, Muséumnational d’Histoire naturelle, Paris; Paulina Jenkins, TheNatural History Museum, London; Michael D. Carleton andLinda Gordon, National Muse um of Natural History, Wash -ington, D.C.; and Judy Chupasko, Museum of ComparativeZoology, Cambridge, Massachusetts. Lucienne Wilmé kindlyprepared Fig. 1.
LITERATURE CITED
ALLEN, J. A. 1917. The American Museum Congo expeditioncollection of bats. Bulletin American Museum of NaturalHistory, 37: 405–478.
BAKER, R. J., and R. D. BRADLEY. 2006. Speciation in mammalsand the genetic species concept. Journal of Mammalogy, 87:643–662.
BURNEY, D. A. 1997. Theories and facts regarding Holocene en-vironmental change before and after human colonization.
Pp. 75–89, in Natural change and human impact in Mada -gascar (S. M. GOODMAN and B. D. PATTERSON, eds.). Smith -sonian Institution Press, Washington, D.C., xiii + 432 pp.
BURNEY, D. A. 1999. Rates, patterns, and processes of landscapetransformation and extinction in Madagascar. Pp. 145–164,in Extinctions in near time (R. D. E. MACPHEE, ed.). Klu -wer, New York, 384 pp.
BURNEY, D. A., L. P. BURNEY, L. R. GODFREY, W. L. JUNGERS, S. M. GOODMAN, H. T. WRIGHT, and A. J. T. JULL. 2004. A chro nology for late prehistoric Madagascar. Journal ofHuman Evolution, 47: 25−63.
CHAPERON, P., J. DANLOUX, and L. FERRY. 1993. Fleuves et ri-vière de Madagascar. ORSTOM, Paris, 874 pp.
CLEMENT, M., D. POSADA, and K. A. CRANDALL. 2000. TCS: A computer program to estimate gene genealogies. Mol ec -ular Ecology, 9: 1657–1660.
CORNET, A. 1974. Essai de cartographie bioclimatique à Mada -gascar. Notice Explicative de l’ORSTOM, 55: 1–28.
CRANDALL, K. A., and A. R. TEMPLETON. 1993. Empirical testsof some predictions from coalescent theory with appli-cations to intraspecific phylogeny reconstruction. Genetics,
134: 959–969.DE WIT, M. J. 2003. Madagascar: heads it’s a continent, tails its
an island. Annual Review of Earth Planetary Science, 31:213–248.
DOLLMAN, G. 1908. On a collection of bats from Yola, northernNigeria, collected by Mr. G. W. Webster. Annals and Mag a -zine of Natural History, 2(8): 545–547.
DONQUE, G. 1975. Contribution géographique à l’étude du cli-mat de Madagascar. Nouvelle Imprimerie des Arts Gra -phiques, Antananarivo, vii + 478 pp.
EGER J. L., and L. MITCHELL. 2003. Chiroptera, bats. Pp.1287–1298, in Natural history of Madagascar (S. M. GOOD -MAN and J. P. BENSTEAD, eds.). The University of ChicagoPress, Chicago, xxi + 1709 pp.
ELITH, J., C. H. GRAHAM, R. P. ANDERSON, M. DUDIK, S. FER -RIER, et al. 2006. Novel methods improve prediction ofspecies’ distributions from occurrence data. Ecography, 29:129−151.
FELSENSTEIN, J. 1985. Confidence limits on phylogenies: an ap-proach using bootstrap. Evolution, 39: 783–791.
FELSENSTEIN, J., and H. KISHINO. 1993. Is there somethingwrong with the bootstrap on phylogenies? A reply to Hillisand Bull. Systematic Biology, 42: 193–200.
FREEMAN, P. W. 1981. A multivariate study of the family Mo-lo s sidae (Mammalia: Chiroptera): morphology, ecology,evo lution. Fieldiana: Zoology (N.S.), 7: 1–173.
FU, Y. X. 1997. Statistical tests of neutrality of mutations againstpopulation growth, hitchhiking, and background selection.Genetics, 147: 915−925.
FU, Y. X., and W. H. LI. 1993. Statistical tests of neutrality ofmutations. Genetics, 133: 693−709.
GAUTIER, L., and S. M. GOODMAN. 2008. Introduction à la flore.Pp. 103–139, in Paysage naturels et biodiversité de Mada -gascar (S. M. GOODMAN, ed.). Muséum National d’HistoireNaturelle, Paris, 669 pp.
GOODMAN, S. M., and S. G. CARDIFF. 2004. A new species of Chaerephon (Molossidae) from Madagascar with noteson other members of the family. Acta Chiropterologica, 6:227–248.
GOODMAN, S. M., D. ANDRIAFIDISON, R. ANDRIANAIVOARIVE-LO, S. G. CARDIFF, E. IFTICENE, R. K. B. JENKINS, A. KO -FOKY, T. MBOHOAHY, D. RAKOTONDRAVONY, J. RANIVO,
48 F. H. Ratrimomanarivo, S. M. Goodman, W. T. Stanley, T. Naidoo, P. J. Taylor, et al.
F. RATRI MO MANARIVO, J. RAZAFIMANAHAKA, and P. A. RA CEY.2005. The distribution and conservation of bats in the dryregions of Madagascar. Animal Conservation, 8: 153–165.
GRANDIDIER, A. 1869. Nyctinomus leucogaster. Revue et Ma-g asin de Zoologie, 21: 337.
GREEN, G. M., and R. W. SUSSMAN. 1990. Deforestation historyof the eastern rain forests of Madagascar from satellite im-ages. Science, 248: 212–215.
HARPER, G. J., M. K. STEININGER, C. J. TUCKER, D. JUHN, and F. HAWKINS. 2007. Fifty years of deforestation and fragmen-tation in Madagascar. Environmental Conservation, 34: 1–9.
HATT, R. T. 1928. Note sur un chéiroptère nouveau du SoudanFrançais. Bulletin de la Société Zoologique de France, 53:374–376.
HAYMAN, R. W., and J. E. HILL. 1971. The mammals of Africa.An identification manual. Part 2. Order Chiroptera. Smith -sonian Institution Press, Washington, D.C., 1–73 pp.
HELGEN, K. M., and T. L. MCFADDEN. 2001. Type specimens of recent mammals in the Museum of Comparative Zool-ogy. Bul letin of the Museum of Comparative Zoology, 157:93–181.
HIJMANS. R. J., S. E. CAMERON, J. L. PARRA, P. G. JONES, and A. JARVIS. 2005. Very high resolution interpolated climatesurfaces for global land areas. International Journal of Cli -matology, 25: 1965−1978.
HILLIS, D. M., and J. J. BULL. 1993. An empirical test of boot-strapping as a method for assessing confidence in phyloge-netic analysis. Systematic Biology, 42: 182–192.
HULL, J. M., and D. J. GIRMAN. 2005. Effects of Holocene cli-mate change on the historical demography of migratingsharp-shinned hawks (Accipiter striatus velox) in SouthAmerica. Molecular Ecology, 14: 159–170.
HUTSON, A. M., S. P. MICKLEBURGH, and P. A. RACEY (comp.).2001. Micro chiropteran bats: global status survey and con-servation action plan. IUCN/SSC, Chiropteran SpecialistGroup, Gland, 258 pp.
IRWIN, D. M., T. D. KOCHER, and A. C. WILSON. 1991. Evolutionof the cytochrome b gene of mammals. Journal of MolecularEvolution, 32: 128–144.
KAUDERN, W. 1915. Säugetiere aus Madagaskar. Arkiv förZoologi, 9: 1–101.
KOFOKY, A. F., D. ANDRIAFIDISON, R. B. JENKINS, D. RAKO TON -DRAVONY, F. RATRIMOMANARIVO, J. H. RAZAFIMANA HA KA,and P. A. RACEY. 2007. Habitat use, roost selection and con-servation of bats in Tsingy de Bemaraha National Park, Mad -agascar. Biodiversity and Conservation, 16: 1039–1053.
KOOPMAN, K. F. 1994. Chiroptera: Systematics. Pp. 1–217, inHandbook of Zoology. (J. NIETHAMMER, H. SCHLIEMANN,and D. STARCK, eds.). Walter de Gruyter, Berlin, Volume 8,Part 60, vii + 217 pp.
LAMB, J. L., T. M. C. RALPH, S. M. GOODMAN, W. BOGDA -NOWICZ, J. FAHR, M. GAJEWSKA, P. J. J. BATES, J. EGER, P. BENDA, and P. J. TAYLOR. 2008. Phylogeography and pre-dicted distribution of African-Arabian and Malagasy popu-lations of giant mastiff bats, Otomops (Chiroptera: Molos -sidae). Acta Chiropterologica, 10: 21–40.
LOUETTE, M. 1999. La faune terrestre de Mayotte. Annales — Musée Royal de l’Afrique Centrale, Sci en ces Zoologiques,284: 1–247.
LOUETTE, M. 2004. Mammifères. Pp. 65–87, in La faune terres-tre de l’archipel des Comores (M. LOUETTE, D. MEITRE, andR. LOCQUE, eds.). Musée Royal de l’Afrique Centrale, Ter -vuren, 456 pp.
MARDULYN, P. 2001. Phylogeography of the Vosges mountainspopulations of Gonioctena pallida (Coleoptera: Chryso me -lidae): a nested clade analysis of mitochondrial DNA haplo-types. Molecular Ecology, 10: 1751–1763.
NABHOLTZ, B., S. GLÉMIN, and N. GALTIER. 2008. Strong var-iations of mitochondrial mutation rate across mammals — the longevity hypothesis. Molecular Biology and Evolution,25: 120–130.
NOUGIER, J., J. M. CANTAGREL, and J. P. KARCHE. 1986. TheComores Archipelago in the western Indian Ocean: volcan -ology, geochronology, and geodynamic setting. Journal ofAfrica Earth Science, 5: 135–145.
PAKENHAM, R. H. W. 1979. The birds of Zanzibar and Pem-ba: an annotated check-list. British Ornithologists UnionCheck-List No. 2, London, 134 pp.
PAKENHAM, R. H. W. 1984. The mammals of Zanzibar andPemba Islands. Privately published by the author, Har pen -den, 84 pp.
PANCHAL, M. 2007. The automation of Nested Clade Phylo geo -graphic analysis. Bioinformatics, 23: 509–510.
PETERSON, A. T., and Á. NYÁRI. 2008. Ecological niche conser-vatism and Pleistocene refugia in the thrush-like mourner,Schiffornis sp., in the Neotropics. Evolution, 62: 173−183.
PETERSON, R. L., J. L. EGER, and L. MITCHELL. 1995. Chiro -ptères. Volume 84. Faune de Madagascar. Muséum Nationald’Histoire Naturelle, Paris, 204 pp.
PHILLIPS, S. J., R. P. ANDERSON, and R. E. SCHAPIRE. 2006.Maximum entropy modelling of species geographic distri-butions. Ecological Modelling, 190: 231−259.
POSADA, D., and K. A. CRANDALL. 1998. Modeltest: testing themodel of DNA substitution. Bioinformatics, 14: 817–818.
POSADA, D., K. A. CRANDALL, and A. R. TEMPLETON. 2000.GeoDis: a program for the cladistic nested analysis of thegeographical distribution of genetic haplotypes. MolecularEcology, 9: 487–488.
RAKOTONANDRASANA, R. E. N. 2008. Inventaire des chauves-souris ans les îles de Nosy Be, de Nosy Komba et de Sainte-Marie: une étude faunistique et biogéographique. Mémoirede DEA, Département de Biologie Animale, Universitéd’Antananarivo, 105 pp.
RAKOTONANDRASANA, E., and S. M. GOODMAN. 2007. Bat in-ventories of the Madagascar offshore islands of Nosy Be,Nosy Komba and Ile Saint Marie. African Bat ConservationNewsletter, 12: 6–10.
RAKOTOSON RANIVO, J. C. 2007. Révision taxonomique des espèces de Microchiroptéra de la région sèche de Ma da -gascar et leur écomorphologie. Ph.D. Thesis, Départementde Biologie Animale, Université d’Antananarivo, 143 pp.
RANIVO, J., and S. M. GOODMAN. 2007. Patterns of ecomorpho-logical variation in the bats of western Madagascar: com -parisons among and between communities along a lati tu -dinal gradient. Mammalian Biology, 72: 1–13.
RATRIMOMANARIVO, F. H., J. VIVIAN, S. M. GOODMAN, and J. L.LAMB. 2007. Morphological and molecular assessment ofthe specific status of Mops midas (Chiroptera: Molossi-dae) from Madagascar and Africa. African Zoology, 42:237–263.
RATRIMOMANARIVO, F. H., S. M. GOODMAN, N. HOOSEN, P. J.TAYLOR, and J. LAMB. 2008. Morphological and molecularvariation in Mops leucostigma (Chiroptera: Molossidae) ofMadagascar and the Comoros: phylogeny, phylogeographyand geographic variation. Mitteilungen aus dem Ham bur gi -schen Zoologischen Museum 105: 57–101.
Geographic and phylogeographic variation in Chaerephon leucogaster 49
RODE, P. 1941. Catalogue des types de Mammifères du Muséumnational d’Histoire naturelle. Ordre des Chiroptères. Bul -letin du Muséum National d’Histoire Naturelle, Paris, 2èmesérie, 13: 227–252.
ROGERS, A. R., and H. HARPENDING. 1992. Population growthmakes waves in the distribution of pairwise genetic differ-ences. Molecular Biology and Evolution, 9: 552–569.
ROZAS, J., J. C. SÁNCHEZ DEL BARRIO, X. MESSEGUER, and R. ROZAS. 2003. DnaSP, DNA polymorphism analyses by the co alescent and other methods. Bioinformatics, 19:2496–2497.
RUSS, J., D. BENNETT, K. ROSS, and A. KOFOKY. 2003. The batsof Madagascar: a field guide with descriptions of echoloca-tion calls. Viper Press, Glossop, 96 pp.
RUSSELL, A. L., R. A. MEDELLIN, and G. F. MCCRACKEN. 2005.Genetic variation and migration in the Mexican free-tailedbat (Tadarida brasiliensis mexicana). Molecular Ecology,14: 2207–2222.
SAIKI, R. K., D. H. GELFORD, S. STOFFEL, S. J. SCHARF, R. G. HI -GUCHI, G. T. HORN, K. B. MULLIS, and H. A. HENLICH. 1988.Primer-directed enzymatic amplification of DNA with a ther mostable DNA polymerase. Science, 239: 487–491.
SIMMONS, N. B. 2005. Order Chiroptera. Pp. 312–529, in Mam -mal species of the World: a taxonomic and geographic ref-erence, 3rd edition (D. E. WILSON and D. M. REEDER, eds.).The Johns Hopkins University Press, Baltimore, 2142 pp.
SMITH, A. P. 1997. Deforestation, fragmentation, and reserve design in western Madagascar. Pp. 415–441, in Tropical forest remnants: ecology, management, and conservation of fragmented communities (W. F. LAURANCE and R. O. W.BIER REGAARD, JR., eds.). The University of Chicago Press,Chi cago, 632 pp.
STANLEY, W. T. 2008. A new species of Mops (Molossidae) from Pemba Island, Tanzania. Acta Chiropterologica, 10:183–192.
STOCKLEY, G. M. 1942. The geology of the Zanzibar Protec -torate and its relation to the East African mainland. Geo -logical Magazine, 79: 233–240.
SWOFFORD, D. L. 2002. PAUP*: phylogenetic analysis usingpar simony (*and other methods), version 4.0b10. SinauerAssociates, Sunderland.
SWYNNERTON, G. H., and R. W. HAYMAN. 1951. A checklist ofthe land mammals of the Tanganyika Territory and theZanzibar Protectorate. Journal of the East African NaturalHistory Society, 20: 274–392.
TAYLOR, P. J., J. M. LAMB, D. REDDY, T. NAIDOO, F. RATRIMO -MANARIVO, E. RICHARDSON, C. SCHOEMAN and S. M. GOOD -MAN. 2009. Cryptic lineages of little free-tailed bats, Cha -erephon pumilus (Chiroptera: Molossidae) from southernAfrica and the western Indian Ocean islands. African Zool -ogy, 44: 55–70.
TEELING, E. C., M. S. SPRINGER, O. MADSEN, P. BATES, S. J.O’BRIEN, and W. J. MURPHY. 2005. A molecular phylogenyfor bats illuminates biogeography and the fossil record. Sci ence, 307: 580–584.
THOMPSON, J. D., D. G. HIGGENS, and T. J. GIBSON. 1994.CLUSTAL W: improving the sensitivity of progressive mul-tiple sequence alignment through sequence weighting, posi-tion specific gap penalties and weight matrix choice. Nu -cleic Acids Research, 22: 4673–4680.
WILKINSON, G. S., and A. M. CHAPMAN. 1991. Length and se-quence variation in evening bat D-loop mtDNA. Genetics,128: 607−617.
50 F. H. Ratrimomanarivo, S. M. Goodman, W. T. Stanley, T. Naidoo, P. J. Taylor, et al.
Received 07 May 2008, accepted 22 December 2008
APPENDIX I
Material utilized during the course of this study. Specimen with museum numbers in normal script were used in the morphologicalstudy; those in italics were used in the extraction of cytochrome b; those in bold and italics for cytochrome b and D-loop; and thosein bold, italics, and underlined for D-loop
Chaerephon leucogasterMADAGASCAR: Province d’Antsiranana, Ambatozavavy
(Nosy Be), 13°22.012’S, 48°18.927’E, 13 Mar. 2006 (FMNH187753, 187757); Ambilobe, 13°11.5’S, 49°03.5’E, 23 May2003 (FMNH 176332, 176333, 176373); Betsiaka,13°09.421’S, 49°14.190’E, 8 Feb. 2004 (FMNH 179381);Dzamadzar (Nosy Be), 13°21.095’S, 48°11.307’E, 2 Jan. 2006(FMNH 188497, 188498, 188499, 188500); near Hell-ville(Nosy Be), 13°24.308’S, 48°18.201’E, 30 Dec. 2005, 13 Mar.2006 (FMNH 187750, 187751-187753, 187754-187755,
187756, 188495, 188496); Nosy Komba, 13°26.562’S,48°20.874’E, 15 Feb. 2006 (FMNH 188626-188628, 188639,188640, 188641, 188642-188644, 188646). Province deFianarantsoa, Manakara, 22°09.418’S, 48°01.009’E, 16 May2005 (FMNH 185228). Province de Mahajanga, Ambalanjana -komby, 16°42.062’S, 46°04.304’E, 10–12 Mar. 2005 (FMNH184921, 184922–184926, 184927, 184928, 184931–184934,
184937–184944, 184946–184949); Ambondromamy,16º26.173’S, 47º09.329’E, 14–15 Mar. 2005 (FMNH 184950–184954); Andranofasika, 16°20.229’S, 46°50.794’E, 16–17Mar. 2005 (FMNH 184955–184959, 184960–184962, 184968,184970); Ankazomborona, 16º06.961’S, 46º45.400’E, 18, 20,22 Mar. 2005 (FMNH 184975–184979, 184982, 184983,184986, 184988, 184993–184995); Ankijabe, 16°24.807’S,46°45.876’E, 18 Mar. 2005 (FMNH 184973–184974); Anta -nim bary, 17º11.104’S, 46º51.306’E, 3 Mar. 2005 (FMNH184891–184895, 184896–184902, 184903–184907); Antsalova,18.40°S, 44.37°E, 20 Feb. 2001 (FMNH 169671, 169696);Berivotra, 15°54.245’S, 46°35.873’E, 25 Mar. 2005 (FMNH185016–185019, 185020–185022, 185023–185026, 185027–185029, 185030, 185031, 185033, 185034); Katsepy,15°45.805’S, 46°14.695’E, 20 Oct. 2002 (FMNH 175889–175893); Maevatanana, 16°57.452’S, 46°49.433’E, 7–8 Mar.2005 (FMNH 184910, 184911, 184914, 184915–184917,
Geographic and phylogeographic variation in Chaerephon leucogaster 51
APPENDIX I. Continued
184918, 184919–184920); Mahajanga, 15°42.778’S,46°18.752’E, 3–6 Dec. 2004, 24 Mar. 2005 (FMNH 184604–184608, 184609, 184611–184619, 184621–184624, 184627,184630–184636, 184638–184643, 184646, 184648–184650,185006, 185010–185013). Province de Toliara, Andranovory,23°08.481’S, 44°08.769’E, 14 Oct. 2004 (FMNH 184476,184477); Ankililoaka, 22°46.548’S, 43°36.889’E, 17 Feb. 2003(FMNH 176186, 176189); Belo sur Mer, 20°44.139’S,44°00.266’E, 11 Nov. 2002 (FMNH 176130–176136, 176137[neotype], 176138–176141); Forêt de Zombitse, 22°49.07’S,44°44.01’E, 17 Apr. 1993 (FMNH 151946); Kirindy–Mite,20°53.2’S, 44°04.8’E, 16 Nov. 2002 (FMNH 176111);Morombe, 21°44.417’S, 43°22.333’E, 17 Mar. 2003 (FMNH176175–176177, 176181, 176185); Sakaraha, 22°54.546’S,44°31.574’E, 15, 18, 19 Oct. 2004 (FMNH 184250,184252–184254, 184256–184258, 184259, 184260, 184262,184263–184264); Toliara, 23°23.704’S, 43°43.219’E, 7, 11 Oct. 2004 (FMNH 184237, 184238–184240, 184241,184244–184247); Tsifota, 22°49.445’S, 43°21.913’E, 22 Feb.2003 (FMNH 176190); ARCHIPEL DES COMORES: Mayotte,Coconi, 12°49.923’S, 45°08.215’E, 27 Feb. 2007 (FMNH194019); Mayotte, Poroani, 12°53.609’S, 45°08.550’E, 27 Feb.2007 (FMNH 194028); TANZANIA: Pemba Island, Kaskazani,4.96487°S, 39.71456°E, 5 Aug. 2006 (FMNH 192817–192821,192886, 192887, 192888, 192889, 192891– 192893).
Chaerephon pumilusMADAGASCAR: Province de Fianarantsoa, Ranomafana
(Ifanadiana), 21°15.456’S, 47°27.355’E, 28 Dec. 2005 (FMNH188088–188089); Ifanadiana, 21°18.394’S, 47°38.144’E, 25May 2005 (FMNH 185322); Farafangana, 22°49.275’S,47°49.860’S, 26 Apr. 2005 (FMNH 185259, 185260);Vohipeno, 22°21.997’S, 47°50.206’E, 8 May 2005 (FMNH185286); Manakara, 22°09.418’S, 48°01.009’E, 17 May 2005(FMNH 185314, 185315); Vangaindrano, 23°21.300’S,47°35.763’E, 23 Apr. 2005 (FMNH 185230). Province de Toa -masina, Ranomafana–Antsinanana, 18°57.636’S, 48°50.845’E,11 Nov. 2005 (FMNH 187834–187835); Toamasina,18°08.441’S, 49°22.670’E, 21, 25 Oct. 2005 (FMNH 187797,187799, 187816); Anjiro, 18°52.945’S, 47°58.245’E, 7 Feb.2005 (FMNH 184678).
Mops leucostigmaMADAGASCAR: Province de Mahajanga, Ankazom -
borona, 16°06.961’S, 46°45.400’E, 18 Mar. 2005 (FMNH185098); ARCHIPEL DES COMORES: Mohéli Island, Fombo -ni, 12°16.882’S, 43°44.272’E, 29 Nov. 2006 (FMNH 194508).
Mops midasMADAGASCAR: Province de Toliara, Sakaraha,
22°54.429’S, 44°31.793’E, 20 Oct. 2004 (FMNH 184306).
APPENDIX II
Cytochrome b haplotype data for different taxa used in the phylogeographic analysis
Taxon Hap N Sample codes
C. leucogaster 1 19 FMNH 192886, 184259, 184954, 184955, 184956, 184957, 184958, 184959, 185030,188496, 184923, 184922, 184239, 184240, 184238, 194028, 192889, 194019, 185228
2 2 FMNH 184923, 1849243 5 FMNH 184925, 184926, 184950, 184951, 1849534 4 FMNH 184975, 184976, 184977, 1849785 1 FMNH 1849796 8 FMNH 187754, 187755, 188498, 187750, 188643, 188642, 188640, 188644
C. pumilus 8 4 FMNH 185230, 185259, 185286, 1853149 1 FMNH 187816
10 1 FMNH 18532211 1 FMNH 184678
M. leucostigma 12 1 FMNH 194508 M. midas 13 1 FMNH 184306
APPENDIX III
D-loop haplotype data for different taxa used in the phylogeographic analysis
Taxon Hap N Sample codes
C. leucogaster 1 2 FMNH 184263, 1842642 18 FMNH 187750, 187751, 187752, 187753, 187754, 187755, 187756, 188495, 188497, 188498,
188499, 188500, 188640, 188641, 188642, 188643, 188644, 185228.3 4 FMNH 184237, 184238, 184239, 184240
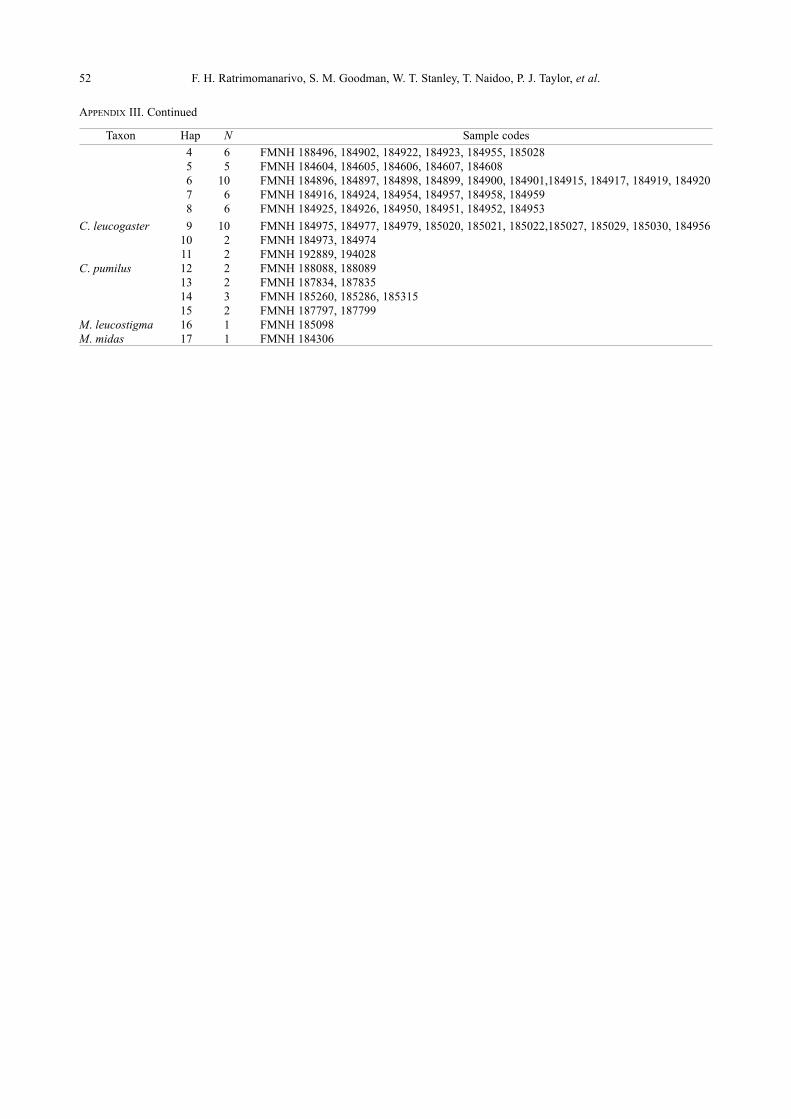
52 F. H. Ratrimomanarivo, S. M. Goodman, W. T. Stanley, T. Naidoo, P. J. Taylor, et al.
APPENDIX III. Continued
4 6 FMNH 188496, 184902, 184922, 184923, 184955, 1850285 5 FMNH 184604, 184605, 184606, 184607, 184608 6 10 FMNH 184896, 184897, 184898, 184899, 184900, 184901,184915, 184917, 184919, 1849207 6 FMNH 184916, 184924, 184954, 184957, 184958, 184959 8 6 FMNH 184925, 184926, 184950, 184951, 184952, 184953
C. leucogaster 9 10 FMNH 184975, 184977, 184979, 185020, 185021, 185022,185027, 185029, 185030, 18495610 2 FMNH 184973, 18497411 2 FMNH 192889, 194028
C. pumilus 12 2 FMNH 188088, 18808913 2 FMNH 187834, 18783514 3 FMNH 185260, 185286, 18531515 2 FMNH 187797, 187799
M. leucostigma 16 1 FMNH 185098M. midas 17 1 FMNH 184306
Taxon Hap N Sample codes
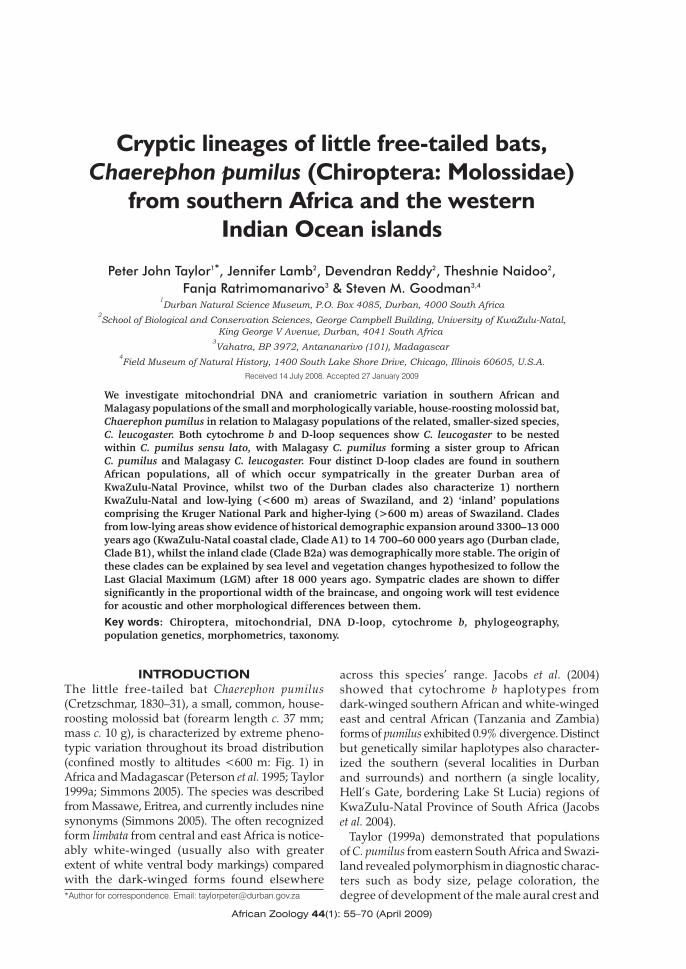
Cryptic lineages of little free-tailed bats,Chaerephon pumilus (Chiroptera: Molossidae)
from southern Africa and the westernIndian Ocean islands
Peter John Taylor1*, Jennifer Lamb
2, Devendran Reddy
2, Theshnie Naidoo
2,
Fanja Ratrimomanarivo3& Steven M. Goodman
3,4
1
Durban Natural Science Museum, P.O. Box 4085, Durban, 4000 South Africa
2
School of Biological and Conservation Sciences, George Campbell Building, University of KwaZulu-Natal,
King George V Avenue, Durban, 4041 South Africa
3
Vahatra, BP 3972, Antananarivo (101), Madagascar
4
Field Museum of Natural History, 1400 South Lake Shore Drive, Chicago, Illinois 60605, U.S.A.
Received 14 July 2008. Accepted 27 January 2009
We investigate mitochondrial DNA and craniometric variation in southern African andMalagasy populations of the small and morphologically variable, house-roosting molossid bat,Chaerephon pumilus in relation to Malagasy populations of the related, smaller-sized species,C. leucogaster. Both cytochrome b and D-loop sequences show C. leucogaster to be nestedwithin C. pumilus sensu lato, with Malagasy C. pumilus forming a sister group to AfricanC. pumilus and Malagasy C. leucogaster. Four distinct D-loop clades are found in southernAfrican populations, all of which occur sympatrically in the greater Durban area ofKwaZulu-Natal Province, whilst two of the Durban clades also characterize 1) northernKwaZulu-Natal and low-lying (<600 m) areas of Swaziland, and 2) ‘inland’ populationscomprising the Kruger National Park and higher-lying (>600 m) areas of Swaziland. Cladesfrom low-lying areas show evidence of historical demographic expansion around 3300–13 000years ago (KwaZulu-Natal coastal clade, Clade A1) to 14 700–60 000 years ago (Durban clade,Clade B1), whilst the inland clade (Clade B2a) was demographically more stable. The origin ofthese clades can be explained by sea level and vegetation changes hypothesized to follow theLast Glacial Maximum (LGM) after 18 000 years ago. Sympatric clades are shown to differsignificantly in the proportional width of the braincase, and ongoing work will test evidencefor acoustic and other morphological differences between them.
Key words: Chiroptera, mitochondrial, DNA D-loop, cytochrome b, phylogeography,population genetics, morphometrics, taxonomy.
INTRODUCTIONThe little free-tailed bat Chaerephon pumilus(Cretzschmar, 1830–31), a small, common, house-roosting molossid bat (forearm length c. 37 mm;mass c. 10 g), is characterized by extreme pheno-typic variation throughout its broad distribution(confined mostly to altitudes <600 m: Fig. 1) inAfrica and Madagascar (Peterson et al. 1995; Taylor1999a; Simmons 2005). The species was describedfrom Massawe, Eritrea, and currently includes ninesynonyms (Simmons 2005). The often recognizedform limbata from central and east Africa is notice-ably white-winged (usually also with greaterextent of white ventral body markings) comparedwith the dark-winged forms found elsewhere
across this species’ range. Jacobs et al. (2004)showed that cytochrome b haplotypes fromdark-winged southern African and white-wingedeast and central African (Tanzania and Zambia)forms of pumilus exhibited 0.9% divergence. Distinctbut genetically similar haplotypes also character-ized the southern (several localities in Durbanand surrounds) and northern (a single locality,Hell’s Gate, bordering Lake St Lucia) regions ofKwaZulu-Natal Province of South Africa (Jacobset al. 2004).
Taylor (1999a) demonstrated that populationsof C. pumilus from eastern South Africa and Swazi-land revealed polymorphism in diagnostic charac-ters such as body size, pelage coloration, thedegree of development of the male aural crest and
African Zoology 44(1): 55–70 (April 2009)
*Author for correspondence. Email: [email protected]
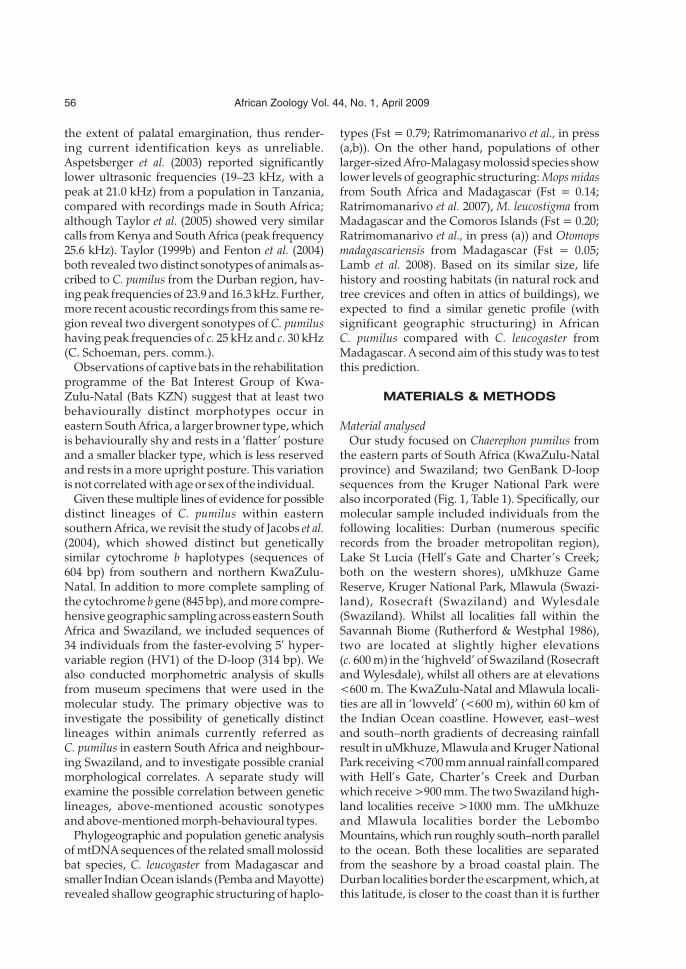
the extent of palatal emargination, thus render-ing current identification keys as unreliable.Aspetsberger et al. (2003) reported significantlylower ultrasonic frequencies (19–23 kHz, with apeak at 21.0 kHz) from a population in Tanzania,compared with recordings made in South Africa;although Taylor et al. (2005) showed very similarcalls from Kenya and South Africa (peak frequency25.6 kHz). Taylor (1999b) and Fenton et al. (2004)both revealed two distinct sonotypes of animals as-cribed to C. pumilus from the Durban region, hav-ing peak frequencies of 23.9 and 16.3 kHz. Further,more recent acoustic recordings from this same re-gion reveal two divergent sonotypes of C. pumilushaving peak frequencies of c. 25 kHz and c. 30 kHz(C. Schoeman, pers. comm.).
Observations of captive bats in the rehabilitationprogramme of the Bat Interest Group of Kwa-Zulu-Natal (Bats KZN) suggest that at least twobehaviourally distinct morphotypes occur ineastern South Africa, a larger browner type, whichis behaviourally shy and rests in a ‘flatter ’ postureand a smaller blacker type, which is less reservedand rests in a more upright posture. This variationis not correlated with age or sex of the individual.
Given these multiple lines of evidence for possibledistinct lineages of C. pumilus within easternsouthern Africa, we revisit the study of Jacobs et al.(2004), which showed distinct but geneticallysimilar cytochrome b haplotypes (sequences of604 bp) from southern and northern KwaZulu-Natal. In addition to more complete sampling ofthe cytochrome b gene (845 bp), and more compre-hensive geographic sampling across eastern SouthAfrica and Swaziland, we included sequences of34 individuals from the faster-evolving 5’ hyper-variable region (HV1) of the D-loop (314 bp). Wealso conducted morphometric analysis of skullsfrom museum specimens that were used in themolecular study. The primary objective was toinvestigate the possibility of genetically distinctlineages within animals currently referred asC. pumilus in eastern South Africa and neighbour-ing Swaziland, and to investigate possible cranialmorphological correlates. A separate study willexamine the possible correlation between geneticlineages, above-mentioned acoustic sonotypesand above-mentioned morph-behavioural types.
Phylogeographic and population genetic analysisof mtDNA sequences of the related small molossidbat species, C. leucogaster from Madagascar andsmaller Indian Ocean islands (Pemba and Mayotte)revealed shallow geographic structuring of haplo-
types (Fst = 0.79; Ratrimomanarivo et al., in press(a,b)). On the other hand, populations of otherlarger-sized Afro-Malagasy molossid species showlower levels of geographic structuring: Mops midasfrom South Africa and Madagascar (Fst = 0.14;Ratrimomanarivo et al. 2007), M. leucostigma fromMadagascar and the Comoros Islands (Fst = 0.20;Ratrimomanarivo et al., in press (a)) and Otomopsmadagascariensis from Madagascar (Fst = 0.05;Lamb et al. 2008). Based on its similar size, lifehistory and roosting habitats (in natural rock andtree crevices and often in attics of buildings), weexpected to find a similar genetic profile (withsignificant geographic structuring) in AfricanC. pumilus compared with C. leucogaster fromMadagascar. A second aim of this study was to testthis prediction.
MATERIALS & METHODS
Material analysedOur study focused on Chaerephon pumilus from
the eastern parts of South Africa (KwaZulu-Natalprovince) and Swaziland; two GenBank D-loopsequences from the Kruger National Park werealso incorporated (Fig. 1, Table 1). Specifically, ourmolecular sample included individuals from thefollowing localities: Durban (numerous specificrecords from the broader metropolitan region),Lake St Lucia (Hell’s Gate and Charter’s Creek;both on the western shores), uMkhuze GameReserve, Kruger National Park, Mlawula (Swazi-land), Rosecraft (Swaziland) and Wylesdale(Swaziland). Whilst all localities fall within theSavannah Biome (Rutherford & Westphal 1986),two are located at slightly higher elevations(c. 600 m) in the ‘highveld’ of Swaziland (Rosecraftand Wylesdale), whilst all others are at elevations<600 m. The KwaZulu-Natal and Mlawula locali-ties are all in ‘lowveld’ (<600 m), within 60 km ofthe Indian Ocean coastline. However, east–westand south–north gradients of decreasing rainfallresult in uMkhuze, Mlawula and Kruger NationalPark receiving <700 mm annual rainfall comparedwith Hell’s Gate, Charter’s Creek and Durbanwhich receive >900 mm. The two Swaziland high-land localities receive >1000 mm. The uMkhuzeand Mlawula localities border the LebomboMountains, which run roughly south–north parallelto the ocean. Both these localities are separatedfrom the seashore by a broad coastal plain. TheDurban localities border the escarpment, which, atthis latitude, is closer to the coast than it is further
56 African Zoology Vol. 44, No. 1, April 2009
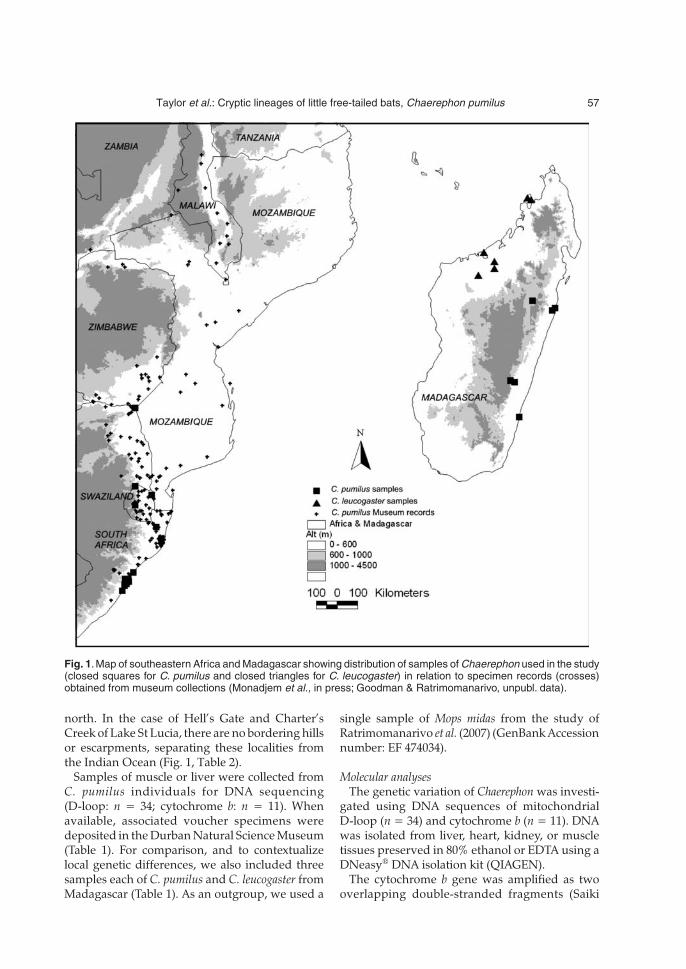
north. In the case of Hell’s Gate and Charter’sCreek of Lake St Lucia, there are no bordering hillsor escarpments, separating these localities fromthe Indian Ocean (Fig. 1, Table 2).
Samples of muscle or liver were collected fromC. pumilus individuals for DNA sequencing(D-loop: n = 34; cytochrome b: n = 11). Whenavailable, associated voucher specimens weredeposited in the Durban Natural Science Museum(Table 1). For comparison, and to contextualizelocal genetic differences, we also included threesamples each of C. pumilus and C. leucogaster fromMadagascar (Table 1). As an outgroup, we used a
single sample of Mops midas from the study ofRatrimomanarivo et al. (2007) (GenBank Accessionnumber: EF 474034).
Molecular analysesThe genetic variation of Chaerephon was investi-
gated using DNA sequences of mitochondrialD-loop (n = 34) and cytochrome b (n = 11). DNAwas isolated from liver, heart, kidney, or muscletissues preserved in 80% ethanol or EDTA using aDNeasy® DNA isolation kit (QIAGEN).
The cytochrome b gene was amplified as twooverlapping double-stranded fragments (Saiki
Taylor et al.: Cryptic lineages of little free-tailed bats, Chaerephon pumilus 57
Fig. 1.Map of southeastern Africa and Madagascar showing distribution of samples of Chaerephon used in the study(closed squares for C. pumilus and closed triangles for C. leucogaster) in relation to specimen records (crosses)obtained from museum collections (Monadjem et al., in press; Goodman & Ratrimomanarivo, unpubl. data).
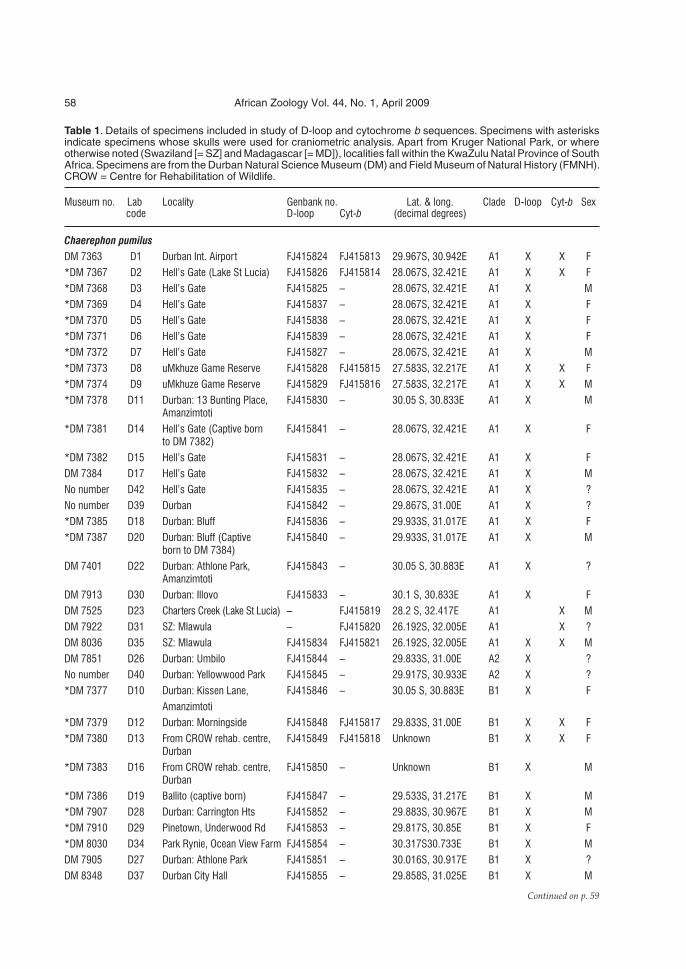
58 African Zoology Vol. 44, No. 1, April 2009
Table 1. Details of specimens included in study of D-loop and cytochrome b sequences. Specimens with asterisksindicate specimens whose skulls were used for craniometric analysis. Apart from Kruger National Park, or whereotherwise noted (Swaziland [= SZ] and Madagascar [= MD]), localities fall within the KwaZulu Natal Province of SouthAfrica.Specimens are from the Durban Natural Science Museum (DM) and Field Museum of Natural History (FMNH).CROW = Centre for Rehabilitation of Wildlife.
Museum no. Lab Locality Genbank no. Lat. & long. Clade D-loop Cyt-b Sexcode D-loop Cyt-b (decimal degrees)
Chaerephon pumilus
DM 7363 D1 Durban Int. Airport FJ415824 FJ415813 29.967S, 30.942E A1 X X F
*DM 7367 D2 Hell’s Gate (Lake St Lucia) FJ415826 FJ415814 28.067S, 32.421E A1 X X F
*DM 7368 D3 Hell’s Gate FJ415825 – 28.067S, 32.421E A1 X M
*DM 7369 D4 Hell’s Gate FJ415837 – 28.067S, 32.421E A1 X F
*DM 7370 D5 Hell’s Gate FJ415838 – 28.067S, 32.421E A1 X F
*DM 7371 D6 Hell’s Gate FJ415839 – 28.067S, 32.421E A1 X F
*DM 7372 D7 Hell’s Gate FJ415827 – 28.067S, 32.421E A1 X M
*DM 7373 D8 uMkhuze Game Reserve FJ415828 FJ415815 27.583S, 32.217E A1 X X F
*DM 7374 D9 uMkhuze Game Reserve FJ415829 FJ415816 27.583S, 32.217E A1 X X M
*DM 7378 D11 Durban: 13 Bunting Place, FJ415830 – 30.05 S, 30.833E A1 X MAmanzimtoti
*DM 7381 D14 Hell’s Gate (Captive born FJ415841 – 28.067S, 32.421E A1 X Fto DM 7382)
*DM 7382 D15 Hell’s Gate FJ415831 – 28.067S, 32.421E A1 X F
DM 7384 D17 Hell’s Gate FJ415832 – 28.067S, 32.421E A1 X M
No number D42 Hell’s Gate FJ415835 – 28.067S, 32.421E A1 X ?
No number D39 Durban FJ415842 – 29.867S, 31.00E A1 X ?
*DM 7385 D18 Durban: Bluff FJ415836 – 29.933S, 31.017E A1 X F
*DM 7387 D20 Durban: Bluff (Captive FJ415840 – 29.933S, 31.017E A1 X Mborn to DM 7384)
DM 7401 D22 Durban: Athlone Park, FJ415843 – 30.05 S, 30.883E A1 X ?Amanzimtoti
DM 7913 D30 Durban: Illovo FJ415833 – 30.1 S, 30.833E A1 X F
DM 7525 D23 Charters Creek (Lake St Lucia) – FJ415819 28.2 S, 32.417E A1 X M
DM 7922 D31 SZ: Mlawula – FJ415820 26.192S, 32.005E A1 X ?
DM 8036 D35 SZ: Mlawula FJ415834 FJ415821 26.192S, 32.005E A1 X X M
DM 7851 D26 Durban: Umbilo FJ415844 – 29.833S, 31.00E A2 X ?
No number D40 Durban: Yellowwood Park FJ415845 – 29.917S, 30.933E A2 X ?
*DM 7377 D10 Durban: Kissen Lane, FJ415846 – 30.05 S, 30.883E B1 X F
Amanzimtoti
*DM 7379 D12 Durban: Morningside FJ415848 FJ415817 29.833S, 31.00E B1 X X F
*DM 7380 D13 From CROW rehab. centre, FJ415849 FJ415818 Unknown B1 X X FDurban
*DM 7383 D16 From CROW rehab. centre, FJ415850 – Unknown B1 X MDurban
*DM 7386 D19 Ballito (captive born) FJ415847 – 29.533S, 31.217E B1 X M
*DM 7907 D28 Durban: Carrington Hts FJ415852 – 29.883S, 30.967E B1 X M
*DM 7910 D29 Pinetown, Underwood Rd FJ415853 – 29.817S, 30.85E B1 X F
*DM 8030 D34 Park Rynie, Ocean View Farm FJ415854 – 30.317S30.733E B1 X M
DM 7905 D27 Durban: Athlone Park FJ415851 – 30.016S, 30.917E B1 X ?
DM 8348 D37 Durban City Hall FJ415855 – 29.858S, 31.025E B1 X M
Continued on p. 59

et al. 1988). The 5’ fragment was amplified withprimers L14723 (5’-ACCAATGCAATGAAAAATCATCGTT-3’) and H15553 (5’-TAGGCAAATAGGAAATATCATTCTGGT-3’), whilst the 3’ fragmentwas amplified using L15146 (5’-CATGAGGACAAATATCATTCTGAG-3’) and H15915 (5’-TCTCCATTTCTGGTTTACAAGAC-3’) (Irwin et al.1991).
Polymerase Chain Reaction (PCR)-amplifica-tions were performed in 25 µl reaction volumeseach consisting of 9 µl genomic DNA solution
(containing 30 ngµ DNA), 0.8 µl sterile water, 2.5 µl10 × reaction buffer (Super-Therm), 4 µl MgCl2
(25 mM) (Super-Therm), 0.5 µl dNTP mix (10 mM)(Roche Diagnostics), 0.2 µl Taq polymerase (5 U/µl)(Super-Therm) and 4 µl each of forward andreverse primer (6 µM). Thermal cycling parametersconsisted of an initial denaturation step at 94°C for4 min, followed by 36 cycles of denaturation at94°C for 60 s, annealing at 50°C for 90 s, extensionat 72°C for 2 min, and a final extension step at 72°Cfor 10 min.
Taylor et al.: Cryptic lineages of little free-tailed bats, Chaerephon pumilus 59
Table 1 (continued )
Museum no. Lab Locality Genbank no. Lat. & long. Clade D-loop Cyt-b Sexcode D-loop Cyt-b (decimal degrees)
DM 8437 D38 SZ: Rosecraft – FJ415823 26.632S, 31.293E B2a X ?
*DM 8042 D36 SZ: Wylesdale FJ415856 FJ415822 25.819S, 31.292E B2a X X F
No number D43 Durban FJ415857 – Not available B2a X ?
No number Kruger NP AY347954 – 22.417S, 31.3E B2a X ?
No number Kruger NP AY347955 – 22.417S, 31.3E B2a X ?
FMNH 187816 MD: Fanandrana – – 18.252 S, 49.268E – X F
FMNH 185322 MD: Ifanadiana – – 21.307 S, 47.636E – X F
FMNH 184656 MD: Ambatondrazaka – – 17.830 S, 48.419E – X F
FMNH 185260 MD: Farafangana – – 22.821 S, 47.831E – X M
FMNH 187799 MD: Toamasina – – 18.141 S, 49.378E – X M
FMNH 188088 MD: Ranomafana – – 21.258 S, 47.456E – X F
Chaerephon leucogaster
FMNH 184924 MD: Ambalanjanakomby – – 16.701 S, 46.072E – X M
FMNH 184979 MD: Ankazomborona – – 16.116 S, 46.757E – X F
FMNH 188644 MD: Nosy Komba – – 13.443 S, 48.348E – X F
FMNH 184974 MD: Ankijabe – – 16.414 S, 46.765E – X F
FMNH 188500 MD: Dzamadzar – – 13.353 S, 48.192E – X F
FMNH 184608 MD: Mahajanga – – 15.713 S, 46.313E – X M
Mops midas
FMNH 184306 MD: Sakaraha EF 474034 – 22.907S, 44.530E – X X ?
Table 2. Summary of topographic, biome and climatic features of sampled localities.
Locality Altitude Annual rainfall Topography Biome
Durban <600 m >900 mm Close to escarpment edge Savanna
uMkhuze Game Reserve <600 m <700 mm Foothills of Lebombo Mts Savanna
Lake St Lucia, W Shores <600 m >900 mm No topography Savanna(Hell’s Gate, Charter’s Creek)
Swaziland ‘Highveld’ (Rosecraft, >600 m >1000 mm Highlands SavannaWylsdale)
Swaziland ‘Lowveld’ (Mlawula) <600 m <700 mm Foothills of Lebombo Mts Savanna
Kruger National Park <600 m <700 mm No notable topography Savanna
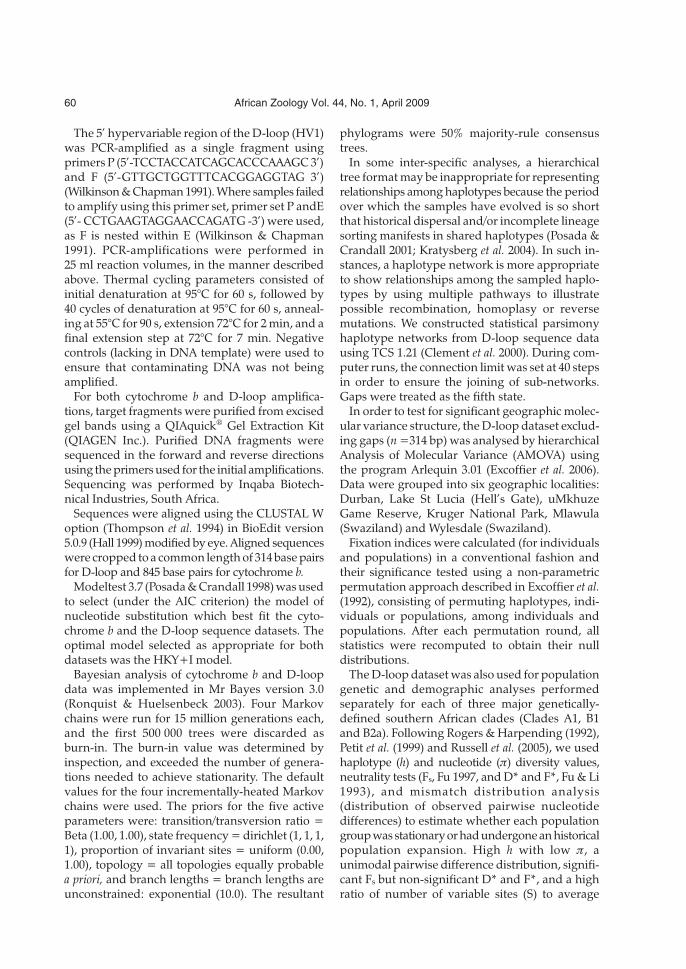
The 5’ hypervariable region of the D-loop (HV1)was PCR-amplified as a single fragment usingprimers P (5’-TCCTACCATCAGCACCCAAAGC 3’)and F (5’-GTTGCTGGTTTCACGGAGGTAG 3’)(Wilkinson & Chapman 1991). Where samples failedto amplify using this primer set, primer set P andE(5’- CCTGAAGTAGGAACCAGATG -3’) were used,as F is nested within E (Wilkinson & Chapman1991). PCR-amplifications were performed in25 ml reaction volumes, in the manner describedabove. Thermal cycling parameters consisted ofinitial denaturation at 95°C for 60 s, followed by40 cycles of denaturation at 95°C for 60 s, anneal-ing at 55°C for 90 s, extension 72°C for 2 min, and afinal extension step at 72°C for 7 min. Negativecontrols (lacking in DNA template) were used toensure that contaminating DNA was not beingamplified.
For both cytochrome b and D-loop amplifica-tions, target fragments were purified from excisedgel bands using a QIAquick® Gel Extraction Kit(QIAGEN Inc.). Purified DNA fragments weresequenced in the forward and reverse directionsusing the primers used for the initial amplifications.Sequencing was performed by Inqaba Biotech-nical Industries, South Africa.
Sequences were aligned using the CLUSTAL Woption (Thompson et al. 1994) in BioEdit version5.0.9 (Hall 1999) modified by eye. Aligned sequenceswere cropped to a common length of 314 base pairsfor D-loop and 845 base pairs for cytochrome b.
Modeltest 3.7 (Posada & Crandall 1998) was usedto select (under the AIC criterion) the model ofnucleotide substitution which best fit the cyto-chrome b and the D-loop sequence datasets. Theoptimal model selected as appropriate for bothdatasets was the HKY+I model.
Bayesian analysis of cytochrome b and D-loopdata was implemented in Mr Bayes version 3.0(Ronquist & Huelsenbeck 2003). Four Markovchains were run for 15 million generations each,and the first 500 000 trees were discarded asburn-in. The burn-in value was determined byinspection, and exceeded the number of genera-tions needed to achieve stationarity. The defaultvalues for the four incrementally-heated Markovchains were used. The priors for the five activeparameters were: transition/transversion ratio =Beta (1.00, 1.00), state frequency = dirichlet (1, 1, 1,1), proportion of invariant sites = uniform (0.00,1.00), topology = all topologies equally probablea priori, and branch lengths = branch lengths areunconstrained: exponential (10.0). The resultant
phylograms were 50% majority-rule consensustrees.
In some inter-specific analyses, a hierarchicaltree format may be inappropriate for representingrelationships among haplotypes because the periodover which the samples have evolved is so shortthat historical dispersal and/or incomplete lineagesorting manifests in shared haplotypes (Posada &Crandall 2001; Kratysberg et al. 2004). In such in-stances, a haplotype network is more appropriateto show relationships among the sampled haplo-types by using multiple pathways to illustratepossible recombination, homoplasy or reversemutations. We constructed statistical parsimonyhaplotype networks from D-loop sequence datausing TCS 1.21 (Clement et al. 2000). During com-puter runs, the connection limit was set at 40 stepsin order to ensure the joining of sub-networks.Gaps were treated as the fifth state.
In order to test for significant geographic molec-ular variance structure, the D-loop dataset exclud-ing gaps (n =314 bp) was analysed by hierarchicalAnalysis of Molecular Variance (AMOVA) usingthe program Arlequin 3.01 (Excoffier et al. 2006).Data were grouped into six geographic localities:Durban, Lake St Lucia (Hell’s Gate), uMkhuzeGame Reserve, Kruger National Park, Mlawula(Swaziland) and Wylesdale (Swaziland).
Fixation indices were calculated (for individualsand populations) in a conventional fashion andtheir significance tested using a non-parametricpermutation approach described in Excoffier et al.(1992), consisting of permuting haplotypes, indi-viduals or populations, among individuals andpopulations. After each permutation round, allstatistics were recomputed to obtain their nulldistributions.
The D-loop dataset was also used for populationgenetic and demographic analyses performedseparately for each of three major genetically-defined southern African clades (Clades A1, B1and B2a). Following Rogers & Harpending (1992),Petit et al. (1999) and Russell et al. (2005), we usedhaplotype (h) and nucleotide (π) diversity values,neutrality tests (Fs, Fu 1997, and D* and F*, Fu & Li1993), and mismatch distribution analysis(distribution of observed pairwise nucleotidedifferences) to estimate whether each populationgroup was stationary or had undergone an historicalpopulation expansion. High h with low π, aunimodal pairwise difference distribution, signifi-cant Fs but non-significant D* and F*, and a highratio of number of variable sites (S) to average
60 African Zoology Vol. 44, No. 1, April 2009
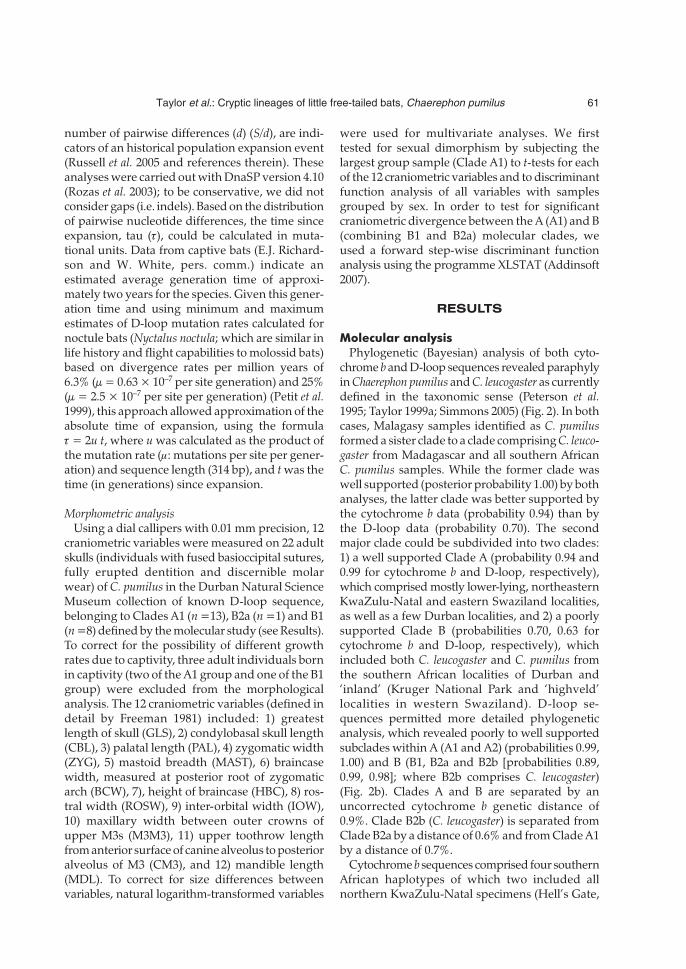
number of pairwise differences (d) (S/d), are indi-cators of an historical population expansion event(Russell et al. 2005 and references therein). Theseanalyses were carried out with DnaSP version 4.10(Rozas et al. 2003); to be conservative, we did notconsider gaps (i.e. indels). Based on the distributionof pairwise nucleotide differences, the time sinceexpansion, tau (τ), could be calculated in muta-tional units. Data from captive bats (E.J. Richard-son and W. White, pers. comm.) indicate anestimated average generation time of approxi-mately two years for the species. Given this gener-ation time and using minimum and maximumestimates of D-loop mutation rates calculated fornoctule bats (Nyctalus noctula; which are similar inlife history and flight capabilities to molossid bats)based on divergence rates per million years of6.3% (µ = 0.63 × 10⁻⁷ per site generation) and 25%(µ = 2.5 × 10⁻⁷ per site per generation) (Petit et al.1999), this approach allowed approximation of theabsolute time of expansion, using the formulaτ = 2u t, where u was calculated as the product ofthe mutation rate (µ: mutations per site per gener-ation) and sequence length (314 bp), and t was thetime (in generations) since expansion.
Morphometric analysisUsing a dial callipers with 0.01 mm precision, 12
craniometric variables were measured on 22 adultskulls (individuals with fused basioccipital sutures,fully erupted dentition and discernible molarwear) of C. pumilus in the Durban Natural ScienceMuseum collection of known D-loop sequence,belonging to Clades A1 (n =13), B2a (n =1) and B1(n =8) defined by the molecular study (see Results).To correct for the possibility of different growthrates due to captivity, three adult individuals bornin captivity (two of the A1 group and one of the B1group) were excluded from the morphologicalanalysis. The 12 craniometric variables (defined indetail by Freeman 1981) included: 1) greatestlength of skull (GLS), 2) condylobasal skull length(CBL), 3) palatal length (PAL), 4) zygomatic width(ZYG), 5) mastoid breadth (MAST), 6) braincasewidth, measured at posterior root of zygomaticarch (BCW), 7), height of braincase (HBC), 8) ros-tral width (ROSW), 9) inter-orbital width (IOW),10) maxillary width between outer crowns ofupper M3s (M3M3), 11) upper toothrow lengthfrom anterior surface of canine alveolus to posterioralveolus of M3 (CM3), and 12) mandible length(MDL). To correct for size differences betweenvariables, natural logarithm-transformed variables
were used for multivariate analyses. We firsttested for sexual dimorphism by subjecting thelargest group sample (Clade A1) to t-tests for eachof the 12 craniometric variables and to discriminantfunction analysis of all variables with samplesgrouped by sex. In order to test for significantcraniometric divergence between the A (A1) and B(combining B1 and B2a) molecular clades, weused a forward step-wise discriminant functionanalysis using the programme XLSTAT (Addinsoft2007).
RESULTS
Molecular analysis
Phylogenetic (Bayesian) analysis of both cyto-chrome b and D-loop sequences revealed paraphylyin Chaerephon pumilus and C. leucogaster as currentlydefined in the taxonomic sense (Peterson et al.1995; Taylor 1999a; Simmons 2005) (Fig. 2). In bothcases, Malagasy samples identified as C. pumilusformed a sister clade to a clade comprising C. leuco-gaster from Madagascar and all southern AfricanC. pumilus samples. While the former clade waswell supported (posterior probability 1.00) by bothanalyses, the latter clade was better supported bythe cytochrome b data (probability 0.94) than bythe D-loop data (probability 0.70). The secondmajor clade could be subdivided into two clades:1) a well supported Clade A (probability 0.94 and0.99 for cytochrome b and D-loop, respectively),which comprised mostly lower-lying, northeasternKwaZulu-Natal and eastern Swaziland localities,as well as a few Durban localities, and 2) a poorlysupported Clade B (probabilities 0.70, 0.63 forcytochrome b and D-loop, respectively), whichincluded both C. leucogaster and C. pumilus fromthe southern African localities of Durban and‘inland’ (Kruger National Park and ‘highveld’localities in western Swaziland). D-loop se-quences permitted more detailed phylogeneticanalysis, which revealed poorly to well supportedsubclades within A (A1 and A2) (probabilities 0.99,1.00) and B (B1, B2a and B2b [probabilities 0.89,0.99, 0.98]; where B2b comprises C. leucogaster)(Fig. 2b). Clades A and B are separated by anuncorrected cytochrome b genetic distance of0.9%. Clade B2b (C. leucogaster) is separated fromClade B2a by a distance of 0.6% and from Clade A1by a distance of 0.7%.
Cytochrome b sequences comprised four southernAfrican haplotypes of which two included allnorthern KwaZulu-Natal specimens (Hell’s Gate,
Taylor et al.: Cryptic lineages of little free-tailed bats, Chaerephon pumilus 61
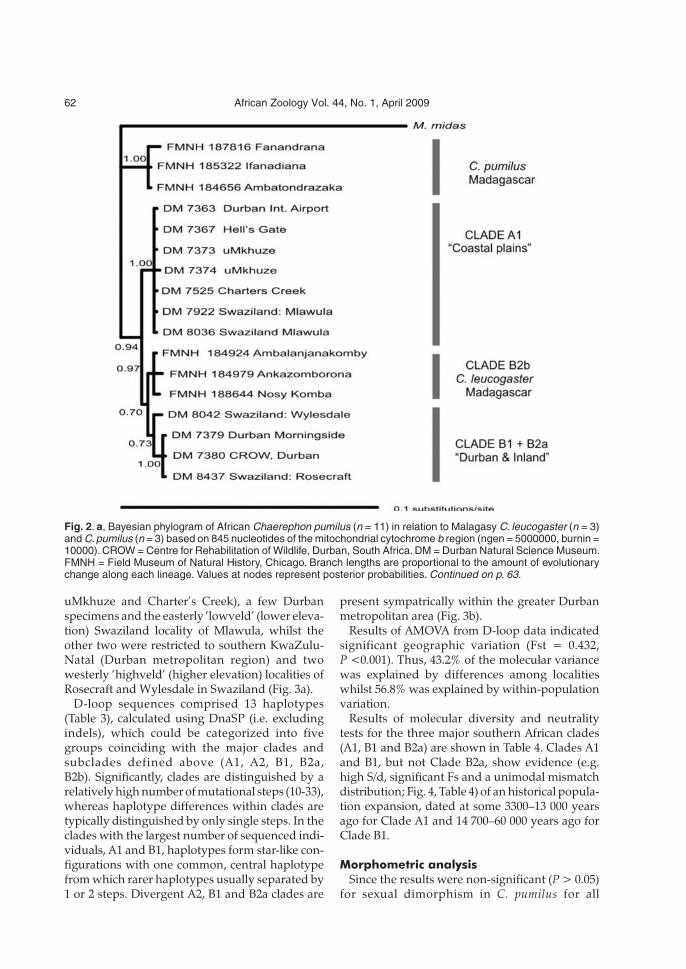
uMkhuze and Charter’s Creek), a few Durbanspecimens and the easterly ‘lowveld’ (lower eleva-tion) Swaziland locality of Mlawula, whilst theother two were restricted to southern KwaZulu-Natal (Durban metropolitan region) and twowesterly ‘highveld’ (higher elevation) localities ofRosecraft and Wylesdale in Swaziland (Fig. 3a).
D-loop sequences comprised 13 haplotypes(Table 3), calculated using DnaSP (i.e. excludingindels), which could be categorized into fivegroups coinciding with the major clades andsubclades defined above (A1, A2, B1, B2a,B2b). Significantly, clades are distinguished by arelatively high number of mutational steps (10-33),whereas haplotype differences within clades aretypically distinguished by only single steps. In theclades with the largest number of sequenced indi-viduals, A1 and B1, haplotypes form star-like con-figurations with one common, central haplotypefrom which rarer haplotypes usually separated by1 or 2 steps. Divergent A2, B1 and B2a clades are
present sympatrically within the greater Durbanmetropolitan area (Fig. 3b).
Results of AMOVA from D-loop data indicatedsignificant geographic variation (Fst = 0.432,P <0.001). Thus, 43.2% of the molecular variancewas explained by differences among localitieswhilst 56.8% was explained by within-populationvariation.
Results of molecular diversity and neutralitytests for the three major southern African clades(A1, B1 and B2a) are shown in Table 4. Clades A1and B1, but not Clade B2a, show evidence (e.g.high S/d, significant Fs and a unimodal mismatchdistribution; Fig. 4, Table 4) of an historical popula-tion expansion, dated at some 3300–13 000 yearsago for Clade A1 and 14 700–60 000 years ago forClade B1.
Morphometric analysis
Since the results were non-significant (P > 0.05)for sexual dimorphism in C. pumilus for all
62 African Zoology Vol. 44, No. 1, April 2009
Fig. 2. a, Bayesian phylogram of African Chaerephon pumilus (n = 11) in relation to Malagasy C. leucogaster (n = 3)and C.pumilus (n = 3) based on 845 nucleotides of the mitochondrial cytochrome b region (ngen = 5000000, burnin =10000). CROW = Centre for Rehabilitation of Wildlife, Durban, South Africa. DM = Durban Natural Science Museum.FMNH = Field Museum of Natural History, Chicago. Branch lengths are proportional to the amount of evolutionarychange along each lineage. Values at nodes represent posterior probabilities. Continued on p. 63.
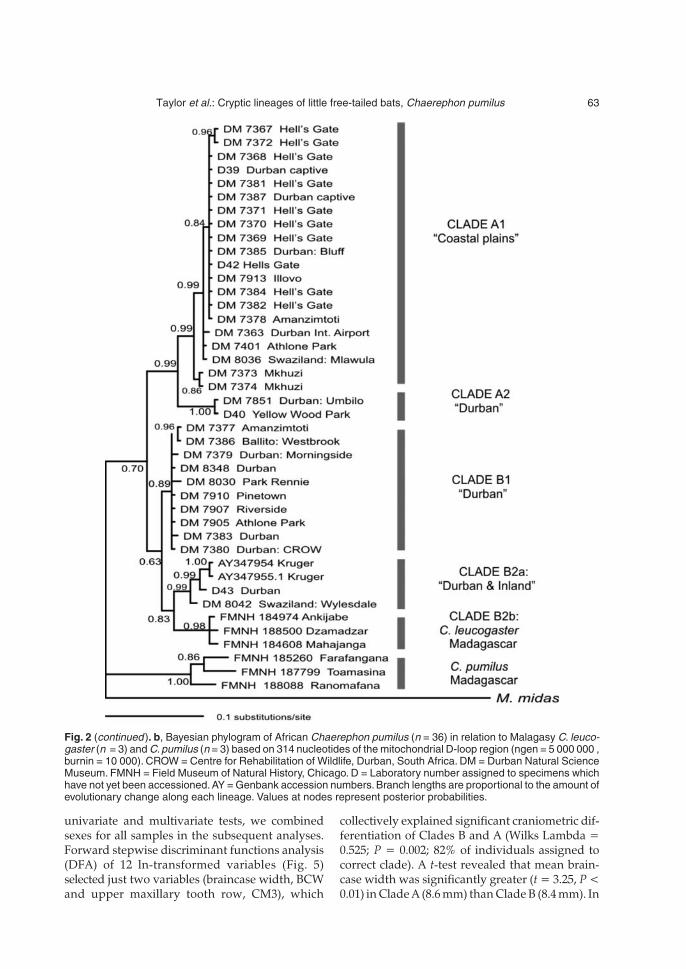
univariate and multivariate tests, we combinedsexes for all samples in the subsequent analyses.Forward stepwise discriminant functions analysis(DFA) of 12 ln-transformed variables (Fig. 5)selected just two variables (braincase width, BCWand upper maxillary tooth row, CM3), which
collectively explained significant craniometric dif-ferentiation of Clades B and A (Wilks Lambda =0.525; P = 0.002; 82% of individuals assigned tocorrect clade). A t-test revealed that mean brain-case width was significantly greater (t = 3.25, P <0.01) in Clade A (8.6 mm) than Clade B (8.4 mm). In
Taylor et al.: Cryptic lineages of little free-tailed bats, Chaerephon pumilus 63
Fig. 2 (continued). b, Bayesian phylogram of African Chaerephon pumilus (n = 36) in relation to Malagasy C. leuco-gaster (n = 3) and C.pumilus (n = 3) based on 314 nucleotides of the mitochondrial D-loop region (ngen = 5 000 000 ,burnin = 10 000). CROW = Centre for Rehabilitation of Wildlife, Durban, South Africa. DM = Durban Natural ScienceMuseum. FMNH = Field Museum of Natural History, Chicago. D = Laboratory number assigned to specimens whichhave not yet been accessioned. AY = Genbank accession numbers. Branch lengths are proportional to the amount ofevolutionary change along each lineage. Values at nodes represent posterior probabilities.
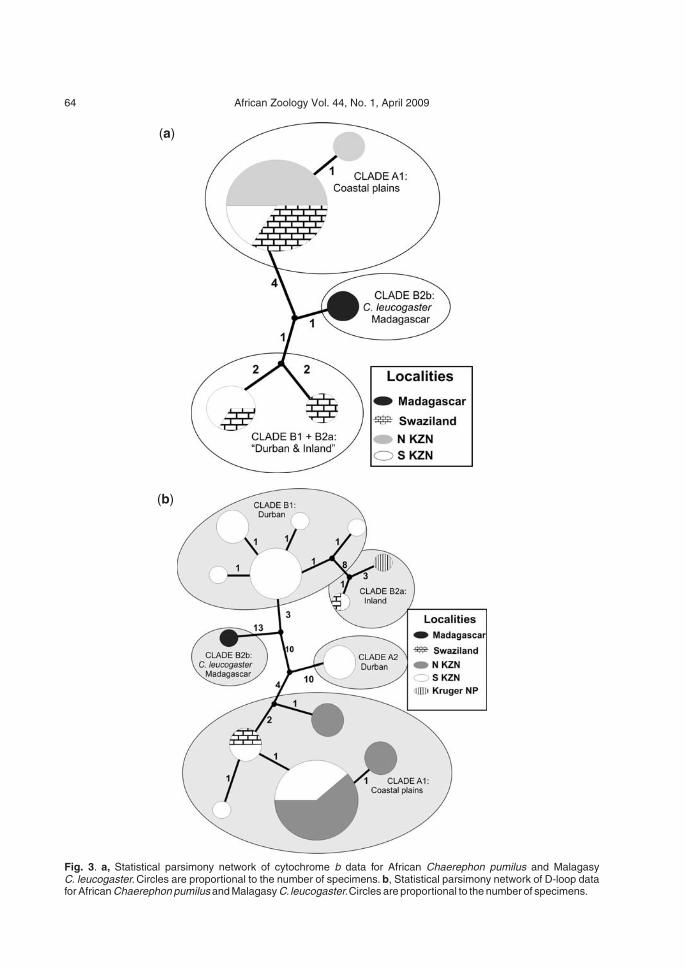
64 African Zoology Vol. 44, No. 1, April 2009
Fig. 3. a, Statistical parsimony network of cytochrome b data for African Chaerephon pumilus and MalagasyC. leucogaster. Circles are proportional to the number of specimens. b, Statistical parsimony network of D-loop datafor African Chaerephon pumilus and Malagasy C. leucogaster.Circles are proportional to the number of specimens.
(a)
(b)
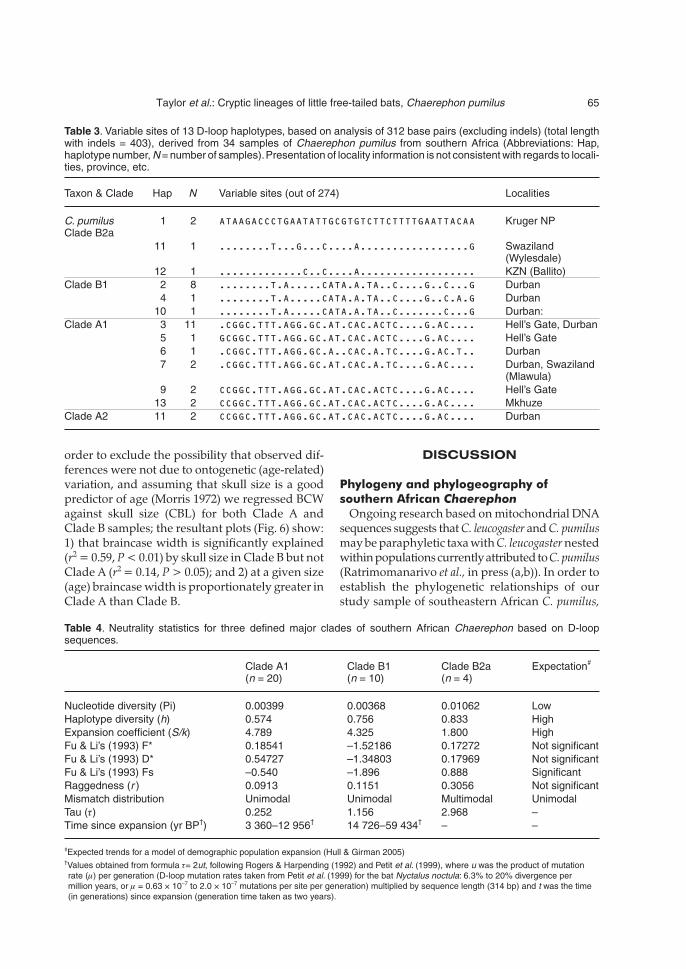
order to exclude the possibility that observed dif-ferences were not due to ontogenetic (age-related)variation, and assuming that skull size is a goodpredictor of age (Morris 1972) we regressed BCWagainst skull size (CBL) for both Clade A andClade B samples; the resultant plots (Fig. 6) show:1) that braincase width is significantly explained(r2 = 0.59, P < 0.01) by skull size in Clade B but notClade A (r2 = 0.14, P > 0.05); and 2) at a given size(age) braincase width is proportionately greater inClade A than Clade B.
DISCUSSION
Phylogeny and phylogeography of
southern African Chaerephon
Ongoing research based on mitochondrial DNAsequences suggests that C. leucogaster and C. pumilusmay be paraphyletic taxa with C. leucogaster nestedwithin populations currently attributed to C. pumilus(Ratrimomanarivo et al., in press (a,b)). In order toestablish the phylogenetic relationships of ourstudy sample of southeastern African C. pumilus,
Taylor et al.: Cryptic lineages of little free-tailed bats, Chaerephon pumilus 65
Table 3. Variable sites of 13 D-loop haplotypes, based on analysis of 312 base pairs (excluding indels) (total lengthwith indels = 403), derived from 34 samples of Chaerephon pumilus from southern Africa (Abbreviations: Hap,haplotype number, N = number of samples).Presentation of locality information is not consistent with regards to locali-ties, province, etc.
Taxon & Clade Hap N Variable sites (out of 274) Localities
C. pumilus 1 2 ���������������������������������������� Kruger NPClade B2a
11 1 ���������������������������������������� Swaziland(Wylesdale)
12 1 ���������������������������������������� KZN (Ballito)Clade B1 2 8 ���������������������������������������� Durban
4 1 ���������������������������������������� Durban10 1 ���������������������������������������� Durban:
Clade A1 3 11 ���������������������������������������� Hell’s Gate, Durban5 1 ���������������������������������������� Hell’s Gate6 1 ������������������������������������.T.. Durban7 2 ���������������������������������������� Durban, Swaziland
(Mlawula)9 2 ���������������������������������������� Hell’s Gate
13 2 ���������������������������������������� MkhuzeClade A2 11 2 ���������������������������������������� Durban
Table 4. Neutrality statistics for three defined major clades of southern African Chaerephon based on D-loopsequences.
Clade A1 Clade B1 Clade B2a Expectation#
(n = 20) (n = 10) (n = 4)
Nucleotide diversity (Pi) 0.00399 0.00368 0.01062 LowHaplotype diversity (h) 0.574 0.756 0.833 HighExpansion coefficient (S/k) 4.789 4.325 1.800 HighFu & Li’s (1993) F* 0.18541 –1.52186 0.17272 Not significantFu & Li’s (1993) D* 0.54727 –1.34803 0.17969 Not significantFu & Li’s (1993) Fs –0.540 –1.896 0.888 SignificantRaggedness (r ) 0.0913 0.1151 0.3056 Not significantMismatch distribution Unimodal Unimodal Multimodal UnimodalTau (τ) 0.252 1.156 2.968 –Time since expansion (yr BP†) 3 360–12 956† 14 726–59 434† – –
#Expected trends for a model of demographic population expansion (Hull & Girman 2005)†Values obtained from formula τ= 2ut, following Rogers & Harpending (1992) and Petit et al. (1999), where u was the product of mutationrate (µ) per generation (D-loop mutation rates taken from Petit et al. (1999) for the bat Nyctalus noctula: 6.3% to 20% divergence permillion years, or µ = 0.63 × 10⁻⁷ to 2.0 × 10⁻⁷ mutations per site per generation) multiplied by sequence length (314 bp) and t was the time(in generations) since expansion (generation time taken as two years).
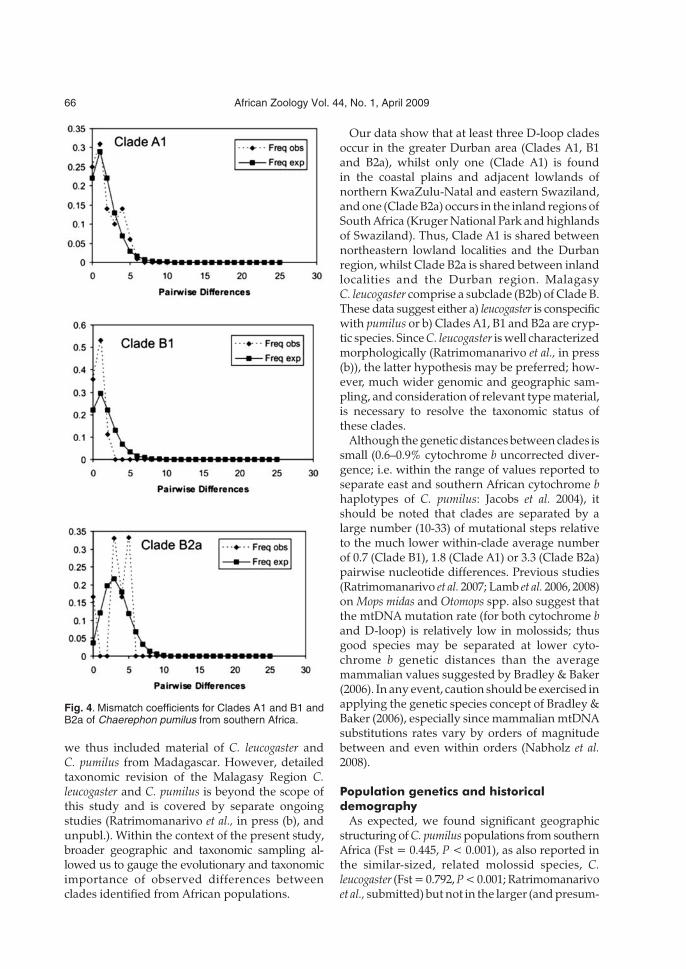
we thus included material of C. leucogaster andC. pumilus from Madagascar. However, detailedtaxonomic revision of the Malagasy Region C.leucogaster and C. pumilus is beyond the scope ofthis study and is covered by separate ongoingstudies (Ratrimomanarivo et al., in press (b), andunpubl.). Within the context of the present study,broader geographic and taxonomic sampling al-lowed us to gauge the evolutionary and taxonomicimportance of observed differences betweenclades identified from African populations.
Our data show that at least three D-loop cladesoccur in the greater Durban area (Clades A1, B1and B2a), whilst only one (Clade A1) is foundin the coastal plains and adjacent lowlands ofnorthern KwaZulu-Natal and eastern Swaziland,and one (Clade B2a) occurs in the inland regions ofSouth Africa (Kruger National Park and highlandsof Swaziland). Thus, Clade A1 is shared betweennortheastern lowland localities and the Durbanregion, whilst Clade B2a is shared between inlandlocalities and the Durban region. MalagasyC. leucogaster comprise a subclade (B2b) of Clade B.These data suggest either a) leucogaster is conspecificwith pumilus or b) Clades A1, B1 and B2a are cryp-tic species. Since C. leucogaster is well characterizedmorphologically (Ratrimomanarivo et al., in press(b)), the latter hypothesis may be preferred; how-ever, much wider genomic and geographic sam-pling, and consideration of relevant type material,is necessary to resolve the taxonomic status ofthese clades.
Although the genetic distances between clades issmall (0.6–0.9% cytochrome b uncorrected diver-gence; i.e. within the range of values reported toseparate east and southern African cytochrome bhaplotypes of C. pumilus: Jacobs et al. 2004), itshould be noted that clades are separated by alarge number (10-33) of mutational steps relativeto the much lower within-clade average numberof 0.7 (Clade B1), 1.8 (Clade A1) or 3.3 (Clade B2a)pairwise nucleotide differences. Previous studies(Ratrimomanarivo et al. 2007; Lamb et al. 2006, 2008)on Mops midas and Otomops spp. also suggest thatthe mtDNA mutation rate (for both cytochrome band D-loop) is relatively low in molossids; thusgood species may be separated at lower cyto-chrome b genetic distances than the averagemammalian values suggested by Bradley & Baker(2006). In any event, caution should be exercised inapplying the genetic species concept of Bradley &Baker (2006), especially since mammalian mtDNAsubstitutions rates vary by orders of magnitudebetween and even within orders (Nabholz et al.2008).
Population genetics and historical
demography
As expected, we found significant geographicstructuring of C. pumilus populations from southernAfrica (Fst = 0.445, P < 0.001), as also reported inthe similar-sized, related molossid species, C.leucogaster (Fst = 0.792, P < 0.001; Ratrimomanarivoet al., submitted) but not in the larger (and presum-
66 African Zoology Vol. 44, No. 1, April 2009
Fig. 4. Mismatch coefficients for Clades A1 and B1 andB2a of Chaerephon pumilus from southern Africa.
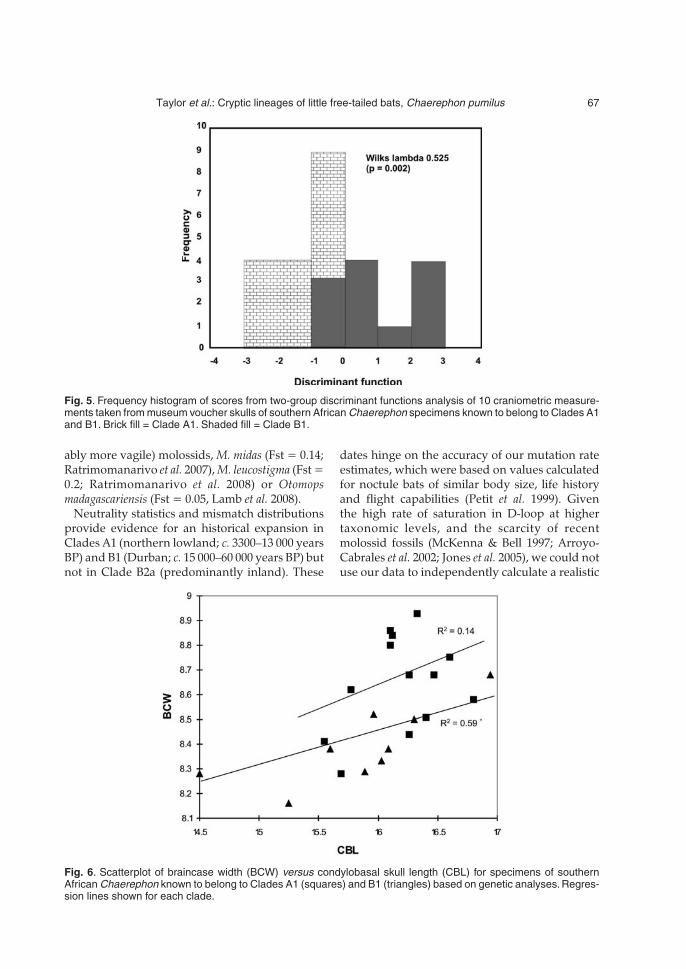
ably more vagile) molossids, M. midas (Fst = 0.14;Ratrimomanarivo et al. 2007), M. leucostigma (Fst =0.2; Ratrimomanarivo et al. 2008) or Otomopsmadagascariensis (Fst = 0.05, Lamb et al. 2008).
Neutrality statistics and mismatch distributionsprovide evidence for an historical expansion inClades A1 (northern lowland; c. 3300–13 000 yearsBP) and B1 (Durban; c. 15 000–60 000 years BP) butnot in Clade B2a (predominantly inland). These
dates hinge on the accuracy of our mutation rateestimates, which were based on values calculatedfor noctule bats of similar body size, life historyand flight capabilities (Petit et al. 1999). Giventhe high rate of saturation in D-loop at highertaxonomic levels, and the scarcity of recentmolossid fossils (McKenna & Bell 1997; Arroyo-Cabrales et al. 2002; Jones et al. 2005), we could notuse our data to independently calculate a realistic
Taylor et al.: Cryptic lineages of little free-tailed bats, Chaerephon pumilus 67
Fig. 5. Frequency histogram of scores from two-group discriminant functions analysis of 10 craniometric measure-ments taken from museum voucher skulls of southern African Chaerephon specimens known to belong to Clades A1and B1. Brick fill = Clade A1. Shaded fill = Clade B1.
Fig. 6. Scatterplot of braincase width (BCW) versus condylobasal skull length (CBL) for specimens of southernAfrican Chaerephon known to belong to Clades A1 (squares) and B1 (triangles) based on genetic analyses. Regres-sion lines shown for each clade.
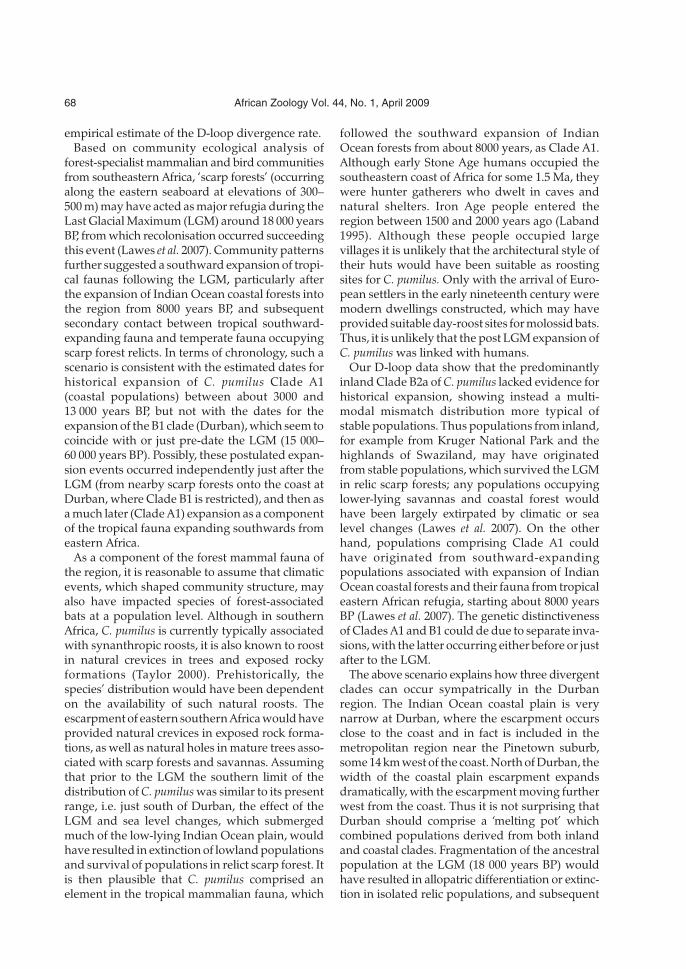
empirical estimate of the D-loop divergence rate.Based on community ecological analysis of
forest-specialist mammalian and bird communitiesfrom southeastern Africa, ‘scarp forests’ (occurringalong the eastern seaboard at elevations of 300–500 m) may have acted as major refugia during theLast Glacial Maximum (LGM) around 18 000 yearsBP, from which recolonisation occurred succeedingthis event (Lawes et al. 2007). Community patternsfurther suggested a southward expansion of tropi-cal faunas following the LGM, particularly afterthe expansion of Indian Ocean coastal forests intothe region from 8000 years BP, and subsequentsecondary contact between tropical southward-expanding fauna and temperate fauna occupyingscarp forest relicts. In terms of chronology, such ascenario is consistent with the estimated dates forhistorical expansion of C. pumilus Clade A1(coastal populations) between about 3000 and13 000 years BP, but not with the dates for theexpansion of the B1 clade (Durban), which seem tocoincide with or just pre-date the LGM (15 000–60 000 years BP). Possibly, these postulated expan-sion events occurred independently just after theLGM (from nearby scarp forests onto the coast atDurban, where Clade B1 is restricted), and then asa much later (Clade A1) expansion as a componentof the tropical fauna expanding southwards fromeastern Africa.
As a component of the forest mammal fauna ofthe region, it is reasonable to assume that climaticevents, which shaped community structure, mayalso have impacted species of forest-associatedbats at a population level. Although in southernAfrica, C. pumilus is currently typically associatedwith synanthropic roosts, it is also known to roostin natural crevices in trees and exposed rockyformations (Taylor 2000). Prehistorically, thespecies’ distribution would have been dependenton the availability of such natural roosts. Theescarpment of eastern southern Africa would haveprovided natural crevices in exposed rock forma-tions, as well as natural holes in mature trees asso-ciated with scarp forests and savannas. Assumingthat prior to the LGM the southern limit of thedistribution of C. pumilus was similar to its presentrange, i.e. just south of Durban, the effect of theLGM and sea level changes, which submergedmuch of the low-lying Indian Ocean plain, wouldhave resulted in extinction of lowland populationsand survival of populations in relict scarp forest. Itis then plausible that C. pumilus comprised anelement in the tropical mammalian fauna, which
followed the southward expansion of IndianOcean forests from about 8000 years, as Clade A1.Although early Stone Age humans occupied thesoutheastern coast of Africa for some 1.5 Ma, theywere hunter gatherers who dwelt in caves andnatural shelters. Iron Age people entered theregion between 1500 and 2000 years ago (Laband1995). Although these people occupied largevillages it is unlikely that the architectural style oftheir huts would have been suitable as roostingsites for C. pumilus. Only with the arrival of Euro-pean settlers in the early nineteenth century weremodern dwellings constructed, which may haveprovided suitable day-roost sites for molossid bats.Thus, it is unlikely that the post LGM expansion ofC. pumilus was linked with humans.
Our D-loop data show that the predominantlyinland Clade B2a of C. pumilus lacked evidence forhistorical expansion, showing instead a multi-modal mismatch distribution more typical ofstable populations. Thus populations from inland,for example from Kruger National Park and thehighlands of Swaziland, may have originatedfrom stable populations, which survived the LGMin relic scarp forests; any populations occupyinglower-lying savannas and coastal forest wouldhave been largely extirpated by climatic or sealevel changes (Lawes et al. 2007). On the otherhand, populations comprising Clade A1 couldhave originated from southward-expandingpopulations associated with expansion of IndianOcean coastal forests and their fauna from tropicaleastern African refugia, starting about 8000 yearsBP (Lawes et al. 2007). The genetic distinctivenessof Clades A1 and B1 could de due to separate inva-sions, with the latter occurring either before or justafter to the LGM.
The above scenario explains how three divergentclades can occur sympatrically in the Durbanregion. The Indian Ocean coastal plain is verynarrow at Durban, where the escarpment occursclose to the coast and in fact is included in themetropolitan region near the Pinetown suburb,some 14 km west of the coast. North of Durban, thewidth of the coastal plain escarpment expandsdramatically, with the escarpment moving furtherwest from the coast. Thus it is not surprising thatDurban should comprise a ‘melting pot’ whichcombined populations derived from both inlandand coastal clades. Fragmentation of the ancestralpopulation at the LGM (18 000 years BP) wouldhave resulted in allopatric differentiation or extinc-tion in isolated relic populations, and subsequent
68 African Zoology Vol. 44, No. 1, April 2009
secondary contact following the later recolonisationevent(s). Whether some 10 000–60 000 years ofgeographical isolation would result in speciationdepends to some extent on the acquisition ofphenotypic characters (e.g. in morphology, karyo-type or echolocation call), which would result inpositive assortment on secondary contact. IfDurban is a zone of secondary contact as heresuggested, nuclear genetic markers would be veryuseful to determine the evolutionary fate (e.g. thedegree of hybridization) of the lineages. Our datesfor historical expansion of Clade A1 correspondclosely with those obtained for the relatedmolossid, C. leucogaster from the west coast ofMadagascar (Ratrimomanarivo et al., in press(a,b)), where morphological characters allowrecognition of this clade as a good species.
Morphological evidence for evolutionary
lineages
Our preliminary morphological analyses revealeda significant difference in proportional braincasesize between the Clades A and B, which suggeststhat geographical isolation may have been accom-panied by adaptive morphological divergence.Further studies in progress will examine cranialvariation in our sample of vouchered specimenswithin the context of much broader geographicalsamples from the range of C. pumilus as well aswith reference to the comparison of type andtopotypic material from Massawe, Eritrea. Hayman& Hill (1971) summarize the taxonomic complexi-ties inherent in this large assemblage of formswhich invites a multidisciplinary and geographi-cally comprehensive taxonomic review and isalmost certainly a composite of multiple crypticspecies (see for example, recent resurrection ofC. pusillus from the western Seychelles; Goodman& Ratrimomanarivo 2007).
ACKNOWLEDGEMENTS
A. Monadjem of University of Swaziland col-lected the specimens from Swaziland. We aregrateful to rehabilitators and members of the BatInterest Group of KwaZulu-Natal for sharing in-formation and DNA samples of captive animals intheir care. P.J.T. received financial support from theNational Research Foundation. Collection of spec-imens in KwaZulu-Natal was carried out with acollecting permit from KZN Wildlife. Work inMadagascar was supported by grants from TheJohn D. and Catherine T. MacArthur Foundationand the Volkswagen Foundation, and the Direction
des Eaux et Forêts graciously provided permits forspecimen collection.
REFERENCES
ADDINSOFT 2007. XLSTAT version 7.2, http://www.xlstat.com
ARROYO-CABRALES, J., GREGORIN, R., SCHLITTER,D.A. & WALKER, A. 2002. The oldest Africanmolossid bat cranium (Chiroptera: Molossidae). Jour-nal of Vertebrate Paleontology, 22: 380–387.
ASPETSBERGER, F., BRANDSEN, D. & JACOBS, D.S.2003. Geographical variation in the morphology,echolocation and diet of the little free-tailed bat,Chaerephon pumilus (Molossidae). African Zoology 38:245–254.
BRADLEY, R.D. & BAKER, R.J. 2006. Speciation inmammals and the genetic species concept. Journal ofMammalogy 87: 643–662.
CLEMENT, M., POSADA, D. & CRANDALL, K.A. 2000.TCS: A computer program to estimate gene genealo-gies. Molecular Ecology 9: 1657–1660.
EXCOFFIER, E., SMOUSE, P. & QUATTRO, J. 1992.Analysis of molecular variance inferred from metricdistances among DNA haplotypes: Application tohuman mitochondrial DNA restriction data. Genetics131: 479–491.
EXCOFFIER, L., LAVAL, G. & SCHNEIDER, S. 2006.Arlequin ver 3.0: An integrated software package forpopulation genetics data analysis. EvolutionaryBioinformatics Online 1: 47–50.
FENTON, M.B., JACOBS, D.S., RICHARDSON, E.R.,TAYLOR, P.J. & WHITE, W. 2004. Individual signa-tures in the frequency modulated sweep calls ofAfrican large-eared free-tailed bats (Otomops mar-tiensseni) (Chiroptera: Molossidae). Journal of Zoology(London) 262: 11–19.
FREEMAN, P. W. 1981. A multivariate study of the familyMolossidae (Mammalia: Chiroptera): morphology,ecology, evolution. Fieldiana: Zoology, New Series, 7:1–173.
FU, Y.X. 1997. Statistical tests of neutrality of mutationsagainst population growth, hitchhiking, and back-ground selection. Genetics 147: 915–925.
FU, Y.X. & LI, W.H. 1993. Statistical tests of neutrality ofmutations. Genetics 133: 693–709.
GOODMAN, S.M. & RATRIMOMANARIVO, F.H. 2007.The taxonomic status of Chaerephon pumilus from thewestern Seychelles: resurrection of the name C.pusillus for an endemic species. Acta Chiropterologica9: 391–399.
HULL, J.M., & GIRMAN, D.J. 2005. Effects of Holoceneclimate change on the historical demography ofmigrating sharp-shinned hawks (Accipiter striatusvelox) in North America. Molecular Ecology 14: 159–170.
HALL, T.A. 1999. BioEdit: a user-friendly biologicalsequence alignment editor and analysis program forWidows 95/98/NT. Nucleic Acids Symposium Series 41:95–98.
HAYMAN, R.W. & HILL, J.E. 1971. Order Chiroptera. In:The Mammals of Africa: An Identification Manual, (eds)J. Meester & H.W. Setzer, pp 1–73. SmithsonianInstitution Press, Washington D.C.
IRWIN, D.M., KOCHER, T.D. & WILSON, A.C. 1991.Evolution of the cytochrome b gene of mammals.
Taylor et al.: Cryptic lineages of little free-tailed bats, Chaerephon pumilus 69
Journal of Molecular Evolution 32: 128–144.JACOBS, D.S., EICK, G.N., RICHARDSON, E.J. &
TAYLOR, P.J. 2004. Genetic similarity amongstphenotypically diverse little free-tailed bats, Chaere-phon pumilus. Acta Chiropterologica 6: 13–21.
JONES, K.E., BININDA-EMONDS, O.R.P., GITTLE-MAN, J.L. 2005. Bats, clocks, and rocks: diversifica-tion patterns in Chiroptera. Evolution: 59: 2243–2255.
KRATYSBERG, Y., SCHWARTZ, M. & BROWN, T.A.2004. Recombination of human mitochondrial DNA.Science 304: 981.
LABAND, J. 1995. Rope of Sand. The Rise and Fall of the ZuluKingdom in the Nineteenth Century. Jonathon BallPublishers, Johannesburg.
LAMB, J.M., ABDEL-RAHMAN, E.H., RALPH, T.,FENTON, M.B., NAIDOO, A., RICHARDSON, E.J.,JACOBS, D.S., DENYS, C. & TAYLOR, P.J. 2006.Phylogeography of southern and northeastern Afri-can populations of Otomops martiensseni (Chiroptera:Molossidae). Durban Museum Novitates 31: 42–53.
LAMB, J.M., RALPH, T.M.C., GOODMAN, S.M.,BOGDANOWICZ, W., FAHR, J., GAJEWSKA, M.,BATES, P.J.J., EGER, J., BENDA, P. & TAYLOR, P.J.2008. Phylogeography and predicted distribution ofAfrican-Arabian and Malagasy populations of giantmastiff bats, Otomops spp. (Chiroptera: Molossidae).Acta Chiropterologica 10: 21–40.
LAWES, M.J., EELEY, H.A.C., FINDLAY, N.J. & FORBES,D. 2007. Resilient forest faunal communities in SouthAfrica: a legacy of palaeoclimatic change and extinc-tion filtering? Journal of Biogeography 34:1246–1264.
McKENNA, M.C. & BELL, S.K. 1997. Classification ofMammals above the Species Level. Columbia UniversityPress, New York.
MONADJEM, A., TAYLOR, P.J., COTTERILL, F.P.D. &SCHOEMAN, M.C. In press. Bats of Southern Africa. ABiogeographic and Taxonomic Synthesis. University ofKwaZulu-Natal Press, Pietermaritzburg.
MORRIS, P. 1972. A review of mammalian age determi-nation methods. Mammal Review 2: 69–104.
NABOLZ, B., GLIMIN, S. & GALTIER, N. 2008. Strongvariations of mitochondrial mutation rate acrossmammals the longevity hypothesis. Molecular Biologyand Evolution 25: 120–130.
PETERSON, R.L., EGER, J.L. & MITCHELL, L. 1995.Chiroptères. Vol. 84. Faune de Madagascar. MuséumNational d’Histoire Naturelle, Paris.
PETIT. E., EXCOFFIER. L. & MAYER. F. 1999. No evi-dence of bottleneck in the postglacial recolonizationof Europe by the noctule bat (Nyctalus noctula). Evolu-tion 53: 1247–1258.
POSADA, D. & CRANDALL, K.A. 1998. Modeltest:testing the model of DNA substitution. Bioinformatics14: 817–818.
POSADA, D. & CRANDALL, K.A. 2001. Intraspecificgene genealogies: trees grafting into networks. Trendsin Ecology and Evolution 16: 37–45.
RATRIMOMANARIVO, F.H., VIVIAN, J., GOODMAN,S.M. & LAMB, J. 2007. Morphological and molecularassessment of the specific status of Mops midas(Chiroptera: Molossidae) from Madagascar andAfrica. African Zoology 42: 237–253.
RATRIMOMANARIVO, F.H., GOODMAN, S.M.,
HOOSEN, N., TAYLOR, P.J & LAMB, J. In press (a).Morphological and molecular variation in Mops leuco-stigma (Chiroptera: Molossidae) of Madagascar andthe Comoros: phylogeny, phylogeography and geo-graphic variation. Mitteilungen aus dem HamburgischenZoologischen Museum.
RATRIMOMANARIVO, F.H., GOODMAN, S.M.,STANLEY, W.T., NAIDOO, T., TAYLOR, P.J. & LAMB,J. In press (b). Patterns of geographic and phylo-geographic variation in Chaerephon leucogaster(Chiroptera: Molossidae) of Madagascar and thewestern Indian Ocean islands of Mayotte and Pemba.Acta Chiropterologica.
ROGERS, A.R. & HARPENDING, H. 1992. Populationgrowth makes waves in the distribution of pairwisegenetic differences. Molecular Biology and Evolution 9:552–569.
RONQUIST, F. & HUELSENBECK, J.P. 2003. MRBAYES 3:Bayesian phylogenetic inference under mixedmodels. Bioinformatics 19: 1572–1574.
ROZAS, J., SÁNCHEZ DEL BARRIO, J.C. MESSEGUER,X. & ROZAS, R. 2003. DnaSP, DNA polymorphismanalyses by the coalescent and other methods.Bioinformatics 19: 2496–2497.
RUSSELL, A. L.,. MEDELLIN, R.A & McCRACKEN, G.F.2005. Genetic variation and migration in the Mexicanfree-tailed bat (Tadarida brasiliensis mexicana). Molecu-lar Ecology 14: 2207–2222.
RUTHERFORD, M.C. & WESTPHAL, R.H. 1986. Biomesof Southern Africa: an objective categorization.Memoirs of the Botanical Survey of South Africa 63: 1–98.
SAIKI, R.K., GELFORD, D.H., STOFFEL, S. SCHARF, S.J.HIGU-CHI, R., HORN, G.T. MULLIS, K.B. &EHRLICH, H.A. 1988. Primer-directed enzymaticamplification of DNA with a thermostable DNApolymerase. Science 239: 487–491.
SIMMONS, N.B. 2005. Order Chiroptera. In: MammalSpecies of the World: A Taxonomic and Geographic Refer-ence, (eds) D.E. Wilson & D.M. Reeder, 3rd edn,pp. 312– 529. Johns Hopkins University Press, Balti-more.
TAYLOR, P.J. 1999a. Problems with the identification ofsouthern African Chaerephon (Molossidae), and thepossibility of a cryptic species from South Africa andSwaziland. Acta Chiropterologica 1: 191–200.
TAYLOR, P.J. 1999b. Echolocation calls of twenty south-ern African bat species. South African Journal of Zoology33: 114–124.
TAYLOR, P.J. 2000. Bats of Southern Africa. University ofNatal Press, Pietermaritzburg.
TAYLOR, P.J. , GEISELMAN, C., KABOCHI, P.,AGWANDA, B, & TURNER, S. 2005. Intraspecificvariation in the calls of some African bats (orderChiroptera). Durban Museum Novitates 30: 24–37.
THOMPSON, J.D., HIGGENS, D.G. & GIBSON, T.J. 1994.CLUSTAL W: improving the sensitivity of progres-sive multiple sequence alignment through sequenceweighting, position specific gap penalties andweight matrix choice. Nucleic Acids Research 22: 4673–4680.
WILKINSON, G.S. & CHAPMAN, A.M. 1991. Lengthand sequence variation in evening bat D-LoopmtDNA. Genetics 128: 607–617.
70 African Zoology Vol. 44, No. 1, April 2009
Responsible Editor: G.N. Bronner
BioOne sees sustainable scholarly publishing as an inherently collaborative enterprise connecting authors, nonprofit publishers, academic institutions,research libraries, and research funders in the common goal of maximizing access to critical research.
Toward a Molecular Phylogeny for the Molossidae (Chiroptera) of the Afro-Malagasy RegionAuthor(s) :Jennifer M. Lamb, Taryn M. C. Ralph, Theshnie Naidoo, Peter J. Taylor, FanjaRatrimomanarivo, William T. Stanley and Steven M. GoodmanSource: Acta Chiropterologica, 13(1):1-16. 2011.Published By: Museum and Institute of Zoology, Polish Academy of SciencesDOI: http://dx.doi.org/10.3161/150811011X578589URL: http://www.bioone.org/doi/full/10.3161/150811011X578589
BioOne (www.bioone.org) is a nonprofit, online aggregation of core research in the biological, ecological,and environmental sciences. BioOne provides a sustainable online platform for over 170 journals and bookspublished by nonprofit societies, associations, museums, institutions, and presses.
Your use of this PDF, the BioOne Web site, and all posted and associated content indicates your acceptance ofBioOne’s Terms of Use, available at www.bioone.org/page/terms_of_use.
Usage of BioOne content is strictly limited to personal, educational, and non-commercial use. Commercialinquiries or rights and permissions requests should be directed to the individual publisher as copyright holder.
INTRODUCTION
The family Molossidae (Chiroptera), commonlyknown as free-tailed or mastiff bats, is part of thesuborder Vespertilioniformes and, with the Cistug -idae (Lack et al., 2010), Vespertilionidae, Natalidaeand Miniopteridae (as defined by Hoofer and VanDen Bussche, 2003; Miller-Butterworth et al., 2007)forms the superfamily Vespertilionoidea (Hoofer etal., 2003; Van Den Bussche and Hoofer, 2004; Eicket al., 2005; Teeling et al., 2005; Lack et al., 2010).The Molossidae comprise 17 genera and about 100species (Simmons, 2005). These generally robustbats are often strong flyers, with long narrow wings, and catch their insect prey in flight. They are
widespread, occurring on every continent exceptAntarctica.
On the basis of a recent taxonomic treatment(Simmons, 2005), the subfamily Molossinae com-prises the following genera: Chaerephon Dob-son, 1874; Cheiromeles Horsfield, 1824; CynomopsThom as, 1920; Eumops Miller, 1906; MolossopsPeters, 1865; Molossus Geoffroy, 1805; Mops Les -son, 1842; Mormopterus Peters, 1865; Myopte rusGeoffroy, 1818; Nyctinomops Miller, 1902; Oto -mops Thomas, 1913; Platymops Thomas, 1906;Pro mops Gervais, 1856; Sauromys Roberts, 1917and Tadarida Rafinesque, 1814 (Simmons, 2005).The subfamily Tomopeatinae includes the genus To -mopeas Miller, 1900 (Sudman et al., 1994).
Acta Chiropterologica, 13(1): 1–16, 2011PL ISSN 1508-1109 © Museum and Institute of Zoology PAS
doi: 10.3161/150811011X578589
Toward a molecular phylogeny for the Molossidae (Chiroptera)
of the Afro-Malagasy region
JENNIFER M. LAMB1, 6, TARYN M. C. RALPH1, THESHNIE NAIDOO1, PETER J. TAYLOR2, FANJA RATRIMOMANARIVO4, WILLIAM T. STANLEY5, and STEVEN M. GOODMAN3, 4
1School of Biological and Conservation Sciences, New Biology Building, South Ring Road, University of KwaZulu-Natal,University Road, Westville, KwaZulu-Natal 3630, Republic of South Africa
2Department of Ecology and Resource Management, School of Environmental Sciences, University of Venda, P. Bag X5050,Thohoyandou, 0950, Republic of South Africa
3Département de Biologie Animale, Université d’Antananarivo, BP 906, Antananarivo (101), Madagascar4Vahatra, BP 3972, Antananarivo (101), Madagascar
5Field Museum of Natural History, 1400 South Lake Shore Drive, Chicago, Illinois 60605, USA6Corresponding author: E-mail: [email protected]
We present phylogenetic information based on nuclear Rag2 and mitochondrial cytochrome b sequence data for six genera ofMolossidae (Chaerephon, Mops, Mormopterus, Otomops, Sauromys, Tadarida) and 18 species, primarily from Africa and theMalagasy region (Madagascar and neighbouring islands), and further include sequences of 12 New World and African taxa sourcedfrom GenBank. There is strong support for the monophyly of the Molossidae included in this study. The Malagasy region taxaMormopterus jugularis and M. francoismoutoui are supported as a basal clade with an age of ≈ 31.2 MYR, and are not monophyleticwith the South American M. kalinowskii. Asian Otomops wroughtoni and O. formosus and Afro-Malagasy O. martiensseni and O. madagascariensis form a strongly-supported ≈ 19.8 MYR-old clade, whose broader relationships among Molossidae are notclearly defined. There is strong support for a ≈ 17.2 MYR-old combined Chaerephon/Mops clade, in which members of these generashow some paraphyly. The monophyly of the genus Tadarida, represented in our analyses by T. brasiliensis from the New Worldand T. fulminans, T. aegyptiaca and T. teniotis from the Old World, is not upheld, although there is good support for a geographically-disjunct ≈ 9.8 MYR-old grouping which includes C. jobimena (Madagascar), T. aegyptiaca (Africa) and T. brasiliensis (America).Sauromys is maintained as a monotypic genus, although there is moderate support for its association with T. fulminans and the Chaerephon/Mops clade, the latter of which comprises M. midas, M. leucostigma, M. condylurus, M. bakarii, C. pumilus, C. pusillus, C. leucogaster and C. atsinanana. An ≈ 8.4 MYR-old New World clade comprising representatives of Eumops,Nyctinomops and Molossus was well-supported.
Key words: Molossidae, Rag2, cytochrome b, Africa, Madagascar, Western Indian Ocean, phylogeny
Eight molossid genera (Chaerephon, Mops,Mormopterus, Myopterus, Otomops, Platymops,Sauromys and Tadarida) are found in Africa, its off-shore islands (Zanzibar and Pemba), and theMalagasy region, including Madagascar, Mayotte,Anjouan, Grande Comore, Mohéli, Aldabra, La Ré -union and Mauritius. Of these, the genera Myopte -rus, Platymops and Sauromys are endemic to main-land Africa, whereas the others are distributedacross portions of the Afro-Malagasy region. Manyof the genera have previously been considered assubgenera of others: Mormopterus has been regard-ed as a subgenus of Tadarida (Hayman and Hill,1971) and as a valid genus that includes Platymopsand Sauromys as subgenera (Freeman, 1981; Le -gendre, 1984); Chaerephon and Mops have alsobeen placed as subgenera of Tadarida (Hayman andHill, 1971; Meester et al., 1986).
We have been engaged in a series of phyloge-netic and phylogeographic studies, primarily ofMalagasy region Molossidae, but also includingmain land Africa congeners. These studies focusedon Chaerephon leucogaster (A. Grandidier, 1869)(Ratri momanarivo et al., 2009a); the C. pumilusCretzs chmar, 1830–1831 group from southernAfrica (Taylor et al., 2009) and the Malagasy region(Goodman et al., 2010); Mops condylurus (A. Smith,1833), M. leucostigma (G. M. Allen, 1918) and M. midas Sundevall, 1843 (Ratrimomanarivo et al., 2007, 2008); Mormopterus jugularis (Peters,1865) (Ratri momanarivo et al., 2009b); and Oto -mops formosus Chasen, 1939, O. madagasca riensisDorst, 1953, O. martiensseni (Matschie, 1897) andO. wrou gh toni (Thomas, 1913) (Lamb et al., 2006,2008). Another study of the Mormopterus occurringon the Masca rene Islands, based on morphology and molecular genetics, found that the populationsoccurring on Mauritius and La Réunion were dis-tinct from one another and animals from the lat-ter were described as a new species, M. francois-moutoui Goodman, van Vuuren, Ratrimomanarivo,Bowie, 2008. We have accumulated mitochondrialcytochrome b and nuclear Rag2 sequence data, andare in a position to contribute to the phylogeny, aswell as inter- and intra-generic relationships, of the Mo los sidae occurring in the Malagasy regionand mainland Africa. Our dataset for 17 speciescomprises sequences from six genera (Chaerephon,Mops, Mor mopterus, Otomops, Sauromys and Ta da -rida) and is augmented with data downloaded fromthe NCBI GenBank for 12 members of the generaEumops, Chaerephon, Molossus, Nyctino mops, Pro -mops and Tadarida.
Current systematic arrangement of the familyMolossidae is based largely on traditional morpho-logical data (Freeman, 1981; Legendre, 1984; Tay -lor, 1999; Simmons, 2005). The genus Nyctino musGeoffroy St. Hilaire, 1813, which was used exten-sively in the early taxonomic classification ofmolos sids (Rosevear, 1965), is today considered a junior synonym of Chaerephon (Simmons, 2005).In 1814, Rafinesque suggested a new genus name,Tadarida, for certain taxa placed in Nyctino-mus (Dobson, 1878). Freeman (1981) divided theAfri can members of the genus Tadarida into fourgenera (Mormopterus, Tadarida, Chaerephon andMops). Pe terson et al. (1995) regarded Chaerephonas a subgenus of Tadarida based on certain morpho-logical characters that are shared by a few species ofboth Chaerephon and Mops (Bouchard, 1998). Cur -rently, Simmons (2005) has adopted the genericclassification proposed by Freeman (1981), wherebyChaerephon is given generic status. The Chaere -phon occurring on Aldabra in the western Seychelleswas named as a distinct taxon, C. pusillus (Miller,1902), and was not recognized by different authori-ties (Hayman and Hill, 1971; Simmons, 2005).Recent work has shown that this is indeed a distinctspecies shared with islands in the Comoro Archi -pelago and Aldabra (Goodman and Ratrimomana -rivo, 2007; Goodman et al., 2010).
Nyctinomus is considered variously as a validgenus (McFarland, 1998), or included in Tadarida(Koopman, 1993; Grubb et al., 1998), Chaerephon(Simmons, 2005) or Mormopterus (Jacobs and Fen -ton, 2002). Mahoney and Walton (1988) consideredthat the name Nyctinomus was published in 1813and therefore had priority over Tadarida Rafines -que, 1814 (Grubb et al., 1998). Van Caken bergheand Seamark (2009) support Grubb et al. (1998),who oppose changing the long-established usage ofTadarida; these authors feel that the use of Nycti -nomus may be more appropriate than the more re-cent Chaerephon Dobson, 1874.
The taxonomic status of Sauromys remains un-clear, and is discussed by Van Cakenberghe andSeamark (2009). This monotypic genus has beenvariously described as a subgenus of Platymops, theSouth American flat-headed free-tailed bat (Roberts,1917); a subgenus of Mormopterus (Freeman, 1981;Koopman, 1993, 1994; Jacobs and Fenton, 2002); a subgenus of Tadarida (Koopman, 1975); or a dis-tinct genus (Peterson, 1965, 1985; Meester et al.,1986; Simmons, 2005). The generic status of Sauro -mys is favoured by Van Cakenberghe and Seamark(2009) based on its unique ecology and morphology.
2 J. M. Lamb, T. M. C. Ralph, T. Naidoo, P. J. Taylor, F. Ratrimomanarivo, et al.
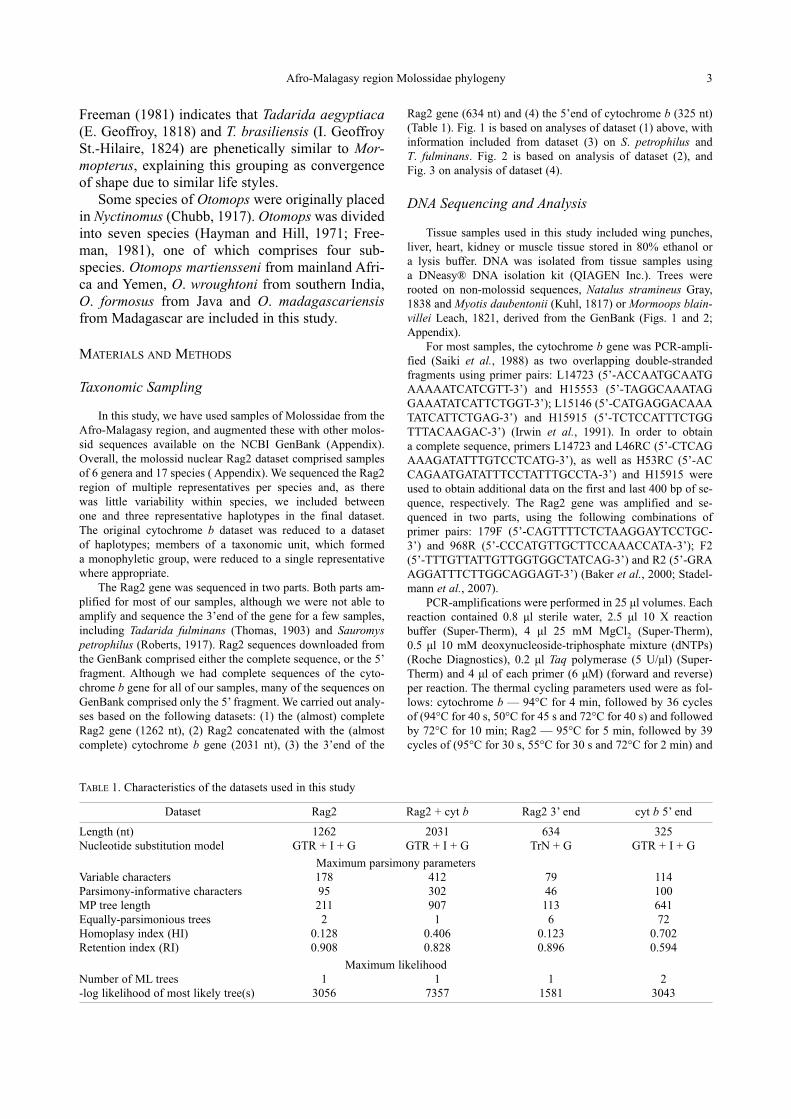
Freeman (1981) indicates that Tada ri da aegyptiaca(E. Geoffroy, 1818) and T. bra siliensis (I. Geoffroy St.-Hilaire, 1824) are phenetically similar to Mor -mo pte rus, explaining this grouping as convergenceof shape due to similar life styles.
Some species of Otomops were originally placedin Nyctinomus (Chubb, 1917). Otomops was dividedinto seven species (Hayman and Hill, 1971; Free -man, 1981), one of which comprises four sub-spe cies. Otomops martiensseni from mainland Afri -ca and Yemen, O. wroughtoni from southern India,O. for mosus from Java and O. madagasca riensisfrom Madagascar are included in this study.
MATERIALS AND METHODS
Taxonomic Sampling
In this study, we have used samples of Molossidae from theAfro-Malagasy region, and augmented these with other molos-sid sequences available on the NCBI GenBank (Appendix).Over all, the molossid nuclear Rag2 dataset comprised samplesof 6 genera and 17 species ( Appendix). We sequenced the Rag2 re gion of multiple representatives per species and, as there was little variability within species, we included between one and three representative haplotypes in the final dataset. The original cytochrome b dataset was reduced to a dataset of hap lo types; members of a taxonomic unit, which formed a monophyletic group, were reduced to a single representativewhere appropriate.
The Rag2 gene was sequenced in two parts. Both parts am-plified for most of our samples, although we were not able toamplify and sequence the 3’end of the gene for a few samples,including Tadarida fulminans (Thomas, 1903) and Sauromyspetrophilus (Roberts, 1917). Rag2 sequences downloaded fromthe GenBank comprised either the complete sequence, or the 5’fragment. Although we had complete sequences of the cyto -chrome b gene for all of our samples, many of the sequences onGenBank comprised only the 5’ fragment. We carried out analy-ses based on the following datasets: (1) the (almost) completeRag2 gene (1262 nt), (2) Rag2 concatenated with the (almostcomplete) cytochrome b gene (2031 nt), (3) the 3’end of the
Rag2 gene (634 nt) and (4) the 5’end of cytochrome b (325 nt)(Table 1). Fig. 1 is based on analyses of dataset (1) above, withinformation included from dataset (3) on S. petrophilus and T. fulminans. Fig. 2 is based on analysis of dataset (2), and Fig. 3 on analysis of dataset (4).
DNA Sequencing and Analysis
Tissue samples used in this study included wing punches,liver, heart, kidney or muscle tissue stored in 80% ethanol or a lysis buffer. DNA was isolated from tissue samples using a DNeasy® DNA isolation kit (QIAGEN Inc.). Trees were rooted on non-molossid sequences, Natalus stramineus Gray,1838 and Myotis daubentonii (Kuhl, 1817) or Mormoops blain -villei Leach, 1821, derived from the GenBank (Figs. 1 and 2;Appendix).
For most samples, the cytochrome b gene was PCR-ampli-fied (Saiki et al., 1988) as two overlapping double-strandedfragments using primer pairs: L14723 (5’-ACCAATGCAATGAAAAATCATCGTT-3’) and H15553 (5’-TAGGCAAATAGGAAATATCATTCTGGT-3’); L15146 (5’-CATGAGGACAAATATCATTCTGAG-3’) and H15915 (5’-TCTCCATTTCTGGTTTACAAGAC-3’) (Irwin et al., 1991). In order to obtain a complete sequence, primers L14723 and L46RC (5’-CTCAGAAAGATATTTGTCCTCATG-3’), as well as H53RC (5’-ACCAGAATGATATTTCCTATTTGCCTA-3’) and H15915 wereused to obtain additional data on the first and last 400 bp of se-quence, respectively. The Rag2 gene was amplified and se-quenced in two parts, using the following combinations ofprimer pairs: 179F (5’-CAGTTTTCTCTAAGGAYTCCTGC-3’) and 968R (5’-CCCATGTTGCTTCCAAACCATA-3’); F2(5’-TTTGTTATTGTTGGTGGCTATCAG-3’) and R2 (5’-GRAAGGATTTCTTGGCAGGAGT-3’) (Baker et al., 2000; Sta del -mann et al., 2007).
PCR-amplifications were performed in 25 μl volumes. Eachreaction contained 0.8 μl sterile water, 2.5 μl 10 X reactionbuffer (Super-Therm), 4 μl 25 mM MgCl2 (Super-Therm), 0.5 μl 10 mM deoxynucleoside-triphosphate mixture (dNTPs)(Roche Diagnostics), 0.2 μl Taq polymerase (5 U/μl) (Super-Therm) and 4 μl of each primer (6 μM) (forward and reverse)per reaction. The thermal cycling parameters used were as fol-lows: cytochrome b — 94°C for 4 min, followed by 36 cyclesof (94°C for 40 s, 50°C for 45 s and 72°C for 40 s) and followedby 72°C for 10 min; Rag2 — 95°C for 5 min, followed by 39cycles of (95°C for 30 s, 55°C for 30 s and 72°C for 2 min) and
Afro-Malagasy region Molossidae phylogeny 3
Dataset Rag2 Rag2 + cyt b Rag2 3’ end cyt b 5’ end
Length (nt) 1262 2031 634 325Nucleotide substitution model GTR + I + G GTR + I + G TrN + G GTR + I + G
Maximum parsimony parametersVariable characters 178 412 79 114Parsimony-informative characters 95 302 46 100MP tree length 211 907 113 641Equally-parsimonious trees 2 1 6 72Homoplasy index (HI) 0.128 0.406 0.123 0.702Retention index (RI) 0.908 0.828 0.896 0.594
Maximum likelihoodNumber of ML trees 1 1 1 2-log likelihood of most likely tree(s) 3056 7357 1581 3043
TABLE 1. Characteristics of the datasets used in this study

4 J. M. Lamb, T. M. C. Ralph, T. Naidoo, P. J. Taylor, F. Ratrimomanarivo, et al.
followed by 72°C for 10 min. Target fragments were purifiedfrom excised gel bands using the QIAquick® Gel Extraction Kit(QIAGEN Inc.) and sequenced at InqabaBiotec, Hatfield, Pre -toria, South Africa. All fragments were sequenced in both di -rections to allow reconciliation of ambiguous positions. Se quen -ces were deposited in GenBank (see Appendix). They werealigned using the CLUSTAL W option (Thompson et al., 1994)of the BioEdit program (ver. 5.0.9 for Windows 95/98/NT) andby visual inspection.
Sequence Analyses
We used jModelTest 0.1.1 (Guindon and Gascuel, 2003;Posada, 2008) applying the AKAIKE information criterion todetermine the most appropriate evolutionary model to use inmaximum parsimony, maximum likelihood and Bayesian ana-lyses (Table 1). We analysed all datasets using likelihood, maxi mum parsimony and neighbour-joining methods in PAUP4.0b10 (Swofford, 2002) and Bayesian Inference as imple-ment ed in MrBayes version 3.0b4 (Huelsenbeck and Ronquist,2001). Incongruence between datasets was evaluated by de -termi ning whether there were any nodes, which were consistent-ly strongly supported (70% bootstrap support, ≥ 95% Baye sianpost erior probability) in one dataset that conflicted with strong-ly-supported nodes in another (De Queiroz, 1993; Eick et al.,2005). The absence of such instances allowed for the concatena-tion of sequences.
In maximum likelihood analyses, starting trees were ob-tained by neighbour-joining followed by TBR branch swapping.For parsimony analyses, starting trees were obtained by step-wise addition. The addition sequence was random, with 1 treeheld at each step and with 10 replicates. The tree-bisection-reconnection branch-swapping algorithm was used. One thou-sand bootstrap replicates were carried out using a heuristicsearch. Bayesian analyses were run using four Markov chainsfor five million generations each, sampling every 100 genera-tions. The chains were heated with the temperature scaling factor T = 0.02. We discarded the first 50,000 trees as burn-in,in each case having checked in a preliminary run that this wasmore than sufficient to achieve stationarity, and constructed a 50% majority rule consensus tree from the remaining trees(Table 1).
Dating
Our Rag2 data were used to estimate nodal dates since theyprovided good node support at the deeper nodes of interest with-in Molossidae. Recent studies have attempted to calibrate mo-lecular dates of deeper (family-level) nodes of the chiropteranphylogeny based on a robust higher phylogeny and compilationof data from earliest fossil occurrences of bats (Jones et al.,2005; Teeling et al., 2005). To estimate dates of major support-ed clades within Molossidae, we used the estimated date of 65MYA for the crown divergence of bats (Teeling et al., 2005) andthe crown divergence dates of 35–38 MYA and 47–49 MYA estimated for Molossidae and Vespertilionidae respectively(Jones et al., 2005). Our analysis was based on 600 nucleotidesof the 5’end of the Rag2 gene, for which there was a gooddataset available, including non-Molossid members of theVespertilio no idea and Equus caballus (AF447533.1), which weused as an outgroup. Bayesian analysis (Markov Chain MonteCarlo [mcmc] algorithm, with length 20,000,000, sampledevery 1,000 iterations with burn-in of 100,000) was used to
estimate mean and 95% confidence limits of specified nodaldates within Molossidae. We used the uncorrelated relaxedclock model assuming that branch-specific rates followed a log-normal distribution, which gives more biologically reasonableresults than the exponential model (A. Rambaut, personal com munication). The analysis was achieved using the programBEAST v.1.5.4 (Drummond and Rambaut, 2010) in conjunctionwith the programs BEAUti v.1.5.1 (Drummond and Ram-baut, 2009) and Tracer v.1.51 (Rambaut and Drummond, 2009).The log files from two independent BEAST runs were com-bined in Tracer as recommended in the programme manual.Based on the results of jMODELTEST 3.7 mentioned above, wespecified the HKY + G substitution model. Based on the esti-mated crown divergence dates, we calibrated the three nodes,Chiroptera, Molossidae and Vespertilionidae, using normal dis-tribution priors, with means set to 65 MYA for Chiroptera andthe mid points of ranges given for Molossidae (35–38 MYA) andVes per tilionidae (47–49 MYA). Standard deviation was set at0.5 for Chiroptera and, in the case of Molossidae and Vesper -tilio nidae, adjusted so that 95% upper and lower limits matchedthe maximum and minimum date estimates.
RESULTS
Sequence Data
High retention indices (RI) and low homoplasyindices (HI) (Table 1) indicate that there was littlehomoplasy in the complete Rag2 dataset (RI 0.908,HI 0.128) or the 3’end of the Rag2 dataset (RI 0.896,HI 0.123). For the cytochrome b (5’end) dataset, theRI values were lower (0.594), and the HI valueshigher (0.702) (Table 1), consistent with a moderateamount of homoplasy. The concatenated Rag2/cyto -chrome b dataset was characterized by RI = 0.828and HI = 0.406 (Table 1).
A single maximum parsimony tree was recov-ered from the concatenated Rag2/cytochrome bdata set (2031 nt), which had the best resolving power. Two MP trees were recovered from the com -plete Rag2 dataset, and 6 MP trees from the Rag2 - 3’end dataset. The cytochrome b - 5’end datasethad the lowest resolving power, yielding 2 ML treesand 72 MP trees. Where more than one ML or MPtree was obtained, the differences between treeswere located in unresolved and unsupported termi-nal branches.
Monophyly of the Molossidae and Relation-ship to Other Members of the SuperfamilyVespertilionoidea
In all analyses, the Molossidae included in thisstudy formed a very strongly- to moderately-sup-ported monophyletic group (Node A, Figs. 1, 2 and 3) with respect to non-molossid chiropteran outgroups.
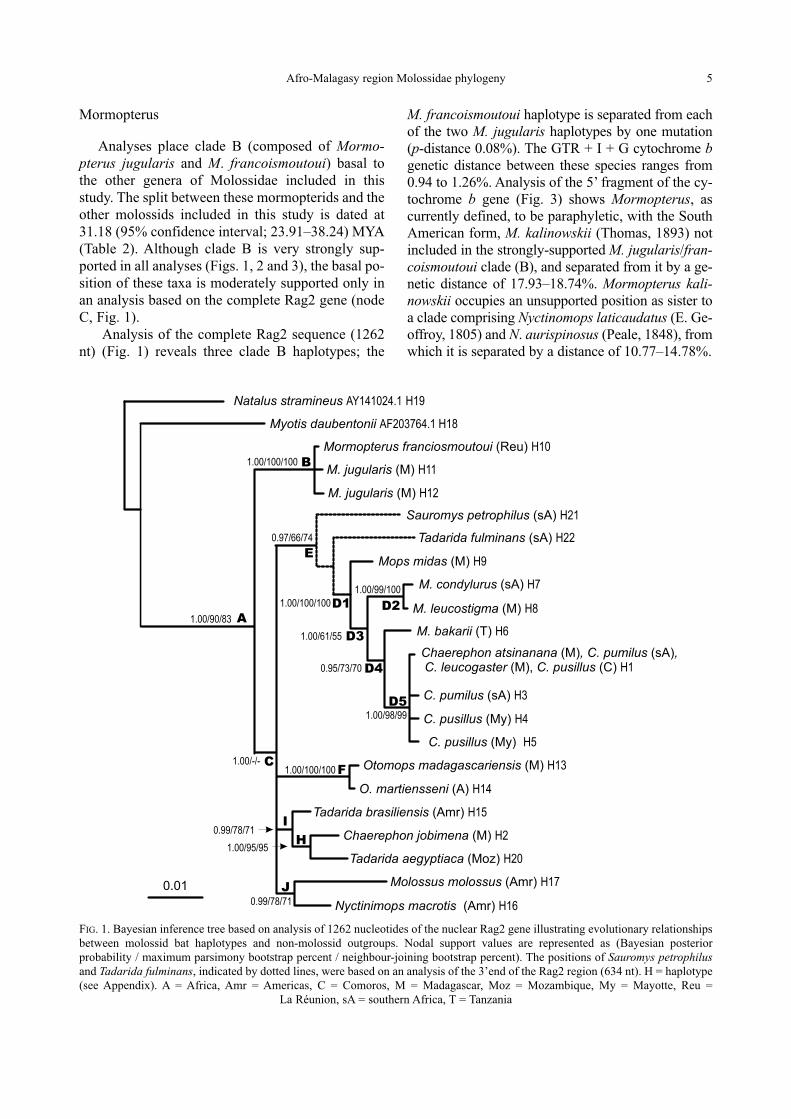
Mormopterus
Analyses place clade B (composed of Mor mo -pterus jugularis and M. francoismoutoui) basal tothe other genera of Molossidae included in thisstudy. The split between these mormo pterids and theother molossids included in this study is dated at31.18 (95% confidence interval; 23.91–38.24) MYA(Table 2). Although clade B is very strongly sup-ported in all analyses (Figs. 1, 2 and 3), the basal po-sition of these taxa is moderately supported only inan analysis based on the complete Rag2 gene (nodeC, Fig. 1).
Analysis of the complete Rag2 sequence (1262nt) (Fig. 1) reveals three clade B haplotypes; the
M. francoismoutoui haplotype is separated from eachof the two M. jugularis haplotypes by one mutation(p-distance 0.08%). The GTR + I + G cyto chrome bgenetic distance between these species ranges from0.94 to 1.26%. Analysis of the 5’ fragment of the cy - tochrome b gene (Fig. 3) shows Mor mopterus, ascurrently defined, to be paraphyletic, with the SouthAmerican form, M. kalinowskii (Thomas, 1893) notin cluded in the strongly-supported M. jugularis/fran - coismoutoui clade (B), and separated from it by a ge-netic distance of 17.93–18.74%. Mormopterus ka li -now skii occupies an unsupported position as sister toa clade comprising Nyctinomops laticaudatus (E. Ge -of froy, 1805) and N. aurispinosus (Peale, 1848), fromwhich it is separated by a distance of 10.77–14.78%.
Afro-Malagasy region Molossidae phylogeny 5
FIG. 1. Bayesian inference tree based on analysis of 1262 nucleotides of the nuclear Rag2 gene illustrating evolutionary relationshipsbetween molossid bat haplotypes and non-molossid outgroups. Nodal support values are represented as (Bayesian posteriorprobability / maximum parsimony bootstrap percent / neighbour-joining bootstrap percent). The positions of Sauromys petrophilusand Tadarida fulminans, indicated by dotted lines, were based on an analysis of the 3’end of the Rag2 region (634 nt). H = haplotype(see Appendix). A = Africa, Amr = Americas, C = Comoros, M = Madagascar, Moz = Mozambique, My = Mayotte, Reu =
La Réunion, sA = southern Africa, T = Tanzania
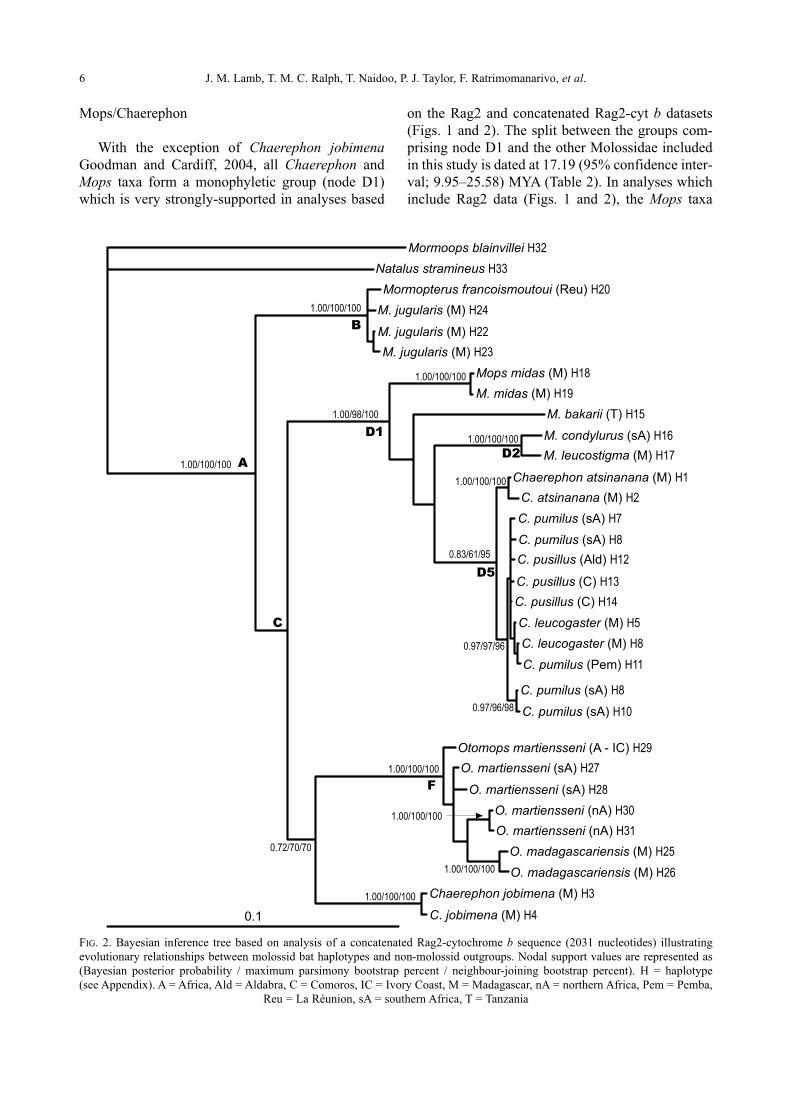
6 J. M. Lamb, T. M. C. Ralph, T. Naidoo, P. J. Taylor, F. Ratrimomanarivo, et al.
Mops/Chaerephon
With the exception of Chaerephon jobimenaGoodman and Cardiff, 2004, all Chaerephon andMops taxa form a monophyletic group (node D1)which is very strongly-supported in analyses based
on the Rag2 and concatenated Rag2-cyt b datasets(Figs. 1 and 2). The split between the groups com-prising node D1 and the other Molossidae includedin this study is dated at 17.19 (95% confidence inter-val; 9.95–25.58) MYA (Table 2). In analyses whichinclude Rag2 data (Figs. 1 and 2), the Mops taxa
FIG. 2. Bayesian inference tree based on analysis of a concatenated Rag2-cytochrome b sequence (2031 nucleotides) illustratingevolutionary relationships between molossid bat haplotypes and non-molossid outgroups. Nodal support values are represented as(Bayesian posterior probability / maximum parsimony bootstrap percent / neighbour-joining bootstrap percent). H = haplotype (see Appendix). A = Africa, Ald = Aldabra, C = Comoros, IC = Ivory Coast, M = Madagascar, nA = northern Africa, Pem = Pemba,
Reu = La Réunion, sA = southern Africa, T = Tanzania
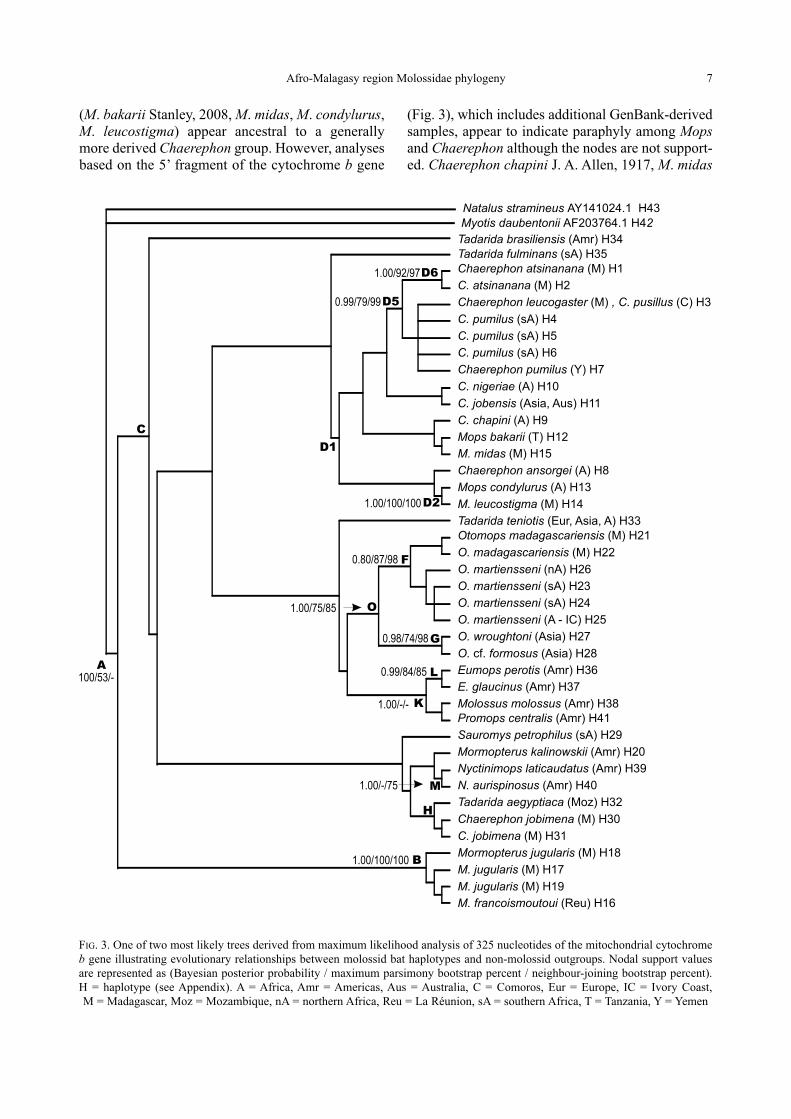
(M. bakarii Stanley, 2008, M. midas, M. condylurus,M. leucostigma) appear ancestral to a generallymore derived Chaerephon group. However, analysesbased on the 5’ fragment of the cytochrome b gene
(Fig. 3), which includes additional GenBank-derivedsamples, appear to indicate paraphyly among Mopsand Chaerephon although the nodes are not support-ed. Chaerephon chapini J. A. Allen, 1917, M. midas
Afro-Malagasy region Molossidae phylogeny 7
FIG. 3. One of two most likely trees derived from maximum likelihood analysis of 325 nucleotides of the mitochondrial cytochromeb gene illustrating evolutionary relationships between molossid bat haplotypes and non-molossid outgroups. Nodal support valuesare represented as (Bayesian posterior probability / maximum parsimony bootstrap percent / neighbour-joining bootstrap percent). H = haplotype (see Appendix). A = Africa, Amr = Americas, Aus = Australia, C = Comoros, Eur = Europe, IC = Ivory Coast, M = Madagascar, Moz = Mozambique, nA = northern Africa, Reu = La Réunion, sA = southern Africa, T = Tanzania, Y = Yemen
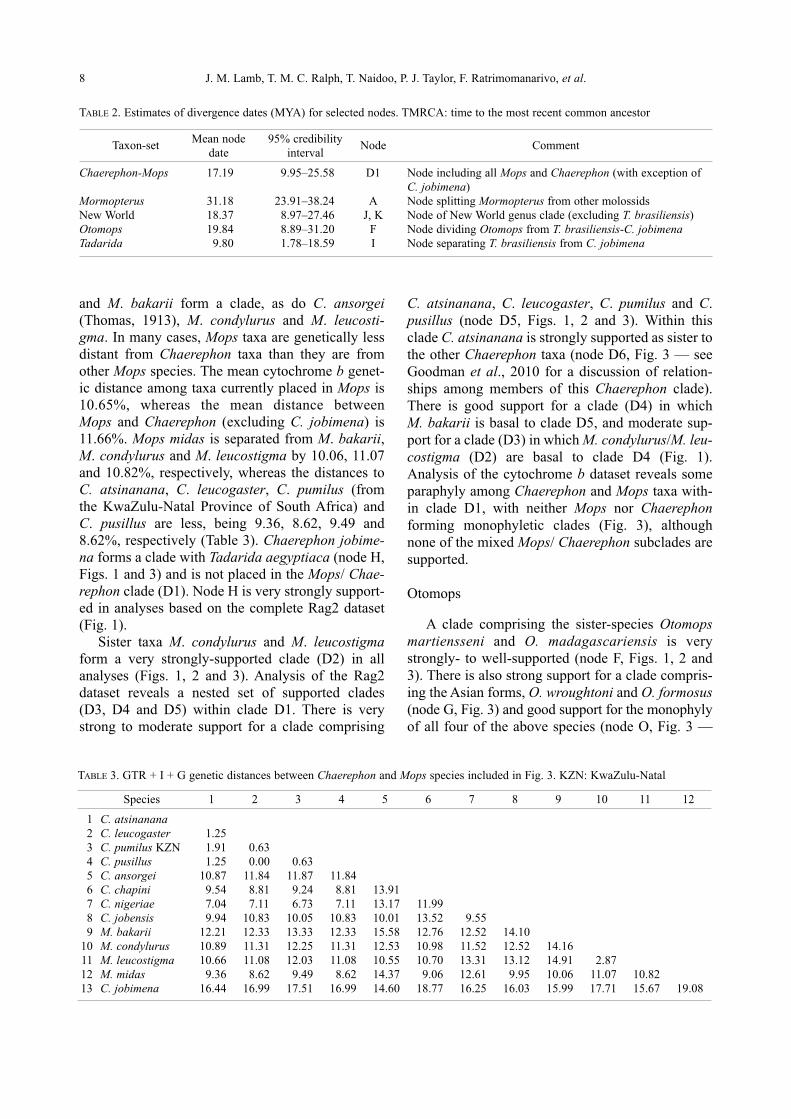
8 J. M. Lamb, T. M. C. Ralph, T. Naidoo, P. J. Taylor, F. Ratrimomanarivo, et al.
and M. bakarii form a clade, as do C. ansorgei(Thomas, 1913), M. condylurus and M. leucosti-gma. In many cases, Mops taxa are genetically lessdistant from Chaerephon taxa than they are fromother Mops species. The mean cytochrome b genet-ic distance among taxa currently placed in Mops is10.65%, whereas the mean distance between Mops and Chaerephon (excluding C. jobimena) is11.66%. Mops midas is separated from M. bakarii,M. condylurus and M. leucostigma by 10.06, 11.07 and 10.82%, respectively, whereas the distances toC. at si nanana, C. leucogaster, C. pumilus (fromthe Kwa Zulu-Natal Province of South Africa) and C. pusillus are less, being 9.36, 8.62, 9.49 and8.62%, respectively (Table 3). Chaerephon jobime-na forms a clade with Tadarida aegyptiaca (node H,Figs. 1 and 3) and is not placed in the Mops/ Chae -re phon clade (D1). Node H is very strongly support-ed in analyses based on the complete Rag2 dataset(Fig. 1).
Sister taxa M. condylurus and M. leucostigmaform a very strongly-supported clade (D2) in allanalyses (Figs. 1, 2 and 3). Analysis of the Rag2dataset reveals a nested set of supported clades (D3, D4 and D5) within clade D1. There is verystrong to moderate support for a clade comprising
C. atsina nana, C. leucogaster, C. pumilus and C.pusillus (node D5, Figs. 1, 2 and 3). Within thisclade C. atsinanana is strongly supported as sister tothe other Chaerephon taxa (node D6, Fig. 3 — seeGoodman et al., 2010 for a discussion of relation-ships among members of this Chaerephon clade).There is good support for a clade (D4) in which M. bakarii is basal to clade D5, and moderate sup-port for a clade (D3) in which M. condylurus/M. leu-costigma (D2) are basal to clade D4 (Fig. 1).Analysis of the cytochrome b dataset reveals someparaphyly among Chaerephon and Mops taxa with-in clade D1, with neither Mops nor Chaerephonforming monophyletic clades (Fig. 3), althoughnone of the mixed Mops/ Chaerephon subclades aresupported.
Otomops
A clade comprising the sister-species Otomopsmartiensseni and O. madagascariensis is verystrong ly- to well-supported (node F, Figs. 1, 2 and3). There is also strong support for a clade compris-ing the Asian forms, O. wroughtoni and O. formosus(node G, Fig. 3) and good support for the monophylyof all four of the above species (node O, Fig. 3 —
Species 1 2 3 4 5 6 7 8 9 10 11 12
1 C. atsinanana 2 C. leucogaster 1.253 C. pumilus KZN 1.91 0.634 C. pusillus 1.25 0.00 0.635 C. ansorgei 10.87 11.84 11.87 11.846 C. chapini 9.54 8.81 9.24 8.81 13.917 C. nigeriae 7.04 7.11 6.73 7.11 13.17 11.998 C. jobensis 9.94 10.83 10.05 10.83 10.01 13.52 9.559 M. bakarii 12.21 12.33 13.33 12.33 15.58 12.76 12.52 14.10
10 M. condylurus 10.89 11.31 12.25 11.31 12.53 10.98 11.52 12.52 14.1611 M. leucostigma 10.66 11.08 12.03 11.08 10.55 10.70 13.31 13.12 14.91 2.8712 M. midas 9.36 8.62 9.49 8.62 14.37 9.06 12.61 9.95 10.06 11.07 10.8213 C. jobimena 16.44 16.99 17.51 16.99 14.60 18.77 16.25 16.03 15.99 17.71 15.67 19.08
TABLE 3. GTR + I + G genetic distances between Chaerephon and Mops species included in Fig. 3. KZN: KwaZulu-Natal
Taxon-setMean node 95% credibility
Node Commentdate interval
Chaerephon-Mops 17.19 9.95–25.58 D1 Node including all Mops and Chaerephon (with exception ofC. jobimena)
Mormopterus 31.18 23.91–38.24 A Node splitting Mormopterus from other molossidsNew World 18.37 8.97–27.46 J, K Node of New World genus clade (excluding T. brasiliensis)Otomops 19.84 8.89–31.20 F Node dividing Otomops from T. brasiliensis-C. jobimenaTadarida 9.80 1.78–18.59 I Node separating T. brasiliensis from C. jobimena
TABLE 2. Estimates of divergence dates (MYA) for selected nodes. TMRCA: time to the most recent common ancestor
see Lamb et al., 2008 for further discussion). Thereis no support for any higher-level relationships in-volving Otomops. The split between the Otomopsclade and clade I comprising Tadarida brasiliensis,Chaere phon jobimena and T. aegyptiaca (Fig. 1) isdated at 19.84 (95% confidence interval; 8.89–31.20) MYA (Table 2).
Tadarida and Sauromys
The Tadarida species represented in this studyare T. fulminans, T. aegyptiaca, T. brasiliensis andT. teniotis (Rafinesque, 1814). As previously men-tioned, there is very strong support for a T. aegyp-tiaca/Chaerephon jobimena clade (H) (Fig. 1).There is also good support from the Rag2 dataset forthe association of clade H with T. brasiliensis (nodeI, Fig. 1) to form a group whose age is estimated at9.80 (95% confidence; 1.78–8.59) MYR. Based onanalyses of the 3’end of the Rag2 dataset, Sauromyspetrophilus and T. fulminans are basal in a modera -tely-supported clade (E), which also contains Cha e -rephon/Mops clade D1. There is no support for themonophyly of Tadarida, and in particular, T. teniotisis not sister to other species placed in the genusTadarida (Fig. 3).
Molossus, Nyctinomops and Eumops
There is good support for association of Molo -ssus molossus (Pallas, 1766) and Nyctinomops ma -cro tis (Gray, 1840) (node J, Fig. 1). The age of thisclade has been estimated at approximately 18.37(95% con fidence; 8.97–27.46) MYR. The cyto -chro me b dataset (Fig. 3) provides support for the following associations: Eumops perotis (Schinz,1821)/E. glau cinus (Wagner, 1843) (node G, strongsupport), M. mo lossus and Promops centralisThomas, 1915 (node K, moderate support) and forNyctinomops laticaudatus/N. aurispinosus (node M,good support).
DISCUSSION
Analyses of the nuclear Rag2 gene have shedsome light on basal relationships within the Mo -lossidae of eastern Africa and the islands of thewestern Indian Ocean, whereas those based on themitochondrial cytochrome b gene have provided insights into relationships within and between gen-era and species. Some genera (e.g., Otomops) arestrongly-supported and distinct whereas others (e.g.,Tadarida) are not supported. These studies, which
have a number of taxonomic implications, have revealed paraphyly between closely-related as wellas distantly-related genera, and even within generaacross continents, which highlights the need for taxonomic approaches based on a combination of morphological and molecular data. The Molossidaeform a monophyletic clade in analyses based on the5’end of the cytochrome b gene as well as in analy-ses of the Rag2 and concatenated Rag2/cytochromeb datasets.
This study provides strong support for the mono-phyly of the Chaerephon + Mops taxa, but not for either of the genera Chaerephon or Mops separately,as some paraphyly was recovered, particularly for C. jobimena. Further, although there are indicationsthat, within this grouping, certain Mops species areancestral and Chaerephon species more derived,lack of resolution and paraphyly among Chaerephonand Mops species mitigates against proposals thatChaerephon as currently described is a subgenus ofTadarida (Peterson et al., 1995) or a genus in itsown right (Freeman, 1981). Pending the outcome ofmore complete sampling, consideration might begiven to combining Chaerephon (with the exceptionof C. jobimena) and Mops into a single genus.
Chaerephon jobimena, referred to Chaerephonbased on morphological similarities to other Cha e -re phon spp. (Goodman and Cardiff, 2004), is genet-ically more similar to Tadarida aegyptiaca, withwhich it forms a well-supported clade based onanalyses of Rag2 sequence data, than to other mem-bers of the genus Chaerephon. The cytochrome bgenetic distances are: C. jobimena to other Chaere -phon species, 14.62–18.74%, and C. jobimena to T. aegyptiaca, 11.15% (Table 3). The former dis-tances are more consistent with the mean distancebetween currently-established Molossidae genera(18.35%), and the latter with that between molossidspecies (11.24%) (P. J. Taylor, S. M. Goodman, F. H. Ratrimomanarivo, W. Buccas, and J. M. Lamb, unpublished data). The morphological similarity of C. jobimena to Chae re phon taxa may be indicativeof sometimes problematic parallel evolution in morphological characters in bats (Ruedi and Ma-y er, 2001). As currently-recognized, the genus Tada -rida is not a natural group. Tadarida teniotis is the type species of this genus, and as T. aegyptiaca andC. jobimena form a separate clade and T. aegyptia -ca is the type species of the genus Nyctinomus(Van Cakenberghe and Seamark, 2009), a possibleresolution to this taxonomic quandary is to placethese latter two taxa and sister species subsequent-ly discovered in a separate genus, Nyctinomus. We
Afro-Malagasy region Molossidae phylogeny 9
await a greater taxonomic sampling and resolutionof the phylogeny of other African Molossidae beforeformally making this recommendation.
This study is the first molecular report on thephylogenetic position of the mainland African form,Mops bakarii, which forms part of the well-support-ed Mops/Chaerephon clade (D1). Within this cladeit appears to occupy a derived position relative to M. midas, condylurus and leucostigma and to be ancestral to a C. pumilus/pusillus/atsinanana/leuco -gaster clade (Fig. 1).
The genus Mormopterus has a disjunct distribu-tion, being represented in our dataset by M. jugu-laris (Madagascar), M. francoismoutoui (La Ré -union) and M. kalinowskii (New World); the Mala -gasy region and New World taxa are paraphyletic.Mormopterus jugularis and M. francoismoutouiform a monophyletic clade, which defines this genusand is basal within the Molossidae. Mormopteruskalinowskii is separated from the Malagasy regiontaxa by a cytochrome b genetic distance of 17.93%to 18.74%, consistent with molossid inter-genericdistances (mean 18.35%) (P. J. Taylor, S. M. Good -man, F. H. Ratrimomanarivo, W. Buccas, and J. M.Lamb, unpublished data). The position within theMolossidae of M. kalinow skii, for which only cy-tochrome b data is available, is not supported, al-though it appears as sister to the South Americanforms Nyctinomops laticaudatus and N. aurispi no -sus and is separated from them by a mean geneticdistance of 12.78%, consistent with the mean inter-specific distance for Molossidae of 11.15% (P. J.Taylor, S. M. Goodman, F. H. Ratrimomanarivo, W.Buccas, and J. M. Lamb, unpublished data), whichis likely to be an over-estimate as it includes incor-rectly-assigned taxa. While more sampling is need-ed, it is clear that M. kalinowskii is not correctlyplaced in the genus Mormopterus. Since M. jugu-laris is the type species of Mormopterus, our dataclearly show that the New World M. kalinowskiimust be referred to a different genus (based on fu-ture research with wider more taxonomic samplingof New World ‘Mormopterus’). A recent morpho-logical and molecular genetics study (Goodman etal., 2008) showed that the species from La Réunion(M. francoismoutoui) and Mauritius (M. acetabulo-sus) showed a 5.01% uncorrected sequence diver-gence from one another in the mitochondrial DNAcontrol region. They were assigned separate speciesnames based on this and other sequence data, whichdid not include cyto chrome b. There is no geneticsupport for a relation ship between T. aegyptiaca, T. bra siliensis and Mormopterus, to which they are
phenetically (morphologically) similar (Freeman,1981), supporting the notion that this grouping is dueto convergence of shape.
The monophyly of the genus Tadarida, repre-sented in this study by the species T. fulminans, T. aegyptiaca, T. brasiliensis and T. teniotis is notsup ported. Further genetic data is needed from a greater number of taxa referred to this genus for a better resolution of the species that should beplaced in Tadarida. Given that T. teniotis is the typespecies of the genus Tadarida, it and demonstratedsister-taxa should be those restricted to this genus.
There is good support for a C. jobimena/T. aegy -ptia ca/T. brasiliensis clade (node I, Fig. 1). AlthoughC. jobimena and T. aegyptiaca appear separated by an interspecific-level genetic distance (11.15%), T. brasiliensis is separated from C. jobimena(17.26%) and T. aegyptiaca (15.07%) by larger dis-tances, more consistent with the mean intergenericdistance for Molossidae (18.35%) (P. J. Taylor, S.M. Goodman, F. H. Ratrimomanarivo, W. Buccas,and J. M. Lamb, unpublished data). Thus, althoughthe Afro-Malagasy C. jobimena and T. aegyptiacaare likely congeners, they are notably distinct fromthe New World T. brasiliensis at the generic level.The type species of the currently unrecognised ge -nus Nyctinomus is N. aegyptiaca; this generic namewould be available for this clade.
There is moderate support for an African cladeincluding Sauromys petrophilus, T. fulminans andChaerephon/Mops clade D1 in an analysis based onthe 3’ fragment of the Rag2 gene (node E, Fig. 1).The cytochrome b genetic distance between themonospecific genus Sauromys and T. fulminans is14.4%, intermediate between the mean inter-speci-fic and inter-generic values for Molossidae (11.15%and 18.35% — P. J. Taylor, S. M. Goodman, F. H.Ra trimomanarivo, W. Buccas, and J. M. Lamb, un-published data). Sauromys petrophilus is separatedfrom members of the well-supported Chaere phon/Mops clade (D1) by a distance of between 14.1 and19.1%, consistent with its status as a distinct genus,as in Peterson (1965, 1985) and Simmons (2005).There is no evidence that Sauromys is a subgenus ofMormopterus, as proposed by several taxonomists(e.g., Freeman, 1981; Koopman, 1994). The distancebetween T. ful minans and Chaerephon/Mops cladeD1 (11.5–13.8%) indicates a closer relationship.
The composition of the genus Otomops is strong-ly-supported by both the Rag2 and cytochrome bdatasets; it appears to be discrete, with no clearly-defined wider relationships among the Molossidaeincluded in this study. A clade comprising the sister-
10 J. M. Lamb, T. M. C. Ralph, T. Naidoo, P. J. Taylor, F. Ratrimomanarivo, et al.
species O. martiensseni and O. madagascariensis ismoderately supported as sister to, but clearly sepa-rate from, a strongly-supported clade comprising theAsian forms, O. wroughtoni and O. formosus.
The earliest molossid fossil, Tadarida rusingaefrom Rusinga Island, Kenya, dates back to the earlyMiocene, 17.5 to 18 MYA (Arroyo-Cabrales et al.,2002) whereas the Vespertilionoidea, which includethe Molossidae, are estimated to have originated 52 to 50 MYA (Teeling et al., 2005). Our datasetsupports mixed clades comprising New World andOld World Molossidae. For example, the genusMormo pterus, estimated to have originated 31.18MYA, and for which the type species is a Malagasyendemic, is basal to a well-supported clade whichincludes a well-supported American Molossus/Ny-c ti nomops clade (≈ 18.37 MY-old) and a strongly-supported ≈ 17.19 MY-old Afro-Malagasy Mops/Cha e re phon clade.
Assuming an Old World origin for the Molossi -dae, and as the split between South America andAfrica (100–84 MYA) predates the origin of Molos-sidae (35–38 MYA — Jones et al., 2005), it is like-ly that the presence of Molossidae in the Americas required at least two dispersal events, one involv-ing the ancestor of Molossus/Nyctinomops occurringap prox ima tely 8.37 MYA, and the other involv-ing T. brasiliensis, which split from the Mala gasytaxon, C. jobimena, ≈ 9.8 MYA. The position ofNew World M. kalinowskii is equivocal, althoughanalysis of cytochrome b sequences (Fig. 3) sug-gest it may be associated with the New World clade. Trans-Atlantic dispersal would have requiredisland hopping across the widening South Atlantic,or rafting (Parrish, 1993). An alternative route may have involved northward dispersal to Eurasiaacross the Tethys Sea followed by entry into NorthAmer ica via Beringia or three putative trans-Atlantic land bridges, followed by entry into SouthAmerica via the islands of the Caribbean (Janis,1993; Sanmartin et al., 2001). Clearly, these hy-potheses require testing from much wider taxonom-ic sampling from New World molossids.
On the basis of current systematics, the disjunctdistribution of certain genera, such as Mormopte-rus or Tadarida, on either side of the Atlantic mayeither be a result of a secondary dispersal event ormorphological convergence in certain classically-used taxonomic characters (see Hoofer and Van DenBussche 2003 for further discussion). In the case of Tadarida, which is genetically rather diverse and does not appear to be a natural group based on conservative Rag2 sequences, it would appear that
the latter is true, although greater insight can only be obtained by more complete taxonomic and genomicsampling.
Taxonomic Conclusions
The data from this study reaffirm that the taxo-nomic use of morphological characters alone can bemisleading. For example, the generic placement of the recently-described C. jobimena was based onmorphological characters (Goodman and Cardiff,2004), whereas genetic estimates based on both the nuclear Rag2 and mitochondrial cyto chrome bgenes place it as closest to Tadarida aegyp tiaca.This is likely to be a case of homoplasy resultingfrom convergent morphological evolution.
The name Mormopterus should be reserved forthe western Indian Ocean island forms M. jugularis,M. francoismoutoui, M. acetabulosus and other taxathat can be demonstrated to be members of thisclade, whereas the South American Mormopte-rus kalinowskii appears to be incorrectly placedwithin this genus. Sauromys petrophilus is support-ed as a mon otypic genus allied to the Chaere phon/Mops clade and Ta darida fulminans. Otomops isstrong ly supported as a discrete genus.
The monophyly of a combined Chaerephon/Mops group is strongly supported, but not the in-tegrity of the genera Chaerephon or Mops, whichshow some paraphyly in a combined clade in whichMops taxa are generally ancestral to more-derivedChaerephon species. Our molecular data places M. ba karii within the well-supported Mops/Cha e re - phon clade.
The genus Tadarida is not monophyletic. Pend -ing wider taxonomic sampling, it is recommendedthat the genus name Tadarida be reserved for T. te-nio tis, the type species, and any yet-to-be discoveredclosely-related taxa. Further, the genus name, Nycti -nomus, might be applied to T. aegyptiaca, the typespecimen, C. jobimena and other close relatives.
ACKNOWLEDGEMENTS
We gratefully acknowledge financial support from theVolks wagen Foundation, The John D. and Catherine T. Mac -Arthur Foundation and the National Research Foundation(South Africa). We also acknowledge, with thanks, the com-ments of the reviewers of this manuscript.
LITERATURE CITED
ARROYO-CABRALES, J. R., D. GREGORIN, A. SCHLITTER, and A. WALKER. 2002. The oldest African molossid bat cranium
Afro-Malagasy region Molossidae phylogeny 11
(Chi roptera: Molossidae). Journal of Vertebrate Paleontol -ogy, 22: 380–387.
BAKER, R. J., C. A. PORTER, J. C. PATTON, and R. A. VAN
DEN BUSSCHE. 2000. Systematics of bats of the family Phyl lo stomidae based on RAG2 DNA sequences. Occa sion -al Papers, Museum of Texas Tech University, 202: i + 1–16.
BOUCHARD, S. 1998. Chaerephon pumilus. Mammalian Species,574: 1–6.
CHUBB, E. C. 1917. A new bat of the genus Otomops obtained atDurban. Annals of the Durban Museum, 1: 433–434.
DE QUEIROZ, A. 1993. For consensus (sometimes). SystematicBiology, 42: 366–372.
DOBSON, G. E. 1878. Catalogue of the Chiroptera in the col-lection of the British Museum. British Museum, London, 567 pp.
DRUMMOND, A. J., and A. RAMBAUT. 2009. BEAUti v.1.5.1.Baye sian evolutionary analysis utility, version 1.5.1, 2009.http://code.google.com/p/beast-mcmc/downloads/list.
DRUMMOND, A. J., and A. RAMBAUT. 2010. BEAST v1.5.4.BEAST: Bayesian evolutionary analysis sampling trees,version 1.5.4, 2010. http://code.google.com/p/beast-mcmc/downloads/list.
EICK, G. N., D. S. JACOBS, and C. A. MATTHEE. 2005. A nuclearDNA phylogenetic perspective on the evolution of echolo-cation and historical biogeography of extant bats (Chiro -ptera). Molecular Biology and Evolution, 22: 1869–1886.
FREEMAN, P. W. 1981. A multivariate study of the family Molos -sidae (Mammalia: Chiroptera): morphology, ecology, evolu-tion. Fieldiana: Zoology (N.S.), 7: 1–173.
GOODMAN, S. M., and S. G. CARDIFF. 2004. A new species of Chaerephon (Molossidae) from Madagascar with notes on other members of the family. Acta Chiropterologica, 6:227–248.
GOODMAN, S. M., and F. H. RATRIMOMANARIVO. 2007. The taxo -nomic status of Chaerephon pumilus from the western Sey -chelles: resurrection of the name C. pusillus for an endemicspecies. Acta Chiropterologica, 9: 391–399.
GOODMAN, S. M., B. JANSEN VAN VUUREN, F. RATRIMOMANA -RIVO, J.-M. PROBST, and R. C. K. BOWIE. 2008. Specific status of populations in the Mascarene Islands referred toMormopterus acetabulosus (Chiroptera: Molossidae), withdescription of a new species. Journal of Mammalogy, 89:1316–1327.
GOODMAN, S. M., W. BUCCAS, T. NAIDOO, F. RATRIMOMANA -RIVO, P. J. TAYLOR, and J. LAMB. 2010. Patterns of morpho-logical and genetic variation in western Indian Ocean mem-bers of the Chaerephon ‘pumilus’ complex (Chiroptera:Mol ossidae), with the description of a new species fromMada gascar. Zootaxa, 2551: 1–36.
GRUBB, P., T. S. JONES, A. G. DAVIES, E. EDBERG, E. D. STARIN,and J. E. HILL. 1998. Mammals of Ghana, Sierra Leone andthe Gambia. Trendrine Press, Zennor, St. Ives, UK, 265 pp.
GUINDON, S., and O. GASCUEL. 2003. A simple, fast, and accu-rate algorithm to estimate large phylogenies by maximumlikelihood. Systematic Biology, 52: 696–704.
HAYMAN, R. W., and J. E. HILL. 1971. Order Chiroptera, in Themammals of Africa: an identification manual (J. MEESTER,and H. W. SETZER, eds.). Smithsonian Institution Press,Wash ington D.C., 73 pp.
HOOFER, S. R., and R. A. VAN DEN BUSSCHE. 2003. Molecularphyl ogenetics of the chiropteran family Vespertilionidae.Acta Chiropterologica, 5 (Supplement): 1–63.
HOOFER, S. R., S. A. REEDER, E. W. HANSEN, and R. A. VAN DEN
BUSSCHE. 2003. Molecular phylogenetics and taxonomic review of noctilionoid and vespertilionoid bats (Chiroptera:Yango chiroptera). Journal of Mammalogy, 84: 809–821.
HUELSENBECK, J. P., and F. RONQUIST. 2001. MRBAYES: A Bayesian inference of phylogeny. Bioinformatics, 17:754–755.
IRWIN, D. M., T. D. KOCHER, and A. C. WILSON. 1991. Evolutionof the cytochrome b gene of mammals. Journal of MolecularEvolution, 32: 128–144.
JACOBS, D. S., and M. B. FENTON. 2002. Mormopterus petro -philus. Mammalian Species, 703: 1–3.
JANIS, C. M. 1993. Tertiary mammal evolution in the context ofchanging climates, vegetation and tectonic events. AnnualReview of Ecology and Systematics, 24: 467–500.
JONES, K. E., O. R. P. BININDA-EMONDS, and J. L. GITTLEMAN.2005. Bats, clocks, and rocks: diversification patterns inChi ro ptera. Evolution, 59: 2243–2255.
KOOPMAN, K. F. 1975. Bats of the Sudan. Bulletin of the Amer -ican Museum of Natural History, 154: 353–444.
KOOPMAN, K. F. 1993. Order Chiroptera. Pp. 137–241, inMam mal species of the World: a taxonomic and geograph-ic reference, 2nd edition (D. E. WILSON and D. M. REEDER,eds.). Smithsonian Institution Press, Washington, D.C.,1206 pp.
KOOPMAN, K. F. 1994. Vol VIII. Mammalia. Part 60. Chiropte-ra: systematics. Pp. vii + 1–217, in Handbook of zoology (J. NIETHAMMER, H. SCHLIEMANN, and D. STARCK, eds.). Walter de Gruyter, Berlin, vii + 217 pp.
LACK, J. B., Z. P. ROEHRS, C. E. STANLEY, JR., M. RUEDI, andR. A. VAN DEN BUSSCHE. 2010. Molecular phylogenetics ofMyotis suggests familial-level divergence of the genus Cis -tugo (Chiroptera). Journal of Mammalogy, 91: 976–992.
LAMB, J. M., E. H. ABDEL-RAHMAN, T. RALPH, M. B. FENTON, A. NAIDOO, E. J. RICHARDSON, D. S. JACOBS, C. DENYS, andP. J. TAYLOR. 2006. Phylogeography of southern and north-eastern African populations of Otomops martiensseni(Chiroptera: Molossidae). Durban Museum Novitates, 31:42–53.
LAMB, J. M., T. M. C. RALPH, S. M. GOODMAN, W. BOGDA NO -WICZ, J. FAHR, M. GAJEWSKA, P. J. J. BATES, J. EGER, P. BEN -DA, and P. J. TAYLOR. 2008. Phylogeography and predicteddistribution of African-Arabian and Malagasy populationsof giant mastiff bats, Otomops (Chiroptera: Molossidae).Acta Chiropterologica, 10: 21–40.
LEGENDRE, S. 1984. Etude odontologique des représentantsactu els du groupe Tadarida (Chiroptera: Molossidae). Im -plications phylogénétiques, systématiques et zoogéogra -phiques. Revue Suisse de Zoologie, 91: 399–442.
MAHONEY, J. A., and D. W. WALTON. 1988. Molossidae. Pp.146–150, in Zoological catalogue of Australia. Volume 5.Mammalia (D. W. WALTON, ed.). Bureau of Flora and Fau -na, Canberra, 274 pp.
MCFARLAND, D. C. 1998. Forest vertebrate fauna study for a comprehensive regional assessment in south-east Queens -land. Stage IA: data audit and gap assessment. Queens-land CRA/RFA Steering Committee, Indooroopilly, vii +1–136 pp.
MEESTER, J. A. J., I. L. RAUTENBACH, N. J. DIPPENAAR, and C.M. BAKER. 1986. Classification of southern African mam-mals. Transvaal Museum Monograph, Pretoria, 359 pp.
MILLER-BUTTERWORTH, C. M., W. J. MURPHY, S. J. O’BRIEN,D. S. JACOBS, M. S. SPRINGER, and E. C. TEELING. 2007. A family matter: conclusive resolution of the taxonomic
12 J. M. Lamb, T. M. C. Ralph, T. Naidoo, P. J. Taylor, F. Ratrimomanarivo, et al.
Afro-Malagasy region Molossidae phylogeny 13
position of the long-fingered bats, Miniopterus. MolecularBiol ogy and Evolution, 24: 1553–1561.
PARRISH, J. T. 1993. The palaeogeography of the opening SouthAtlantic. Pp. 8–27, in The Africa-South America connec-tion. Oxford Monographs on Biogeography (W. GEORGE andR. LAVOCAT, eds.). Clarendon Press, Oxford, xvii + 166 pp.
PETERSON, R. L. 1965. A review of the flat-headed bats of thefamily Molossidae from South America and Africa. LifeSci ences Contribution, Royal Ontario Museum, 64: 1–32.
PETERSON, R. L. 1985. A systematic review of the molossid batsallied with the genus Mormopterus (Chiroptera: Molos si -dae). Acta Zoologica Fennica, 170: 205–208.
PETERSON, R. L., J. L. EGER, and L. MITCHELL. 1995. Chiroptè -res. Volume 84. Faune de Madagascar. Muséum Nationald’His toire Naturelle, Paris, 204 pp.
POSADA, D. 2008. jModelTest: phylogenetic model averaging.Molecular Biology and Evolution, 25: 1253–1256.
RAMBAUT, A., and A. J. DRUMMOND. 2009. Tracer v. 1.5, 2009. MCMC Trace File Analyser. http://tree.bio.ed.ac.uk/software/tracer/.
RATRIMOMANARIVO, F. H., J. VIVIAN, S. M. GOODMAN, and J. M.LAMB. 2007. Morphological and molecular assessment ofthe specific status of Mops midas (Chiroptera: Molossi-dae) from Madagascar and Africa. African Zoology, 42:237–263.
RATRIMOMANARIVO, F. H., S. M. GOODMAN, N. HOOSEN, P. J.TAYLOR, and J. LAMB. 2008. Morphological and molecularvariation in Mops leucostigma (Chiroptera: Molossidae) ofMadagascar and the Comoros: phylogeny, phylogeographyand geographic variation. Mitteilungen aus dem Hamburg -ischen Zoologischen Museum, 105: 57–101.
RATRIMOMANARIVO, F. H., S. M. GOODMAN, W. T. STANLEY, T.NAIDOO, P. J. TAYLOR, and J. M. LAMB. 2009a. Geographicand phylogeographic variation in Chaerephon leucogaster(Chiroptera: Molossidae) of Madagascar and the westernIndian Ocean islands of Mayotte and Pemba. Acta Chiro pte -rologica, 11: 25–52.
RATRIMOMANARIVO, F. H., S. M. GOODMAN, P. J. TAYLOR, B.MEL SON, and J. LAMB. 2009b. Morphological and geneticvariation in Mormopterus jugularis (Chiroptera: Molos si -dae) in different bioclimatic regions of Madagascar with na -tural history notes. Mammalia, 73: 110–129.
ROBERTS, A. 1917. Descriptions of two new species of a newsubgenus of bats and a new species of molerats. Annals ofthe Transvaal Museum, 6: 4–6.
ROSEVEAR, D. R. 1965. The bats of West Africa. British Muse -um (Natural History), London, 418 pp.
RUEDI, M., and F. MAYER. 2001. Molecular systematics of batsof the genus Myotis (Vespertilionidae) suggests determin-istic ecomorphological convergences. Molecular Phylo ge-n etics and Evolution, 21: 436–448.
SAIKI, R. K., D. H. GELFORD, S. STOFFEL, S. J. SCHARF, R.
HI GUCHI, G. T. HORN, K. B. MULLIS, and H. A. EHRLICH.1988. Primer-directed enzymatic amplification of DNA witha ther mostable DNA polymerase. Science, 239: 487–491.
SANMARTIN, I., H. ENGHOFF, and F. RONQUIST. 2001. Patterns ofanimal dispersal, vicariance and diversification in theHolarctic. Biolological Journal of the Linnean Society, 73:345–390.
SIMMONS, N. B. 2005. Order Chiroptera. Pp. 312–529, in Mam -mal species of the World: a taxonomic and geographical ref-erence, 3rd edition (D. E. WILSON and D. M. REEDER, eds.).The Johns Hopkins University Press, Baltimore, 2142 pp.
STADELMANN, B., L. K. LIN, T. H. KUNZ, and M. RUEDI. 2007.Mol ecular phylogeny of New World Myotis (Chiroptera,Ves pertilionidae) inferred from mitochondrial and nuclearDNA genes. Molecular Phylogenetics and Evolution, 43:32–48.
STANLEY, W. T. 2008. A new species of Mops (Molossidae) from Pemba Island, Tanzania. Acta Chiropterologica, 10:183–192.
SUDMAN, P. D., L. J. BARKLEY, and M. S. HAFNER. 1994. Fam -ilial affinity of Tomopeas ravus (Chiroptera) based on pro-tein electrophoretic and cytochrome b sequence data. Jour -nal of Mammalogy, 75: 365–377.
SWOFFORD, D. L. 2002. PAUP*: phylogenetic analysis usingpar si mony (*and other methods), version 4.0b10. SinauerAs sociates, Sunderland.
TAYLOR, P. J. 1999. Problems with identification of southernAfrican Chaerephon (Molossidae), and the possibility of a cryptic species from South Africa and Swaziland. ActaChi ro pterologica, 1: 191–200.
TAYLOR, P. J., J. M. LAMB, D. REDDY, T. NAIDOO, F. RATRIMO -MA NARIVO, E. RICHARDSON, C. SCHOEMAN, and S. M.GOOD MAN. 2009. Cryptic lineages of little free-tailed bats,Chae re phon pumilus (Chiroptera: Molossidae) from south-ern Af rica and the western Indian Ocean islands. AfricanZool ogy, 44: 55–70.
TEELING, E. C., M. S. SPRINGER, O. MADSEN, P. BATES, S. J.O’BRIEN, and W. J. MURPHY. 2005. A molecular phylogenyof bats illuminates biogeography and fossil record. Science,307: 580–584.
THOMPSON, J. D., D. G. HIGGINS, and T. J. GIBSON. 1994. CLUS -TAL W: improving the sensitivity of progressive multiplese quence alignment through sequence weighting, positionspecific gap penalties and weight matrix choice. NucleicAcids Research, 22: 4673–4680.
VAN CAKENBERGHE, V., and E. C. J. SEAMARK. 2009. AfricanChi ro ptera Report 2009. http://www.africanbats.org/ACR.htm.
VAN DEN BUSSCHE, R. A., and S. R. HOOFER. 2004. Phylogeneticrelationships among recent chiropteran families and the im-portance of choosing appropriate out-group taxa. Journal ofMammalogy, 85: 321–330.
Received 18 August 2010, accepted 02 March 2011
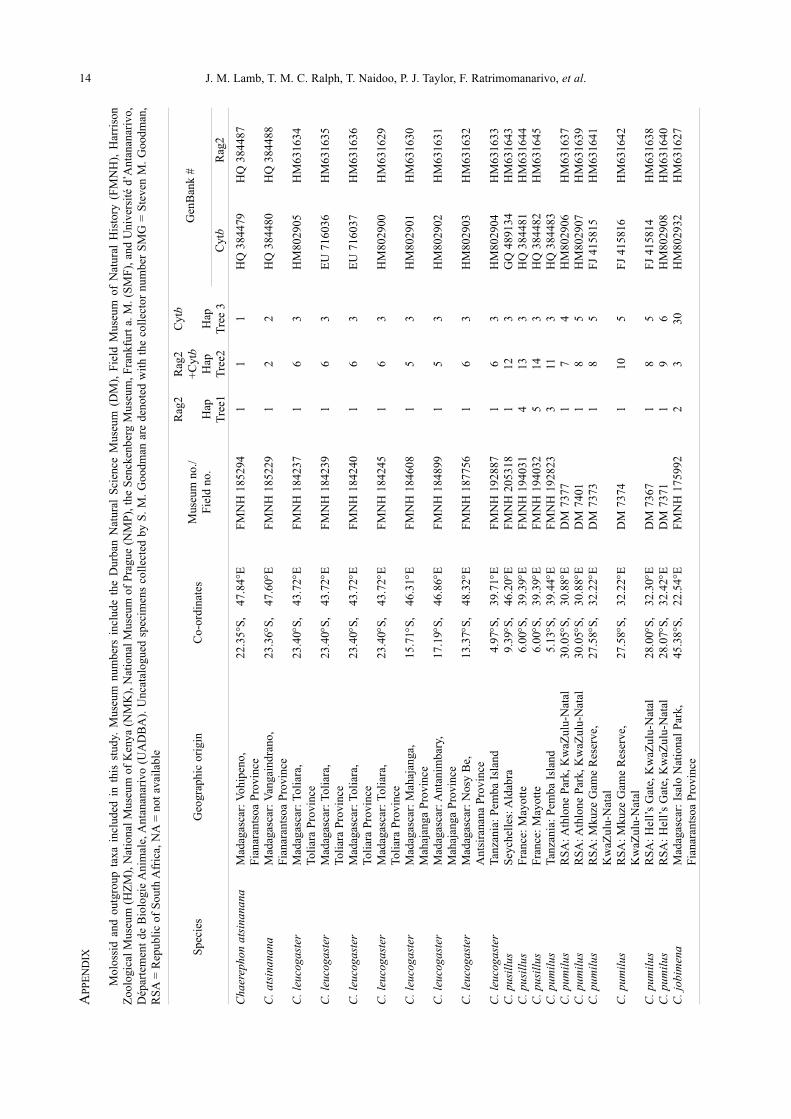
14 J. M. Lamb, T. M. C. Ralph, T. Naidoo, P. J. Taylor, F. Ratrimomanarivo, et al.A
PPE
ND
IX
Mol
ossi
d an
d ou
tgro
up t
axa
incl
uded
in
this
stu
dy.
Mus
eum
num
bers
inc
lude
the
Dur
ban
Nat
ural
Sci
ence
Mus
eum
(D
M),
Fie
ld M
useu
m o
f N
atur
al H
isto
ry (
FM
NH
), H
arri
son
Zoo
logi
cal
Mus
eum
(H
ZM
), N
atio
nal
Mus
eum
of
Ken
ya (
NM
K),
Nat
iona
l M
useu
m o
f P
ragu
e (N
MP
), t
he S
enck
enbe
rg M
useu
m, F
rank
furt
a. M
. (S
MF
), a
nd U
nive
rsit
é d’
Ant
anan
ariv
o,D
épar
tem
ent
de B
iolo
gie
Ani
mal
e, A
ntan
anar
ivo
(UA
DB
A).
Unc
atal
ogue
d sp
ecim
ens
coll
ecte
d by
S.
M.
Goo
dman
are
den
oted
wit
h th
e co
llec
tor
num
ber
SM
G =
Ste
ven
M.
Goo
dman
,R
SA
= R
epub
lic
of S
outh
Afr
ica,
NA
= n
ot a
vail
able
Rag
2 R
ag2
Cyt
b G
enB
ank
#S
peci
esG
eogr
aphi
c or
igin
Co-
ordi
nate
sM
useu
m n
o./
+C
ytb
Fie
ld n
o.H
apH
apH
apC
ytb
Rag
2T
ree1
Tre
e2T
ree
3
Cha
erep
hon
atsi
nana
naM
adag
asca
r: V
ohip
eno,
22
.35°
S,
47.8
4°E
F
MN
H 1
8529
41
11
HQ
384
479
HQ
384
487
Fia
nara
ntso
a P
rovi
nce
C. a
tsin
anan
aM
adag
asca
r: V
anga
indr
ano,
23
.36°
S,
47.6
0°E
FM
NH
185
229
12
2H
Q 3
8448
0H
Q 3
8448
8F
iana
rant
soa
Pro
vinc
eC
. leu
coga
ster
Mad
agas
car:
Tol
iara
, 23
.40°
S,
43.7
2°E
FM
NH
184
237
16
3H
M80
2905
HM
6316
34To
liar
a P
rovi
nce
C. l
euco
gast
erM
adag
asca
r: T
olia
ra,
23.4
0°S
, 43
.72°
EF
MN
H 1
8423
91
63
EU
716
036
HM
6316
35To
liar
a P
rovi
nce
C. l
euco
gast
erM
adag
asca
r: T
olia
ra,
23.4
0°S
, 43
.72°
EF
MN
H 1
8424
01
63
EU
716
037
HM
6316
36To
liar
a P
rovi
nce
C. l
euco
gast
erM
adag
asca
r: T
olia
ra,
23.4
0°S
, 43
.72°
EF
MN
H 1
8424
51
63
HM
8029
00H
M63
1629
Toli
ara
Pro
vinc
eC
. leu
coga
ster
Mad
agas
car:
Mah
ajan
ga,
15.7
1°S
,46
.31°
EF
MN
H 1
8460
81
53
HM
8029
01H
M63
1630
Mah
ajan
ga P
rovi
nce
C. l
euco
gast
erM
adag
asca
r: A
ntan
imba
ry,
17.1
9°S
, 46
.86°
EF
MN
H 1
8489
91
53
HM
8029
02H
M63
1631
Mah
ajan
ga P
rovi
nce
C. l
euco
gast
erM
adag
asca
r: N
osy
Be,
13
.37°
S,
48.3
2°E
FM
NH
187
756
16
3H
M80
2903
HM
6316
32A
ntsi
rana
na P
rovi
nce
C. l
euco
gast
erTa
nzan
ia:
Pem
ba I
slan
d4.
97°S
, 39
.71°
EF
MN
H 1
9288
71
63
HM
8029
04H
M63
1633
C. p
usill
usS
eych
elle
s: A
ldab
ra9.
39°S
, 46
.20°
EF
MN
H 2
0531
81
123
GQ
489
134
HM
6316
43C
. pus
illus
Fra
nce:
May
otte
6.00
°S,
39.3
9°E
FM
NH
194
031
413
3H
Q 3
8448
1H
M63
1644
C. p
usill
usF
ranc
e: M
ayot
te6.
00°S
, 39
.39°
EF
MN
H 1
9403
25
143
HQ
384
482
HM
6316
45C
. pum
ilus
Tanz
ania
: P
emba
Isl
and
5.13
°S,
39.4
4°E
FM
NH
192
823
311
3H
Q 3
8448
3C
. pum
ilus
RS
A:A
thlo
ne P
ark,
Kw
aZul
u-N
atal
30
.05°
S,
30.8
8°E
DM
737
71
74
HM
8029
06H
M63
1637
C. p
umilu
sR
SA
: Ath
lone
Par
k,K
waZ
ulu-
Nat
al30
.05°
S,
30.8
8°E
DM
740
11
85
HM
8029
07H
M63
1639
C. p
umilu
sR
SA
: M
kuze
Gam
e R
eser
ve,
27.5
8°S
, 32
.22°
ED
M 7
373
18
5F
J 41
5815
HM
6316
41K
waZ
ulu-
Nat
alC
. pum
ilus
RS
A:
Mku
ze G
ame
Res
erve
, 27
.58°
S,
32.2
2°E
DM
737
41
105
FJ
4158
16H
M63
1642
Kw
aZul
u-N
atal
C. p
umilu
sR
SA
: H
ell’
s G
ate,
Kw
aZul
u-N
atal
28.0
0°S
, 32
.30°
ED
M 7
367
18
5F
J 41
5814
HM
6316
38C
. pum
ilus
RS
A:
Hel
l’s
Gat
e, K
waZ
ulu-
Nat
al28
.07°
S,
32.4
2°E
DM
737
11
96
HM
8029
08H
M63
1640
C. j
obim
ena
Mad
agas
car:
Isa
lo N
atio
nal
Par
k,
45.3
8°S
, 22
.54°
EF
MN
H 1
7599
22
330
HM
8029
32H
M63
1627
Fia
nara
ntso
a P
rovi
nce
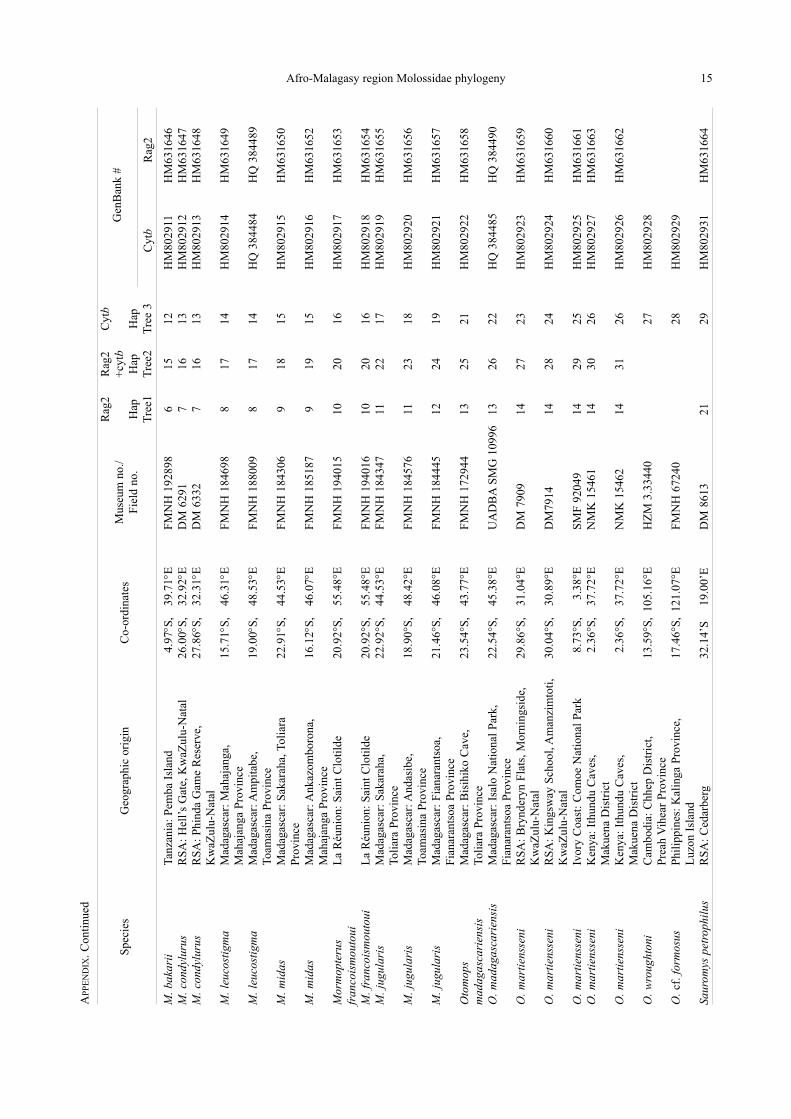
Afro-Malagasy region Molossidae phylogeny 15
M. b
akar
iiTa
nzan
ia:
Pem
ba I
slan
d4.
97°S
, 39
.71°
EF
MN
H 1
9289
86
1512
HM
8029
11H
M63
1646
M. c
ondy
luru
sR
SA
: H
ell’
s G
ate,
Kw
aZul
u-N
atal
26.0
0°S
, 32
.92°
ED
M 6
291
716
13H
M80
2912
HM
6316
47M
. con
dylu
rus
RS
A:
Phi
nda
Gam
e R
eser
ve,
27.8
6°S
, 32
.31°
ED
M 6
332
716
13H
M80
2913
HM
6316
48K
waZ
ulu-
Nat
alM
. leu
cost
igm
aM
adag
asca
r: M
ahaj
anga
, 15
.71°
S,
46.3
1°E
FM
NH
184
698
817
14H
M80
2914
HM
6316
49M
ahaj
anga
Pro
vinc
eM
. leu
cost
igm
aM
adag
asca
r: A
mpi
tabe
, 19
.00°
S,
48.5
3°E
FM
NH
188
009
817
14H
Q 3
8448
4H
Q 3
8448
9To
amas
ina
Pro
vinc
eM
. mid
asM
adag
asca
r: S
akar
aha,
Tol
iara
22
.91°
S,
44.5
3°E
FM
NH
184
306
918
15H
M80
2915
HM
6316
50P
rovi
nce
M. m
idas
Mad
agas
car:
Ank
azom
boro
na,
16.1
2°S
, 46
.07°
EF
MN
H 1
8518
79
1915
HM
8029
16H
M63
1652
Mah
ajan
ga P
rovi
nce
Mor
mop
teru
s L
a R
éuni
on:
Sai
nt C
loti
lde
20.9
2°S
, 55
.48°
EF
MN
H 1
9401
510
2016
HM
8029
17H
M63
1653
fran
cois
mou
toui
M. f
ranc
oism
outo
uiL
a R
éuni
on:
Sai
nt C
loti
lde
20.9
2°S
, 55
.48°
EF
MN
H 1
9401
610
2016
HM
8029
18H
M63
1654
M. j
ugul
aris
Mad
agas
car:
Sak
arah
a,
22.9
2°S
, 44
.53°
EF
MN
H 1
8434
711
2217
HM
8029
19H
M63
1655
Toli
ara
Pro
vinc
eM
. jug
ular
isM
adag
asca
r: A
ndas
ibe,
18.9
0°S
, 48
.42°
EF
MN
H 1
8457
611
2318
HM
8029
20H
M63
1656
Toam
asin
a P
rovi
nce
M. j
ugul
aris
Mad
agas
car:
Fia
nara
ntso
a,
21.4
6°S
, 46
.08°
EF
MN
H 1
8444
512
2419
HM
8029
21H
M63
1657
Fia
nara
ntso
a P
rovi
nce
Oto
mop
s M
adag
asca
r: B
isih
iko
Cav
e,23
.54°
S,
43.7
7°E
FM
NH
172
944
1325
21H
M80
2922
HM
6316
58m
adag
asca
rien
sis
Toli
ara
Pro
vinc
eO
. mad
agas
cari
ensi
sM
adag
asca
r: I
salo
Nat
iona
l P
ark,
22
.54°
S,
45.3
8°E
UA
DB
A S
MG
109
9613
2622
HQ
384
485
HQ
384
490
Fia
nara
ntso
a P
rovi
nce
O. m
artie
nsse
niR
SA
: B
rynd
eryn
Fla
ts, M
orni
ngsi
de,
29.8
6°S
, 31
.04°
ED
M 7
909
1427
23H
M80
2923
HM
6316
59K
waZ
ulu-
Nat
alO
. mar
tiens
seni
RS
A:
Kin
gsw
ay S
choo
l, A
man
zim
toti
, 30
.04°
S,
30.8
9°E
DM
7914
1428
24H
M80
2924
HM
6316
60K
waZ
ulu-
Nat
alO
. mar
tiens
seni
Ivor
y C
oast
:C
omoe
Nat
iona
l P
ark
8.73
°S,
3.38
°ES
MF
920
4914
2925
HM
8029
25H
M63
1661
O. m
artie
nsse
niK
enya
: It
hund
u C
aves
,2.
36°S
, 37
.72°
EN
MK
154
6114
3026
HM
8029
27H
M63
1663
Mak
uena
Dis
tric
tO
. mar
tiens
seni
Ken
ya:
Ithu
ndu
Cav
es,
2.36
°S,
37.7
2°E
NM
K 1
5462
1431
26H
M80
2926
HM
6316
62M
akue
na D
istr
ict
O. w
roug
hton
iC
ambo
dia:
Chh
ep D
istr
ict,
13.5
9°S
, 10
5.16
°EH
ZM
3.3
3440
27H
M80
2928
Pre
ah V
ihea
r P
rovi
nce
O. c
f.fo
rmos
usP
hili
ppin
es:
Kal
inga
Pro
vinc
e,17
.46°
S,
121.
07°E
FM
NH
672
4028
HM
8029
29L
uzon
Isl
and
Saur
omys
pet
roph
ilus
RS
A:
Ced
arbe
rg32
.14’
S
19.0
0’E
DM
861
321
29H
M80
2931
HM
6316
64
Rag
2 R
ag2
Cyt
b G
enB
ank
#S
peci
esG
eogr
aphi
c or
igin
Co-
ordi
nate
sM
useu
m n
o./
+cy
tbF
ield
no.
Hap
Hap
Hap
Cyt
bR
ag2
Tre
e1T
ree2
Tre
e 3
AP
PE
ND
IX. C
onti
nued

16 J. M. Lamb, T. M. C. Ralph, T. Naidoo, P. J. Taylor, F. Ratrimomanarivo, et al.
Rag
2 R
ag2
Cyt
b G
enB
ank
#S
peci
esG
eogr
aphi
c or
igin
Co-
ordi
nate
sM
useu
m n
o./
+cy
tbF
ield
no.
Hap
Hap
Hap
Cyt
bR
ag2
Tre
e1T
ree2
Tre
e 3
Tada
rida
aeg
yptia
caM
ozam
biqu
e:40
km
wes
t of
Rib
aue
NA
DM
861
720
32H
M80
2930
HM
6316
68T.
fulm
inan
sM
ozam
biqu
e:40
km
wes
t of
Rib
aue
NA
DM
861
922
35H
Q 3
8448
6H
M63
1667
Cha
erep
hon
anso
rgei
NA
NA
NA
8A
Y37
7967
C. c
hapi
niN
AN
AN
A9
AY
5913
29C
. job
ensi
sN
AN
AN
A11
AY
5913
31C
. nig
eria
eN
AN
AN
A10
AY
5913
30Eu
mop
s gl
auci
nus
NA
NA
NA
37L
1971
9.1
E. p
erot
isN
AN
AN
A36
L19
720.
1M
olos
sus
mol
ossu
sN
AN
AN
A17
38L
1972
4.1
AY
1410
17M
orm
opte
rus
kalin
owsk
iiN
AN
AN
A20
L19
725.
1M
yotis
dau
bent
oni
NA
NA
NA
1842
AB
1065
89.1
AF
2037
64.1
Nat
alus
str
amin
eus
NA
NA
NA
1933
43A
Y62
1019
.1A
Y14
1024
.1N
yctin
omop
s au
risp
inos
isN
AN
AN
A40
L19
728
N. l
atic
auda
tus
NA
NA
NA
39L
1972
9N
. mac
rotis
NA
NA
NA
16A
Y14
1018
.1Pr
omop
s ce
ntra
lisN
AN
AN
A41
L19
732.
1T.
bra
silie
nsis
NA
NA
NA
15L
1973
4.1
AY
1410
19.1
T. fu
lmin
ans
NA
NA
NA
35E
U76
0911
.1T
BI
T. te
niot
isN
AN
AN
A33
DQ
1209
10.1
Mor
moo
ps b
lain
ville
iN
AN
AN
A32
AY
6044
62.1
AF
3387
01
AP
PE
ND
IX. C
onti
nued
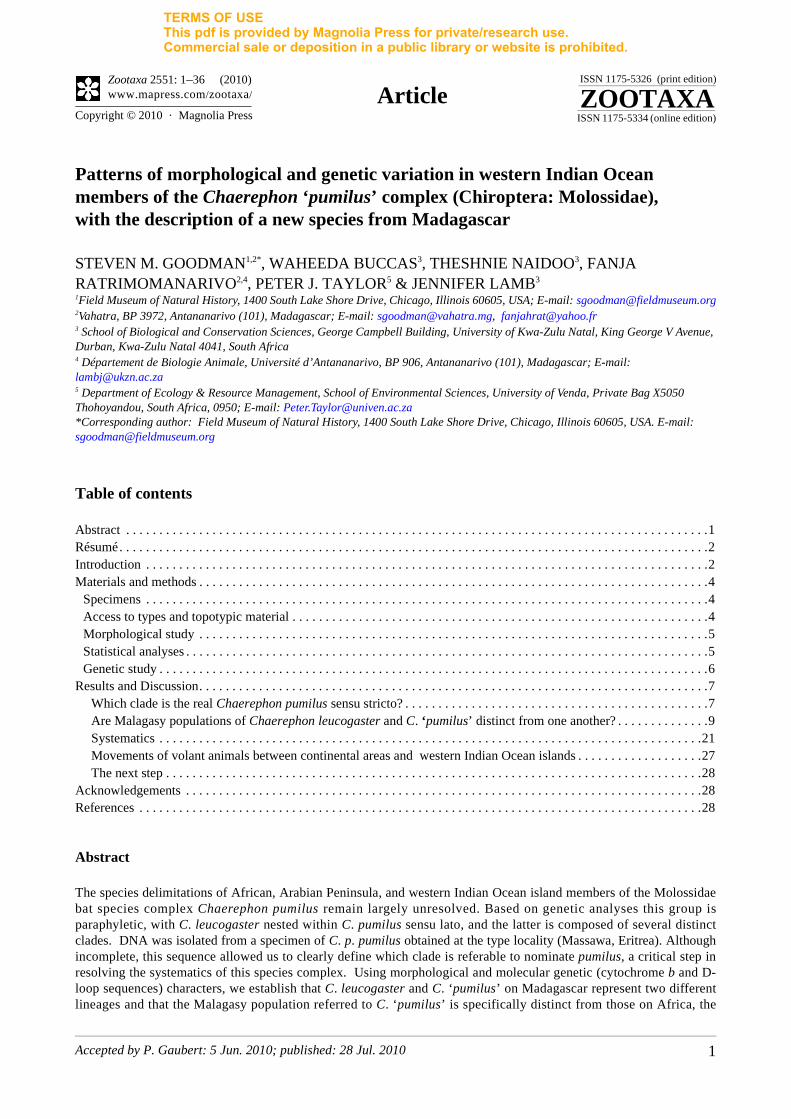
Accepted by P. Gaubert: 5 Jun. 2010; published: 28 Jul. 2010 1
ZOOTAXAISSN 1175-5326 (print edition)
ISSN 1175-5334 (online edition)Copyright © 2010 · Magnolia Press
Zootaxa 2551: 1–36 (2010) www.mapress.com/zootaxa/ Article
Patterns of morphological and genetic variation in western Indian Ocean members of the Chaerephon ‘pumilus’ complex (Chiroptera: Molossidae), with the description of a new species from Madagascar
STEVEN M. GOODMAN1,2*, WAHEEDA BUCCAS3, THESHNIE NAIDOO3, FANJA RATRIMOMANARIVO2,4, PETER J. TAYLOR5 & JENNIFER LAMB3
1Field Museum of Natural History, 1400 South Lake Shore Drive, Chicago, Illinois 60605, USA; E-mail: [email protected], BP 3972, Antananarivo (101), Madagascar; E-mail: [email protected], [email protected] School of Biological and Conservation Sciences, George Campbell Building, University of Kwa-Zulu Natal, King George V Avenue, Durban, Kwa-Zulu Natal 4041, South Africa 4 Département de Biologie Animale, Université d’Antananarivo, BP 906, Antananarivo (101), Madagascar; E-mail: [email protected] Department of Ecology & Resource Management, School of Environmental Sciences, University of Venda, Private Bag X5050 Thohoyandou, South Africa, 0950; E-mail: [email protected]*Corresponding author: Field Museum of Natural History, 1400 South Lake Shore Drive, Chicago, Illinois 60605, USA. E-mail: [email protected]
Table of contents
Abstract . . . . . . . . . . . . . . . . . . . . . . . . . . . . . . . . . . . . . . . . . . . . . . . . . . . . . . . . . . . . . . . . . . . . . . . . . . . . . . . . . . . . . . . .1Résumé. . . . . . . . . . . . . . . . . . . . . . . . . . . . . . . . . . . . . . . . . . . . . . . . . . . . . . . . . . . . . . . . . . . . . . . . . . . . . . . . . . . . . . . . .2Introduction . . . . . . . . . . . . . . . . . . . . . . . . . . . . . . . . . . . . . . . . . . . . . . . . . . . . . . . . . . . . . . . . . . . . . . . . . . . . . . . . . . . . .2Materials and methods . . . . . . . . . . . . . . . . . . . . . . . . . . . . . . . . . . . . . . . . . . . . . . . . . . . . . . . . . . . . . . . . . . . . . . . . . . . . .4
Specimens . . . . . . . . . . . . . . . . . . . . . . . . . . . . . . . . . . . . . . . . . . . . . . . . . . . . . . . . . . . . . . . . . . . . . . . . . . . . . . . . . . . . .4Access to types and topotypic material . . . . . . . . . . . . . . . . . . . . . . . . . . . . . . . . . . . . . . . . . . . . . . . . . . . . . . . . . . . . . . .4Morphological study . . . . . . . . . . . . . . . . . . . . . . . . . . . . . . . . . . . . . . . . . . . . . . . . . . . . . . . . . . . . . . . . . . . . . . . . . . . . .5Statistical analyses . . . . . . . . . . . . . . . . . . . . . . . . . . . . . . . . . . . . . . . . . . . . . . . . . . . . . . . . . . . . . . . . . . . . . . . . . . . . . . .5Genetic study . . . . . . . . . . . . . . . . . . . . . . . . . . . . . . . . . . . . . . . . . . . . . . . . . . . . . . . . . . . . . . . . . . . . . . . . . . . . . . . . . . .6
Results and Discussion. . . . . . . . . . . . . . . . . . . . . . . . . . . . . . . . . . . . . . . . . . . . . . . . . . . . . . . . . . . . . . . . . . . . . . . . . . . . .7Which clade is the real Chaerephon pumilus sensu stricto? . . . . . . . . . . . . . . . . . . . . . . . . . . . . . . . . . . . . . . . . . . . . . .7Are Malagasy populations of Chaerephon leucogaster and C. ‘pumilus’ distinct from one another? . . . . . . . . . . . . . .9Systematics . . . . . . . . . . . . . . . . . . . . . . . . . . . . . . . . . . . . . . . . . . . . . . . . . . . . . . . . . . . . . . . . . . . . . . . . . . . . . . . . . .21Movements of volant animals between continental areas and western Indian Ocean islands . . . . . . . . . . . . . . . . . . .27The next step . . . . . . . . . . . . . . . . . . . . . . . . . . . . . . . . . . . . . . . . . . . . . . . . . . . . . . . . . . . . . . . . . . . . . . . . . . . . . . . . .28
Acknowledgements . . . . . . . . . . . . . . . . . . . . . . . . . . . . . . . . . . . . . . . . . . . . . . . . . . . . . . . . . . . . . . . . . . . . . . . . . . . . . .28References . . . . . . . . . . . . . . . . . . . . . . . . . . . . . . . . . . . . . . . . . . . . . . . . . . . . . . . . . . . . . . . . . . . . . . . . . . . . . . . . . . . . .28
Abstract
The species delimitations of African, Arabian Peninsula, and western Indian Ocean island members of the Molossidaebat species complex Chaerephon pumilus remain largely unresolved. Based on genetic analyses this group isparaphyletic, with C. leucogaster nested within C. pumilus sensu lato, and the latter is composed of several distinctclades. DNA was isolated from a specimen of C. p. pumilus obtained at the type locality (Massawa, Eritrea). Althoughincomplete, this sequence allowed us to clearly define which clade is referable to nominate pumilus, a critical step inresolving the systematics of this species complex. Using morphological and molecular genetic (cytochrome b and D-loop sequences) characters, we establish that C. leucogaster and C. ‘pumilus’ on Madagascar represent two differentlineages and that the Malagasy population referred to C. ‘pumilus’ is specifically distinct from those on Africa, the
TERMS OF USEThis pdf is provided by Magnolia Press for private/research use. Commercial sale or deposition in a public library or website is prohibited.
GOODMAN ET AL.2 · Zootaxa 2551 © 2010 Magnolia Press
Arabian Peninsula, the Comoros Archipelago, and the western Seychelles (Aldabra). The Madagascar population is heredescribed as a new species, Chaerephon atsinanana sp. nov. This taxon is common in the eastern portion ofMadagascar, particularly in synanthropic settings, across an elevational range from near sea level to 1100 m, and thereare no immediate conservation concerns. Members of the C. pumilus species complex from the western Seychelles arereferable to C. pusillus, to which populations from the Comoros (Mayotte, Anjouan, Mohéli, and Grande Comore) arealso assigned.
Résumé
Les délimitations du complexe d’espèces Chaerephon pumilus, membre des chauves-souris Molossidae de l’Afrique, dela Péninsule Arabique et de l’Océan Indien occidental, sont largement non résolues. D’après les données génétiques, cegroupe est paraphylétique, avec C. leucogaster inclus dans C. pumilus sensu lato, ce dernier taxon étant composé deplusieurs clades distincts. L'ADN a été isolé à partir d'un spécimen de C. p. pumilus obtenu dans la localité type(Massawa, en Erythrée). Bien qu’incomplète, la séquence obtenue nous a permis de définir clairement le clade deréférence pour la nomination de pumilus, une étape cruciale dans la résolution de la systématique de ce complexed’espèces. L’utilisation des caractères morphologiques et moléculaire (séquences de cytochrome b et de D-loop) nous apermis d’établir que C. leucogaster et C. ‘pumilus’ à Madagascar correspondent à deux lignées différentes et que lapopulation malgache désignée comme C. ‘pumilus’ est spécifiquement distincte de celles de l'Afrique, de la péninsulearabique, de l'Archipel des Comores et des Seychelles occidentales (Aldabra). Nous nommons cette nouvelle espèce,Chaerephon atsinanana sp. nov. Cette dernière est commune dans la partie orientale de Madagascar, en particuliercomme espèce synanthropique, et présente une distribution altitudinale allant du niveau de la mer jusqu’à 1100 md’altitude. A l’heure actuelle, l’espèce ne semble pas nécessiter une attention particulière en termes de conservation. Lesmembres du complexe C. pumilus des Seychelles occidentales sont désignés sous le nom de C. pusillus, ainsi que lespopulations des Comores (Mayotte, Anjouan, Mohéli et Grande Comore).
Key words: taxonomy, morphology, molecular genetics, Chaerephon, Madagascar, Africa, Comoros, Aldabra
Introduction
As currently configured, the small Molossidae bat, Chaerephon pumilus (Cretzschmar 1830-1831), has abroad distribution across much of sub-Saharan Africa and on offshore islands of both the Atlantic and IndianOcean coasts of this continent, East to the Arabian Peninsula, and on islands in the western Indian Ocean(Bouchard 1998; Harrison & Bates 1991; Simmons 2005). The nominate form was described based onspecimens collected at Massawa, Eritrea. On the Arabian Peninsula, this taxon appears limited to Yemen,specifically the portion directly across the Red Sea from Eritrea (Harrison & Bates 1991). Animals currentlyassigned to C. pumilus sensu lato show considerable phenotypic variation with bat taxonomists recognizing12 different forms (Koopman 1994). In contrast, given the considerable levels of dichromatism in certainpopulations, particularly associated with wing and pelage coloration, it has been suggested that “attempts atsubspecific separation based mainly on colour are profitless” (Hayman & Hill 1971, p. 64).
Seven forms of C. pumilus sensu lato have been named from the eastern and southern portions of theAfrican continent and western Indian Ocean islands: limbata Peters 1852 (type locality: Mozambique Island,Mozambique, but see Turni & Kock 2008); naivashae Hollister 1916 (type locality: Naivasha Station,Kenya); hindei (Thomas 1904) (type locality: Fort Hall, Kenya); elphicki Roberts 1926 (type locality:southeastern Transvaal, South Africa); langi Roberts 1932 (type locality: northern Botswana); leucogaster(Grandidier 1869) (type locality: Menabe Region, western Madagascar, neotype locality: Belo sur Mer[Ratrimomanarivo et al. 2009a]); and pusillus (Miller 1902) (type locality: Aldabra Island, westernSeychelles). On the basis of phenetic analyses associated with skull morphology, Peterson et al. (1995)proposed to elevate three forms (hindei, limbata, and naivashae) to full species. While this suggestion mayindeed be valid, the lack of a phylogenetic context and diagnoses to separate these forms renders theirtaxonomic conclusion difficult to interpret in light of other potential factors to explain the patterns ofmorphological variation in this species complex (e.g., Ratrimomanarivo et al. 2008). Given apparent highlevels of morphological polymorphism in C. pumilus sensu lato, overlaid on clinal and geographic variation, ithas been rather problematic to sort out the systematics of this putative species complex.
TERMS OF USEThis pdf is provided by Magnolia Press for private/research use. Commercial sale or deposition in a public library or website is prohibited.
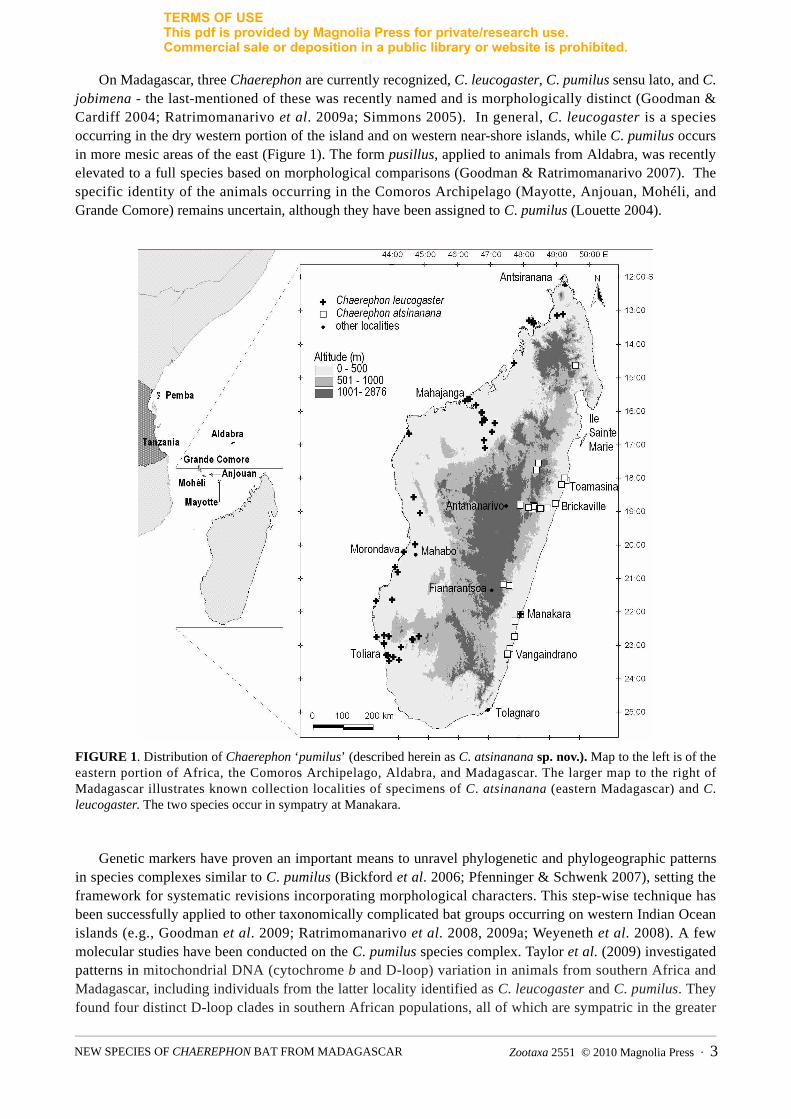
Zootaxa 2551 © 2010 Magnolia Press · 3NEW SPECIES OF CHAEREPHON BAT FROM MADAGASCAR
On Madagascar, three Chaerephon are currently recognized, C. leucogaster, C. pumilus sensu lato, and C.jobimena - the last-mentioned of these was recently named and is morphologically distinct (Goodman &Cardiff 2004; Ratrimomanarivo et al. 2009a; Simmons 2005). In general, C. leucogaster is a speciesoccurring in the dry western portion of the island and on western near-shore islands, while C. pumilus occursin more mesic areas of the east (Figure 1). The form pusillus, applied to animals from Aldabra, was recentlyelevated to a full species based on morphological comparisons (Goodman & Ratrimomanarivo 2007). Thespecific identity of the animals occurring in the Comoros Archipelago (Mayotte, Anjouan, Mohéli, andGrande Comore) remains uncertain, although they have been assigned to C. pumilus (Louette 2004).
FIGURE 1. Distribution of Chaerephon ‘pumilus’ (described herein as C. atsinanana sp. nov.). Map to the left is of theeastern portion of Africa, the Comoros Archipelago, Aldabra, and Madagascar. The larger map to the right ofMadagascar illustrates known collection localities of specimens of C. atsinanana (eastern Madagascar) and C.leucogaster. The two species occur in sympatry at Manakara.
Genetic markers have proven an important means to unravel phylogenetic and phylogeographic patternsin species complexes similar to C. pumilus (Bickford et al. 2006; Pfenninger & Schwenk 2007), setting theframework for systematic revisions incorporating morphological characters. This step-wise technique hasbeen successfully applied to other taxonomically complicated bat groups occurring on western Indian Oceanislands (e.g., Goodman et al. 2009; Ratrimomanarivo et al. 2008, 2009a; Weyeneth et al. 2008). A fewmolecular studies have been conducted on the C. pumilus species complex. Taylor et al. (2009) investigatedpatterns in mitochondrial DNA (cytochrome b and D-loop) variation in animals from southern Africa andMadagascar, including individuals from the latter locality identified as C. leucogaster and C. pumilus. Theyfound four distinct D-loop clades in southern African populations, all of which are sympatric in the greater
TERMS OF USEThis pdf is provided by Magnolia Press for private/research use. Commercial sale or deposition in a public library or website is prohibited.
GOODMAN ET AL.4 · Zootaxa 2551 © 2010 Magnolia Press
Durban area of the KwaZulu-Natal Province, indicating possible incipient speciation or cryptic species. Thisstudy also found C. leucogaster to be nested within C. pumilus sensu lato, and Malagasy C. pumilus forming asister group to a complex of clades of African C. pumilus and Malagasy C. leucogaster. Jacobs et al. (2004)showed that cytochrome b haplotypes from dark-winged southern African (classically assigned to nominatepumilus) and white-winged east and central African forms (classically assigned to the form limbatus) divergedby 0.9%. Further, seemingly fixed differences are known in the echolocation calls of African animals assignedto C. pumilus (Aspetsberger et al. 2003; Fenton et al. 2004; Taylor 1999a), further indicating possibledifferentiation associated with sympatric cryptic species. These studies demonstrate certain levels ofdifferentiation across the range of C. pumilus sensu lato and supports Simmons (2005) prediction that “Thiscomplex probably includes more than one species”.
Our point of departure for resolving the evolutionary history of the C. pumilus species complex is anexplicit phylogeny based on molecular genetic data. With the established clades, we then applymorphological and morphometric data to diagnose and delineate the taxonomy of these animals. In order toresolve fully the evolutionary history of the species complex, various types of data are needed, such assequence information from holotypes, lectotypes or topotypes, karyology, and vocalizations, as well as broadgeographical sampling. Hence, this is a step-wise procedure and herein we commence the first of a series ofsystematic studies to establish: 1) which clade represents the nominate form of pumilus, 2) whether Malagasypopulations of C. leucogaster and C. ‘pumilus’ are specifically distinct from one another, 3) patterns ofmorphological and molecular variation in western Indian Ocean island populations (Madagascar, Comoros,and Aldabra), and 4) the specific status of the Madagascar population, which is described here as a newspecies.
Materials and methods
SpecimensIn a taxonomic revision as presented herein, specimens, particularly those with associated tissues, form
the critical point of comparison for the resolution of phylogenetic and phylogeographic patterns. Recentinventory work in parts of Africa and offshore islands, the Arabian Peninsula, as well as western Indian Oceanislands have provided such critical material. Specimens used in this study are housed in the Durban NaturalScience Museum (DM), Durban; Field Museum of Natural History (FMNH), Chicago; Département deBiologie Animale, Université d’Antananarivo (UADBA), Antananarivo; Muséum national d’Histoirenaturelle (MNHN), Paris; Museum of Comparative Zoology (MCZ), Harvard University, Cambridge; RoyalOntario Museum (ROM), Toronto; Senkenberg Museum Forschunginstitut (SMF), Frankfurt; The NaturalHistory Museum (formerly British Museum (Natural History) [BMNH]), London; The National Museum ofNatural History (formerly United States National Museum [USNM]), Washington, D.C.; and Museum fürNaturkunde, Humboldt Universität zu Berlin (formerly Zoologisches Museum Berlin [ZMB]), Berlin.
Access to types and topotypic materialFrom a taxonomic perspective, the only means to properly address the question of the species limits, in
the Linnaean sense, of the various named forms in the C. pumilus complex occurring in the eastern portion ofAfrica and the western Indian Ocean islands was to measure newly collected animals and compare them totype specimens. This material included the lectotype (SMF 4311) and associated type series (SMF 11917,11918, 12372, 12377) of nominate pumilus from Massawa [other spellings include Massaua and Mitsiwa],Eritrea, collected by E. Rüppell and published by Cretzschmar (1830–1831). The lectotype is a mountedspecimen that Mertens (1925) noted as having the skull unextracted; subsequently, the skull was removed andcleaned. The occipital portion of the cranium is missing, but otherwise the specimen is in relatively goodcondition. Further, we examined the syntypes of limbatus (ZMB 537, 538) as designated by Turni and Kock(2008). Finally, a key aspect to resolve which of the multiple clades within this pumilus species complex isreferable to the nominate form, was to extract DNA from an individual (USNM 38032) collected at the typelocality (see section “DNA isolation, PCR and sequencing of the nearly 120 year old sample from Massawa,
TERMS OF USEThis pdf is provided by Magnolia Press for private/research use. Commercial sale or deposition in a public library or website is prohibited.
Zootaxa 2551 © 2010 Magnolia Press · 5NEW SPECIES OF CHAEREPHON BAT FROM MADAGASCAR
Eritrea”). USNM 38032 was also directly compared to the types of nominate pumilus and limbatus in the SMFand ZMB, respectively.
Morphological studyThree different types of measurements were recorded from adult specimens of the C. pumilus complex (C.
pumilus sensu lato—eastern Madagascar (n=231), Aldabra (n=9), Comoros (n=63), Kenya (n=61), SouthAfrica (n=18), and C. leucogaster – Madagascar (n=129)): external, cranial, and dental. Only adults were usedin the analyses presented herein and these were defined as having fused basisphenoid-basioccipital sutures, aswell as fully erupted adult dentitions. Given that members of this genus regularly show sexual dimorphism incranio-dental measurements, but not necessarily external measurements (Bouchard 1998; Peterson et al. 2005;Ratrimomanarivo et al. 2009a), conclusions supported by many of the variables measured herein, we haveseparated adult males and females in our descriptive and statistical comparisons. In morphometriccomparisons of Malagasy C. leucogaster, which show some clinal variation, we have used specimens from thecentral western portion of Madagascar, which is the terre typica of this animal (OTU 3 of Ratrimomanarivo etal. 2009a).
Five different external measurements were taken by FHR and SMG in a similar fashion for the recentMalagasy and Comoros collections using a millimeter ruler to a precision of 0.5 mm: total length, tail length,hindfoot length (excluding claw), ear length, and forearm length. Body mass in grams was also recorded witha Pesola spring balance at an accuracy of 0.5 g. Associated with potential differences in measurementtechnique, a certain level of caution is needed in comparisons of external measurements made by these twofield workers and those data gleaned from museum specimens.
Ten cranial and eight dental measurements, largely following Freeman (1981), were made by FHR andSMG using digital calipers accurate to 0.1 mm (acronym for each measurement presented in parenthesesusing Freeman’s system). Several comparisons were made to verify that these two researchers measuredspecimens in the same fashion and that differences in measurements of the same individuals were less than1% different. Measurements included in our analyses are: CRANIAL MEASUREMENTS: greatest skulllength (GSL), from posterior-most part of occipital to anterior-most point of premaxillary bone;condyloincisive length (CON INCI), from occipital condyle to anterior-most point of incisors; greatestzygomatic breadth (ZYGO BR), width taken across zygomatic arches at the widest point; postorbital width(POST ORB), dorsal width at most constricted part of skull; breadth at mastoids (MASTOID), greatestbreadth across skull at mastoid processes; palatal length (PALATE), from posterior border of hard palate toanterior edge of premaxillary bone; lacrimal width (LACR WID), width across rostrum dorsally at lacrimalprotuberances; condylocanine length (CON CANI), from midpoint of mandibular condyle to anterior borderof alveolus of lower canine; temporal moment arm (MOM1 COR), length from middle of mandibular condyleto tip of coronoid process; masseter moment arm (MOM2 ANG), length from middle of mandibular condyleto tip of angular process; and DENTAL MEASUREMENTS: anterior palatal width (C1-C1), taken across theouter alveolar borders of the upper canines; posterior palatal width (M3-M3), taken across the outer alveolarborders of the third upper molars; upper molariform row (UP MOLR), length from PM4 to M3 (alveolar);maxillary toothrow (MTR), length from anterior alveolar border of canine to posterior alveolar border of M3;height upper canine (UP CANIN), greatest length from point immediately dorsal to cingulum to end of tooth;width of M3 (M3 WIDTH), greatest lateral-medial width of tooth; and lower toothrow (LOWER TR), lengthfrom posterior alveolar border of m3 to alveolar border of c1. Finally, details were recorded for each specimenon the degree of anterior palate emargination using the classification of Freeman (1981, variable C65).Terminology for cranial and dental characters follows Bates and Harrison (1997), Csorba et al. (2003), andDebaeremaeker and Fenton (2003).
Statistical analysesTo evaluate patterns of morphological variation in members of the C. pumilus complex the statistical
package STATISTICA AX version 7.0 was used for all univariate and multivariate analyses. Cranial anddental measurements were analyzed separately following the conclusions of Ranivo and Goodman (2007) that
TERMS OF USEThis pdf is provided by Magnolia Press for private/research use. Commercial sale or deposition in a public library or website is prohibited.
GOODMAN ET AL.6 · Zootaxa 2551 © 2010 Magnolia Press
these two types of variables do not necessarily co-vary. T-tests were used to examine patterns of sexualdimorphism in regional populations, which in general showed differences for cranial and dental variables.Principal Component Analysis (PCA), using log-transformed data, was utilized to distinguish the differentpopulations in three-dimensional space.
Genetic studyOur objectives with the genetic analyses were 1) to identify which clade represents nominate pumilus; 2)
to determine if C. leucogaster can be differentiated from C. ‘pumilus’ on Madagascar and other populations inthe western Indian Ocean region; and 3) to evaluate the relationships of the different populations of the C.‘pumilus’ species on other western Indian Ocean islands (Comoros Archipelago and Aldabra).
Genetic variation in Chaerephon spp. was investigated using mitochondrial cytochrome b (n=89) and D-loop (n=92) sequencing (Appendix 1). Samples of Chaerephon were obtained from numerous localities ineastern and western Madagascar and other western Indian Ocean islands, including, Pemba, Zanzibar,Aldabra, Anjouan, Grande Comore, Mayotte, and Mohéli. Chaerephon specimens from Massawa (Eritrea),Yemen, and mainland Tanzania were used for comparative purposes. Samples used as outgroups includedMops leucostigma G. M. Allen, 1918, M. midas (Sundevall, 1843), and Otomops martinesseni (Matschie,1897). A short sequence of C. chapini (GenBank acc. numb. AY591329.1) was used as an outgroup for asecond analysis including the type specimen of C. pumilus and based on 206 nucleotides of the mitochondrialcytochrome b gene.
DNA isolation, PCR, and sequencingThe following protocols were used on all samples with the exception of the century-old individual
(USNM 38032), from Massawa. Total genomic DNA was extracted from tissues, preserved in 80% ethanol orEDTA, using DNeasy® DNA isolation kit (Qiagen, Cape Town). The cytochrome b gene was amplified astwo overlapping fragments with primers pairs L 14723 - H 15553 and L15146 - H15915 (Irwin et al. 1991).
Polymerase Chain Reaction (PCR)-amplifications were performed in 25 μl reaction volumes eachconsisting of 9 μl genomic DNA solution (containing 30 ng DNA), 0.8 μl sterile water, 2.5 μl 10 X reactionbuffer (Super-Therm), 4 μl MgCl2 (25 mM) (Super-Therm), 0.5 μl dNTP mix (10 mM) (Roche Diagnostics),0.2 μl Taq polymerase (5 U/μl) (Super-Therm) and 4 μl each of forward and reverse primer (6 μM). Thermalcycling parameters consisted of an initial denaturation step at 94°C for 4 min, followed by 36 cycles ofdenaturation at 94°C for 1 min, annealing at 50°C for 1 min 30s, extension at 72°C for 2 min, and a finalextension step at 72°C for 10 min.
The D-loop region was PCR-amplified using the primers pair P - F from Wilkinson and Chapman (1991).Where samples failed to amplify using this primer set, the primers pair P - E was used, F being nested withinE (Wilkinson and Chapman 1991). PCR-amplifications were performed in 25 µl reaction volumes, asdescribed above. Thermal cycling parameters consisted of initial denaturation at 95°C for 1 min, followed by40 cycles of denaturation at 95°C for 1 min, annealing at 55°C for 1 min 30 s, extension 72°C for 2 min, and afinal extension step at 72°C for 7 min.
For both cytochrome b and D-loop amplifications, target fragments were purified from excised gel bandsusing a QIAquick® Gel Extraction Kit (Qiagen Inc.). Purified DNA fragments were sequenced in the forwardand reverse directions on an ABI 3730 capillary sequencer at Inqaba Biotechnical Industries Pty. Ltd.,Hatfield, Pretoria, South Africa.
DNA isolation, PCR and sequencing of the nearly 120 year old sample from Massawa, EritreaSmall muscle scrapings obtained from the skull of a C. pumilus specimen (USNM 38032) collected on 2
May 1890 at the type locality of Massawa, were sent to Lakehead University (Thunder Bay, Ontario, Canada)Paleo-DNA Laboratory Genetic Testing Service for cytochrome b sequencing. A standard proteinase Kextraction, containing 1X TNE Buffer, 20% SDS, 0.39M DTT and Proteinase K was carried out on thesetissue fragments. This was followed by silica bead purification. Additional size exclusion column purificationwas carried out to help remove inhibitors, if present. The above extraction procedure was repeated once. A
TERMS OF USEThis pdf is provided by Magnolia Press for private/research use. Commercial sale or deposition in a public library or website is prohibited.
Zootaxa 2551 © 2010 Magnolia Press · 7NEW SPECIES OF CHAEREPHON BAT FROM MADAGASCAR
standard Platinum Taq DNA Polymerase PCR reaction was carried out using a primer pair designed fromChaerephon cytochrome b sequence alignments and amplifying a fragment of 206 bp (Bat 1F 5’CCTAATAATCCAAATTTTGACAGG 3’ - Bat 1R 5’ CTCCTATTTTTCATGTTTCTG 3’; annealing T°:50°C). The DNA sample was amplified multiple times with both sets of primers. All PCR reaction productswere separated by electrophoresis in 6% polyacrylamide gels, which were stained with ethidium bromide forvisualization of PCR product. The single PCR product was sequenced as detailed above.
Sequence analysesElectropherograms of the sequences generated were inspected with Chromas software (version 1.45;
Technelysium Pty. Ltd., Helensvale, Queensland, Australia). Sequence alignments were generated underBioEdit version 7 (Hall 1999) and its accessory CLUSTAL W alignment application (Thompson et al. 1994),and corrected manually by visual inspection for alignment errors.
Two cytochrome b alignments were created. One of these, trimmed to a common length of 206nucleotides, determined by the length of sequence which was obtained from the Massawa specimen, was usedto show the relationships of major clades within the Chaerephon pumilus complex in order to determinewhich clade represents nominate pumilus. A second cytochrome b alignment, which included all samplesexcluding the Massawa sample, was trimmed to a common length of 1031 nucleotides. For this sample series,a D-loop alignment of 337 nucleotides was also built.
Haplotype analysis of all datasets was carried out using the program DnaSP 4.10 (Rozas et al. 2003).Modeltest (Posada & Crandall 1998) was used to select the model of nucleotide substitution which best fitseach sequence dataset. The HKY+I model was selected using the AIC information criterion for bothcytochrome b datasets (206 and 1031 nucleotides) and for the D-loop dataset.
Bayesian analysis was implemented in Mr Bayes 3.0 (Hulsenbeck & Ronquist 2001) using flat priors. Forall analyses, four Markov chains were run for 15 million generations each, and the first 500,000 treesdiscarded as burn-in.
PAUP* 4.0b10 (Swofford 2002) was used to estimate nucleotide divergence and generate neighbor-joining and maximum parsimony trees. For parsimony analysis, we used the random additions sequenceoption (n=100) for discrete, unordered characters. The shortest tree was obtained using the heuristic searchoption under tree bisection-reconnection (TBR) branch swapping option. The degree of support for each nodeof the resulting tree was estimated using bootstrap re-sampling analysis (1000 pseudoreplicates; Felsenstein1985).
Results and Discussion
Which clade is the real Chaerephon pumilus sensu stricto?Bayesian, maximum parsimony (MP), and neighbor-joining (NJ) analyses based on 206 nucleotides of the
mitochondrial cytochrome b gene (Figure 2) provide strong support (posterior probability (pp.) 1.00,bootstrap 100% (MP and NJ) for the monophyly of the major Chaerephon clades that form the subject of thisstudy. Chaerephon chapini is sister to the other Chaerephon taxa, which form a moderately well-supportedgroup in MP (91%) and NJ (94%) analyses, but not in Bayesian analyses (pp. 0.85). Although this firstanalysis was limited to 206 nucleotides of the cytochrome b gene, we were able to establish the distinctness ofC. pumilus from Massawa, and its sister-relationship with C. pumilus from Yemen (node well supported inMP (83%) and NJ (90%) analyses). The comments below are based on a more complete cytochrome bsequence alignment (1031 nucleotide) and a 332-nucleotides control region alignment (for a detaileddiscussion, see the section below entitled ‘Molecular genetics’).
Chaerephon pumilus from Yemen (Clade A; established above as sister to C. pumilus sensu stricto fromMassawa), is sister to three major clades (B, C2a, and C2b) of Chaerephon from the western Indian Oceanregion. Clades B (from eastern Madagascar) and C2a (from the Comoros and Aldabra) are stronglysupported, whilst clade C2b is moderately supported. Clade A is separated from Clades B (2.98%), C2a
TERMS OF USEThis pdf is provided by Magnolia Press for private/research use. Commercial sale or deposition in a public library or website is prohibited.
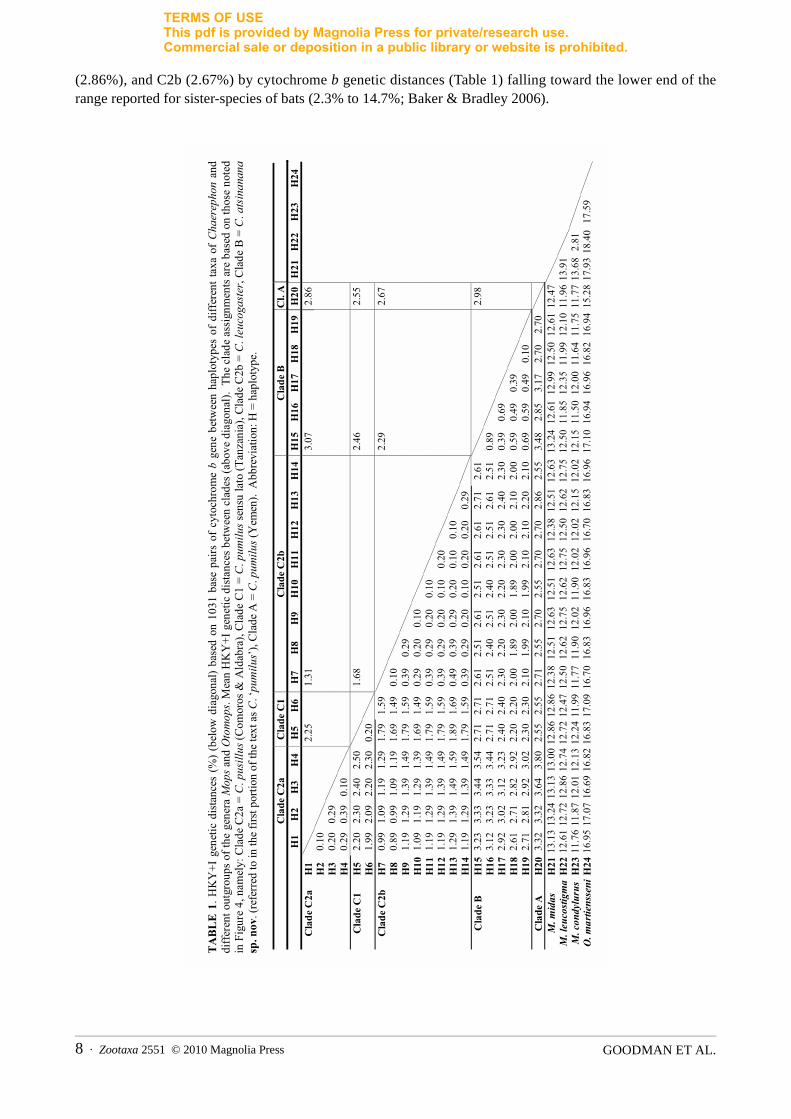
GOODMAN ET AL.8 · Zootaxa 2551 © 2010 Magnolia Press
(2.86%), and C2b (2.67%) by cytochrome b genetic distances (Table 1) falling toward the lower end of therange reported for sister-species of bats (2.3% to 14.7%; Baker & Bradley 2006).
TA
BL
E 1.
HK
Y+I
gen
etic
dis
tanc
es (
%)
(bel
ow d
iago
nal)
base
d on
103
1 ba
se p
airs
of
cyto
chro
me
bge
ne b
etw
een
hapl
otyp
es o
f di
ffer
ent t
axa
of C
haer
epho
n an
d di
ffer
ent o
utgr
oups
of t
he g
ener
a M
ops a
nd O
tom
ops.
Mea
n H
KY
+I g
enet
ic d
ista
nces
bet
wee
n cl
ades
(abo
ve d
iago
nal).
The
cla
de a
ssig
nmen
ts a
re b
ased
on
thos
e no
ted
in F
igur
e 4,
nam
ely:
Cla
de C
2a =
C. p
usill
us (C
omor
os &
Ald
abra
), C
lade
C1
= C
. pum
ilus s
ensu
lato
(Tan
zani
a), C
lade
C2b
= C
. leu
coga
ster
, Cla
de B
= C
.ats
inan
ana
sp. n
ov. (
refe
rred
to in
the
first
por
tion
of th
e te
xt a
s C. ‘
pum
ilus’
), C
lade
A =
C. p
umilu
s (Y
emen
). A
bbre
viat
ion:
H =
hap
loty
pe.
Cla
de C
2a
Cla
de C
1C
lade
C2b
C
lade
B
Cl.
A
H
1H
2H
3H
4H
5H
6H
7H
8H
9H
10H
11H
12H
13H
14H
15H
16H
17H
18H
19H
20H
21H
22H
23H
24C
lade
C2a
H
1
2.
25
1.31
3.
07
2.
86
H2
0.10
H
30.
200.
29
H
40.
290.
390.
10
Cla
de C
1 H
52.
202.
302.
402.
50
1.
68
2.
46
2.
55
H6
1.99
2.09
2.20
2.30
0.20
Cla
de C
2b
H7
0.99
1.09
1.19
1.29
1.79
1.59
2.29
2.67
H
80.
890.
991.
091.
191.
691.
490.
10
H9
1.19
1.29
1.39
1.49
1.79
1.59
0.39
0.29
H
101.
091.
191.
291.
391.
691.
490.
290.
200.
10
H11
1.19
1.29
1.39
1.49
1.79
1.59
0.39
0.29
0.20
0.10
H12
1.19
1.29
1.39
1.49
1.79
1.59
0.39
0.29
0.20
0.10
0.20
H
131.
291.
391.
491.
591.
891.
690.
490.
390.
290.
200.
100.
10
H
141.
191.
291.
391.
491.
791.
590.
390.
290.
200.
100.
200.
200.
29
Cla
de B
H
153.
233.
333.
443.
542.
712.
712.
612.
512.
612.
512.
612.
612.
712.
61
2.98
H
163.
123.
233.
333.
442.
712.
712.
512.
402.
512.
402.
512.
512.
612.
510.
89
H
172.
923.
023.
123.
232.
402.
402.
302.
202.
302.
202.
302.
302.
402.
300.
390.
69
H18
2.61
2.71
2.82
2.92
2.20
2.20
2.00
1.89
2.00
1.89
2.00
2.00
2.10
2.00
0.59
0.49
0.39
H19
2.71
2.81
2.92
3.02
2.30
2.30
2.10
1.99
2.10
1.99
2.10
2.10
2.20
2.10
0.69
0.59
0.49
0.10
Cla
de A
H
203.
323.
323.
643.
802.
552.
552.
712.
552.
702.
552.
702.
702.
862.
553.
482.
853.
172.
702.
70
M
. mid
as
H21
13.1
313
.24
13.1
313
.00
12.8
612
.86
12.3
812
.51
12.6
312
.51
12.6
312
.38
12.5
112
.63
13.2
412
.61
12.9
912
.50
12.6
112
.47
M. l
euco
stigm
aH
2212
.61
12.7
212
.86
12.7
412
.72
12.4
712
.50
12.6
212
.75
12.6
212
.75
12.5
012
.62
12.7
512
.50
11.8
512
.35
11.9
912
.10
11.9
613
.91
M
. con
dylu
rus
H23
11.7
611
.87
12.0
112
.13
12.2
411
.99
11.7
711
.90
12.0
211
.90
12.0
212
.02
12.1
512
.02
12.1
511
.50
12.0
011
.64
11.7
511
.77
13.6
82.
81
O
. mar
tiens
seni
H24
16.9
517
.07
16.6
916
.82
16.8
317
.09
16.7
016
.83
16.9
616
.83
16.9
616
.70
16.8
316
.96
17.1
016
.94
16.9
616
.82
16.9
415
.28
17.9
318
.40
17.5
90.
o00
TERMS OF USEThis pdf is provided by Magnolia Press for private/research use. Commercial sale or deposition in a public library or website is prohibited.
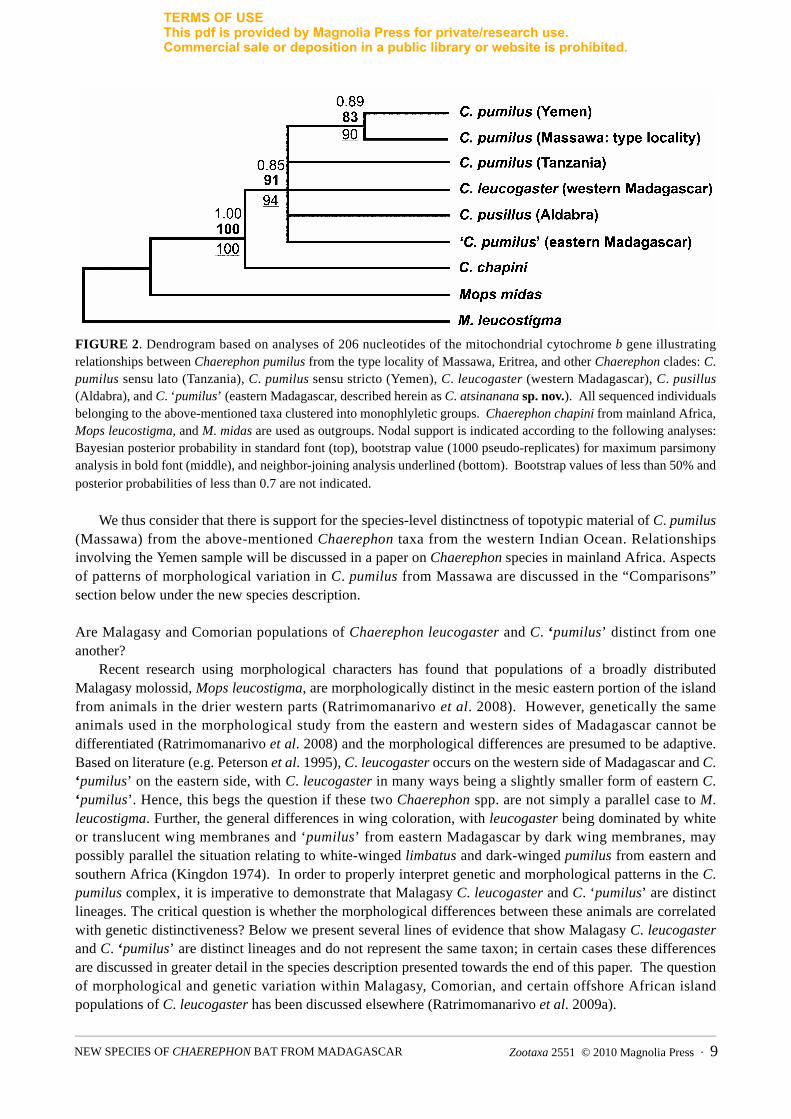
Zootaxa 2551 © 2010 Magnolia Press · 9NEW SPECIES OF CHAEREPHON BAT FROM MADAGASCAR
FIGURE 2. Dendrogram based on analyses of 206 nucleotides of the mitochondrial cytochrome b gene illustratingrelationships between Chaerephon pumilus from the type locality of Massawa, Eritrea, and other Chaerephon clades: C.pumilus sensu lato (Tanzania), C. pumilus sensu stricto (Yemen), C. leucogaster (western Madagascar), C. pusillus(Aldabra), and C. ‘pumilus’ (eastern Madagascar, described herein as C. atsinanana sp. nov.). All sequenced individualsbelonging to the above-mentioned taxa clustered into monophlyletic groups. Chaerephon chapini from mainland Africa,Mops leucostigma, and M. midas are used as outgroups. Nodal support is indicated according to the following analyses:Bayesian posterior probability in standard font (top), bootstrap value (1000 pseudo-replicates) for maximum parsimonyanalysis in bold font (middle), and neighbor-joining analysis underlined (bottom). Bootstrap values of less than 50% andposterior probabilities of less than 0.7 are not indicated.
We thus consider that there is support for the species-level distinctness of topotypic material of C. pumilus(Massawa) from the above-mentioned Chaerephon taxa from the western Indian Ocean. Relationshipsinvolving the Yemen sample will be discussed in a paper on Chaerephon species in mainland Africa. Aspectsof patterns of morphological variation in C. pumilus from Massawa are discussed in the “Comparisons”section below under the new species description.
Are Malagasy and Comorian populations of Chaerephon leucogaster and C. ‘pumilus’ distinct from oneanother?
Recent research using morphological characters has found that populations of a broadly distributedMalagasy molossid, Mops leucostigma, are morphologically distinct in the mesic eastern portion of the islandfrom animals in the drier western parts (Ratrimomanarivo et al. 2008). However, genetically the sameanimals used in the morphological study from the eastern and western sides of Madagascar cannot bedifferentiated (Ratrimomanarivo et al. 2008) and the morphological differences are presumed to be adaptive.Based on literature (e.g. Peterson et al. 1995), C. leucogaster occurs on the western side of Madagascar and C.‘pumilus’ on the eastern side, with C. leucogaster in many ways being a slightly smaller form of eastern C.‘pumilus’. Hence, this begs the question if these two Chaerephon spp. are not simply a parallel case to M.leucostigma. Further, the general differences in wing coloration, with leucogaster being dominated by whiteor translucent wing membranes and ‘pumilus’ from eastern Madagascar by dark wing membranes, maypossibly parallel the situation relating to white-winged limbatus and dark-winged pumilus from eastern andsouthern Africa (Kingdon 1974). In order to properly interpret genetic and morphological patterns in the C.pumilus complex, it is imperative to demonstrate that Malagasy C. leucogaster and C. ‘pumilus’ are distinctlineages. The critical question is whether the morphological differences between these animals are correlatedwith genetic distinctiveness? Below we present several lines of evidence that show Malagasy C. leucogasterand C. ‘pumilus’ are distinct lineages and do not represent the same taxon; in certain cases these differencesare discussed in greater detail in the species description presented towards the end of this paper. The questionof morphological and genetic variation within Malagasy, Comorian, and certain offshore African islandpopulations of C. leucogaster has been discussed elsewhere (Ratrimomanarivo et al. 2009a).
TERMS OF USEThis pdf is provided by Magnolia Press for private/research use. Commercial sale or deposition in a public library or website is prohibited.
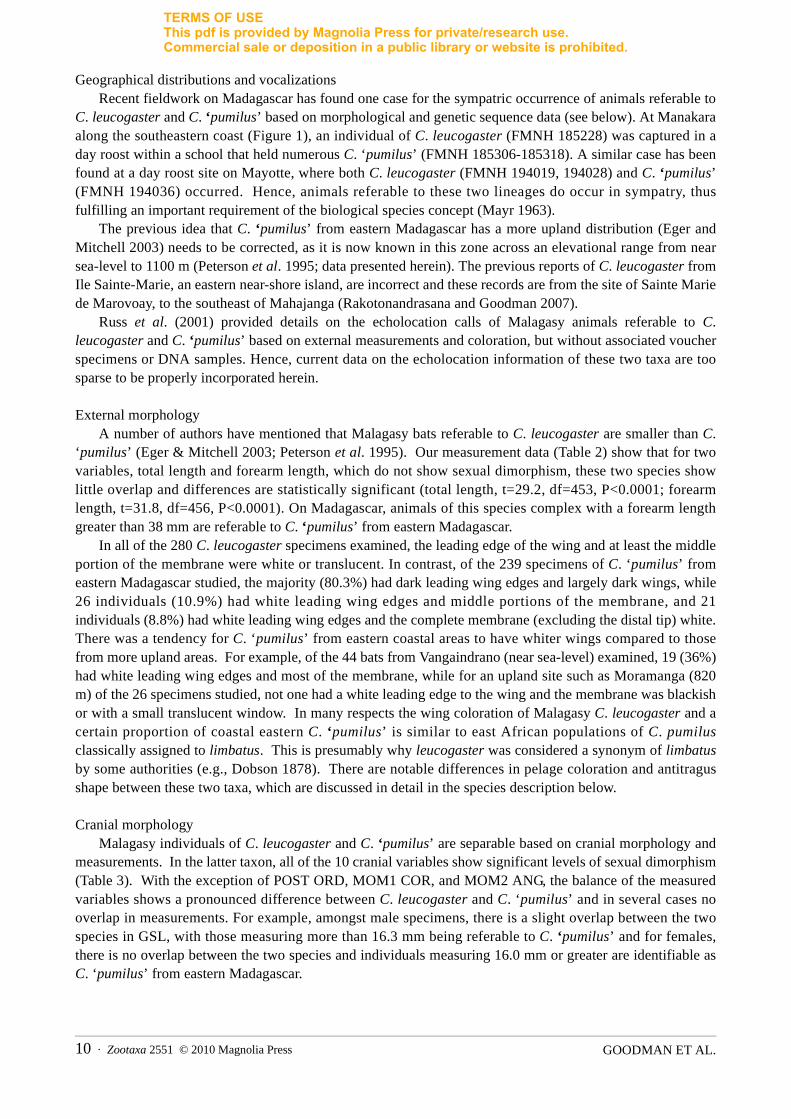
GOODMAN ET AL.10 · Zootaxa 2551 © 2010 Magnolia Press
Geographical distributions and vocalizationsRecent fieldwork on Madagascar has found one case for the sympatric occurrence of animals referable to
C. leucogaster and C. ‘pumilus’ based on morphological and genetic sequence data (see below). At Manakaraalong the southeastern coast (Figure 1), an individual of C. leucogaster (FMNH 185228) was captured in aday roost within a school that held numerous C. ‘pumilus’ (FMNH 185306-185318). A similar case has beenfound at a day roost site on Mayotte, where both C. leucogaster (FMNH 194019, 194028) and C. ‘pumilus’(FMNH 194036) occurred. Hence, animals referable to these two lineages do occur in sympatry, thusfulfilling an important requirement of the biological species concept (Mayr 1963).
The previous idea that C. ‘pumilus’ from eastern Madagascar has a more upland distribution (Eger andMitchell 2003) needs to be corrected, as it is now known in this zone across an elevational range from nearsea-level to 1100 m (Peterson et al. 1995; data presented herein). The previous reports of C. leucogaster fromIle Sainte-Marie, an eastern near-shore island, are incorrect and these records are from the site of Sainte Mariede Marovoay, to the southeast of Mahajanga (Rakotonandrasana and Goodman 2007).
Russ et al. (2001) provided details on the echolocation calls of Malagasy animals referable to C.leucogaster and C. ‘pumilus’ based on external measurements and coloration, but without associated voucherspecimens or DNA samples. Hence, current data on the echolocation information of these two taxa are toosparse to be properly incorporated herein.
External morphology A number of authors have mentioned that Malagasy bats referable to C. leucogaster are smaller than C.‘pumilus’ (Eger & Mitchell 2003; Peterson et al. 1995). Our measurement data (Table 2) show that for twovariables, total length and forearm length, which do not show sexual dimorphism, these two species showlittle overlap and differences are statistically significant (total length, t=29.2, df=453, P<0.0001; forearmlength, t=31.8, df=456, P<0.0001). On Madagascar, animals of this species complex with a forearm lengthgreater than 38 mm are referable to C. ‘pumilus’ from eastern Madagascar.
In all of the 280 C. leucogaster specimens examined, the leading edge of the wing and at least the middleportion of the membrane were white or translucent. In contrast, of the 239 specimens of C. ‘pumilus’ fromeastern Madagascar studied, the majority (80.3%) had dark leading wing edges and largely dark wings, while26 individuals (10.9%) had white leading wing edges and middle portions of the membrane, and 21individuals (8.8%) had white leading wing edges and the complete membrane (excluding the distal tip) white.There was a tendency for C. ‘pumilus’ from eastern coastal areas to have whiter wings compared to thosefrom more upland areas. For example, of the 44 bats from Vangaindrano (near sea-level) examined, 19 (36%)had white leading wing edges and most of the membrane, while for an upland site such as Moramanga (820m) of the 26 specimens studied, not one had a white leading edge to the wing and the membrane was blackishor with a small translucent window. In many respects the wing coloration of Malagasy C. leucogaster and acertain proportion of coastal eastern C. ‘pumilus’ is similar to east African populations of C. pumilusclassically assigned to limbatus. This is presumably why leucogaster was considered a synonym of limbatusby some authorities (e.g., Dobson 1878). There are notable differences in pelage coloration and antitragusshape between these two taxa, which are discussed in detail in the species description below.
Cranial morphology Malagasy individuals of C. leucogaster and C. ‘pumilus’ are separable based on cranial morphology and
measurements. In the latter taxon, all of the 10 cranial variables show significant levels of sexual dimorphism(Table 3). With the exception of POST ORD, MOM1 COR, and MOM2 ANG, the balance of the measuredvariables shows a pronounced difference between C. leucogaster and C. ‘pumilus’ and in several cases nooverlap in measurements. For example, amongst male specimens, there is a slight overlap between the twospecies in GSL, with those measuring more than 16.3 mm being referable to C. ‘pumilus’ and for females,there is no overlap between the two species and individuals measuring 16.0 mm or greater are identifiable asC. ‘pumilus’ from eastern Madagascar.
TERMS OF USEThis pdf is provided by Magnolia Press for private/research use. Commercial sale or deposition in a public library or website is prohibited.
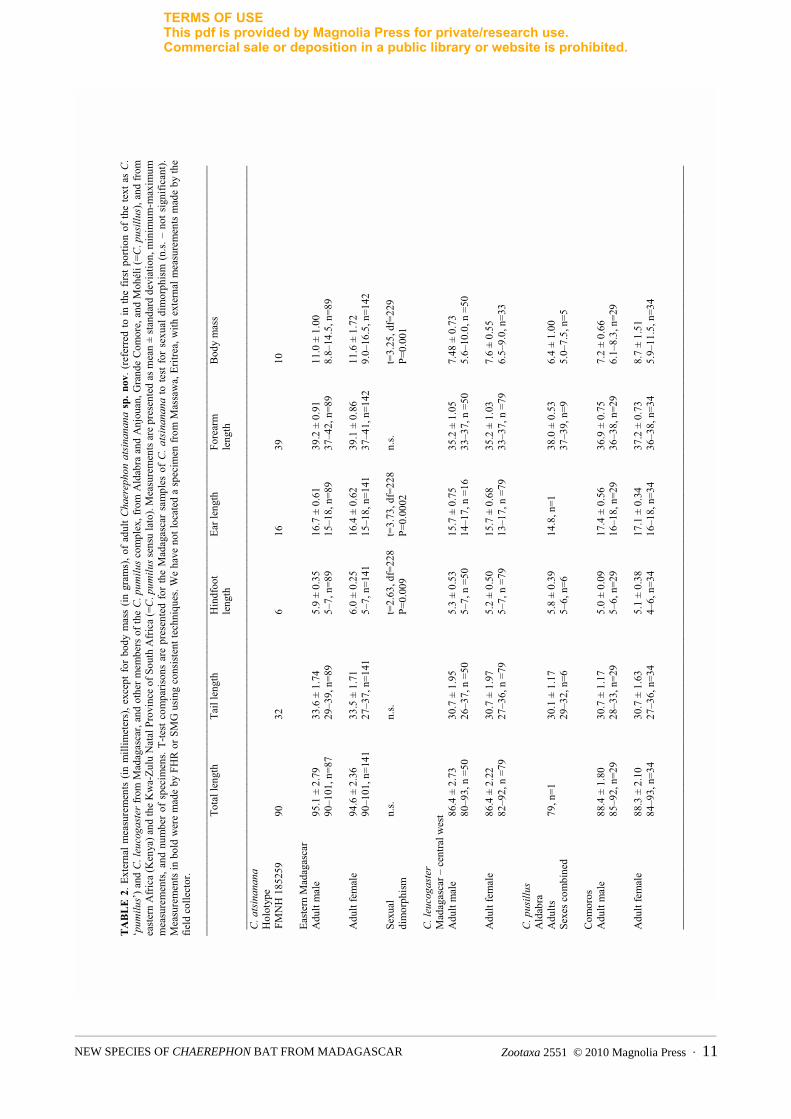
Zootaxa 2551 © 2010 Magnolia Press · 11NEW SPECIES OF CHAEREPHON BAT FROM MADAGASCAR
TA
BL
E 2
. Ext
erna
l mea
sure
men
ts (
in m
illim
eter
s), e
xcep
t for
bod
y m
ass
(in g
ram
s), o
f adu
lt C
haer
epho
nat
sinan
ana
sp. n
ov. (
refe
rred
to in
the
first
por
tion
of th
e te
xt a
s C
.‘p
umilu
s’) a
nd C
. leu
coga
ster
from
Mad
agas
car,
and
othe
r mem
bers
of t
he C
. pum
ilus c
ompl
ex, f
rom
Ald
abra
and
Anj
ouan
, Gra
nde
Com
ore,
and
Moh
éli (
=C. p
usill
us),
and
from
ea
ster
n A
frica
(Ken
ya) a
nd th
e K
wa-
Zulu
Nat
al P
rovi
nce
of S
outh
Afri
ca (=
C. p
umilu
s sen
su la
to).
Mea
sure
men
ts a
re p
rese
nted
as m
ean
± st
anda
rd d
evia
tion,
min
imum
-max
imum
m
easu
rem
ents
, and
num
ber
of s
peci
men
s. T-
test
com
paris
ons
are
pres
ente
d fo
r th
e M
adag
asca
r sa
mpl
es o
f C
. ats
inan
ana
to te
st f
or s
exua
l dim
orph
ism
(n.s.
– n
ot s
igni
fican
t).
Mea
sure
men
ts in
bol
d w
ere
mad
e by
FH
R o
r SM
G u
sing
con
sist
ent t
echn
ique
s. W
e ha
ve n
ot lo
cate
d a
spec
imen
from
Mas
saw
a, E
ritre
a, w
ith e
xter
nal m
easu
rem
ents
mad
e by
the
field
col
lect
or.
____
____
____
____
____
____
____
____
____
____
____
____
____
____
____
____
____
____
____
____
____
____
____
____
____
____
____
____
____
_
Tota
l len
gth
Tail
leng
th
Hin
dfoo
t Ea
r len
gth
Fore
arm
B
ody
mas
s
leng
th
leng
th
____
____
____
____
____
____
____
____
____
____
____
____
____
____
____
____
____
____
____
____
____
____
____
____
____
____
____
____
____
C. a
tsin
anan
a H
olot
ype
FM
NH
185
259
90
32
6 16
39
10
East
ern
Mad
agas
car
Adu
lt m
ale
95.1
± 2
.79
33.6
± 1
.74
5.9
± 0.
35
16.7
± 0
.61
39.2
± 0
.91
11.0
± 1
.00
90
–101
, n=8
7 29
–39,
n=8
9 5–
7, n
=89
15–1
8, n
=89
37–4
2, n
=89
8.8–
14.5
, n=8
9
Adu
lt fe
mal
e 94
.6 ±
2.3
6 33
.5 ±
1.7
1 6.
0 ±
0.25
16
.4 ±
0.6
2 39
.1 ±
0.8
6 11
.6 ±
1.7
2
90–1
01, n
=141
27
–37,
n=1
41
5–7,
n=1
41
15–1
8, n
=141
37
–41,
n=1
42
9.0–
16.5
, n=1
42
Sexu
al
n.s.
n.s.
t=2.
63, d
f=22
8 t=
3.73
, df=
228
n.s.
t=3.
25, d
f=22
9 di
mor
phis
m
P=0.
009
P=0.
0002
P=0.
001
C. l
euco
gast
er
Mad
agas
car –
cen
tral w
est
Adu
lt m
ale
86.4
± 2
.73
30.7
± 1
.95
5.3
± 0.
53
15.7
± 0
.75
35.2
± 1
.05
7.48
± 0
.73
80
–93,
n =
50
26–3
7, n
=50
5–
7, n
=50
14
–17,
n =
16
33–3
7, n
=50
5.
6–10
.0, n
=50
Adu
lt fe
mal
e
86
.4 ±
2.2
2 30
.7 ±
1.9
7 5.
2 ±
0.50
15
.7 ±
0.6
8 35
.2 ±
1.0
3 7.
6 ±
0.55
82–9
2, n
=79
27
–36,
n =
79
5–7,
n =
79
13–1
7, n
=79
33
–37,
n =
79
6.5–
9.0,
n=3
3
C. p
usill
us
Ald
abra
A
dults
79
, n=1
30
.1 ±
1.1
7 5.
8 ±
0.39
14
.8, n
=1
38.0
± 0
.53
6.4
± 1.
00
Sexe
s com
bine
d
29–3
2, n
=6
5–6,
n=6
37–3
9, n
=9
5.0–
7.5,
n=5
Com
oros
A
dult
mal
e 88
.4 ±
1.8
0 30
.7 ±
1.1
7 5.
0 ±
0.09
17
.4 ±
0.5
6 36
.9 ±
0.7
5 7.
2 ±
0.66
85–9
2, n
=29
28–3
3, n
=29
5–6,
n=2
9 16
–18,
n=2
9 36
–38,
n=2
9 6.
1–8.
3, n
=29
Adu
lt fe
mal
e 88
.3 ±
2.1
0 30
.7 ±
1.6
3 5.
1 ±
0.38
17
.1 ±
0.3
4 37
.2 ±
0.7
3 8.
7 ±
1.51
84–9
3, n
=34
27–3
6, n
=34
4–6,
n=3
4 16
–18,
n=3
4 36
–38,
n=3
4 5.
9–11
.5, n
=34
____
____
____
____
____
____
____
____
____
____
____
____
____
____
____
____
____
____
____
____
____
____
____
____
____
____
____
____
____
TERMS OF USEThis pdf is provided by Magnolia Press for private/research use. Commercial sale or deposition in a public library or website is prohibited.
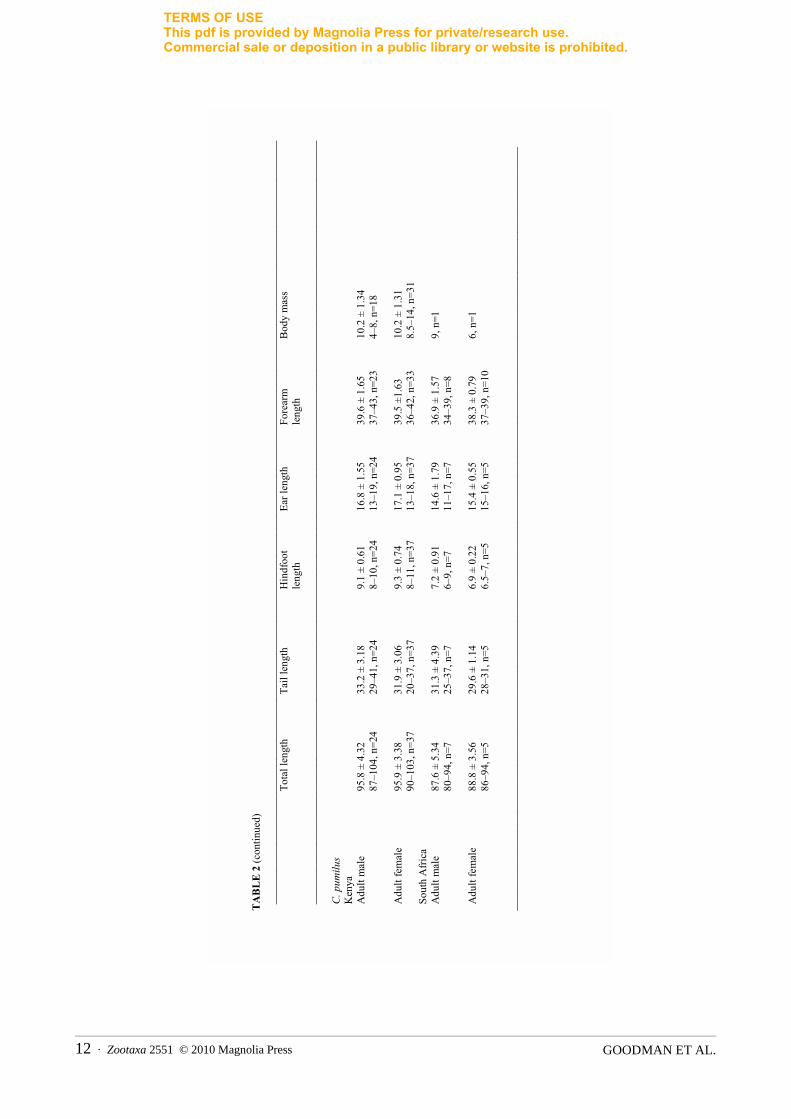
GOODMAN ET AL.12 · Zootaxa 2551 © 2010 Magnolia Press
TA
BL
E 2
(con
tinue
d)__
____
____
____
____
____
____
____
____
____
____
____
____
____
____
____
____
____
____
____
____
____
____
____
____
____
____
____
____
__
Tota
l len
gth
Tail
leng
th
Hin
dfoo
t Ea
r len
gth
Fore
arm
B
ody
mas
s
leng
th
leng
th
____
____
____
____
____
____
____
____
____
____
____
____
____
____
____
____
____
____
____
____
____
____
____
____
____
____
____
____
____
C. p
umilu
s K
enya
A
dult
mal
e 95
.8 ±
4.3
2 33
.2 ±
3.1
8 9.
1 ±
0.61
16
.8 ±
1.5
5 39
.6 ±
1.6
5 10
.2 ±
1.3
4
87–1
04, n
=24
29–4
1, n
=24
8–10
, n=2
4 13
–19,
n=2
4 37
–43,
n=2
3 4–
8, n
=18
Adu
lt fe
mal
e 95
.9 ±
3.3
8 31
.9 ±
3.0
6 9.
3 ±
0.74
17
.1 ±
0.9
5 39
.5 ±
1.63
10
.2 ±
1.3
1
90–1
03, n
=37
20–3
7, n
=37
8–11
, n=3
7 13
–18,
n=3
7 36
–42,
n=3
3 8.
5–14
, n=3
1 So
uth
Afri
ca
Adu
lt m
ale
87.6
± 5
.34
31.3
± 4
.39
7.2
± 0.
91
14.6
± 1
.79
36.9
± 1
.57
9, n
=1
80
–94,
n=7
25
–37,
n=7
6–
9, n
=7
11–1
7, n
=7
34–3
9, n
=8
Adu
lt fe
mal
e 88
.8 ±
3.5
6 29
.6 ±
1.1
4 6.
9 ±
0.22
15
.4 ±
0.5
5 38
.3 ±
0.7
9 6,
n=1
86–9
4, n
=5
28–3
1, n
=5
6.5–
7, n
=5
15–1
6, n
=5
37–3
9, n
=10
____
____
____
____
____
____
____
____
____
____
____
____
____
____
____
____
____
____
____
____
____
____
____
____
____
____
____
____
____
TERMS OF USEThis pdf is provided by Magnolia Press for private/research use. Commercial sale or deposition in a public library or website is prohibited.
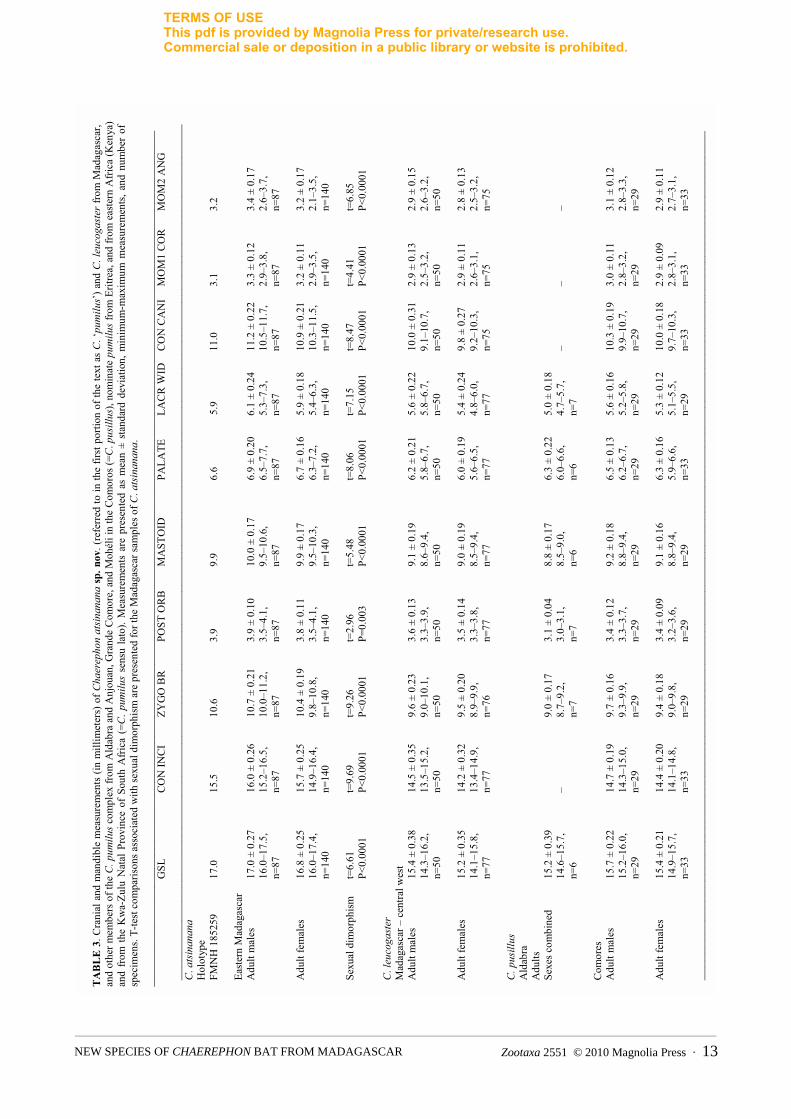
Zootaxa 2551 © 2010 Magnolia Press · 13NEW SPECIES OF CHAEREPHON BAT FROM MADAGASCAR
TA
BL
E 3
. Cra
nial
and
man
dibl
e m
easu
rem
ents
(in
mill
imet
ers)
of C
haer
epho
nat
sinan
ana
sp. n
ov. (
refe
rred
to in
the
first
por
tion
of th
e te
xt a
s C
.‘pu
milu
s’) a
nd C
. leu
coga
ster
from
Mad
agas
car,
and
othe
r mem
bers
of t
he C
. pum
ilus c
ompl
ex fr
om A
ldab
ra a
nd A
njou
an, G
rand
e C
omor
e, a
nd M
ohél
i in
the
Com
oros
(=C
. pus
illus
), no
min
ate
pum
ilus f
rom
Erit
rea,
and
from
eas
tern
Afri
ca (K
enya
) an
d fro
m th
e K
wa-
Zulu
Nat
al P
rovi
nce
of S
outh
Afr
ica
(=C
. pum
ilus
sens
u la
to).
Mea
sure
men
ts a
re p
rese
nted
as
mea
n ±
stan
dard
dev
iatio
n, m
inim
um-m
axim
um m
easu
rem
ents
, and
num
ber
of
spec
imen
s. T-
test
com
paris
ons a
ssoc
iate
d w
ith se
xual
dim
orph
ism
are
pre
sent
ed fo
r the
Mad
agas
car s
ampl
es o
f C. a
tsin
anan
a.__
____
____
____
____
____
____
____
____
____
____
____
____
____
____
____
____
____
____
____
____
____
____
____
____
____
____
____
____
____
____
____
____
GSL
C
ON
INC
I ZY
GO
BR
PO
ST O
RB
MA
STO
ID
PALA
TE
LAC
R W
ID
CO
N C
AN
I M
OM
1 C
OR
MO
M2
AN
G
____
____
____
____
____
____
____
____
____
____
____
____
____
____
____
____
____
____
____
____
____
____
____
____
____
____
____
____
____
____
____
____
__C
. ats
inan
ana
Hol
otyp
e
FMN
H 1
8525
9 17
.0
15.5
10
.6
3.9
9.9
6.
6 5.
9 11
.0
3.1
3.2
East
ern
Mad
agas
car
Adu
lt m
ales
17
.0 ±
0.2
7 16
.0 ±
0.2
6 10
.7 ±
0.2
1 3.
9 ±
0.10
10
.0 ±
0.1
7 6.
9 ±
0.20
6.
1 ±
0.24
11
.2 ±
0.2
2 3.
3 ±
0.12
3.
4 ±
0.17
16.0
–17.
5,
15.2
–16.
5,
10.0
–11.
2,
3.5–
4.1,
9.
5–10
.6,
6.5–
7.7,
5.
3–7.
3,
10.5
–11.
7,
2.9–
3.8,
2.
6–3.
7,
n=
87
n=87
n=
87
n=87
n=
87
n=
87
n=87
n=
87
n=87
n=
87
Adu
lt fe
mal
es
16.8
± 0
.25
15.7
± 0
.25
10.4
± 0
.19
3.8
± 0.
11
9.9
± 0.
17
6.7
± 0.
16
5.9
± 0.
18
10.9
± 0
.21
3.2
± 0.
11
3.2
± 0.
17
16.0
–17.
4,
14.9
–16.
4,
9.8–
10.8
, 3.
5–4.
1,
9.5–
10.3
, 6.
3–7.
2,
5.4–
6.3,
10
.3–1
1.5,
2.
9–3.
5,
2.1–
3.5,
n=14
0 n=
140
n=14
0 n=
140
n=14
0
n=14
0 n=
140
n=14
0 n=
140
n=14
0
Sexu
al d
imor
phis
m
t=6.
61
t=9.
69
t=9.
26
t=2.
96
t=5.
48
t=
8.06
t=
7.15
t=
8.47
t=
4.41
t=
6.85
P<0.
0001
P<
0.00
01
P<0.
0001
P=
0.00
3 P<
0.00
01
P<0.
0001
P<
0.00
01
P<0.
0001
P<
0.00
01
P<0.
0001
C. l
euco
gast
er
Mad
agas
car –
cen
tral w
est
Adu
lt m
ales
15
.4 ±
0.3
8 14
.5 ±
0.3
5 9.
6 ±
0.23
3.
6 ±
0.13
9.
1 ±
0.19
6.
2 ±
0.21
5.
6 ±
0.22
10
.0 ±
0.3
1 2.
9 ±
0.13
2.
9 ±
0.15
14.3
–16.
2,
13.5
–15.
2,
9.0–
10.1
, 3.
3–3.
9,
8.6–
9.4,
5.
8–6.
7,
5.8–
6.7,
9.
1–10
.7,
2.5–
3.2,
2.
6–3.
2,
n=
50
n=50
n=
50
n=50
n=
50
n=
50
n=50
n=
50
n=50
n=
50
Adu
lt fe
mal
es
15.2
± 0
.35
14.2
± 0
.32
9.5
± 0.
20
3.5
± 0.
14
9.0
± 0.
19
6.0
± 0.
19
5.4
± 0.
24
9.8
± 0.
27
2.9
± 0.
11
2.8
± 0.
13
14
.1–1
5.8,
13
.4–1
4.9,
8.
9–9.
9,
3.3–
3.8,
8.
5–9.
4,
5.6–
6.5,
4.
8–6.
0,
9.
2–10
.3,
2.
6–3.
1,
2.5–
3.2,
n=77
n=
77
n=76
n=
77
n=77
n=77
n=
77
n=75
n=
75
n=75
C. p
usill
us
Ald
abra
A
dults
Se
xes c
ombi
ned
15.2
± 0
.39
9.
0 ±
0.17
3.
1 ±
0.04
8.
8 ±
0.17
6.
3 ±
0.22
5.
0 ±
0.18
14
.6–1
5.7,
–
8.7–
9.2,
3.
0–3.
1,
8.5–
9.0,
6.
0–6.
6,
4.7–
5.7,
–
– –
n=
6
n=7
n=7
n=6
n=
6 n=
7
Com
ores
A
dult
mal
es
15.7
± 0
.22
14.7
± 0
.19
9.7
± 0.
16
3.4
± 0.
12
9.2
± 0.
18
6.5
± 0.
13
5.6
± 0.
16
10.3
± 0
.19
3.0
± 0.
11
3.1
± 0.
12
15.2
–16.
0,
14.3
–15.
0,
9.3–
9.9,
3.
3–3.
7,
8.8–
9.4,
6.
2–6.
7,
5.2–
5.8,
9.
9–10
.7,
2.8–
3.2,
2.
8–3.
3,
n=
29
n=29
n=
29
n=29
n=
29
n=
29
n=29
n=
29
n=29
n=
29
Adu
lt fe
mal
es
15.4
± 0
.21
14.4
± 0
.20
9.4
± 0.
18
3.4
± 0.
09
9.1
± 0.
16
6.3
± 0.
16
5.3
± 0.
12
10.0
± 0
.18
2.9
± 0.
09
2.9
± 0.
11
14.9
–15.
7,
14.1
–14.
8,
9.0–
9.8,
3.
2–3.
6,
8.8–
9.4,
5.
9–6.
6,
5.1–
5.5,
9.
7–10
.3,
2.8–
3.1,
2.
7–3.
1,
n=
33
n=33
n=
29
n=29
n=
29
n=
33
n=29
n=
33
n=33
n=
33
____
____
____
____
____
____
____
____
____
____
____
____
____
____
____
____
____
____
____
____
____
____
____
____
____
____
____
____
____
____
____
____
_
TERMS OF USEThis pdf is provided by Magnolia Press for private/research use. Commercial sale or deposition in a public library or website is prohibited.
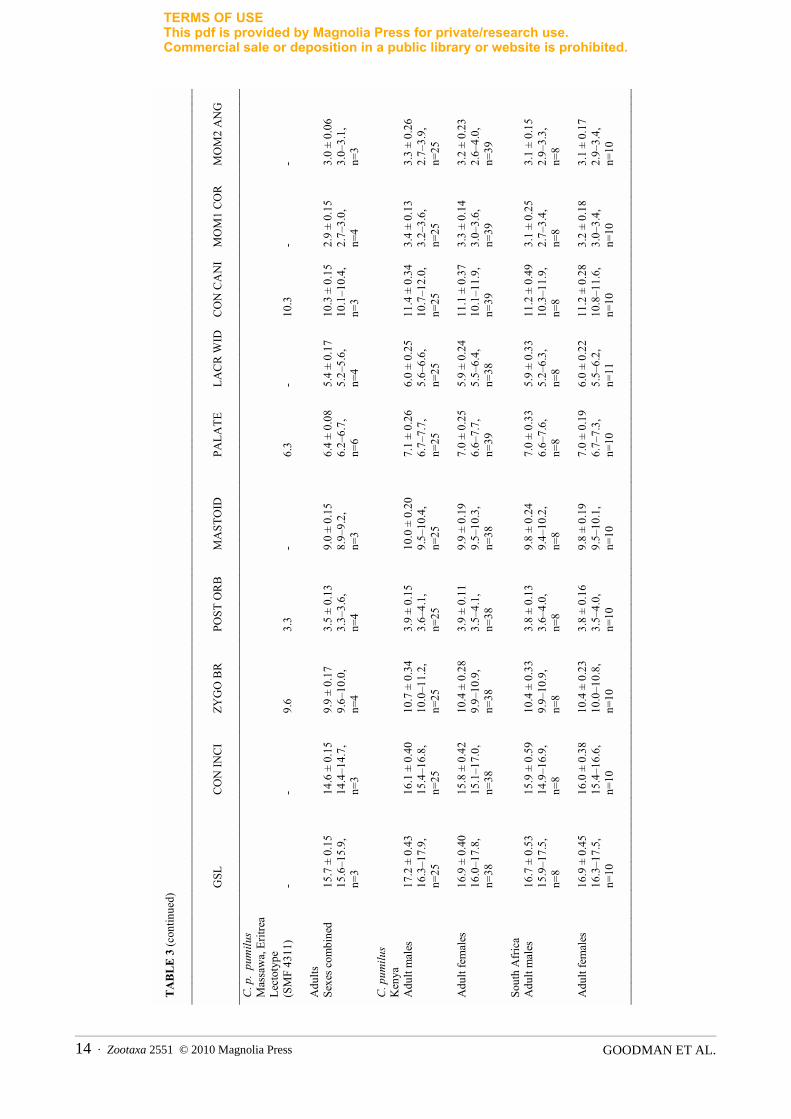
GOODMAN ET AL.14 · Zootaxa 2551 © 2010 Magnolia Press
TA
BLE
3 (c
ontin
ued)
__
____
____
____
____
____
____
____
____
____
____
____
____
____
____
____
____
____
____
____
____
____
____
____
____
____
____
____
____
____
____
____
___
GSL
C
ON
INC
I ZY
GO
BR
PO
ST O
RB
M
AST
OID
PA
LATE
LA
CR
WID
C
ON
CA
NI
MO
M1
CO
R
MO
M2
AN
G
____
____
____
____
____
____
____
____
____
____
____
____
____
____
____
____
____
____
____
____
____
____
____
____
____
____
____
____
____
____
____
____
_C
. p.
pum
ilus
Mas
saw
a, E
ritre
a Le
ctot
ype
(S
MF
4311
) -
- 9.
6 3.
3 -
6.
3 -
10.3
-
-
Adu
lts
Sexe
s com
bine
d 15
.7 ±
0.1
5 14
.6 ±
0.1
5 9.
9 ±
0.17
3.
5 ±
0.13
9.
0 ±
0.15
6.
4 ±
0.08
5.
4 ±
0.17
10
.3 ±
0.1
5 2.
9 ±
0.15
3.
0 ±
0.06
15
.6–1
5.9,
14
.4–1
4.7,
9.
6–10
.0,
3.3–
3.6,
8.
9–9.
2,
6.2–
6.7,
5.
2–5.
6,
10.1
–10.
4,
2.7–
3.0,
3.
0–3.
1,
n=
3 n=
3 n=
4 n=
4 n=
3
n=6
n=4
n=3
n=4
n=3
C. p
umilu
s K
enya
A
dult
mal
es
17.2
± 0
.43
16.1
± 0
.40
10.7
± 0
.34
3.9
± 0.
15
10.0
± 0
.20
7.1
± 0.
26
6.0
± 0.
25
11.4
± 0
.34
3.4
± 0.
13
3.3
± 0.
26
16
.3–1
7.9,
15
.4–1
6.8,
10
.0–1
1.2,
3.
6–4.
1,
9.5–
10.4
, 6.
7–7.
7,
5.6–
6.6,
10
.7–1
2.0,
3.
2–3.
6,
2.7–
3.9,
n=25
n=
25
n=25
n=
25
n=25
n=25
n=
25
n=25
n=
25
n=25
Adu
lt fe
mal
es
16.9
± 0
.40
15.8
± 0
.42
10.4
± 0
.28
3.9
± 0.
11
9.9
± 0.
19
7.0
± 0.
25
5.9
± 0.
24
11.1
± 0
.37
3.3
± 0.
14
3.2
± 0.
23
16.0
–17.
8,
15.1
–17.
0,
9.9–
10.9
, 3.
5–4.
1,
9.5–
10.3
, 6.
6–7.
7,
5.5–
6.4,
10
.1–1
1.9,
3.
0–3.
6,
2.6–
4.0,
n=
38
n=38
n=
38
n=38
n=
38
n=
39
n=38
n=
39
n=39
n=
39
Sout
h A
fric
a A
dult
mal
es
16.7
± 0
.53
15.9
± 0
.59
10.4
± 0
.33
3.8
± 0.
13
9.8
± 0.
24
7.0
± 0.
33
5.9
± 0.
33
11.2
± 0
.49
3.1
± 0.
25
3.1
± 0.
15
15
.9–1
7.5,
14
.9–1
6.9,
9.
9–10
.9,
3.6–
4.0,
9.
4–10
.2,
6.6–
7.6,
5.
2–6.
3,
10.3
–11.
9,
2.7–
3.4,
2.
9–3.
3,
n=
8 n=
8 n=
8n=
8 n=
8
n=8
n=8
n=8
n=8
n=8
Adu
lt fe
mal
es
16.9
± 0
.45
16.0
± 0
.38
10.4
± 0
.23
3.8
± 0.
16
9.8
± 0.
19
7.0
± 0.
19
6.0
± 0.
22
11.2
± 0
.28
3.2
± 0.
18
3.1
± 0.
17
16.3
–17.
5,
15.4
–16.
6,
10.0
–10.
8,
3.5–
4.0,
9.
5–10
.1,
6.7–
7.3,
5.
5–6.
2,
10.8
–11.
6,
3.0–
3.4,
2.
9–3.
4,
n=
10
n=10
n=
10
n=10
n=
10
n=
10
n=11
n=
10
n=10
n=
10
____
____
____
____
____
____
____
____
____
____
____
____
____
____
____
____
____
____
____
____
____
____
____
____
____
____
____
____
____
____
____
____
_
TERMS OF USEThis pdf is provided by Magnolia Press for private/research use. Commercial sale or deposition in a public library or website is prohibited.
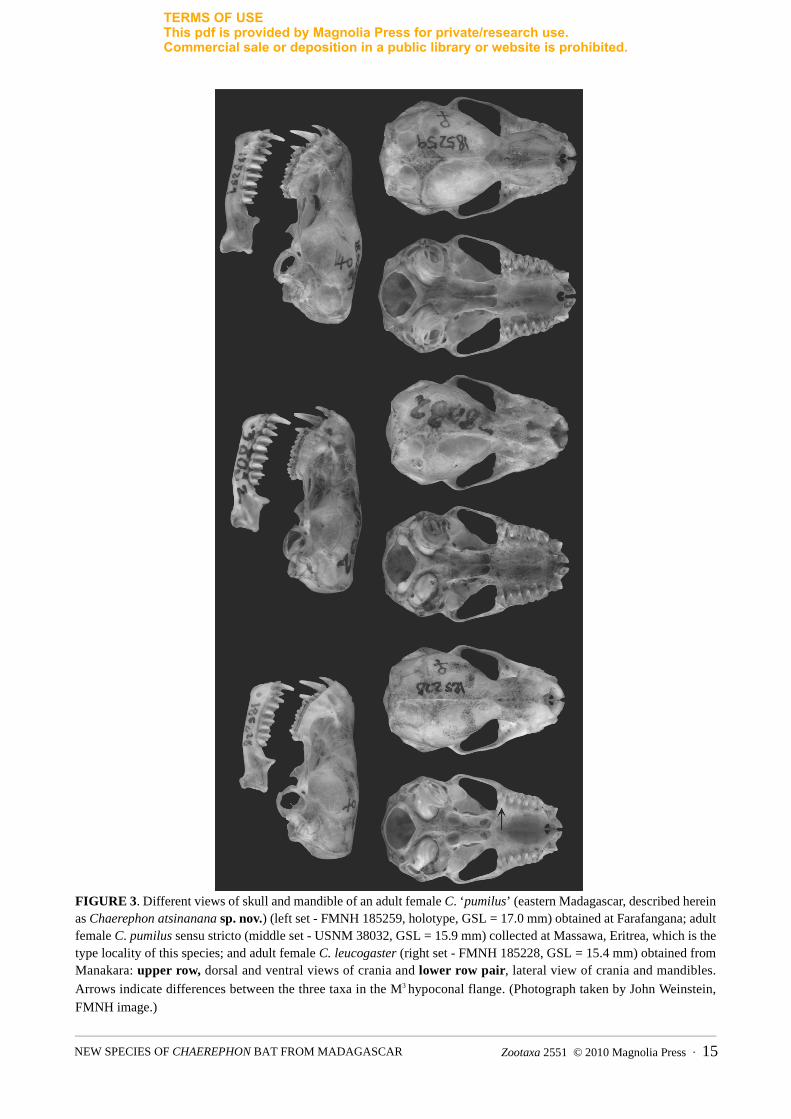
Zootaxa 2551 © 2010 Magnolia Press · 15NEW SPECIES OF CHAEREPHON BAT FROM MADAGASCAR
FIGURE 3. Different views of skull and mandible of an adult female C. ‘pumilus’ (eastern Madagascar, described hereinas Chaerephon atsinanana sp. nov.) (left set - FMNH 185259, holotype, GSL = 17.0 mm) obtained at Farafangana; adultfemale C. pumilus sensu stricto (middle set - USNM 38032, GSL = 15.9 mm) collected at Massawa, Eritrea, which is thetype locality of this species; and adult female C. leucogaster (right set - FMNH 185228, GSL = 15.4 mm) obtained fromManakara: upper row, dorsal and ventral views of crania and lower row pair, lateral view of crania and mandibles.
Arrows indicate differences between the three taxa in the M3 hypoconal flange. (Photograph taken by John Weinstein,FMNH image.)
TERMS OF USEThis pdf is provided by Magnolia Press for private/research use. Commercial sale or deposition in a public library or website is prohibited.
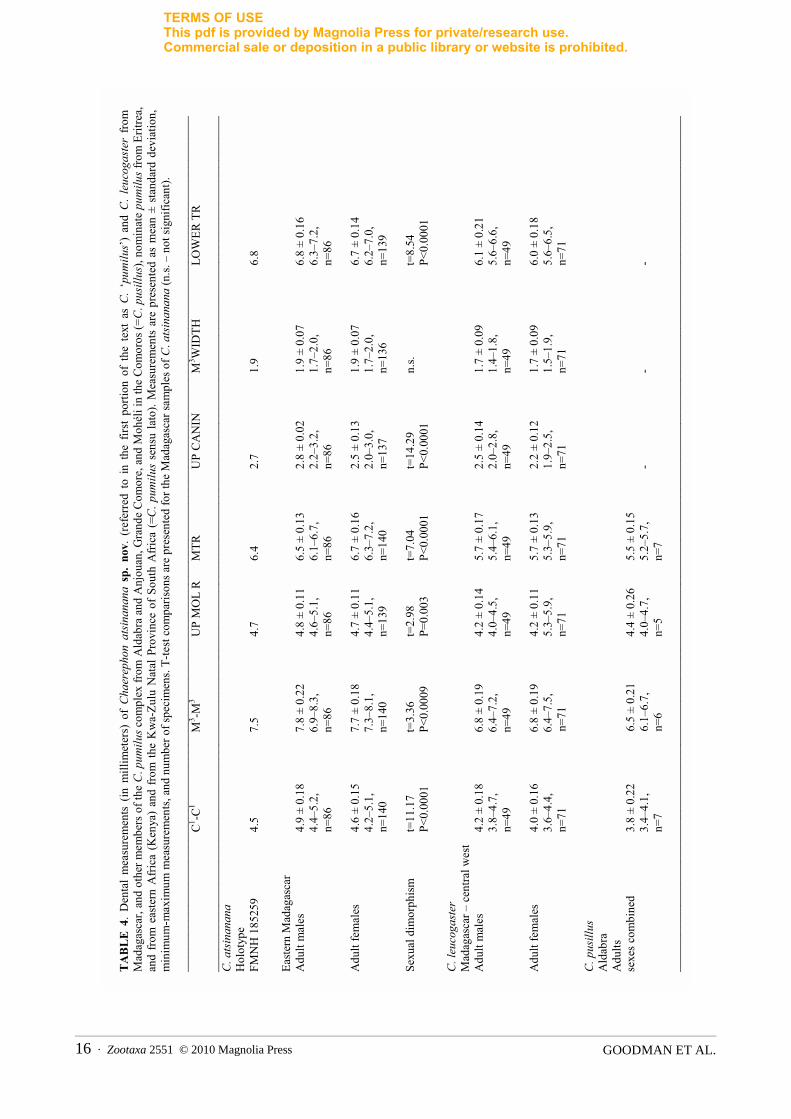
GOODMAN ET AL.16 · Zootaxa 2551 © 2010 Magnolia Press
TA
BL
E 4
. D
enta
l m
easu
rem
ents
(in
mill
imet
ers)
of
Cha
erep
hon
atsin
anan
a sp
. no
v. (
refe
rred
to
in t
he f
irst
porti
on o
f th
e te
xt a
s C
.‘p
umilu
s’)
and
C.
leuc
ogas
ter
from
M
adag
asca
r, an
d ot
her m
embe
rs o
f the
C.p
umilu
s com
plex
from
Ald
abra
and
Anj
ouan
, Gra
nde
Com
ore,
and
Moh
éli i
n th
e C
omor
os (=
C. p
usill
us),
nom
inat
e pu
milu
s fro
m E
ritre
a,
and
from
eas
tern
Afri
ca (
Ken
ya)
and
from
the
Kw
a-Zu
lu N
atal
Pro
vinc
e of
Sou
th A
frica
(=C
. pum
ilus
sens
u la
to).
Mea
sure
men
ts a
re p
rese
nted
as
mea
n ±
stan
dard
dev
iatio
n,
min
imum
-max
imum
mea
sure
men
ts, a
nd n
umbe
r of s
peci
men
s. T-
test
com
paris
ons a
re p
rese
nted
for t
he M
adag
asca
r sam
ples
of C
.ats
inan
ana
(n.s.
– n
ot si
gnifi
cant
).__
____
____
____
____
____
____
____
____
____
____
____
____
____
____
____
____
____
____
____
____
____
____
____
____
____
____
____
____
___
C1 -C
1 M
3 -M3
UP
MO
L R
M
TR
UP
CA
NIN
M
3 WID
TH
LOW
ER T
R
__
____
____
____
____
____
____
____
____
____
____
____
____
____
____
____
____
____
____
____
____
____
____
____
____
____
____
____
____
___
C. a
tsin
anan
a H
olot
ype
FMN
H 1
8525
9 4
.5
7.5
4.7
6.
4
2.7
1.
9
6.8
East
ern
Mad
agas
car
Adu
lt m
ales
4
.9 ±
0.1
8 7.
8 ±
0.22
4.
8 ±
0.11
6.
5 ±
0.13
2.
8 ±
0.02
1.
9 ±
0.07
6.
8 ±
0.16
4.4
–5.2
, 6.
9–8.
3,
4.6–
5.1,
6.
1–6.
7,
2.2–
3.2,
1.
7–2.
0,
6.3–
7.2,
n=8
6 n=
86
n=86
n=
86
n=86
n=
86
n=86
Adu
lt fe
mal
es
4.6
± 0.
15
7.7
± 0.
18
4.7
± 0.
11
6.7
± 0.
16
2.5
± 0.
13
1.9
± 0.
07
6.7
± 0.
14
4.2–
5.1,
7.
3–8.
1,
4.4–
5.1,
6.
3–7.
2,
2.0–
3.0,
1.
7–2.
0,
6.2–
7.0,
n=14
0 n=
140
n=13
9 n=
140
n=13
7 n=
136
n=13
9
Sexu
al d
imor
phis
m
t=11
.17
t=3.
36
t=2.
98
t=7.
04
t=14
.29
n.s.
t=8.
54
P<
0.00
01
P<0.
0009
P=
0.00
3 P<
0.00
01
P<0.
0001
P<0.
0001
C. l
euco
gast
er
Mad
agas
car –
cen
tral w
est
A
dult
mal
es
4.2
± 0.
18
6.8
± 0.
19
4.2
± 0.
14
5.7
± 0.
17
2.5
± 0.
14
1.7
± 0.
09
6.1
± 0.
21
3.
8–4.
7,
6.4–
7.2,
4.
0–4.
5,
5.4–
6.1,
2.
0–2.
8,
1.4–
1.8,
5.
6–6.
6,
n=49
n=
49
n=49
n=
49
n=49
n=
49
n=49
Adu
lt fe
mal
es
4.0
± 0.
16
6.8
± 0.
19
4.2
± 0.
11
5.7
± 0.
13
2.2
± 0.
12
1.7
± 0.
09
6.0
± 0.
18
3.
6–4.
4,
6.4–
7.5,
5.
3–5.
9,
5.3–
5.9,
1.
9–2.
5,
1.5–
1.9,
5.
6–6.
5,
n=71
n=
71
n=71
n=
71
n=71
n=
71
n=71
C. p
usill
us
Ald
abra
A
dults
se
xes c
ombi
ned
3.8
± 0.
22
6.5
± 0.
21
4.4
± 0.
26
5.5
± 0.
15
3.
4–4.
1,
6.1–
6.7,
4.
0–4.
7,
5.2–
5.7,
-
- -
n=7
n=6
n=5
n=7
____
____
____
____
____
____
____
____
____
____
____
____
____
____
____
____
____
____
____
____
____
____
____
____
____
____
____
____
____
_
TERMS OF USEThis pdf is provided by Magnolia Press for private/research use. Commercial sale or deposition in a public library or website is prohibited.
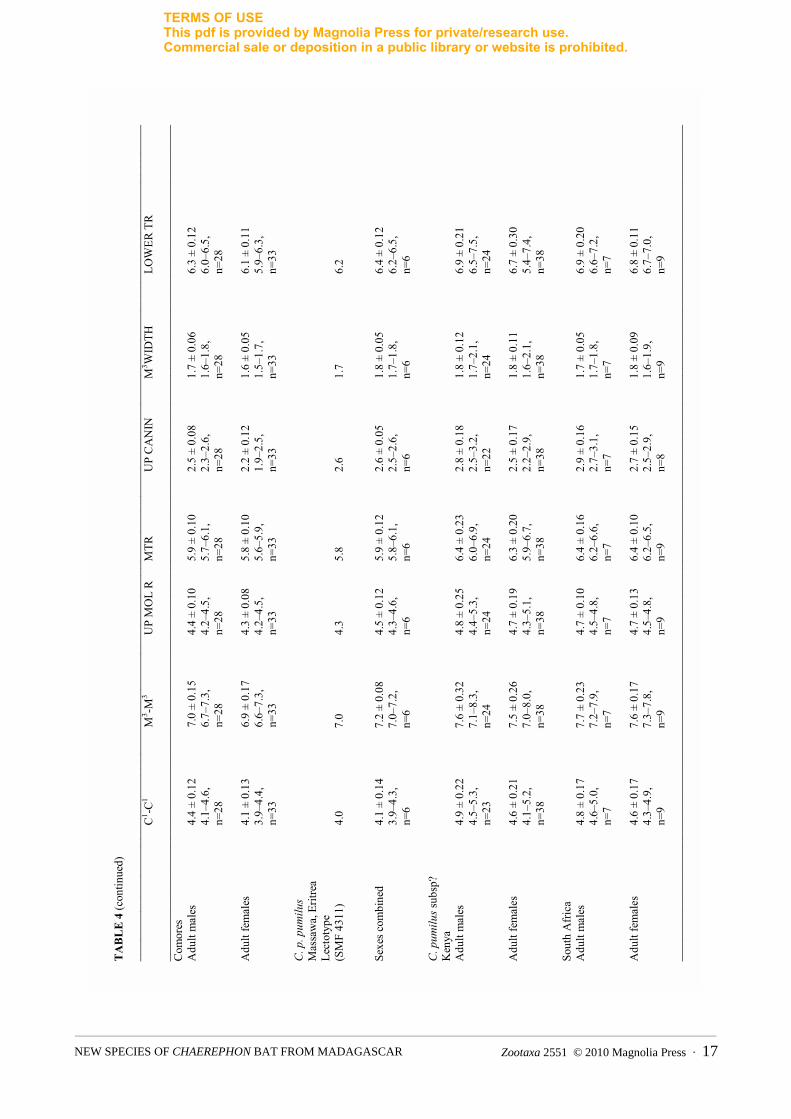
Zootaxa 2551 © 2010 Magnolia Press · 17NEW SPECIES OF CHAEREPHON BAT FROM MADAGASCAR
TA
BL
E 4
(con
tinue
d)
____
____
____
____
____
____
____
____
____
____
____
____
____
____
____
____
____
____
____
____
____
____
____
____
____
____
____
____
____
_ C
1 -C1
M3 -M
3 U
P M
OL
R
MTR
U
P C
AN
IN
M3 W
IDTH
LO
WER
TR
__
____
____
____
____
____
____
____
____
____
____
____
____
____
____
____
____
____
____
____
____
____
____
____
____
____
____
____
____
___
Com
ores
A
dult
mal
es
4.4
± 0.
12
7.0
± 0.
15
4.4
± 0.
10
5.9
± 0.
10
2.5
± 0.
08
1.7
± 0.
06
6.3
± 0.
12
4.
1–4.
6,
6.7–
7.3,
4.
2–4.
5,
5.7–
6.1,
2.
3–2.
6,
1.6–
1.8,
6.
0–6.
5,
n=
28
n=28
n=
28
n=28
n=
28
n=28
n=
28
Adu
lt fe
mal
es
4.1
± 0.
13
6.9
± 0.
17
4.3
± 0.
08
5.8
± 0.
10
2.2
± 0.
12
1.6
± 0.
05
6.1
± 0.
11
3.
9–4.
4,
6.6–
7.3,
4.
2–4.
5,
5.6–
5.9,
1.
9–2.
5,
1.5–
1.7,
5.
9–6.
3,
n=
33
n=33
n=
33
n=33
n=
33
n=33
n=
33
C. p
. pum
ilus
Mas
saw
a, E
ritre
a Le
ctot
ype
(SM
F 43
11)
4.0
7.0
4.3
5.8
2.6
1.7
6.2
Sexe
s com
bine
d 4.
1 ±
0.14
7.
2 ±
0.08
4.
5 ±
0.12
5.
9 ±
0.12
2.
6 ±
0.05
1.
8 ±
0.05
6.
4 ±
0.12
3.9–
4.3,
7.
0–7.
2,
4.3–
4.6,
5.
8–6.
1,
2.5–
2.6,
1.
7–1.
8,
6.2–
6.5,
n=6
n=6
n=6
n=6
n=6
n=6
n=6
C. p
umilu
s sub
sp?
Ken
ya
Adu
lt m
ales
4.
9 ±
0.22
7.
6 ±
0.32
4.
8 ±
0.25
6.
4 ±
0.23
2.
8 ±
0.18
1.
8 ±
0.12
6.
9 ±
0.21
4.
5–5.
3,
7.1–
8.3,
4.
4–5.
3,
6.0–
6.9,
2.
5–3.
2,
1.7–
2.1,
6.
5–7.
5,
n=
23
n=24
n=
24
n=24
n=
22
n=24
n=
24
Adu
lt fe
mal
es
4.6
± 0.
21
7.5
± 0.
26
4.7
± 0.
19
6.3
± 0.
20
2.5
± 0.
17
1.8
± 0.
11
6.7
± 0.
30
4.
1–5.
2,
7.0–
8.0,
4.
3–5.
1,
5.9–
6.7,
2.
2–2.
9,
1.6–
2.1,
5.
4–7.
4,
n=
38
n=38
n=
38
n=38
n=
38
n=38
n=
38
Sout
h A
fric
a A
dult
mal
es
4.8
± 0.
17
7.7
± 0.
23
4.7
± 0.
10
6.4
± 0.
16
2.9
± 0.
16
1.7
± 0.
05
6.9
± 0.
20
4.6–
5.0,
7.
2–7.
9,
4.5–
4.8,
6.
2–6.
6,
2.7–
3.1,
1.
7–1.
8,
6.6–
7.2,
n=7
n=7
n=7
n=7
n=7
n=7
n=7
Adu
lt fe
mal
es
4.6
± 0.
17
7.6
± 0.
17
4.7
± 0.
13
6.4
± 0.
10
2.7
± 0.
15
1.8
± 0.
09
6.8
± 0.
11
4.
3–4.
9,
7.3–
7.8,
4.
5–4.
8,
6.2–
6.5,
2.
5–2.
9,
1.6–
1.9,
6.
7–7.
0,
n=
9 n=
9 n=
9 n=
9 n=
8 n=
9 n=
9 __
____
____
____
____
____
____
____
____
____
____
____
____
____
____
____
____
____
____
____
____
____
____
____
____
____
____
____
____
___
TERMS OF USEThis pdf is provided by Magnolia Press for private/research use. Commercial sale or deposition in a public library or website is prohibited.
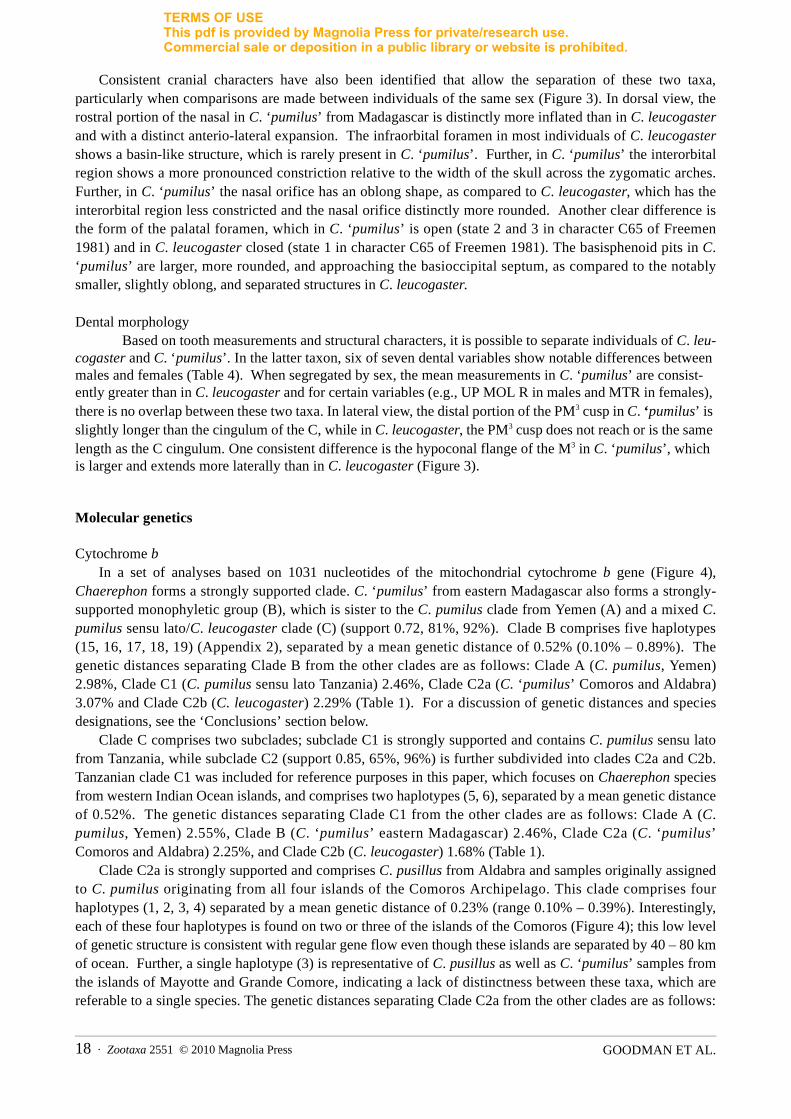
GOODMAN ET AL.18 · Zootaxa 2551 © 2010 Magnolia Press
Consistent cranial characters have also been identified that allow the separation of these two taxa,particularly when comparisons are made between individuals of the same sex (Figure 3). In dorsal view, therostral portion of the nasal in C. ‘pumilus’ from Madagascar is distinctly more inflated than in C. leucogasterand with a distinct anterio-lateral expansion. The infraorbital foramen in most individuals of C. leucogastershows a basin-like structure, which is rarely present in C. ‘pumilus’. Further, in C. ‘pumilus’ the interorbitalregion shows a more pronounced constriction relative to the width of the skull across the zygomatic arches.Further, in C. ‘pumilus’ the nasal orifice has an oblong shape, as compared to C. leucogaster, which has theinterorbital region less constricted and the nasal orifice distinctly more rounded. Another clear difference isthe form of the palatal foramen, which in C. ‘pumilus’ is open (state 2 and 3 in character C65 of Freemen1981) and in C. leucogaster closed (state 1 in character C65 of Freemen 1981). The basisphenoid pits in C.‘pumilus’ are larger, more rounded, and approaching the basioccipital septum, as compared to the notablysmaller, slightly oblong, and separated structures in C. leucogaster.
Dental morphologyBased on tooth measurements and structural characters, it is possible to separate individuals of C. leu-
cogaster and C. ‘pumilus’. In the latter taxon, six of seven dental variables show notable differences between males and females (Table 4). When segregated by sex, the mean measurements in C. ‘pumilus’ are consist-ently greater than in C. leucogaster and for certain variables (e.g., UP MOL R in males and MTR in females), there is no overlap between these two taxa. In lateral view, the distal portion of the PM3 cusp in C. ‘pumilus’ is slightly longer than the cingulum of the C, while in C. leucogaster, the PM3 cusp does not reach or is the same length as the C cingulum. One consistent difference is the hypoconal flange of the M3 in C. ‘pumilus’, which is larger and extends more laterally than in C. leucogaster (Figure 3).
Molecular genetics
Cytochrome bIn a set of analyses based on 1031 nucleotides of the mitochondrial cytochrome b gene (Figure 4),
Chaerephon forms a strongly supported clade. C. ‘pumilus’ from eastern Madagascar also forms a strongly-supported monophyletic group (B), which is sister to the C. pumilus clade from Yemen (A) and a mixed C.pumilus sensu lato/C. leucogaster clade (C) (support 0.72, 81%, 92%). Clade B comprises five haplotypes(15, 16, 17, 18, 19) (Appendix 2), separated by a mean genetic distance of 0.52% (0.10% – 0.89%). Thegenetic distances separating Clade B from the other clades are as follows: Clade A (C. pumilus, Yemen)2.98%, Clade C1 (C. pumilus sensu lato Tanzania) 2.46%, Clade C2a (C. ‘pumilus’ Comoros and Aldabra)3.07% and Clade C2b (C. leucogaster) 2.29% (Table 1). For a discussion of genetic distances and speciesdesignations, see the ‘Conclusions’ section below.
Clade C comprises two subclades; subclade C1 is strongly supported and contains C. pumilus sensu latofrom Tanzania, while subclade C2 (support 0.85, 65%, 96%) is further subdivided into clades C2a and C2b.Tanzanian clade C1 was included for reference purposes in this paper, which focuses on Chaerephon speciesfrom western Indian Ocean islands, and comprises two haplotypes (5, 6), separated by a mean genetic distanceof 0.52%. The genetic distances separating Clade C1 from the other clades are as follows: Clade A (C.pumilus, Yemen) 2.55%, Clade B (C. ‘pumilus’ eastern Madagascar) 2.46%, Clade C2a (C. ‘pumilus’Comoros and Aldabra) 2.25%, and Clade C2b (C. leucogaster) 1.68% (Table 1).
Clade C2a is strongly supported and comprises C. pusillus from Aldabra and samples originally assignedto C. pumilus originating from all four islands of the Comoros Archipelago. This clade comprises fourhaplotypes (1, 2, 3, 4) separated by a mean genetic distance of 0.23% (range 0.10% – 0.39%). Interestingly,each of these four haplotypes is found on two or three of the islands of the Comoros (Figure 4); this low levelof genetic structure is consistent with regular gene flow even though these islands are separated by 40 – 80 kmof ocean. Further, a single haplotype (3) is representative of C. pusillus as well as C. ‘pumilus’ samples fromthe islands of Mayotte and Grande Comore, indicating a lack of distinctness between these taxa, which arereferable to a single species. The genetic distances separating Clade C2a from the other clades are as follows:
TERMS OF USEThis pdf is provided by Magnolia Press for private/research use. Commercial sale or deposition in a public library or website is prohibited.
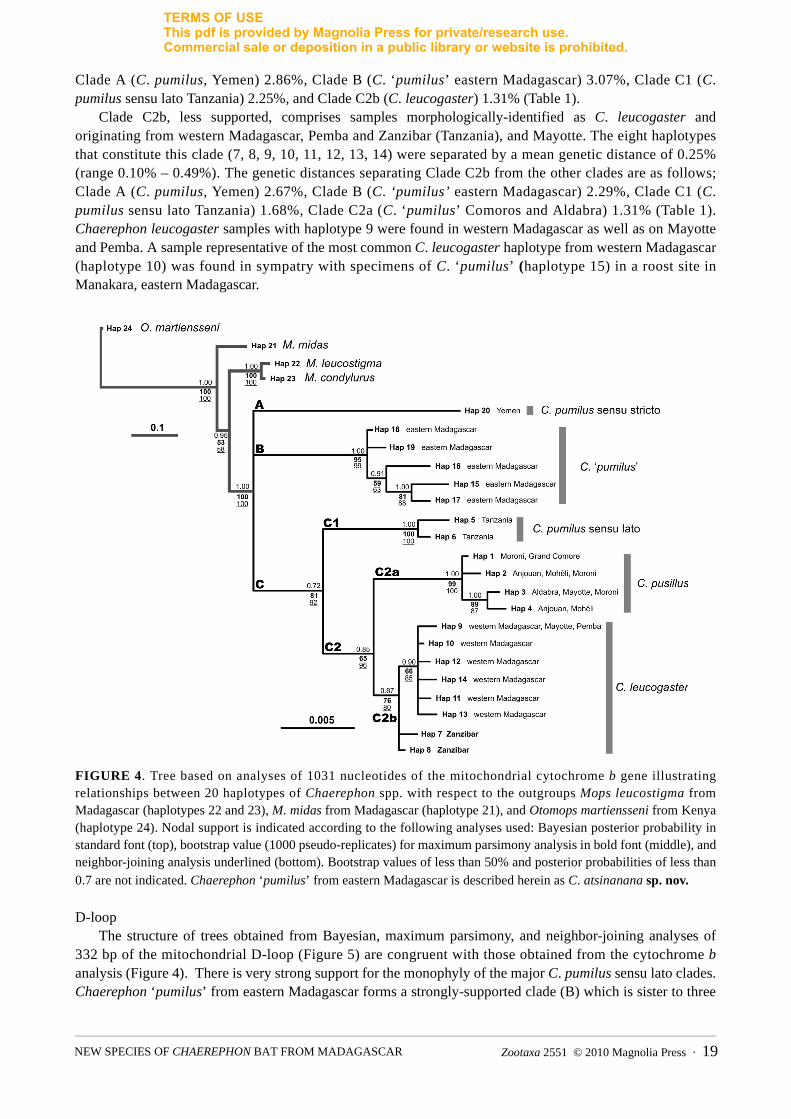
Zootaxa 2551 © 2010 Magnolia Press · 19NEW SPECIES OF CHAEREPHON BAT FROM MADAGASCAR
Clade A (C. pumilus, Yemen) 2.86%, Clade B (C. ‘pumilus’ eastern Madagascar) 3.07%, Clade C1 (C.pumilus sensu lato Tanzania) 2.25%, and Clade C2b (C. leucogaster) 1.31% (Table 1).
Clade C2b, less supported, comprises samples morphologically-identified as C. leucogaster andoriginating from western Madagascar, Pemba and Zanzibar (Tanzania), and Mayotte. The eight haplotypesthat constitute this clade (7, 8, 9, 10, 11, 12, 13, 14) were separated by a mean genetic distance of 0.25%(range 0.10% – 0.49%). The genetic distances separating Clade C2b from the other clades are as follows;Clade A (C. pumilus, Yemen) 2.67%, Clade B (C. ‘pumilus’ eastern Madagascar) 2.29%, Clade C1 (C.pumilus sensu lato Tanzania) 1.68%, Clade C2a (C. ‘pumilus’ Comoros and Aldabra) 1.31% (Table 1).Chaerephon leucogaster samples with haplotype 9 were found in western Madagascar as well as on Mayotteand Pemba. A sample representative of the most common C. leucogaster haplotype from western Madagascar(haplotype 10) was found in sympatry with specimens of C. ‘pumilus’ (haplotype 15) in a roost site inManakara, eastern Madagascar.
FIGURE 4. Tree based on analyses of 1031 nucleotides of the mitochondrial cytochrome b gene illustratingrelationships between 20 haplotypes of Chaerephon spp. with respect to the outgroups Mops leucostigma fromMadagascar (haplotypes 22 and 23), M. midas from Madagascar (haplotype 21), and Otomops martiensseni from Kenya(haplotype 24). Nodal support is indicated according to the following analyses used: Bayesian posterior probability instandard font (top), bootstrap value (1000 pseudo-replicates) for maximum parsimony analysis in bold font (middle), andneighbor-joining analysis underlined (bottom). Bootstrap values of less than 50% and posterior probabilities of less than0.7 are not indicated. Chaerephon ‘pumilus’ from eastern Madagascar is described herein as C. atsinanana sp. nov.
D-loopThe structure of trees obtained from Bayesian, maximum parsimony, and neighbor-joining analyses of
332 bp of the mitochondrial D-loop (Figure 5) are congruent with those obtained from the cytochrome banalysis (Figure 4). There is very strong support for the monophyly of the major C. pumilus sensu lato clades.Chaerephon ‘pumilus’ from eastern Madagascar forms a strongly-supported clade (B) which is sister to three
TERMS OF USEThis pdf is provided by Magnolia Press for private/research use. Commercial sale or deposition in a public library or website is prohibited.
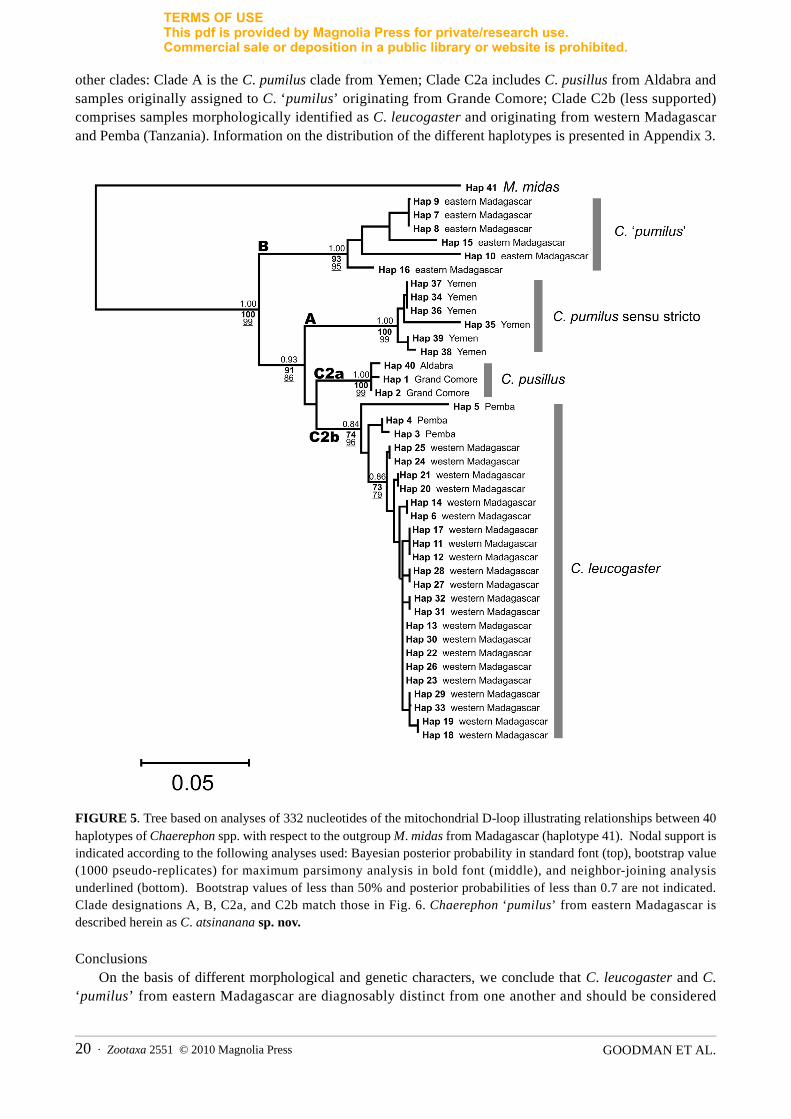
GOODMAN ET AL.20 · Zootaxa 2551 © 2010 Magnolia Press
other clades: Clade A is the C. pumilus clade from Yemen; Clade C2a includes C. pusillus from Aldabra andsamples originally assigned to C. ‘pumilus’ originating from Grande Comore; Clade C2b (less supported)comprises samples morphologically identified as C. leucogaster and originating from western Madagascarand Pemba (Tanzania). Information on the distribution of the different haplotypes is presented in Appendix 3.
FIGURE 5. Tree based on analyses of 332 nucleotides of the mitochondrial D-loop illustrating relationships between 40haplotypes of Chaerephon spp. with respect to the outgroup M. midas from Madagascar (haplotype 41). Nodal support isindicated according to the following analyses used: Bayesian posterior probability in standard font (top), bootstrap value(1000 pseudo-replicates) for maximum parsimony analysis in bold font (middle), and neighbor-joining analysisunderlined (bottom). Bootstrap values of less than 50% and posterior probabilities of less than 0.7 are not indicated.Clade designations A, B, C2a, and C2b match those in Fig. 6. Chaerephon ‘pumilus’ from eastern Madagascar isdescribed herein as C. atsinanana sp. nov.
ConclusionsOn the basis of different morphological and genetic characters, we conclude that C. leucogaster and C.
‘pumilus’ from eastern Madagascar are diagnosably distinct from one another and should be considered
TERMS OF USEThis pdf is provided by Magnolia Press for private/research use. Commercial sale or deposition in a public library or website is prohibited.
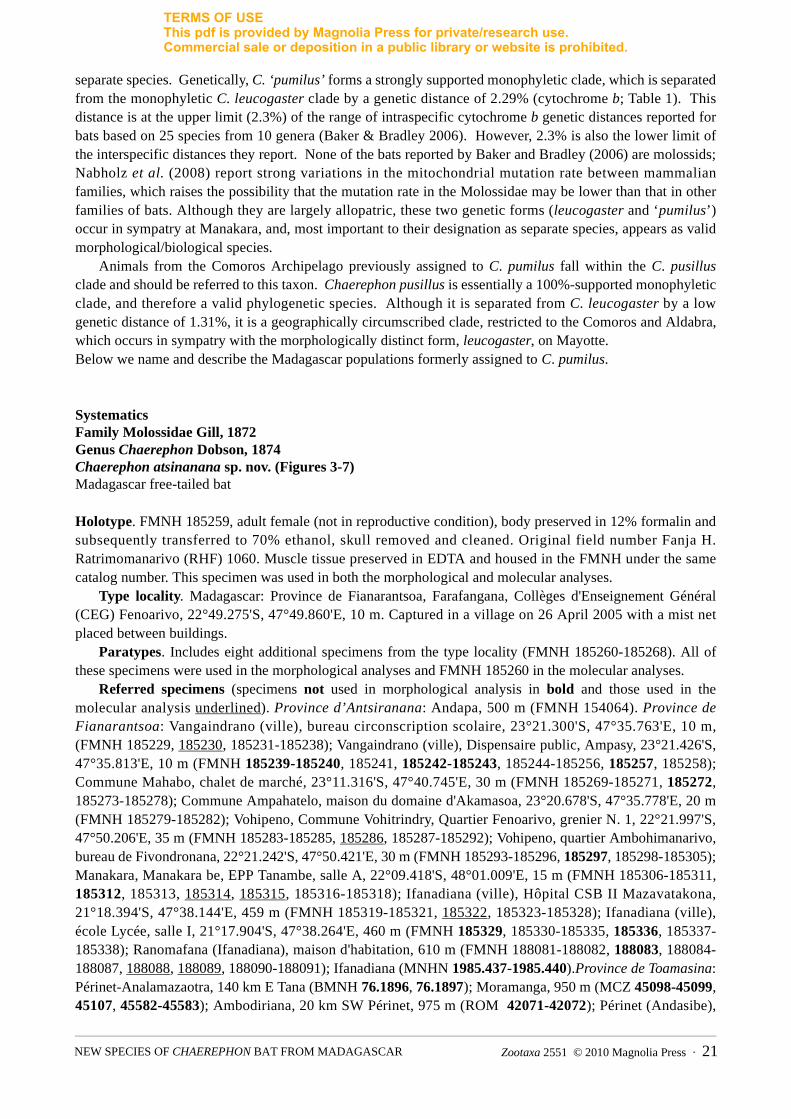
Zootaxa 2551 © 2010 Magnolia Press · 21NEW SPECIES OF CHAEREPHON BAT FROM MADAGASCAR
separate species. Genetically, C. ‘pumilus’ forms a strongly supported monophyletic clade, which is separatedfrom the monophyletic C. leucogaster clade by a genetic distance of 2.29% (cytochrome b; Table 1). Thisdistance is at the upper limit (2.3%) of the range of intraspecific cytochrome b genetic distances reported forbats based on 25 species from 10 genera (Baker & Bradley 2006). However, 2.3% is also the lower limit ofthe interspecific distances they report. None of the bats reported by Baker and Bradley (2006) are molossids;Nabholz et al. (2008) report strong variations in the mitochondrial mutation rate between mammalianfamilies, which raises the possibility that the mutation rate in the Molossidae may be lower than that in otherfamilies of bats. Although they are largely allopatric, these two genetic forms (leucogaster and ‘pumilus’)occur in sympatry at Manakara, and, most important to their designation as separate species, appears as validmorphological/biological species.
Animals from the Comoros Archipelago previously assigned to C. pumilus fall within the C. pusillusclade and should be referred to this taxon. Chaerephon pusillus is essentially a 100%-supported monophyleticclade, and therefore a valid phylogenetic species. Although it is separated from C. leucogaster by a lowgenetic distance of 1.31%, it is a geographically circumscribed clade, restricted to the Comoros and Aldabra,which occurs in sympatry with the morphologically distinct form, leucogaster, on Mayotte. Below we name and describe the Madagascar populations formerly assigned to C. pumilus.
SystematicsFamily Molossidae Gill, 1872Genus Chaerephon Dobson, 1874Chaerephon atsinanana sp. nov. (Figures 3-7)Madagascar free-tailed bat
Holotype. FMNH 185259, adult female (not in reproductive condition), body preserved in 12% formalin andsubsequently transferred to 70% ethanol, skull removed and cleaned. Original field number Fanja H.Ratrimomanarivo (RHF) 1060. Muscle tissue preserved in EDTA and housed in the FMNH under the samecatalog number. This specimen was used in both the morphological and molecular analyses.
Type locality. Madagascar: Province de Fianarantsoa, Farafangana, Collèges d'Enseignement Général(CEG) Fenoarivo, 22°49.275'S, 47°49.860'E, 10 m. Captured in a village on 26 April 2005 with a mist netplaced between buildings.
Paratypes. Includes eight additional specimens from the type locality (FMNH 185260-185268). All ofthese specimens were used in the morphological analyses and FMNH 185260 in the molecular analyses.
Referred specimens (specimens not used in morphological analysis in bold and those used in themolecular analysis underlined). Province d’Antsiranana: Andapa, 500 m (FMNH 154064). Province deFianarantsoa: Vangaindrano (ville), bureau circonscription scolaire, 23°21.300'S, 47°35.763'E, 10 m,(FMNH 185229, 185230, 185231-185238); Vangaindrano (ville), Dispensaire public, Ampasy, 23°21.426'S,47°35.813'E, 10 m (FMNH 185239-185240, 185241, 185242-185243, 185244-185256, 185257, 185258);Commune Mahabo, chalet de marché, 23°11.316'S, 47°40.745'E, 30 m (FMNH 185269-185271, 185272,185273-185278); Commune Ampahatelo, maison du domaine d'Akamasoa, 23°20.678'S, 47°35.778'E, 20 m(FMNH 185279-185282); Vohipeno, Commune Vohitrindry, Quartier Fenoarivo, grenier N. 1, 22°21.997'S,47°50.206'E, 35 m (FMNH 185283-185285, 185286, 185287-185292); Vohipeno, quartier Ambohimanarivo,bureau de Fivondronana, 22°21.242'S, 47°50.421'E, 30 m (FMNH 185293-185296, 185297, 185298-185305);Manakara, Manakara be, EPP Tanambe, salle A, 22°09.418'S, 48°01.009'E, 15 m (FMNH 185306-185311,185312, 185313, 185314, 185315, 185316-185318); Ifanadiana (ville), Hôpital CSB II Mazavatakona,21°18.394'S, 47°38.144'E, 459 m (FMNH 185319-185321, 185322, 185323-185328); Ifanadiana (ville),école Lycée, salle I, 21°17.904'S, 47°38.264'E, 460 m (FMNH 185329, 185330-185335, 185336, 185337-185338); Ranomafana (Ifanadiana), maison d'habitation, 610 m (FMNH 188081-188082, 188083, 188084-188087, 188088, 188089, 188090-188091); Ifanadiana (MNHN 1985.437-1985.440).Province de Toamasina:Périnet-Analamazaotra, 140 km E Tana (BMNH 76.1896, 76.1897); Moramanga, 950 m (MCZ 45098-45099,45107, 45582-45583); Ambodiriana, 20 km SW Périnet, 975 m (ROM 42071-42072); Périnet (Andasibe),
TERMS OF USEThis pdf is provided by Magnolia Press for private/research use. Commercial sale or deposition in a public library or website is prohibited.
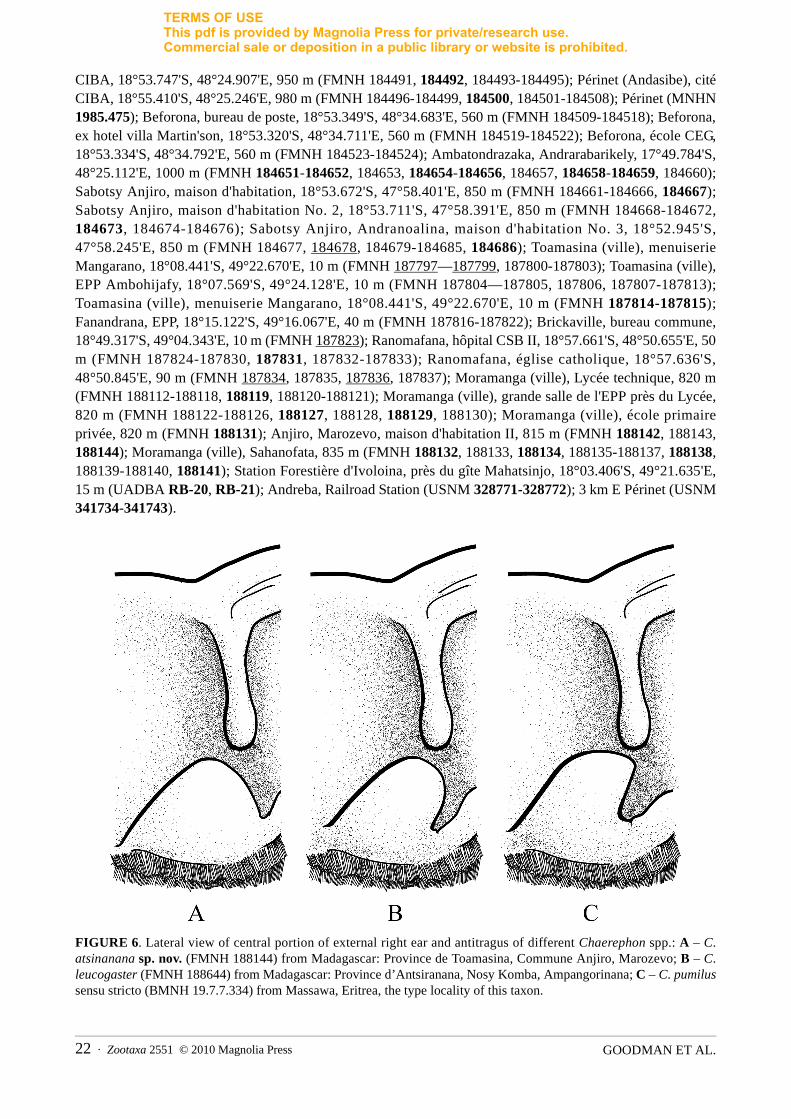
GOODMAN ET AL.22 · Zootaxa 2551 © 2010 Magnolia Press
CIBA, 18°53.747'S, 48°24.907'E, 950 m (FMNH 184491, 184492, 184493-184495); Périnet (Andasibe), citéCIBA, 18°55.410'S, 48°25.246'E, 980 m (FMNH 184496-184499, 184500, 184501-184508); Périnet (MNHN1985.475); Beforona, bureau de poste, 18°53.349'S, 48°34.683'E, 560 m (FMNH 184509-184518); Beforona,ex hotel villa Martin'son, 18°53.320'S, 48°34.711'E, 560 m (FMNH 184519-184522); Beforona, école CEG,18°53.334'S, 48°34.792'E, 560 m (FMNH 184523-184524); Ambatondrazaka, Andrarabarikely, 17°49.784'S,48°25.112'E, 1000 m (FMNH 184651-184652, 184653, 184654-184656, 184657, 184658-184659, 184660);Sabotsy Anjiro, maison d'habitation, 18°53.672'S, 47°58.401'E, 850 m (FMNH 184661-184666, 184667);Sabotsy Anjiro, maison d'habitation No. 2, 18°53.711'S, 47°58.391'E, 850 m (FMNH 184668-184672,184673, 184674-184676); Sabotsy Anjiro, Andranoalina, maison d'habitation No. 3, 18°52.945'S,47°58.245'E, 850 m (FMNH 184677, 184678, 184679-184685, 184686); Toamasina (ville), menuiserieMangarano, 18°08.441'S, 49°22.670'E, 10 m (FMNH 187797—187799, 187800-187803); Toamasina (ville),EPP Ambohijafy, 18°07.569'S, 49°24.128'E, 10 m (FMNH 187804—187805, 187806, 187807-187813);Toamasina (ville), menuiserie Mangarano, 18°08.441'S, 49°22.670'E, 10 m (FMNH 187814-187815);Fanandrana, EPP, 18°15.122'S, 49°16.067'E, 40 m (FMNH 187816-187822); Brickaville, bureau commune,18°49.317'S, 49°04.343'E, 10 m (FMNH 187823); Ranomafana, hôpital CSB II, 18°57.661'S, 48°50.655'E, 50m (FMNH 187824-187830, 187831, 187832-187833); Ranomafana, église catholique, 18°57.636'S,48°50.845'E, 90 m (FMNH 187834, 187835, 187836, 187837); Moramanga (ville), Lycée technique, 820 m(FMNH 188112-188118, 188119, 188120-188121); Moramanga (ville), grande salle de l'EPP près du Lycée,820 m (FMNH 188122-188126, 188127, 188128, 188129, 188130); Moramanga (ville), école primaireprivée, 820 m (FMNH 188131); Anjiro, Marozevo, maison d'habitation II, 815 m (FMNH 188142, 188143,188144); Moramanga (ville), Sahanofata, 835 m (FMNH 188132, 188133, 188134, 188135-188137, 188138,188139-188140, 188141); Station Forestière d'Ivoloina, près du gîte Mahatsinjo, 18°03.406'S, 49°21.635'E,15 m (UADBA RB-20, RB-21); Andreba, Railroad Station (USNM 328771-328772); 3 km E Périnet (USNM341734-341743).
FIGURE 6. Lateral view of central portion of external right ear and antitragus of different Chaerephon spp.: A – C.atsinanana sp. nov. (FMNH 188144) from Madagascar: Province de Toamasina, Commune Anjiro, Marozevo; B – C.leucogaster (FMNH 188644) from Madagascar: Province d’Antsiranana, Nosy Komba, Ampangorinana; C – C. pumilussensu stricto (BMNH 19.7.7.334) from Massawa, Eritrea, the type locality of this taxon.
TERMS OF USEThis pdf is provided by Magnolia Press for private/research use. Commercial sale or deposition in a public library or website is prohibited.
Zootaxa 2551 © 2010 Magnolia Press · 23NEW SPECIES OF CHAEREPHON BAT FROM MADAGASCAR
Etymology. The name atsinanana is derived from the Malagasy word meaning “from the east.”Diagnosis. A relatively small molossid bat with a forearm of 37-42 mm. The ears are notably shorter than
the head and they are united by a short band of skin. The antitragus is large and broad, the anterior marginslightly angled and posterior margin rounded, and blunt tip (Figure 6a). The tragus has a broad attachment.Skull and mandible relatively large for a small member of Chaerephon. The nasal is inflated and in dorsalview, the rostrum is expanded anterior-laterally (Figure 3). The cranial portion of the frontal, parietal, andsupraoccipital, as well as the squamosal, are inflated. The basisphenoid pits are large, deep, slightly oval, andapproaching the basioccipital septum. Basioccipital pits are either not present or indistinct. Palatal foramen isopen, but not forming a deep cleft. The individual teeth, particularly molariform, relatively robust. The P3 isprominent and aligned towards the outer margin of the toothrow. Lingual portion of upper molariform teethelongated, particularly the hypoconal flange of M1, the paracone and hypoconal flange of M2, and thehypoconal flange in M3.
Given present taxon and character sampling, the species is further diagnosed by the following strictsynapomorphies in the cytochrome b gene (the first nucleotide given is the ancestral state, followed by thenucleotide position in the cytochrome b gene, followed by the derived state; substitutions that result in anamino acid change are indicated in bold text): Hap 15: C108T, A126T, A147G, A238T, T282C, T309C, T351C, C352T, A516G, C573T, T579C, G709A,G711A, A753G, A1020G, G1038A, C1101T, G1104A. Hap 16 and 19: C108T, A238T, T282C, T309C, T351C, C573T, T579C, G711A, A1020G, G1038A, C1101T,G1104A. Hap 17: C108T, A147G, A238T, T282C, T309C, T351C, C352T, C573T, T579C, G711A, A753G, A1020C,G1038A, C1101T, G1104A. Hap 18: C108T, A238T, T282C, T309C, T351C, C573T, T579C, G711A, A1020G, G1038A, C1101T,G1104A.
Sympatrically occurring Molossidae. At the holotype site in Farafangana near the Collègesd'Enseignement Général (CEG) Fenoarivo, only C. atsinanana was captured, but Mops leucostigma was alsofound in this village. Across the range of C. atsinanana, it is known to occur in sympatry, in virtually all casesin synanthropic settings, with C. leucogaster (at Manakara [Ratrimomanarivo et al. 2009a]), Mormopterusjugularis (Ratrimomanarivo et al. 2009b), and Mops leucostigma (Ratrimomanarivo et al. 2008).
Description. The lectotype of nominate pumilus (SMF 4311, an adult female based on the examination ofthe specimen’s external genitalia) from Massawa, Eritrea, has a partially damaged skull, while otherspecimens from the type series collected in Massawa, particularly SMF 11918, are in excellent condition. Inthe Senckenberg Museum, these specimens were compared to USNM 38032 (an adult female), also fromMassawa, and all are morphologically similar with the exception of some subtle differences that are bestconsidered falling within the range of intraspecific variation. In subsequent comparisons, USNM 38032 wasused to represent the cranial and dental character states in nominate pumilus.
External characters. The forearm length of the lectotype of nominate pumilus (SMF 4311) taken from theoutstretched wing of the mounted specimen measured 38.6 mm. This falls within the range of C. atsinanana.Given the style of preparation and the state of the specimens, it was difficult to compare USNM 143167 orindividuals of C. atsinanana to the type series of nominate pumilus in the SMF. Herein, comparisons arebased on the specimens from Eritrea, Saati - USNM 143167 (an adult male) and from Massawa - USNM143168, USNM 38032, and BMNH 19.7.7.3347 (all females) from Massawa.
On the basis of the material available, in fluid preserved specimens of nominate pumilus and C.atsinanana, the fleshy portion of the ears, including the band connecting them, have similar morphology.However, the antitragus of C. atsinanana is notably broad, with an angular anterior edge, and terminating witha rectangular-blunt tip, while in nominate pumilus the structure is less thickset, with a less angular anteriormargin, more angular posterior margin, and slightly rounded tip (Figure 6). Further, the short tragus in C.atsinanana is distinctly broader and with an extensive portion attaching to the ear, compared to nominatepumilus that has a narrower articular surface (not illustrated). In C. leucogaster, the antitragus is small,proportionately not wide, the two lateral margins being largely similar in shape, and terminates with a rounded
TERMS OF USEThis pdf is provided by Magnolia Press for private/research use. Commercial sale or deposition in a public library or website is prohibited.
GOODMAN ET AL.24 · Zootaxa 2551 © 2010 Magnolia Press
edge and in C. atsinanana it is notably larger and broader, anterior margin slightly angled and posteriormargin rounded, and blunt tipped (Figure 6). The tragus of C. leucogaster is slightly longer and narrower atthe base than the shorter and broader structure in C. atsinanana.
The dorsum, throat, and chest in C. leucogaster is dark brown, as compared to C. atsinanana with ablackish-brown dorsum, brown throat, and dark brown chest; in the latter taxon there is considerable variation(Figure 7). The abdomen in C. leucogaster tends to have a large whitish area, although in a few individualsthis is not extensive and restricted to the mid-ventral area, while in C. atsinanana the venter is a dark brownand in a few rare cases, there is a small white mid-ventral patch. In general, C. atsinanana have a distinctwhitish or beige strip of hairs at the base of the wings (plagiopatagium), also found in most African animalsassigned to C. pumilus, although considerable intraspecific variation can be found on Madagascar withinadults of the same population (Figure 7). This pelage trait is largely unknown from Malagasy C. leucogaster.
Skull and dentition. The skull of C. atsinanana is notably more massive than in nominate pumilus (Figure3). In all cases, the average skull measurements of C. atsinanana are larger than those of nominate pumilusand for certain variables (GSL, CON INCI, MASTOID), there is no overlap in measurements between thesetwo species (Table 3).
In dorsal view, there is a notable inflation of the nasal in C. atsinanana as compared to nominate pumilus(Figure 3), resulting in a distinct antero-lateral expansion of this portion of the rostrum. When examined froma lateral view, the lacrimal ridge has a more angular shape in nominate pumilus, particularly along the faciesorbitalis of the frontal. Further, in C. atsinanana the cranial portion of the frontal, parietal, and supraoccipital,as well as the squamosal, are notably more inflated than in nominate pumilus. In ventral view, thebasisphenoid pits in C. atsinanana are larger, deeper, slightly oval, and approaching the basioccipital septum;this is in contrast to the notably smaller, shallower, rounded, and separated structures in nominate pumilus(Figure 3). Further, in nominate pumilus shallow basioccipital pits are present and these structures are veryindistinct or absent in C. atsinanana. The form of the palatal foramen in the two taxa is similar, being open(state 2 or 3 in character C65 of Freemen 1981), but not with a deep cleft. Some caution is needed whenassessing this character, as certain skulls, which have not been thoroughly cleaned, particularly withDermestidae beetles, retain remnant tissue and cartilage. A case in point is the holotype of C. atsinanana(Figure 3), in which the remaining attachment between the premaxillae is cartilaginous. This character is alsohighly variable in African populations of C. pumilus (Taylor 1999b).
The condylocanine length (CON CANI) in C. atsinanana is on average longer than in nominate pumilus,but there is broad overlap in measures of the temporal and masseter moment arms of the mandible (MOM1COR, MOM2 ANG) and lower toothrow. The lower molariform teeth in these two taxa have similarmorphology and cusp structure, but the width of individual teeth is wider in C. atsinanana than in nominatepumilus.
With one exception, the average measurements for the dental variables are larger in C. atsinanana than innominate pumilus; the exception is UP CANIN in nominate pumilus (sexes combined), which on average isslightly longer (2.6 mm) than in female C. atsinanana (2.5 mm). Hence, individual molariform teeth in C.atsinanana are distinctly more robust than in nominate pumilus, particularly when comparing adultindividuals of the same sex. The P3 in nominate pumilus is notably reduced in size, being peg-like, and isaligned in the middle of the toothrow, as compared to in C. atsinanana in which this tooth is notably largerand aligned towards the outer margin of the toothrow. In general, the cusp morphology of the uppermolariform teeth of these two species are similar, although in C. atsinanana there is a distinct elongation ofthe portion of the tooth lingual to the commissures, particularly the hypoconal flange of M1 the, the paraconeand hypoconal flange of M2, and the hypoconal flange and more open commissure of M3.
Patterns of morphological variation in members of the C. pumilus complex in the western Indian Ocean.In order to provide further insight into patterns of morphological variation in a multivariable sense of C.atsinanana with other western Indian Ocean islands and east African populations of C. pumilus sensu lato, aPCA analysis was conducted separately for males and females for different cranial and dental variables (Table5). In order to maximize the number of specimens that could be used in these comparisons, a few variableswith numerous cases of missing data were excluded from the analysis. In general, two different groups occur
TERMS OF USEThis pdf is provided by Magnolia Press for private/research use. Commercial sale or deposition in a public library or website is prohibited.
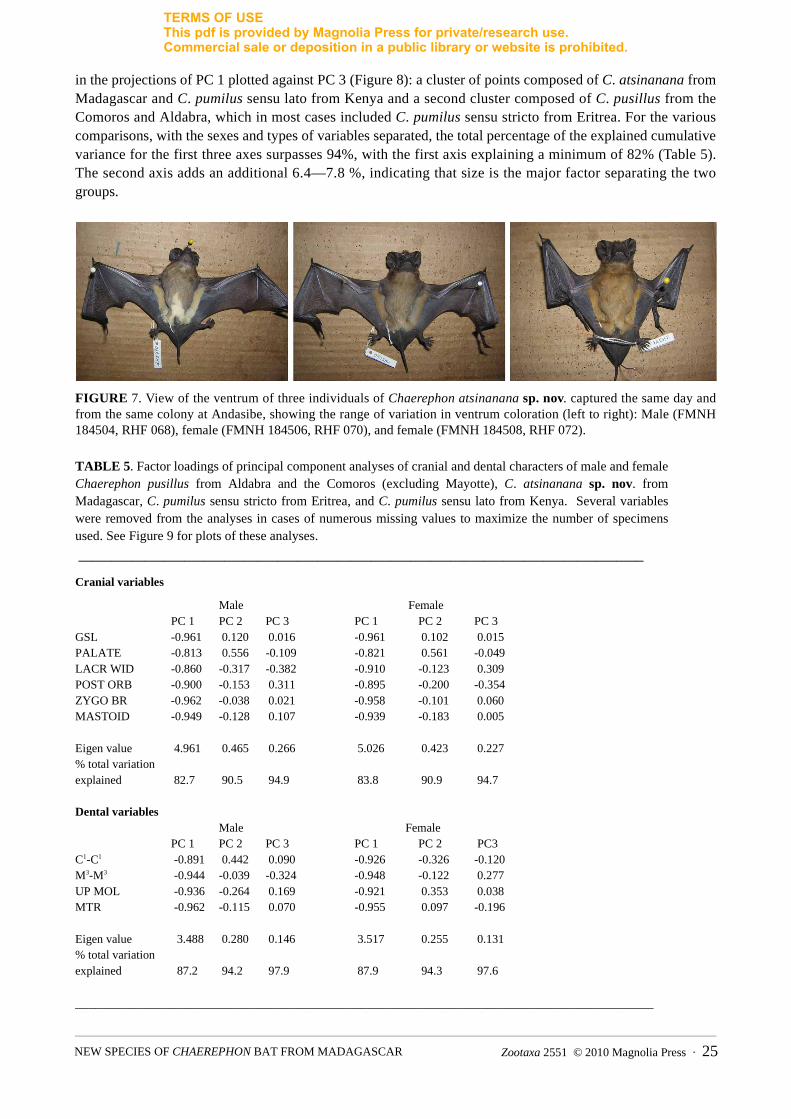
Zootaxa 2551 © 2010 Magnolia Press · 25NEW SPECIES OF CHAEREPHON BAT FROM MADAGASCAR
in the projections of PC 1 plotted against PC 3 (Figure 8): a cluster of points composed of C. atsinanana fromMadagascar and C. pumilus sensu lato from Kenya and a second cluster composed of C. pusillus from theComoros and Aldabra, which in most cases included C. pumilus sensu stricto from Eritrea. For the variouscomparisons, with the sexes and types of variables separated, the total percentage of the explained cumulativevariance for the first three axes surpasses 94%, with the first axis explaining a minimum of 82% (Table 5).The second axis adds an additional 6.4—7.8 %, indicating that size is the major factor separating the twogroups.
FIGURE 7. View of the ventrum of three individuals of Chaerephon atsinanana sp. nov. captured the same day andfrom the same colony at Andasibe, showing the range of variation in ventrum coloration (left to right): Male (FMNH184504, RHF 068), female (FMNH 184506, RHF 070), and female (FMNH 184508, RHF 072).
TABLE 5. Factor loadings of principal component analyses of cranial and dental characters of male and femaleChaerephon pusillus from Aldabra and the Comoros (excluding Mayotte), C. atsinanana sp. nov. fromMadagascar, C. pumilus sensu stricto from Eritrea, and C. pumilus sensu lato from Kenya. Several variableswere removed from the analyses in cases of numerous missing values to maximize the number of specimensused. See Figure 9 for plots of these analyses.
_____________________________________________________________________________________
Cranial variables
Male FemalePC 1 PC 2 PC 3 PC 1 PC 2 PC 3
GSL -0.961 0.120 0.016 -0.961 0.102 0.015PALATE -0.813 0.556 -0.109 -0.821 0.561 -0.049LACR WID -0.860 -0.317 -0.382 -0.910 -0.123 0.309POST ORB -0.900 -0.153 0.311 -0.895 -0.200 -0.354ZYGO BR -0.962 -0.038 0.021 -0.958 -0.101 0.060MASTOID -0.949 -0.128 0.107 -0.939 -0.183 0.005
Eigen value 4.961 0.465 0.266 5.026 0.423 0.227% total variationexplained 82.7 90.5 94.9 83.8 90.9 94.7
Dental variablesMale Female
PC 1 PC 2 PC 3 PC 1 PC 2 PC3C1-C1 -0.891 0.442 0.090 -0.926 -0.326 -0.120M3-M3 -0.944 -0.039 -0.324 -0.948 -0.122 0.277UP MOL -0.936 -0.264 0.169 -0.921 0.353 0.038MTR -0.962 -0.115 0.070 -0.955 0.097 -0.196
Eigen value 3.488 0.280 0.146 3.517 0.255 0.131% total variationexplained 87.2 94.2 97.9 87.9 94.3 97.6
_______________________________________________________________________________________
TERMS OF USEThis pdf is provided by Magnolia Press for private/research use. Commercial sale or deposition in a public library or website is prohibited.
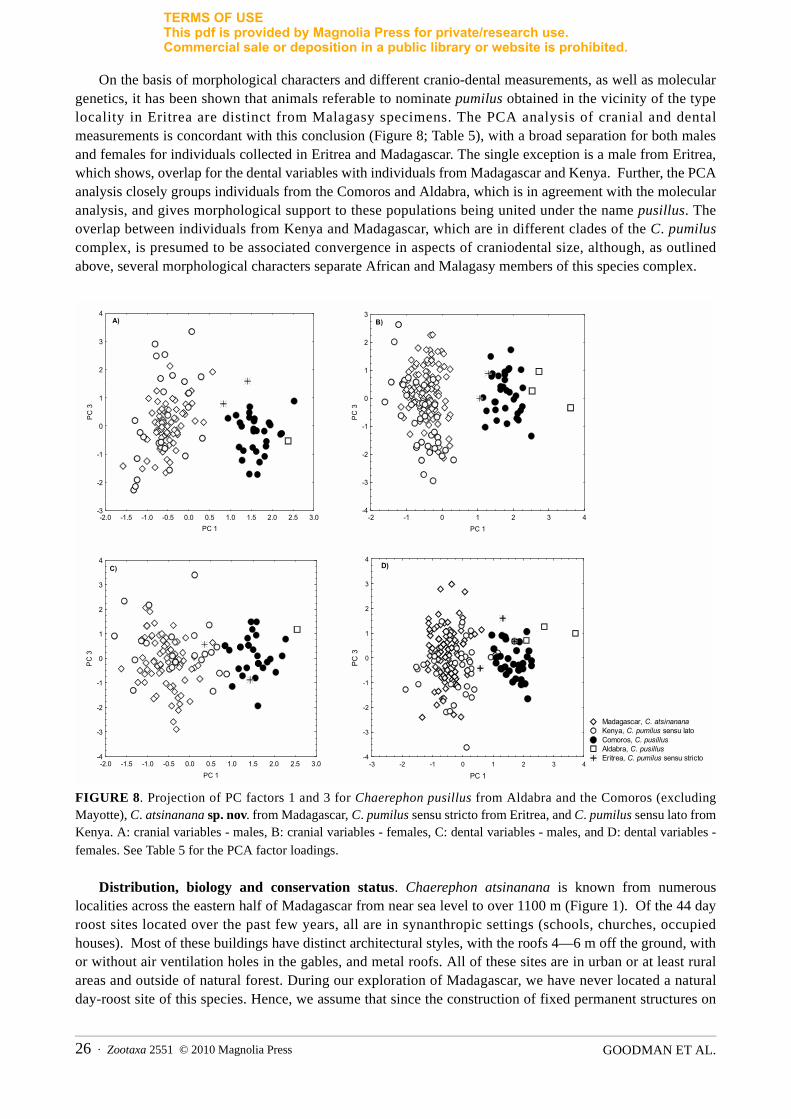
GOODMAN ET AL.26 · Zootaxa 2551 © 2010 Magnolia Press
On the basis of morphological characters and different cranio-dental measurements, as well as moleculargenetics, it has been shown that animals referable to nominate pumilus obtained in the vicinity of the typelocality in Eritrea are distinct from Malagasy specimens. The PCA analysis of cranial and dentalmeasurements is concordant with this conclusion (Figure 8; Table 5), with a broad separation for both malesand females for individuals collected in Eritrea and Madagascar. The single exception is a male from Eritrea,which shows, overlap for the dental variables with individuals from Madagascar and Kenya. Further, the PCAanalysis closely groups individuals from the Comoros and Aldabra, which is in agreement with the molecularanalysis, and gives morphological support to these populations being united under the name pusillus. Theoverlap between individuals from Kenya and Madagascar, which are in different clades of the C. pumiluscomplex, is presumed to be associated convergence in aspects of craniodental size, although, as outlinedabove, several morphological characters separate African and Malagasy members of this species complex.
FIGURE 8. Projection of PC factors 1 and 3 for Chaerephon pusillus from Aldabra and the Comoros (excludingMayotte), C. atsinanana sp. nov. from Madagascar, C. pumilus sensu stricto from Eritrea, and C. pumilus sensu lato fromKenya. A: cranial variables - males, B: cranial variables - females, C: dental variables - males, and D: dental variables -females. See Table 5 for the PCA factor loadings.
Distribution, biology and conservation status. Chaerephon atsinanana is known from numerouslocalities across the eastern half of Madagascar from near sea level to over 1100 m (Figure 1). Of the 44 dayroost sites located over the past few years, all are in synanthropic settings (schools, churches, occupiedhouses). Most of these buildings have distinct architectural styles, with the roofs 4—6 m off the ground, withor without air ventilation holes in the gables, and metal roofs. All of these sites are in urban or at least ruralareas and outside of natural forest. During our exploration of Madagascar, we have never located a naturalday-roost site of this species. Hence, we assume that since the construction of fixed permanent structures on
-2 -1 0 1 2 3 4PC 1
-4
-3
-2
-1
0
1
2
3
PC
3
B)
-2.0 -1.5 -1.0 -0.5 0.0 0.5 1.0 1.5 2.0 2.5 3.0PC 1
-3
-2
-1
0
1
2
3
4
PC
3
A)
-2.0 -1.5 -1.0 -0.5 0.0 0.5 1.0 1.5 2.0 2.5 3.0PC 1
-4
-3
-2
-1
0
1
2
3
4
PC
3
C)
Madagascar, C. atsinanana Kenya, C. pumilus sensu lato Comoros, C. pusillus Aldabra, C. pusillus Eritrea, C. pumilus sensu stricto
-3 -2 -1 0 1 2 3 4
PC 1
-4
-3
-2
-1
0
1
2
3
4
PC 3
D)
TERMS OF USEThis pdf is provided by Magnolia Press for private/research use. Commercial sale or deposition in a public library or website is prohibited.
Zootaxa 2551 © 2010 Magnolia Press · 27NEW SPECIES OF CHAEREPHON BAT FROM MADAGASCAR
the island, within the past hundred years or so, local populations of this species have increased and itsdistribution may have concordantly expanded. While there is some evidence of hunting of this species forbush-meat (Goodman et al. 2008), it is remarkably adaptable to human transformation of the naturallandscapes of the island (Harper et al. 2007) and occupying buildings for day roosts. Hence, there is noimmediate conservation concern associated with the short or medium-term future of C. atsinanana. The sameholds true for C. pusillus from the Comoros, which particularly on Mohéli, Grande Comoro, and Anjouan areabundant in certain architectural styles of abandoned or occupied buildings. In contrast, C. pusillus from thewestern Seychelles, specifically Aldabra Atoll, is not known to occupy the few buildings on the island,indicating that day roost sites might be more limited.
Taxonomic conclusionsSeveral authors have underlined that the current taxonomical classification of the Chaerephon pumilus
sensu lato complex, as a single species, does not reflect the evolutionary history of this group (e.g., Simmons2005; Taylor et al. 2009). Here, based on the isolation of DNA from a tissue sample recovered from an olderspecimen collected at the type locality (Massawa, Eritrea), we were able to establish which clade represents C.pumilus sensu stricto. Thereafter, with a combination of molecular genetics and morphological charactersseveral different aspects could be established: 1) C. leucogaster, which is genetically nested within C. pumilussensu lato, was diagnostically distinct to animals classically referred to C. pumilus from eastern Madagascarand at one site on the island they are known to occur in sympatry; 2) subsequently, to refer all of the animalswithin the C. pumilus sensu lato clade to a single species was not concordant to phylogenetic patterns and itwas necessary to consider the Malagasy population of C. ‘pumilus’ as a separate evolutionary unit; and 3) arange of morphological characters allow the separation of Malagasy animals from nominate pumilus and theMalagasy animals are described herein as a new species to science, C. atsinanana. Another important aspectis that size alone, specifically associated with cranio-dental measurements, should not be used as a taxonomiccharacter, as an overlay of the phylogenetic results and morphological results indicate, for example, thatsimilarities in size between C. atsinanana and C. pumilus from Kenya is convergent. The research presentedherein is the first step in resolving a portion of the evolutionary history of the C. pumilus species complex.
Movements of volant animals between continental areas and western Indian Ocean islands Even though numerous islands in the western Indian Ocean are several hundred kilometers from the
nearest continental landmass, there is evidence for different animal groups of regular migration and irregularmovements. This is at least in part associated with seasonal wind patterns of the Inter-Tropical ConvergenceZone (ITCZ) (Anderson 2009; Dijkstra 2007; Pedgley et al. 1995). Evidence for movements of bats betweenAfrica and Madagascar can be found in the molossid Mops midas, which was formerly thought to havedistinctive African and Malagasy populations. Recent research shows no morphological or geneticdifferentiation between these populations (Ratrimomanarivo et al. 2007) and either movements of these batsacross the Mozambique Channel or recent colonization of Madagascar can best explain this observation.Although the Comoros Archipelago is separated from the nearest portion of Madagascar by about 300 km ofopen water, several molossids are shared between these two areas (M. leucostigma and Chaerephonleucogaster) and show no genetic differences. Hence, these taxa either only recently colonized thisarchipelago or there is at least occasional dispersal movements between Madagascar and the Comoros thatmaintain the genetic similarity. Another example is two small species of Miniopterus (Family Miniopteridae)bats that are shared in common between northern Madagascar and two Comorian islands (Grande Comore andAnjouan) that are morphologically and genetically similar (Goodman et al. 2009; Weyeneth et al. 2008).None of the bat taxa mentioned in this paragraph is known from the outer western Seychelles island ofAldabra, which forms a point of a nearly equilateral triangle between northern Madagascar and the Comoros(Figure 1).
The case presented here for animals of the C. pumilus species complex shows a different pattern in thewestern Indian Ocean from those mentioned above for other bat species. The Malagasy animals, namedherein as a new species endemic to the island, are morphologically and genetically distinct from regional
TERMS OF USEThis pdf is provided by Magnolia Press for private/research use. Commercial sale or deposition in a public library or website is prohibited.
GOODMAN ET AL.28 · Zootaxa 2551 © 2010 Magnolia Press
islands and mainland Africa. The population of C. pusillus from the western Seychelles atoll of Aldabracluster with that of the Comoros, rather than Madagascar. For numerous other species of volant vertebrates(bats and birds), the origin of the Aldabra fauna is mixed between the Comoros and Madagascar (e.g.,Goodman & Ranivo 2008; O’Brien et al. 2009; Pasquet et al. 2007; Warren et al. 2003). Hence, in the case ofthese 9-17 g Chaerephon bats, these water barriers have been associated with the isolation and subsequentdifferentiation of populations after successful dispersal and colonization events. In contrast, within theComoros, there is no apparent genetic structure between with the individual islands, which are separated by40 and 80 km, indicating that this distance is regularly traversed by these bats and giving rise to intra-archipelago panmixia of populations.
The next stepOur definitions of morphological and molecular characters associated with C. pumilus sensu stricto and C.
leucogaster sensu stricto (Ratrimomanarivo et al. 2009a; herein), as well as the delimitation of taxa in the C.pumilus-leucogaster complex from the western Indian Ocean, sets the stage for further resolution of thespecies-complex from the African continent. This is notably complicated by the various named forms withinthis complex that have been placed in synonymy and the need to either obtain sequence data from type seriesor topotypic material to resolve in a taxonomic sense the names that should be applied to the different clades.For example, the status of various small-sized taxa assigned to C. leucogaster from west Africa (see Rosevear1965) needs to be critically evaluated. Additionally, the taxonomic status of the different C. pumilus sensu latoclades identified in Taylor et al. (2009) needs to be assessed in the light of wider molecular sampling andcomparison of other types of data, such as echolocation and karyotypes.
Acknowledgements
Field research conducted by SMG and FR associated with this paper has been generously supported byConservation International (CABS), Fondation Française pour la Recherche sur la Biodiversité, The John T.and Catherine D. MacArthur Foundation, and the Volkswagen Foundation; genetic analyses were financed bythe latter organization. JL and PJT acknowledge financial assistance of the South African National ResearchFoundation (NRF). On Madagascar, we are grateful to the Direction des Eaux et Forêts and AssociationNational pour la Gestion des Aires Protégées and on Aldabra, The Seychelles Island Foundation and Ministryof Environment, Natural Resources and Transport, Division of Nature Conservation for issuing permits toconduct faunal surveys and aid in numerous ways. For assistance in the field, we thank EddyRakotonandrasana, Julie Ranivo, Jirot Rakotomavo, Beza Ramasindrazana, and Jacobin Ranaivo onMadagascar; Manuel Ruedi, Nicole Weyeneth, and Yahaya Ibrahim in the Comoros; and Gérard Rocamoraand Vincent Robert on Aldabra. For providing critical tissue samples from Tanzania and Yemen, we aregrateful to William Stanley and Petr Benda, respectively. For access to specimens under their care, we areindebted to Jean-Marc Pons, Muséum National d’Histoire Naturelle, Paris; Paulina Jenkins, The NaturalHistory Museum, London; Michael D. Carleton and Linda Gordon, National Museum of Natural History,Washington, D. C.; Katrin Krohmann, Senckenberg Museum und Forschungsinstitut, Frankfurt; and FriederMayer, Zoologisches Museum Berlin (Museum für Naturkunde). We are grateful to Paulina Jenkins andAndrew Polaszek for advice on zoological nomenclature. Lucienne Wilmé kindly prepared Figure 1, JohnWeinstein Figure 3, and Charlotte Hammond Figure 6. For comments on an earlier version of this manuscript,we are grateful to Paul Bates, Judith Eger, and Philippe Gaubert.
References
Anderson, R.C. (2009) Do dragonflies migrate across the western Indian Ocean? Journal of Tropical Ecology, 25, 347–358.
Aspetsberger, F., Brandsen, D. & Jacobs, D.S. (2003) Geographical variation in the morphology, echolocation and diet ofthe little free-tailed bat, Chaerephon pumilus (Molossidae). African Zoology, 38, 245–254.
TERMS OF USEThis pdf is provided by Magnolia Press for private/research use. Commercial sale or deposition in a public library or website is prohibited.
Zootaxa 2551 © 2010 Magnolia Press · 29NEW SPECIES OF CHAEREPHON BAT FROM MADAGASCAR
Baker, R.J. & Bradley, R.D. (2006) Speciation in mammals and the genetic species concept. Journal of Mammalogy,87(4), 643–662.
Bates, P.J.J. & Harrison, D.L. (1997) Bats of the Indian Subcontinent. Harrison Zoological Museum, Sevenoaks, Kent,258 pp.
Bickford, D., Lohman, D.J., Sodhi, N.S., Ng, P.K.L., Meier, R., Winker, K., Ingram, K.K. & Das, I. (2006) Crypticspecies as a window on diversity and conservation. Trends in Ecology and Evolution, 22, 148–155.
Bouchard, S. 1998. Chaerephon pumilus. Mammalian Species, 574, 1–6.Csorba, G., Ujhelyi, P. & Thomas, N. (2003) Horseshoe Bats of the World (Chiroptera: Rhinolophidae). Alana Books,
Shropshire, 160 pp.Debaeremaeker, K.R. & Fenton, M.B. (2003) Basisphenoid and basioccipital pits in microchiropteran bats. Biological
Journal of the Linnean Society, 78, 215–233.Dijkstra, K.-D.B. (2007) Gone with the wind: westward dispersal across the Indian Ocean and island speciation in
Hemicordulina dragonflies (Odonata: Corduliidae). Zootaxa, 1438, 27–48.Dobson, G.E. (1878) Catalogue of the Chiroptera in the collection of the British Museum. Order of the Trustees, London,
pp. 567.Eger, J.L. & Mitchell, L. (2003) Chiroptera, Bats. In: Goodman, S.M. & Benstead, J.P. (Eds.) The Natural History of
Madagascar. The University of Chicago Press, Chicago, pp. 1287–1298.Felsenstein, J. (1985) Confidence limits on phylogenies: an approach using bootstrap. Evolution, 39, 783–791.Fenton, M.B., Jacobs, D.S., Richardson, E.R., Taylor, P.J. & White, W. (2004) Individual signatures in the frequency
modulated sweep calls of African large-eared free-tailed bats (Otomops martiensseni) (Chiroptera: Molossidae).Journal of Zoology (London), 262, 11–19.
Freeman, P.W. (1981) A multivariate study of the family Molossidae (Mammalia: Chiroptera): Morphology, ecology,evolution. Fieldiana: Zoology, new series, 7, 1–173.
Goodman, S.M. & Cardiff, S.G. (2004) A new species of Chaerephon (Molossidae) from Madagascar with notes on othermembers of the family. Acta Chiropterlogica, 6, 227–248.
Goodman, S.M. & Ranivo, J. (2008) A new species of Triaenops (Mammalia, Chiroptera, Hipposideridae) from AldabraAtoll, Picard Island (Seychelles). Zoosystema, 30, 681–693.
Goodman, S.M. & Ratrimomanarivo, F. (2007) The taxonomic status of Chaerephon pumilus from the westernSeychelles: resurrection of the name C. pusillus for an endemic species. Acta Chiropterologica, 9, 391–399.
Goodman, S.M., Ratrimomanarivo, F.H., Ranivo, J. & Cardiff, S.G. (2008) The hunting of microchiropteran bats indifferent portions of Madagascar. African Bat Conservation Newsletter, 16, 4–7.
Goodman, S.M., Maminirina, C.P., Weyeneth, N., Bradman, H.M., Christidis, L., Ruedi, M. & Appleton, B. (2009) Theuse of molecular and morphological characters to resolve the taxonomic identity of cryptic species: the case ofMiniopterus manavi (Chiroptera, Miniopteridae). Zoologica Scripta, 38, 339–363.
Harper, G.J., Steininger, M.K., Tucker, C.J., Juhn, D. & Hawkins, F. (2007) Fifty years of deforestation andfragmentation in Madagascar. Environmental Conservation, 34, 1–9.
Hall, T. A. (1999) BioEdit: a user-friendly biological sequence alignment editor and analysis program for Windows 95/98/NT. Nucleic Acids Symposium Series, 41, 95–98.
Harrison, D.L. & Bates, P.J.J. (1991) The mammals of Arabia, 2nd edition. Harrison Zoological Museum, Sevenoaks, xvi+ 354 pp.
Hayman, R.W. & Hill, J.E. (1971) The mammals of Africa. An identification manual. Part 2. Order Chiroptera.Smithsonian Institution Press, Washington, D.C., 1–73 pp.
Huelsenbeck, J.P. & Ronquist, F. (2001) MRBAYES: a Bayesian inference of phylogeny. Bioinformatics 17, 754–755.Irwin, D.M., Kocher, T.D. & Wilson, A.C. (1991) Evolution of the cytochrome b gene of mammals. Journal of
Molecular Evolution, 32, 128–144.Jacobs, D.S., Eick, G.N., Richardson, E.J. & Taylor, P.J. (2004) Genetic similarity amongst phenotypically diverse little
free-tailed bats, Chaerephon pumilus. Acta Chiropterologica, 6, 13–21.Kingdon, J. (1974) East African Mammals: An Atlas of Evolution in Africa. Vol. II Part A (Insectivores and Bats).
Academic Press, London, pp. 341.Koopman, K.F. (1994) Chiroptera: Systematics. In: Niethammer, J., Schliemann, H. & Stark, D. (Eds.) Handbuch der
Zoologie, Vol. VIII, Mammalia, Part 60. Walter de Gruyter, Berlin, vii + 217 pp.Louette, M. (2004) Mammifères. In: Louette, M., Meitre, D. & Locque, R. (Eds.) La faune terrestre de l’archipel des
Comores. Musée royal de l’Afrique centrale, Tervuren, pp. 65–87.Mayr, E. (1963) Animal species and evolution. Harvard University Press, Cambridge, Mass., 797 pp. Mertens, R. (1925) Verzeichnis der Saugetier-Typen des Senckenbergischen Museums. Senckenbergiana, 7, 18–37.Nabholz, B., Mauffrey, J.-F., Bazin, E., Galtier, N. & Glemin, S. (2008) Determination of mitochondrial genetic diversity
in mammals. Genetics, 178, 351–361. O’Brien, J., Mariani, C., Olson, L., Russell, A.L., Say, L., Yoder, A.D. & Hayden, T.J. (2009) Multiple colonisations of
the western Indian Ocean by Pteropus fruit bats (Megachiroptera: Pteropodidae): The furthest islands were
TERMS OF USEThis pdf is provided by Magnolia Press for private/research use. Commercial sale or deposition in a public library or website is prohibited.
GOODMAN ET AL.30 · Zootaxa 2551 © 2010 Magnolia Press
colonised first. Molecular Phylogenetics and Evolution, 51, 294–303. Pasquet, E., Pons, J.-M., Fuchs, J., Cruaud, C. & Bretagnolle, V. (2007) Evolutionary history and biogeography of the
drongos (Dicruridae), a tropical Old World clade of corvoid passerines. Molecular Phylogenetics and Evolution, 45,158–167.
Pedgley, D.E., Reynolds, D.R. & Tatchell, G.M. (1995) Long-range insect migration in relation to climate and weather:Africa and Europe. In Drake, V.A. & Gatehouse, A.G. (Eds.) Insect Migration: Tracking Resources Through Spaceand Time. Cambridge University Press, New York, xvii + 478 pp.
Peterson, R.L., Eger, J.L. & Mitchell, L. (1995) Chiroptères. Vol. 84. Faune de Madagascar. Muséum national d’Histoirenaturelle, Paris, 204 pp.
Pfenninger, M. & Schwenk, K. (2007) Cryptic animal species are homogeneously distributed among taxa andbiogeographical regions. BMC Evolutionary Biology, 7, 121 doi: 10.1186/1471-2148-7-121.
Posada, D. & Crandall, K.A. (1998) Modeltest: testing the model of DNA substitution. Bioinformatics, 14, 817–818.Rakotonandrasana, E. & Goodman, S.M. (2007) Bat inventories of the Madagascar offshore islands of Nosy Be, Nosy
Komba and Ile Sainte-Marie. African Bat Conservation News, 12, 6–10.Ranivo, J. & Goodman, S.M. (2007) Patterns of ecomorphological variation in the bats of western Madagascar:
comparisons among and between communities along a latitudinal gradient. Mammalian Biology, 72, 1–13.Ratrimomanarivo, F.H., Vivian, J., Goodman, S.M. & Lamb, J. (2007) Morphological and molecular assessment of the
specific status of Mops midas (Chiroptera: Molossidae) from Madagascar and Africa. African Zoology, 42, 237–253.Ratrimomanarivo, F.H., Goodman, S.M., Hoosen, N., Taylor, P.J. & Lamb, J. (2008) Morphological and molecular
variation in Mops leucostigma (Chiroptera: Molossidae) of Madagascar and the Comoros: phylogeny,phylogeography, and geographic variation. Mitteilungen aus dem Hamburgischen Zoologischen Museum, 105, 57–101.
Ratrimomanarivo, F.H., Goodman, S.M., Stanley, W.T., Naidoo, T., Taylor, P.J. & Lamb, J. (2009a) Patterns ofgeographic and phylogeographic variation in Chaerephon leucogaster (Chiroptera: Molossidae) of Madagascar andthe western Indian Ocean islands of Mayotte and Pemba. Acta Chiropterologica, 11, 25–52.
Ratrimomanarivo, F.H., Goodman, S.M., Taylor, P.J., Bronwyn, M. & Lamb, J. (2009b) Morphological and geneticvariation in Mormopterus jugularis (Chiroptera: Molossidae) in different bioclimatic regions of Madagascar withnatural history notes. Mammalia, 73, 110–129.
Rosevear, D.R. (1965) The Bats of West Africa. Trustees of the British Museum (Natural History), London, 418 pp.Rozas, J., Sánchez del Barrio, J.C. Messeguer, X. & Rozas, R. (2003) DnaSP, DNA polymorphism analyses by the
coalescent and other methods. Bioinformatics, 19, 2496–2497.Russ, J., Bennett, D., Ross, K. & Kofoky, A. (2001) The Bats of Madagascar: A Field Guide with Descriptions of
Echolocation Calls. Viper Press, Glossop, 96 pp.Simmons, N.B. (2005) Order Chiroptera. In: Wilson, D.E. & Reeder, D.M. (Eds.) Mammal Species of the World: A
Taxonomic and Geographic Reference, 3rd edn. Johns Hopkins University Press, Baltimore, pp. 312–529.Swofford, D. L. (2002) PAUP*: phylogenetic analysis using parsimony (*and other methods), version 4.0b10. Sinauer
Associates, Sunderland.Taylor, P.J. (1999a) Echolocation calls of twenty southern African bat species. South African Journal of Zoology, 34(3),
114–124.Taylor, P.J. (1999b) Problems with the identification of southern African Chaerephon (Molossidae), and the possibility
of a cryptic species from South Africa and Swaziland. Acta Chiropterologica, 1, 191–200. Taylor, P.J., Lamb, J., Reddy, D., Naidoo, T., Ratrimomanarivo, F., Richardson, E. & Goodman, S.M. (2009) Cryptic
lineages of little free-tailed bats, Chaerephon pumilus (Chiroptera: Molossidae) from southern Africa and thewestern Indian Ocean islands. African Zoology, 44, 55–70.
Thompson, J.D., Higgens, D.G. & Gibson, T.J. (1994) CLUSTAL W: improving the sensitivity of progressive multiplesequence alignment through sequence weighting, position specific gap penalties and weight matrix choice. NucleicAcids Research, 22, 4673–4680.
Turni, H. & Kock, D. (2008) Type specimens of chiropteran mammals at the Museum für Naturkunde Berlin. Zootaxa,1869, 1–82.
Warren, B.H., Bermingham, E., Bowie, R.C.K., Prys-Jones, R.P. & Thébaud, C. (2003) Molecular phylogeographyreveals island colonization history and diversification of western Indian Ocean sunbirds. Molecular Phylogeneticsand Evolution, 29, 67–85.
Weyeneth, N., Goodman, S.M., Stanley, W.T. & Ruedi, M. (2008) The biogeography of Miniopterus bats (Chiroptera:Miniopteridae) from the Comoro Archipelago inferred from mitochondrial DNA. Molecular Ecology, 17, 5205–5219.
Wilkinson, G.S. & Chapman, A.M. (1991) Length and sequence variation in evening bat D-Loop mtDNA. Genetics, 128,607–617.
TERMS OF USEThis pdf is provided by Magnolia Press for private/research use. Commercial sale or deposition in a public library or website is prohibited.
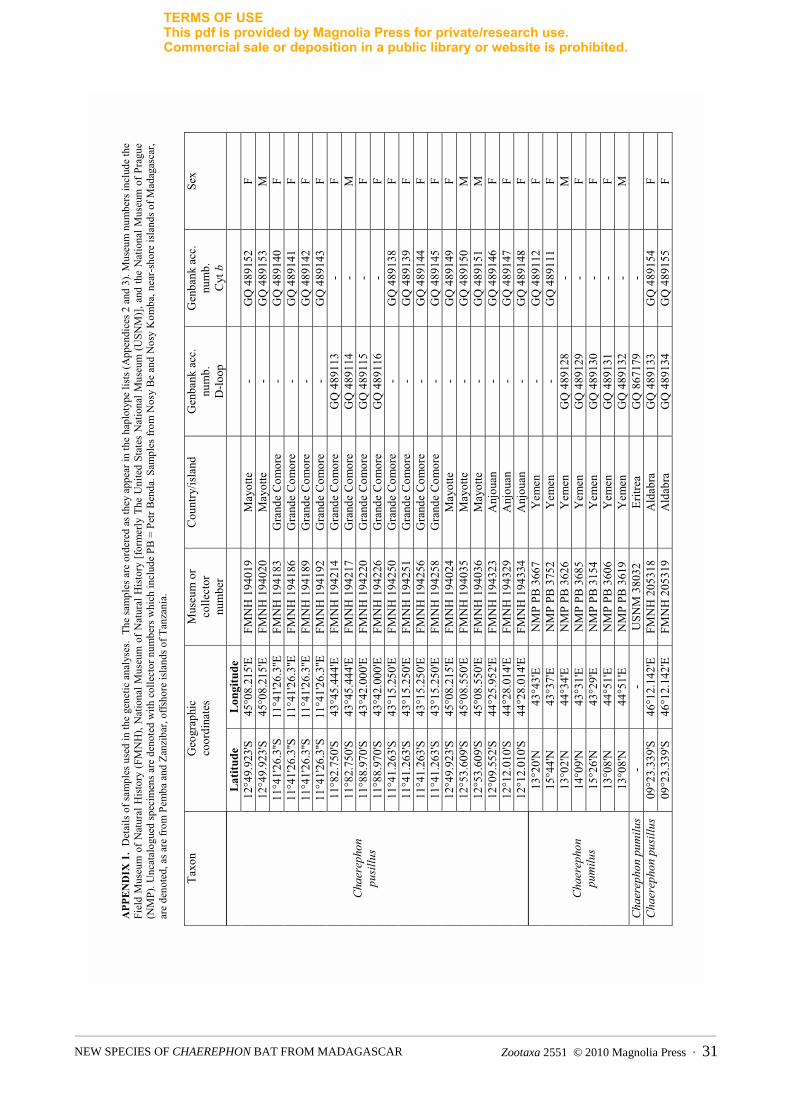
Zootaxa 2551 © 2010 Magnolia Press · 31NEW SPECIES OF CHAEREPHON BAT FROM MADAGASCAR
APP
EN
DIX
1.
Det
ails
of s
ampl
es u
sed
in th
e ge
netic
ana
lyse
s.Th
e sa
mpl
es a
re o
rder
ed a
s the
y ap
pear
in th
e ha
plot
ype
lists
(App
endi
ces 2
and
3).
Mus
eum
num
bers
incl
ude
the
Fiel
d M
useu
m o
f Nat
ural
His
tory
(FM
NH
), N
atio
nal M
useu
m o
f Nat
ural
His
tory
[fo
rmer
ly T
he U
nite
d St
ates
Nat
iona
l Mus
eum
(USN
M)]
, and
the
Nat
iona
l Mus
eum
of P
ragu
e (N
MP)
. Unc
atal
ogue
d sp
ecim
ens a
re d
enot
ed w
ith c
olle
ctor
num
bers
whi
ch in
clud
e PB
= P
etr B
enda
. Sam
ples
from
Nos
y B
e an
d N
osy
Kom
ba, n
ear-
shor
e is
land
s of M
adag
asca
r, ar
e de
note
d, a
s are
from
Pem
ba a
nd Z
anzi
bar,
offs
hore
isla
nds o
f Tan
zani
a.
Taxo
n G
eogr
aphi
c
coor
dina
tes
Mus
eum
or
colle
ctor
num
ber
Cou
ntry
/isla
nd
Gen
bank
acc
. nu
mb.
D
-loop
Gen
bank
acc
. nu
mb.
C
yt b
Sex
Lat
itude
L
ongi
tude
12
°49.
923'
S 45
°08.
215'
E FM
NH
194
019
May
otte
-
GQ
489
152
F 12
°49.
923'
S 45
°08.
215'
E FM
NH
194
020
May
otte
-
GQ
489
153
M
11°4
1'26
.3''S
11°4
1'26
.3''E
FMN
H 1
9418
3 G
rand
e C
omor
e -
GQ
489
140
F 11
°41'
26.3
''S11
°41'
26.3
''EFM
NH
194
186
Gra
nde
Com
ore
- G
Q 4
8914
1 F
11°4
1'26
.3''S
11°4
1'26
.3''E
FMN
H 1
9418
9 G
rand
e C
omor
e -
GQ
489
142
F 11
°41'
26.3
''S11
°41'
26.3
''EFM
NH
194
192
Gra
nde
Com
ore
- G
Q 4
8914
3 F
11°8
2.75
0'S
43°4
5.44
4'E
FMN
H 1
9421
4 G
rand
e C
omor
e G
Q 4
8911
3 -
F 11
°82.
750'
S 43
°45.
444'
E FM
NH
194
217
Gra
nde
Com
ore
GQ
489
114
- M
11
°88.
970'
S 43
°42.
000'
E FM
NH
194
220
Gra
nde
Com
ore
GQ
489
115
- F
11°8
8.97
0'S
43°4
2.00
0'E
FMN
H 1
9422
6 G
rand
e C
omor
e G
Q 4
8911
6 -
F 11
°41.
263'
S 43
°15.
250'
E FM
NH
194
250
Gra
nde
Com
ore
- G
Q 4
8913
8 F
11°4
1.26
3'S
43°1
5.25
0'E
FMN
H 1
9425
1 G
rand
e C
omor
e -
GQ
489
139
F 11
°41.
263'
S 43
°15.
250'
E FM
NH
194
256
Gra
nde
Com
ore
- G
Q 4
8914
4 F
11°4
1.26
3'S
43°1
5.25
0'E
FMN
H 1
9425
8 G
rand
e C
omor
e -
GQ
489
145
F 12
°49.
923'
S 45
°08.
215'
E FM
NH
194
024
May
otte
-
GQ
489
149
F 12
°53.
609'
S 45
°08.
550'
E FM
NH
194
035
May
otte
-
GQ
489
150
M
12°5
3.60
9'S
45°0
8.55
0'E
FMN
H 1
9403
6 M
ayot
te
- G
Q 4
8915
1 M
12
°09.
552'
S 44
°25.
952'
E FM
NH
194
323
Anj
ouan
-
GQ
489
146
F 12
°12.
010'
S 44
°28.
014'
E FM
NH
194
329
Anj
ouan
-
GQ
489
147
F
Chae
reph
on
pusil
lus
12°1
2.01
0'S
44°2
8.01
4'E
FMN
H 1
9433
4 A
njou
an
- G
Q 4
8914
8 F
13°2
0'N
43
°43'
E N
MP
PB 3
667
Yem
en
- G
Q 4
8911
2 F
15°4
4'N
43
°37'
E N
MP
PB 3
752
Yem
en
- G
Q 4
8911
1 F
13°0
2'N
44
°34'
E N
MP
PB 3
626
Yem
en
GQ
489
128
- M
14
°09'
N
43°3
1'E
NM
P PB
368
5 Y
emen
G
Q 4
8912
9 -
F 15
°26'
N
43°2
9'E
NM
P PB
315
4 Y
emen
G
Q 4
8913
0 -
F 13
°08'
N
44°5
1'E
NM
P PB
360
6 Y
emen
G
Q 4
8913
1 -
F
Chae
reph
on
pum
ilus
13°0
8'N
44
°51'
E N
MP
PB 3
619
Yem
en
GQ
489
132
- M
Ch
aere
phon
pum
ilus
- -
USN
M 3
8032
Er
itrea
G
Q 8
6717
9 -
09
°23.
339'
S 46
°12.
142'
E FM
NH
205
318
Ald
abra
G
Q 4
8913
3 G
Q 4
8915
4 F
Chae
reph
on p
usill
us09
°23.
339'
S 46
°12.
142'
E FM
NH
205
319
Ald
abra
G
Q 4
8913
4 G
Q 4
8915
5 F
TERMS OF USEThis pdf is provided by Magnolia Press for private/research use. Commercial sale or deposition in a public library or website is prohibited.
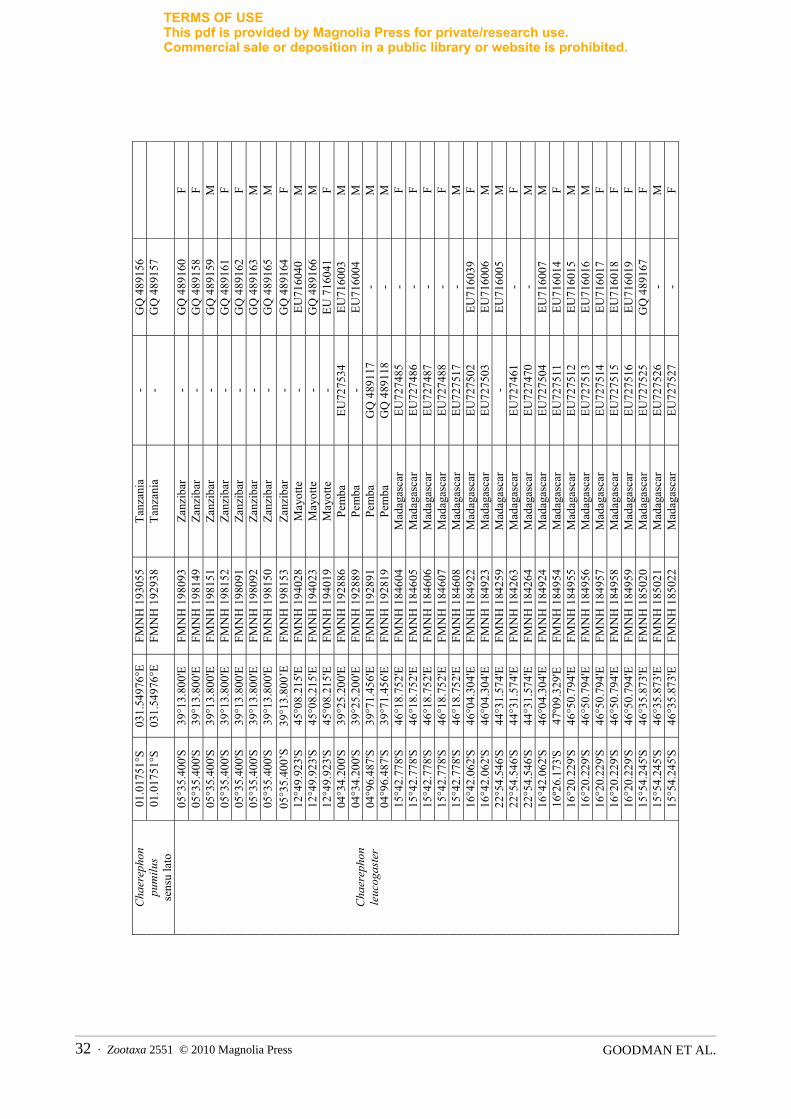
GOODMAN ET AL.32 · Zootaxa 2551 © 2010 Magnolia Press
01.0
1751
°S
031.
5497
6°E
FMN
H 1
9305
5 Ta
nzan
ia
- G
Q 4
8915
6
Chae
reph
on
pum
ilus
sens
u la
to01
.017
51°S
03
1.54
976°
EFM
NH
192
938
Tanz
ania
-
GQ
489
157
05°3
5.40
0'S
39°1
3.80
0'E
FMN
H 1
9809
3 Za
nzib
ar
- G
Q 4
8916
0 F
05°3
5.40
0'S
39°1
3.80
0'E
FMN
H 1
9814
9 Za
nzib
ar
- G
Q 4
8915
8 F
05°3
5.40
0'S
39°1
3.80
0'E
FMN
H 1
9815
1 Za
nzib
ar
- G
Q 4
8915
9 M
05
°35.
400'
S 39
°13.
800'
E FM
NH
198
152
Zanz
ibar
-
GQ
489
161
F 05
°35.
400'
S 39
°13.
800'
E FM
NH
198
091
Zanz
ibar
-
GQ
489
162
F 05
°35.
400'
S 39
°13.
800'
E FM
NH
198
092
Zanz
ibar
-
GQ
489
163
M
05°3
5.40
0'S
39°1
3.80
0'E
FMN
H 1
9815
0 Za
nzib
ar
- G
Q 4
8916
5 M
05
°35.
400’
S 39
°13.
800’
E FM
NH
198
153
Zanz
ibar
-
GQ
489
164
F 12
°49.
923'
S 45
°08.
215'
E FM
NH
194
028
May
otte
-
EU71
6040
M
12
°49.
923'
S 45
°08.
215'
E FM
NH
194
023
May
otte
-
GQ
489
166
M
12°4
9.92
3'S
45°0
8.21
5'E
FMN
H 1
9401
9 M
ayot
te
- EU
716
041
F 04
°34.
200'
S 39
°25.
200'
E FM
NH
192
886
Pem
ba
EU72
7534
EU
7160
03
M
04°3
4.20
0'S
39°2
5.20
0'E
FMN
H 1
9288
9 Pe
mba
-
EU71
6004
M
04
°96.
487'
S 39
°71.
456'
E FM
NH
192
891
Pem
ba
GQ
489
117
- M
04
°96.
487'
S 39
°71.
456'
E FM
NH
192
819
Pem
ba
GQ
489
118
- M
15
°42.
778'
S 46
°18.
752'
E FM
NH
184
604
Mad
agas
car
EU72
7485
-
F 15
°42.
778'
S 46
°18.
752'
E FM
NH
184
605
Mad
agas
car
EU72
7486
-
F 15
°42.
778'
S 46
°18.
752'
E FM
NH
184
606
Mad
agas
car
EU72
7487
-
F 15
°42.
778'
S 46
°18.
752'
E FM
NH
184
607
Mad
agas
car
EU72
7488
-
F 15
°42.
778'
S 46
°18.
752'
E FM
NH
184
608
Mad
agas
car
EU72
7517
-
M
16°4
2.06
2'S
46°0
4.30
4'E
FMN
H 1
8492
2 M
adag
asca
r EU
7275
02
EU71
6039
F
16°4
2.06
2'S
46°0
4.30
4'E
FMN
H 1
8492
3 M
adag
asca
r EU
7275
03
EU71
6006
M
22
°54.
546'
S 44
°31.
574'
E FM
NH
184
259
Mad
agas
car
- EU
7160
05
M
22°5
4.54
6'S
44°3
1.57
4'E
FMN
H 1
8426
3 M
adag
asca
r EU
7274
61
- F
22°5
4.54
6'S
44°3
1.57
4'E
FMN
H 1
8426
4 M
adag
asca
r EU
7274
70
- M
16
°42.
062'
S 46
°04.
304'
E FM
NH
184
924
Mad
agas
car
EU72
7504
EU
7160
07
M
16º2
6.17
3'S
47º0
9.32
9'E
FMN
H 1
8495
4 M
adag
asca
r EU
7275
11
EU71
6014
F
16°2
0.22
9'S
46°5
0.79
4'E
FMN
H 1
8495
5 M
adag
asca
r EU
7275
12
EU71
6015
M
16
°20.
229'
S 46
°50.
794'
E FM
NH
184
956
Mad
agas
car
EU72
7513
EU
7160
16
M
16°2
0.22
9'S
46°5
0.79
4'E
FMN
H 1
8495
7 M
adag
asca
r EU
7275
14
EU71
6017
F
16°2
0.22
9'S
46°5
0.79
4'E
FMN
H 1
8495
8 M
adag
asca
r EU
7275
15
EU71
6018
F
16°2
0.22
9'S
46°5
0.79
4'E
FMN
H 1
8495
9 M
adag
asca
r EU
7275
16
EU71
6019
F
15°5
4.24
5'S
46°3
5.87
3'E
FMN
H 1
8502
0 M
adag
asca
r EU
7275
25
GQ
489
167
F 15
°54.
245'
S 46
°35.
873'
E FM
NH
185
021
Mad
agas
car
EU72
7526
-
M
Chae
reph
on
leuc
ogas
ter
15°5
4.24
5'S
46°3
5.87
3'E
FMN
H 1
8502
2 M
adag
asca
r EU
7275
27
- F
TERMS OF USEThis pdf is provided by Magnolia Press for private/research use. Commercial sale or deposition in a public library or website is prohibited.
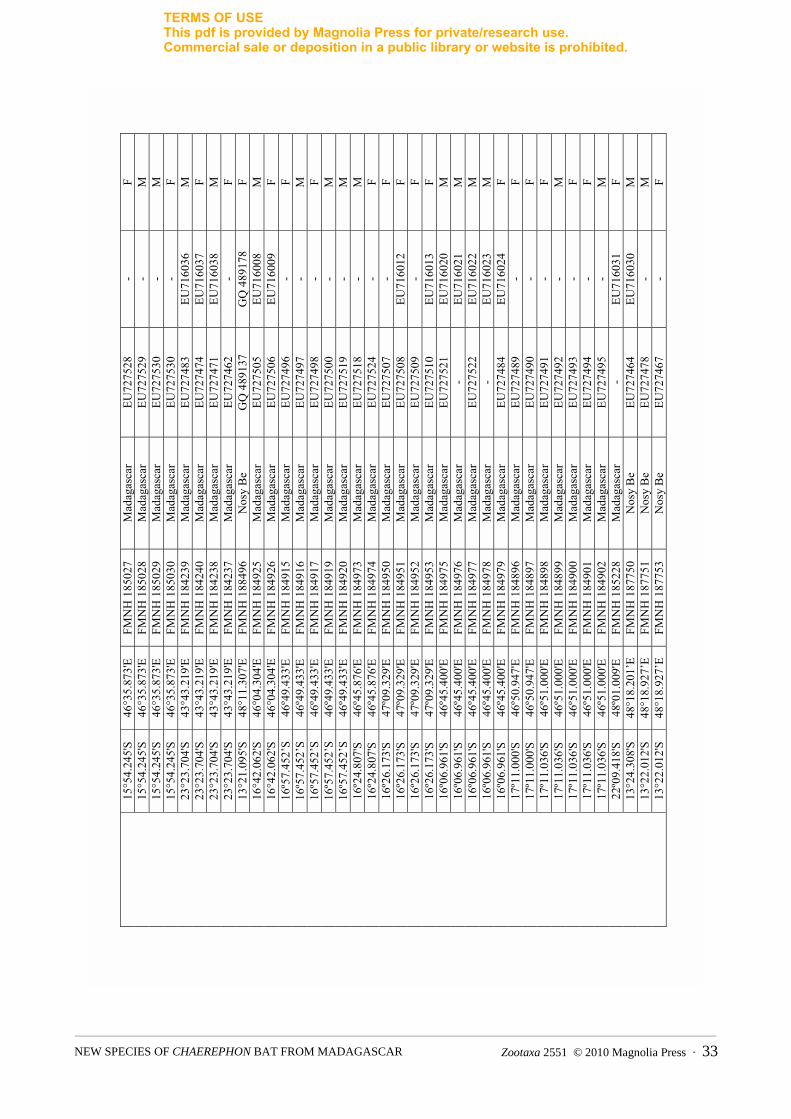
Zootaxa 2551 © 2010 Magnolia Press · 33NEW SPECIES OF CHAEREPHON BAT FROM MADAGASCAR
15°5
4.24
5'S
46°3
5.87
3'E
FMN
H 1
8502
7 M
adag
asca
r EU
7275
28
- F
15°5
4.24
5'S
46°3
5.87
3'E
FMN
H 1
8502
8 M
adag
asca
r EU
7275
29
- M
15
°54.
245'
S 46
°35.
873'
E FM
NH
185
029
Mad
agas
car
EU72
7530
-
M
15°5
4.24
5'S
46°3
5.87
3'E
FMN
H 1
8503
0 M
adag
asca
r EU
7275
30
- F
23°2
3.70
4'S
43°4
3.21
9'E
FMN
H 1
8423
9 M
adag
asca
r EU
7274
83
EU71
6036
M
23
°23.
704'
S 43
°43.
219'
E FM
NH
184
240
Mad
agas
car
EU72
7474
EU
7160
37
F 23
°23.
704'
S 43
°43.
219'
E FM
NH
184
238
Mad
agas
car
EU72
7471
EU
7160
38
M
23°2
3.70
4'S
43°4
3.21
9'E
FMN
H 1
8423
7 M
adag
asca
r EU
7274
62
- F
13°2
1.09
5'S
48°1
1.30
7'E
FMN
H 1
8849
6 N
osy
Be
GQ
489
137
GQ
489
178
F 16
°42.
062'
S 46
°04.
304'
E FM
NH
184
925
Mad
agas
car
EU72
7505
EU
7160
08
M
16°4
2.06
2'S
46°0
4.30
4'E
FMN
H 1
8492
6 M
adag
asca
r EU
7275
06
EU71
6009
F
16º5
7.45
2’S
46º4
9.43
3'E
FMN
H 1
8491
5 M
adag
asca
r EU
7274
96
- F
16º5
7.45
2’S
46º4
9.43
3'E
FMN
H 1
8491
6 M
adag
asca
r EU
7274
97
- M
16
º57.
452’
S 46
º49.
433'
E FM
NH
184
917
Mad
agas
car
EU72
7498
-
F 16
º57.
452’
S 46
º49.
433'
E FM
NH
184
919
Mad
agas
car
EU72
7500
-
M
16º5
7.45
2’S
46º4
9.43
3'E
FMN
H 1
8492
0 M
adag
asca
r EU
7275
19
- M
16
º24.
807'
S 46
º45.
876'
E FM
NH
184
973
Mad
agas
car
EU72
7518
-
M
16º2
4.80
7'S
46º4
5.87
6'E
FMN
H 1
8497
4 M
adag
asca
r EU
7275
24
- F
16º2
6.17
3'S
47º0
9.32
9'E
FMN
H 1
8495
0 M
adag
asca
r EU
7275
07
- F
16º2
6.17
3'S
47º0
9.32
9'E
FMN
H 1
8495
1 M
adag
asca
r EU
7275
08
EU71
6012
F
16º2
6.17
3'S
47º0
9.32
9'E
FMN
H 1
8495
2 M
adag
asca
r EU
7275
09
- F
16º2
6.17
3'S
47º0
9.32
9'E
FMN
H 1
8495
3 M
adag
asca
r EU
7275
10
EU71
6013
F
16º0
6.96
1'S
46º4
5.40
0'E
FMN
H 1
8497
5 M
adag
asca
r EU
7275
21
EU71
6020
M
16
º06.
961'
S 46
º45.
400'
E FM
NH
184
976
Mad
agas
car
- EU
7160
21
M
16º0
6.96
1'S
46º4
5.40
0'E
FMN
H 1
8497
7 M
adag
asca
r EU
7275
22
EU71
6022
M
16
º06.
961'
S 46
º45.
400'
E FM
NH
184
978
Mad
agas
car
- EU
7160
23
M
16º0
6.96
1'S
46º4
5.40
0'E
FMN
H 1
8497
9 M
adag
asca
r EU
7274
84
EU71
6024
F
17º1
1.00
0'S
46º5
0.94
7'E
FMN
H 1
8489
6 M
adag
asca
r EU
7274
89
- F
17º1
1.00
0'S
46º5
0.94
7'E
FMN
H 1
8489
7 M
adag
asca
r EU
7274
90
- F
17º1
1.03
6'S
46º5
1.00
0'E
FMN
H 1
8489
8 M
adag
asca
r EU
7274
91
- F
17º1
1.03
6'S
46º5
1.00
0'E
FMN
H 1
8489
9 M
adag
asca
r EU
7274
92
- M
17
º11.
036'
S 46
º51.
000'
E FM
NH
184
900
Mad
agas
car
EU72
7493
-
F 17
º11.
036'
S 46
º51.
000'
E FM
NH
184
901
Mad
agas
car
EU72
7494
-
F 17
º11.
036'
S 46
º51.
000'
E FM
NH
184
902
Mad
agas
car
EU72
7495
-
M
22º0
9.41
8'S
48º0
1.00
9'E
FMN
H 1
8522
8 M
adag
asca
r -
EU71
6031
F
13°2
4.30
8'S
48°1
8.20
1’E
FMN
H 1
8775
0 N
osy
Be
EU72
7464
EU
7160
30
M
13°2
2.01
2'S
48°1
8.92
7’E
FMN
H 1
8775
1 N
osy
Be
EU72
7478
-
M
13°2
2.01
2'S
48°1
8.92
7’E
FMN
H 1
8775
3 N
osy
Be
EU72
7467
-
F
TERMS OF USEThis pdf is provided by Magnolia Press for private/research use. Commercial sale or deposition in a public library or website is prohibited.
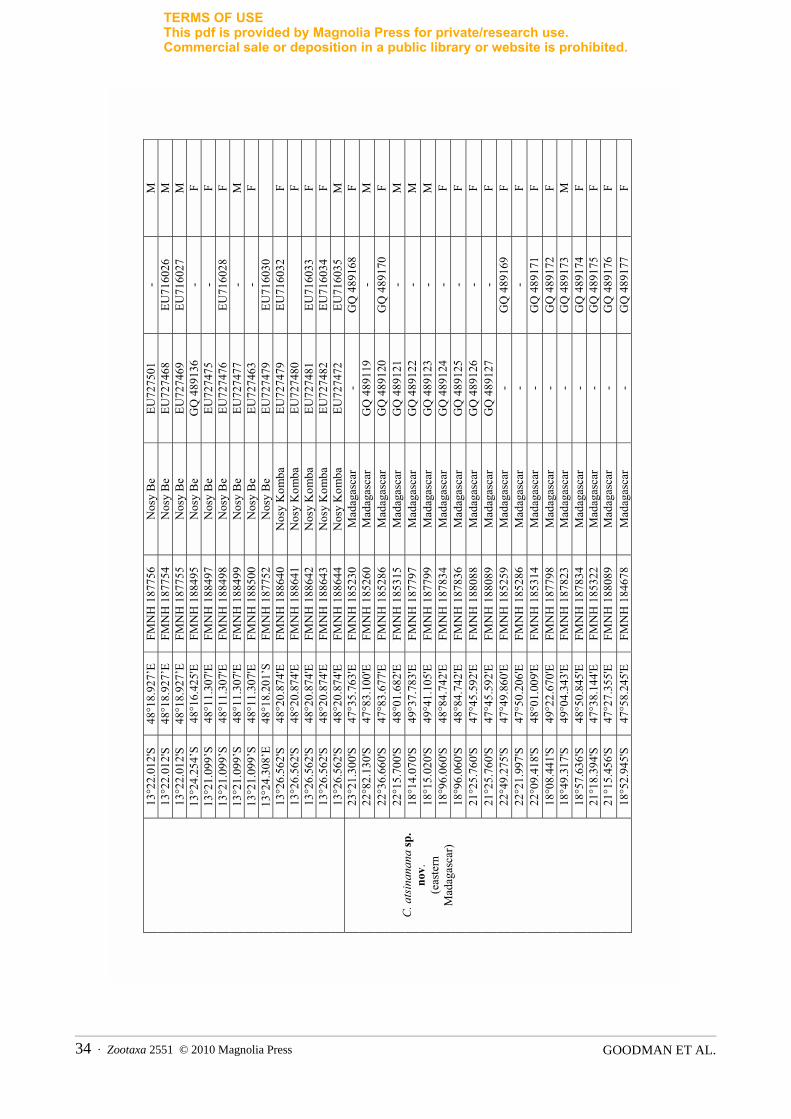
GOODMAN ET AL.34 · Zootaxa 2551 © 2010 Magnolia Press
13°2
2.01
2'S
48°1
8.92
7’E
FMN
H 1
8775
6 N
osy
Be
EU72
7501
-
M
13°2
2.01
2'S
48°1
8.92
7’E
FMN
H 1
8775
4 N
osy
Be
EU72
7468
EU
7160
26
M
13°2
2.01
2'S
48°1
8.92
7’E
FMN
H 1
8775
5 N
osy
Be
EU72
7469
EU
7160
27
M
13°2
4.25
4’S
48°1
6.42
5'E
FMN
H 1
8849
5 N
osy
Be
GQ
489
136
- F
13°2
1.09
9’S
48°1
1.30
7'E
FMN
H 1
8849
7 N
osy
Be
EU72
7475
-
F 13
°21.
099’
S 48
°11.
307'
E FM
NH
188
498
Nos
y B
e EU
7274
76
EU71
6028
F
13°2
1.09
9’S
48°1
1.30
7'E
FMN
H 1
8849
9 N
osy
Be
EU72
7477
-
M
13°2
1.09
9’S
48°1
1.30
7'E
FMN
H 1
8850
0 N
osy
Be
EU72
7463
-
F 13
°24.
308’
E 48
°18.
201’
S FM
NH
187
752
Nos
y B
e EU
7274
79
EU71
6030
13°2
6.56
2'S
48°2
0.87
4'E
FMN
H 1
8864
0 N
osy
Kom
ba
EU72
7479
EU
7160
32
F 13
°26.
562'
S 48
°20.
874'
E FM
NH
188
641
Nos
y K
omba
EU
7274
80
F
13°2
6.56
2'S
48°2
0.87
4'E
FMN
H 1
8864
2 N
osy
Kom
ba
EU72
7481
EU
7160
33
F 13
°26.
562'
S 48
°20.
874'
E FM
NH
188
643
Nos
y K
omba
EU
7274
82
EU71
6034
F
13°2
6.56
2'S
48°2
0.87
4'E
FMN
H 1
8864
4 N
osy
Kom
ba
EU72
7472
EU
7160
35
M
23°2
1.30
0'S
47°3
5.76
3'E
FMN
H 1
8523
0 M
adag
asca
r -
GQ
489
168
F 22
°82.
130'
S 47
°83.
100'
E FM
NH
185
260
Mad
agas
car
GQ
489
119
- M
22
°36.
660'
S 47
°83.
677'
E FM
NH
185
286
Mad
agas
car
GQ
489
120
GQ
489
170
F 22
°15.
700'
S 48
°01.
682'
E FM
NH
185
315
Mad
agas
car
GQ
489
121
- M
18
°14.
070'
S 49
°37.
783'
E FM
NH
187
797
Mad
agas
car
GQ
489
122
- M
18
°15.
020'
S 49
°41.
105'
E FM
NH
187
799
Mad
agas
car
GQ
489
123
- M
18
°96.
060'
S 48
°84.
742'
E FM
NH
187
834
Mad
agas
car
GQ
489
124
- F
18°9
6.06
0'S
48°8
4.74
2'E
FMN
H 1
8783
6 M
adag
asca
r G
Q 4
8912
5 -
F 21
°25.
760'
S 47
°45.
592'
E FM
NH
188
088
Mad
agas
car
GQ
489
126
- F
21°2
5.76
0'S
47°4
5.59
2'E
FMN
H 1
8808
9 M
adag
asca
r G
Q 4
8912
7 -
F 22
°49.
275'
S 47
°49.
860'
E FM
NH
185
259
Mad
agas
car
- G
Q 4
8916
9 F
22°2
1.99
7'S
47°5
0.20
6'E
FMN
H 1
8528
6 M
adag
asca
r -
- F
22°0
9.41
8'S
48°0
1.00
9'E
FMN
H 1
8531
4 M
adag
asca
r -
GQ
489
171
F 18
°08.
441'
S 49
°22.
670'
E FM
NH
187
798
Mad
agas
car
- G
Q 4
8917
2 F
18°4
9.31
7'S
49°0
4.34
3'E
FMN
H 1
8782
3 M
adag
asca
r -
GQ
489
173
M
18°5
7.63
6'S
48°5
0.84
5'E
FMN
H 1
8783
4 M
adag
asca
r -
GQ
489
174
F 21
°18.
394'
S 47
°38.
144'
E FM
NH
185
322
Mad
agas
car
- G
Q 4
8917
5 F
21°1
5.45
6'S
47°2
7.35
5'E
FMN
H 1
8808
9 M
adag
asca
r -
GQ
489
176
F
C. a
tsina
nana
sp.
nov.
(eas
tern
M
adag
asca
r)
18°5
2.94
5'S
47°5
8.24
5'E
FMN
H 1
8467
8 M
adag
asca
r -
GQ
489
177
F
TERMS OF USEThis pdf is provided by Magnolia Press for private/research use. Commercial sale or deposition in a public library or website is prohibited.
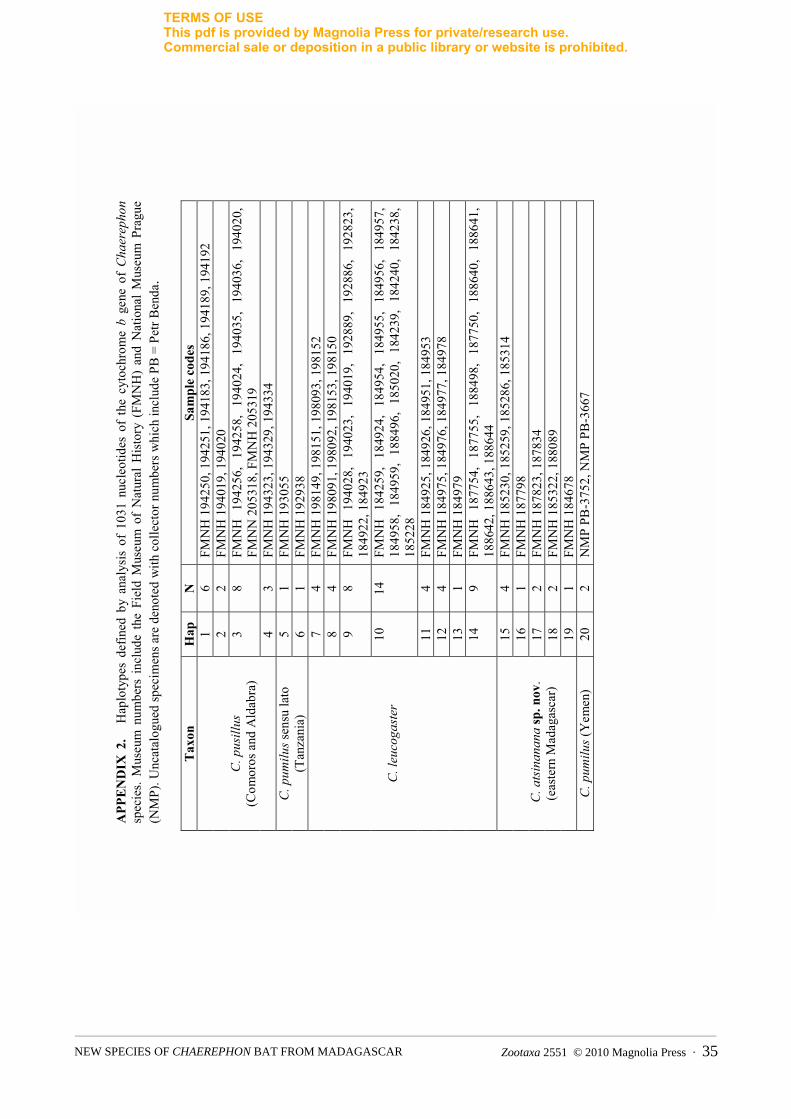
Zootaxa 2551 © 2010 Magnolia Press · 35NEW SPECIES OF CHAEREPHON BAT FROM MADAGASCAR
APP
EN
DIX
2.
Hap
loty
pes
defin
ed b
y an
alys
is o
f 10
31 n
ucle
otid
es o
f th
e cy
toch
rom
e b
gene
of
Chae
reph
on
spec
ies.
Mus
eum
num
bers
inc
lude
the
Fie
ld M
useu
m o
f N
atur
al H
isto
ry (
FMN
H)
and
Nat
iona
l M
useu
m P
ragu
e (N
MP)
. Unc
atal
ogue
d sp
ecim
ens a
re d
enot
ed w
ith c
olle
ctor
num
bers
whi
ch in
clud
e PB
= P
etr B
enda
.
Tax
on
Hap
N
Sam
ple
code
s 1
6 FM
NH
194
250,
194
251,
194
183,
194
186,
194
189,
194
192
2 2
FMN
H 1
9401
9, 1
9402
0 3
8 FM
NH
194
256,
194
258,
194
024,
194
035,
194
036,
194
020,
FM
NN
205
318,
FM
NH
205
319
C. p
usill
us
(Com
oros
and
Ald
abra
) 4
3 FM
NH
194
323,
194
329,
194
334
5 1
FMN
H 1
9305
5 C.
pum
ilus s
ensu
lato
(T
anza
nia)
6
1 FM
NH
192
938
7 4
FMN
H 1
9814
9, 1
9815
1, 1
9809
3, 1
9815
2 8
4 FM
NH
198
091,
198
092,
198
153,
198
150
9 8
FMN
H 1
9402
8, 1
9402
3,19
4019
,19
2889
, 19
2886
, 19
2823
, 18
4922
, 184
923
10
14
FMN
H 1
8425
9, 1
8492
4, 1
8495
4, 1
8495
5, 1
8495
6, 1
8495
7,
1849
58,
1849
59,
1884
96,
1850
20,
1842
39,
1842
40,
1842
38,
1852
28
11
4 FM
NH
184
925,
184
926,
184
951,
184
953
12
4 FM
NH
184
975,
184
976,
184
977,
184
978
13
1 FM
NH
184
979
C. le
ucog
aste
r
14
9 FM
NH
187
754,
187
755,
188
498,
187
750,
188
640,
188
641,
18
8642
, 188
643,
188
644
15
4 FM
NH
185
230,
185
259,
185
286,
185
314
16
1 FM
NH
187
798
17
2 FM
NH
187
823,
187
834
18
2 FM
NH
185
322,
188
089
C.a
tsina
nana
sp. n
ov.
(eas
tern
Mad
agas
car)
19
1
FMN
H 1
8467
8C.
pum
ilus (
Yem
en)
20
2 N
MP
PB-3
752,
NM
P PB
-366
7
TERMS OF USEThis pdf is provided by Magnolia Press for private/research use. Commercial sale or deposition in a public library or website is prohibited.
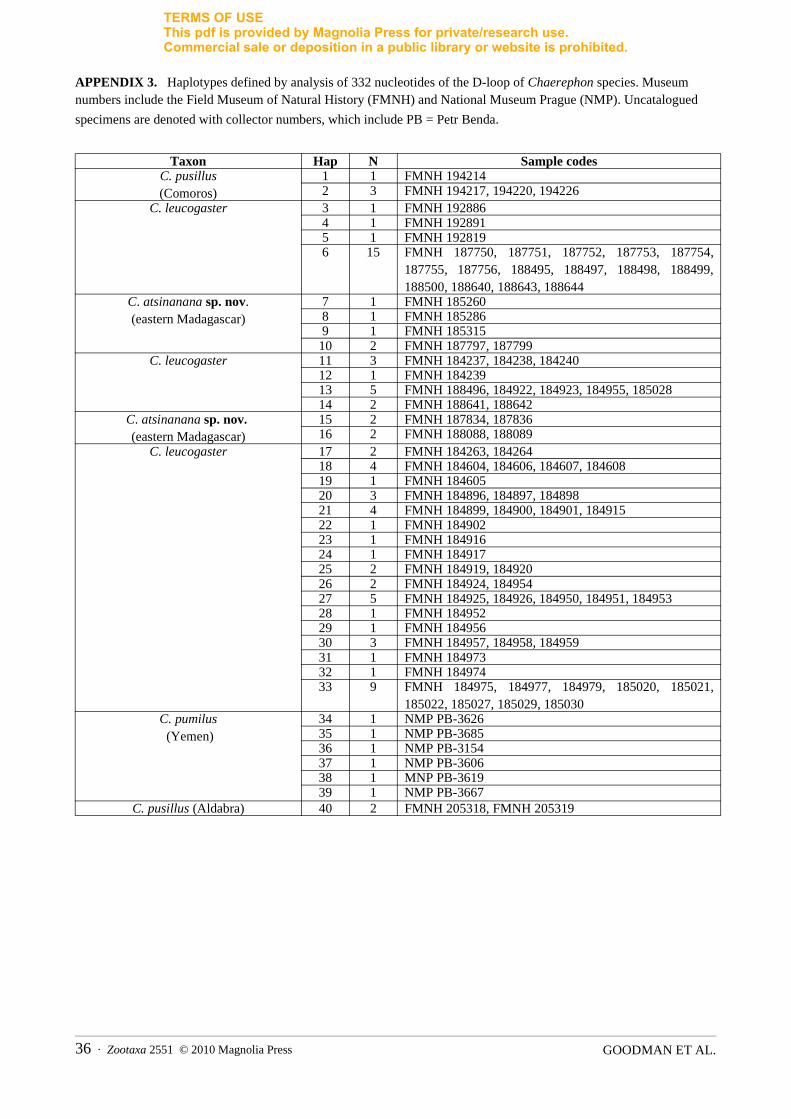
GOODMAN ET AL.36 · Zootaxa 2551 © 2010 Magnolia Press
APPENDIX 3. Haplotypes defined by analysis of 332 nucleotides of the D-loop of Chaerephon species. Museum numbers include the Field Museum of Natural History (FMNH) and National Museum Prague (NMP). Uncatalogued
specimens are denoted with collector numbers, which include PB = Petr Benda.
Taxon Hap N Sample codesC. pusillus(Comoros)
1 1 FMNH 1942142 3 FMNH 194217, 194220, 194226
C. leucogaster 3 1 FMNH 1928864 1 FMNH 1928915 1 FMNH 1928196 15 FMNH 187750, 187751, 187752, 187753, 187754,
187755, 187756, 188495, 188497, 188498, 188499,188500, 188640, 188643, 188644
C. atsinanana sp. nov.(eastern Madagascar)
7 1 FMNH 1852608 1 FMNH 1852869 1 FMNH 185315
10 2 FMNH 187797, 187799C. leucogaster 11 3 FMNH 184237, 184238, 184240
12 1 FMNH 18423913 5 FMNH 188496, 184922, 184923, 184955, 18502814 2 FMNH 188641, 188642
C. atsinanana sp. nov. (eastern Madagascar)
15 2 FMNH 187834, 18783616 2 FMNH 188088, 188089
C. leucogaster 17 2 FMNH 184263, 18426418 4 FMNH 184604, 184606, 184607, 18460819 1 FMNH 18460520 3 FMNH 184896, 184897, 18489821 4 FMNH 184899, 184900, 184901, 18491522 1 FMNH 18490223 1 FMNH 18491624 1 FMNH 18491725 2 FMNH 184919, 18492026 2 FMNH 184924, 18495427 5 FMNH 184925, 184926, 184950, 184951, 18495328 1 FMNH 18495229 1 FMNH 18495630 3 FMNH 184957, 184958, 18495931 1 FMNH 18497332 1 FMNH 18497433 9 FMNH 184975, 184977, 184979, 185020, 185021,
185022, 185027, 185029, 185030C. pumilus (Yemen)
34 1 NMP PB-362635 1 NMP PB-368536 1 NMP PB-315437 1 NMP PB-360638 1 MNP PB-361939 1 NMP PB-3667
C. pusillus (Aldabra) 40 2 FMNH 205318, FMNH 205319
TERMS OF USEThis pdf is provided by Magnolia Press for private/research use. Commercial sale or deposition in a public library or website is prohibited.
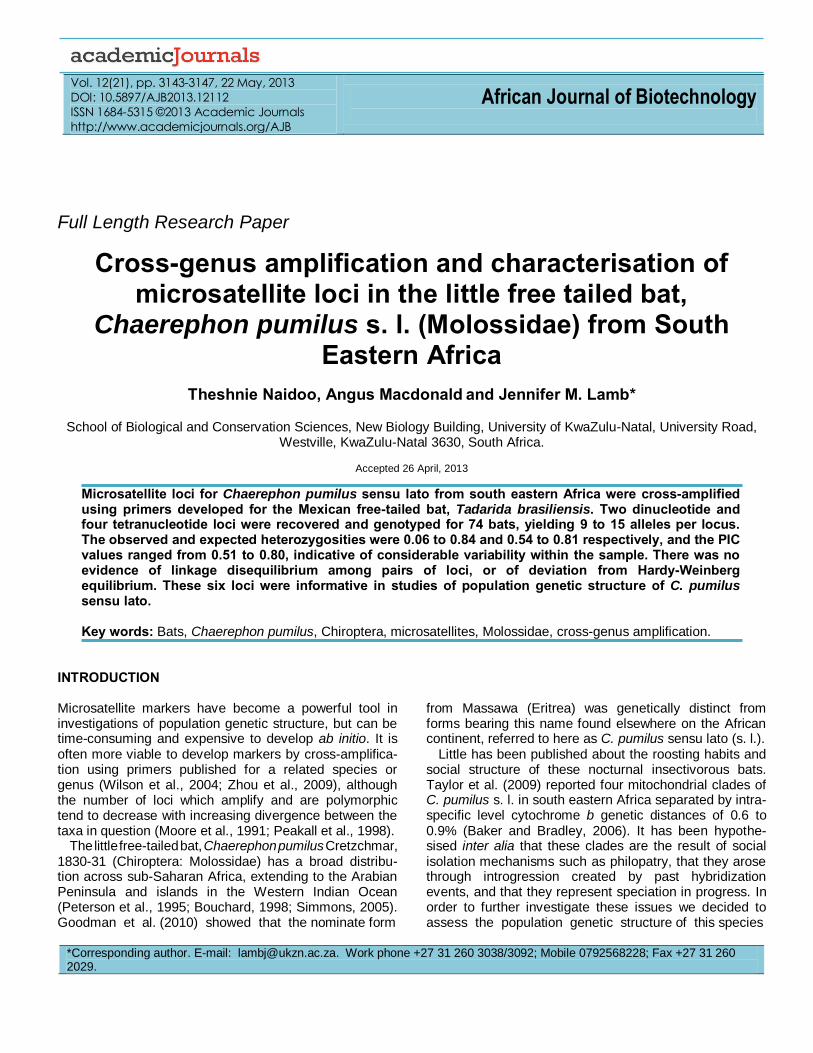
Vol. 12(21), pp. 3143-3147, 22 May, 2013
DOI: 10.5897/AJB2013.12112
ISSN 1684-5315 ©2013 Academic Journals
http://www.academicjournals.org/AJB
African Journal of Biotechnology
Full Length Research Paper
Cross-genus amplification and characterisation of microsatellite loci in the little free tailed bat,
Chaerephon pumilus s. l. (Molossidae) from South Eastern Africa
Theshnie Naidoo, Angus Macdonald and Jennifer M. Lamb*
School of Biological and Conservation Sciences, New Biology Building, University of KwaZulu-Natal, University Road,
Westville, KwaZulu-Natal 3630, South Africa.
Accepted 26 April, 2013
Microsatellite loci for Chaerephon pumilus sensu lato from south eastern Africa were cross-amplified using primers developed for the Mexican free-tailed bat, Tadarida brasiliensis. Two dinucleotide and four tetranucleotide loci were recovered and genotyped for 74 bats, yielding 9 to 15 alleles per locus. The observed and expected heterozygosities were 0.06 to 0.84 and 0.54 to 0.81 respectively, and the PIC values ranged from 0.51 to 0.80, indicative of considerable variability within the sample. There was no evidence of linkage disequilibrium among pairs of loci, or of deviation from Hardy-Weinberg equilibrium. These six loci were informative in studies of population genetic structure of C. pumilus sensu lato. Key words: Bats, Chaerephon pumilus, Chiroptera, microsatellites, Molossidae, cross-genus amplification.
INTRODUCTION Microsatellite markers have become a powerful tool in investigations of population genetic structure, but can be time-consuming and expensive to develop ab initio. It is often more viable to develop markers by cross-amplifica-tion using primers published for a related species or genus (Wilson et al., 2004; Zhou et al., 2009), although the number of loci which amplify and are polymorphic tend to decrease with increasing divergence between the taxa in question (Moore et al., 1991; Peakall et al., 1998).
The little free-tailed bat, Chaerephon pumilus Cretzchmar, 1830-31 (Chiroptera: Molossidae) has a broad distribu-tion across sub-Saharan Africa, extending to the Arabian Peninsula and islands in the Western Indian Ocean (Peterson et al., 1995; Bouchard, 1998; Simmons, 2005). Goodman et al. (2010) showed that the nominate form
from Massawa (Eritrea) was genetically distinct from forms bearing this name found elsewhere on the African continent, referred to here as C. pumilus sensu lato (s. l.).
Little has been published about the roosting habits and social structure of these nocturnal insectivorous bats. Taylor et al. (2009) reported four mitochondrial clades of C. pumilus s. l. in south eastern Africa separated by intra-specific level cytochrome b genetic distances of 0.6 to 0.9% (Baker and Bradley, 2006). It has been hypothe-sised inter alia that these clades are the result of social isolation mechanisms such as philopatry, that they arose through introgression created by past hybridization events, and that they represent speciation in progress. In order to further investigate these issues we decided to assess the population genetic structure of this species
*Corresponding author. E-mail: [email protected]. Work phone +27 31 260 3038/3092; Mobile 0792568228; Fax +27 31 260 2029.
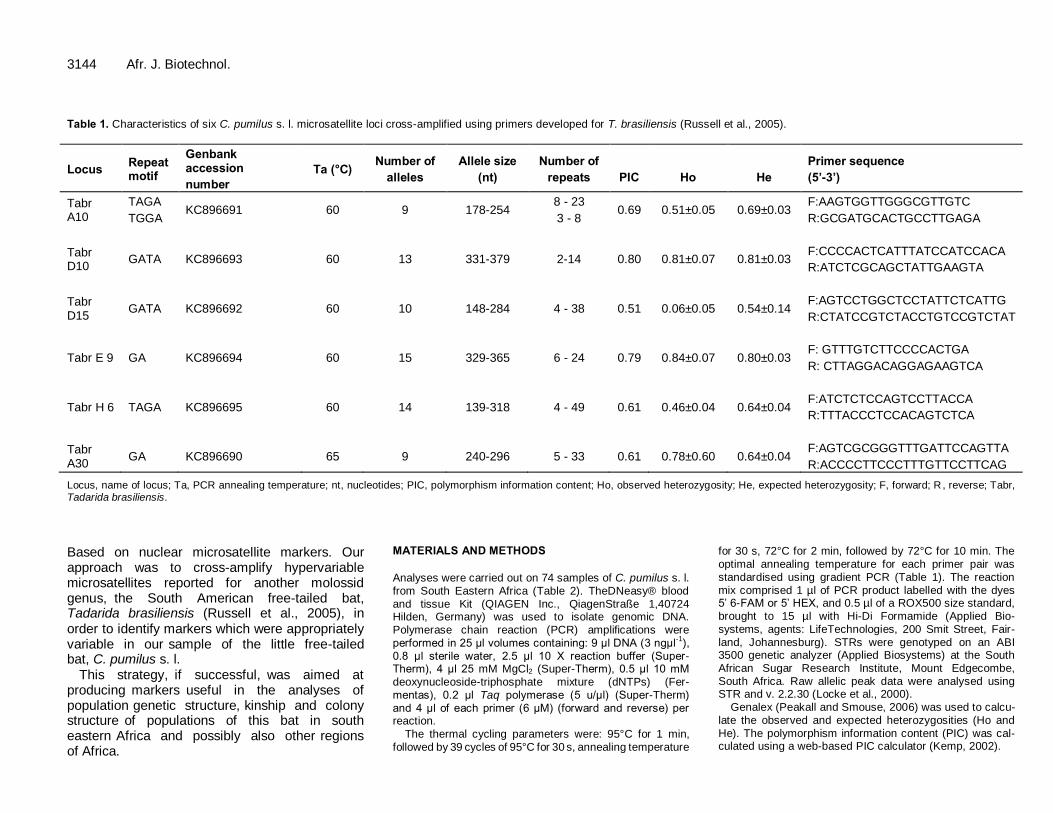
3144 Afr. J. Biotechnol. Table 1. Characteristics of six C. pumilus s. l. microsatellite loci cross-amplified using primers developed for T. brasiliensis (Russell et al., 2005).
Locus Repeat motif
Genbank accession number
Ta (°C) Number of alleles
Allele size (nt)
Number of repeats
PIC
Ho
He
Primer sequence (5’-3’)
Tabr A10
TAGA TGGA
KC896691 60 9 178-254 8 - 23 3 - 8
0.69 0.51±0.05 0.69±0.03 F:AAGTGGTTGGGCGTTGTC R:GCGATGCACTGCCTTGAGA
Tabr D10
GATA
KC896693
60
13
331-379
2-14
0.80
0.81±0.07
0.81±0.03
F:CCCCACTCATTTATCCATCCACA R:ATCTCGCAGCTATTGAAGTA
Tabr D15
GATA
KC896692
60
10
148-284
4 - 38
0.51
0.06±0.05
0.54±0.14
F:AGTCCTGGCTCCTATTCTCATTG R:CTATCCGTCTACCTGTCCGTCTAT
Tabr E 9
GA
KC896694
60
15
329-365
6 - 24
0.79
0.84±0.07
0.80±0.03
F: GTTTGTCTTCCCCACTGA R: CTTAGGACAGGAGAAGTCA
Tabr H 6
TAGA
KC896695
60
14
139-318
4 - 49
0.61
0.46±0.04
0.64±0.04
F:ATCTCTCCAGTCCTTACCA R:TTTACCCTCCACAGTCTCA
Tabr A30
GA
KC896690
65
9
240-296
5 - 33
0.61
0.78±0.60
0.64±0.04
F:AGTCGCGGGTTTGATTCCAGTTA R:ACCCCTTCCCTTTGTTCCTTCAG
Locus, name of locus; Ta, PCR annealing temperature; nt, nucleotides; PIC, polymorphism information content; Ho, observed heterozygosity; He, expected heterozygosity; F, forward; R , reverse; Tabr, Tadarida brasiliensis. Based on nuclear microsatellite markers. Our approach was to cross-amplify hypervariable microsatellites reported for another molossid genus, the South American free-tailed bat, Tadarida brasiliensis (Russell et al., 2005), in order to identify markers which were appropriately variable in our sample of the little free-tailed bat, C. pumilus s. l.
This strategy, if successful, was aimed at producing markers useful in the analyses of population genetic structure, kinship and colony structure of populations of this bat in south eastern Africa and possibly also other regions of Africa.
MATERIALS AND METHODS Analyses were carried out on 74 samples of C. pumilus s. l. from South Eastern Africa (Table 2). TheDNeasy® blood and tissue Kit (QIAGEN Inc., QiagenStraße 1,40724 Hilden, Germany) was used to isolate genomic DNA. Polymerase chain reaction (PCR) amplifications were performed in 25 μl volumes containing: 9 μl DNA (3 ngμl
-1), 0.8 μl sterile water, 2.5 μl 10 X reaction buffer (Super-Therm), 4 μl 25 mM MgCl2 (Super-Therm), 0.5 μl 10 mM deoxynucleoside-triphosphate mixture (dNTPs) (Fer-mentas), 0.2 μl Taq polymerase (5 u/μl) (Super-Therm) and 4 μl of each primer (6 μM) (forward and reverse) per reaction.
The thermal cycling parameters were: 95°C for 1 min, followed by 39 cycles of 95°C for 30 s, annealing temperature
for 30 s, 72°C for 2 min, followed by 72°C for 10 min. The optimal annealing temperature for each primer pair was standardised using gradient PCR (Table 1). The reaction mix comprised 1 µl of PCR product labelled with the dyes 5’ 6-FAM or 5’ HEX, and 0.5 µl of a ROX500 size standard, brought to 15 µl with Hi-Di Formamide (Applied Bio-systems, agents: LifeTechnologies, 200 Smit Street, Fair-land, Johannesburg). STRs were genotyped on an ABI 3500 genetic analyzer (Applied Biosystems) at the South African Sugar Research Institute, Mount Edgecombe, South Africa. Raw allelic peak data were analysed using STR and v. 2.2.30 (Locke et al., 2000).
Genalex (Peakall and Smouse, 2006) was used to calcu-late the observed and expected heterozygosities (Ho and He). The polymorphism information content (PIC) was cal-culated using a web-based PIC calculator (Kemp, 2002).
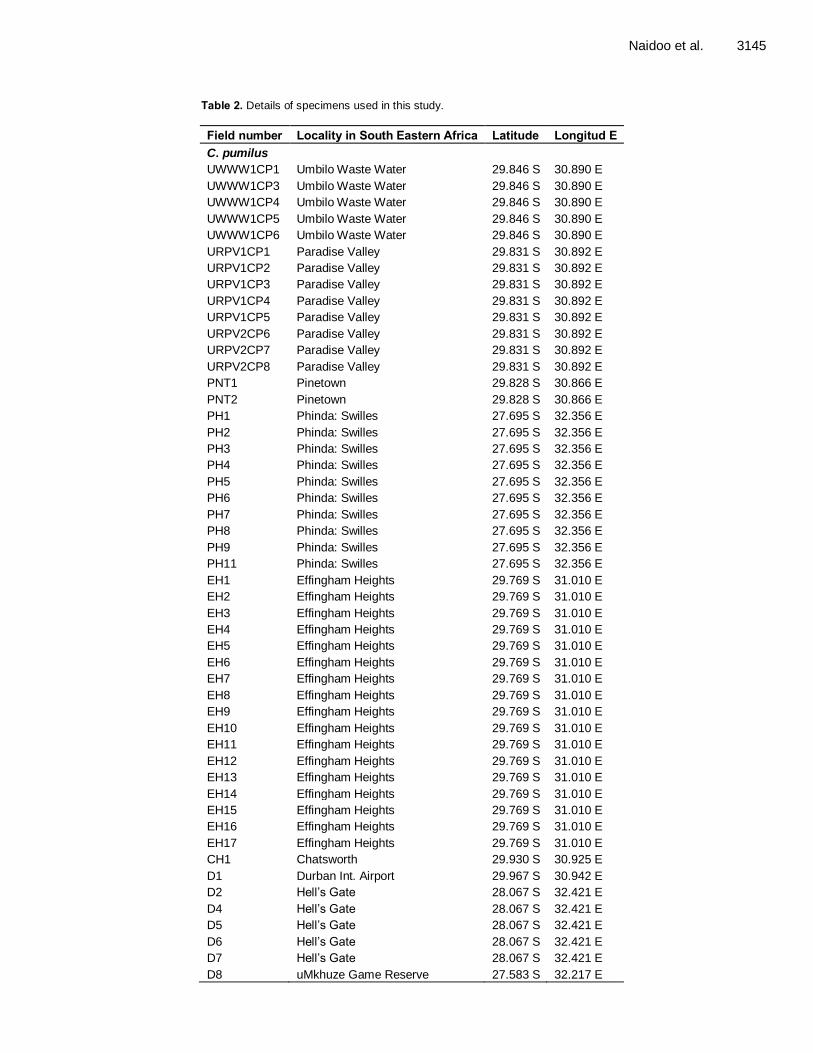
Naidoo et al. 3145
Table 2. Details of specimens used in this study. Field number Locality in South Eastern Africa Latitude Longitud E C. pumilus UWWW1CP1 Umbilo Waste Water 29.846 S 30.890 E UWWW1CP3 Umbilo Waste Water 29.846 S 30.890 E UWWW1CP4 Umbilo Waste Water 29.846 S 30.890 E UWWW1CP5 Umbilo Waste Water 29.846 S 30.890 E UWWW1CP6 Umbilo Waste Water 29.846 S 30.890 E URPV1CP1 Paradise Valley 29.831 S 30.892 E URPV1CP2 Paradise Valley 29.831 S 30.892 E URPV1CP3 Paradise Valley 29.831 S 30.892 E URPV1CP4 Paradise Valley 29.831 S 30.892 E URPV1CP5 Paradise Valley 29.831 S 30.892 E URPV2CP6 Paradise Valley 29.831 S 30.892 E URPV2CP7 Paradise Valley 29.831 S 30.892 E URPV2CP8 Paradise Valley 29.831 S 30.892 E PNT1 Pinetown 29.828 S 30.866 E PNT2 Pinetown 29.828 S 30.866 E PH1 Phinda: Swilles 27.695 S 32.356 E PH2 Phinda: Swilles 27.695 S 32.356 E PH3 Phinda: Swilles 27.695 S 32.356 E PH4 Phinda: Swilles 27.695 S 32.356 E PH5 Phinda: Swilles 27.695 S 32.356 E PH6 Phinda: Swilles 27.695 S 32.356 E PH7 Phinda: Swilles 27.695 S 32.356 E PH8 Phinda: Swilles 27.695 S 32.356 E PH9 Phinda: Swilles 27.695 S 32.356 E PH11 Phinda: Swilles 27.695 S 32.356 E EH1 Effingham Heights 29.769 S 31.010 E EH2 Effingham Heights 29.769 S 31.010 E EH3 Effingham Heights 29.769 S 31.010 E EH4 Effingham Heights 29.769 S 31.010 E EH5 Effingham Heights 29.769 S 31.010 E EH6 Effingham Heights 29.769 S 31.010 E EH7 Effingham Heights 29.769 S 31.010 E EH8 Effingham Heights 29.769 S 31.010 E EH9 Effingham Heights 29.769 S 31.010 E EH10 Effingham Heights 29.769 S 31.010 E EH11 Effingham Heights 29.769 S 31.010 E EH12 Effingham Heights 29.769 S 31.010 E EH13 Effingham Heights 29.769 S 31.010 E EH14 Effingham Heights 29.769 S 31.010 E EH15 Effingham Heights 29.769 S 31.010 E EH16 Effingham Heights 29.769 S 31.010 E EH17 Effingham Heights 29.769 S 31.010 E CH1 Chatsworth 29.930 S 30.925 E D1 Durban Int. Airport 29.967 S 30.942 E D2 Hell’s Gate 28.067 S 32.421 E D4 Hell’s Gate 28.067 S 32.421 E D5 Hell’s Gate 28.067 S 32.421 E D6 Hell’s Gate 28.067 S 32.421 E D7 Hell’s Gate 28.067 S 32.421 E D8 uMkhuze Game Reserve 27.583 S 32.217 E
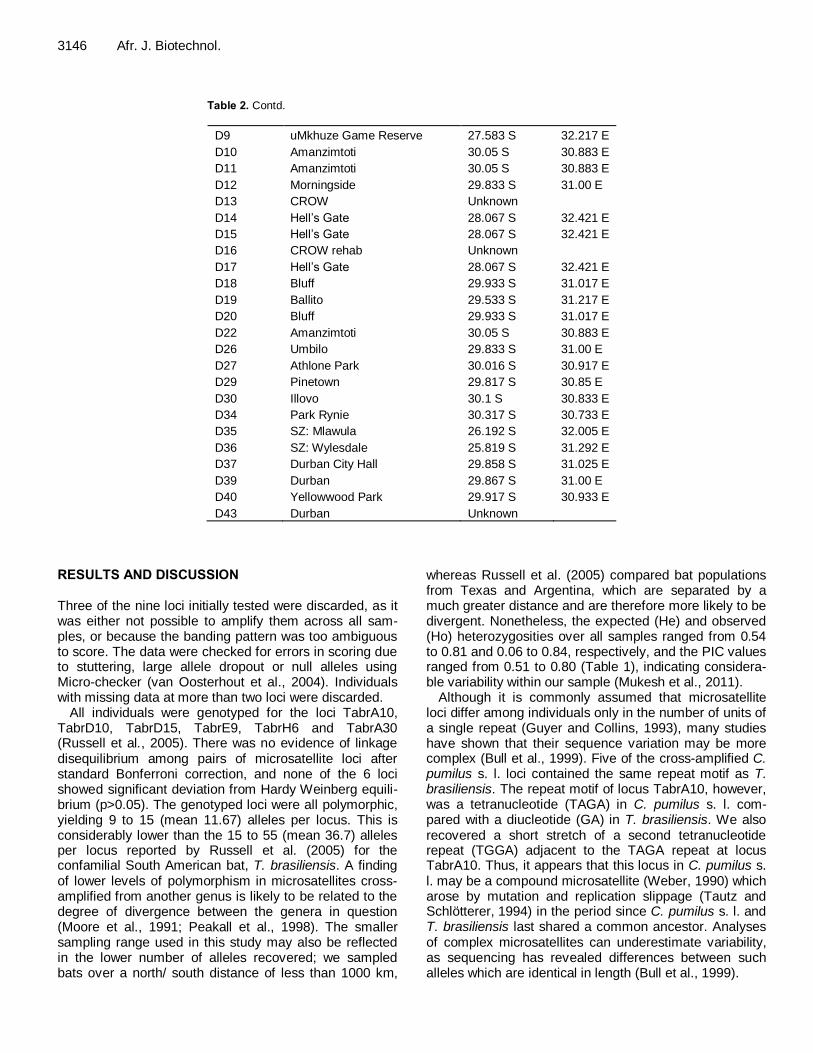
3146 Afr. J. Biotechnol.
Table 2. Contd.
D9 uMkhuze Game Reserve 27.583 S 32.217 E D10 Amanzimtoti 30.05 S 30.883 E D11 Amanzimtoti 30.05 S 30.883 E D12 Morningside 29.833 S 31.00 E D13 CROW Unknown D14 Hell’s Gate 28.067 S 32.421 E D15 Hell’s Gate 28.067 S 32.421 E D16 CROW rehab Unknown D17 Hell’s Gate 28.067 S 32.421 E D18 Bluff 29.933 S 31.017 E D19 Ballito 29.533 S 31.217 E D20 Bluff 29.933 S 31.017 E D22 Amanzimtoti 30.05 S 30.883 E D26 Umbilo 29.833 S 31.00 E D27 Athlone Park 30.016 S 30.917 E D29 Pinetown 29.817 S 30.85 E D30 Illovo 30.1 S 30.833 E D34 Park Rynie 30.317 S 30.733 E D35 SZ: Mlawula 26.192 S 32.005 E D36 SZ: Wylesdale 25.819 S 31.292 E D37 Durban City Hall 29.858 S 31.025 E D39 Durban 29.867 S 31.00 E D40 Yellowwood Park 29.917 S 30.933 E D43 Durban Unknown
RESULTS AND DISCUSSION Three of the nine loci initially tested were discarded, as it was either not possible to amplify them across all sam-ples, or because the banding pattern was too ambiguous to score. The data were checked for errors in scoring due to stuttering, large allele dropout or null alleles using Micro-checker (van Oosterhout et al., 2004). Individuals with missing data at more than two loci were discarded.
All individuals were genotyped for the loci TabrA10, TabrD10, TabrD15, TabrE9, TabrH6 and TabrA30 (Russell et al., 2005). There was no evidence of linkage disequilibrium among pairs of microsatellite loci after standard Bonferroni correction, and none of the 6 loci showed significant deviation from Hardy Weinberg equili-brium (p>0.05). The genotyped loci were all polymorphic, yielding 9 to 15 (mean 11.67) alleles per locus. This is considerably lower than the 15 to 55 (mean 36.7) alleles per locus reported by Russell et al. (2005) for the confamilial South American bat, T. brasiliensis. A finding of lower levels of polymorphism in microsatellites cross-amplified from another genus is likely to be related to the degree of divergence between the genera in question (Moore et al., 1991; Peakall et al., 1998). The smaller sampling range used in this study may also be reflected in the lower number of alleles recovered; we sampled bats over a north/ south distance of less than 1000 km,
whereas Russell et al. (2005) compared bat populations from Texas and Argentina, which are separated by a much greater distance and are therefore more likely to be divergent. Nonetheless, the expected (He) and observed (Ho) heterozygosities over all samples ranged from 0.54 to 0.81 and 0.06 to 0.84, respectively, and the PIC values ranged from 0.51 to 0.80 (Table 1), indicating considera-ble variability within our sample (Mukesh et al., 2011).
Although it is commonly assumed that microsatellite loci differ among individuals only in the number of units of a single repeat (Guyer and Collins, 1993), many studies have shown that their sequence variation may be more complex (Bull et al., 1999). Five of the cross-amplified C. pumilus s. l. loci contained the same repeat motif as T. brasiliensis. The repeat motif of locus TabrA10, however, was a tetranucleotide (TAGA) in C. pumilus s. l. com-pared with a diucleotide (GA) in T. brasiliensis. We also recovered a short stretch of a second tetranucleotide repeat (TGGA) adjacent to the TAGA repeat at locus TabrA10. Thus, it appears that this locus in C. pumilus s. l. may be a compound microsatellite (Weber, 1990) which arose by mutation and replication slippage (Tautz and Schlötterer, 1994) in the period since C. pumilus s. l. and T. brasiliensis last shared a common ancestor. Analyses of complex microsatellites can underestimate variability, as sequencing has revealed differences between such alleles which are identical in length (Bull et al., 1999).
In conclusion, the six polymorphic microsatellite loci reported here are sufficiently variable to prove useful in analyses of mating and paternity studies, as well as in studies of population genetic structure of C. pumilus s. l. from south eastern Africa, and possibly other members of the C. pumilus species complex from Africa and the western Indian Ocean region. ACKNOWLEDGEMENTS We are grateful to the National Science Foundation, South Africa, for the financial support in the form of a grant to Jennifer M. Lamb (JML) and a bursary to Theshnie Naidoo (TN). We are also grateful to Drs Peter Taylor and Corrie Schoeman for the assistance with sample collection. REFERENCES Baker RJ, Bradley RD (2006). Speciation in mammals and the genetic
species concept. J. Mammal. 87(4): 643-662. Bouchard S (1998). Chaerephon pumilus. Mammalian Species 574: 1-
6. Bull N, Juijin JA, Liou M, van Eick MJT, Sinke RJ, Stricker NL, DeYoung
JA, Carlton VEH, Baharloo S,Klomp LWJ et al. (1999). Fine resolution mapping by haplotype evolution: the examples of PFIC1 and BRIC. Hum. Genet. 104:241-148.
Goodman SM, Buccas W, Naidoo T, Ratrimomanarivo F, Taylor PJ, Lamb JM (2010). Patterns of morphological and genetic variation in western Indian Ocean members of the Chaerephon ‘pumilus’ complex (Chiroptera: Molossidae), with the description of a new species from Madagascar. Zootaxa 2551: 1-36.
Guyer MS, Collins FS (1993). The Human Genome Project and the future of medicine.Am. J. Dis. Child.147:1145-1152.
Kemp S (2002). PIC calculator extra.http://www.genomics.liv.ac.uk/animal/pic. Accessed 14 April 2012.
Locke M, Baacke E, Toone R (2000). Veterinary genetics lab STRand version 2.2.30.software programme. Regents of the University of California.
Moore SS, Sargeant LL, King TJ, Mattick JS, Georges M, Hetzel DJ (1991). The conservation of dinucleotide microsatellites among mammalian genomes allows the use fo heterologous PCR primer pairs in closely related species. Genomics 103: 654-660.doi:10.1016/0888- 54391)90448-N.
Mukesh T, Rai ID, Manhan RP, Sathyakumar S (2011). A panel of polymorphic microsatellite markers in Himalayan monal Lophophorus impejanus developed by cross-species amplification, and their applicability in other Galliformes. Eur. J. Wildlife Res. doi 10.1007/s10344-011-0494-1.
Naidoo et al. 3147 Peakall R, Gilmore S, Keys W, Morgante M, Rafalski A (1998). Cross-
species amplification of soybean (Glycine max) simple sequence repeats within the genus and other legume genera: implications for the transferability of SSRs in plants. Mol. Biol. Evol.15: 1275-1287.
Peakall R, Smouse PE (2006). GenAlEx 6.5: genetic analysis in Excel. Population genetic software for teaching and research-an update. Bioinformatics 28: 2537 - 2539.
Peterson RL, Eger JL, Mitchell L (1995). ChiropteresFaune de Madagascar. Museum National d’Histoire Naturelle, vol. 84, Paris. pp.152-167.
Russell AL, Turmelle AS, Brown VA, McCracken GF (2005). Extremely variable di-and tetranucleotide microsatellite loci in Brazilian free-tailed bats (Tadaridabrasiliensis). Mol. Ecol. Notes 5: 669-671.
Simmons NB (2005). Order Chiroptera. In: Wilson DE, Reeder DM (eds.), Mammal Species of the World: A Taxonomic and Geographic Reference, 3rd edition. The John Hopkins University Press, Baltimore. pp. 434-435.
Tautz D, Schlötterer C (1994). Simple sequences. Curr. Opin. Genet. Dev. 4: 832-837.
Taylor PJ, Lamb J, Reddy D, Naidoo T, Ratrimomanarivo F, Richardson E, Goodman SM (2009). Cryptic lineages of little free-tailed bats, Chaerephon pumilus (Chiroptera: Molossidae) from southern Africa and the western Indian Ocean islands. Afr. Zool. 44: 55-70.
Van Oosterhout C, Hutchinson WF, Wills DPM, Shipley P (2004). Software for identifying and correcting genotyping errors in microsatellite data. Mol. Ecol. Notes 4: 535-538.
Weber JL (1990). Informativeness of human (dC-dA)n.(dG-dT)n polymorphisms. Genomics 7: 524-530.
Wilson ACC, Massonet B, Simon JC, Leterme NP, Dolatti L, Llewellyn KS, Figueroa CC, Ramirez CC, Blackman RL, Estoup A, Sunnucks P (2004). Cross-species amplification of microsatellite loci in aphids: assessment and application. Mol. Ecol. Notes 4: 104-109. doi:10.1046/j.1471-8286.2003.00584.x.
Zhou X, Xu Y, Ran J, Yue B, Cao L, Li J (2009). Polymorphic microsatellites in Buff-throated partridge developed by cross-species amplification. Eur. J. Wildlife Res. 51: 81-83.d o i : 10.1007/ s10344-008-0217-4.
Genetically and geographically isolated lineages of atropical bat (Chiroptera: Molossidae) show demographicstability over the late Pleistocene
JENNIFER M. LAMB1*, THESHNIE NAIDOO1, PETER J. TAYLOR1,2,MELANIE NAPIER1, FANJA RATRIMOMANARIVO3,4 and STEVEN M. GOODMAN4,5
1School of Biological and Conservation Sciences, New Biology Building, University ofKwaZulu-Natal, University Road, Westville, KwaZulu-Natal 3630, South Africa2Department of Ecology and Resource Management, School of Environmental Sciences, University ofVenda, Post Bag X5050, Thohoyandou, 0950, South Africa3Département de Biologie Animale, Université d’Antananarivo, BP 906, Antananarivo (101),Madagascar4Vahatra, BP 3972, Antananarivo (101), Madagascar5Field Museum of Natural History, 1400 South Lake Shore Drive, Chicago, Illinois 60605, USA
Received 9 July 2011; revised 2 November 2011; accepted for publication 2 November 2011bij_1853 18..40
The newly described molossid bat, Chaerephon atsinanana Goodman et al., 2010, endemic to eastern Madagascar,shows notably high levels of phylogeographic and genetic structure compared with allopatric Chaerephon leuco-gaster Grandidier, 1869 from western Madagascar. Such highly significant structuring of haplotypes amongaltitudinally and latitudinally stratified population groups is contrary to the expected panmixia in strong flyingbats. The null model of concordance in historical demographic patterns across these two Chaerephon species wasnot supported. Mismatch and Bayesian skyline analyses indicated ancient stable C. atsinanana populations ofconstant size during the last two major Pleistocene glacial periods, making retreat into and expansion from glacialrefugia an unlikely explanation for such high levels of structure, in accordance with expectations for tropical bats.Analyses were consistent with post-refugial population expansion in the less diverse and structured C. leucogasterduring the end of the last Pleistocene glacial period. We hypothesise that the pronounced genetic structuring inC. atsinanana may result from female philopatry. Furthermore, differing demographic histories of the two speciesmay have been shaped by differing climate or habitat preferences, consistent with evidence from MaxEnt ecologicalniche modelling, which shows differences in variables influencing the current predicted distributions. FossilQuaternary pollen deposits further indicate greater stability in past climatic patterns in eastern versus westernMadagascar. © 2012 The Linnean Society of London, Biological Journal of the Linnean Society, 2012, 106, 18–40.
ADDITIONAL KEYWORDS: Chaerephon – environmental niche modelling – genetic structuring – historicaldemography – Madagascar – phylogeography.
INTRODUCTION
Here we examine the population genetic structure,historical demography, and predicted distribution ofChaerephon atsinanana Goodman et al., 2010, anewly described species of molossid bat that isendemic to eastern Madagascar (Goodman et al.,
2010), and contrast this with patterns shown byanother member of the genus occurring on Madagas-car, Chaerephon leucogaster Grandidier, 1869. Thefamily Molossidae (Order Chiroptera), commonlyknown as free-tailed or mastiff bats, comprises 17genera and about 100 species (Simmons, 2005), and isglobally widespread, occurring on every continentexcept Antarctica and on numerous isolated islands.These generally robust bats tend to be strong flyers,*Corresponding author. E-mail: [email protected]
Biological Journal of the Linnean Society, 2012, 106, 18–40. With 5 figures
bs_bs_banner
© 2012 The Linnean Society of London, Biological Journal of the Linnean Society, 2012, 106, 18–4018
with long narrow wings, and catch their insect preyin flight. A study based on nuclear (Rag2) and mito-chondrial (cytochrome b) data (Lamb et al., 2011)shows C. atsinanana to be sister to a clade comprisingC. leucogaster, Chaerephon pusillus Miller, 1902(Comoros and Aldabra) and Chaerephon pumilusCretzschmar, 1830–1831 (southern Africa).
Comparative studies of closely related taxa distrib-uted within a region can shed light on the role ofpopulation processes and historical events in shapingtheir current distribution and genetic structure. Suchtaxa might be expected to show similarities in geneticstructure based on their shared histories (Zink, 1996).Conversely, marked differences in genetic structuremay be attributed to contrasting life history or eco-logical traits (Chen et al., 2010).
In bats, social structure, which can be reflected ingenetic structure, is largely determined by roostingecology (Chen et al., 2010). Dispersal ability is also akey force in shaping the demography of natural popu-lations (Proctor et al., 2004). Both C. atsinanana andC. leucogaster show similar roosting patterns andflight capabilities and, therefore, dispersal capabili-ties, as indicated by aerodynamic aspects of wingshape (Taylor et al., in press). Based on these aspectswe would expect them to show similar patterns ofgenetic structure.
The influence of glacial changes in tropical andsubtropical regions is often minimal (Lessa, Cook &Patton, 2003). The null model for the effect ofglacial changes is concordance in historical demo-graphic and genetic patterns across the twoMalagasy Chaerephon species, C. leucogaster andC. atsinanana (Weir & Schluter, 2004). As there isevidence for expansion of populations of C. leuco-gaster (Ratrimomanarivo et al., 2009), and of thebroadly distributed Malagasy bat, Myotis goudoti(Smith, 1834) (Weyeneth, Goodman & Ruedi, 2011),from Pleistocene refugia, we would expect to finda similar expansion of C. atsinanana. Anticipatedgenetic signatures of range expansions mightinclude star-shaped haplotype networks, an excessof singletons, and unimodal mismatch distributions(Excoffier, Foll & Petit, 2009).
In accord with relatively low levels of phylo-geographic structure in C. leucogaster and a generalexpectation of panmixia over large geographicexpanses in strong flying bats such as Molossidae(Russell, Medellin & McCracken, 2005), we wouldanticipate relatively low levels of structuring in C. at-sinanana. However, the degree of spatial partitioningof genetic diversity in bats is surprisingly variable,and some species show high levels of spatial structureon small (e.g. Kerth, Mayer & König, 2000) or large(e.g. Miller-Butterworth, Jacobs & Harley, 2003)geographic scales.
Mammalian species that show high levels of popu-lation substructure are frequently separated bynon-traversable vicariant barriers (Avise et al., 1987).Malagasy forms of Chaerephon, however, have rela-tively broad elevational distributions, and are likelyto be capable of traversing potential geographic bar-riers such as passes within mountain ranges andriver valleys occurring within their preferred habitat.Thus, when high levels of population substructureoccur in Chaerephon or other molossid species inMadagascar, the cause is unlikely to be vicariance.
If Quaternary climatic vicissitudes were similar inthe eastern and western portions of Madagascar, theabsence of concordance in historical demographic andgenetic patterns between C. leucogaster and C. atsi-nanana would suggest the role of factors other thanPleistocene-era climatic and habitat oscillationsin shaping the demography of C. atsinanana. Forexample, simulations carried out by Knowles &Alvarado-Serrano (2010) indicate that significantlevels of genetic differentiation can occur as a conse-quence of the demography of the expansion processacross a heterogeneous environment, and do not nec-essarily depend on long-term isolation of refugialpopulations. Significant levels of genetic differentia-tion may also occur as a result of behavioural and/orsocial characteristics of a species, such as the ten-dency of females and/or males to return consistentlyto, or remain in, a roost or area (philopatry) (e.g.Worthington-Wilmer et al., 1994).
Adaptation to different ecological factors or habi-tats is an alternative explanation for lack of con-cordance in patterns between the two MalagasyChaerephon species. For example, the species-specificdemographic histories of five passerine bird speciesin Tibet were shown by Qu et al. (2010) to depend onhabitat requirements. Chaerephon leucogaster andC. atsinanana are essentially allopatrically distrib-uted. Chaerephon atsinanana is common in the mesiceastern portion of Madagascar (Fig. 1), across anelevational range from near sea level to 1100 m a.s.l.(Goodman et al., 2010). Chaerephon leucogaster isfound across an elevational range of 0–920 m a.s.l.,and is confined almost exclusively to the more exten-sive and drier western portion of the island (Fig. 1),although there is one record of an individual occur-ring in sympatry with C. atsinanana at Manakara,on the south-east coast (Ratrimomanarivo et al.,2009).
Both C. atsinanana and C. leucogaster are adaptedto the high levels of human-induced environmentalchange on Madagascar, and have established synan-thropic day roosts in buildings. During surveys atnumerous sites in Madagascar, C. atsinanana wasnever found roosting in a natural setting (Goodmanet al., 2010). These authors report that only 1.4% of
GENETIC STRUCTURE IN MALAGASY MOLOSSIDS 19
© 2012 The Linnean Society of London, Biological Journal of the Linnean Society, 2012, 106, 18–40
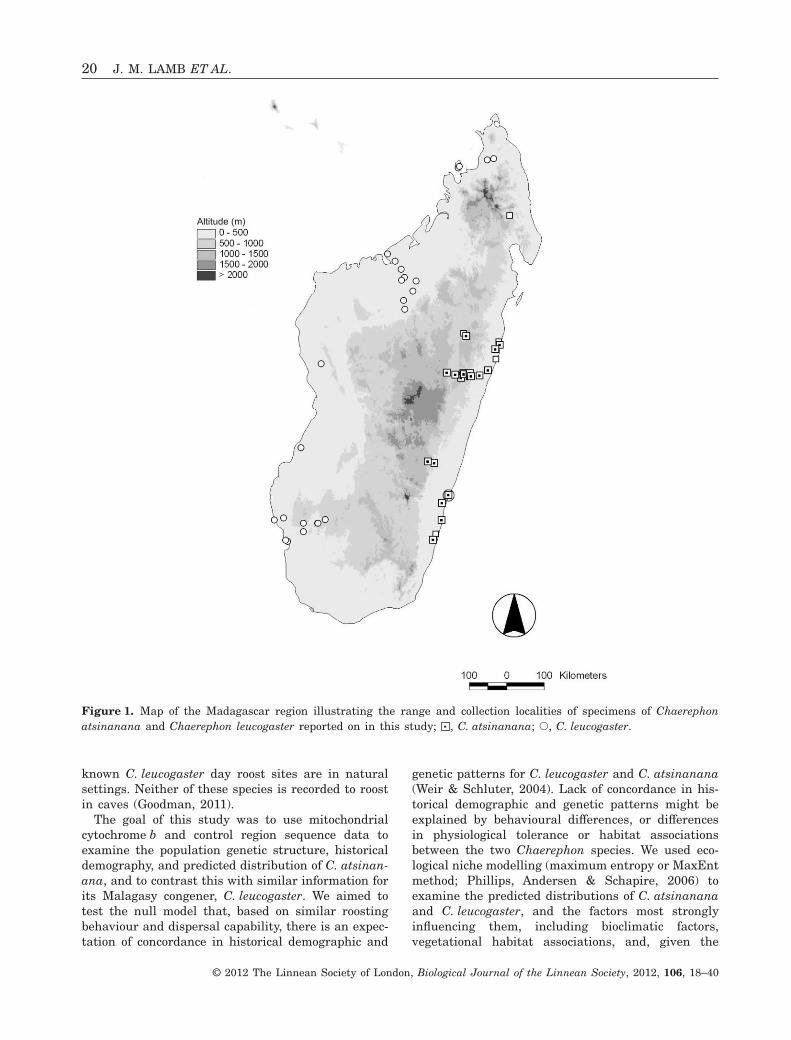
known C. leucogaster day roost sites are in naturalsettings. Neither of these species is recorded to roostin caves (Goodman, 2011).
The goal of this study was to use mitochondrialcytochrome b and control region sequence data toexamine the population genetic structure, historicaldemography, and predicted distribution of C. atsinan-ana, and to contrast this with similar information forits Malagasy congener, C. leucogaster. We aimed totest the null model that, based on similar roostingbehaviour and dispersal capability, there is an expec-tation of concordance in historical demographic and
genetic patterns for C. leucogaster and C. atsinanana(Weir & Schluter, 2004). Lack of concordance in his-torical demographic and genetic patterns might beexplained by behavioural differences, or differencesin physiological tolerance or habitat associationsbetween the two Chaerephon species. We used eco-logical niche modelling (maximum entropy or MaxEntmethod; Phillips, Andersen & Schapire, 2006) toexamine the predicted distributions of C. atsinananaand C. leucogaster, and the factors most stronglyinfluencing them, including bioclimatic factors,vegetational habitat associations, and, given the
Figure 1. Map of the Madagascar region illustrating the range and collection localities of specimens of Chaerephonatsinanana and Chaerephon leucogaster reported on in this study; , C. atsinanana; �, C. leucogaster.
20 J. M. LAMB ET AL.
© 2012 The Linnean Society of London, Biological Journal of the Linnean Society, 2012, 106, 18–40
known synanthropic tendencies of molossids in Mada-gascar, human influence on the landscape.
MATERIAL AND METHODSSTUDY ANIMALS
This study presents new sequence analyses forC. atsinanana (Appendix), and compares these withinformation previously published for C. leucogaster(Ratrimomanarivo et al., 2009). Some new analyses ofthe C. leucogaster data set are presented here forcomparison.
SAMPLING
The mitochondrial cytochrome b and/or control regionwere sequenced for between one and 13 samples ofC. atsinanana from each of 17 localities spanning thedistribution range of this species (Appendix). Themedian number of samples from each locality was fourfor cytochrome b (total 62) and six (total 107)for the control region. Cytochrome b trees wereconstructed using the following molossid taxa asout-groups: C. leucogaster (Madagascar), C. pusillus(Comoros and Aldabra), Mops condylurus Smith, 1833(mainland Africa), Mops leucostigma Allen, 1918(Madagascar) and Mops midas Sundevall, 1843(Madagascar) (Appendix). Animals were handled inaccordance with the guidelines of the American Societyof Mammalogists (Sikes, Gannon & The Animal Careand Use Committee of the American Society of Mam-malogists, 2011). Tissue samples used in this studyincluded wing punches and liver, heart, kidney, ormuscle tissue stored in 80% ethanol or lysis buffer.
DNA ISOLATION, POLYMERASE CHAIN REACTION
(PCR) AMPLIFICATION, AND SEQUENCING
DNA was isolated from tissue samples using aDNeasy® DNA isolation kit (QIAGEN Inc.). PCRamplifications were performed in 25-mL volumes.Each reaction contained 9 mL of DNA (3 ng mL-1),0.8 mL of sterile water, 2.5 mL of 10 X reaction buffer(Super-Therm), 4 mL of 25 mM MgCl2 (Super-Therm),0.5 mL of 10 mM deoxynucleoside-triphosphate mix-ture (dNTPs) (Roche), 0.2 mL of Taq polymerase(5 U mL-1) (Super-Therm), and 4 mL of each primer(6 mM) (forward and reverse) per reaction.
The cytochrome b gene was PCR amplified as twooverlapping double-stranded fragments using primerpairs: L14723 (5′-ACCAATGCAATGAAAAATCATCGTT-3′) and H15553 (5′-TAGGCAAATAGGAAATATCATTCTGGT-3′); L15146 (5′-CATGAGGACAAATATCATTCTGAG-3′) and H15915 (5′-TCTCCATTTCTGGTTTACAAGAC-3′) (Irwin, Kocher & Wilson, 1991).The thermal cycling parameters used were: 94 °C for
4 min, followed by 36 cycles of 94 °C for 40 s, 50 °Cfor 45 s and 72 °C for 40 s, and finally followedby 72 °C for 10 min. The control region was PCRamplified as a single fragment using primers P(5′-TCCTACCATCAGCACCCAAAGC-3′) and E (5′-CCTGAAGTAGGAACCAGATG-3′) (Wilkinson &Chapman, 1991). The thermal cycling parametersused were: 94 °C for 4 min, followed by 40 cycles of94 °C for 60 s, 55 °C for 90 s and 72 °C for 120 s, andfinally followed by 72 °C for 7 min.
Target fragments were purified from excised gelbands using a QIAquick® Gel Extraction Kit(QIAGEN Inc.) and sequenced at InqabaBiotec(Hatfield, Pretoria, South Africa). All fragments weresequenced in both directions to allow for the recon-ciliation of ambiguous positions. Sequences weredeposited in GenBank (Appendix). Sequences werealigned using the CLUSTAL W option (Thompson,Higgins & Gibson, 1994) of BioEdit 5.0.9 for Windows95/98/NT, and by visual inspection.
PHYLOGENETIC ANALYSIS OF CYTOCHROME
B SEQUENCE DATA
Cytochrome b sequences were analysed using theneighbour-joining and maximum parsimony methodsin PAUP 4.0b10 (Swofford, 2002) and Bayesian infer-ence as implemented in MrBayes 3.0b4 (Huelsenbeck& Ronquist, 2001). We used jModelTest 0.1.1 (Posada,2008), applying Akaike’s information criterion todetermine the most appropriate evolutionary model(GTR + G) to use in neighbour-joining, genetic dis-tance and Bayesian analyses. For parsimony analy-ses, starting trees were obtained by stepwise addition.The addition sequence was random, with one treeheld at each step and with ten replicates. A total of1000 bootstrap replicates were carried out for bothmaximum parsimony and neighbour-joining analyses.Bayesian analyses were run using four Markovchains for five million generations each, samplingevery 100 generations. The chains were heated withthe temperature scaling factor T = 0.02. We discardedthe first 20 000 trees as burn-in, in each case havingchecked in a preliminary run that this was more thansufficient to achieve stationarity. The results werepresented as a single haplotype tree (Fig. 2) withsupport from all analysis methods indicated at thenodes.
POPULATION GENETIC ANALYSES
Because of its higher variability, the control regiondata set was primarily used for population geneticanalyses. Relationships among C. atsinanana mito-chondrial DNA control region sequences were analy-sed using a variety of approaches.
GENETIC STRUCTURE IN MALAGASY MOLOSSIDS 21
© 2012 The Linnean Society of London, Biological Journal of the Linnean Society, 2012, 106, 18–40

HAPLOTYPE ANALYSES
We used DnaSP 5.10 (Librado & Rozas, 2009) to gen-erate haplotype data files from the cytochrome b,control region, and concatenated cytochrome b–controlregion data sets. We used the control region data set foranalyses of molecular variance (AMOVA). Genetic dis-tances between the control region and between cyto-chrome b haplotypes were analysed in PAUP 4.0b10(Swofford, 2002) using the most appropriate evolution-ary models, HKY + G and GTR + G, respectively, deter-mined in jModelTest 0.1.1 (Posada, 2008) (Table 1).Statistical parsimony haplotype networks werecreated in TCS from the control region and concat-enated control region–cytochrome b data sets.
Analysis of molecular variance
We tested for significant variance in the distribution ofcontrol region sequences between individuals, popula-tions, and groups of populations using AMOVA, carriedout in ARLEQUIN 3.0 (Excoffier, Laval & Schneider,2005). Fixation indices were calculated in a conven-tional fashion and their significance tested using anon-parametric permutation approach, as described inExcoffier, Smouse & Quattro (1992). Three designswere used for C. atsinanana: (1) no grouping of popu-lations; (2) populations divided into groups north andsouth of 20°S; and (3) populations divided into threealtitudinal groups (0–100, 101–600, and 601–1000 m a.s.l.) (Fig. 3C; Tables 2 & 3). The designs
Hap 1: Chaerephon atsinanana
Hap 2: .C atsinanana
Hap 3: C atsinanana.
Hap 5: .C atsinanana
Hap 4: .C atsinanana
Hap 6: .C atsinanana
Hap 7: .C atsinanana
Hap 11: Chaerephon pusillus
Hap 10: Chaerephon leucogaster
Hap 8: C. leucogaster
Hap 9: C. leucogaster
Hap 12 Mops condylurus:
Hap 13 Mops leucostigma:
Hap 14 Mops midas:
0.01
Madagascar
eastern Madagascar
Madagascar
mainland Africa
Comoros & Aldabra
western Madagascar0.89/88/95
0.96/96/97
1.00/100/100
1.00/100/100
0.99/96/96
1.00/85/94
Figure 2. Bayesian inference tree based on an analysis of 863 nucleotides of the mitochondrial cytochrome b geneillustrating evolutionary relationships between Chaerephon atsinanana haplotypes and out-groups. Nodal support values,including those from congruent maximum parsimony and neighbour-joining analyses, are indicated as: Bayesian posteriorprobability/maximum parsimony bootstrap percentage/neighbour-joining bootstrap percentage.
Table 1. Genetic distances between haplotypes of Chaerephon atsinanana
Haplotype 1 2 3 4 5 6 7
1 – 1.01 0.70 0.82 0.82 0.94 0.822 3.82 – 0.58 0.70 0.23 0.12 0.703 6.35 5.44 – 0.12 0.35 0.47 0.124 5.47 3.00 6.31 – 0.47 0.58 0.235 5.48 3.00 6.32 0.01 – 0.12 0.476 3.84 6.35 7.23 6.33 6.34 – 0.597 3.04 5.49 8.14 5.47 5.48 0.74 –8 2.65 5.06 7.68 5.90 5.90 4.25 3.44
Below diagonal: mean HKY + G genetic distances (%) between haplotype groups based on an analysis of 301 nucleotidesof the mitochondrial control region. Above diagonal: mean GTR + G genetic distances (%) between haplotype groups basedon an analysis of 863 nucleotides of the mitochondrial cytochrome b gene.
22 J. M. LAMB ET AL.
© 2012 The Linnean Society of London, Biological Journal of the Linnean Society, 2012, 106, 18–40
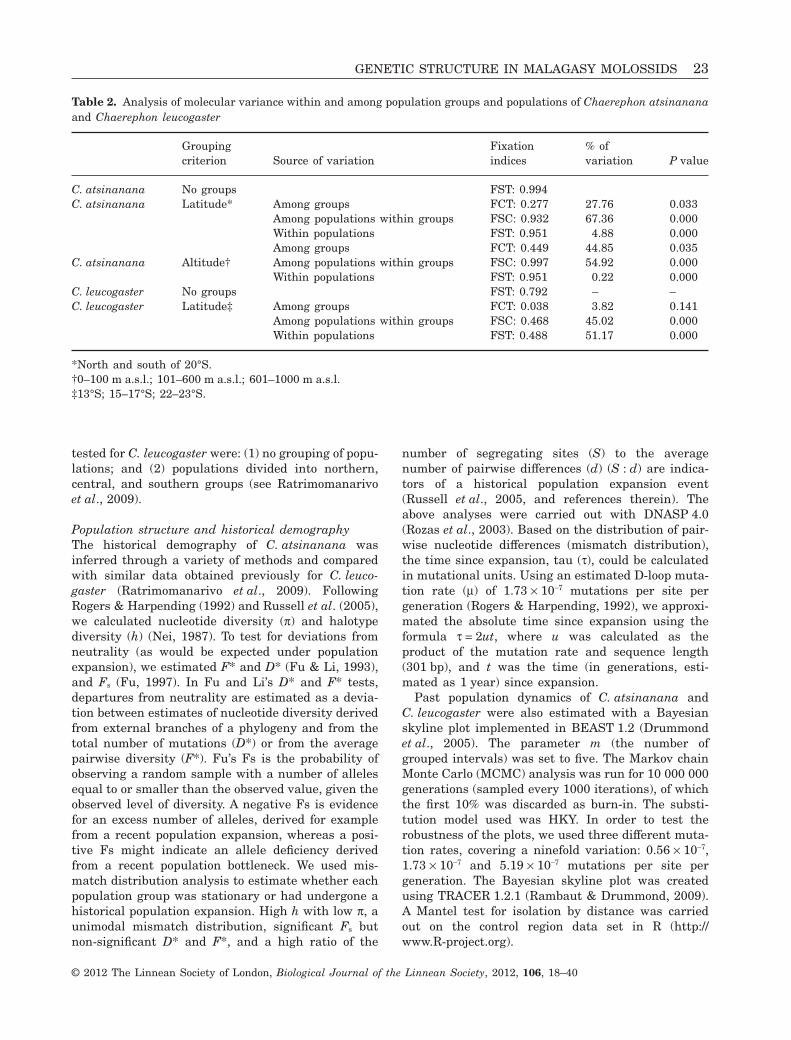
tested for C. leucogaster were: (1) no grouping of popu-lations; and (2) populations divided into northern,central, and southern groups (see Ratrimomanarivoet al., 2009).
Population structure and historical demographyThe historical demography of C. atsinanana wasinferred through a variety of methods and comparedwith similar data obtained previously for C. leuco-gaster (Ratrimomanarivo et al., 2009). FollowingRogers & Harpending (1992) and Russell et al. (2005),we calculated nucleotide diversity (p) and halotypediversity (h) (Nei, 1987). To test for deviations fromneutrality (as would be expected under populationexpansion), we estimated F* and D* (Fu & Li, 1993),and Fs (Fu, 1997). In Fu and Li’s D* and F* tests,departures from neutrality are estimated as a devia-tion between estimates of nucleotide diversity derivedfrom external branches of a phylogeny and from thetotal number of mutations (D*) or from the averagepairwise diversity (F*). Fu’s Fs is the probability ofobserving a random sample with a number of allelesequal to or smaller than the observed value, given theobserved level of diversity. A negative Fs is evidencefor an excess number of alleles, derived for examplefrom a recent population expansion, whereas a posi-tive Fs might indicate an allele deficiency derivedfrom a recent population bottleneck. We used mis-match distribution analysis to estimate whether eachpopulation group was stationary or had undergone ahistorical population expansion. High h with low p, aunimodal mismatch distribution, significant Fs butnon-significant D* and F*, and a high ratio of the
number of segregating sites (S) to the averagenumber of pairwise differences (d) (S : d) are indica-tors of a historical population expansion event(Russell et al., 2005, and references therein). Theabove analyses were carried out with DNASP 4.0(Rozas et al., 2003). Based on the distribution of pair-wise nucleotide differences (mismatch distribution),the time since expansion, tau (t), could be calculatedin mutational units. Using an estimated D-loop muta-tion rate (m) of 1.73 ¥ 10-7 mutations per site pergeneration (Rogers & Harpending, 1992), we approxi-mated the absolute time since expansion using theformula t = 2ut, where u was calculated as theproduct of the mutation rate and sequence length(301 bp), and t was the time (in generations, esti-mated as 1 year) since expansion.
Past population dynamics of C. atsinanana andC. leucogaster were also estimated with a Bayesianskyline plot implemented in BEAST 1.2 (Drummondet al., 2005). The parameter m (the number ofgrouped intervals) was set to five. The Markov chainMonte Carlo (MCMC) analysis was run for 10 000 000generations (sampled every 1000 iterations), of whichthe first 10% was discarded as burn-in. The substi-tution model used was HKY. In order to test therobustness of the plots, we used three different muta-tion rates, covering a ninefold variation: 0.56 ¥ 10-7,1.73 ¥ 10-7 and 5.19 ¥ 10-7 mutations per site pergeneration. The Bayesian skyline plot was createdusing TRACER 1.2.1 (Rambaut & Drummond, 2009).A Mantel test for isolation by distance was carriedout on the control region data set in R (http://www.R-project.org).
Table 2. Analysis of molecular variance within and among population groups and populations of Chaerephon atsinananaand Chaerephon leucogaster
Groupingcriterion Source of variation
Fixationindices
% ofvariation P value
C. atsinanana No groups FST: 0.994C. atsinanana Latitude* Among groups FCT: 0.277 27.76 0.033
Among populations within groups FSC: 0.932 67.36 0.000Within populations FST: 0.951 4.88 0.000Among groups FCT: 0.449 44.85 0.035
C. atsinanana Altitude† Among populations within groups FSC: 0.997 54.92 0.000Within populations FST: 0.951 0.22 0.000
C. leucogaster No groups FST: 0.792 – –C. leucogaster Latitude‡ Among groups FCT: 0.038 3.82 0.141
Among populations within groups FSC: 0.468 45.02 0.000Within populations FST: 0.488 51.17 0.000
*North and south of 20°S.†0–100 m a.s.l.; 101–600 m a.s.l.; 601–1000 m a.s.l.‡13°S; 15–17°S; 22–23°S.
GENETIC STRUCTURE IN MALAGASY MOLOSSIDS 23
© 2012 The Linnean Society of London, Biological Journal of the Linnean Society, 2012, 106, 18–40
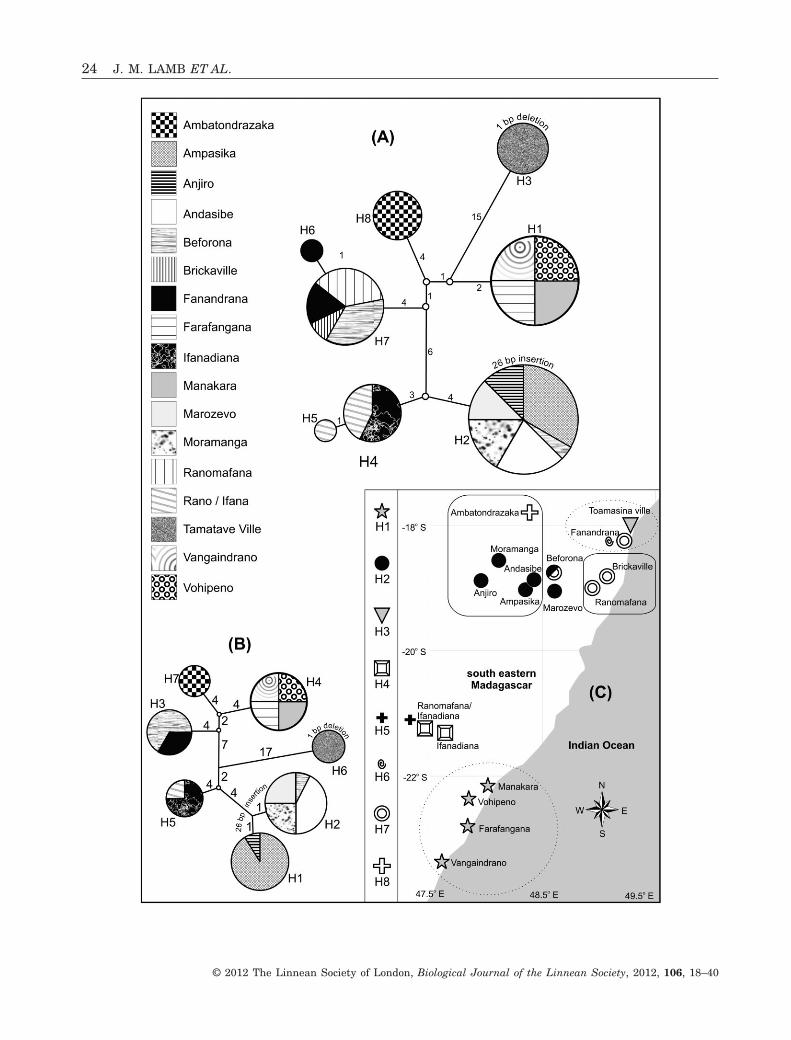
24 J. M. LAMB ET AL.
© 2012 The Linnean Society of London, Biological Journal of the Linnean Society, 2012, 106, 18–40
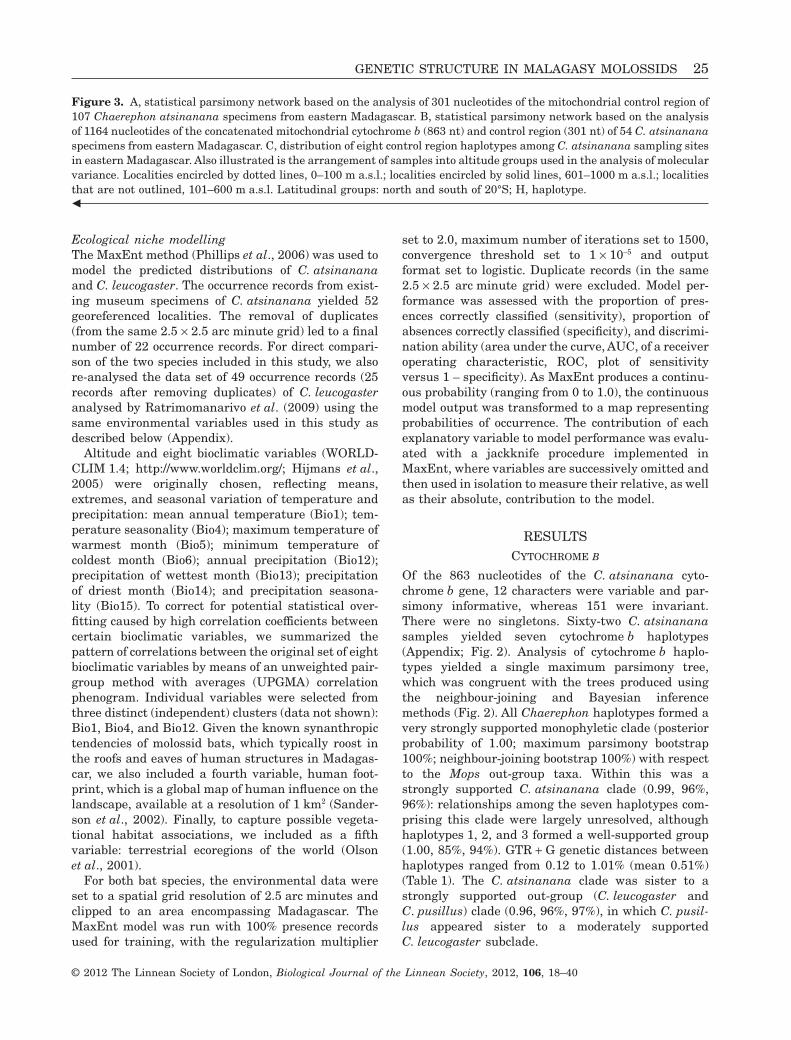
Ecological niche modellingThe MaxEnt method (Phillips et al., 2006) was used tomodel the predicted distributions of C. atsinananaand C. leucogaster. The occurrence records from exist-ing museum specimens of C. atsinanana yielded 52georeferenced localities. The removal of duplicates(from the same 2.5 ¥ 2.5 arc minute grid) led to a finalnumber of 22 occurrence records. For direct compari-son of the two species included in this study, we alsore-analysed the data set of 49 occurrence records (25records after removing duplicates) of C. leucogasteranalysed by Ratrimomanarivo et al. (2009) using thesame environmental variables used in this study asdescribed below (Appendix).
Altitude and eight bioclimatic variables (WORLD-CLIM 1.4; http://www.worldclim.org/; Hijmans et al.,2005) were originally chosen, reflecting means,extremes, and seasonal variation of temperature andprecipitation: mean annual temperature (Bio1); tem-perature seasonality (Bio4); maximum temperature ofwarmest month (Bio5); minimum temperature ofcoldest month (Bio6); annual precipitation (Bio12);precipitation of wettest month (Bio13); precipitationof driest month (Bio14); and precipitation seasona-lity (Bio15). To correct for potential statistical over-fitting caused by high correlation coefficients betweencertain bioclimatic variables, we summarized thepattern of correlations between the original set of eightbioclimatic variables by means of an unweighted pair-group method with averages (UPGMA) correlationphenogram. Individual variables were selected fromthree distinct (independent) clusters (data not shown):Bio1, Bio4, and Bio12. Given the known synanthropictendencies of molossid bats, which typically roost inthe roofs and eaves of human structures in Madagas-car, we also included a fourth variable, human foot-print, which is a global map of human influence on thelandscape, available at a resolution of 1 km2 (Sander-son et al., 2002). Finally, to capture possible vegeta-tional habitat associations, we included as a fifthvariable: terrestrial ecoregions of the world (Olsonet al., 2001).
For both bat species, the environmental data wereset to a spatial grid resolution of 2.5 arc minutes andclipped to an area encompassing Madagascar. TheMaxEnt model was run with 100% presence recordsused for training, with the regularization multiplier
set to 2.0, maximum number of iterations set to 1500,convergence threshold set to 1 ¥ 10-5 and outputformat set to logistic. Duplicate records (in the same2.5 ¥ 2.5 arc minute grid) were excluded. Model per-formance was assessed with the proportion of pres-ences correctly classified (sensitivity), proportion ofabsences correctly classified (specificity), and discrimi-nation ability (area under the curve, AUC, of a receiveroperating characteristic, ROC, plot of sensitivityversus 1 – specificity). As MaxEnt produces a continu-ous probability (ranging from 0 to 1.0), the continuousmodel output was transformed to a map representingprobabilities of occurrence. The contribution of eachexplanatory variable to model performance was evalu-ated with a jackknife procedure implemented inMaxEnt, where variables are successively omitted andthen used in isolation to measure their relative, as wellas their absolute, contribution to the model.
RESULTSCYTOCHROME B
Of the 863 nucleotides of the C. atsinanana cyto-chrome b gene, 12 characters were variable and par-simony informative, whereas 151 were invariant.There were no singletons. Sixty-two C. atsinananasamples yielded seven cytochrome b haplotypes(Appendix; Fig. 2). Analysis of cytochrome b haplo-types yielded a single maximum parsimony tree,which was congruent with the trees produced usingthe neighbour-joining and Bayesian inferencemethods (Fig. 2). All Chaerephon haplotypes formed avery strongly supported monophyletic clade (posteriorprobability of 1.00; maximum parsimony bootstrap100%; neighbour-joining bootstrap 100%) with respectto the Mops out-group taxa. Within this was astrongly supported C. atsinanana clade (0.99, 96%,96%): relationships among the seven haplotypes com-prising this clade were largely unresolved, althoughhaplotypes 1, 2, and 3 formed a well-supported group(1.00, 85%, 94%). GTR + G genetic distances betweenhaplotypes ranged from 0.12 to 1.01% (mean 0.51%)(Table 1). The C. atsinanana clade was sister to astrongly supported out-group (C. leucogaster andC. pusillus) clade (0.96, 96%, 97%), in which C. pusil-lus appeared sister to a moderately supportedC. leucogaster subclade.
Figure 3. A, statistical parsimony network based on the analysis of 301 nucleotides of the mitochondrial control region of107 Chaerephon atsinanana specimens from eastern Madagascar. B, statistical parsimony network based on the analysisof 1164 nucleotides of the concatenated mitochondrial cytochrome b (863 nt) and control region (301 nt) of 54 C. atsinananaspecimens from eastern Madagascar. C, distribution of eight control region haplotypes among C. atsinanana sampling sitesin eastern Madagascar. Also illustrated is the arrangement of samples into altitude groups used in the analysis of molecularvariance. Localities encircled by dotted lines, 0–100 m a.s.l.; localities encircled by solid lines, 601–1000 m a.s.l.; localitiesthat are not outlined, 101–600 m a.s.l. Latitudinal groups: north and south of 20°S; H, haplotype.�
GENETIC STRUCTURE IN MALAGASY MOLOSSIDS 25
© 2012 The Linnean Society of London, Biological Journal of the Linnean Society, 2012, 106, 18–40
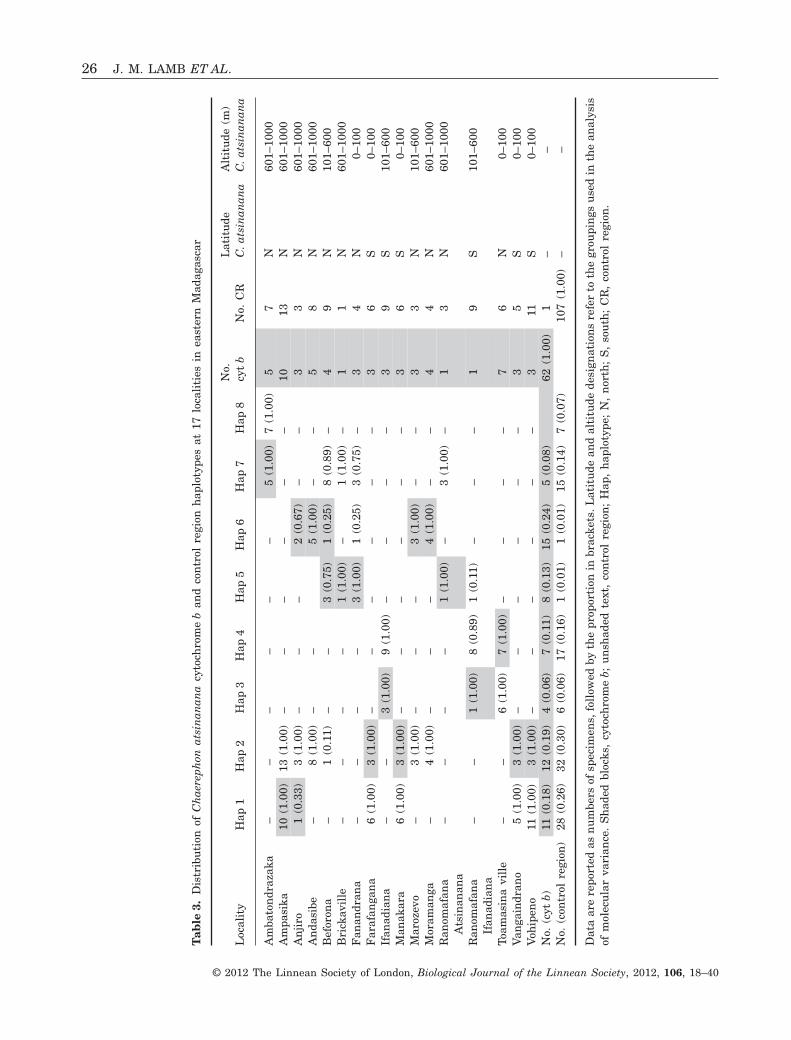
Tab
le3.
Dis
trib
uti
onof
Ch
aere
phon
atsi
nan
ana
cyto
chro
me
ban
dco
ntr
olre
gion
hap
loty
pes
at17
loca
liti
esin
east
ern
Mad
agas
car
Loc
alit
yH
ap1
Hap
2H
ap3
Hap
4H
ap5
Hap
6H
ap7
Hap
8N
o.cy
tb
No.
CR
Lat
itu
deC
.ats
inan
ana
Alt
itu
de(m
)C
.ats
inan
ana
Am
bato
ndr
azak
a–
––
––
–5
(1.0
0)7
(1.0
0)5
7N
601–
1000
Am
pasi
ka10
(1.0
0)13
(1.0
0)–
––
––
–10
13N
601–
1000
An
jiro
1(0
.33)
3(1
.00)
––
–2
(0.6
7)–
–3
3N
601–
1000
An
dasi
be–
8(1
.00)
––
5(1
.00)
––
58
N60
1–10
00B
efor
ona
–1
(0.1
1)–
–3
(0.7
5)1
(0.2
5)8
(0.8
9)–
49
N10
1–60
0B
rick
avil
le–
––
–1
(1.0
0)–
1(1
.00)
–1
1N
601–
1000
Fan
andr
ana
––
––
3(1
.00)
1(0
.25)
3(0
.75)
–3
4N
0–10
0F
araf
anga
na
6(1
.00)
3(1
.00)
––
––
––
36
S0–
100
Ifan
adia
na
––
3(1
.00)
9(1
.00)
––
––
39
S10
1–60
0M
anak
ara
6(1
.00)
3(1
.00)
––
––
––
36
S0–
100
Mar
ozev
o–
3(1
.00)
––
–3
(1.0
0)–
–3
3N
101–
600
Mor
aman
ga–
4(1
.00)
––
–4
(1.0
0)–
–4
4N
601–
1000
Ran
omaf
ana
Ats
inan
ana
––
––
1(1
.00)
–3
(1.0
0)–
13
N60
1–10
00
Ran
omaf
ana
Ifan
adia
na
––
1(1
.00)
8(0
.89)
1(0
.11)
––
–1
9S
101–
600
Toam
asin
avi
lle
––
6(1
.00)
7(1
.00)
––
––
76
N0–
100
Van
gain
dran
o5
(1.0
0)3
(1.0
0)–
––
––
–3
5S
0–10
0V
ohip
eno
11(1
.00)
3(1
.00)
––
––
––
311
S0–
100
No.
(cyt
b)11
(0.1
8)12
(0.1
9)4
(0.0
6)7
(0.1
1)8
(0.1
3)15
(0.2
4)5
(0.0
8)62
(1.0
0)1
––
No.
(con
trol
regi
on)
28(0
.26)
32(0
.30)
6(0
.06)
17(0
.16)
1(0
.01)
1(0
.01)
15(0
.14)
7(0
.07)
107
(1.0
0)–
–
Dat
aar
ere
port
edas
nu
mbe
rsof
spec
imen
s,fo
llow
edby
the
prop
orti
onin
brac
kets
.Lat
itu
dean
dal
titu
dede
sign
atio
ns
refe
rto
the
grou
pin
gsu
sed
inth
ean
alys
isof
mol
ecu
lar
vari
ance
.S
had
edbl
ocks
,cy
toch
rom
eb;
un
shad
edte
xt,
con
trol
regi
on;
Hap
,h
aplo
type
;N
,n
orth
;S
,so
uth
;C
R,
con
trol
regi
on.
26 J. M. LAMB ET AL.
© 2012 The Linnean Society of London, Biological Journal of the Linnean Society, 2012, 106, 18–40
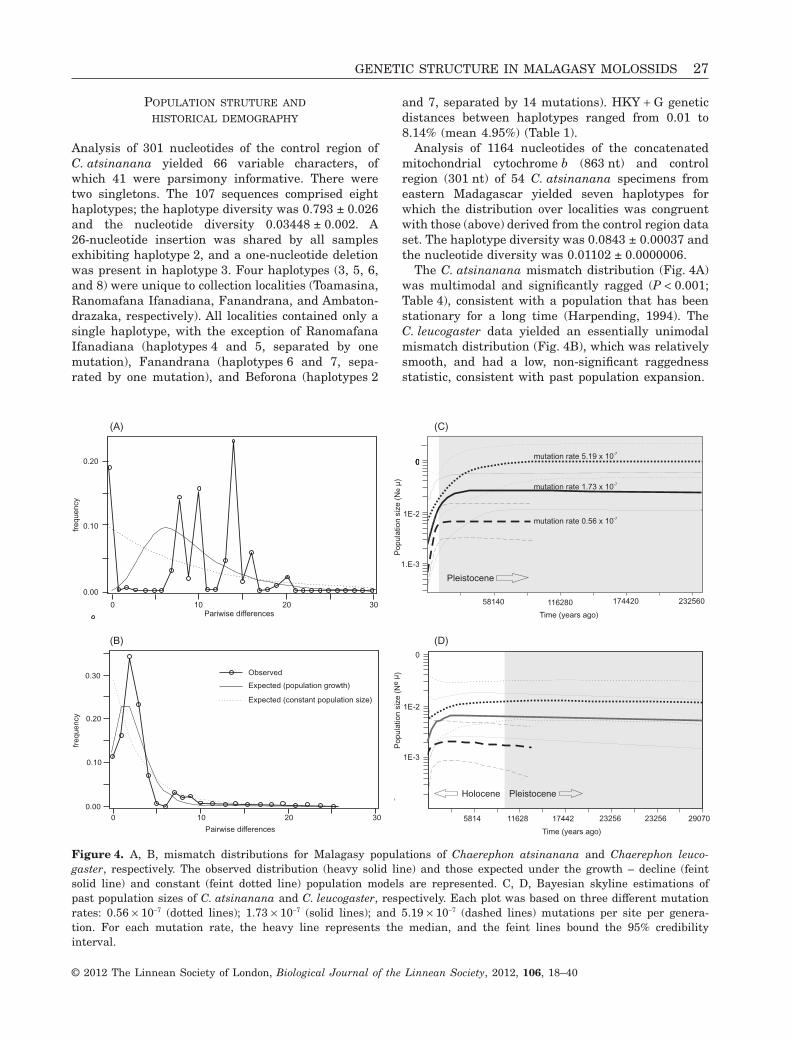
POPULATION STRUTURE AND
HISTORICAL DEMOGRAPHY
Analysis of 301 nucleotides of the control region ofC. atsinanana yielded 66 variable characters, ofwhich 41 were parsimony informative. There weretwo singletons. The 107 sequences comprised eighthaplotypes; the haplotype diversity was 0.793 ± 0.026and the nucleotide diversity 0.03448 ± 0.002. A26-nucleotide insertion was shared by all samplesexhibiting haplotype 2, and a one-nucleotide deletionwas present in haplotype 3. Four haplotypes (3, 5, 6,and 8) were unique to collection localities (Toamasina,Ranomafana Ifanadiana, Fanandrana, and Ambaton-drazaka, respectively). All localities contained only asingle haplotype, with the exception of RanomafanaIfanadiana (haplotypes 4 and 5, separated by onemutation), Fanandrana (haplotypes 6 and 7, sepa-rated by one mutation), and Beforona (haplotypes 2
and 7, separated by 14 mutations). HKY + G geneticdistances between haplotypes ranged from 0.01 to8.14% (mean 4.95%) (Table 1).
Analysis of 1164 nucleotides of the concatenatedmitochondrial cytochrome b (863 nt) and controlregion (301 nt) of 54 C. atsinanana specimens fromeastern Madagascar yielded seven haplotypes forwhich the distribution over localities was congruentwith those (above) derived from the control region dataset. The haplotype diversity was 0.0843 ± 0.00037 andthe nucleotide diversity was 0.01102 ± 0.0000006.
The C. atsinanana mismatch distribution (Fig. 4A)was multimodal and significantly ragged (P < 0.001;Table 4), consistent with a population that has beenstationary for a long time (Harpending, 1994). TheC. leucogaster data yielded an essentially unimodalmismatch distribution (Fig. 4B), which was relativelysmooth, and had a low, non-significant raggednessstatistic, consistent with past population expansion.
0.00
0.10
0.20
0.30
0 10 20 30
Pairwise differences
Expected (constant population size)
Expected (population growth)
Observed
frequency
0 10 20 30
0.00
0.10
0.20
Pariwise differences
frequency
(A)
(B)
Popula
tion s
ize (
)N
eµ
0
1E-2
1E-3
11628 23256 23256 29070174425814
Time (years ago)
PleistoceneHolocene
(D)
11628058140 232560174420
Popula
tion s
ize (
N)
eµ
0
1E-2
1.E-3
Time (years ago)
Pleistocene
(C)
00
mutation rate 1.73 x 10⁻⁷
mutation rate 0.56 x 10⁻⁷
mutation rate 5.19 x 10⁻⁷
Figure 4. A, B, mismatch distributions for Malagasy populations of Chaerephon atsinanana and Chaerephon leuco-gaster, respectively. The observed distribution (heavy solid line) and those expected under the growth – decline (feintsolid line) and constant (feint dotted line) population models are represented. C, D, Bayesian skyline estimations ofpast population sizes of C. atsinanana and C. leucogaster, respectively. Each plot was based on three different mutationrates: 0.56 ¥ 10-7 (dotted lines); 1.73 ¥ 10-7 (solid lines); and 5.19 ¥ 10-7 (dashed lines) mutations per site per genera-tion. For each mutation rate, the heavy line represents the median, and the feint lines bound the 95% credibilityinterval.
GENETIC STRUCTURE IN MALAGASY MOLOSSIDS 27
© 2012 The Linnean Society of London, Biological Journal of the Linnean Society, 2012, 106, 18–40
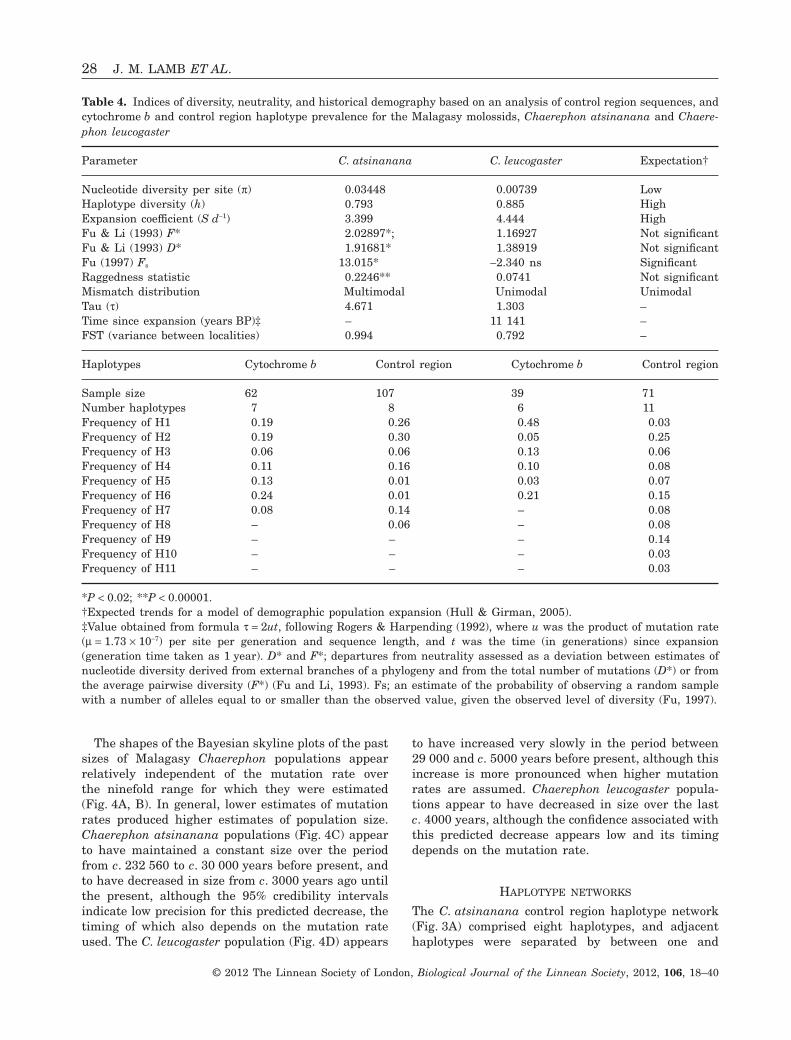
The shapes of the Bayesian skyline plots of the pastsizes of Malagasy Chaerephon populations appearrelatively independent of the mutation rate overthe ninefold range for which they were estimated(Fig. 4A, B). In general, lower estimates of mutationrates produced higher estimates of population size.Chaerephon atsinanana populations (Fig. 4C) appearto have maintained a constant size over the periodfrom c. 232 560 to c. 30 000 years before present, andto have decreased in size from c. 3000 years ago untilthe present, although the 95% credibility intervalsindicate low precision for this predicted decrease, thetiming of which also depends on the mutation rateused. The C. leucogaster population (Fig. 4D) appears
to have increased very slowly in the period between29 000 and c. 5000 years before present, although thisincrease is more pronounced when higher mutationrates are assumed. Chaerephon leucogaster popula-tions appear to have decreased in size over the lastc. 4000 years, although the confidence associated withthis predicted decrease appears low and its timingdepends on the mutation rate.
HAPLOTYPE NETWORKS
The C. atsinanana control region haplotype network(Fig. 3A) comprised eight haplotypes, and adjacenthaplotypes were separated by between one and
Table 4. Indices of diversity, neutrality, and historical demography based on an analysis of control region sequences, andcytochrome b and control region haplotype prevalence for the Malagasy molossids, Chaerephon atsinanana and Chaere-phon leucogaster
Parameter C. atsinanana C. leucogaster Expectation†
Nucleotide diversity per site (p) 0.03448 0.00739 LowHaplotype diversity (h) 0.793 0.885 HighExpansion coefficient (S d-1) 3.399 4.444 HighFu & Li (1993) F* 2.02897*; 1.16927 Not significantFu & Li (1993) D* 1.91681* 1.38919 Not significantFu (1997) Fs 13.015* -2.340 ns SignificantRaggedness statistic 0.2246** 0.0741 Not significantMismatch distribution Multimodal Unimodal UnimodalTau (t) 4.671 1.303 –Time since expansion (years BP)‡ – 11 141 –FST (variance between localities) 0.994 0.792 –
Haplotypes Cytochrome b Control region Cytochrome b Control region
Sample size 62 107 39 71Number haplotypes 7 8 6 11Frequency of H1 0.19 0.26 0.48 0.03Frequency of H2 0.19 0.30 0.05 0.25Frequency of H3 0.06 0.06 0.13 0.06Frequency of H4 0.11 0.16 0.10 0.08Frequency of H5 0.13 0.01 0.03 0.07Frequency of H6 0.24 0.01 0.21 0.15Frequency of H7 0.08 0.14 – 0.08Frequency of H8 – 0.06 – 0.08Frequency of H9 – – – 0.14Frequency of H10 – – – 0.03Frequency of H11 – – – 0.03
*P < 0.02; **P < 0.00001.†Expected trends for a model of demographic population expansion (Hull & Girman, 2005).‡Value obtained from formula t = 2ut, following Rogers & Harpending (1992), where u was the product of mutation rate(m = 1.73 ¥ 10-7) per site per generation and sequence length, and t was the time (in generations) since expansion(generation time taken as 1 year). D* and F*; departures from neutrality assessed as a deviation between estimates ofnucleotide diversity derived from external branches of a phylogeny and from the total number of mutations (D*) or fromthe average pairwise diversity (F*) (Fu and Li, 1993). Fs; an estimate of the probability of observing a random samplewith a number of alleles equal to or smaller than the observed value, given the observed level of diversity (Fu, 1997).
28 J. M. LAMB ET AL.
© 2012 The Linnean Society of London, Biological Journal of the Linnean Society, 2012, 106, 18–40
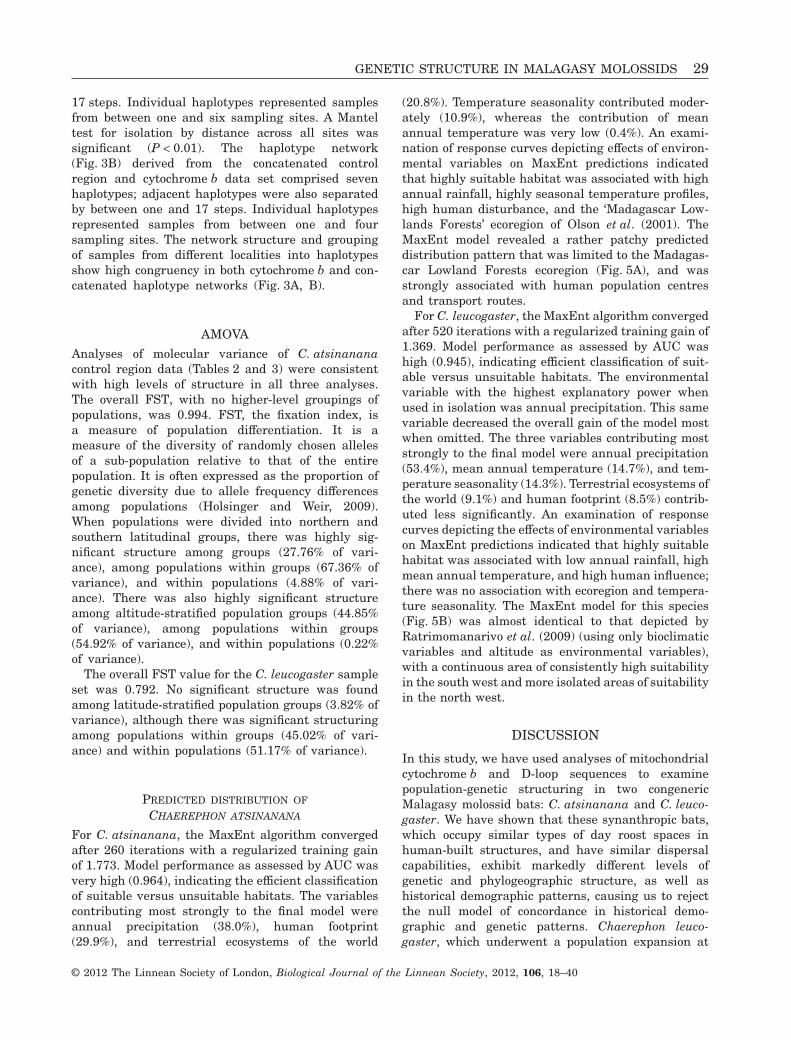
17 steps. Individual haplotypes represented samplesfrom between one and six sampling sites. A Manteltest for isolation by distance across all sites wassignificant (P < 0.01). The haplotype network(Fig. 3B) derived from the concatenated controlregion and cytochrome b data set comprised sevenhaplotypes; adjacent haplotypes were also separatedby between one and 17 steps. Individual haplotypesrepresented samples from between one and foursampling sites. The network structure and groupingof samples from different localities into haplotypesshow high congruency in both cytochrome b and con-catenated haplotype networks (Fig. 3A, B).
AMOVA
Analyses of molecular variance of C. atsinananacontrol region data (Tables 2 and 3) were consistentwith high levels of structure in all three analyses.The overall FST, with no higher-level groupings ofpopulations, was 0.994. FST, the fixation index, isa measure of population differentiation. It is ameasure of the diversity of randomly chosen allelesof a sub-population relative to that of the entirepopulation. It is often expressed as the proportion ofgenetic diversity due to allele frequency differencesamong populations (Holsinger and Weir, 2009).When populations were divided into northern andsouthern latitudinal groups, there was highly sig-nificant structure among groups (27.76% of vari-ance), among populations within groups (67.36% ofvariance), and within populations (4.88% of vari-ance). There was also highly significant structureamong altitude-stratified population groups (44.85%of variance), among populations within groups(54.92% of variance), and within populations (0.22%of variance).
The overall FST value for the C. leucogaster sampleset was 0.792. No significant structure was foundamong latitude-stratified population groups (3.82% ofvariance), although there was significant structuringamong populations within groups (45.02% of vari-ance) and within populations (51.17% of variance).
PREDICTED DISTRIBUTION OF
CHAEREPHON ATSINANANA
For C. atsinanana, the MaxEnt algorithm convergedafter 260 iterations with a regularized training gainof 1.773. Model performance as assessed by AUC wasvery high (0.964), indicating the efficient classificationof suitable versus unsuitable habitats. The variablescontributing most strongly to the final model wereannual precipitation (38.0%), human footprint(29.9%), and terrestrial ecosystems of the world
(20.8%). Temperature seasonality contributed moder-ately (10.9%), whereas the contribution of meanannual temperature was very low (0.4%). An exami-nation of response curves depicting effects of environ-mental variables on MaxEnt predictions indicatedthat highly suitable habitat was associated with highannual rainfall, highly seasonal temperature profiles,high human disturbance, and the ‘Madagascar Low-lands Forests’ ecoregion of Olson et al. (2001). TheMaxEnt model revealed a rather patchy predicteddistribution pattern that was limited to the Madagas-car Lowland Forests ecoregion (Fig. 5A), and wasstrongly associated with human population centresand transport routes.
For C. leucogaster, the MaxEnt algorithm convergedafter 520 iterations with a regularized training gain of1.369. Model performance as assessed by AUC washigh (0.945), indicating efficient classification of suit-able versus unsuitable habitats. The environmentalvariable with the highest explanatory power whenused in isolation was annual precipitation. This samevariable decreased the overall gain of the model mostwhen omitted. The three variables contributing moststrongly to the final model were annual precipitation(53.4%), mean annual temperature (14.7%), and tem-perature seasonality (14.3%). Terrestrial ecosystems ofthe world (9.1%) and human footprint (8.5%) contrib-uted less significantly. An examination of responsecurves depicting the effects of environmental variableson MaxEnt predictions indicated that highly suitablehabitat was associated with low annual rainfall, highmean annual temperature, and high human influence;there was no association with ecoregion and tempera-ture seasonality. The MaxEnt model for this species(Fig. 5B) was almost identical to that depicted byRatrimomanarivo et al. (2009) (using only bioclimaticvariables and altitude as environmental variables),with a continuous area of consistently high suitabilityin the south west and more isolated areas of suitabilityin the north west.
DISCUSSION
In this study, we have used analyses of mitochondrialcytochrome b and D-loop sequences to examinepopulation-genetic structuring in two congenericMalagasy molossid bats: C. atsinanana and C. leuco-gaster. We have shown that these synanthropic bats,which occupy similar types of day roost spaces inhuman-built structures, and have similar dispersalcapabilities, exhibit markedly different levels ofgenetic and phylogeographic structure, as well ashistorical demographic patterns, causing us to rejectthe null model of concordance in historical demo-graphic and genetic patterns. Chaerephon leuco-gaster, which underwent a population expansion at
GENETIC STRUCTURE IN MALAGASY MOLOSSIDS 29
© 2012 The Linnean Society of London, Biological Journal of the Linnean Society, 2012, 106, 18–40
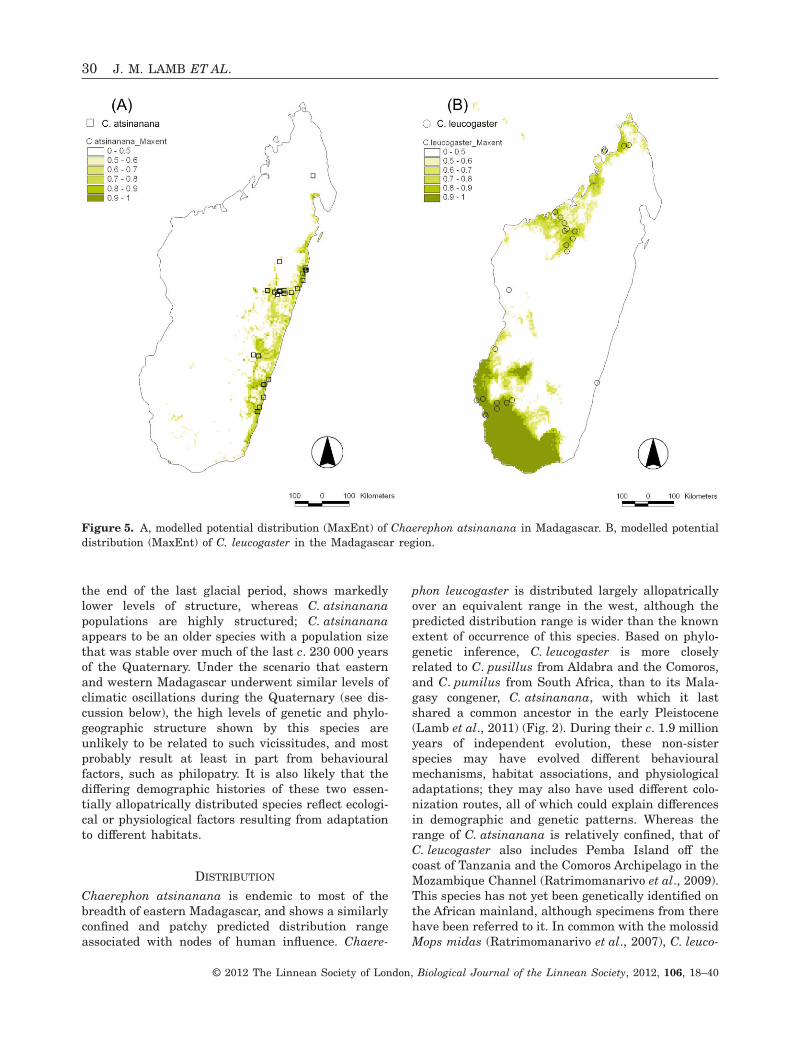
the end of the last glacial period, shows markedlylower levels of structure, whereas C. atsinananapopulations are highly structured; C. atsinananaappears to be an older species with a population sizethat was stable over much of the last c. 230 000 yearsof the Quaternary. Under the scenario that easternand western Madagascar underwent similar levels ofclimatic oscillations during the Quaternary (see dis-cussion below), the high levels of genetic and phylo-geographic structure shown by this species areunlikely to be related to such vicissitudes, and mostprobably result at least in part from behaviouralfactors, such as philopatry. It is also likely that thediffering demographic histories of these two essen-tially allopatrically distributed species reflect ecologi-cal or physiological factors resulting from adaptationto different habitats.
DISTRIBUTION
Chaerephon atsinanana is endemic to most of thebreadth of eastern Madagascar, and shows a similarlyconfined and patchy predicted distribution rangeassociated with nodes of human influence. Chaere-
phon leucogaster is distributed largely allopatricallyover an equivalent range in the west, although thepredicted distribution range is wider than the knownextent of occurrence of this species. Based on phylo-genetic inference, C. leucogaster is more closelyrelated to C. pusillus from Aldabra and the Comoros,and C. pumilus from South Africa, than to its Mala-gasy congener, C. atsinanana, with which it lastshared a common ancestor in the early Pleistocene(Lamb et al., 2011) (Fig. 2). During their c. 1.9 millionyears of independent evolution, these non-sisterspecies may have evolved different behaviouralmechanisms, habitat associations, and physiologicaladaptations; they may also have used different colo-nization routes, all of which could explain differencesin demographic and genetic patterns. Whereas therange of C. atsinanana is relatively confined, that ofC. leucogaster also includes Pemba Island off thecoast of Tanzania and the Comoros Archipelago in theMozambique Channel (Ratrimomanarivo et al., 2009).This species has not yet been genetically identified onthe African mainland, although specimens from therehave been referred to it. In common with the molossidMops midas (Ratrimomanarivo et al., 2007), C. leuco-
Figure 5. A, modelled potential distribution (MaxEnt) of Chaerephon atsinanana in Madagascar. B, modelled potentialdistribution (MaxEnt) of C. leucogaster in the Madagascar region.
30 J. M. LAMB ET AL.
© 2012 The Linnean Society of London, Biological Journal of the Linnean Society, 2012, 106, 18–40
gaster is capable of traversing the several hundredkilometres of open water in the Mozambique Channelbetween Madagascar, African off-shore islands, andthe Comoros.
Although C. leucogaster is primarily a lowlandspecies in the dry west, C. atsinanana is found inthe mesic east at elevations of up to 1100 m a.s.l. Asboth species are capable of sustained high andstrong flight, they are probably able to traversepasses within the mountainous divide separatingtheir distributional ranges, as has been shown bythe recovery of a single C. leucogaster individualfrom Manakara (Fig. 5B), on the east coast, andsympatric with C. atsinanana. It therefore appearsthat the genetic break between these taxa is unlikelyto be a result of vicariance.
In the MaxEnt analyses, the annual precipitationwas most strongly predictive of the distribution ofboth C. atsinanana (found in mesic eastern regions)and C. leucogaster (found in dry western regions).The strong contribution of ecoregion (MadagascarLowland Forest) to the MaxEnt-predicted distributionof C. atsinanana appears to reflect habitat associa-tions. The comparatively much reduced effect of ecore-gion on the predicted distribution of C. leucogaster inrelation to climate (annual precipitation) suggeststhat physiological tolerance rather than habitat asso-ciations may be an important factor in determiningthe distribution of C. leucogaster in the drier westernregion of Madagascar. Such differences in factorsunderlying the distribution of modern species maybe central to understanding the divergent responsesof these two species to historical climatic regimes,as reflected in their radically different populationgenetic profiles.
There are many difficulties inherent in usingpresence-only data (such as museum records) for esti-mating the predicted distributions of species. We notethat the modelled potential distributions of C. atsinan-ana and C. leucogaster (Fig. 5) appear not to include allthe points in the respective models, or to include thesewith low probability. A potential problem with model-ling the distributions of highly mobile organisms, suchas molossid bats, is that they may be sampled outsidetheir most common range. Costa et al. (2010), in theirevaluation of sampling bias in ecological niche model-ling, report that the MaxEnt model seldom fails topredict species collected, and that where this occurs,the numbers of sampled localities are ususally low (i.e.fewer than five), which is not the case in this study.Although MaxEnt tends to be more sensitive to sam-pling bias than other models (Costa et al., 2010), it hasbeen shown to function well with presence-only data,and to perform generally better than alternative ‘cli-matic envelope’ models such as GARP and BIOCLIM(Elith et al., 2006).
HISTORICAL DEMOGRAPHY
Episodes of population growth and decline leave char-acteristic signatures in a mismatch distribution(Rogers & Harpending, 1992). Our population geneticanalyses are consistent with a C. atsinanana popula-tion that has been stationary for a relatively longperiod. Diversity and neutrality statistics are incom-patible with a model of demographic populationexpansion (Hull & Girman, 2005) (Table 4), and themismatch distribution is multimodal and significantlyragged (Fig. 4A; Table 4): characteristic of a popula-tion at demographic equilibrium (Slatkin & Hudson,1991; Rogers & Harpending, 1992; Schneider &Excoffier, 1999). Furthermore, there are very fewsingletons (zero and two in the cytochrome b andcontrol region data sets, respectively), and the haplo-type networks do not exhibit the star shape associ-ated with expanding populations (see Excoffier et al.,2009). Bayesian skyline analysis plots indicatesimilar patterns over a nine-fold variation in esti-mated mutation rate (Fig. 4C), and provide noevidence that C. atsinanana underwent cycles ofpopulation contraction and expansion, correspondingwith glacial and interglacial periods, in the latter partof the Pleistocene.
Our analyses are, however, consistent with a periodof population expansion in C. leucogaster at the end ofthe last Pleistocene glacial cycle. Mismatch distribu-tions indicate that approximately 11 000 years haveelapsed since the period of expansion. The Bayesianskyline plot (Fig. 4D) is consistent with a relativelysmall increase in population size in the periodbetween c. 29 000 and c. 5000 years before present(Fig. 4D), which is more pronounced at higherassumed mutation rates. Such an expansion mayaccount for the markedly lower levels of genetic andphylogeographic structure observed in C. leucogasterrelative to C. atsinanana.
In Madagascar, the climate was cooler and drierin glacial periods, with consequent habitat shifts(Straka, 1995; Burney et al., 2004; Wilmé, Goodman& Ganzhorn, 2006). Data from late Quaternary fossildeposits on Madagascar, particularly pollen cores,provide insight into the levels of climatic changeduring this period. These vicissitudes, which occurredbefore the first colonization of the island by humanssome 2300 years ago (Burney et al., 2004), had adirect impact on vegetation structure, which in turnwould have caused shifts in the distribution of certainanimal species. The western portion of the island,which today has a native vegetation of dry deciduousforest in the north west, grading into dry spiny bushtowards the south west, underwent a drastic changeduring the period from the Late Pleistocene to theHolocene. On the basis of cores falling along a north–
GENETIC STRUCTURE IN MALAGASY MOLOSSIDS 31
© 2012 The Linnean Society of London, Biological Journal of the Linnean Society, 2012, 106, 18–40
south cline in the western lowlands, shifts in plantcommunities were notably more drastic towards thesouth (Burney, 1993, 1999; Matsumoto & Burney,1994). During periods of drier conditions, locallyoccurring species of animals, which still exist today,would have been pushed into geographically limitedzones of ecological refuge, creating genetic bottle-necks, as seen in the low levels of geographical struc-ture amongst existing populations of C. leucogaster.Although few pollen cores from a comparable geologi-cal period are available from the humid forest low-lands of eastern Madagascar, there is good evidencethat this zone was distinctly more stable (Virah-Sawmy, Gillson & Willis, 2009a; Virah-Sawmy, Willis& Gillson, 2009b), and that certain locally occurringanimal populations did not experience the same shiftsin climatic regimes, and were able to maintainaspects of genetic variation, as demonstrated by thephylogeographical structure of C. atsinanana.
Accordingly, a mobile bat such as C. leucogastermay have retreated into refugia on the island, fromwhich such populations may have subsequentlyexpanded during more mesic times (Vences et al.,2009). Nested clade analysis has revealed somesignificant latitudinal phylogeographic associationsbetween north versus central and south versuscentral C. leucogaster haplotype groups (Ratrimoma-narivo et al., 2009), and provides an inference of pastfragmentation followed by range expansion. Suchlatitudinal stratification has also been reportedfor the widespread endemic Malagasy bat, Myotisgoudoti (Weyeneth et al., 2011). These authors reporta zone of admixture between southern and centralnorthern lineages in a broad central band (from 20°to 23°S), located further south than the centralC. leucogaster haplotypes (from 15° to 17°S). Theprobable timing of the population expansions ofC. leucogaster and Myotis goudoti differ, making itunlikely that they were caused by the same historicalclimate shift processes. It is also possible that lati-tudinal genetic differentiation in C. leucogaster is aresult of the process of demographic expansion acrossa spatially and temporally heterogeneous environ-ment, and was not primarily dependent on long-termisolation in glacial refugia (Knowles & Alvarado-Serrano, 2010).
Although Bayesian skyline plots for both species ofChaerephon indicate the possibility of a relativelyrecent decline in population size, this should beregarded with caution, as the confidence limits on thispart of the plot are wide. Both species adapted theirroosting behaviour to take advantage of new sitesafforded by man-made structures in the period follow-ing the arrival of humans on Madagascar. The highlevels of human population pressure experienced onMadagascar in modern times have led to the large-
scale destruction of natural forests to create agricul-tural and residential landscapes (Harper et al., 2007).The construction of buildings is likely to have led to apopulation expansion to fill these new roost sites,which may previously have been a limiting factor, ascompared with foraging habitat per se. If indeed thecase, this would explain why these two bat specieshave adapted to the dramatic transformation of thenatural habitats of the island, and are locally abun-dant (Goodman et al., 2010; Goodman, 2011). Neithermismatch distribution analysis nor the Bayesianskyline plots reflect the massive population expansionof these molossid bats over the last 100 generations,possibly indicative of a limitation in their applicabil-ity at certain time scales.
GENETIC STRUCTURE
The genetic distances between C. atsinanana cyto-chrome b haplotypes ranged from 0.14 to 1.01%(mean 0.54%), which is consistent with intraspecificvariation (Baker & Bradley, 2006), although the highlevels of structure between subpopulations may be asnapshot of populations in the process of speciation.
Analysis of molecular variance reveals significantlevels of genetic structure in both C. atsinanana andC. leucogaster, although structuring in C. atsinananais especially high (overall FST 0.994 versus 0.792). InC. atsinanana, 44.85% of the variance occurs amongthree altitudinal groups ranging from sea level to~ 1000 m a.s.l., the upper level of which is close tocertain passes leading to the western side of the island.Additionally, 27.76% of the variance occurs amongnorth–south population groups. Only 0.22% (altitude)and 4.88% (latitude) occurs within populations(Table 2). In contrast, AMOVA of C. leucogaster controlregion data shows non-significant structuring amonglatitudinal groups (3.82% of the variance), with most ofthe variance (51.10%) occurring among populations.
Most locales exhibit a single C. atsinanana haplo-type, and haplotypes, if shared, tend to be common toadjacent localities (Fig. 3). The major C. atsinananacontrol region haplotypes are separated by highnumbers of mutational steps (Fig. 3), consistent witha mean divergence between haplotypes of 4.95%, withsome haplotypes differing by up to 8.14%. Thus, C. at-sinanana comprises a set of highly diverse, structuredsubpopulations. Such levels of genetic differentiationcould be caused by isolation and genetic drift (Atar-touch et al., 2006), which begs the question as to thecause of the isolation: up to 45% of the variancebetween groups can be explained by ecological vari-ables such as altitude and latitude. However, thevariance among populations is extremely low (as lowas 0.22%), making it likely that other factors arecontributing to the high level of genetic structuring inthis species.
32 J. M. LAMB ET AL.
© 2012 The Linnean Society of London, Biological Journal of the Linnean Society, 2012, 106, 18–40
Interestingly, the control region genetic distancesbetween populations of C. atsinanana are similar tothose reported for another species of endemic Mala-gasy bat, Myotis goudoti (mean 4.2%; maximum 9%;Weyeneth et al., 2011) and the relatively less mobileAustralian ghost bat, Macroderma gigas (Dobson,1887) (control region divergence up to 6%, 87% ofvariance among populations; Worthington-Wilmeret al., 1994). As is the case for Macroderma gigas,C. atsinanana fits Avise et al.’s (1987) category 1, inwhich the major haplotypes of deep gene trees arerestricted to particular areas, indicating popula-tions that have been isolated for a long period.Worthington-Wilmer et al. (1994) proposed thisextreme structuring to be a consequence of long-termisolation of subpopulations, accentuated by femalephilopatry. Furthermore, in the case of C. atsinanana,relatively stable climatic periods during the Quater-nary of eastern Madagascar did not result in geneticbottlenecks, and allowed this taxon to retain phylo-geographic structure.
A significant degree of isolation by distance inC. atsinanana further indicates the limitation offemale-mediated gene flow between localities. AsC. atsinanana presumably has the capacity to be ahighly mobile bat, and occupies a considerable swathof eastern Madagascar that contains no significantgeographic barriers, particularly mountain ranges,the low level of gene flow between subpopulations islikely to be maintained by behavioural aspects asso-ciated with dispersal. An excellent example is femalephilopatry, consistent with our analyses of a mater-nally inherited marker reflecting movements offemales (Ballard & Whitlock, 2004). Future work willfocus on the sequencing of nuclear genes and analysisof microsatellites in order to obtain a finer-scalepicture of population genetic structuring in C. atsi-nanana, and to assess the male contribution to geneflow. Use of a multilocus approach may also addressthe possibility that the patterns observed here reflectselection rather than population history, as muta-tion, drift, and selection operate independently onunlinked loci (Knowles, 2004).
We conclude that the Malagasy molossid bats C. at-sinanana and C. leucogaster show markedly differentdemographic patterns, as well as different levels ofpopulation genetic and phylogeographic structuring.The lower levels of structure in C. leucogaster mayat least partly reflect a late-Pleistocene populationexpansion, subsequent to a genetic bottleneck. Thehigh levels of population structure in C. atsinananaare likely to reflect ancient genetic subdivisions, pos-sibly stemming from low levels of gene flow caused byfemale philopatry, and maintained by the climaticstability of eastern Madagascar during Quaternaryglacial cycling. Furthermore, differing demographic
histories of the two species may have been shaped bydiffering climate or habitat preferences. MaxEnt eco-logical niche modelling predicts the occurrence ofC. atsinanana in areas of high rainfall, covered withlowland forest and associated with high human influ-ence. In contrast, C. leucogaster is most stronglyassociated with areas of low rainfall, suggesting thatphysiological tolerance is an important determinantof its distribution.
ACKNOWLEDGEMENTS
We are grateful to the Département de BiologieAnimale for various administrative help and theDirection du Système des Aires Protégées, DirectionGénérale de Environnement et des Forêts, for issuingpermits for the collection and exporting of specimens.We thankfully acknowledge financial support fromthe Volkswagen Foundation, The John D. and Cathe-rine T. MacArthur Foundation, and the NationalResearch Foundation (South Africa) for both field-work and laboratory work. We are grateful to thereviewers for their constructive and insightful com-ments and advice.
REFERENCES
Atartouch T, Rüber L, Gonzalez EG, Albert EM, Rami M,Dakkak A, Zardoya R. 2006. Signature of an early geneticbottleneck in a population of Moroccan sardines (Sardinapilchardus). Molecular Phylogenetics and Evolution 39:373–383.
Avise J, Arnold JC, Ball RM, Bermingham E, Lamb T,Neigel JE, Reeb CA, Saunders NC. 1987. Intraspecificphylogeography: the mtDna bridge between populationgenetics and systematics. Annual Review of Ecology andSystematics 18: 489–522.
Baker RJ, Bradley RD. 2006. Speciation in mammals andthe genetic species concept. Journal of Mammalogy 87:643–662.
Ballard JWO, Whitlock MC. 2004. The incomplete naturalhistory of mitochondria. Molecular Ecology 13: 729–744.
Burney DA. 1993. Late Holocene environmental changes inarid southwestern Madagascar. Quaternary Research 40:98–106.
Burney DA. 1999. Rates, patterns, and processes of land-scape transformation and extinction in Madagascar. In:MacPhee RDE, ed. Extinctions in near time: causes, contexts,and consequences. New York: Plenum, 145–164.
Burney DA, Burney LP, Godfrey LR, Jungers WL,Goodman SM, Wright HT, Jull AJT. 2004. A chronologyfor late prehistoric Madagascar. Journal of Human Evolu-tion 47: 25–63.
Chen J, Rossiter SJ, Flanders JR, Sun Y, Hua P,Miller-Butterworth C, Liu X, Rajan KE, Zhang S. 2010.Contrasting genetic structure in two co-distributed speciesof Old World fruit bat. PLoS ONE 5: e13903.
GENETIC STRUCTURE IN MALAGASY MOLOSSIDS 33
© 2012 The Linnean Society of London, Biological Journal of the Linnean Society, 2012, 106, 18–40
Costa GC, Nogueira C, Machado RB, Colli GR. 2010.Sampling bias and the use of ecological niche modeling inconservation planning: a field evaluation in a biodiversityhotspot. Biodiversity and Conservation 19: 883–899.
Drummond AJ, Rambaut A, Shapiro B, Pybus O. 2005.Bayesian coalescent inference of past population dynamicsfrom molecular sequences. Molecular Biology and Evolution22: 1185–1192.
Elith J, Graham CJ, Anderson M, Dudick M, Ferrier S.2006. Novel methods improve prediction of species’ distri-butions from occurrence data. Ecography 29: 129–151.
Excoffier L, Foll M, Petit RJ. 2009. Genetic consequences ofrange expansions. Annual Review of Ecology, Evolution, andSystematics 40: 481–501.
Excoffier L, Laval G, Schneider S. 2005. Arlequin ver. 3.0:an integrated software package for populations geneticsdata analysis. Evolutionary Bioinformatics Online 1: 47–50.
Excoffier L, Smouse P, Quattro J. 1992. Analysis ofmolecular variance inferred from metric distances amongDNA haplotypes: application to human mitochondrial DNArestriction data. Genetics 131: 479–491.
Fu XY. 1997. Statistical tests of neutrality of mutationsagainst population growth, hitchhiking and backgroundselection. Genetics 147: 915–925.
Fu XY, Li WH. 1993. Statistical tests of neutrality of muta-tions. Genetics 133: 693–709.
Goodman SM. 2011. Les chauves-souris de Madagascar.Antananarivo: Association Vahatra.
Goodman SM, Buccas W, Naidoo T, Ratrimomanarivo F,Taylor PJ, Lamb J. 2010. Patterns of morphological andgenetic variation in western Indian Ocean members of theChaerephon ‘pumilus’ complex Chiroptera: molossidae, withthe description of a new species from Madagascar. Zootaxa2551: 1–36.
Harpending HC. 1994. Signature of ancient populationgrowth in a low resolution mitochondrial DNA mismatchdistribution. Human Biology 66: 591–600.
Harper GJ, Steininger MK, Tucker CJ, Juhn D,Hawkins F. 2007. Fifty years of deforestation and frag-mentation in Madagascar. Environmental Conservation 34:325–333.
Hijmans RJ, Cameron SE, Parra JL, Jones PG, Jarvis A.2005. Very high resolution interpolated climate surfaces forglobal land areas. International Journal of Climatology 25:1965–1978.
Holsinger KE, Weir BS. 2009. Genetics in geographicallystructured populations: defining, estimating and interpret-ing FST. Nat Rev Genet 10 (9): 639–650.
Huelsenbeck JP, Ronquist F. 2001. MrBayes: a Bayesianinference of phylogeny. Bioinformatics 17: 754–755.
Hull JM, Girman DJ. 2005. Effects of Holocene climatechange on the historical demography of migrating sharp-shinned hawks (Accipiter striatus velox) in South America.Molecular Ecology 14: 159–170.
Irwin DM, Kocher TD, Wilson AC. 1991. Evolution ofthe cytochrome-b gene of mammals. Journal of MolecularEvolution 32: 128–144.
Kerth G, Mayer F, König B. 2000. Mitochondrial DNA(mtdna) reveals that female Bechstein bats live in closedsocieties. Molecular Ecology 9: 793–800.
Knowles LL. 2004. Exploring the population genetic conse-quences of the colonization process with spatio-temporallyexplicit models: insights from coupled ecological, demo-graphic and genetic models in montane grasshoppers.Molecular Ecology 19: 3727–3745.
Knowles LL, Alvarado-Serrano DF. 2010. The burgeoningfield of statistical phylogeography. Journal of EvolutionaryBiology 17: 1–10.
Lamb JM, Ralph TMC, Naidoo T, Taylor PJ, Ratrimo-manarivo F, Stanley WT, Goodman SM. 2011. Toward amolecular phylogeny for the Molossidae (Chiroptera) of theAfro-Malagasy region. Acta Chiropterologica 13: 1–16.
Lessa EP, Cook JA, Patton JL. 2003. Genetic footprints ofdemographic expansion in North America, but not Amazo-nia, during the Late Quaternary. Proceedings of theNational Academy of Sciences, USA 100: 10331–10334.
Librado P, Rozas J. 2009. Dnasp v5: a software for compre-hensive analysis of DNA polymorphism data. Bioinformatics25: 1451–1452.
Matsumoto K, Burney DA. 1994. Late Holocene environ-mental changes at Lake Mitsinjo, northwestern Madagas-car. The Holocene 4: 16–24.
Miller-Butterworth CM, Jacobs DS, Harley EH. 2003.Strong population substructure is correlated with morphol-ogy and ecology in a migratory bat. Nature 424: 187–191.
Nei M. 1987. Molecular evolutionary genetics. New York, NY:Columbia University Press.
Olson DM, Dinerstein E, Wikramanaya ED, Burgess ND,Powell GVN, Underwood EC, D’Amico JA, Itoua I,Strand HE, Morrison JC, Loucks CJ, Allnutt TF, Rick-etts TH, Kura Y, Lamoreux JF, Wettengel WW, HedaoP, Kassem KR. 2001. Terrestrial ecoregions of the world: anew map of life on earth. Bioscience 51: 933–938.
Phillips SJ, Andersen RP, Schapire RE. 2006. Maximumentropy modelling of species geographic distributions. Eco-logical Modelling 190: 231–359.
Posada D. 2008. jModelTest: phylogenetic model averaging.Molecular Biology and Evolution 25: 1253–1256.
Proctor MF, McLellan BN, Strobeck C, Barclay RMR.2004. Gender-specific dispersal distances of grizzly bearsestimated by genetic analysis. Canadian Journal of Zoology82: 1108–1118.
Qu Y, Lei F, Zhang R, Lu X. 2010. Comparative phylogeog-raphy of five avian species: implications for Pleistoceneevolutionary history in the Qinghai-Tibetan plateau.Molecular Ecology 19: 338–351.
Rambaut A, Drummond AJ. 2009. Tracer v. 1.5: mcmc tracefile analyser. Available at: http://tree.bio.ed.ac.uk/software/tracer/.
Ratrimomanarivo FH, Goodman SM, Stanley WT,Naidoo T, Taylor PJ, Lamb JM. 2009. Geographic andphylogeographic variation in Chaerephon leucogaster (Chi-roptera: Molossidae) of Madagascar and the western IndianOcean islands of Mayotte and Pemba. Acta Chiropterologica11: 25–52.
34 J. M. LAMB ET AL.
© 2012 The Linnean Society of London, Biological Journal of the Linnean Society, 2012, 106, 18–40
Ratrimomanarivo FH, Vivian J, Goodman SM, Lamb J.2007. Morphological and molecular assessment of the spe-cific status of Mops midas (Chiroptera: Molossidae) fromMadagascar and Africa. African Zoology 42: 237–253.
Rogers AR, Harpending H. 1992. Population growth makeswaves in the distribution of pairwise genetic differences.Molecular Biology and Evolution 9: 552–569.
Rozas J, Sanchez-DelBarrio JC, Messeguer X, Rozas R.2003. Dnasp, DNA polymorphism analyses by the coales-cent and other methods. Bioinformatics 19: 2496–2497.
Russell AL, Medellin RA, McCracken GF. 2005. Geneticvariation and migration in the Mexican free-tailed bat(Tadarida brasiliensis mexicana). Molecular Ecology 14:2207–2222.
Sanderson EW, Redford KH, Vedder A, Coppolillo PB,Ward SE. 2002. A conceptual model for conservation plan-ning based on landscape species requirements. Landscapeand Urban Planning 58: 41–56.
Schneider S, Excoffier L. 1999. Estimation of past demo-graphic parameters from the distribution of pairwise diver-gences when the mutation rates vary among sites:application to human mitochondrial DNA. Genetics 152:1079–1089.
Sikes RS, Gannon WL, The Animal Care and Use Com-mittee of the American Society of Mammalogists.2011. Guidelines of the American Society of Mammalogistsfor the use of wild mammals in research. Journal of Mam-malogy 92: 235–253.
Simmons NB. 2005. Order Chiroptera. In: Wilson DE,Reeder DM, eds. Mammal species of the World: a taxonomicand geographical reference, 3rd edn. Baltimore, MD: JohnsHopkins University Press, 312–529.
Slatkin M, Hudson RR. 1991. Pairwise comparisons of mito-chondrial DNA sequences in stable and exponentiallygrowing populations. Genetics 129: 555–562.
Straka H. 1995. Histoire de la végétation de Madagascaroriental dans les derniers 100 millénaires. In: Lourenço WR,ed. Biogéographie de Madagascar. Paris: EditionsORSTOM, 37–47.
Swofford DL. 2002. Paup*: phylogenetic analysis using
parsimony (*and other methods), version 4.0b10. Sunder-land, MA: Sinauer Associates.
Taylor PJ, Goodman SM, Schoeman MC, Ratrimoma-narivo FH, Lamb JM. In Press. Wing loading correlatesnegatively with genetic structuring in eight species of Afro-Malagasy bats (Molossidae). Acta Chiropterologica.
Thompson JD, Higgins DG, Gibson TJ. 1994. Clustal-W –improving the sensitivity of progressive multiple sequencealignment through sequence weighting, position-specific gappenalties and weight matrix choice. Nucleic Acids Research22: 4673–4680.
Vences M, Wollenberg KC, Vieites DR, Lees DC. 2009.Madagascar as a model region of species diversification.Trends in Ecology and Evolution 24: 456–465.
Virah-Sawmy M, Gillson L, Willis KJ. 2009a. How doesspatial heterogeneity influence resilience to climaticchanges? Ecological dynamics in southeast Madagascar.Ecological Monographs 79: 557–574.
Virah-Sawmy M, Willis KJ, Gillson L. 2009b. Thresholdresponse of Madagascar littoral forest to sea-level rise.Global Ecology and Biogeography 18: 98–110.
Weir JT, Schluter D. 2004. Ice sheets promote speciation inboreal birds. Proceedings of the Royal Society of London.Series B: Biological Sciences 271: 1881–1887.
Weyeneth N, Goodman SM, Ruedi M. 2011. Do diversifi-cation models of Madagascar biota explain the populationstructure of the endemic bat Myotis goudoti (Chiroptera:Vespertilionidae)? Journal of Biogegography 38: 44–54.
Wilkinson GS, Chapman AM. 1991. Length and sequencevariation in evening bat d-loop mtdna. Genetics 128: 607–617.
Wilmé L, Goodman SM, Ganzhorn JU. 2006. Biogeo-graphic evolution of Madagascar microendemic biota.Science 312: 1063–1065.
Worthington-Wilmer J, Moritz C, Hall L, Toop J. 1994.Extreme population structuring in the threatened ghost bat,Macroderma gigas: evidence from mitochondrial DNA. Pro-ceedings of the Royal Society of London 257: 193–198.
Zink RM. 1996. Comparative phylogeography in NorthAmerican birds. Evolution 50: 308–317.
GENETIC STRUCTURE IN MALAGASY MOLOSSIDS 35
© 2012 The Linnean Society of London, Biological Journal of the Linnean Society, 2012, 106, 18–40
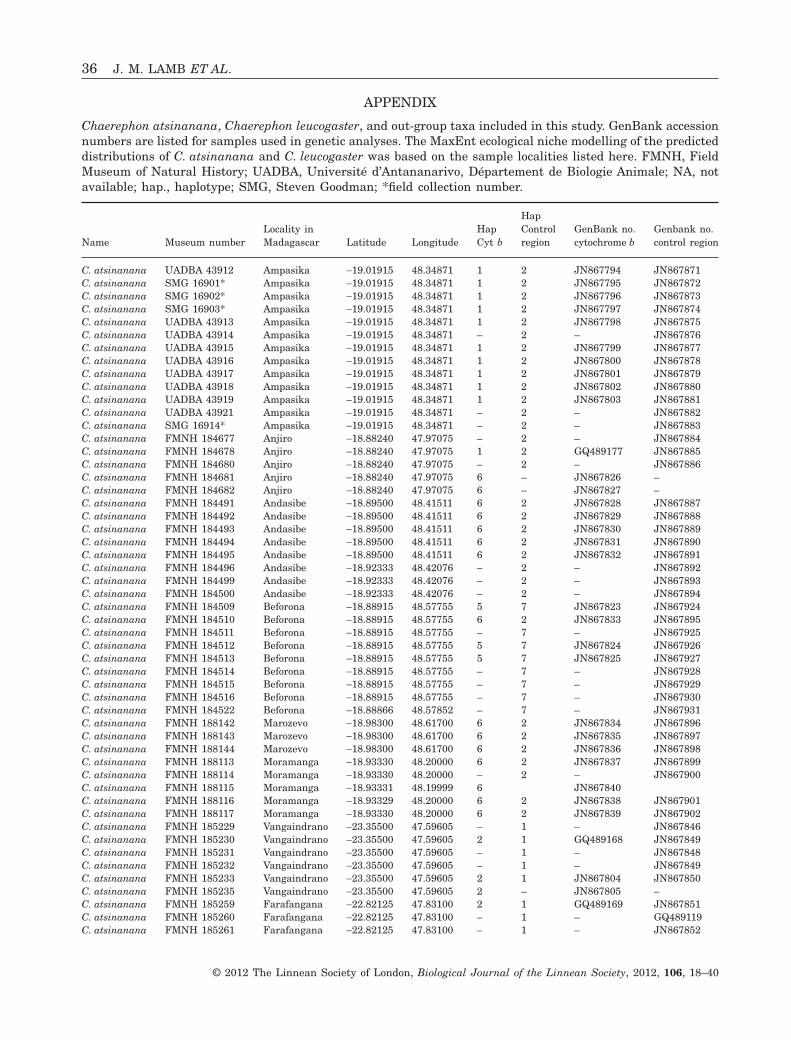
APPENDIX
Chaerephon atsinanana, Chaerephon leucogaster, and out-group taxa included in this study. GenBank accessionnumbers are listed for samples used in genetic analyses. The MaxEnt ecological niche modelling of the predicteddistributions of C. atsinanana and C. leucogaster was based on the sample localities listed here. FMNH, FieldMuseum of Natural History; UADBA, Université d’Antananarivo, Département de Biologie Animale; NA, notavailable; hap., haplotype; SMG, Steven Goodman; *field collection number.
Name Museum numberLocality inMadagascar Latitude Longitude
HapCyt b
HapControlregion
GenBank no.cytochrome b
Genbank no.control region
C. atsinanana UADBA 43912 Ampasika -19.01915 48.34871 1 2 JN867794 JN867871C. atsinanana SMG 16901* Ampasika -19.01915 48.34871 1 2 JN867795 JN867872C. atsinanana SMG 16902* Ampasika -19.01915 48.34871 1 2 JN867796 JN867873C. atsinanana SMG 16903* Ampasika -19.01915 48.34871 1 2 JN867797 JN867874C. atsinanana UADBA 43913 Ampasika -19.01915 48.34871 1 2 JN867798 JN867875C. atsinanana UADBA 43914 Ampasika -19.01915 48.34871 – 2 – JN867876C. atsinanana UADBA 43915 Ampasika -19.01915 48.34871 1 2 JN867799 JN867877C. atsinanana UADBA 43916 Ampasika -19.01915 48.34871 1 2 JN867800 JN867878C. atsinanana UADBA 43917 Ampasika -19.01915 48.34871 1 2 JN867801 JN867879C. atsinanana UADBA 43918 Ampasika -19.01915 48.34871 1 2 JN867802 JN867880C. atsinanana UADBA 43919 Ampasika -19.01915 48.34871 1 2 JN867803 JN867881C. atsinanana UADBA 43921 Ampasika -19.01915 48.34871 – 2 – JN867882C. atsinanana SMG 16914* Ampasika -19.01915 48.34871 – 2 – JN867883C. atsinanana FMNH 184677 Anjiro -18.88240 47.97075 – 2 – JN867884C. atsinanana FMNH 184678 Anjiro -18.88240 47.97075 1 2 GQ489177 JN867885C. atsinanana FMNH 184680 Anjiro -18.88240 47.97075 – 2 – JN867886C. atsinanana FMNH 184681 Anjiro -18.88240 47.97075 6 – JN867826 –C. atsinanana FMNH 184682 Anjiro -18.88240 47.97075 6 – JN867827 –C. atsinanana FMNH 184491 Andasibe -18.89500 48.41511 6 2 JN867828 JN867887C. atsinanana FMNH 184492 Andasibe -18.89500 48.41511 6 2 JN867829 JN867888C. atsinanana FMNH 184493 Andasibe -18.89500 48.41511 6 2 JN867830 JN867889C. atsinanana FMNH 184494 Andasibe -18.89500 48.41511 6 2 JN867831 JN867890C. atsinanana FMNH 184495 Andasibe -18.89500 48.41511 6 2 JN867832 JN867891C. atsinanana FMNH 184496 Andasibe -18.92333 48.42076 – 2 – JN867892C. atsinanana FMNH 184499 Andasibe -18.92333 48.42076 – 2 – JN867893C. atsinanana FMNH 184500 Andasibe -18.92333 48.42076 – 2 – JN867894C. atsinanana FMNH 184509 Beforona -18.88915 48.57755 5 7 JN867823 JN867924C. atsinanana FMNH 184510 Beforona -18.88915 48.57755 6 2 JN867833 JN867895C. atsinanana FMNH 184511 Beforona -18.88915 48.57755 – 7 – JN867925C. atsinanana FMNH 184512 Beforona -18.88915 48.57755 5 7 JN867824 JN867926C. atsinanana FMNH 184513 Beforona -18.88915 48.57755 5 7 JN867825 JN867927C. atsinanana FMNH 184514 Beforona -18.88915 48.57755 – 7 – JN867928C. atsinanana FMNH 184515 Beforona -18.88915 48.57755 – 7 – JN867929C. atsinanana FMNH 184516 Beforona -18.88915 48.57755 – 7 – JN867930C. atsinanana FMNH 184522 Beforona -18.88866 48.57852 – 7 – JN867931C. atsinanana FMNH 188142 Marozevo -18.98300 48.61700 6 2 JN867834 JN867896C. atsinanana FMNH 188143 Marozevo -18.98300 48.61700 6 2 JN867835 JN867897C. atsinanana FMNH 188144 Marozevo -18.98300 48.61700 6 2 JN867836 JN867898C. atsinanana FMNH 188113 Moramanga -18.93330 48.20000 6 2 JN867837 JN867899C. atsinanana FMNH 188114 Moramanga -18.93330 48.20000 – 2 – JN867900C. atsinanana FMNH 188115 Moramanga -18.93331 48.19999 6 JN867840C. atsinanana FMNH 188116 Moramanga -18.93329 48.20000 6 2 JN867838 JN867901C. atsinanana FMNH 188117 Moramanga -18.93330 48.20000 6 2 JN867839 JN867902C. atsinanana FMNH 185229 Vangaindrano -23.35500 47.59605 – 1 – JN867846C. atsinanana FMNH 185230 Vangaindrano -23.35500 47.59605 2 1 GQ489168 JN867849C. atsinanana FMNH 185231 Vangaindrano -23.35500 47.59605 – 1 – JN867848C. atsinanana FMNH 185232 Vangaindrano -23.35500 47.59605 – 1 – JN867849C. atsinanana FMNH 185233 Vangaindrano -23.35500 47.59605 2 1 JN867804 JN867850C. atsinanana FMNH 185235 Vangaindrano -23.35500 47.59605 2 – JN867805 –C. atsinanana FMNH 185259 Farafangana -22.82125 47.83100 2 1 GQ489169 JN867851C. atsinanana FMNH 185260 Farafangana -22.82125 47.83100 – 1 – GQ489119C. atsinanana FMNH 185261 Farafangana -22.82125 47.83100 – 1 – JN867852
36 J. M. LAMB ET AL.
© 2012 The Linnean Society of London, Biological Journal of the Linnean Society, 2012, 106, 18–40
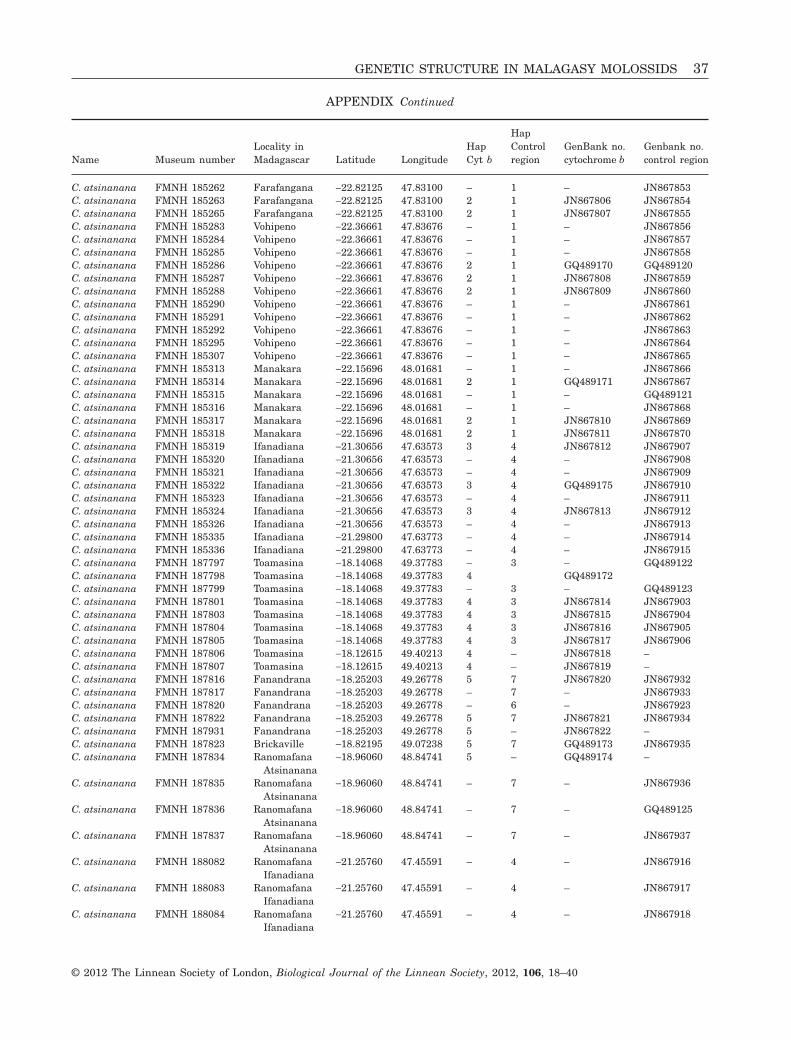
APPENDIX Continued
Name Museum numberLocality inMadagascar Latitude Longitude
HapCyt b
HapControlregion
GenBank no.cytochrome b
Genbank no.control region
C. atsinanana FMNH 185262 Farafangana -22.82125 47.83100 – 1 – JN867853C. atsinanana FMNH 185263 Farafangana -22.82125 47.83100 2 1 JN867806 JN867854C. atsinanana FMNH 185265 Farafangana -22.82125 47.83100 2 1 JN867807 JN867855C. atsinanana FMNH 185283 Vohipeno -22.36661 47.83676 – 1 – JN867856C. atsinanana FMNH 185284 Vohipeno -22.36661 47.83676 – 1 – JN867857C. atsinanana FMNH 185285 Vohipeno -22.36661 47.83676 – 1 – JN867858C. atsinanana FMNH 185286 Vohipeno -22.36661 47.83676 2 1 GQ489170 GQ489120C. atsinanana FMNH 185287 Vohipeno -22.36661 47.83676 2 1 JN867808 JN867859C. atsinanana FMNH 185288 Vohipeno -22.36661 47.83676 2 1 JN867809 JN867860C. atsinanana FMNH 185290 Vohipeno -22.36661 47.83676 – 1 – JN867861C. atsinanana FMNH 185291 Vohipeno -22.36661 47.83676 – 1 – JN867862C. atsinanana FMNH 185292 Vohipeno -22.36661 47.83676 – 1 – JN867863C. atsinanana FMNH 185295 Vohipeno -22.36661 47.83676 – 1 – JN867864C. atsinanana FMNH 185307 Vohipeno -22.36661 47.83676 – 1 – JN867865C. atsinanana FMNH 185313 Manakara -22.15696 48.01681 – 1 – JN867866C. atsinanana FMNH 185314 Manakara -22.15696 48.01681 2 1 GQ489171 JN867867C. atsinanana FMNH 185315 Manakara -22.15696 48.01681 – 1 – GQ489121C. atsinanana FMNH 185316 Manakara -22.15696 48.01681 – 1 – JN867868C. atsinanana FMNH 185317 Manakara -22.15696 48.01681 2 1 JN867810 JN867869C. atsinanana FMNH 185318 Manakara -22.15696 48.01681 2 1 JN867811 JN867870C. atsinanana FMNH 185319 Ifanadiana -21.30656 47.63573 3 4 JN867812 JN867907C. atsinanana FMNH 185320 Ifanadiana -21.30656 47.63573 – 4 – JN867908C. atsinanana FMNH 185321 Ifanadiana -21.30656 47.63573 – 4 – JN867909C. atsinanana FMNH 185322 Ifanadiana -21.30656 47.63573 3 4 GQ489175 JN867910C. atsinanana FMNH 185323 Ifanadiana -21.30656 47.63573 – 4 – JN867911C. atsinanana FMNH 185324 Ifanadiana -21.30656 47.63573 3 4 JN867813 JN867912C. atsinanana FMNH 185326 Ifanadiana -21.30656 47.63573 – 4 – JN867913C. atsinanana FMNH 185335 Ifanadiana -21.29800 47.63773 – 4 – JN867914C. atsinanana FMNH 185336 Ifanadiana -21.29800 47.63773 – 4 – JN867915C. atsinanana FMNH 187797 Toamasina -18.14068 49.37783 – 3 – GQ489122C. atsinanana FMNH 187798 Toamasina -18.14068 49.37783 4 GQ489172C. atsinanana FMNH 187799 Toamasina -18.14068 49.37783 – 3 – GQ489123C. atsinanana FMNH 187801 Toamasina -18.14068 49.37783 4 3 JN867814 JN867903C. atsinanana FMNH 187803 Toamasina -18.14068 49.37783 4 3 JN867815 JN867904C. atsinanana FMNH 187804 Toamasina -18.14068 49.37783 4 3 JN867816 JN867905C. atsinanana FMNH 187805 Toamasina -18.14068 49.37783 4 3 JN867817 JN867906C. atsinanana FMNH 187806 Toamasina -18.12615 49.40213 4 – JN867818 –C. atsinanana FMNH 187807 Toamasina -18.12615 49.40213 4 – JN867819 –C. atsinanana FMNH 187816 Fanandrana -18.25203 49.26778 5 7 JN867820 JN867932C. atsinanana FMNH 187817 Fanandrana -18.25203 49.26778 – 7 – JN867933C. atsinanana FMNH 187820 Fanandrana -18.25203 49.26778 – 6 – JN867923C. atsinanana FMNH 187822 Fanandrana -18.25203 49.26778 5 7 JN867821 JN867934C. atsinanana FMNH 187931 Fanandrana -18.25203 49.26778 5 – JN867822 –C. atsinanana FMNH 187823 Brickaville -18.82195 49.07238 5 7 GQ489173 JN867935C. atsinanana FMNH 187834 Ranomafana
Atsinanana-18.96060 48.84741 5 – GQ489174 –
C. atsinanana FMNH 187835 RanomafanaAtsinanana
-18.96060 48.84741 – 7 – JN867936
C. atsinanana FMNH 187836 RanomafanaAtsinanana
-18.96060 48.84741 – 7 – GQ489125
C. atsinanana FMNH 187837 RanomafanaAtsinanana
-18.96060 48.84741 – 7 – JN867937
C. atsinanana FMNH 188082 RanomafanaIfanadiana
-21.25760 47.45591 – 4 – JN867916
C. atsinanana FMNH 188083 RanomafanaIfanadiana
-21.25760 47.45591 – 4 – JN867917
C. atsinanana FMNH 188084 RanomafanaIfanadiana
-21.25760 47.45591 – 4 – JN867918
GENETIC STRUCTURE IN MALAGASY MOLOSSIDS 37
© 2012 The Linnean Society of London, Biological Journal of the Linnean Society, 2012, 106, 18–40
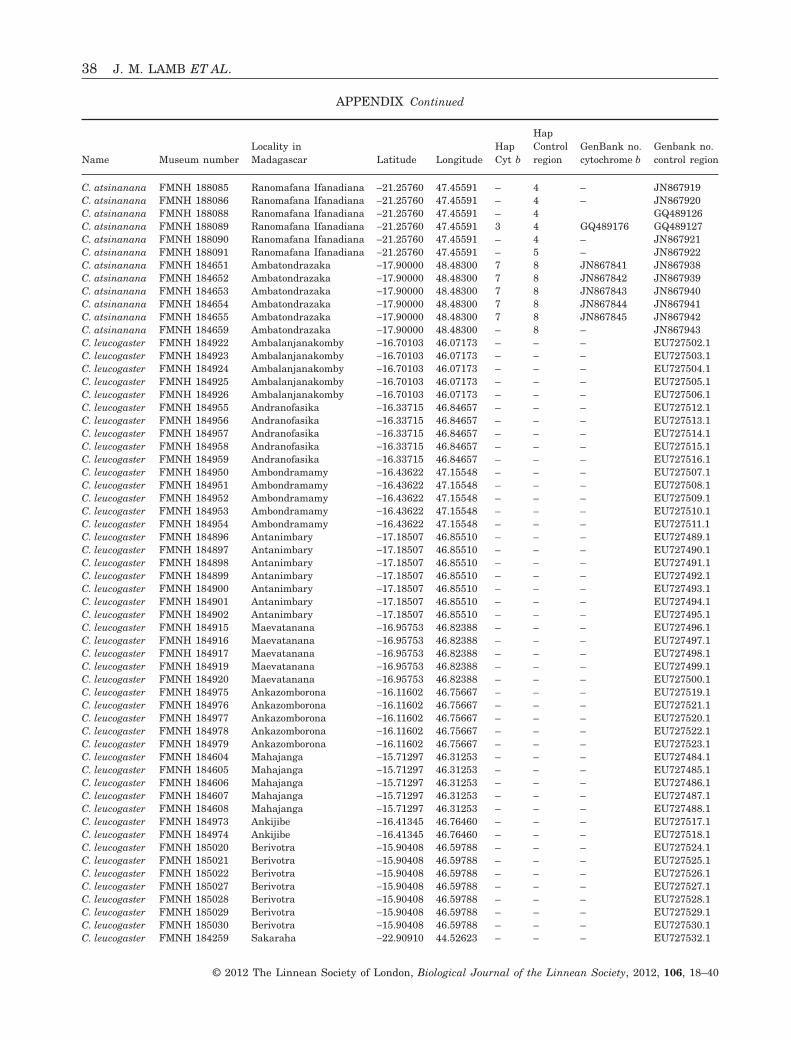
APPENDIX Continued
Name Museum numberLocality inMadagascar Latitude Longitude
HapCyt b
HapControlregion
GenBank no.cytochrome b
Genbank no.control region
C. atsinanana FMNH 188085 Ranomafana Ifanadiana -21.25760 47.45591 – 4 – JN867919C. atsinanana FMNH 188086 Ranomafana Ifanadiana -21.25760 47.45591 – 4 – JN867920C. atsinanana FMNH 188088 Ranomafana Ifanadiana -21.25760 47.45591 – 4 GQ489126C. atsinanana FMNH 188089 Ranomafana Ifanadiana -21.25760 47.45591 3 4 GQ489176 GQ489127C. atsinanana FMNH 188090 Ranomafana Ifanadiana -21.25760 47.45591 – 4 – JN867921C. atsinanana FMNH 188091 Ranomafana Ifanadiana -21.25760 47.45591 – 5 – JN867922C. atsinanana FMNH 184651 Ambatondrazaka -17.90000 48.48300 7 8 JN867841 JN867938C. atsinanana FMNH 184652 Ambatondrazaka -17.90000 48.48300 7 8 JN867842 JN867939C. atsinanana FMNH 184653 Ambatondrazaka -17.90000 48.48300 7 8 JN867843 JN867940C. atsinanana FMNH 184654 Ambatondrazaka -17.90000 48.48300 7 8 JN867844 JN867941C. atsinanana FMNH 184655 Ambatondrazaka -17.90000 48.48300 7 8 JN867845 JN867942C. atsinanana FMNH 184659 Ambatondrazaka -17.90000 48.48300 – 8 – JN867943C. leucogaster FMNH 184922 Ambalanjanakomby -16.70103 46.07173 – – – EU727502.1C. leucogaster FMNH 184923 Ambalanjanakomby -16.70103 46.07173 – – – EU727503.1C. leucogaster FMNH 184924 Ambalanjanakomby -16.70103 46.07173 – – – EU727504.1C. leucogaster FMNH 184925 Ambalanjanakomby -16.70103 46.07173 – – – EU727505.1C. leucogaster FMNH 184926 Ambalanjanakomby -16.70103 46.07173 – – – EU727506.1C. leucogaster FMNH 184955 Andranofasika -16.33715 46.84657 – – – EU727512.1C. leucogaster FMNH 184956 Andranofasika -16.33715 46.84657 – – – EU727513.1C. leucogaster FMNH 184957 Andranofasika -16.33715 46.84657 – – – EU727514.1C. leucogaster FMNH 184958 Andranofasika -16.33715 46.84657 – – – EU727515.1C. leucogaster FMNH 184959 Andranofasika -16.33715 46.84657 – – – EU727516.1C. leucogaster FMNH 184950 Ambondramamy -16.43622 47.15548 – – – EU727507.1C. leucogaster FMNH 184951 Ambondramamy -16.43622 47.15548 – – – EU727508.1C. leucogaster FMNH 184952 Ambondramamy -16.43622 47.15548 – – – EU727509.1C. leucogaster FMNH 184953 Ambondramamy -16.43622 47.15548 – – – EU727510.1C. leucogaster FMNH 184954 Ambondramamy -16.43622 47.15548 – – – EU727511.1C. leucogaster FMNH 184896 Antanimbary -17.18507 46.85510 – – – EU727489.1C. leucogaster FMNH 184897 Antanimbary -17.18507 46.85510 – – – EU727490.1C. leucogaster FMNH 184898 Antanimbary -17.18507 46.85510 – – – EU727491.1C. leucogaster FMNH 184899 Antanimbary -17.18507 46.85510 – – – EU727492.1C. leucogaster FMNH 184900 Antanimbary -17.18507 46.85510 – – – EU727493.1C. leucogaster FMNH 184901 Antanimbary -17.18507 46.85510 – – – EU727494.1C. leucogaster FMNH 184902 Antanimbary -17.18507 46.85510 – – – EU727495.1C. leucogaster FMNH 184915 Maevatanana -16.95753 46.82388 – – – EU727496.1C. leucogaster FMNH 184916 Maevatanana -16.95753 46.82388 – – – EU727497.1C. leucogaster FMNH 184917 Maevatanana -16.95753 46.82388 – – – EU727498.1C. leucogaster FMNH 184919 Maevatanana -16.95753 46.82388 – – – EU727499.1C. leucogaster FMNH 184920 Maevatanana -16.95753 46.82388 – – – EU727500.1C. leucogaster FMNH 184975 Ankazomborona -16.11602 46.75667 – – – EU727519.1C. leucogaster FMNH 184976 Ankazomborona -16.11602 46.75667 – – – EU727521.1C. leucogaster FMNH 184977 Ankazomborona -16.11602 46.75667 – – – EU727520.1C. leucogaster FMNH 184978 Ankazomborona -16.11602 46.75667 – – – EU727522.1C. leucogaster FMNH 184979 Ankazomborona -16.11602 46.75667 – – – EU727523.1C. leucogaster FMNH 184604 Mahajanga -15.71297 46.31253 – – – EU727484.1C. leucogaster FMNH 184605 Mahajanga -15.71297 46.31253 – – – EU727485.1C. leucogaster FMNH 184606 Mahajanga -15.71297 46.31253 – – – EU727486.1C. leucogaster FMNH 184607 Mahajanga -15.71297 46.31253 – – – EU727487.1C. leucogaster FMNH 184608 Mahajanga -15.71297 46.31253 – – – EU727488.1C. leucogaster FMNH 184973 Ankijibe -16.41345 46.76460 – – – EU727517.1C. leucogaster FMNH 184974 Ankijibe -16.41345 46.76460 – – – EU727518.1C. leucogaster FMNH 185020 Berivotra -15.90408 46.59788 – – – EU727524.1C. leucogaster FMNH 185021 Berivotra -15.90408 46.59788 – – – EU727525.1C. leucogaster FMNH 185022 Berivotra -15.90408 46.59788 – – – EU727526.1C. leucogaster FMNH 185027 Berivotra -15.90408 46.59788 – – – EU727527.1C. leucogaster FMNH 185028 Berivotra -15.90408 46.59788 – – – EU727528.1C. leucogaster FMNH 185029 Berivotra -15.90408 46.59788 – – – EU727529.1C. leucogaster FMNH 185030 Berivotra -15.90408 46.59788 – – – EU727530.1C. leucogaster FMNH 184259 Sakaraha -22.90910 44.52623 – – – EU727532.1
38 J. M. LAMB ET AL.
© 2012 The Linnean Society of London, Biological Journal of the Linnean Society, 2012, 106, 18–40
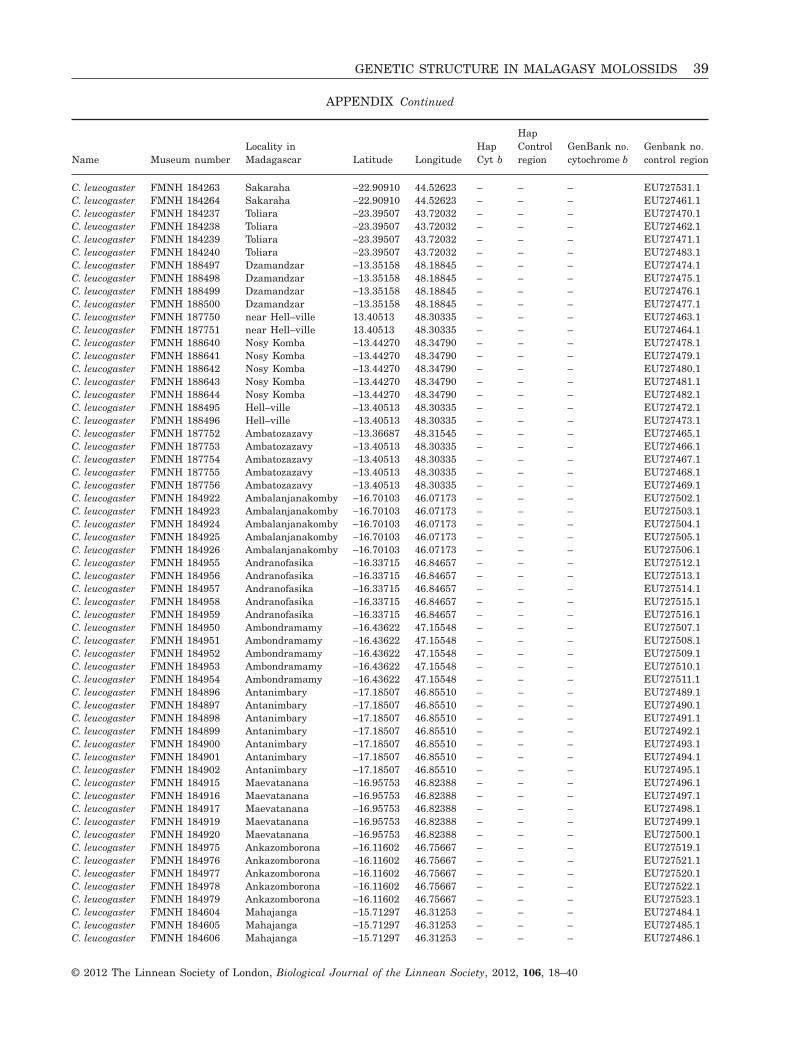
APPENDIX Continued
Name Museum numberLocality inMadagascar Latitude Longitude
HapCyt b
HapControlregion
GenBank no.cytochrome b
Genbank no.control region
C. leucogaster FMNH 184263 Sakaraha -22.90910 44.52623 – – – EU727531.1C. leucogaster FMNH 184264 Sakaraha -22.90910 44.52623 – – – EU727461.1C. leucogaster FMNH 184237 Toliara -23.39507 43.72032 – – – EU727470.1C. leucogaster FMNH 184238 Toliara -23.39507 43.72032 – – – EU727462.1C. leucogaster FMNH 184239 Toliara -23.39507 43.72032 – – – EU727471.1C. leucogaster FMNH 184240 Toliara -23.39507 43.72032 – – – EU727483.1C. leucogaster FMNH 188497 Dzamandzar -13.35158 48.18845 – – – EU727474.1C. leucogaster FMNH 188498 Dzamandzar -13.35158 48.18845 – – – EU727475.1C. leucogaster FMNH 188499 Dzamandzar -13.35158 48.18845 – – – EU727476.1C. leucogaster FMNH 188500 Dzamandzar -13.35158 48.18845 – – – EU727477.1C. leucogaster FMNH 187750 near Hell–ville 13.40513 48.30335 – – – EU727463.1C. leucogaster FMNH 187751 near Hell–ville 13.40513 48.30335 – – – EU727464.1C. leucogaster FMNH 188640 Nosy Komba -13.44270 48.34790 – – – EU727478.1C. leucogaster FMNH 188641 Nosy Komba -13.44270 48.34790 – – – EU727479.1C. leucogaster FMNH 188642 Nosy Komba -13.44270 48.34790 – – – EU727480.1C. leucogaster FMNH 188643 Nosy Komba -13.44270 48.34790 – – – EU727481.1C. leucogaster FMNH 188644 Nosy Komba -13.44270 48.34790 – – – EU727482.1C. leucogaster FMNH 188495 Hell–ville -13.40513 48.30335 – – – EU727472.1C. leucogaster FMNH 188496 Hell–ville -13.40513 48.30335 – – – EU727473.1C. leucogaster FMNH 187752 Ambatozazavy -13.36687 48.31545 – – – EU727465.1C. leucogaster FMNH 187753 Ambatozazavy -13.40513 48.30335 – – – EU727466.1C. leucogaster FMNH 187754 Ambatozazavy -13.40513 48.30335 – – – EU727467.1C. leucogaster FMNH 187755 Ambatozazavy -13.40513 48.30335 – – – EU727468.1C. leucogaster FMNH 187756 Ambatozazavy -13.40513 48.30335 – – – EU727469.1C. leucogaster FMNH 184922 Ambalanjanakomby -16.70103 46.07173 – – – EU727502.1C. leucogaster FMNH 184923 Ambalanjanakomby -16.70103 46.07173 – – – EU727503.1C. leucogaster FMNH 184924 Ambalanjanakomby -16.70103 46.07173 – – – EU727504.1C. leucogaster FMNH 184925 Ambalanjanakomby -16.70103 46.07173 – – – EU727505.1C. leucogaster FMNH 184926 Ambalanjanakomby -16.70103 46.07173 – – – EU727506.1C. leucogaster FMNH 184955 Andranofasika -16.33715 46.84657 – – – EU727512.1C. leucogaster FMNH 184956 Andranofasika -16.33715 46.84657 – – – EU727513.1C. leucogaster FMNH 184957 Andranofasika -16.33715 46.84657 – – – EU727514.1C. leucogaster FMNH 184958 Andranofasika -16.33715 46.84657 – – – EU727515.1C. leucogaster FMNH 184959 Andranofasika -16.33715 46.84657 – – – EU727516.1C. leucogaster FMNH 184950 Ambondramamy -16.43622 47.15548 – – – EU727507.1C. leucogaster FMNH 184951 Ambondramamy -16.43622 47.15548 – – – EU727508.1C. leucogaster FMNH 184952 Ambondramamy -16.43622 47.15548 – – – EU727509.1C. leucogaster FMNH 184953 Ambondramamy -16.43622 47.15548 – – – EU727510.1C. leucogaster FMNH 184954 Ambondramamy -16.43622 47.15548 – – – EU727511.1C. leucogaster FMNH 184896 Antanimbary -17.18507 46.85510 – – – EU727489.1C. leucogaster FMNH 184897 Antanimbary -17.18507 46.85510 – – – EU727490.1C. leucogaster FMNH 184898 Antanimbary -17.18507 46.85510 – – – EU727491.1C. leucogaster FMNH 184899 Antanimbary -17.18507 46.85510 – – – EU727492.1C. leucogaster FMNH 184900 Antanimbary -17.18507 46.85510 – – – EU727493.1C. leucogaster FMNH 184901 Antanimbary -17.18507 46.85510 – – – EU727494.1C. leucogaster FMNH 184902 Antanimbary -17.18507 46.85510 – – – EU727495.1C. leucogaster FMNH 184915 Maevatanana -16.95753 46.82388 – – – EU727496.1C. leucogaster FMNH 184916 Maevatanana -16.95753 46.82388 – – – EU727497.1C. leucogaster FMNH 184917 Maevatanana -16.95753 46.82388 – – – EU727498.1C. leucogaster FMNH 184919 Maevatanana -16.95753 46.82388 – – – EU727499.1C. leucogaster FMNH 184920 Maevatanana -16.95753 46.82388 – – – EU727500.1C. leucogaster FMNH 184975 Ankazomborona -16.11602 46.75667 – – – EU727519.1C. leucogaster FMNH 184976 Ankazomborona -16.11602 46.75667 – – – EU727521.1C. leucogaster FMNH 184977 Ankazomborona -16.11602 46.75667 – – – EU727520.1C. leucogaster FMNH 184978 Ankazomborona -16.11602 46.75667 – – – EU727522.1C. leucogaster FMNH 184979 Ankazomborona -16.11602 46.75667 – – – EU727523.1C. leucogaster FMNH 184604 Mahajanga -15.71297 46.31253 – – – EU727484.1C. leucogaster FMNH 184605 Mahajanga -15.71297 46.31253 – – – EU727485.1C. leucogaster FMNH 184606 Mahajanga -15.71297 46.31253 – – – EU727486.1
GENETIC STRUCTURE IN MALAGASY MOLOSSIDS 39
© 2012 The Linnean Society of London, Biological Journal of the Linnean Society, 2012, 106, 18–40
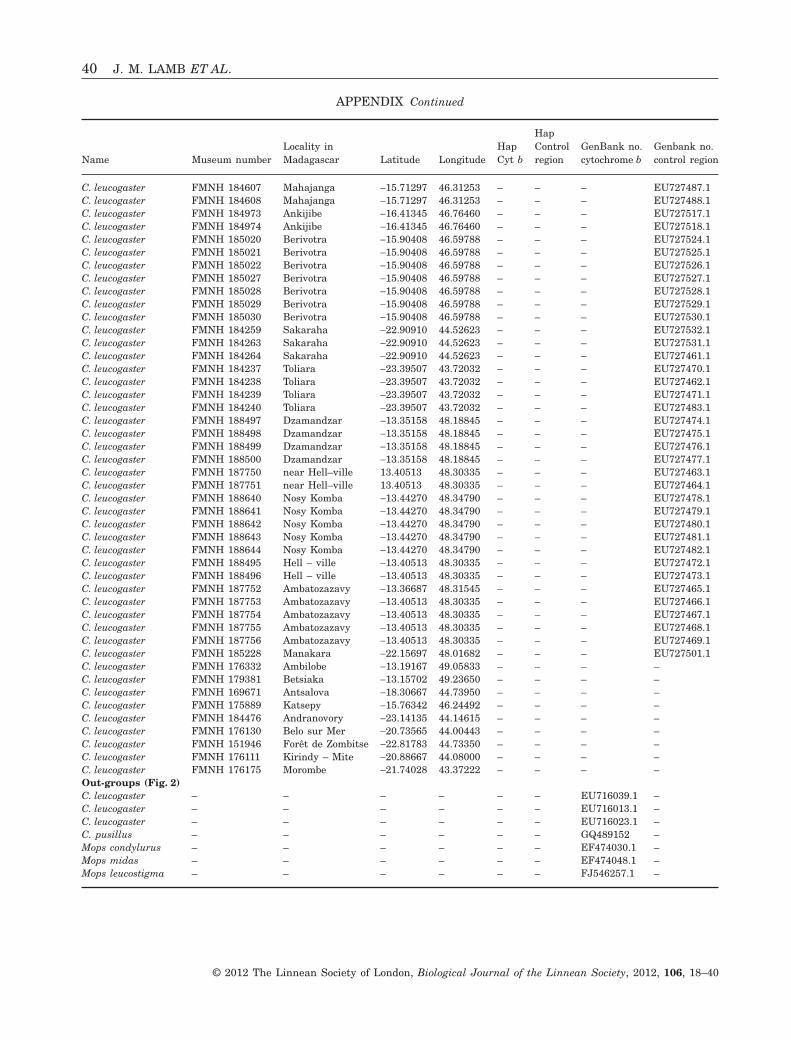
APPENDIX Continued
Name Museum numberLocality inMadagascar Latitude Longitude
HapCyt b
HapControlregion
GenBank no.cytochrome b
Genbank no.control region
C. leucogaster FMNH 184607 Mahajanga -15.71297 46.31253 – – – EU727487.1C. leucogaster FMNH 184608 Mahajanga -15.71297 46.31253 – – – EU727488.1C. leucogaster FMNH 184973 Ankijibe -16.41345 46.76460 – – – EU727517.1C. leucogaster FMNH 184974 Ankijibe -16.41345 46.76460 – – – EU727518.1C. leucogaster FMNH 185020 Berivotra -15.90408 46.59788 – – – EU727524.1C. leucogaster FMNH 185021 Berivotra -15.90408 46.59788 – – – EU727525.1C. leucogaster FMNH 185022 Berivotra -15.90408 46.59788 – – – EU727526.1C. leucogaster FMNH 185027 Berivotra -15.90408 46.59788 – – – EU727527.1C. leucogaster FMNH 185028 Berivotra -15.90408 46.59788 – – – EU727528.1C. leucogaster FMNH 185029 Berivotra -15.90408 46.59788 – – – EU727529.1C. leucogaster FMNH 185030 Berivotra -15.90408 46.59788 – – – EU727530.1C. leucogaster FMNH 184259 Sakaraha -22.90910 44.52623 – – – EU727532.1C. leucogaster FMNH 184263 Sakaraha -22.90910 44.52623 – – – EU727531.1C. leucogaster FMNH 184264 Sakaraha -22.90910 44.52623 – – – EU727461.1C. leucogaster FMNH 184237 Toliara -23.39507 43.72032 – – – EU727470.1C. leucogaster FMNH 184238 Toliara -23.39507 43.72032 – – – EU727462.1C. leucogaster FMNH 184239 Toliara -23.39507 43.72032 – – – EU727471.1C. leucogaster FMNH 184240 Toliara -23.39507 43.72032 – – – EU727483.1C. leucogaster FMNH 188497 Dzamandzar -13.35158 48.18845 – – – EU727474.1C. leucogaster FMNH 188498 Dzamandzar -13.35158 48.18845 – – – EU727475.1C. leucogaster FMNH 188499 Dzamandzar -13.35158 48.18845 – – – EU727476.1C. leucogaster FMNH 188500 Dzamandzar -13.35158 48.18845 – – – EU727477.1C. leucogaster FMNH 187750 near Hell–ville 13.40513 48.30335 – – – EU727463.1C. leucogaster FMNH 187751 near Hell–ville 13.40513 48.30335 – – – EU727464.1C. leucogaster FMNH 188640 Nosy Komba -13.44270 48.34790 – – – EU727478.1C. leucogaster FMNH 188641 Nosy Komba -13.44270 48.34790 – – – EU727479.1C. leucogaster FMNH 188642 Nosy Komba -13.44270 48.34790 – – – EU727480.1C. leucogaster FMNH 188643 Nosy Komba -13.44270 48.34790 – – – EU727481.1C. leucogaster FMNH 188644 Nosy Komba -13.44270 48.34790 – – – EU727482.1C. leucogaster FMNH 188495 Hell – ville -13.40513 48.30335 – – – EU727472.1C. leucogaster FMNH 188496 Hell – ville -13.40513 48.30335 – – – EU727473.1C. leucogaster FMNH 187752 Ambatozazavy -13.36687 48.31545 – – – EU727465.1C. leucogaster FMNH 187753 Ambatozazavy -13.40513 48.30335 – – – EU727466.1C. leucogaster FMNH 187754 Ambatozazavy -13.40513 48.30335 – – – EU727467.1C. leucogaster FMNH 187755 Ambatozazavy -13.40513 48.30335 – – – EU727468.1C. leucogaster FMNH 187756 Ambatozazavy -13.40513 48.30335 – – – EU727469.1C. leucogaster FMNH 185228 Manakara -22.15697 48.01682 – – – EU727501.1C. leucogaster FMNH 176332 Ambilobe -13.19167 49.05833 – – – –C. leucogaster FMNH 179381 Betsiaka -13.15702 49.23650 – – – –C. leucogaster FMNH 169671 Antsalova -18.30667 44.73950 – – – –C. leucogaster FMNH 175889 Katsepy -15.76342 46.24492 – – – –C. leucogaster FMNH 184476 Andranovory -23.14135 44.14615 – – – –C. leucogaster FMNH 176130 Belo sur Mer -20.73565 44.00443 – – – –C. leucogaster FMNH 151946 Forêt de Zombitse -22.81783 44.73350 – – – –C. leucogaster FMNH 176111 Kirindy – Mite -20.88667 44.08000 – – – –C. leucogaster FMNH 176175 Morombe -21.74028 43.37222 – – – –Out-groups (Fig. 2)C. leucogaster – – – – – – EU716039.1 –C. leucogaster – – – – – – EU716013.1 –C. leucogaster – – – – – – EU716023.1 –C. pusillus – – – – – – GQ489152 –Mops condylurus – – – – – – EF474030.1 –Mops midas – – – – – – EF474048.1 –Mops leucostigma – – – – – – FJ546257.1 –
40 J. M. LAMB ET AL.
© 2012 The Linnean Society of London, Biological Journal of the Linnean Society, 2012, 106, 18–40
Copyright © 2022 FDOKUMEN