Materials used for Wheels on Rolling Stock - Railway Research
Engineering Failure Analysis 14 (2007) 791–800
www.elsevier.com/locate/engfailanal
Evaluation of fatigue life of aluminum alloy wheelsunder radial loads
P. Ramamurty Raju a,*, B. Satyanarayana b, K. Ramji b, K. Suresh Babu a
a Department of Mechanical Engineering, Sagi Rama Krishnam Raju Engineering College, Bhimavaram 534 204, Andhra Pradesh, Indiab Department of Mechanical Engineering, Andhra University, Vishakapatnam, Andhra Pradesh, India
Received 12 November 2006; accepted 19 November 2006Available online 17 January 2007
Abstract
This paper is concerned with generation of S–N curve for aluminum alloy (Al) A356.2-T6 and estimation of fatigue lifeunder radial fatigue load. The S–N curve is developed by conducting tests at different stress levels under constant ampli-tude loading. Tests are conducted on alloy wheels for fatigue life evaluation under radial loads. Finite element analysis(FEA) is carried out by simulating the test conditions to analyze stress distribution and fatigue life of the alloy wheels.It is observed from analysis that the prediction of fatigue life using FEA is found to be in close agreement with the cor-responding experimental observations. An attempt has been made by conducting parametric study to suggest a suitablesafety factor for reliable fatigue life prediction.� 2006 Elsevier Ltd. All rights reserved.
Keywords: S–N curve; Radial fatigue load; Fatigue life; Safety factor; Finite element analysis
1. Introduction
In the fatigue life evaluation of aluminum wheel design, the commonly accepted procedure for passengercar wheel manufacturing is to pass two durability tests, namely the radial fatigue test and cornering fatiguetest [1]. Since alloy wheels are designed for variation in style and have more complex shapes than regularsteel wheels, it is difficult to assess fatigue life by using analytical methods. In general, the newly designedwheel is tested in laboratory for its life through an accelerated fatigue test before the actual productionstarts. Based on these test results the wheel design is further modified for high strength and less weight,if required. Grubisic and Fisher [2] have reported earlier in the literature that testing alone without theaid of stress analysis will not yield the optimum wheel design. Hsu et al. [3] described a probability basedmodel for prediction of fatigue failure of aluminum disc wheels, which intended to better link the predic-tion of life using simulation results with historical data. Finite element models of 20 aluminum wheels
1350-6307/$ - see front matter � 2006 Elsevier Ltd. All rights reserved.
doi:10.1016/j.engfailanal.2006.11.028
* Corresponding author. Tel.: 91 8816 225124.E-mail address: [email protected] (P.R. Raju).
Nomenclature
Su ultimate tensile strengthSy yield strengthe elongationHB hardnessK acceleration test factorF maximum tyre loadFr radial load
792 P.R. Raju et al. / Engineering Failure Analysis 14 (2007) 791–800
which are already physically tested were constructed to simulate dynamic radial fatigue test. Their meanstress and stress amplitude during the fatigue loading cycles were calculated and plotted on a two dimen-sional plane. For a new wheel the failure probability of dynamic radial fatigue test can be read directlyfrom this probability contour drawn from the test data. Gope [4] mentioned that a minimum of three spec-imens are required to predict the fatigue life using the log normal distribution. To the best of authors’knowledge the research work carried out in this area is limited.
The present work deals with estimating the fatigue life of aluminum alloy wheel by conducting the testsunder radial fatigue load and comparison of the same with that of finite element analysis. Fatigue life predic-tion using the stress approach is mostly based on local stress, because it is not possible to determine nominalstress for the individual critical areas. The necessary material data for fatigue life prediction with the stressconcept is the well known S–N curve. Therefore, S–N curves are required for each specimen which reflectsthe stress condition in the critical area of the component. To find out the fatigue properties of the aluminumalloy wheel material (A356.2-T6) for actual manufacturing conditions, fatigue test is conducted to generate S–N curve for which 43 specimens are machined from the spokes of alloy wheels and are tested using rotatingbending fatigue test equipment.
There are different loading methodologies for simulation of radial fatigue test. The dynamic nature of thetests is simulated using equivalent static load in the form of cyclic nature [5]. The results obtained by simula-tion of tests are compared with actual wheel tests performed. Since fatigue characteristics of a material dependupon several parameters from metallurgical aspects to manufacturing conditions, a safety factor should beconsidered. It is generally expected that there should be difference between experimental and analytical results.In order to correlate the experimental results with FEA, a parametric study is carried out by employing var-ious safety factors and finally a reliable safety factor is suggested. Similarly the effect of loading angle alongcircumferential direction for applying radial load is also analyzed by performing parametric studies and finallya suitable angle is suggested.
2. Development of S–N curve
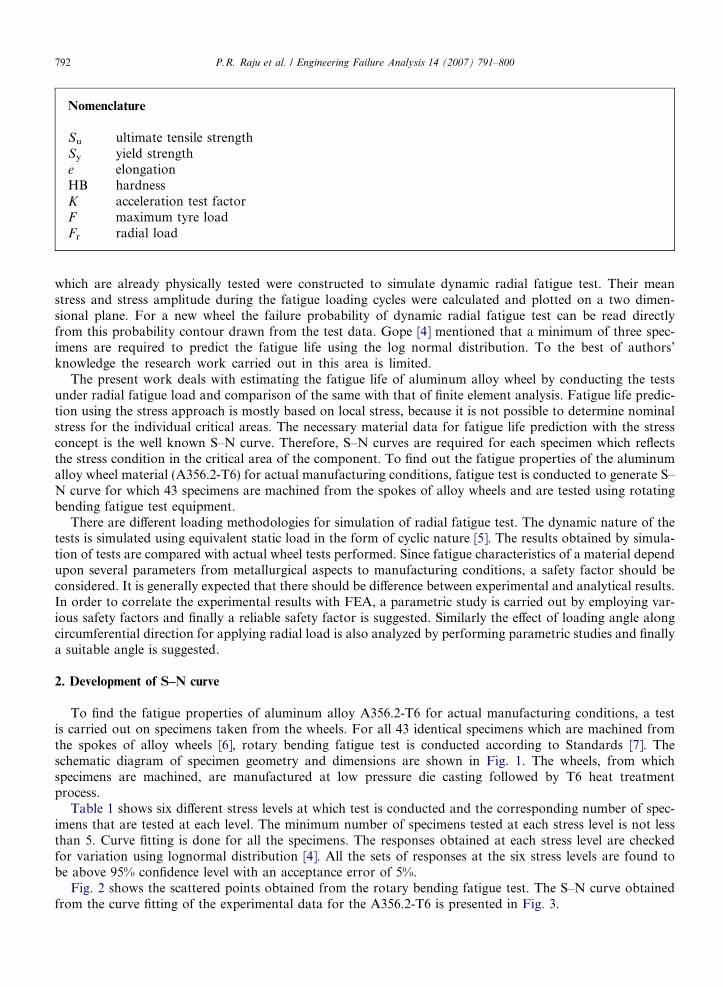
To find the fatigue properties of aluminum alloy A356.2-T6 for actual manufacturing conditions, a testis carried out on specimens taken from the wheels. For all 43 identical specimens which are machined fromthe spokes of alloy wheels [6], rotary bending fatigue test is conducted according to Standards [7]. Theschematic diagram of specimen geometry and dimensions are shown in Fig. 1. The wheels, from whichspecimens are machined, are manufactured at low pressure die casting followed by T6 heat treatmentprocess.
Table 1 shows six different stress levels at which test is conducted and the corresponding number of spec-imens that are tested at each level. The minimum number of specimens tested at each stress level is not lessthan 5. Curve fitting is done for all the specimens. The responses obtained at each stress level are checkedfor variation using lognormal distribution [4]. All the sets of responses at the six stress levels are found tobe above 95% confidence level with an acceptance error of 5%.
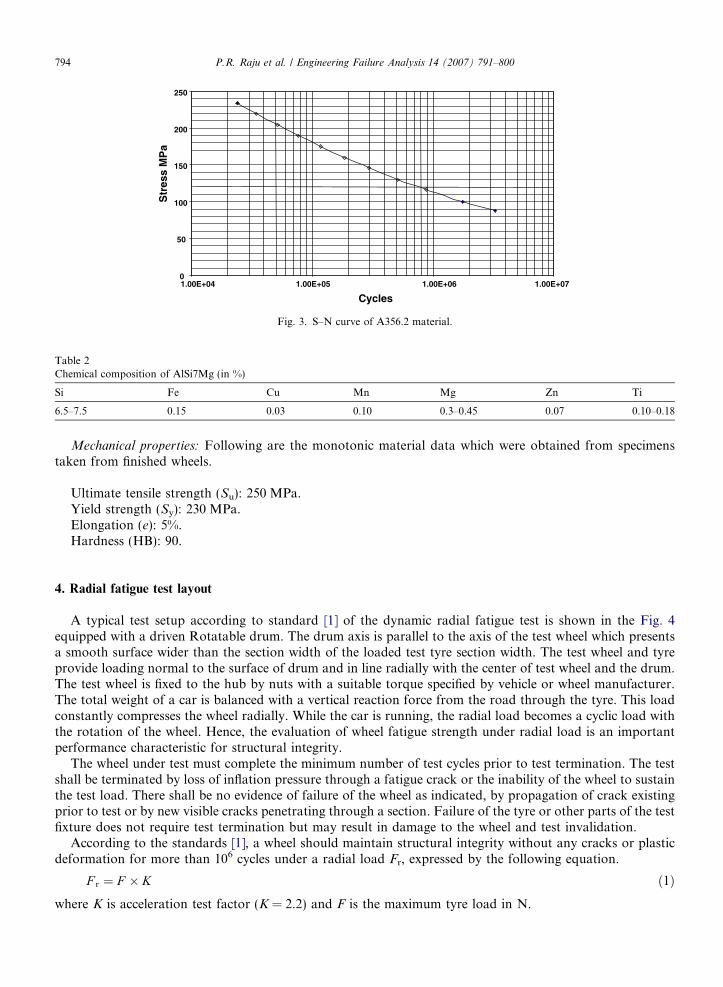
Fig. 2 shows the scattered points obtained from the rotary bending fatigue test. The S–N curve obtainedfrom the curve fitting of the experimental data for the A356.2-T6 is presented in Fig. 3.
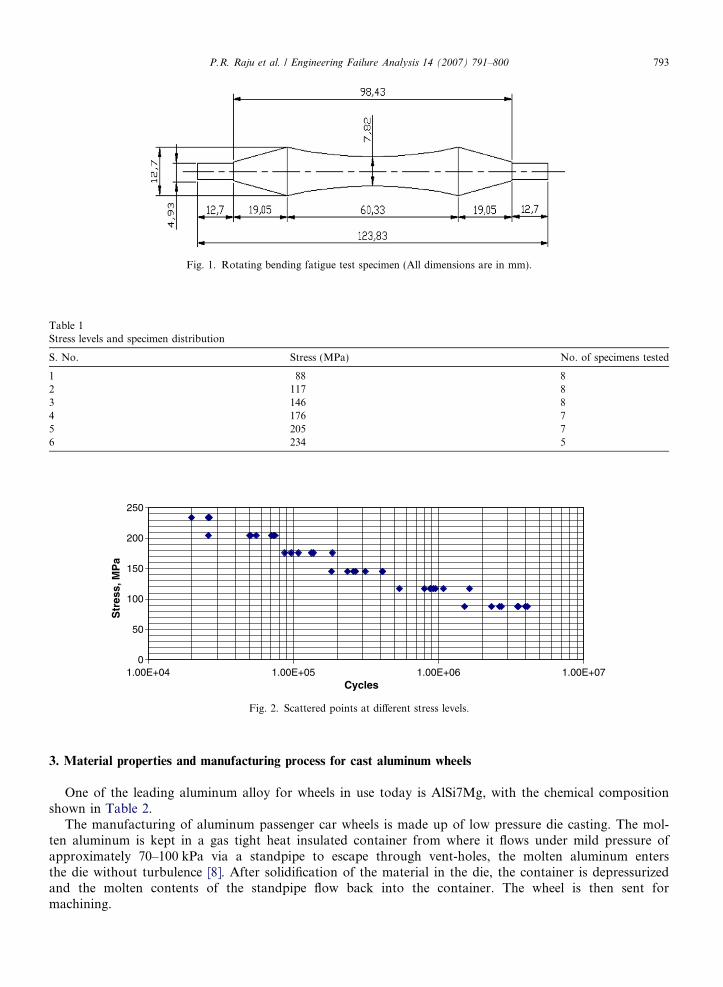
Fig. 1. Rotating bending fatigue test specimen (All dimensions are in mm).
Table 1Stress levels and specimen distribution
S. No. Stress (MPa) No. of specimens tested
1 88 82 117 83 146 84 176 75 205 76 234 5
0
50
100
150
200
250
1.00E+04 1.00E+05 1.00E+06 1.00E+07Cycles
Str
ess,
MP
a
Fig. 2. Scattered points at different stress levels.
P.R. Raju et al. / Engineering Failure Analysis 14 (2007) 791–800 793
3. Material properties and manufacturing process for cast aluminum wheels
One of the leading aluminum alloy for wheels in use today is AlSi7Mg, with the chemical compositionshown in Table 2.
The manufacturing of aluminum passenger car wheels is made up of low pressure die casting. The mol-ten aluminum is kept in a gas tight heat insulated container from where it flows under mild pressure ofapproximately 70–100 kPa via a standpipe to escape through vent-holes, the molten aluminum entersthe die without turbulence [8]. After solidification of the material in the die, the container is depressurizedand the molten contents of the standpipe flow back into the container. The wheel is then sent formachining.
0
50
100
150
200
250
1.00E+04 1.00E+05 1.00E+06 1.00E+07
Cycles
Str
ess
MP
a
Fig. 3. S–N curve of A356.2 material.
Table 2Chemical composition of AlSi7Mg (in %)
Si Fe Cu Mn Mg Zn Ti
6.5–7.5 0.15 0.03 0.10 0.3–0.45 0.07 0.10–0.18
794 P.R. Raju et al. / Engineering Failure Analysis 14 (2007) 791–800
Mechanical properties: Following are the monotonic material data which were obtained from specimenstaken from finished wheels.
Ultimate tensile strength (Su): 250 MPa.Yield strength (Sy): 230 MPa.Elongation (e): 5%.Hardness (HB): 90.
4. Radial fatigue test layout
A typical test setup according to standard [1] of the dynamic radial fatigue test is shown in the Fig. 4equipped with a driven Rotatable drum. The drum axis is parallel to the axis of the test wheel which presentsa smooth surface wider than the section width of the loaded test tyre section width. The test wheel and tyreprovide loading normal to the surface of drum and in line radially with the center of test wheel and the drum.The test wheel is fixed to the hub by nuts with a suitable torque specified by vehicle or wheel manufacturer.The total weight of a car is balanced with a vertical reaction force from the road through the tyre. This loadconstantly compresses the wheel radially. While the car is running, the radial load becomes a cyclic load withthe rotation of the wheel. Hence, the evaluation of wheel fatigue strength under radial load is an importantperformance characteristic for structural integrity.
The wheel under test must complete the minimum number of test cycles prior to test termination. The testshall be terminated by loss of inflation pressure through a fatigue crack or the inability of the wheel to sustainthe test load. There shall be no evidence of failure of the wheel as indicated, by propagation of crack existingprior to test or by new visible cracks penetrating through a section. Failure of the tyre or other parts of the testfixture does not require test termination but may result in damage to the wheel and test invalidation.
According to the standards [1], a wheel should maintain structural integrity without any cracks or plasticdeformation for more than 106 cycles under a radial load Fr, expressed by the following equation.
F r ¼ F � K ð1Þ
where K is acceleration test factor (K = 2.2) and F is the maximum tyre load in N.
Fig. 4. Layout of test setup of radial fatigue test.
Table 3Radial fatigue test results
Sample Test results upto 1,000,000 cycles Test results upto 2,500,000 cycles
1 Passed Failed2 Passed Failed3 Passed Failed4 Passed Failed5 Passed Failed6 Passed Failed7 Passed Failed8 Passed Failed9 Passed Failed
10 Passed Failed
P.R. Raju et al. / Engineering Failure Analysis 14 (2007) 791–800 795
Ten wheels have been tested on radial fatigue testing machine and results are presented in Table 3. The testis conducted in two stages. In the first stage, the wheel is inspected for first 106 cycles for visible cracks. Ifcracks are found, the test will be stopped, else it will be continued for next 1,500,000 cycles. After2,500,000 cycles again the wheel is examined and is said to have passed the test if no cracks are found.
5. Radial fatigue test (RFT) results
In the present tests, cracks started to initiate in between 1,050,000 and 1,300,000 cycles. All wheels arefound to have cracks after 2,500,000 cycles. All the 10 wheels that are tested failed under the radial fatigue
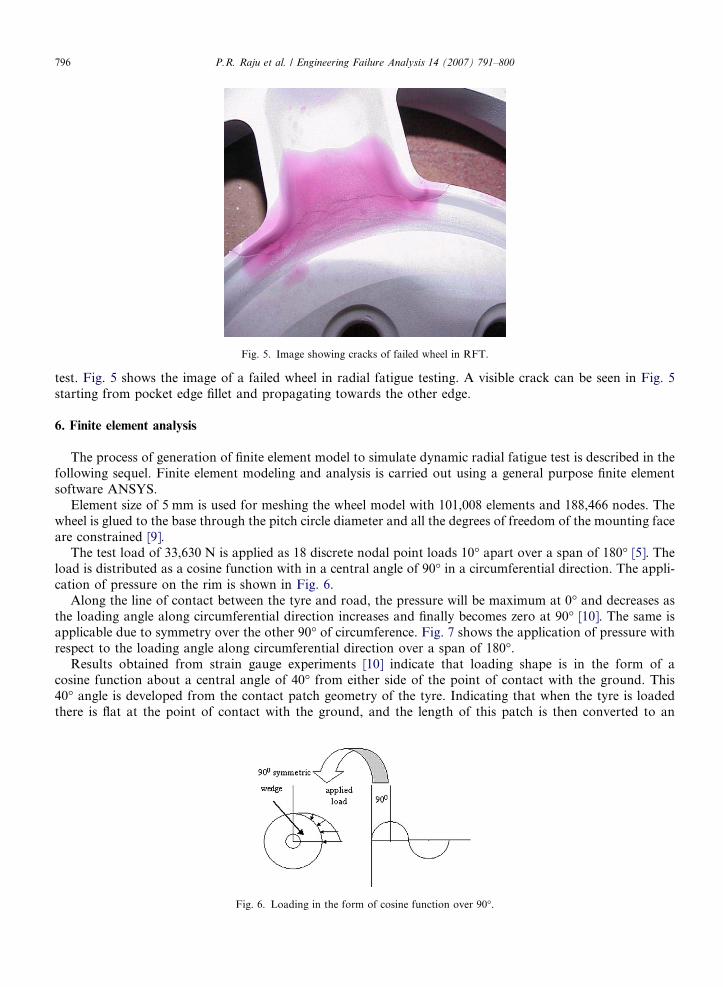
Fig. 5. Image showing cracks of failed wheel in RFT.
796 P.R. Raju et al. / Engineering Failure Analysis 14 (2007) 791–800
test. Fig. 5 shows the image of a failed wheel in radial fatigue testing. A visible crack can be seen in Fig. 5starting from pocket edge fillet and propagating towards the other edge.
6. Finite element analysis
The process of generation of finite element model to simulate dynamic radial fatigue test is described in thefollowing sequel. Finite element modeling and analysis is carried out using a general purpose finite elementsoftware ANSYS.
Element size of 5 mm is used for meshing the wheel model with 101,008 elements and 188,466 nodes. Thewheel is glued to the base through the pitch circle diameter and all the degrees of freedom of the mounting faceare constrained [9].
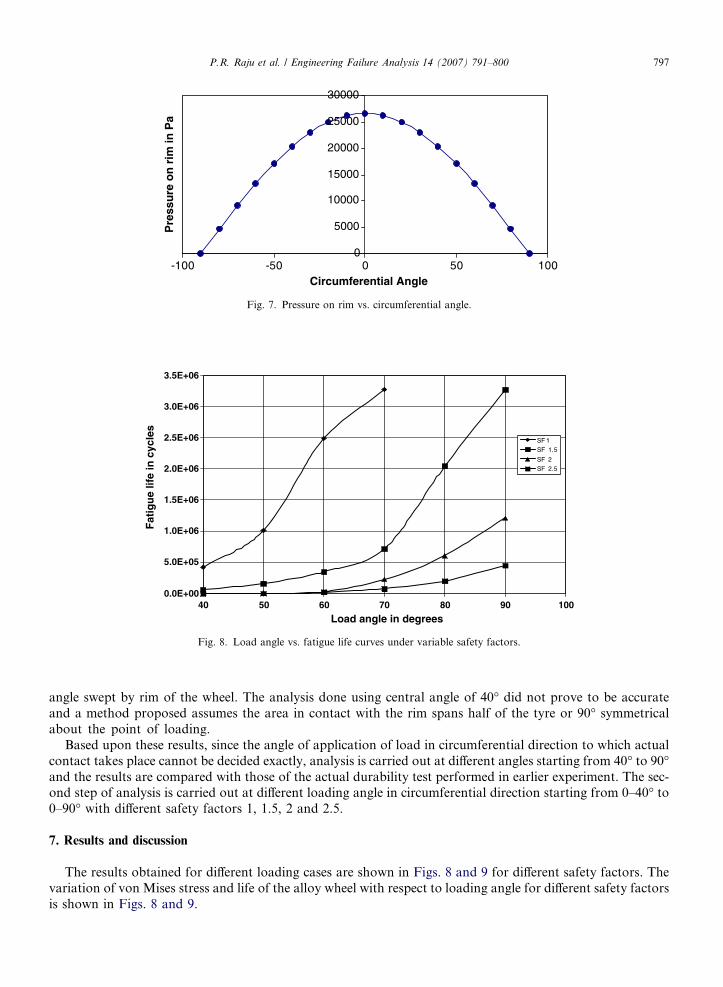
The test load of 33,630 N is applied as 18 discrete nodal point loads 10� apart over a span of 180� [5]. Theload is distributed as a cosine function with in a central angle of 90� in a circumferential direction. The appli-cation of pressure on the rim is shown in Fig. 6.
Along the line of contact between the tyre and road, the pressure will be maximum at 0� and decreases asthe loading angle along circumferential direction increases and finally becomes zero at 90� [10]. The same isapplicable due to symmetry over the other 90� of circumference. Fig. 7 shows the application of pressure withrespect to the loading angle along circumferential direction over a span of 180�.
Results obtained from strain gauge experiments [10] indicate that loading shape is in the form of acosine function about a central angle of 40� from either side of the point of contact with the ground. This40� angle is developed from the contact patch geometry of the tyre. Indicating that when the tyre is loadedthere is flat at the point of contact with the ground, and the length of this patch is then converted to an
Fig. 6. Loading in the form of cosine function over 90�.
0
5000
10000
15000
20000
25000
30000
-100 -50 0 50 100Circumferential Angle
Pre
ssu
re o
n r
im in
Pa
Fig. 7. Pressure on rim vs. circumferential angle.
0.0E+00
5.0E+05
1.0E+06
1.5E+06
2.0E+06
2.5E+06
3.0E+06
3.5E+06
40 50 60 70 80 90 100
Load angle in degrees
Fat
igu
e lif
e in
cyc
les
SF 1
SF 1.5
SF 2
SF 2.5
Fig. 8. Load angle vs. fatigue life curves under variable safety factors.
P.R. Raju et al. / Engineering Failure Analysis 14 (2007) 791–800 797
angle swept by rim of the wheel. The analysis done using central angle of 40� did not prove to be accurateand a method proposed assumes the area in contact with the rim spans half of the tyre or 90� symmetricalabout the point of loading.
Based upon these results, since the angle of application of load in circumferential direction to which actualcontact takes place cannot be decided exactly, analysis is carried out at different angles starting from 40� to 90�and the results are compared with those of the actual durability test performed in earlier experiment. The sec-ond step of analysis is carried out at different loading angle in circumferential direction starting from 0–40� to0–90� with different safety factors 1, 1.5, 2 and 2.5.
7. Results and discussion
The results obtained for different loading cases are shown in Figs. 8 and 9 for different safety factors. Thevariation of von Mises stress and life of the alloy wheel with respect to loading angle for different safety factorsis shown in Figs. 8 and 9.
0
50
100
150
200
250
300
350
400
450
40 50 60 70 80 90 100
Load angle in degrees
von
Mis
es s
tres
s in
MP
a
SF 1
SF 1.5
SF 2
SF 2.5
Fig. 9. Load angle vs. von Mises under variable safety factors.
798 P.R. Raju et al. / Engineering Failure Analysis 14 (2007) 791–800
From Fig. 8, it can be observed that for safety factor 1 and 40� circumferential loading, the life of the wheelis 424,812 cycles. As the circumferential angle increases from 40� to 70�, the life of the wheel increases to3,277,860 cycles more and increases further up to 90� loading. From experimental results, the life of wheel liesin between 1,050,000 and 1,300,000 cycles. The change in life of the wheel by varying circumferential anglefrom 40� to 90� is much higher compared to experimental results.
For safety factor 1.5, it can be observed that the life of wheel at 40� circumferential loading is 62,050 cyclesand the life gradually increases to 3,277,860 cycles at 90�. It can also be observed that for safety factor 1.5, thelife is more than the experimental results.
For safety factor 2, it can be observed that the life of the wheel is less than 10,000 cycles at 40� circumfer-ential loading and the life gradually increased to 1,213,400 cycles at 90� loading. It can be observed that resultsobtained from 90� circumferential loading with safety factor 2 are much closer to the experimental results.
For safety factor 2.5, the life of alloy wheel is less than 10,000 cycles at 40� circumferential loading and447,400 cycles at 90� loading, which shows that the safety factor 2.5 gives life much lesser compared to cor-responding experimental results.
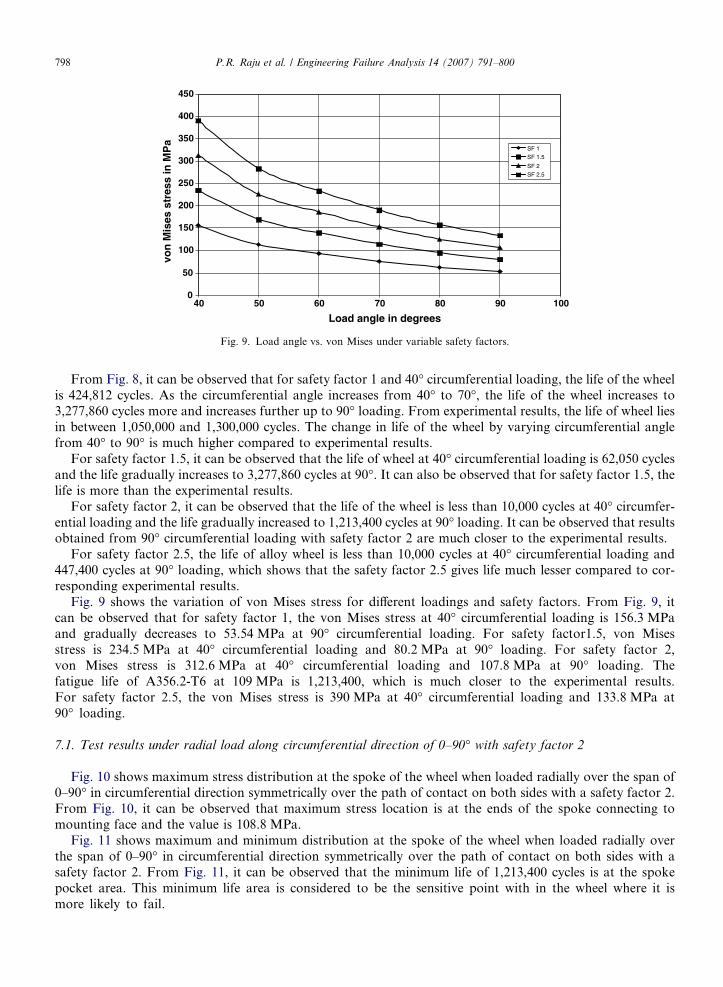
Fig. 9 shows the variation of von Mises stress for different loadings and safety factors. From Fig. 9, itcan be observed that for safety factor 1, the von Mises stress at 40� circumferential loading is 156.3 MPaand gradually decreases to 53.54 MPa at 90� circumferential loading. For safety factor1.5, von Misesstress is 234.5 MPa at 40� circumferential loading and 80.2 MPa at 90� loading. For safety factor 2,von Mises stress is 312.6 MPa at 40� circumferential loading and 107.8 MPa at 90� loading. Thefatigue life of A356.2-T6 at 109 MPa is 1,213,400, which is much closer to the experimental results.For safety factor 2.5, the von Mises stress is 390 MPa at 40� circumferential loading and 133.8 MPa at90� loading.
7.1. Test results under radial load along circumferential direction of 0–90� with safety factor 2
Fig. 10 shows maximum stress distribution at the spoke of the wheel when loaded radially over the span of0–90� in circumferential direction symmetrically over the path of contact on both sides with a safety factor 2.From Fig. 10, it can be observed that maximum stress location is at the ends of the spoke connecting tomounting face and the value is 108.8 MPa.
Fig. 11 shows maximum and minimum distribution at the spoke of the wheel when loaded radially overthe span of 0–90� in circumferential direction symmetrically over the path of contact on both sides with asafety factor 2. From Fig. 11, it can be observed that the minimum life of 1,213,400 cycles is at the spokepocket area. This minimum life area is considered to be the sensitive point with in the wheel where it ismore likely to fail.
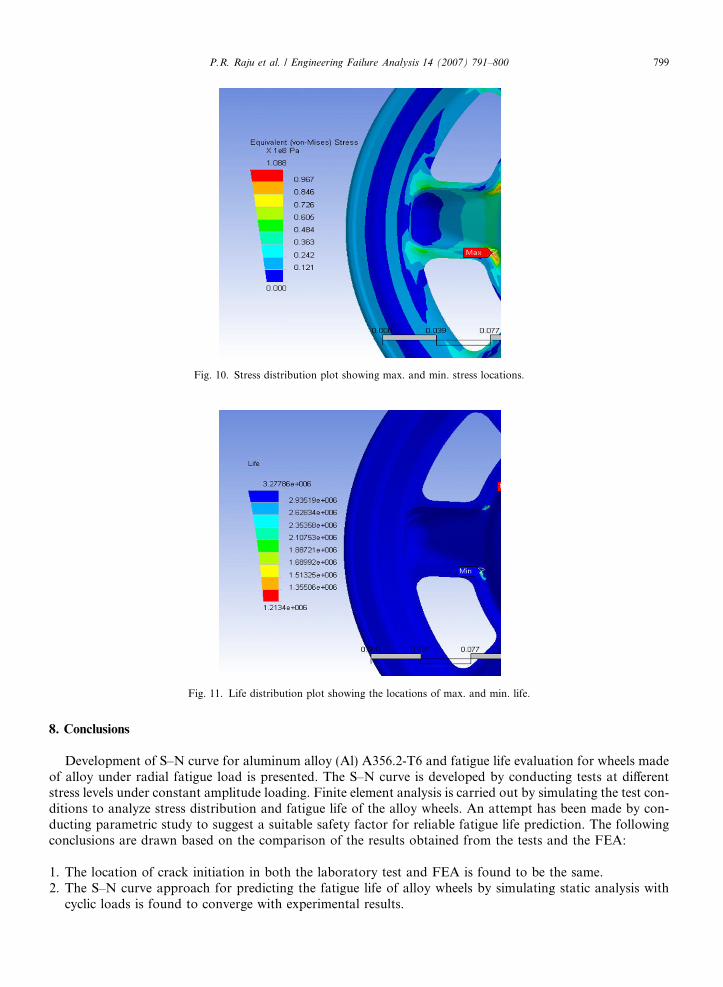
Fig. 10. Stress distribution plot showing max. and min. stress locations.
Fig. 11. Life distribution plot showing the locations of max. and min. life.
P.R. Raju et al. / Engineering Failure Analysis 14 (2007) 791–800 799
8. Conclusions
Development of S–N curve for aluminum alloy (Al) A356.2-T6 and fatigue life evaluation for wheels madeof alloy under radial fatigue load is presented. The S–N curve is developed by conducting tests at differentstress levels under constant amplitude loading. Finite element analysis is carried out by simulating the test con-ditions to analyze stress distribution and fatigue life of the alloy wheels. An attempt has been made by con-ducting parametric study to suggest a suitable safety factor for reliable fatigue life prediction. The followingconclusions are drawn based on the comparison of the results obtained from the tests and the FEA:
1. The location of crack initiation in both the laboratory test and FEA is found to be the same.2. The S–N curve approach for predicting the fatigue life of alloy wheels by simulating static analysis with
cyclic loads is found to converge with experimental results.
800 P.R. Raju et al. / Engineering Failure Analysis 14 (2007) 791–800
3. The predicted fatigue life using FEA is found to be in close agreement with the corresponding experimentalobservations
4. Safety factors for fatigue life and radial load are suggested by conducting extensive parametric studies.5. The proposed safety factors will be useful for manufacturers/designers for reliable fatigue life prediction of
similar structural components subjected to radial fatigue load.
References
[1] JIS D 4103. Japanese Industrial Standard. Disc Wheel for Automobiles. 1989.[2] Grubisic V, Fischer G. Automotive wheels, methods and procedures for optimal design and testing. SAE Technical Paper Series
830135; 1984:1.508–1.525.[3] Hsu YL, Wang SG, Liu TC. Prediction of fatigue failure of aluminum disc wheel using the failure probability contour based on
historical test data. J Chin Inst Industrial Eng 2004;21(6):551–8.[4] Gope PC. Determination of minimum number of specimens in S–N testing. J Eng Mater Technol 2002;124:421–7.[5] Kerr S, Russell DL, Patel US, Bishop NWM. FE-based wheel fatigue analysis using MSC. Fatigue. Proceedings of the 1st MSC
worldwide automotive conference, Munich, Germany: 1999.[6] David Gerken T, Rick Neal. Squeeze cast (SCPM) light weight aluminum front knuckle case study. International Congress and
Exposition. Detroit, Michigan; 1999.[7] IS: 5075 INDIAN STANDARD. Method of rotating bending fatigue testing of metals 1985.[8] Fischer G, Grubisic V. Cast aluminum wheels and buses – testing and evaluation. SAE Technical Paper Series 841705; 1985;6.1051–
6.1062.[9] Hsu YL, Hsu MS. Weight reduction of aluminum disc wheels under fatigue constraints using a sequential neural network
approximation method. Computers Ind 2001;46(2):61–73.[10] John Stearns C. An investigation of stress and displacement distribution in a aluminum alloy automobile rim. A Dissertation
Presented to the Graduate Faculty of the University of Akron, Ohio; 2000.
Copyright © 2022 FDOKUMEN