Evaluation of excess significance bias in animal studies of neurological diseases
10
Evaluation of Excess Significance Bias in Animal Studies of Neurological Diseases Konstantinos K. Tsilidis 1. , Orestis A. Panagiotou 1. , Emily S. Sena 2,3 , Eleni Aretouli 4,5 , Evangelos Evangelou 1 , David W. Howells 3 , Rustam Al-Shahi Salman 2 , Malcolm R. Macleod 2 , John P. A. Ioannidis 6 * 1 Department of Hygiene and Epidemiology, University of Ioannina School of Medicine, Ioannina, Greece, 2 Department of Clinical Neurosciences, University of Edinburgh, Edinburgh, United Kingdom, 3 The Florey Institute of Neuroscience and Mental Health, University of Melbourne, Heidelberg, Victoria, Australia, 4 Department of Methods and Experimental Psychology, University of Deusto, Bilbao, Spain, 5 Laboratory of Cognitive Neuroscience, School of Psychology, Aristotle University of Thessaloniki, Thessaloniki, Greece, 6 Stanford Prevention Research Center, Department of Medicine, and Department of Health Research and Policy, Stanford University School of Medicine, and Department of Statistics, Stanford University School of Humanities and Sciences, Stanford, California, United States of America Abstract Animal studies generate valuable hypotheses that lead to the conduct of preventive or therapeutic clinical trials. We assessed whether there is evidence for excess statistical significance in results of animal studies on neurological disorders, suggesting biases. We used data from meta-analyses of interventions deposited in Collaborative Approach to Meta-Analysis and Review of Animal Data in Experimental Studies (CAMARADES). The number of observed studies with statistically significant results (O) was compared with the expected number (E), based on the statistical power of each study under different assumptions for the plausible effect size. We assessed 4,445 datasets synthesized in 160 meta-analyses on Alzheimer disease (n = 2), experimental autoimmune encephalomyelitis (n = 34), focal ischemia (n = 16), intracerebral hemorrhage (n = 61), Parkinson disease (n = 45), and spinal cord injury (n = 2). 112 meta-analyses (70%) found nominally (p#0.05) statistically significant summary fixed effects. Assuming the effect size in the most precise study to be a plausible effect, 919 out of 4,445 nominally significant results were expected versus 1,719 observed (p,10 29 ). Excess significance was present across all neurological disorders, in all subgroups defined by methodological characteristics, and also according to alternative plausible effects. Asymmetry tests also showed evidence of small-study effects in 74 (46%) meta-analyses. Significantly effective interventions with more than 500 animals, and no hints of bias were seen in eight (5%) meta-analyses. Overall, there are too many animal studies with statistically significant results in the literature of neurological disorders. This observation suggests strong biases, with selective analysis and outcome reporting biases being plausible explanations, and provides novel evidence on how these biases might influence the whole research domain of neurological animal literature. Citation: Tsilidis KK, Panagiotou OA, Sena ES, Aretouli E, Evangelou E, et al. (2013) Evaluation of Excess Significance Bias in Animal Studies of Neurological Diseases. PLoS Biol 11(7): e1001609. doi:10.1371/journal.pbio.1001609 Academic Editor: Lisa Bero, University of California San Francisco, United States of America Received February 13, 2013; Accepted June 6, 2013; Published July 16, 2013 Copyright: ß 2013 Tsilidis et al. This is an open-access article distributed under the terms of the Creative Commons Attribution License, which permits unrestricted use, distribution, and reproduction in any medium, provided the original author and source are credited. Funding: No specific and/or direct funding was received for this study. No funding bodies played any role in the design, writing or decision to publish this manuscript. The authors were personally salaried by their institutions during the period of writing though no specific salary was set aside or given for the writing of this paper. There are no current external funding sources for this study. Competing Interests: The authors have declared that no competing interests exist. Abbreviations: AD, Alzheimer disease; CAMARADES, Collaborative Approach to Meta-Analysis and Review of Animal Data in Experimental Studies; E, number of expected studies with statistically significant results; EAE, experimental autoimmune encephalomyelitis; ICH, intracerebral hemorrhage; IQR, interquartile range; MBP, myelin basic protein; NOS, nitric oxide species; O, number of observed studies with statistically significant results; PD, Parkinson disease; RCT, randomized clinical trial; SCI, spinal cord injury * E-mail: [email protected] . These authors contributed equally to this work. Introduction Animal research studies make a valuable contribution in the generation of hypotheses that might be tested in preventative or therapeutic clinical trials of new interventions. These data may establish that there is a reasonable prospect of efficacy in human disease, which justifies the risk to trial participants. Several empirical evaluations of the preclinical animal literature have shown limited concordance between treatment effects in animal experiments and subsequent clinical trials in humans [1–4]. Systematic assessments of the quality of animal studies have attributed this translational failure, at least in part, to shortcomings in experimental design and in the reporting of results [5]. Lack of randomization, blinding, inadequate application of inclusion and exclusion criteria, inadequate statistical power, and inappropriate statistical analysis may compromise internal validity [6,7]. These problems are compounded by different types of reporting biases [8]. First, bias against publication of ‘‘negative’’ results (publication bias) or publication after considerable delay (time lag bias) may exist [9]. Such findings may not be published at all, published with considerable delay, or published in low impact or low visibility national journals in comparison to studies with ‘‘positive’’ findings. Second, selective analysis and outcome reporting biases may emerge when there are many analyses that can be performed, but only the analysis with the ‘‘best’’ results is presented resulting in potentially misleading findings [10]. This can take many different PLOS Biology | www.plosbiology.org 1 July 2013 | Volume 11 | Issue 7 | e1001609
Transcript of Evaluation of excess significance bias in animal studies of neurological diseases

Evaluation of Excess Significance Bias in Animal Studiesof Neurological DiseasesKonstantinos K. Tsilidis1., Orestis A. Panagiotou1., Emily S. Sena2,3, Eleni Aretouli4,5,
Evangelos Evangelou1, David W. Howells3, Rustam Al-Shahi Salman2, Malcolm R. Macleod2,
John P. A. Ioannidis6*
1 Department of Hygiene and Epidemiology, University of Ioannina School of Medicine, Ioannina, Greece, 2 Department of Clinical Neurosciences, University of Edinburgh,
Edinburgh, United Kingdom, 3 The Florey Institute of Neuroscience and Mental Health, University of Melbourne, Heidelberg, Victoria, Australia, 4 Department of Methods
and Experimental Psychology, University of Deusto, Bilbao, Spain, 5 Laboratory of Cognitive Neuroscience, School of Psychology, Aristotle University of Thessaloniki,
Thessaloniki, Greece, 6 Stanford Prevention Research Center, Department of Medicine, and Department of Health Research and Policy, Stanford University School of
Medicine, and Department of Statistics, Stanford University School of Humanities and Sciences, Stanford, California, United States of America
Abstract
Animal studies generate valuable hypotheses that lead to the conduct of preventive or therapeutic clinical trials. Weassessed whether there is evidence for excess statistical significance in results of animal studies on neurological disorders,suggesting biases. We used data from meta-analyses of interventions deposited in Collaborative Approach to Meta-Analysisand Review of Animal Data in Experimental Studies (CAMARADES). The number of observed studies with statisticallysignificant results (O) was compared with the expected number (E), based on the statistical power of each study underdifferent assumptions for the plausible effect size. We assessed 4,445 datasets synthesized in 160 meta-analyses onAlzheimer disease (n = 2), experimental autoimmune encephalomyelitis (n = 34), focal ischemia (n = 16), intracerebralhemorrhage (n = 61), Parkinson disease (n = 45), and spinal cord injury (n = 2). 112 meta-analyses (70%) found nominally(p#0.05) statistically significant summary fixed effects. Assuming the effect size in the most precise study to be a plausibleeffect, 919 out of 4,445 nominally significant results were expected versus 1,719 observed (p,1029). Excess significance waspresent across all neurological disorders, in all subgroups defined by methodological characteristics, and also according toalternative plausible effects. Asymmetry tests also showed evidence of small-study effects in 74 (46%) meta-analyses.Significantly effective interventions with more than 500 animals, and no hints of bias were seen in eight (5%) meta-analyses.Overall, there are too many animal studies with statistically significant results in the literature of neurological disorders. Thisobservation suggests strong biases, with selective analysis and outcome reporting biases being plausible explanations, andprovides novel evidence on how these biases might influence the whole research domain of neurological animal literature.
Citation: Tsilidis KK, Panagiotou OA, Sena ES, Aretouli E, Evangelou E, et al. (2013) Evaluation of Excess Significance Bias in Animal Studies of NeurologicalDiseases. PLoS Biol 11(7): e1001609. doi:10.1371/journal.pbio.1001609
Academic Editor: Lisa Bero, University of California San Francisco, United States of America
Received February 13, 2013; Accepted June 6, 2013; Published July 16, 2013
Copyright: � 2013 Tsilidis et al. This is an open-access article distributed under the terms of the Creative Commons Attribution License, which permitsunrestricted use, distribution, and reproduction in any medium, provided the original author and source are credited.
Funding: No specific and/or direct funding was received for this study. No funding bodies played any role in the design, writing or decision to publish thismanuscript. The authors were personally salaried by their institutions during the period of writing though no specific salary was set aside or given for the writingof this paper. There are no current external funding sources for this study.
Competing Interests: The authors have declared that no competing interests exist.
Abbreviations: AD, Alzheimer disease; CAMARADES, Collaborative Approach to Meta-Analysis and Review of Animal Data in Experimental Studies; E, number ofexpected studies with statistically significant results; EAE, experimental autoimmune encephalomyelitis; ICH, intracerebral hemorrhage; IQR, interquartile range;MBP, myelin basic protein; NOS, nitric oxide species; O, number of observed studies with statistically significant results; PD, Parkinson disease; RCT, randomizedclinical trial; SCI, spinal cord injury
* E-mail: [email protected]
. These authors contributed equally to this work.
Introduction
Animal research studies make a valuable contribution in the
generation of hypotheses that might be tested in preventative or
therapeutic clinical trials of new interventions. These data may
establish that there is a reasonable prospect of efficacy in human
disease, which justifies the risk to trial participants.
Several empirical evaluations of the preclinical animal literature
have shown limited concordance between treatment effects in
animal experiments and subsequent clinical trials in humans [1–4].
Systematic assessments of the quality of animal studies have
attributed this translational failure, at least in part, to shortcomings
in experimental design and in the reporting of results [5]. Lack of
randomization, blinding, inadequate application of inclusion and
exclusion criteria, inadequate statistical power, and inappropriate
statistical analysis may compromise internal validity [6,7].
These problems are compounded by different types of reporting
biases [8]. First, bias against publication of ‘‘negative’’ results
(publication bias) or publication after considerable delay (time lag
bias) may exist [9]. Such findings may not be published at all,
published with considerable delay, or published in low impact or low
visibility national journals in comparison to studies with ‘‘positive’’
findings. Second, selective analysis and outcome reporting biases
may emerge when there are many analyses that can be performed,
but only the analysis with the ‘‘best’’ results is presented resulting in
potentially misleading findings [10]. This can take many different
PLOS Biology | www.plosbiology.org 1 July 2013 | Volume 11 | Issue 7 | e1001609

representations such as analyzing many different outcomes but
reporting only one or some of them, or using different statistical
approaches to analyze the same outcome but reporting only one of
them. Third, in theory ‘‘positive’’ results may be totally faked, but
hopefully such fraud is not common. Overall, these biases ultimately
lead to a body of evidence with an inflated proportion of published
studies with statistically significant results.
Detecting these biases is not a straightforward process. There
are several empirical statistical methods that try to detect
publication bias in meta-analyses. The most popular of these are
tests of asymmetry, which evaluate whether small or imprecise
studies give different results from larger more precise ones [11].
However, these methods may not be very sensitive or specific in
the detection of such biases, especially when few studies are
included in a meta-analysis [11–13].
An alternative approach is the excess significance test. This
examines whether too many individual studies in a meta-analysis
report statistically significant results compared with what would be
expected under reasonable assumptions about the plausible effect
size [14]. The excess significance test has low power to detect bias
in single meta-analyses with limited number of studies, but a major
advantage is its applicability to many meta-analyses across a given
field. This increases the power to detect biases that pertain to
larger fields and disciplines rather than just single topics. Previous
applications have found an excess of statistically significant
findings in various human research domains [14–17], but it has
not been applied to animal research studies.
Biases in animal experiments may result in biologically inert or
even harmful substances being taken forward to clinical trials, thus
exposing patients to unnecessary risk and wasting scarce research
funds. It is important to understand the extent of potential biases in
this field, as multiple interventions with seemingly promising results
in animals accumulate in its literature. Therefore, in this paper, we
probed whether there is evidence for excess statistical significance in
animal studies of interventions for neurological diseases using a
large database of 160 interventions and 4,445 study datasets.
Results
Description of DatabaseOur database included a total of 4,445 pairwise comparisons
from 1,411 unique animal studies that were synthesized in 160
meta-analyses (Table S1). Two meta-analyses (n = 1,054 compar-
isons) pertained to Alzheimer disease (AD), 34 meta-analyses
(n = 483) to experimental autoimmune encephalomyelitis (EAE),
16 meta-analyses (n = 1,403) to focal ischemia, 61 meta-analyses
(n = 424) to intracerebral hemorrhage (ICH), 45 meta-analyses
(n = 873) to Parkinson disease (PD), and two meta-analyses
(n = 208) to spinal cord injury (SCI). The median number of
comparisons in each meta-analysis was eight (interquartile range
[IQR], 3–23). The median sample size in each animal study
dataset was 16 (IQR, 11–20), while the median sample size in each
meta-analysis was 135 (IQR, 48–376).
Summary Effect SizesOf the 160 meta-analyses, 112 (70%) had found a nominally
(p#0.05) statistically significant summary effect per fixed-effects
synthesis, of which 108 meta-analyses favored the experimental
intervention and only four meta-analyses favored the control
intervention (94 and four for random effects synthesis). The
proportion of the associations that had a nominally statistically
significant effect using the fixed-effects summary ranged from 57%
for ICH to 100% for AD, focal ischemia, and SCI. Table S1
provides information for all 160 meta-analyses. In 47 (29%) meta-
analyses the respective most precise study had a nominally
statistically significant result, as described in Table 1. The effect
size of the most precise study in each meta-analysis was more
conservative than the fixed-effects summary in 114 (71%) meta-
analyses.
Between-Study HeterogeneityThere was statistically significant heterogeneity at p#0.10 for 83
(52%) meta-analyses (Table S1). There was moderate heteroge-
neity (I2 = 50%–75%) in 52 (33%) meta-analyses, and high
heterogeneity (I2.75%) in 22 (14%). The lowest proportion of
significant heterogeneity was observed in meta-analyses of ICH
(36%) and PD (42%), while all other areas had significant
heterogeneities above 70%. Uncertainty around the heterogeneity
estimates was often large, as reflected by wide 95% CI of I2.
Small-Study EffectsThere was evidence of small-study effects in 74 (46%) meta-
analyses (Table S1). These pertained to AD (n = 2 meta-analyses),
EAE (n = 14), focal ischemia (n = 9), ICH (n = 27), PD (n = 21), and
SCI (n = 1).
Excess of SignificanceWhen the plausible effect was assumed to be that of the most
precise study in each meta-analysis, there was evidence (p#0.10) of
excess significance in 49 (31%) meta-analyses (AD n = 2, EAE
n = 13, focal ischemia n = 11, ICH n = 10, PD n = 12, SCI n = 1)
(Table 2), despite the generally low power of the excess significance
test. Under the assumptions of the summary fixed effect being the
plausible effect, there was evidence of excess significance in 23
meta-analyses.
When the excess of significance was examined in aggregate across
all 4,445 studies (Table 3), excess significance was present when
assuming as plausible effect the effect of the most precise study
(p,1.1029). The observed number of ‘‘positive’’ studies was
O = 1,719, while the expected was E = 919. Excess significance
was also documented in studies of each of the six disease categories.
An excess of ‘‘positive’’ studies was observed also when assuming the
summary fixed effect as the plausible effect size (p,1.1029).
Similar results were observed in analyses according to method-
ological or reporting characteristics of included studies (Table 4).
Author Summary
Studies have shown that the results of animal biomedicalexperiments fail to translate into human clinical trials; thiscould be attributed either to real differences in theunderlying biology between humans and animals, toshortcomings in the experimental design, or to bias inthe reporting of results from the animal studies. We use astatistical technique to evaluate whether the number ofpublished animal studies with ‘‘positive’’ (statisticallysignificant) results is too large to be true. We assess4,445 animal studies for 160 candidate treatments ofneurological disorders, and observe that 1,719 of themhave a ‘‘positive’’ result, whereas only 919 studies would apriori be expected to have such a result. According to ourmethodology, only eight of the 160 evaluated treatmentsshould have been subsequently tested in humans. Insummary, we judge that there are too many animal studieswith ‘‘positive’’ results in the neurological disorder litera-ture, and we discuss the reasons and potential remediesfor this phenomenon.
Excess Significance Bias in Animal Neuro-Studies
PLOS Biology | www.plosbiology.org 2 July 2013 | Volume 11 | Issue 7 | e1001609

Table 1. Description of the 47 meta-analyses where the respective most precise study had a nominally statistically significanteffect.
Disease OutcomeIntervention/Treatment
Cases/Controls Standardized Mean Difference (95% CI)
Most PreciseStudya
Summary FixedEffect
Summary RandomEffect
EAE Mean severity Aminoguanidine 70/82 1?10 (0?19–2?01) 0?40 (0?04–0?77) 0?45 (20?22 to 1?12)
EAE Mean severity Complete freundsadjuvant
44/42 2?79 (1?27–4?31) 1?61 (0?79–2?43) 1?85 (20?09 to 3?78)
EAE Mean severity Estrogen hormone 415/531 0?84 (0?32–1?36) 1?10 (0?91–1?29) 1?49 (1?08–1?90)
EAE Mean severity Fingolimod (FTY720) 91/111 1?30 (0?07–2?53) 2?39 (1?75–3?03) 3?14 (1?29–4?98)
EAE Mean severity Immunoglobulin 139/90 1?15 (0?67–1?62) 0?89 (0?56–1?23) 1?01 (0?22–1?80)
EAE Mean severity Insulin like growthfactor
38/38 4?04 (2?29–5?80) 4?85 (3?85–5?85) 5?00 (3?65–6?34)
EAE Mean severity MBP 1,138/1,638 0?82 (0?32–1?32) 0?75 (0?65–0?86) 0?98 (0?77–1?19)
EAE Mean severity Minocycline 22/25 2?16 (0?90–3?43) 1?68 (0?91–2?45) 1?72 (0?48–2?97)
EAE Mean severity Phenytoin 11/11 2?59 (0?68–4?51) 3?15 (1?70–4?59) 3?15 (1?70–4?59)
EAE Mean severity Proteolipid protein 19/28 21?27 (22?07 to 20?48) 20?97 (21?62 to 20?32) 20?92 (21?78 to 20?05)
EAE Mean severity Prednisolone 17/17 1?55 (0?12–2?98) 1?54 (0?64–2?44) 1?54 (0?64–2?44)
EAE Mean severity Rolipram 117/109 0?56 (0?03–1?08) 0?69 (0?41–0?97) 0?63 (0?06–1?19)
Focal ischemia Infarct volume Hypothermia 1,803/1,949 1?08 (0?42–1?74) 1?39 (1?30–1?48) 1?69 (1?53–1?86)
Focal ischemia Infarct volume Stem Cells 1,611/1,657 0?91 (0?20–1?62) 0?81 (0?71–0?91) 1?21 (1?00–1?41)
Focal ischemia Infarct volume Growth factor 981/1,026 0?78 (0?14–1?42) 0?93 (0?82–1?04) 1?09 (0?90–1?27)
Focal ischemia Infarct volume Nootropic 120/128 1?44 (0?43–2?44) 0?93 (0?60–1?26) 0?97 (0?53–1?42)
Focal ischemia Infarct volume Minocycline 335/337 1?20 (0?55–1?84) 0?84 (0?65–1?03) 0?83 (0?60–1?07)
Focal ischemia Infarct volume Melatonin 276/303 1?33 (0?51–2?14) 1?13 (0?90–1?35) 1?13 (0?90–1?35)
Focal ischemia Infarct volume NOS donors 280/356 1?58 (0?76–2?41) 0?71 (0?50–0?92) 0?76 (0?44–1?08)
ICH Neurobehavioural score Anti-inflammatory 218/214 0?79 (0?10–1?48) 1?19 (0?89–1?48) 2?06 (1?34–2?77)
ICH Neurobehavioural score Calcium channelblockers
108/108 1?06 (0?64–1?48) 0?72 (0?42–1?02) 0?47 (20?04 to 0?98)
ICH Neurobehavioural score Growth factor 70/70 4?03 (2?73–5?34) 5?35 (4?55–6?15) 6?37 (4?18–8?55)
ICH Neurobehavioural score Tuftsin fragment 1–3 29/26 1?33 (0?59–2?08) 1?21 (0?62–1?79) 1?21 (0?62–1?79)
ICH Neurobehavioural score PPAR-gamma agonist 37/37 2?00 (0?94–3?06) 3?36 (2?52–4?20) 5?38 (1?82–8?95)
ICH Neurobehavioural score Psychomotor stimulant 98/104 0?76 (0?27–1?25) 0?17 (20?15 to 0?48) 20?36 (21?19 to 0?48)
ICH Neurobehavioural score Stem cells 408/371 2?81 (2?09–3?53) 1?64 (1?45–1?84) 1?77 (1?38–2?15)
ICH Brain water content Minocycline 12/12 2?33 (0?73–3?94) 2?62 (1?41–3?84) 2?62 (1?41–3?84)
ICH Brain water content Growth factor 18/18 5?76 (3?81–7?71) 4?98 (3?51–6?45) 4?95 (3?19–6?70)
ICH Brain water content Zinc protoporphyrin 12/12 1?31 (0?01–2?60) 1?40 (0?46–2?34) 1?40 (0?46–2?34)
ICH Brain water content Atorvastatin 18/18 3?01 (1?25–4?77) 3?77 (2?28–5?26) 4?12 (1?53–6?71)
ICH Brain water content Tuftsin fragment 10/10 1?63 (0?09–3?17) 1?83 (0?69–2?98) 1?83 (0?69–2?98)
ICH Brain water content Stem cells 32/32 1?60 (0?43–2?77) 1?43 (0?64–2?22) 1?43 (0?64–2?22)
ICH Hematoma volume Recombinant factorVIIa
12/12 21?74 (23?15 to 20?32) 22?03 (23?11 to 20?96) 22?03 (23?11 to 20?96)
ICH Hematoma volume Tuftsin fragment 12/12 1?35 (0?15–2?56) 1?57 (0?59–2?54) 1?57 (0?59–2?54)
ICH Hematoma volume Rosiglitazone 11/11 2?05 (0?07–4?02) 3?01 (1?59–4?44) 3?03 (1?06–5?01)
PD Various A86929 68/68 2?31 (0?20–4?42) 1?55 (0?76–2?34) 1?55 (0?76–2?34)
PD Rotational behavior Aplindore 105/105 0?78 (0?04–1?53) 1?73 (1?40–2?06) 1?88 (1?25–2?51)
PD Various Ciladopa (AY27110) 100/100 1?40 (0?55–2?25) 0?002 (20?38 to 0?38) 20?37 (21?36 to 0?62)
PD Various Bromocriptine 436/490 0?97 (0?02–1?91) 0?96 (0?76–1?17) 0?95 (0?71–1?18)
PD Rotational behavior Dinapsoline 131/131 1?47 (0?07–2?87) 2?03 (1?59–2?47) 2?30 (1?48–3?11)
PD Various Lisuride 100/146 1?04 (0?18–1?90) 1?39 (0?99–1?80) 1?39 (0?99–1?80)
PD Various Pramipexole 146/143 1?81 (0?45–3?16) 1?42 (0?97–1?87) 1?43 (0?83–2?03)
PD Various Quinelorane 24/21 2?48 (0?88–4?07) 1?06 (0?15–1?97) 1?22 (20?43 to 2?86)
Excess Significance Bias in Animal Neuro-Studies
PLOS Biology | www.plosbiology.org 3 July 2013 | Volume 11 | Issue 7 | e1001609

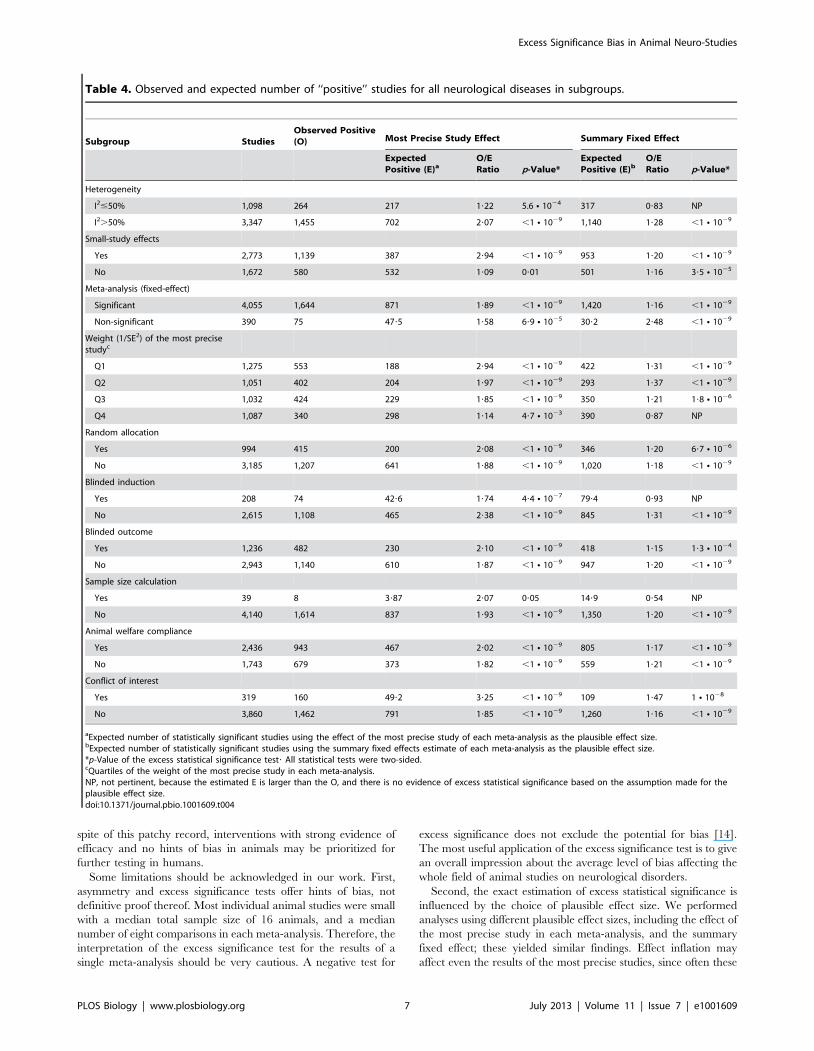
Under the assumption of the effect of the most precise study being
the plausible effect, there was evidence of excess significance in all
subgroups. However, the strongest excesses of significance (as
characterized by the ratio of O over E) were recorded specifically
in meta-analyses where small-study effects had also been
documented (O/E = 2.94), in those meta-analyses with the least
precise studies (O/E = 2.94 in the bottom quartile of weight), and
in those meta-analyses where the corresponding studies included a
statement about the presence of conflict of interest (O/E = 3.27).
Under the assumption of the summary fixed effects being the
plausible effect size, excess significance was still formally
documented in the large majority of subgroups, but none had
such extreme O/E ratios (Table 4).
Interventions with Strong Evidence of AssociationOnly 46 meta-analyses (29%) found interventions with a
nominally significant effect per fixed-effects synthesis and no
evidence of small-study effects or excess significance (when this
calculation was based on the plausible effect being that of the most
precise study) (Figure 1). Of those, only eight had a total sample
size of over 500 animals: one pertained to EAE (myelin basic
protein [MBP]), four pertained to focal ischemia (minocycline,
melatonin, nicotinamide, nitric oxide species [NOS] donors), one
pertained to ICH (stem cells), and two to PD (bromocriptine,
quinpirole).
Discussion
We evaluated 160 meta-analyses of animal studies describing six
neurological conditions, most of which had found a nominally
(p#0.05) statistically significant fixed-effects summary favoring the
experimental intervention. The number of nominally statistically
significant results in the component studies of these meta-analyses
was too large to be true, and this evidence of excess significance
was present in studies across all six neurological diseases. Overall,
only eight of the 160 meta-analyses had nominally significant
results, no suggestion of bias related to small-study effects or excess
of significant findings, and evidence procured from over 500
animals.
Animal studies represent a considerable proportion of the
biomedical literature with approximately five million papers
indexed in PubMed [8]. These studies are conducted to do a
first-pass evaluation of the effectiveness and safety of therapeutic
interventions. However, there is great discrepancy between the
intervention effects found in preclinical animal studies and those
found in clinical trials of humans with most of these interventions
rarely achieving successful translation [2,3,18]. Possible explana-
tions for this failure include differences in the underlying biology
and pathophysiology between humans and animals, but also the
presence of biases in study design or reporting of the animal
literature.
Our empirical evaluation of animal studies on neurological
disorders found a significant excess of nominally statistically
significant studies, which suggests the presence of strong study
design or reporting biases. Prior evaluations of animal studies had
also noted that alarmingly the vast majority of the published
studies had statistically significant associations, and had suggested
high prevalence of publication bias [9,19], resulting in spurious
claims of effectiveness. We observed excessive nominally signifi-
cant results in all subgroup categories defined by random
allocation of treatment, blinded induction of treatment, blinded
assessment of the outcome, sample size calculation, or compliance
to animal welfare. This suggests that the excess of significance in
animal studies of neurological disorders may reflect reporting
biases that operate regardless of study design features. It is
nevertheless possible that reporting biases are worst in fields with
poor study quality, although this was not clear in our evaluation.
Deficiencies in random allocation and blinded induction of the
treatment or blinded assessment of the outcome have been
associated with inflated efficacy estimates in other evaluations of
animal research [20,21].
We also documented very prominent excess of significant results
(observed ‘‘positive’’ results being three times the number of
expected) for interventions that had also evidence of small-study
effects and in meta-analyses with the least precise studies. Both of
these observations are commensurate with reporting bias being the
explanation for the excess significance, with bias being more
prominent in smaller studies and becoming more discernible when
sufficiently precise studies are also available.
Conventional publication bias (non-publication of neutral/
negative results), may exist in the literature of animal studies on
neurological disorders. Our evaluation showed that 46% of the
meta-analyses had evidence of small-study effects, which may
signal publication bias. However, this association is not specific,
and the Egger test used to evaluate small-study effects is
underpowered especially when it evaluates few and small studies
in a meta-analysis [13]. It is also likely that selective outcome or
analysis reporting biases exist. The animal studies on neurological
disorders used many different outcomes and methods to measure
each outcome as can be seen across the Table S1, and they may
have used different statistical analysis techniques and applied
several different rules for inclusion and exclusion of data. Thus, it
is possible that individual studies may have measured different
outcomes, tested a variety of inclusion and exclusion criteria and
Table 1. Cont.
Disease OutcomeIntervention/Treatment
Cases/Controls Standardized Mean Difference (95% CI)
Most PreciseStudya
Summary FixedEffect
Summary RandomEffect
PD Various Quinpirole 320/312 1?47 (0?77–2?17) 1?09 (0?87–1?31) 1?08 (0?65–1?50)
PD Various Rotigotine 75/83 1?81 (0?88–2?74) 1?76 (1?21–2?32) 1?76 (1?21–2?32)
PD Various SKF 80723 10/10 2?30 (0?51–4?09) 3?04 (1?42–4?67) 4?04 (20?02 to 8?09)
PD Various Talipexole 239/238 1?03 (0?33–1?73) 0?79 (0?51–1?07) 0?86 (0?45–1?27)
aStandardized mean difference and 95% CI of the most precise study (smallest standard error) in each meta-analysis.PPAR, peroxisome proliferator-activated receptor; A86929, a dopamine receptor agonist; SKF 80723, a benzazepine D1 dopamine agonist.doi:10.1371/journal.pbio.1001609.t001
Excess Significance Bias in Animal Neuro-Studies
PLOS Biology | www.plosbiology.org 4 July 2013 | Volume 11 | Issue 7 | e1001609

Table 2. Observed and expected number of ‘‘positive’’ studies in the 49 meta-analyses with a significant excess of ‘‘positive’’studies under the assumption that the plausible effect size equals the effect of the most precise study in each meta-analysis.
Disease OutcomeIntervention/Treatment Studies Comparisons
ObservedPositive
Most Precise StudyEffect Summary Fixed Effect
ExpectedPositivea p-Value*
ExpectedPositiveb p-Value*
AD Morris water maze Various 82 250 76 45?8 3?8 N 1026 51?3 2?2 N 1024
AD Plaque area Various 318 804 342 40?6 ,1 N 1029 226 ,1 N 1029
EAE Mean severity Bone marrow 2 24 15 1?2 ,1 N 1029 14?5 0?99
EAE Mean severity Cobra venom factor 2 8 4 1?17 0?02 3?95 0?99
EAE Mean severity Cyclosporin 8 14 6 3?05 0?10 4?43 0?39
EAE Mean severity Estrogen hormone 7 42 22 15?8 0?06 22?3 NP
EAE Mean severity Glatiramer acetate 9 20 13 2?4 4 N 1028 11?5 0?65
EAE Mean severity Interleukin 10 7 34 9 4?6 0?04 2?15 2 N 1024
EAE Mean severity Interleukin 4 3 10 2 0?52 0?09 1?51 0?65
EAE Mean severity Lovastatin 2 7 4 0?93 7?7 N 1023 4?59 NP
EAE Mean severity Methylprednisolone 4 10 6 3?15 0?08 0?69 1?8 N 1025
EAE Mean severity Mitoxantrone 4 30 20 5?29 ,1 N 1029 25?4 NP
EAE Mean severity Rolipram 3 9 7 2?16 1 N 1023 2?99 8?2 N 1023
EAE Mean severity Spinal cord protein 2 5 2 0?32 0?04 0?34 0?04
EAE Mean severity Vitamin D 6 13 9 1?88 1?1 N 1025 9?19 NP
Focal ischemia Infarct volume Hypothermia 107 221 135 101 7?2 N 1026 145 NP
Focal ischemia Infarct volume Stem cells 110 211 84 67?6 0?02 63?7 3?3 N 1023
Focal ischemia Infarct volume Thrombolytic 83 202 60 10?2 ,1 N 1029 41?1 1?6 N 1023
Focal ischemia Infarct volume Anti-oxidants 18 34 14 6?31 2?8 N 1023 13?2 0?86
Focal ischemia Infarct volume Growth factor 78 128 53 32?7 9?7 N 1025 42?7 0?06
Focal ischemia Infarct volume Anti-inflammatory 23 44 31 2?36 ,1 N 1029 20 1?2 N 1023
Focal ischemia Infarct volume Estrogens 33 100 46 10?4 ,1 N 1029 25?6 9?7 N 1026
Focal ischemia Infarct volume Urokinase 12 26 18 2?26 ,1 N 1029 10?1 2 N 1023
Focal ischemia Infarct volume NXY-059 10 29 14 1?54 ,1 N 1029 11?1 0?26
Focal ischemia Infarct volume NOS inhibitors 65 148 63 34?6 2?6 N 1027 33 5 N 1028
Focal ischemia Infarct volume Tacrolimus (FK506) 29 95 55 15?8 ,1 N 1029 50?3 0?36
ICH Neurobehavioural score Minocycline 3 9 3 0?45 8?5 N 1023 0?46 9 N 1023
ICH Neurobehavioural score Anti-inflammatory 7 26 15 7?32 1?7 N 1023 13?6 0?70
ICH Neurobehavioural score Anti-oxidants 9 32 12 1?6 2 N 1028 2?03 3 N 1027
ICH Neurobehavioural score Atorvastatin 2 6 3 0?31 2?5 N 1023 2?97 0?99
ICH Neurobehavioural score Iron chelator 6 14 7 1?9 1?2 N 1023 6?35 0?79
ICH Brain water content Anti-inflammatory 7 13 4 1?04 0?02 4?05 NP
ICH Brain water content Anti-oxidants 5 29 9 3?12 2?6 N 1023 2?15 1?7 N 1024
ICH Brain water content Deferoxamine 2 12 6 1?05 2?6 N 1024 5?58 0?99
ICH Brain water content Estradiol 2 4 2 0?28 0?03 1?06 0?29
ICH Hematoma volume Anti-inflammatory 5 8 2 0?4 0?06 0?84 0?2
PD Various PHNO 15 41 6 2?05 0?02 14?8 NP
PD Various 7-OH-DPAT 4 7 4 0?8 4?4 N 1023 4?12 NP
PD Rotational behavior Aplindore 4 7 7 3?49 7?7 N 1023 6?99 0?99
PD Various Apomorphine 54 156 63 32?2 2 N 1028 30?3 ,1 N 1029
PD Various Cabergoline 6 14 4 0?91 0?01 1?9 0?11
PD Various Pergolide 8 14 4 1?3 0?03 3?25 0?75
PD Various Piribedil 12 42 5 2?17 0?06 10?4 NP
PD Various Ropinirole 13 33 9 4?22 0?03 19?1 NP
PD Various S32504 15 36 14 2?5 5 N 1028 12?7 0?73
PD Various SKF 83959 3 4 2 0?39 0?05 0?96 0?25
Excess Significance Bias in Animal Neuro-Studies
PLOS Biology | www.plosbiology.org 5 July 2013 | Volume 11 | Issue 7 | e1001609

performed several statistical analyses, but reported only a few
findings guided in part by the significance of the results. Detection
of such biases is difficult and no formal well-developed statistical
test exists. Evidence is usually indirect and requires access to the
study protocol or even communication with the investigators.
In contrast to the above, we found eight interventions with
strong and statistically significant benefits in animal models and
without evidence of small-study effects or excess significance.
However, the data for these interventions may still have
compromised internal validity; having identified one of these,
melatonin, as a candidate treatment for stroke, we tested efficacy
in an animal study designed specifically to avoid some of the
prevalent sources of bias. Under these circumstances melatonin
had no significant effect on outcome [22].
It is interesting to discuss whether human experimental
evidence for these interventions is more promising than the
generally disappointing results seen for most interventions that
have previously given some signal of effectiveness in animals. A
meta-analysis of 33 animal studies showed that administration of
MBP reduced the severity of EAE, which is an animal model for
multiple sclerosis. However, a phase III randomized clinical trial
(RCT) in humans showed no significant differences between MBP
and placebo [23]. Minocycline, a tetracycline antibiotic with
potential neuroprotective effects, showed improvements in stroke
scales in two human RCTs, but these were small phase II trials
[24,25] and have not been confirmed in larger studies. Several
animal studies of melatonin, an endogenously produced antiox-
idant, have reported a beneficial effect on infarct volume [26], but
RCTs with clinical endpoints in humans don’t exist. A small RCT
did not show significant differences in oxidative or inflammatory
stress parameters between melatonin and placebo [27]. Adminis-
tration of nicotinamide, the amide of vitamin B3, to animals with
focal ischemia reduced the infarct volume [19], but RCTs have
not evaluated clinical outcomes in relation to nicotinamide [28].
Several animal studies of NOS donors, like the anti-anginal drug
nicorandil, have shown reductions in infarct volume, and RCTs
have also shown that nicorandil improves cardiac function in
patients with acute myocardial infarction [29,30]. Granulocyte-
colony stimulating factor (G-CSF), a growth factor that stimulates
the bone marrow to produce granulocytes and stem cells, has been
reported in animal studies to improve the neurobehavioral score in
animals with ICH. Some similar evidence exists from RCTs of
stroke patients, but it consists of small phase II trials [31,32], and
an unpublished phase III trial was neutral (Ringelstein P et al.,
International Stroke Conference, Feb 2012). Bromocriptine and
quinpirole are dopamine agonists that have been successfully used
in animal studies of PD [33]. Bromocriptine is approved to treat
PD in humans [34], but no human trial exists for quinpirole. In
Table 2. Cont.
Disease OutcomeIntervention/Treatment Studies Comparisons
ObservedPositive
Most Precise StudyEffect Summary Fixed Effect
ExpectedPositivea p-Value*
ExpectedPositiveb p-Value*
PD Various SKF 38393 14 38 12 6?33 0?03 5?62 9?2 N 1023
PD Various SKF 82958 10 16 7 2?12 2?7 N 1023 5?73 0?6
SCI Neurobehavior-motor Stem cells 89 186 85 16?5 ,1 N 1029 85?8 NP
aExpected number of statistically significant studies using the effect of the most precise study of each meta-analysis as the plausible effect size.bExpected number of statistically significant studies using the summary fixed effects estimate of each meta-analysis as the plausible effect size.*p-value of the excess statistical significance test? All statistical tests were two-sided.7-OH-DPAT, a dopamine D3 receptor agonist; NP, not pertinent, because the estimated E is larger than the O, and there is no evidence of excess statistical significancebased on the assumption made for the plausible effect size; NXY-059, disufenton sodium; PHNO, a dopamine D2 receptor agonist; S32504, a dopamine D3/D2 receptoragonist; SKF 82958, a benzazepine D1/D5 dopamine agonist; SKF 38393, a benzazepine D1/D5 dopamine agonist; SKF 83959, a benzazepine D1/D2 dopamine agonist.doi:10.1371/journal.pbio.1001609.t002
Table 3. Observed and expected number of ‘‘positive’’ studies by type of neurological disease.
Disease Comparisons Observed Positive Most Precise Study Effect Summary Fixed Effect
Expected Positivea p-Value* Expected Positiveb p-Value*
All 4,445 1,719 919 ,1 N 1029 1,450 ,1 N 1029
AD 1,054 418 86?4 ,1 N 1029 277 ,1 N 1029
EAE 483 212 131 ,1 N 1029 187 0?02
Focal ischemia 1,403 626 370 ,1 N 1029 517 ,1 N 1029
ICH 424 145 108 5?6 N 1025 130 0?11
PD 873 228 202 0?04 254 NP
SCI 208 90 21?6 ,1 N 1029 90?3 NP
aExpected number of statistically significant studies using the effect of the most precise study of each meta-analysis as the plausible effect size.bExpected number of statistically significant studies using the summary fixed effects estimate of each meta-analysis as the plausible effect size.*p-Value of the excess statistical significance test. All statistical tests were two-sided.NP, not pertinent, because the estimated E is larger than the O, and there is no evidence of excess statistical significance based on the assumption made for theplausible effect size.doi:10.1371/journal.pbio.1001609.t003
Excess Significance Bias in Animal Neuro-Studies
PLOS Biology | www.plosbiology.org 6 July 2013 | Volume 11 | Issue 7 | e1001609
spite of this patchy record, interventions with strong evidence of
efficacy and no hints of bias in animals may be prioritized for
further testing in humans.
Some limitations should be acknowledged in our work. First,
asymmetry and excess significance tests offer hints of bias, not
definitive proof thereof. Most individual animal studies were small
with a median total sample size of 16 animals, and a median
number of eight comparisons in each meta-analysis. Therefore, the
interpretation of the excess significance test for the results of a
single meta-analysis should be very cautious. A negative test for
excess significance does not exclude the potential for bias [14].
The most useful application of the excess significance test is to give
an overall impression about the average level of bias affecting the
whole field of animal studies on neurological disorders.
Second, the exact estimation of excess statistical significance is
influenced by the choice of plausible effect size. We performed
analyses using different plausible effect sizes, including the effect of
the most precise study in each meta-analysis, and the summary
fixed effect; these yielded similar findings. Effect inflation may
affect even the results of the most precise studies, since often these
Table 4. Observed and expected number of ‘‘positive’’ studies for all neurological diseases in subgroups.
Subgroup StudiesObserved Positive(O) Most Precise Study Effect Summary Fixed Effect
ExpectedPositive (E)a
O/ERatio p-Value*
ExpectedPositive (E)b
O/ERatio p-Value*
Heterogeneity
I2#50% 1,098 264 217 1?22 5.6 N 1024 317 0?83 NP
I2.50% 3,347 1,455 702 2?07 ,1 N 1029 1,140 1?28 ,1 N 1029
Small-study effects
Yes 2,773 1,139 387 2?94 ,1 N 1029 953 1?20 ,1 N 1029
No 1,672 580 532 1?09 0?01 501 1?16 3?5 N 1025
Meta-analysis (fixed-effect)
Significant 4,055 1,644 871 1?89 ,1 N 1029 1,420 1?16 ,1 N 1029
Non-significant 390 75 47?5 1?58 6?9 N 1025 30?2 2?48 ,1 N 1029
Weight (1/SE2) of the most precisestudyc
Q1 1,275 553 188 2?94 ,1 N 1029 422 1?31 ,1 N 1029
Q2 1,051 402 204 1?97 ,1 N 1029 293 1?37 ,1 N 1029
Q3 1,032 424 229 1?85 ,1 N 1029 350 1?21 1?8 N 1026
Q4 1,087 340 298 1?14 4?7 N 1023 390 0?87 NP
Random allocation
Yes 994 415 200 2?08 ,1 N 1029 346 1?20 6?7 N 1026
No 3,185 1,207 641 1?88 ,1 N 1029 1,020 1?18 ,1 N 1029
Blinded induction
Yes 208 74 42?6 1?74 4?4 N 1027 79?4 0?93 NP
No 2,615 1,108 465 2?38 ,1 N 1029 845 1?31 ,1 N 1029
Blinded outcome
Yes 1,236 482 230 2?10 ,1 N 1029 418 1?15 1?3 N 1024
No 2,943 1,140 610 1?87 ,1 N 1029 947 1?20 ,1 N 1029
Sample size calculation
Yes 39 8 3?87 2?07 0?05 14?9 0?54 NP
No 4,140 1,614 837 1?93 ,1 N 1029 1,350 1?20 ,1 N 1029
Animal welfare compliance
Yes 2,436 943 467 2?02 ,1 N 1029 805 1?17 ,1 N 1029
No 1,743 679 373 1?82 ,1 N 1029 559 1?21 ,1 N 1029
Conflict of interest
Yes 319 160 49?2 3?25 ,1 N 1029 109 1?47 1 N 1028
No 3,860 1,462 791 1?85 ,1 N 1029 1,260 1?16 ,1 N 1029
aExpected number of statistically significant studies using the effect of the most precise study of each meta-analysis as the plausible effect size.bExpected number of statistically significant studies using the summary fixed effects estimate of each meta-analysis as the plausible effect size.*p-Value of the excess statistical significance test? All statistical tests were two-sided.cQuartiles of the weight of the most precise study in each meta-analysis.NP, not pertinent, because the estimated E is larger than the O, and there is no evidence of excess statistical significance based on the assumption made for theplausible effect size.doi:10.1371/journal.pbio.1001609.t004
Excess Significance Bias in Animal Neuro-Studies
PLOS Biology | www.plosbiology.org 7 July 2013 | Volume 11 | Issue 7 | e1001609

were not necessarily very large or may have had inherent biases
themselves, or both. Thus, our estimates of the extent of excess
statistical significance are possibly conservative, and the problem
may be more severe.
Third, we evaluated a large number of meta-analyses on six
neurological conditions, but our findings might not necessarily be
representative of the whole animal literature. However, biases and
methodological deficits have been described for many animal
studies regardless of disease domain [1,2,21].
In conclusion, the literature of animal studies on neurological
disorders is probably subject to considerable bias. This does not
mean that none of the observed associations in the literature are
true. For example, we showed evidence of eight strong and
statistically significant associations without evidence of small-study
effects or excess significance. However, only two (NOS donors and
focal ischemia, and bromocriptine and PD) of even these eight
associations seem to have convincing RCT data in humans. We
support measures to minimize bias in animal studies and to
maximize successful translation into human applications of
promising interventions [35]. Study design, conduct, and reporting
of animal studies can be improved by following published
guidelines for reporting animal research [35,36]. Publication and
selective reporting biases may be diminished by preregistering
experimental animal studies. Access to the study protocol and also
to raw data and analyses would allow verification of their results,
and make their integration with other parallel or future efforts
easier. Systematic reviews and meta-analyses and large consortia
conducting multi-centre animal studies should become routine to
ensure the best use of existing animal data, and to aid in the
selection of the most promising treatment strategies to enter
human clinical trials.
Materials and Methods
Study IdentificationWe used data from published and unpublished meta-analyses of
interventions tested in animal studies of six neurological diseases
(AD, EAE, focal ischemia, ICH, PD, and SCI) deposited in the
database of Collaborative Approach to Meta-Analysis and Review
of Animal Data in Experimental Studies (CAMARADES), which
is an international collaboration established in 2004 with an aim to
support meta-analyses of animal data [20]. The database is
representative of the literature, and includes details of each
individual experiment. Out of the total of 14 published meta-
analyses of animal stroke studies, 11 are part of the CAMAR-
ADES database. Animal studies report a variety of outcome
measures often measured from the same cohort of animals. To
ensure independence, we only used one outcome analysis per
animal cohort. Where multiple outcomes were reported from a
single cohort, we chose the one that was most frequently found in
each meta-analysis. We abstracted the following information from
each study: publication year, intervention, outcome, animal
cohort, effect size and standard error, number of affected animals
in the treatment and control group, and ten binary methodological
criteria (peer-reviewed publication, statement of control of
temperature, random allocation to treatment or control, blinded
induction of treatment, blinded assessment of outcome, use of
anesthetic without significant intrinsic neuroprotective activity,
Figure 1. Venn diagrams of the meta-analyses of animal studies of neurological disorders. We plotted the number of studies with a totalsample size of at least 500 animals; those which showed a nominally (p#0.05) statistically significant effect per fixed-effects synthesis; those that hadno evidence of small-study effects; and those that had no evidence of excess significance. The numbers represent the studies that have two or moreof the above characteristics according to the respective overlapping areas.doi:10.1371/journal.pbio.1001609.g001
Excess Significance Bias in Animal Neuro-Studies
PLOS Biology | www.plosbiology.org 8 July 2013 | Volume 11 | Issue 7 | e1001609
appropriate animal model, sample size calculation, compliance
with animal welfare regulations, and statement of potential conflict
of interest), which were based on relevant guidelines for reporting
animal research [35–38].
Estimation of Summary Effect and HeterogeneityFor each meta-analysis, we estimated the summary effect size
and its confidence intervals using both fixed and random effect
models [39]. All outcomes included in the database were measured
on a continuous scale, and hence we used the standardized mean
difference as the effect size. We also tested for between-study
heterogeneity estimating the p-value of the x2-based Cochran Q
test, and the I2 metric of inconsistency. Q is obtained by the
weighted sum of the squared differences of the observed effect in
each study minus the fixed summary effect [40]. I2 ranges from
0% to 100% and describes the percentage of variation across
studies that is attributed to heterogeneity rather than chance [41].
The corresponding 95% CIs were also calculated [42].
Asymmetry Tests for Small-Study EffectsWe evaluated whether there is evidence for small-study effects,
i.e., whether smaller studies give substantially different estimates of
effect size compared to larger studies. This may offer a hint for
publication or other selective reporting biases, but they may also
reflect genuine heterogeneity, chance or other reasons for
differences between small and large studies [11]. We applied the
regression asymmetry test proposed by Egger et al [43]. A p#0.10
with more conservative effect in larger studies was considered
evidence for small-study effects.
Evaluation of Excess SignificanceWe applied the excess significance test, which is an exploratory
test that evaluates whether there is a relative excess of formally
significant findings in the published literature due to any reason.
This test evaluates whether the observed number of studies (O)
with nominally statistically significant results (‘‘positive’’ studies,
p#0.05) within a meta-analysis differs from their expected number
(E). ‘‘Positive’’ findings were counted in both directions, i.e., when
the experimental intervention is more beneficial compared to the
control, as well as when the experimental intervention is harmful.
If there is no excess significance bias, then O = E. The greater the
difference between O and E, the greater is the extent of excess
significance bias.
We used a binomial test, as previously presented in detail [14].
This test evaluates whether the number of ‘‘positive’’ studies,
among those in a meta-analysis, is too large based on the power
that these studies have to detect plausible effects at a= 0.05. The
O versus E comparison is performed separately for each meta-
analysis, and it is also extended to many meta-analyses after
summing O and E across meta-analyses.
E is calculated in each meta-analysis by the sum of the statistical
power estimates for each component study. The estimated power
of each component study depends on the plausible effect size for
the tested animal study association. The true effect size for any
meta-analysis is not known. We performed the main analysis using
the effect size of the most precise study (with the smallest standard
error) in a meta-analysis as the plausible effect. The estimate from
this most precise study, other things being equal, should be closer
to the true estimate than the results of less precise studies,
especially if biases affect predominantly the literature of smaller
studies (small-study effects) [44–46]. Additionally, we conducted
sensitivity analysis using as the plausible effect size the fixed effects
summary from each meta-analysis. In the presence of bias these
summary fixed effects may be larger than the true effects, and this
situation may arise even for the effect estimate of the most precise
study, albeit to a smaller extent. Therefore, all these assumptions
tend to be conservative in testing for excess significance. We did
not use the random effects summary, because it tends to be overtly
inflated in the presence of small-study effects, as the small studies
receive increased relative weight in random effects calculations
[47].
The power of each study was calculated using the Wilcoxon
rank sum test under the family of Lehmann alternative hypotheses
in a freely available software [48], which is an exact calculation
suitable for the very small sample sizes that are typical of many
animal studies [49]. Excess significance for single meta-analyses
was claimed at p#0.10 (one-sided p#0.05 with O.E as previously
proposed), since the test is expected to have low power to detect a
specific excess of significant findings especially when there are a
few ‘‘positive’’ studies [14].
We assessed excess significance in aggregate across all six
neurological diseases, and separately in each one of them, as
selective reporting bias may affect different research domains to a
different extent. These domains may also have different typical
magnitudes of effect sizes for the tested interventions, and different
analytical biases even if research is sometimes conducted by the
same teams across various domains.
The excess significance test was also performed in subgroups:
for meta-analyses with I2#50% and .50%, as values exceeding
50% are typically considered evidence of large heterogeneity
beyond chance [50]; by evidence or not of small-study effects as
per Egger’s test; by whether the summary fixed effect of the
respective meta-analysis was nominally statistically significant or
not; by quartiles of the weight of the most precise study for each
meta-analysis; by use of random allocation of the treatment or not;
by use of blinded induction of the treatment or not; by use of
blinded assessment of the outcome or not; by whether the sample
size calculation was described or not; by whether the study
reported to comply to the animal welfare regulations or not; and
by whether potential conflicts of interest were reported or not.
Supporting Information
Table S1 Analytical description of the 160 meta-analy-ses with observed and expected numbers of ‘‘positive’’study datasets.
(XLSX)
Acknowledgments
We would like to acknowledge the support of the Edinburgh MRC Trials
Methodology Hub; and Hanna Vesterinen, Kieren Egan, Joseph Frantzias,
and Ana Antonic for data collection.
Author Contributions
The author(s) have made the following declarations about their
contributions: Conceived and designed the experiments: KT ES MM JI.
Analyzed the data: KT OP EA EE. Wrote the paper: KT OP JI. Designed
and supervised the CAMARADES database: ES DH RS MM.
References
1. van der Worp HB, Howells DW, Sena ES, Porritt MJ, Rewell S, et al. (2010)
Can animal models of disease reliably inform human studies? PLoS Med 7:
e1000245. doi:10.1371/journal.pmed.1000245
2. Perel P, Roberts I, Sena E, Wheble P, Briscoe C, et al. (2007) Comparison of
treatment effects between animal experiments and clinical trials: systematic
review. BMJ 334: 197.
Excess Significance Bias in Animal Neuro-Studies
PLOS Biology | www.plosbiology.org 9 July 2013 | Volume 11 | Issue 7 | e1001609

3. Pound P, Ebrahim S, Sandercock P, Bracken MB, Roberts I (2004) Where is the
evidence that animal research benefits humans? BMJ 328: 514–517.4. O’Collins VE, Macleod MR, Donnan GA, Horky LL, van der Worp BH, et al.
(2006) 1,026 experimental treatments in acute stroke. Ann Neurol 59: 467–477.
5. Sena E, van der Worp HB, Howells D, Macleod M (2007) How can we improvethe pre-clinical development of drugs for stroke? Trends Neurosci 30: 433–439.
6. Macleod MR, O’Collins T, Horky LL, Howells DW, Donnan GA (2005)Systematic review and metaanalysis of the efficacy of FK506 in experimental
stroke. J Cereb Blood Flow Metab 25: 713–721.
7. Macleod MR, van der Worp HB, Sena ES, Howells DW, Dirnagl U, et al.(2008) Evidence for the efficacy of NXY-059 in experimental focal cerebral
ischaemia is confounded by study quality. Stroke 39: 2824–2829.8. Ioannidis JP (2012) Extrapolating from animals to humans. Sci Transl Med 4:
151ps115.9. Sena ES, van der Worp HB, Bath PM, Howells DW, Macleod MR (2010)
Publication bias in reports of animal stroke studies leads to major overstatement
of efficacy. PLoS Biol 8: e1000344. doi:10.1371/journal.pbio.100034410. Ioannidis JP (2008) Why most discovered true associations are inflated.
Epidemiology 19: 640–648.11. Sterne JA, Sutton AJ, Ioannidis JP, Terrin N, Jones DR, et al. (2011)
Recommendations for examining and interpreting funnel plot asymmetry in
meta-analyses of randomised controlled trials. BMJ 343: d4002.12. Ioannidis JP, Trikalinos TA (2007) The appropriateness of asymmetry tests for
publication bias in meta-analyses: a large survey. CMAJ 176: 1091–1096.13. Lau J, Ioannidis JP, Terrin N, Schmid CH, Olkin I (2006) The case of the
misleading funnel plot. BMJ 333: 597–600.14. Ioannidis JP, Trikalinos TA (2007) An exploratory test for an excess of significant
findings. Clin Trials 4: 245–253.
15. Tsilidis KK, Papatheodorou SI, Evangelou E, Ioannidis JP (2012) Evaluation ofexcess statistical significance in meta-analyses of 98 biomarker associations with
cancer risk. J Natl Cancer Inst 104: 1867–1878.16. Ioannidis JP (2011) Excess significance bias in the literature on brain volume
abnormalities. Arch Gen Psychiatry 68: 773–780.
17. Kavvoura FK, McQueen MB, Khoury MJ, Tanzi RE, Bertram L, et al. (2008)Evaluation of the potential excess of statistically significant findings in published
genetic association studies: application to Alzheimer’s disease. Am J Epidemiol168: 855–865.
18. Hackam DG, Redelmeier DA (2006) Translation of research evidence fromanimals to humans. JAMA 296: 1731–1732.
19. Macleod MR, O’Collins T, Howells DW, Donnan GA (2004) Pooling of animal
experimental data reveals influence of study design and publication bias. Stroke35: 1203–1208.
20. Crossley NA, Sena E, Goehler J, Horn J, van der Worp B, et al. (2008) Empiricalevidence of bias in the design of experimental stroke studies: a metaepidemio-
logic approach. Stroke 39: 929–934.
21. Bebarta V, Luyten D, Heard K (2003) Emergency medicine animal research:does use of randomization and blinding affect the results? Acad Emerg Med 10:
684–687.22. O’Collins VE, Macleod MR, Cox SF, Van Raay L, Aleksoska E, et al. (2011)
Preclinical drug evaluation for combination therapy in acute stroke usingsystematic review, meta-analysis, and subsequent experimental testing. J Cereb
Blood Flow Metab 31: 962–975.
23. Freedman MS, Bar-Or A, Oger J, Traboulsee A, Patry D, et al. (2011) A phaseIII study evaluating the efficacy and safety of MBP8298 in secondary progressive
MS. Neurology 77: 1551–1560.24. Lampl Y, Boaz M, Gilad R, Lorberboym M, Dabby R, et al. (2007) Minocycline
treatment in acute stroke: an open-label, evaluator-blinded study. Neurology 69:
1404–1410.25. Padma Srivastava MV, Bhasin A, Bhatia R, Garg A, Gaikwad S, et al. (2012)
Efficacy of minocycline in acute ischemic stroke: a single-blinded, placebo-controlled trial. Neurol India 60: 23–28.
26. Macleod MR, O’Collins T, Horky LL, Howells DW, Donnan GA (2005)
Systematic review and meta-analysis of the efficacy of melatonin in experimentalstroke. J Pineal Res 38: 35–41.
27. Kucukakin B, Wilhelmsen M, Lykkesfeldt J, Reiter RJ, Rosenberg J, et al. (2010)No effect of melatonin to modify surgical-stress response after major vascular
surgery: a randomised placebo-controlled trial. Eur J Vasc Endovasc Surg 40:461–467.
28. Whitney EJ, Krasuski RA, Personius BE, Michalek JE, Maranian AM, et al.
(2005) A randomized trial of a strategy for increasing high-density lipoprotein
cholesterol levels: effects on progression of coronary heart disease and clinicalevents. Ann Intern Med 142: 95–104.
29. Ono H, Osanai T, Ishizaka H, Hanada H, Kamada T, et al. (2004) Nicorandil
improves cardiac function and clinical outcome in patients with acutemyocardial infarction undergoing primary percutaneous coronary intervention:
role of inhibitory effect on reactive oxygen species formation. Am Heart J 148:E15.
30. Sugimoto K, Ito H, Iwakura K, Ikushima M, Kato A, et al. (2003) Intravenous
nicorandil in conjunction with coronary reperfusion therapy is associated withbetter clinical and functional outcomes in patients with acute myocardial
infarction. Circ J 67: 295–300.
31. England TJ, Abaei M, Auer DP, Lowe J, Jones DR, et al. (2012) Granulocyte-colony stimulating factor for mobilizing bone marrow stem cells in subacute
stroke: the stem cell trial of recovery enhancement after stroke 2 randomizedcontrolled trial. Stroke 43: 405–411.
32. Shyu WC, Lin SZ, Lee CC, Liu DD, Li H (2006) Granulocyte colony-
stimulating factor for acute ischemic stroke: a randomized controlled trial.CMAJ 174: 927–933.
33. Rooke ED, Vesterinen HM, Sena ES, Egan KJ, Macleod MR (2011) Dopamine
agonists in animal models of Parkinson’s disease: a systematic review and meta-analysis. Parkinsonism Relat Disord 17: 313–320.
34. Libman I, Gawel MJ, Riopelle RJ, Bouchard S (1987) A comparison of
bromocriptine (Parlodel) and levodopa-carbidopa (Sinemet) for treatment of ‘‘denovo’’ Parkinson’s disease patients. Can J Neurol Sci 14: 576–580.
35. Landis SC, Amara SG, Asadullah K, Austin CP, Blumenstein R, et al. (2012) A
call for transparent reporting to optimize the predictive value of preclinicalresearch. Nature 490: 187–191.
36. Kilkenny C, Browne WJ, Cuthill IC, Emerson M, Altman DG (2010) Improving
bioscience research reporting: the ARRIVE guidelines for reporting animalresearch. PLoS Biol 8: e1000412. doi:10.1371/journal.pbio.1000412
37. Stroke Therapy Academic Industry Roundtable (STAIR) (1999) Recommenda-
tions for standards regarding preclinical neuroprotective and restorative drugdevelopment. Stroke 30: 2752–2758.
38. Macleod MR, Fisher M, O’Collins V, Sena ES, Dirnagl U, et al. (2009) Good
laboratory practice: preventing introduction of bias at the bench. Stroke 40:e50–52.
39. DerSimonian R, Laird N (1986) Meta-analysis in clinical trials. Control Clin
Trials 7: 177–188.
40. Cochran WG (1954) The combination of estimates from different experiments.Biometrics 10: 101–129.
41. Higgins JP, Thompson SG (2002) Quantifying heterogeneity in a meta-analysis.
Stat Med 21: 1539–1558.
42. Ioannidis JP, Patsopoulos NA, Evangelou E (2007) Uncertainty in heterogeneity
estimates in meta-analyses. BMJ 335: 914–916.
43. Egger M, Davey Smith G, Schneider M, Minder C (1997) Bias in meta-analysisdetected by a simple, graphical test. BMJ 315: 629–634.
44. Sena ES, Briscoe CL, Howells DW, Donnan GA, Sandercock PA, et al. (2010)
Factors affecting the apparent efficacy and safety of tissue plasminogen activatorin thrombotic occlusion models of stroke: systematic review and meta-analysis.
J Cereb Blood Flow Metab 30: 1905–1913.
45. Sena ES, van der Worp HB, Bath PM, Howells DW, Macleod MR (2010)Publication bias in reports of animal stroke studies leads to major overstatement
of efficacy. PLoS Biol 8: e1000344. doi:10.1371/journal.pbio.1000344
46. Vesterinen HM, Sena ES, ffrench-Constant C, Williams A, Chandran S, et al.(2010) Improving the translational hit of experimental treatments in multiple
sclerosis. Mult Scler 16: 1044–1055.
47. Higgins J, Green S, editors (2008) Cochrane Handbook for Systematic Reviewsof Interventions. Chichester, England: The Cochrane Collaboration and John
Wiley & Sons Ltd.
48. Erdfelder E, Faul F, Buchner A (1996) GPOWER: A general power analysisprogram. Behav Res Methods Instrum Comput 28: 1–11.
49. Heller G (2006) Power calculations for preclinical studies using a K-sample rank
test and the Lehmann alternative hypothesis. Stat Med 25: 2543–2553.
50. Higgins JP, Thompson SG, Deeks JJ, Altman DG (2003) Measuringinconsistency in meta-analyses. BMJ 327: 557–560.
Excess Significance Bias in Animal Neuro-Studies
PLOS Biology | www.plosbiology.org 10 July 2013 | Volume 11 | Issue 7 | e1001609